SECURITIES AND EXCHANGE COMMISSION
Washington, D.C. 20549
FORM 6-K
Report of Foreign Private Issuer
Pursuant to Rule 13a-16 or 15d-16 of the
Pursuant to Rule 13a-16 or 15d-16 of the
Securities Exchange Act of 1934
For the month of July, 2020
Commission File Number 1565025AMBEV S.A.
(Exact name of registrant as specified in its charter)
AMBEV S.A.
(Translation of Registrant's name into English)
Rua Dr. Renato Paes de Barros, 1017 - 3rd Floor
04530-000 São Paulo, SP
Federative Republic of Brazil
04530-000 São Paulo, SP
Federative Republic of Brazil
(Address of principal executive office)
Indicate by check mark whether the registrant files or will file annual reports under cover Form 20-F or Form 40-F.
Form 20-F ___X___ Form 40-F _______
Indicate by check mark whether the registrant by furnishing the information contained in this Form is also thereby furnishing the information to the Commission pursuant to Rule 12g3-2(b) under the Securities Exchange Act of 1934.
Yes _______ No ___X____  | Second Quarter 2020 Results July 30, 2020 Page | 1 |
AMBEV REPORTS 2020 SECOND QUARTER RESULTS UNDER IFRS
São Paulo, July 30, 2020 – Ambev S.A. [B3: ABEV3; NYSE: ABEV] announces its results for the second quarter of 2020. The following operating and financial information, unless otherwise indicated, is presented in nominal Reais and prepared according to the International Financial Reporting Standards (“IFRS”) issued by the International Accounting Standards Board (“IASB”) and to the accounting practices issued by the Brazilian Accounting Standards Committee ("CPC”) and approved by the Brazilian Securities and Exchange Commission (“CVM”). The information herein should be read together with our financial information for the six-month period ended June 30, 2020 filed with the CVM and submitted to the U.S. Securities and Exchange Commission (“SEC”).
OPERATING AND FINANCIAL HIGHLIGHTS
Net revenue: Net revenue was down 10.4% in 2Q20, with volume declining by 9.4% and decline in net revenue per hectoliter (NR/hl) of 1.0%. Net revenue was down in Brazil (-6.7%), Central America and the Caribbean (CAC) (-33.9%), Latin America South (LAS)[1] (-8.7%) and Canada (-3.9%). In Brazil, volume was down 4.4% and NR/hl was down 2.5%. In CAC, volume declined by 39.4% and NR/hl grew by 9.1%. In LAS, volume was down 16.5% and NR/hl rose by 9.4%. In Canada, volume increased by 0.3% while NR/hl decreased by 4.1%. In HY20, on a consolidated basis, net revenue was down 6.0%, with volume decreasing 7.4% and NR/hl growing by 1.6%.
Cost of goods sold (COGS): In 2Q20, COGS and cash COGS (excluding depreciation and amortization) were up 10.0% and 9.9%, respectively. On a per hectoliter basis, COGS grew by 21.4% while cash COGS was up 21.3%, mainly due to inflationary pressures in Argentina, transactional currency headwinds and package mix impacts. In HY20, COGS and cash COGS increased by 9.7% and 10.1%, respectively. On a per hectoliter basis, COGS rose by 18.5% while cash COGS was up 18.9%.
Selling, general & administrative (SG&A) expenses: SG&A and cash SG&A (excluding depreciation and amortization) were down 4.4% and 7.5% despite inflationary pressures in Argentina. The decrease was mainly driven by actions aimed at reducing our discretionary expenses across all our operations. In HY20, SG&A grew by 1.8% while cash SG&A decreased 0.6%.
EBITDA, gross margin and EBITDA margin: In 2Q20, EBITDA reached R$ 3,348.3 million, which corresponds to an organic reduction of 33.6%, with a gross margin of 50.0% (-930bps) and EBITDA margin of 28.8% (-990bps). In HY20, EBITDA was R$ 7,580.8 (-25.6%) with gross margin and EBITDA margin reaching 52.7% (-680bps) and 31.3% (-830bps), respectively.
Normalized profit and EPS: Normalized profit was R$ 1,372.6 million, 49.4% lower than in 2Q19, due to lower EBITDA and higher financial expenses. Normalized EPS in the quarter was R$ 0.08 (-49.3%). In HY20, normalized profit decreased by 52.5%, reaching R$ 2,600.4 million, with normalized EPS of R$ 0.15 (-54.0%).
Cash generation and CAPEX: Cash flow from operating activities was R$ 1,838.8 million (-41.0%) and CAPEX reached R$ 807.1 million (-9.9%). In HY20, cash flow from operating activities totaled R$ 3,382.8 million (-34.9%) and CAPEX increased by 49.4% to R$ 2,153.5 million.
1 The impacts resulting from applying Hyperinflation Accounting for our Argentinean subsidiaries, in accordance to IAS 29, are detailed in the section Financial Reporting in Hyperinflationary Economies - Argentina (page 21).
AMBEV REPORTS 2020 SECOND QUARTER RESULTS UNDER IFRS |
| | Second Quarter 2020 Results July 30, 2020 Page | 2 |
| Financial highlights - Ambev consolidated | 2Q19 | 2Q20 | % As Reported | % Organic | YTD19 | YTD20 | % As Reported | % Organic |
| R$ million | ||||||||
| Volume ('000 hl) | 36,865.2 | 33,465.6 | -9.2% | -9.4% | 78,161.6 | 72,477.1 | -7.3% | -7.4% |
| Net revenue | 12,145.1 | 11,615.3 | -4.4% | -10.4% | 24,785.3 | 24,217.9 | -2.3% | -6.0% |
| Gross profit | 7,183.8 | 5,813.5 | -19.1% | -24.5% | 14,716.3 | 12,772.9 | -13.2% | -16.7% |
| % Gross margin | 59.1% | 50.0% | -910 bps | -930 bps | 59.4% | 52.7% | -670 bps | -680 bps |
| Normalized EBITDA | 4,691.3 | 3,348.3 | -28.6% | -33.6% | 9,811.9 | 7,580.8 | -22.7% | -25.6% |
| % Normalized EBITDA margin | 38.6% | 28.8% | -980 bps | -990 bps | 39.6% | 31.3% | -830 bps | -830 bps |
| Profit | 2,615.9 | 1,271.3 | -51.4% | 5,365.0 | 2,482.6 | -53.7% | ||
| Normalized profit | 2,712.1 | 1,372.6 | -49.4% | 5,474.5 | 2,600.4 | -52.5% | ||
| EPS (R$/shares) | 0.16 | 0.08 | -51.4% | 0.33 | 0.15 | -55.3% | ||
| Normalized EPS (R$/shares) | 0.17 | 0.08 | -49.3% | 0.34 | 0.15 | -54.0% |
Note: Earnings per share calculation is based on outstanding shares (total existing shares excluding shares held in treasury).
MANAGEMENT COMMENTS
Ambev entered the second quarter with two main priorities: (i) ensure our solid financial position by preserving liquidity in the short and long term and (ii) navigate the “new normal” brought by COVID-19 pandemic, protecting our people and adapting to changes while continuing to invest in what we believe will be a competitive advantage going forward: consumer centricity, client service level, digital transformation, innovation and strengthening our ties with the broader ecosystem.
As the pandemic progressed, the significant changes in consumer behavior and channel dynamics that started in mid-March fully affected the quarter with meaningful impact to our profitability, as governments imposed restrictions that varied in terms of scope and intensity in response to COVID-19.
In the charts below, we separated our countries as per the weight of the off-trade channel in each beer market and the household consumer expenditure[2] to illustrate this change in channel dynamics. We also ranked the countries based on the total impact in beer volumes during the second quarter from the most affected, Bolivia, to the least affected, Canada:
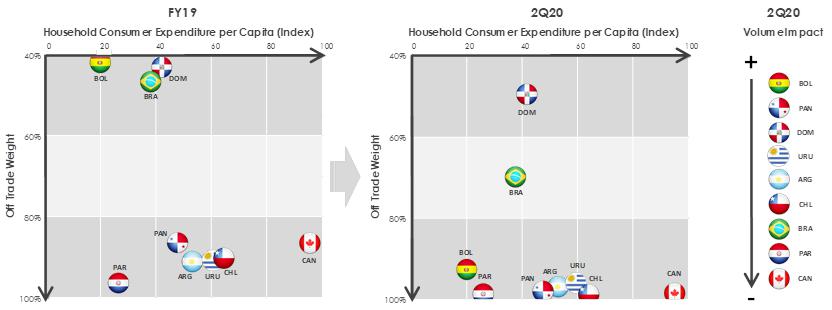
Source: Canback, Euromonitor, Nielsen, Internal Sources
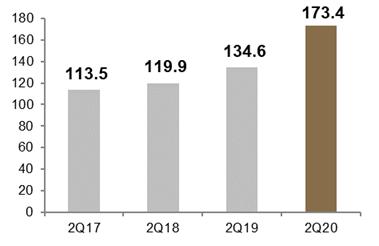
Since April, when our consolidated volumes declined 27%, we have seen a gradual recovery, with a decline of 7% in May and a growth of 5% in June, driven mostly by Brazil Beer:
2 Household consumer expenditure for each country is indexed at the USA household consumer expenditure, which was set at 100.
AMBEV REPORTS 2020 SECOND QUARTER RESULTS UNDER IFRS |
| | Second Quarter 2020 Results July 30, 2020 Page | 3 |
| · | In Brazil, we saw an improving trend throughout the quarter driven by the success of our innovation strategy, the reliability of our supply chain and customer relationships, the strengths of our distribution footprint and a shift in off-trade consumption to traditional outlets, where our portfolio over-indexes. Furthermore, these benefits were amplified by the positive impact of government subsidies on consumer disposable income. Our NAB business, however, was negatively impacted by on-trade restrictions and the consequent change in consumption occasions as well as by consumer trade down. |
| · | CAC was the most impacted region in terms of COVID-related restrictions. Dominican Republic faced a curfew for almost the entire quarter and Panama had restrictions on alcohol consumption and people circulation that severely impacted volumes in the country. |
| · | The performance in LAS was mostly impacted by Bolivia and Argentina, with the former being impacted by the severe restrictions on people circulation imposed by the local government and the latter being more affected by the impacts of the COVID-19 in the economy. |
| · | In Canada, despite the pantry loading effect in 1Q20 and a weak industry this quarter, we delivered better-than-expected results driven by the strong performance of our premium and core plus portfolios and our beyond beer brands. |
The full impact of the COVID-19 pandemic in our future results, however, remains uncertain. Our actions will be targeted at meeting consumer demand as we strive to deliver a V-shape recovery in top line, while we expect a slower pace of recovery in the bottom line as a result of the package mix, channel mix shift towards the off-trade, continued cost pressures from transactional FX headwinds and the impact of the crisis on disposable consumer income.
Despite the short term disruptions, we will continue to focus on: (i) becoming more customer and consumer centric; (ii) strengthening and further developing our portfolio; (iii) leveraging our unmatched distribution capability; (iv) bringing exciting innovations to consumers; (v) bolstering our digital transformation initiatives; and (vi) investing in our people. By successfully executing our plans, we should create the conditions to emerge stronger from this crisis and drive sustainable growth over the long run.
License to Operate
The on-trade lockdown started in mid-March and evolved as the quarter progressed in different ways for each region in which we operate, with some countries being more restrictive than others with regards to people circulation and the sale of alcoholic beverages.
| · | In Brazil: the intensity of restrictions varied among regions, since they are determined at the state and municipal levels, with big cities and urban centers being more affected. All our production facilities and distribution centers in Brazil are operating. |
| · | In CAC: the Dominican Republic entered the quarter with a curfew set between 5pm and 5am. During the quarter, the curfew was eased to 8pm to 5am and ended in the last week of June. On July 21st, however, the government reintroduced a curfew between 7pm to 5am. In Panama, we entered the quarter with a ban on alcohol and beer sales established by the government for the entire country and a full lockdown that continued until May 8th, when consumers were allowed to buy one six-pack of beer or one liter of rum per person. On June 21st, restrictions on alcohol sales were lifted. All our production facilities and distribution centers in CAC are operating. |
| · | In LAS: with the exception of Chile, countries started to gradually recover since April, even though Bolivia is still being strongly impacted by restrictions on people circulation. All our production facilities and distribution centers in LAS are operating. |
| · | In Canada: bars and restaurants started to gradually reopen across the country in mid-June, while the off-trade and the retail channels across the provinces remained open. All our breweries in Canada are operating normally. |
AMBEV REPORTS 2020 SECOND QUARTER RESULTS UNDER IFRS |
| | Second Quarter 2020 Results July 30, 2020 Page | 4 |
Ambev as an Ecosystem
Despite the challenges brought by COVID-19, the pandemic has served as a hallmark, a resetting moment that allowed us to reframe our purpose and renew our pact with our ecosystem, developing stronger and more sustainable relationships with our customers, reconnecting with our consumers and helping society.
Our number one priority is and will continue to be the health and safety of our people. In addition, we believe we can make a positive impact in society and have worked to contribute to our ecosystem, playing a central role by leveraging our capabilities and competencies to positively impact our stakeholders and our community through tangible actions:
| · | In Brazil, we took part in Movimento NÓS, a coalition of eight consumer goods companies that will help approximately 300,000 POCs to reopen with a total investment of R$370 million to support working capital, impacting indirectly more than three million people. Stella Artois and Bohemia continued with the campaign to financially support restaurants and bars, having raised together more than R$ 10 million to date. |
| · | In CAC, with Colmados Seguros in the Dominican Republic and Paisano Seguro in Panama, we have helped POCs guarantee secure spaces for consumers during reopening and partnered to reinvent socializing by creating new safe ways to bring people together. |
| · | In LAS, Quilmes, our subsidiary in Argentina, was recognized by both the public and opinion leaders as the company that is making the greatest efforts to face solidarity actions in the areas where our production is located. |
As a recognition to the role we have played since the outbreak of COVID-19, Ambev has received the Solidarity Award from the United Nations that recognizes impactful work that individuals and organizations have been taking to support communities as we navigate the pandemic.
Innovation and Business transformation
Although the COVID-19 pandemic has created significant challenges for our business, it has also accelerated consumer trends that we have been investing on, primarily reinforcing the need for an innovative, consumer-centric mindset and advancing our business transformation enabled by technology.
Innovation has become more and more one of the pillars of our business and front and center to our commercial strategy. We talk about innovation in broader terms, not only in terms of products, but also our relationships with customers and consumers.
As markets mature and new trends appear, consumers demand more options for the different consumption occasions. To connect with our consumers in unique ways, providing them with exceptional products that satisfy their preferences, we must continue to become more flexible in order to deliver the best value propositions available in terms of products and experience.
We have been investing in our production facilities to increase flexibility and be able to launch innovations faster. With ZITEC, our innovation and technology center, our time to market in Brazil has been brought down from more than seven months in 2018 to close to two months in the quarter. We have also reorganized internally, creating “squads” with mandates to deep-dive into new trends and the needs of our consumers, understanding their preferences and listening to their demands.
In this quarter, in Brazil, we started to see this consistent approach to product innovation show results as our market share of products launched in the past three years is now higher than our total market share. One of our recent launches, Brahma Duplo Malte, is perhaps the best example of this innovative approach in action. It is the result of understanding consumer demands for flavor and creaminess and delivering a product that, by combining the Pilsner malt with the Munich malt, delivers a striking character while also providing to consumers a new way of thinking about Pure Malt brands. The product offers a strong value proposition within the core plus segment and has grown consistently since its launch.
AMBEV REPORTS 2020 SECOND QUARTER RESULTS UNDER IFRS |
| | Second Quarter 2020 Results July 30, 2020 Page | 5 |
In terms of marketing, we continued to invest in new ways of connecting with our consumers, further leveraging our mantra of “Stop interrupting, Start Entertaining” through our livestream concerts platform, the so called “lives”. In the quarter, in Brazil, we had 398 lives that together had more than 676 million views and more than 2.5 million mentions featuring 15 different brands in our portfolio. To give a reference on the dimension of the impact, the lives had 57% more views than FIFA 2018 World Cup Final in Brazil and almost 10x more views in YouTube than the Global Citizen Live concert “Together at Home”.
With a team of over 200 people across all Ambev regions, our internal creative agency Draftline has helped us use resources more efficiently. We were able to internalize the full development of some campaigns and use the information from our direct-to-consumer platforms to customize our marketing while reducing consumer acquisition costs. Also, our regional Draftline units have helped us engage faster with trending topics that require more agility and flexibility.
Our digital transformation has continued to gain relevance in all of our geographies as both customers and consumers call for convenience. In Brazil, our direct-to-consumer platform Zé Delivery had 5.5 million orders in the quarter, more than 3.6x the total orders of the full previous year, reaching 142 cities and 40% of the Brazilian population. Our B2B solution has played an important role in increasing traffic and the total interaction time with our clients, helping reach potential through the assortment of products and allowing our sales representatives to gradually shift towards an approach more focused on trade execution.
In LAS, our digital platforms have helped us reduce volume impact, improve mix of products and better understand our consumers. In Argentina we launched Appbar in April to deliver cold beverages in less than 45 minutes. In Chile and Paraguay, we continued the expansion of the delivery platforms Casa de la Cerveza and Estación, respectively. In Bolivia, we launched the e-commerce for Tiendas Ya, an already established delivery operation, as one of our efforts to increase our exposure to the off-trade channel in the country.
In CAC, the Dominican Republic has been our pilot operation for “Bees”, a proprietary B2B platform with technology developed in-house and designed to deliver a better experience to POCs that already accounts for the majority of the country’s net revenues. Bees integrates products from different categories in the same digital environment and makes suggestions based on advanced algorithms. It is also designed to improve promotions and increase the communication inside the app while allowing for the capture of more data points on clients’ preferences.
Strategic Platforms
Premiumize at scale
Our premium brands performance was significantly impacted in the quarter since these brands are more consumed in on-trade occasions, where we over-index, making Ambev total premium portfolio decrease low teens this quarter. However, we see premiumization as a trend with significant opportunity across our geographies and we continue to work on building the best portfolio to lead this trend, which will fuel our results over the next several years.
| · | In Brazil, although our premium volume declined low teens driven by our domestic brands Original and Chopp Brahma, which are predominantly sold in the on-trade channel, our global brands still managed to grow double digits, led by Budweiser. |
| o | Budweiser’s quarter was marked by the One Team Live, aimed at supporting health professionals through fundraising and donations to Médicos Sem Fronteiras and Associação Médica Brasileira. |
AMBEV REPORTS 2020 SECOND QUARTER RESULTS UNDER IFRS |
| | Second Quarter 2020 Results July 30, 2020 Page | 6 |
| o | Stella Artois has played a central role in helping bars and restaurants during the pandemic. It continued to lead Ajude um Restaurante, a movement directed towards consumers to rescue restaurants by selling a subsidized voucher for a future dinner that has already raised more than R$ 6 million. |
| o | Beck’s continued its roll-out focused on the southeast region of the country growing substantially. Beck’s quarter was highlighted by its first activation through a live made in partnership with Brazilian DJ Vintage Culture with over 2.2 million views in YouTube. |
| · | In CAC, even though premium brands were strongly affected by the circulation restrictions imposed in the different countries, we were able to increase premium mix in Panama and, in Guatemala, our premium portfolio continued to show a strong momentum driven by Modelo Especial growing by double digits in the quarter. |
| · | In LAS, the premium portfolio declined double digits in the quarter despite Argentina delivering low single-digit growth led by Corona’s strong performance. |
| · | In Canada, our strategy of premiumization delivered another quarter of solid growth, mainly driven by Corona growing high single-digits. |
Differentiate the Core
| · | Brazil: we continue to further differentiate our core brands focused on building a complete and powerful portfolio and connecting to consumers. |
| o | Bohemia has led the way, having grown double or triple digits every quarter since 3Q17, gaining momentum with a newly launched visual brand identity. It has performed an important role leading the efforts to help the small bars during the pandemic. |
| o | Skol has continued to advance on its new positioning of “Lightness goes down well”, partnering with Porta dos Fundos, the Brazilian most-seen comedy channel on YouTube to create weekly content to make the quarantine of its consumers “lighter”. The brand has also made different campaigns with Wesley Safadão and Xand Avião, two famous Brazilian singers. Skol Puro Malte grew by strong double-digits from a meaningful base in the quarter. |
| o | Brahma led the lives with Circuito Brahma, partnering with multiple Sertanejo personalities with an intense agenda of streamings throughout the quarter. The Mother’s Day Special was a highlight with more than six million views. Through the successful launch of Brahma Duplo Malte, we are further elevating our presence in the core plus segment. |
| · | LAS: in Argentina, Quilmes, our classic lager, focused on great campaigns such as “Stay at home”, “Soccer for the people” and “Come back responsibly”. In the core plus segment, Andes Origen has overperformed the industry in Argentina for another consecutive quarter and in Chile, Cusqueña and Budweiser continue to deliver strong results, both growing double-digits in the quarter. |
| · | Canada: the core and core plus segments showed resilience as consumers migrated to trusted brands with Michelob Ultra growing double digits and Bud Light gaining momentum in the quarter leveraged by innovations such as Bud Light Strawberry Lemonade. |
Drive Smart Affordability
| · | Our Brazilian regional beers, Nossa, Magnífica and Legítima, continued to deliver strong results with volumes up 70% in the quarter. Our brands engaged with local communities by donating Cassava products (soap and flour), raising funds for local farmers while helping the local population in their basic hygiene and food needs. |
AMBEV REPORTS 2020 SECOND QUARTER RESULTS UNDER IFRS |
| | Second Quarter 2020 Results July 30, 2020 Page | 7 |
| · | In LAS, our decision to focus on expanding the 1 liter returnable glass bottles in Paraguay led to better volume recovery and market share gains, while in Argentina we continued to expand our 340ml returnable bottles across our portfolio. |
| · | In CAC, in Dominican Republic, we have continued to expand our affordability strategy through pack-price initiatives, offering different alternatives considering price points and occasions. |
Future Beverages
Our highlights of the quarter were recent M&A transactions that have helped us enter emerging segments and continued to deliver strong results:
| · | In Canada, G&W continues to grow its Nutrl portfolio as vodka soda gains relevance in the country. |
| · | In Argentina, Dante Robino has grown consistently since our combination in March, with sales volumes almost doubling in May and June versus last year due to an increased distribution footprint. |
AMBEV REPORTS 2020 SECOND QUARTER RESULTS UNDER IFRS |
| | Second Quarter 2020 Results July 30, 2020 Page | 8 |
AMBEV CONSOLIDATED INCOME STATEMENT
| Consolidated income statement | 2Q19 | Scope | Currency Translation | IAS 29 3M Impact | Organic Growth | 2Q20 | % As Reported | % Organic |
| R$ million | ||||||||
| Net revenue | 12,145.1 | 62.2 | 685.4 | (32.4) | (1,245.0) | 11,615.3 | -4.4% | -10.4% |
| Cost of goods sold (COGS) | (4,961.3) | (30.0) | (307.9) | (10.2) | (492.4) | (5,801.9) | 16.9% | 10.0% |
| Gross profit | 7,183.8 | 32.2 | 377.5 | (42.6) | (1,737.4) | 5,813.5 | -19.1% | -24.5% |
| Selling, general and administrative (SG&A) | (3,792.5) | (20.8) | (194.8) | 11.2 | 164.6 | (3,832.3) | 1.0% | -4.4% |
| Other operating income/(expenses) | 190.8 | 4.0 | 1.2 | (131.0) | 64.9 | -66.0% | -68.5% | |
| Normalized operating income (normalized EBIT) | 3,582.1 | 11.4 | 186.6 | (30.2) | (1,703.9) | 2,046.1 | -42.9% | -48.4% |
| Exceptional items above EBIT | (33.9) | (6.3) | 0.3 | (88.0) | (127.9) | nm | nm | |
| Net finance results | (567.4) | (793.7) | 39.9% | |||||
| Share of results of joint ventures | (0.7) | (16.2) | nm | |||||
| Income tax expense | (364.1) | 163.1 | -144.8% | |||||
| Profit | 2,615.9 | 1,271.3 | -51.4% | |||||
| Attributable to Ambev holders | 2,520.7 | 1,226.8 | -51.3% | |||||
| Attributable to non-controlling interests | 95.2 | 44.5 | -53.2% | |||||
| Normalized profit | 2,712.1 | 1,372.6 | -49.4% | |||||
| Attributable to Ambev holders | 2,616.9 | 1,327.5 | -49.3% | |||||
| Normalized EBITDA | 4,691.3 | 11.6 | 229.5 | (35.5) | (1,548.6) | 3,348.3 | -28.6% | -33.6% |
| Consolidated income statement | YTD19 | Scope | Currency Translation | IAS 29 3M Impact | Organic Growth | YTD20 | % As Reported | % Organic |
| R$ million | ||||||||
| Net revenue | 24,785.3 | 79.7 | 828.2 | (1,475.3) | 24,217.9 | -2.3% | -6.0% | |
| Cost of goods sold (COGS) | (10,069.0) | (38.5) | (358.7) | (978.9) | (11,445.1) | 13.7% | 9.7% | |
| Gross profit | 14,716.3 | 41.2 | 469.5 | (2,454.2) | 12,772.9 | -13.2% | -16.7% | |
| Selling, general and administrative (SG&A) | (7,482.0) | (31.0) | (254.6) | (136.9) | (7,904.5) | 5.6% | 1.8% | |
| Other operating income | 422.0 | 1.2 | (187.0) | 236.2 | -44.0% | -44.3% | ||
| Normalized operating income (normalized EBIT) | 7,656.2 | 10.3 | 216.1 | (2,778.1) | 5,104.5 | -33.3% | -36.3% | |
| Exceptional items above EBIT | (52.3) | (6.4) | (93.2) | (152.0) | 190.5% | 178.2% | ||
| Net finance results | (1,239.5) | (2,330.6) | 88.0% | |||||
| Share of results of joint ventures | (2.9) | (22.9) | nm | |||||
| Income tax expense | (996.6) | (116.5) | -88.3% | |||||
| Profit | 5,365.0 | 2,482.6 | -53.7% | |||||
| Attributable to Ambev holders | 5,182.6 | 2,318.6 | -55.3% | |||||
| Attributable to non-controlling interests | 182.4 | 164.0 | -10.1% | |||||
| Normalized profit | 5,474.5 | 2,600.4 | -52.5% | |||||
| Attributable to Ambev holders | 5,291.7 | 2,434.8 | -54.0% | |||||
| Normalized EBITDA | 9,811.9 | 10.8 | 267.4 | (2,509.4) | 7,580.8 | -22.7% | -25.6% |
AMBEV REPORTS 2020 SECOND QUARTER RESULTS UNDER IFRS |
| | Second Quarter 2020 Results July 30, 2020 Page | 9 |
AMBEV CONSOLIDATED RESULTS
The combination of Ambev’s operations in Brazil, Central America and the Caribbean (CAC), Latin America South (LAS) and Canada’s business units, eliminating intercompany transactions, comprises our consolidated financial statements. The figures shown below are on an as-reported basis.
| Volume (million hectoliters) | |
 | |
| Net revenue per hectoliter (R$) | COGS per hectoliter (R$) |
 |  |
| Normalized EBITDA (R$ million) | Normalized EBITDA Margin (%) |
 |  |
AMBEV REPORTS 2020 SECOND QUARTER RESULTS UNDER IFRS |
| | Second Quarter 2020 Results July 30, 2020 Page | 10 |
AMBEV CONSOLIDATED
| Ambev | 2Q19 | Scope | Currency Translation | IAS 29 3M Impact | Organic Growth | 2Q20 | % As Reported | % Organic |
| R$ million | ||||||||
| Volume ('000 hl) | 36,865.2 | 72.7 | (3,472.4) | 33,465.6 | -9.2% | -9.4% | ||
| Net revenue | 12,145.1 | 62.2 | 685.4 | (32.4) | (1,245.0) | 11,615.3 | -4.4% | -10.4% |
| Net revenue/hl (R$) | 329.4 | 1.0 | 20.5 | (7.3) | 3.4 | 347.1 | 5.4% | -1.0% |
| COGS | (4,961.3) | (30.0) | (307.9) | (10.2) | (492.4) | (5,801.9) | 16.9% | 10.0% |
| COGS/hl (R$) | (134.6) | (0.5) | (9.2) | (0.2) | (28.8) | (173.4) | 28.8% | 21.4% |
| COGS excl. deprec. & amort. | (4,287.7) | (30.0) | (281.0) | (13.6) | (420.8) | (5,033.2) | 17.4% | 9.9% |
| COGS/hl excl. deprec. & amort. (R$) | (116.3) | (0.6) | (8.4) | (0.3) | (24.8) | (150.4) | 29.3% | 21.3% |
| Gross profit | 7,183.8 | 32.2 | 377.5 | (42.6) | (1,737.4) | 5,813.5 | -19.1% | -24.5% |
| % Gross margin | 59.1% | 50.0% | -910 bps | -930 bps | ||||
| SG&A excl. deprec. & amort. | (3,356.9) | (20.6) | (178.8) | 9.3 | 248.2 | (3,298.8) | -1.7% | -7.5% |
| SG&A deprec. & amort. | (435.6) | (0.2) | (16.0) | 1.9 | (83.6) | (533.5) | 22.5% | 19.4% |
| SG&A total | (3,792.5) | (20.8) | (194.8) | 11.2 | 164.6 | (3,832.3) | 1.0% | -4.4% |
| Other operating income/(expenses) | 190.8 | 4.0 | 1.2 | (131.0) | 64.9 | -66.0% | -68.5% | |
| Normalized EBIT | 3,582.1 | 11.4 | 186.6 | (30.2) | (1,703.9) | 2,046.1 | -42.9% | -48.4% |
| % Normalized EBIT margin | 29.5% | 17.6% | -1190 bps | -1240 bps | ||||
| Normalized EBITDA | 4,691.3 | 11.6 | 229.5 | (35.5) | (1,548.6) | 3,348.3 | -28.6% | -33.6% |
| % Normalized EBITDA margin | 38.6% | 28.8% | -980 bps | -990 bps | ||||
| Ambev | YTD19 | Scope | Currency Translation | IAS 29 3M Impact | Organic Growth | YTD20 | % As Reported | % Organic |
| R$ million | ||||||||
| Volume ('000 hl) | 78,161.6 | 94.7 | (5,779.2) | 72,477.1 | -7.3% | -7.4% | ||
| Net revenue | 24,785.3 | 79.7 | 828.2 | (1,475.3) | 24,217.9 | -2.3% | -6.0% | |
| Net revenue/hl (R$) | 317.1 | 0.6 | 11.4 | 5.0 | 334.1 | 5.4% | 1.6% | |
| COGS | (10,069.0) | (38.5) | (358.7) | (978.9) | (11,445.1) | 13.7% | 9.7% | |
| COGS/hl (R$) | (128.8) | (0.3) | (4.9) | (23.8) | (157.9) | 22.6% | 18.5% | |
| COGS excl. deprec. & amort. | (8,755.9) | (38.5) | (326.9) | (888.5) | (10,009.8) | 14.3% | 10.1% | |
| COGS/hl excl. deprec. & amort. (R$) | (112.0) | (0.4) | (4.5) | (21.2) | (138.1) | 23.3% | 18.9% | |
| Gross profit | 14,716.3 | 41.2 | 469.5 | (2,454.2) | 12,772.9 | -13.2% | -16.7% | |
| % Gross margin | 59.4% | 52.7% | -670 bps | -680 bps | ||||
| SG&A excl. deprec. & amort. | (6,639.5) | (30.4) | (235.1) | 41.4 | (6,863.6) | 3.4% | -0.6% | |
| SG&A deprec. & amort. | (842.6) | (0.5) | (19.6) | (178.2) | (1,040.9) | 23.5% | 21.2% | |
| SG&A total | (7,482.0) | (31.0) | (254.6) | (136.9) | (7,904.5) | 5.6% | 1.8% | |
| Other operating income/(expenses) | 422.0 | 1.2 | (187.0) | 236.2 | -44.0% | -44.3% | ||
| Normalized EBIT | 7,656.2 | 10.3 | 216.1 | (2,778.1) | 5,104.5 | -33.3% | -36.3% | |
| % Normalized EBIT margin | 30.9% | 21.1% | -980 bps | -1000 bps | ||||
| Normalized EBITDA | 9,811.9 | 10.8 | 267.4 | (2,509.4) | 7,580.8 | -22.7% | -25.6% | |
| % Normalized EBITDA margin | 39.6% | 31.3% | -830 bps | -830 bps |
AMBEV REPORTS 2020 SECOND QUARTER RESULTS UNDER IFRS |
| | Second Quarter 2020 Results July 30, 2020 Page | 11 |
BRAZIL
| Brazil | 2Q19 | Scope | Currency Translation | Organic Growth | 2Q20 | % As Reported | % Organic |
| R$ million | |||||||
| Volume ('000 hl) | 24,159.6 | (1,056.4) | 23,103.2 | -4.4% | -4.4% | ||
| Net revenue | 6,276.2 | (421.5) | 5,854.7 | -6.7% | -6.7% | ||
| Net revenue/hl (R$) | 259.8 | (6.4) | 253.4 | -2.5% | -2.5% | ||
| COGS | (2,609.4) | (371.9) | (2,981.3) | 14.3% | 14.3% | ||
| COGS/hl (R$) | (108.0) | (21.0) | (129.0) | 19.5% | 19.5% | ||
| COGS excl. deprec. & amort. | (2,246.3) | (337.4) | (2,583.7) | 15.0% | 15.0% | ||
| COGS/hl excl. deprec. & amort. (R$) | (93.0) | (18.9) | (111.8) | 20.3% | 20.3% | ||
| Gross profit | 3,666.8 | (793.4) | 2,873.4 | -21.6% | -21.6% | ||
| % Gross margin | 58.4% | 49.1% | -930 bps | -930 bps | |||
| SG&A excl. deprec. & amort. | (1,816.8) | 132.3 | (1,684.4) | -7.3% | -7.3% | ||
| SG&A deprec. & amort. | (274.8) | (66.9) | (341.6) | 24.3% | 24.3% | ||
| SG&A total | (2,091.5) | 65.5 | (2,026.1) | -3.1% | -3.1% | ||
| Other operating income/(expenses) | 180.1 | (39.2) | 140.9 | -21.8% | -21.8% | ||
| Normalized EBIT | 1,755.3 | (767.1) | 988.2 | -43.7% | -43.7% | ||
| % Normalized EBIT margin | 28.0% | 16.9% | -1110 bps | -1110 bps | |||
| Normalized EBITDA | 2,393.2 | (665.8) | 1,727.5 | -27.8% | -27.8% | ||
| % Normalized EBITDA margin | 38.1% | 29.5% | -860 bps | -860 bps | |||
| Brazil | YTD19 | Scope | Currency Translation | Organic Growth | YTD20 | % As Reported | % Organic |
| R$ million | |||||||
| Volume ('000 hl) | 51,668.7 | (3,554.1) | 48,114.6 | -6.9% | -6.9% | ||
| Net revenue | 13,490.5 | (1,110.7) | 12,379.8 | -8.2% | -8.2% | ||
| Net revenue/hl (R$) | 261.1 | (3.8) | 257.3 | -1.5% | -1.5% | ||
| COGS | (5,667.0) | (264.4) | (5,931.3) | 4.7% | 4.7% | ||
| COGS/hl (R$) | (109.7) | (13.6) | (123.3) | 12.4% | 12.4% | ||
| COGS excl. deprec. & amort. | (4,926.2) | (260.5) | (5,186.7) | 5.3% | 5.3% | ||
| COGS/hl excl. deprec. & amort. (R$) | (95.3) | (12.5) | (107.8) | 13.1% | 13.1% | ||
| Gross profit | 7,823.6 | (1,375.1) | 6,448.5 | -17.6% | -17.6% | ||
| % Gross margin | 58.0% | 52.1% | -590 bps | -590 bps | |||
| SG&A excl. deprec. & amort. | (3,642.7) | 51.8 | (3,590.9) | -1.4% | -1.4% | ||
| SG&A deprec. & amort. | (546.0) | (141.3) | (687.4) | 25.9% | 25.9% | ||
| SG&A total | (4,188.8) | (89.5) | (4,278.3) | 2.1% | 2.1% | ||
| Other operating income/(expenses) | 413.4 | (110.1) | 303.4 | -26.6% | -26.6% | ||
| Normalized EBIT | 4,048.2 | (1,574.7) | 2,473.5 | -38.9% | -38.9% | ||
| % Normalized EBIT margin | 30.0% | 20.0% | -1000 bps | -1000 bps | |||
| Normalized EBITDA | 5,335.0 | (1,429.5) | 3,905.5 | -26.8% | -26.8% | ||
| % Normalized EBITDA margin | 39.5% | 31.5% | -800 bps | -800 bps |
AMBEV REPORTS 2020 SECOND QUARTER RESULTS UNDER IFRS |
| | Second Quarter 2020 Results July 30, 2020 Page | 12 |
BEER BRAZIL
The volume performance in this quarter was impacted by a soft industry and unfavorable mix shift, as the restrictions imposed by the COVID-19 pandemic resulted in the partial shutdown of most of the on-trade. According to our estimates, we outperformed the industry. Our NR/hl was driven by unfavorable channel mix.
The increase in cash COGS/hl is mostly explained by unfavorable package mix and transactional FX. The cash SG&A decrease in the quarter resulted from a deep revision of our discretionary expenses which more than compensated increased distribution expenses driven by a higher weight of small format off-trade stores.
| Beer Brazil | 2Q19 | Scope | Currency Translation | Organic Growth | 2Q20 | % As Reported | % Organic |
| R$ million | |||||||
| Volume ('000 hl) | 18,245.3 | (293.7) | 17,951.6 | -1.6% | -1.6% | ||
| Net revenue | 5,296.5 | (167.9) | 5,128.6 | -3.2% | -3.2% | ||
| Net revenue/hl (R$) | 290.3 | (4.6) | 285.7 | -1.6% | -1.6% | ||
| COGS | (2,206.4) | (367.3) | (2,573.6) | 16.6% | 16.6% | ||
| COGS/hl (R$) | (120.9) | (22.4) | (143.4) | 18.6% | 18.6% | ||
| COGS excl. deprec. & amort. | (1,890.4) | (336.3) | (2,226.7) | 17.8% | 17.8% | ||
| COGS/hl excl. deprec. & amort. (R$) | (103.6) | (20.4) | (124.0) | 19.7% | 19.7% | ||
| Gross profit | 3,090.1 | (535.2) | 2,555.0 | -17.3% | -17.3% | ||
| % Gross margin | 58.3% | 49.8% | -850 bps | -850 bps | |||
| SG&A excl. deprec. & amort. | (1,517.0) | 96.5 | (1,420.5) | -6.4% | -6.4% | ||
| SG&A deprec. & amort. | (235.9) | (69.4) | (305.3) | 29.4% | 29.4% | ||
| SG&A total | (1,752.9) | 27.1 | (1,725.8) | -1.5% | -1.5% | ||
| Other operating income/(expenses) | 94.7 | 22.5 | 117.2 | 23.8% | 23.8% | ||
| Normalized EBIT | 1,431.9 | (485.6) | 946.3 | -33.9% | -33.9% | ||
| % Normalized EBIT margin | 27.0% | 18.5% | -850 bps | -850 bps | |||
| Normalized EBITDA | 1,983.8 | (385.3) | 1,598.5 | -19.4% | -19.4% | ||
| % Normalized EBITDA margin | 37.5% | 31.2% | -630 bps | -630 bps | |||
| Beer Brazil | YTD19 | Scope | Currency Translation | Organic Growth | YTD20 | % As Reported | % Organic |
| R$ million | |||||||
| Volume ('000 hl) | 39,248.7 | (2,715.6) | 36,533.1 | -6.9% | -6.9% | ||
| Net revenue | 11,429.3 | (846.1) | 10,583.2 | -7.4% | -7.4% | ||
| Net revenue/hl (R$) | 291.2 | (1.5) | 289.7 | -0.5% | -0.5% | ||
| COGS | (4,704.6) | (270.4) | (4,975.0) | 5.7% | 5.7% | ||
| COGS/hl (R$) | (119.9) | (16.3) | (136.2) | 13.6% | 13.6% | ||
| COGS excl. deprec. & amort. | (4,060.9) | (267.3) | (4,328.2) | 6.6% | 6.6% | ||
| COGS/hl excl. deprec. & amort. (R$) | (103.5) | (15.0) | (118.5) | 14.5% | 14.5% | ||
| Gross profit | 6,724.7 | (1,116.5) | 5,608.2 | -16.6% | -16.6% | ||
| % Gross margin | 58.8% | 53.0% | -580 bps | -580 bps | |||
| SG&A excl. deprec. & amort. | (3,076.7) | 38.4 | (3,038.3) | -1.2% | -1.2% | ||
| SG&A deprec. & amort. | (478.8) | (128.8) | (607.7) | 26.9% | 26.9% | ||
| SG&A total | (3,555.5) | (90.4) | (3,646.0) | 2.5% | 2.5% | ||
| Other operating income/(expenses) | 270.2 | (22.2) | 248.0 | -8.2% | -8.2% | ||
| Normalized EBIT | 3,439.4 | (1,229.2) | 2,210.3 | -35.7% | -35.7% | ||
| % Normalized EBIT margin | 30.1% | 20.9% | -920 bps | -920 bps | |||
| Normalized EBITDA | 4,561.9 | - | - | (1,097.2) | 3,464.8 | -24.1% | -24.1% |
| % Normalized EBITDA margin | 39.9% | 32.7% | -720 bps | -720 bps |
AMBEV REPORTS 2020 SECOND QUARTER RESULTS UNDER IFRS |
| | Second Quarter 2020 Results July 30, 2020 Page | 13 |
NAB BRAZIL
Volume performance was impacted by COVID-19 restrictions and the consequent change in consumption occasions, such as those related to sports and meals. Our NR/hl was driven by unfavorable channel, brand and pack mix shifts, as the restrictions imposed on the on-trade channel led to a shift to the off-trade channel as well as to an increased weight of multi-serve packaging versus single serve.
Despite the mix shift, the cash COGS/hl performance was mostly driven by the hard comparable in the previous year and operational deleverage. The cash SG&A decrease in the quarter resulted from a deep revision of our discretionary expenses.
| NAB Brazil | 2Q19 | Scope | Currency Translation | Organic Growth | 2Q20 | % As Reported | % Organic |
| R$ million | |||||||
| Volume ('000 hl) | 5,914.3 | (762.7) | 5,151.6 | -12.9% | -12.9% | ||
| Net revenue | 979.7 | (253.6) | 726.1 | -25.9% | -25.9% | ||
| Net revenue/hl (R$) | 165.6 | (24.7) | 140.9 | -14.9% | -14.9% | ||
| COGS | (403.0) | (4.6) | (407.6) | 1.1% | 1.1% | ||
| COGS/hl (R$) | (68.1) | (11.0) | (79.1) | 16.1% | 16.1% | ||
| COGS excl. deprec. & amort. | (355.8) | (1.1) | (356.9) | 0.3% | 0.3% | ||
| COGS/hl excl. deprec. & amort. (R$) | (60.2) | (9.1) | (69.3) | 15.2% | 15.2% | ||
| Gross profit | 576.6 | (258.2) | 318.4 | -44.8% | -44.8% | ||
| % Gross margin | 58.9% | 43.9% | -1500 bps | -1500 bps | |||
| SG&A excl. deprec. & amort. | (299.8) | 35.9 | (263.9) | -12.0% | -12.0% | ||
| SG&A deprec. & amort. | (38.8) | 2.5 | (36.3) | -6.5% | -6.5% | ||
| SG&A total | (338.6) | 38.4 | (300.2) | -11.3% | -11.3% | ||
| Other operating income/(expenses) | 85.4 | (61.7) | 23.7 | -72.2% | -72.2% | ||
| Normalized EBIT | 323.4 | (281.4) | 41.9 | -87.0% | -87.0% | ||
| % Normalized EBIT margin | 33.0% | 5.8% | -2720 bps | -2720 bps | |||
| Normalized EBITDA | 409.4 | (280.5) | 129.0 | -68.5% | -68.5% | ||
| % Normalized EBITDA margin | 41.8% | 17.8% | -2400 bps | -2400 bps | |||
| NAB Brazil | YTD19 | Scope | Currency Translation | Organic Growth | YTD20 | % As Reported | % Organic |
| R$ million | |||||||
| Volume ('000 hl) | 12,420.0 | (838.5) | 11,581.5 | -6.8% | -6.8% | ||
| Net revenue | 2,061.2 | (264.6) | 1,796.6 | -12.8% | -12.8% | ||
| Net revenue/hl (R$) | 166.0 | (10.8) | 155.1 | -6.5% | -6.5% | ||
| COGS | (962.4) | 6.0 | (956.3) | -0.6% | -0.6% | ||
| COGS/hl (R$) | (77.5) | (5.1) | (82.6) | 6.6% | 6.6% | ||
| COGS excl. deprec. & amort. | (865.3) | 6.8 | (858.6) | -0.8% | -0.8% | ||
| COGS/hl excl. deprec. & amort. (R$) | (69.7) | (4.5) | (74.1) | 6.4% | 6.4% | ||
| Gross profit | 1,098.8 | (258.6) | 840.2 | -23.5% | -23.5% | ||
| % Gross margin | 53.3% | 46.8% | -650 bps | -650 bps | |||
| SG&A excl. deprec. & amort. | (566.0) | 13.4 | (552.6) | -2.4% | -2.4% | ||
| SG&A deprec. & amort. | (67.2) | (12.5) | (79.7) | 18.5% | 18.5% | ||
| SG&A total | (633.2) | 0.9 | (632.3) | -0.1% | -0.1% | ||
| Other operating income/(expenses) | 143.2 | (87.9) | 55.3 | -61.4% | -61.4% | ||
| Normalized EBIT | 608.8 | (345.6) | 263.3 | -56.8% | -56.8% | ||
| % Normalized EBIT margin | 29.5% | 14.7% | -1480 bps | -1480 bps | |||
| Normalized EBITDA | 773.1 | (332.4) | 440.7 | -43.0% | -43.0% | ||
| % Normalized EBITDA margin | 37.5% | 24.5% | -1300 bps | -1300 bps |
AMBEV REPORTS 2020 SECOND QUARTER RESULTS UNDER IFRS |
| | Second Quarter 2020 Results July 30, 2020 Page | 14 |
CENTRAL AMERICA AND THE CARIBBEAN (CAC)
The net revenue performance was driven by the volume decline caused by severe restrictions adopted to mitigate COVID-19 spread throughout the region. Our NR/hl increased due to the successful implementation of our revenue management initiatives.
Despite a very tough volume decline, CAC managed to deliver 39.9% of EBITDA margin in the quarter due to the disciplined execution of our COGS and SG&A savings initiatives coupled with a reduced impact of operational deleverage due to the high mix of returnable glass bottles in the Dominican Republic.
| CAC | 2Q19 | Scope | Currency Translation | Organic Growth | 2Q20 | % As Reported | % Organic |
| R$ million | |||||||
| Volume ('000 hl) | 3,448.7 | (1,359.0) | 2,089.7 | -39.4% | -39.4% | ||
| Net revenue | 1,685.8 | 272.7 | (571.0) | 1,387.4 | -17.7% | -33.9% | |
| Net revenue/hl (R$) | 488.8 | 130.5 | 44.6 | 663.9 | 35.8% | 9.1% | |
| COGS | (720.9) | (130.9) | 191.9 | (659.9) | -8.5% | -26.6% | |
| COGS/hl (R$) | (209.0) | (62.6) | (44.1) | (315.8) | 51.1% | 21.1% | |
| COGS excl. deprec. & amort. | (632.3) | (110.3) | 195.8 | (546.7) | -13.5% | -31.0% | |
| COGS/hl excl. deprec. & amort. (R$) | (183.3) | (52.8) | (25.5) | (261.6) | 42.7% | 13.9% | |
| Gross profit | 964.9 | 141.8 | (379.1) | 727.6 | -24.6% | -39.3% | |
| % Gross margin | 57.2% | 52.4% | -480 bps | -470 bps | |||
| SG&A excl. deprec. & amort. | (293.9) | (56.3) | 81.3 | (268.9) | -8.5% | -27.7% | |
| SG&A deprec. & amort. | (53.8) | (10.3) | 9.9 | (54.2) | 0.7% | -18.4% | |
| SG&A total | (347.7) | (66.6) | 91.2 | (323.1) | -7.1% | -26.2% | |
| Other operating income/(expenses) | 51.5 | (1.9) | (68.0) | (18.4) | -135.8% | -132.0% | |
| Normalized EBIT | 668.7 | 73.2 | (355.9) | 386.0 | -42.3% | -53.2% | |
| % Normalized EBIT margin | 39.7% | 27.8% | -1190 bps | -1160 bps | |||
| Normalized EBITDA | 811.1 | 104.1 | (361.9) | 553.3 | -31.8% | -44.6% | |
| % Normalized EBITDA margin | 48.1% | 39.9% | -820 bps | -780 bps | |||
| CAC | YTD19 | Scope | Currency Translation | Organic Growth | YTD20 | % As Reported | % Organic |
| R$ million | |||||||
| Volume ('000 hl) | 6,624.6 | (1,786.8) | 4,837.8 | -27.0% | -27.0% | ||
| Net revenue | 3,147.9 | 384.2 | (720.2) | 2,811.9 | -10.7% | -22.9% | |
| Net revenue/hl (R$) | 475.2 | 79.4 | 26.6 | 581.2 | 22.3% | 5.6% | |
| COGS | (1,364.2) | (186.3) | 212.3 | (1,338.2) | -1.9% | -15.6% | |
| COGS/hl (R$) | (205.9) | (38.5) | (32.2) | (276.6) | 34.3% | 15.6% | |
| COGS excl. deprec. & amort. | (1,198.5) | (159.0) | 219.8 | (1,137.7) | -5.1% | -18.3% | |
| COGS/hl excl. deprec. & amort. (R$) | (180.9) | (32.9) | (21.4) | (235.2) | 30.0% | 11.8% | |
| Gross profit | 1,783.7 | 197.9 | (508.0) | 1,473.6 | -17.4% | -28.5% | |
| % Gross margin | 56.7% | 52.4% | -430 bps | -410 bps | |||
| SG&A excl. deprec. & amort. | (616.4) | (84.0) | 115.8 | (584.6) | -5.2% | -18.8% | |
| SG&A deprec. & amort. | (88.4) | (13.7) | 7.5 | (94.6) | 7.0% | -8.5% | |
| SG&A total | (704.8) | (97.7) | 123.2 | (679.2) | -3.6% | -17.5% | |
| Other operating income/(expenses) | 56.2 | (1.6) | (67.7) | (13.1) | -123.3% | -120.4% | |
| Normalized EBIT | 1,135.1 | 98.5 | (452.4) | 781.3 | -31.2% | -39.9% | |
| % Normalized EBIT margin | 36.1% | 27.8% | -830 bps | -800 bps | |||
| Normalized EBITDA | 1,389.2 | 139.5 | (452.3) | 1,076.4 | -22.5% | -32.6% | |
| % Normalized EBITDA margin | 44.1% | 38.3% | -580 bps | -550 bps |
AMBEV REPORTS 2020 SECOND QUARTER RESULTS UNDER IFRS |
| | Second Quarter 2020 Results July 30, 2020 Page | 15 |
LATIN AMERICA SOUTH (LAS)[3]
Net revenue decreased in LAS mostly driven by Bolivia and Argentina, where volumes were affected by COVID-19 restrictions. NR/hl increased as a result of our continued revenue management initiatives, including in Argentina where we face a highly inflationary environment.
The significant increase in Cash COGS/hl is mainly explained by transactional FX, operational deleverage and pack mix, while the cash SG&A growth was mainly driven by the high inflation in Argentina despite an effective revision of our expenses in the region.
| LAS | 2Q19 | Scope | Currency Translation | IAS 29 3M Impact | Organic Growth | 2Q20 | % As Reported | % Organic |
| R$ million | ||||||||
| Volume ('000 hl) | 6,449.7 | (1,066.4) | 5,383.3 | -16.5% | -16.5% | |||
| Net revenue | 2,140.0 | (70.3) | (32.4) | (173.7) | 1,863.6 | -12.9% | -8.7% | |
| Net revenue/hl (R$) | 331.8 | (13.1) | (3.9) | 31.3 | 346.2 | 4.3% | 9.4% | |
| COGS | (886.0) | 20.9 | (10.2) | (244.3) | (1,119.7) | 26.4% | 28.7% | |
| COGS/hl (R$) | (137.4) | 3.9 | (0.1) | (74.4) | (208.0) | 51.4% | 54.2% | |
| COGS excl. deprec. & amort. | (708.1) | 14.3 | (13.6) | (215.6) | (923.0) | 30.4% | 31.5% | |
| COGS/hl excl. deprec. & amort. (R$) | (109.8) | 2.6 | (1.1) | (63.2) | (171.5) | 56.2% | 57.6% | |
| Gross profit | 1,253.9 | (49.4) | (42.6) | (417.9) | 744.0 | -40.7% | -36.2% | |
| % Gross margin | 58.6% | 39.9% | -1870 bps | -1730 bps | ||||
| SG&A excl. deprec. & amort. | (563.3) | 24.3 | 9.3 | (92.0) | (621.7) | 10.4% | 17.4% | |
| SG&A deprec. & amort. | (76.4) | 5.1 | 1.9 | (16.0) | (85.4) | 11.8% | 22.4% | |
| SG&A total | (639.7) | 29.4 | 11.2 | (108.0) | (707.1) | 10.5% | 18.0% | |
| Other operating income/(expenses) | (27.3) | 9.1 | 1.2 | (25.2) | (42.2) | 54.5% | 93.6% | |
| Normalized EBIT | 586.9 | (11.0) | (30.2) | (551.1) | (5.4) | -100.9% | -104.9% | |
| % Normalized EBIT margin | 27.4% | -0.3% | -2770 bps | -2760 bps | ||||
| Normalized EBITDA | 841.3 | (22.6) | (35.5) | (506.5) | 276.7 | -67.1% | -66.2% | |
| % Normalized EBITDA margin | 39.3% | 14.8% | -2450 bps | -2410 bps | ||||
| LAS | YTD19 | Scope | Currency Translation | IAS 29 3M Impact | Organic Growth | YTD20 | % As Reported | % Organic |
| R$ million | ||||||||
| Volume ('000 hl) | 15,222.2 | (505.0) | 14,717.2 | -3.3% | -3.3% | |||
| Net revenue | 4,810.1 | (218.7) | 392.4 | 4,983.8 | 3.6% | 8.2% | ||
| Net revenue/hl (R$) | 316.0 | (14.9) | 37.5 | 338.6 | 7.2% | 11.9% | ||
| COGS | (1,839.6) | 95.7 | (790.3) | (2,534.3) | 37.8% | 43.0% | ||
| COGS/hl (R$) | (120.9) | 6.5 | (57.8) | (172.2) | 42.5% | 47.9% | ||
| COGS excl. deprec. & amort. | (1,502.0) | - | 80.9 | (738.1) | (2,159.3) | 43.8% | 49.1% | |
| COGS/hl excl. deprec. & amort. (R$) | (98.7) | 5.5 | (53.5) | (146.7) | 48.7% | 54.3% | ||
| Gross profit | 2,970.5 | - | (123.0) | (397.9) | 2,449.5 | -17.5% | -13.4% | |
| % Gross margin | 61.8% | 49.1% | -1270 bps | -1240 bps | ||||
| SG&A excl. deprec. & amort. | (1,167.8) | 67.1 | (252.6) | (1,353.3) | 15.9% | 21.6% | ||
| SG&A deprec. & amort. | (148.6) | 9.8 | (25.5) | (164.2) | 10.5% | 17.2% | ||
| SG&A total | (1,316.4) | 76.9 | (278.1) | (1,517.6) | 15.3% | 21.1% | ||
| Other operating income/(expenses) | (27.3) | 7.6 | (5.9) | (25.6) | -6.3% | 21.6% | ||
| Normalized EBIT | 1,626.8 | (38.5) | (681.9) | 906.4 | -44.3% | -41.9% | ||
| % Normalized EBIT margin | 33.8% | 18.2% | -1560 bps | -1560 bps | ||||
| Normalized EBITDA | 2,113.0 | (63.1) | (604.2) | 1,445.7 | -31.6% | -28.6% | ||
| % Normalized EBITDA margin | 43.9% | 29.0% | -1490 bps | -1490 bps |
3 Reported numbers are presented applying Hyperinflation Accounting for our Argentinean operations, as detailed on page 21.
AMBEV REPORTS 2020 SECOND QUARTER RESULTS UNDER IFRS |
| | Second Quarter 2020 Results July 30, 2020 Page | 16 |
CANADA
Canada volumes grew, partially driven by strong beer market share gains due to the increased demand for known and trusted brands and the performance of future beverages led by our seltzer portfolio and innovations. The net revenue decrease in Canada resulted from negative NR/hl driven by unfavorable channel and pack mix.
Cash COGS/hl increased, impacted by channel and pack mix coupled with transactional FX. The volumes of kegs, which have lower COGS, were negatively impacted by on-trade restrictions and shifts in pack mix. In terms of SG&A, Canada was able to deliver solid savings.
| Canada | 2Q19 | Scope | Currency Translation | Organic Growth | 2Q20 | % As Reported | % Organic |
| R$ million | |||||||
| Volume ('000 hl) | 2,807.2 | 72.7 | 9.4 | 2,889.4 | 2.9% | 0.3% | |
| Net revenue | 2,043.2 | 62.2 | 483.0 | (78.8) | 2,509.6 | 22.8% | -3.9% |
| Net revenue/hl (R$) | 727.8 | 3.2 | 167.2 | (29.7) | 868.5 | 19.3% | -4.1% |
| COGS | (745.0) | (30.0) | (197.9) | (68.2) | (1,041.1) | 39.7% | 9.2% |
| COGS/hl (R$) | (265.4) | (3.7) | (68.5) | (22.7) | (360.3) | 35.8% | 8.6% |
| COGS excl. deprec. & amort. | (701.2) | (30.0) | (185.0) | (63.6) | (979.8) | 39.7% | 9.1% |
| COGS/hl excl. deprec. & amort. (R$) | (249.8) | (4.1) | (64.0) | (21.2) | (339.1) | 35.8% | 8.5% |
| Gross profit | 1,298.2 | 32.2 | 285.1 | (147.0) | 1,468.5 | 13.1% | -11.3% |
| % Gross margin | 63.5% | 58.5% | -500 bps | -490 bps | |||
| SG&A excl. deprec. & amort. | (682.9) | (20.6) | (146.8) | 126.6 | (723.7) | 6.0% | -18.5% |
| SG&A deprec. & amort. | (30.7) | (0.2) | (10.8) | (10.7) | (52.3) | 70.6% | 34.8% |
| SG&A total | (713.6) | (20.8) | (157.6) | 116.0 | (776.0) | 8.7% | -16.3% |
| Other operating income/(expenses) | (13.5) | (3.2) | 1.3 | (15.3) | 14.0% | -9.8% | |
| Normalized EBIT | 571.2 | 11.4 | 124.3 | (29.7) | 677.2 | 18.6% | -5.2% |
| % Normalized EBIT margin | 28.0% | 27.0% | -100 bps | -40 bps | |||
| Normalized EBITDA | 645.7 | 11.6 | 148.0 | (14.5) | 790.8 | 22.5% | -2.2% |
| % Normalized EBITDA margin | 31.6% | 31.5% | -10 bps | 50 bps | |||
| Canada | YTD19 | Scope | Currency Translation | Organic Growth | YTD20 | % As Reported | % Organic |
| R$ million | |||||||
| Volume ('000 hl) | 4,646.1 | 94.7 | 66.7 | 4,807.5 | 3.5% | 1.4% | |
| Net revenue | 3,336.7 | 79.7 | 662.7 | (36.7) | 4,042.5 | 21.2% | -1.1% |
| Net revenue/hl (R$) | 718.2 | 2.5 | 137.9 | (17.6) | 840.9 | 17.1% | -2.5% |
| COGS | (1,198.2) | (38.5) | (268.0) | (136.5) | (1,641.2) | 37.0% | 11.4% |
| COGS/hl (R$) | (257.9) | (3.0) | (55.8) | (24.8) | (341.4) | 32.4% | 9.6% |
| COGS excl. deprec. & amort. | (1,129.1) | (38.5) | (248.8) | (109.7) | (1,526.1) | 35.2% | 9.7% |
| COGS/hl excl. deprec. & amort. (R$) | (243.0) | (3.3) | (51.7) | (19.4) | (317.4) | 30.6% | 8.0% |
| Gross profit | 2,138.5 | 41.2 | 394.7 | (173.2) | 2,401.2 | 12.3% | -8.1% |
| % Gross margin | 64.1% | 59.4% | -470 bps | -450 bps | |||
| SG&A excl. deprec. & amort. | (1,212.6) | (30.4) | (218.1) | 126.4 | (1,334.7) | 10.1% | -10.4% |
| SG&A deprec. & amort. | (59.5) | (0.5) | (15.8) | (18.9) | (94.7) | 59.2% | 31.8% |
| SG&A total | (1,272.1) | (31.0) | (233.9) | 107.5 | (1,429.4) | 12.4% | -8.4% |
| Other operating income/(expenses) | (20.3) | (4.8) | (3.4) | (28.5) | 40.2% | 16.8% | |
| Normalized EBIT | 846.1 | 10.3 | 156.0 | (69.1) | 943.3 | 11.5% | -8.2% |
| % Normalized EBIT margin | 25.4% | 23.3% | -210 bps | -190 bps | |||
| Normalized EBITDA | 974.7 | 10.8 | 191.0 | (23.3) | 1,153.2 | 18.3% | -2.4% |
| % Normalized EBITDA margin | 29.2% | 28.5% | -70 bps | -40 bps |
AMBEV REPORTS 2020 SECOND QUARTER RESULTS UNDER IFRS |
| | Second Quarter 2020 Results July 30, 2020 Page | 17 |
OTHER OPERATING INCOME/EXPENSES
Other operating income decreased because of lower government grants, due to the volume decline observed in Brazil and the hard comparable in the previous year.
| Other operating income/(expenses) | 2Q19 | 2Q20 | YTD19 | YTD20 |
| R$ million | ||||
| Government grants/NPV of long term fiscal incentives | 191.1 | 118.0 | 395.2 | 274.6 |
| (Additions to)/reversals of provisions | (11.1) | (25.7) | (8.3) | (28.2) |
| Gain/(loss) on disposal of fixed assets, intangible assets and operations in associates | 10.2 | (17.2) | 12.8 | (1.3) |
| Net other operating income/(expenses) | 0.6 | (10.2) | 22.3 | (8.9) |
| Other operating income/(expenses) | 190.8 | 64.9 | 422.0 | 236.2 |
EXCEPTIONAL ITEMS
Exceptional items correspond to (i) exceptional expenses incurred in relation to the COVID-19 pandemic, including the actions taken to ensure the health and safety of our employees, such as the acquisition of hand-sanitizer, masks and additional cleaning of our facilities, as well as donations to the broader community, and (ii) restructuring expenses primarily linked to centralization and sizing projects in Brazil and LAS.
| Exceptional items | 2Q19 | 2Q20 | YTD19 | YTD20 |
| R$ million | ||||
| Costs from business combination | (16.7) | - | (16.7) | |
| Restructuring | (32.8) | (36.2) | (51.0) | (50.0) |
| IAS 29/CPC 42 (hyperinflation) application effect | (1.1) | (0.5) | (1.3) | (0.5) |
| COVID-19 impact | (61.3) | - | (71.5) | |
| Other | (13.3) | - | (13.3) | |
| Exceptional items | (33.9) | (127.9) | (52.3) | (152.0) |
AMBEV REPORTS 2020 SECOND QUARTER RESULTS UNDER IFRS |
| | Second Quarter 2020 Results July 30, 2020 Page | 18 |
NET FINANCE RESULTS
The net finance results performance is broken down as follows:
| · | Interest income of R$ 149.8 million, driven by our cash balance, mainly in Brazilian Reais, US dollars and Canadian dollars; |
| · | Interest expenses of R$ 432.2 million, which include interest expenses on lease liabilities, as determined by IFRS 16; interest expenses incurred in connection with the Brazilian Tax Regularization Program – PERT; interest accrual related to long term state tax incentives in Brazil; fair value adjustments of payables as determined by IFRS 13 (CPC 46); as well as a non-cash accrual of approximately R$ 100 million related to the put option associated with our investment in the Dominican Republic; |
| · | R$ 202.6 million of losses on derivative instruments, mainly explained by FX hedges carry costs linked to our COGS and Capex exposure in Argentina, partially offset by gains related to equity swaps; |
| · | Losses on non-derivative instruments of R$ 148.3 million, mainly explained by balance sheet exposure (intercompany and third-party payables), mostly linked to the Argentinean Peso and the Brazilian Real depreciation; |
| · | R$ 48.9 million of taxes on financial transactions; |
| · | R$ 196.4 million of other financial expenses, mainly explained by accruals on legal contingencies and pension plan expenses, letters of credit expenses and debt issuance fees; |
| · | R$ 84.8 million of non-cash financial income resulting from the adoption of Hyperinflation Accounting in Argentina, as detailed on page 21. |
| Net finance results | 2Q19 | 2Q20 | YTD19 | YTD20 |
| R$ million | ||||
| Interest income | 155.7 | 149.8 | 290.9 | 297.4 |
| Interest expenses | (382.9) | (432.2) | (774.2) | (858.7) |
| Gains/(losses) on derivative instruments | (203.7) | (202.6) | (398.6) | (1,148.0) |
| Gains/(losses) on non-derivative instruments | (13.1) | (148.3) | (123.9) | (352.5) |
| Taxes on financial transactions | (18.7) | (48.9) | (72.7) | (135.5) |
| Other financial income/(expenses), net | (93.5) | (196.4) | (246.5) | (298.3) |
| Exceptional financial income/(expenses), net | (99.0) | (99.0) | ||
| Hyperinflation Argentina | 87.9 | 84.8 | 184.6 | 164.9 |
| Net finance results | (567.4) | (793.7) | (1,239.5) | (2,330.6) |
AMBEV REPORTS 2020 SECOND QUARTER RESULTS UNDER IFRS |
| | Second Quarter 2020 Results July 30, 2020 Page | 19 |
DEBT BREAKDOWN
| Debt breakdown | December 31, 2019 | June 30, 2020 | ||||
| R$ million | Current | Non-current | Total | Current | Non-current | Total |
| Local Currency | 474.3 | 1,881.9 | 2,356.2 | 2,675.3 | 1,904.2 | 4,579.5 |
| Foreign Currency | 178.9 | 527.7 | 706.6 | 1,443.4 | 759.9 | 2,203.4 |
| Consolidated Debt | 653.1 | 2,409.7 | 3,062.8 | 4,118.7 | 2,664.1 | 6,782.8 |
| Cash and Cash Equivalents less Bank Overdrafts | 11,900.6 | 16,748.2 | ||||
| Current Investment Securities | 14.6 | 44.8 | ||||
| Net debt/(cash) | (8,852.4) | (10,010.2) | ||||
AMBEV REPORTS 2020 SECOND QUARTER RESULTS UNDER IFRS |
| | Second Quarter 2020 Results July 30, 2020 Page | 20 |
PROVISION FOR INCOME TAX & SOCIAL
The table below demonstrates the tax and social contribution provision.
| Income tax and social contribution | 2Q19 | 2Q20 | YTD19 | YTD20 |
| R$ million | ||||
| Profit before tax | 2,980.0 | 1,108.2 | 6,361.5 | 2,599.1 |
| Adjustment on taxable basis | ||||
| Non-taxable other income | (299.9) | (308.5) | (367.9) | (563.0) |
| Goverment grants (VAT) | (438.7) | (349.4) | (925.9) | (754.4) |
| Share of results of joint ventures | 0.7 | 16.2 | 2.9 | 22.9 |
| Expenses not deductible | 66.1 | 97.0 | 225.2 | 153.3 |
| Foreign profits taxed in Brazil | 128.9 | 232.2 | 251.5 | 284.9 |
| 2,437.1 | 795.7 | 5,547.4 | 1,742.8 | |
| Aggregated weighted nominal tax rate | 28.9% | 24.0% | 29.3% | 26.6% |
| Taxes – nominal rate | (705.1) | (190.7) | (1,626.9) | (462.9) |
| Adjustment on tax expense | ||||
| Tax benefit - interest on shareholders' equity | 386.9 | 534.0 | 756.0 | 675.3 |
| Tax benefit - amortization on tax books | 19.4 | 19.4 | 41.8 | 38.7 |
| Argentina's hyperinflation effect | (20.0) | (10.0) | (38.2) | (29.6) |
| Other tax adjustments | (45.3) | (189.5) | (129.3) | (338.1) |
| Income tax and social contribution expense | (364.1) | 163.1 | (996.6) | (116.5) |
| Effective tax rate | 12.2% | -14.7% | 15.7% | 4.5% |
SHAREHOLDING STRUCTURE
The table below summarizes Ambev S.A.’s shareholding structure as of June 30, 2020.
| Ambev S.A.'s shareholding structure | ||
| ON | % Outs | |
| Anheuser-Busch InBev | 9,728,777,961 | 61.8% |
| FAHZ | 1,609,987,301 | 10.2% |
| Market | 4,394,312,642 | 27.9% |
| Outstanding | 15,733,077,904 | 100.0% |
| Treasury | 2,040,061 | |
| TOTAL | 15,735,117,965 | |
| Free float B3 | 3,067,050,806 | 19.5% |
| Free float NYSE | 1,327,261,836 | 8.4% |
AMBEV REPORTS 2020 SECOND QUARTER RESULTS UNDER IFRS |
| | Second Quarter 2020 Results July 30, 2020 Page | 21 |
FINANCIAL REPORTING IN HYPERINFLATIONARY ECONOMIES - ARGENTINA
Following the categorization of Argentina as a country with a three-year cumulative inflation rate greater than 100%, the country is considered highly inflationary in accordance with IFRS.
Consequently, starting from 3Q18, we have been reporting the operations of our Argentinean affiliates applying Hyperinflation Accounting. The IFRS and CPC rules (IAS 29/CPC 42) require the results of our operations in hyperinflationary economies to be reported restating the year to date results adjusting for the change in the general purchasing power of the local currency, using official indices, before converting the local amounts at the closing rate of the period (i.e., June 30, 2020 closing rate for 2Q20 and YTD20 results).
The HY20 Hyperinflation Accounting adjustment results from the combined effect of (i) the indexation to reflect changes in purchasing power on the HY20 results against a dedicated line in the finance results, and (ii) the difference between the translation of the HY20 results at the closing exchange rate of June 30, 2020 and the translation using the average year to date rate on the reported period, as applicable to non-inflationary economies. 2Q20 results under Hyperinflation Accounting are calculated as the difference between reported HY20 and 1Q20 results.
The impacts in 2Q19, YTD19, 2Q20 and YTD20 on Net Revenue and Normalized EBITDA were as follows:
| Impact of Hyperinflation Accounting (IAS 29/CPC42) | ||||
| Revenue | ||||
| R$ million | 2Q19 | 2Q20 | YTD19 | YTD20 |
| Indexation(1) | 172.6 | 110.7 | 225.9 | 149.4 |
| Currency(2) | 10.3 | (134.0) | (119.6) | 98.8 |
| Total Impact | 183.0 | (23.3) | 106.3 | 248.2 |
| Normalized EBITDA | ||||
| R$ million | 2Q19 | 2Q20 | YTD19 | YTD20 |
| Indexation(1) | 77.6 | 42.3 | 92.7 | 43.9 |
| Currency(2) | 21.0 | (62.7) | (53.9) | 30.1 |
| Total Impact | 98.5 | (20.3) | 38.9 | 74.0 |
| BRLARS average rate | 10.5052 | 13.3657 | ||
| BRLARS closing rate | 11.0769 | 12.8661 | 11.0769 | 12.8661 |
| (1) | Indexation calculated at each period’s closing exchange rate. |
| (2) | Currency impact calculated as the difference between converting the Argentinean peso (ARS) reported amounts at the closing exchange rate compared to the average exchange rate of each period. |
Furthermore, IAS 29 requires adjusting non-monetary assets and liabilities on the balance sheet of our operations in hyperinflationary economies for cumulative inflation. The resulting effect from the adjustment until December 31, 2017 was reported in Equity and, the effect from the adjustment from this date on, in a dedicated account in the finance results, reporting deferred taxes on such adjustments, when applicable.
In 2Q20, the transition to Hyperinflation Accounting in accordance with the IFRS rules, resulted in (i) a positive R$ 84.8 million adjustment reported in the finance results; (ii) a negative impact on the Profit of R$ 21.4 million; (iii) a negative impact on the Normalized Profit of R$ 20.7 million; and (iv) no material impact on EPS, but a positive impact of R$ 0.01 on Normalized EPS.
In HY20, the consequences of the transition were (i) a positive R$ 164.9 million adjustment reported in the finance results; (ii) a negative impact on the Profit of R$ 50.9 million; (iii) a negative impact on the Normalized Profit of R$ 49.8 million; and (iv) no material impact on EPS, as well as on Normalized EPS.
The 2Q20 results are calculated by deducting from the HY results the 3M results as published. As a consequence, LAS and Consolidated 2Q20 and 2Q19 results are impacted by the adjustment of 3M results for the cumulative inflation between March 31 and June 30, as well as by the translation of 3M results at the HY closing exchange rate, of June 30, as follows:
AMBEV REPORTS 2020 SECOND QUARTER RESULTS UNDER IFRS |
| | Second Quarter 2020 Results July 30, 2020 Page | 22 |
| LAS - 3M As Reported | YTD19 | Scope | Currency Translation | Organic Growth | YTD20 | % Organic |
| Net revenue | 4,810.1 | (218.7) | 392.4 | 4,983.8 | 8.2% | |
| COGS | (1,839.6) | 95.7 | (790.3) | (2,534.3) | 43.0% | |
| COGS excl. deprec. & amort. | (1,502.0) | 80.9 | (738.1) | (2,159.3) | 49.1% | |
| Gross profit | 2,970.5 | (123.0) | (397.9) | 2,449.5 | -13.4% | |
| SG&A excl. deprec. & amort. | (1,167.8) | 67.1 | (252.6) | (1,353.3) | 21.6% | |
| SG&A deprec. & amort. | (148.6) | 9.8 | (25.5) | (164.2) | 17.2% | |
| SG&A total | (1,316.4) | 76.9 | (278.1) | (1,517.6) | 21.1% | |
| Other operating income/(expenses) | (27.3) | 7.6 | (5.9) | (25.6) | 21.6% | |
| Normalized EBIT | 1,626.8 | (38.5) | (681.9) | 906.4 | -41.9% | |
| Normalized EBITDA | 2,113.0 | (63.1) | (604.2) | 1,445.7 | -28.6% | |
| LAS - 3M Recalculated at HY Exchange Rates | YTD19 | Scope | Currency Translation | Organic Growth | YTD20 | % Organic |
| Net revenue | 4,944.7 | (305.3) | 360.0 | 4,999.4 | 7.3% | |
| COGS | (1,873.7) | 133.2 | (800.5) | (2,541.0) | 42.7% | |
| COGS excl. deprec. & amort. | (1,526.6) | 113.2 | (751.7) | (2,165.1) | 49.2% | |
| Gross profit | 3,071.0 | (172.1) | (440.5) | 2,458.4 | -14.3% | |
| SG&A excl. deprec. & amort. | (1,201.4) | 87.7 | (243.3) | (1,357.0) | 20.3% | |
| SG&A deprec. & amort. | (153.5) | 12.4 | (23.6) | (164.7) | 15.4% | |
| SG&A total | (1,354.9) | 100.0 | (266.9) | (1,521.7) | 19.7% | |
| Other operating income/(expenses) | (27.7) | 6.9 | (4.7) | (25.4) | 16.9% | |
| Normalized EBIT | 1,688.4 | (65.1) | (712.1) | 911.2 | -42.2% | |
| Normalized EBITDA | 2,189.0 | (97.5) | (639.7) | 1,451.8 | -29.2% | |
| LAS - 3M Recalculation Impact in 2Q | YTD19 | Scope | Currency Translation | Organic Growth | YTD20 | % Organic |
| Net revenue | 134.6 | (86.6) | (32.4) | 15.6 | ||
| COGS | (34.0) | 37.5 | (10.2) | (6.8) | ||
| COGS excl. deprec. & amort. | (24.6) | 32.3 | (13.6) | (5.8) | ||
| Gross profit | 100.5 | (49.1) | (42.6) | 8.8 | ||
| SG&A excl. deprec. & amort. | (33.6) | 20.6 | 9.3 | (3.7) | ||
| SG&A deprec. & amort. | (4.9) | 2.5 | 1.9 | (0.5) | ||
| SG&A total | (38.5) | 23.1 | 11.2 | (4.2) | ||
| Other operating income/(expenses) | (0.4) | (0.7) | 1.2 | 0.1 | ||
| Normalized EBIT | 61.6 | (26.6) | (30.2) | 4.8 | ||
| Normalized EBITDA | 76.0 | (34.3) | (35.5) | 6.2 |
In the corresponding sections, the impacts above are excluded from organic calculation and are identified separately in the columns labeled “IAS 29 3M Impact”. Organic percentage growth rates for 2Q20 are calculated by considering the “Organic growth” reported in the tables in the applicable sections, over 2Q19 base adjusted for the 3M19 recalculation.
AMBEV REPORTS 2020 SECOND QUARTER RESULTS UNDER IFRS |
| | Second Quarter 2020 Results July 30, 2020 Page | 23 |
RECONCILIATION BETWEEN NORMALIZED EBITDA & PROFIT
Both Normalized EBITDA and EBIT are measures used by Ambev’s management to measure the Company’s performance.
Normalized EBITDA is calculated excluding from Profit the following effects: (i) Non-controlling interest; (ii) Income Tax expense; (iii) Share of results of associates; (iv) Net finance results; (v) Exceptional items; and (vi) Depreciation & Amortization.
Normalized EBITDA and EBIT are not accounting measures under accounting practices in Brazil, IFRS or the United States of America (US GAAP) and should not be considered as an alternative to Profit as a measure of operational performance or an alternative to Cash Flow as a measure of liquidity. Normalized EBITDA and EBIT do not have a standard calculation method and Ambev’s definition of Normalized EBITDA and EBIT may not be comparable to that of other companies.
| Reconciliation - Profit to EBITDA | 2Q19 | 2Q20 | YTD19 | YTD20 |
| R$ million | ||||
| Profit - Ambev holders | 2,520.7 | 1,226.8 | 5,182.6 | 2,318.6 |
| Non-controlling interest | 95.2 | 44.5 | 182.4 | 164.0 |
| Income tax expense | 364.1 | (163.1) | 996.6 | 116.5 |
| Profit before taxes | 2,980.0 | 1,108.2 | 6,361.5 | 2,599.1 |
| Share of results of joint ventures | 0.7 | 16.2 | 2.9 | 22.9 |
| Net finance results | 567.4 | 793.7 | 1,239.5 | 2,330.6 |
| Exceptional items | 33.9 | 127.9 | 52.3 | 152.0 |
| Normalized EBIT | 3,582.1 | 2,046.1 | 7,656.2 | 5,104.5 |
| Depreciation & amortization - total | 1,109.2 | 1,302.2 | 2,155.7 | 2,476.2 |
| Normalized EBITDA | 4,691.3 | 3,348.3 | 9,811.9 | 7,580.8 |
AMBEV REPORTS 2020 SECOND QUARTER RESULTS UNDER IFRS |
| | Second Quarter 2020 Results July 30, 2020 Page | 24 |
Q2 2020 EARNINGS CONFERENCE CALL
Speakers: | Jean Jereissati Neto Chief Executive Officer
Lucas Machado Lira Chief Financial and Investor Relations Officer | |
Language: | English | |
Date: | July 30, 2020 (Thursday) | |
Time: | 12:00 (Brasília time) 11:00 (EST) | |
Phone number: | US participants International participants
| +1 (844) 435-0325 |
Conference ID: | Ambev | |
Please call 15 minutes prior to the beginning of the conference call.
Webcast: The conference call will also be transmitted live through the Internet, available on Ambev’s website: https://webcastlite.mziq.com/cover.html?webcastId=6d51d07b-9972-44ef-99fc-0f91a1c0f78b
A slide presentation will be available for download in our website (ri.ambev.com.br), as well as at the webcast platform through the link above.
Playback: The conference call replay through internet will be available one hour after conclusion at Ambev’s website at the same link above. For Playback through telephone: +1 (412) 317-0088 / Code: 10145361
For additional information, please contact the Investor Relations team:
Thiago Levy +55 (11) 2122-1415 thiago.levy@ambev.com.br
| Felipe Trotta +55 (11) 2122-1414 felipe.trotta@ambev.com.br
|
ri.ambev.com.br
AMBEV REPORTS 2020 SECOND QUARTER RESULTS UNDER IFRS |
| | Second Quarter 2020 Results July 30, 2020 Page | 25 |
NOTES
This press release segregates the impact of organic changes from those arising from changes in scope or currency translation. Scope changes represent the impact of acquisitions and divestitures, the start up or termination of activities or the transfer of activities between segments, curtailment gains and losses and year-over-year changes in accounting estimates and other assumptions that management does not consider as part of the underlying performance of the business. Organic growth and normalized numbers are presented applying constant year-over-year exchange rates to exclude the impact of the movement of foreign exchange rates.
Unless stated, percentage changes in this press release are both organic and normalized in nature. Whenever used in this document, the term “normalized” refers to performance measures (EBITDA, EBIT, Profit, EPS) before exceptional items adjustments. Exceptional items are either income or expenses which do not occur regularly as part of the normal activities of the Company. They are presented separately because they are important for the understanding of the underlying sustainable performance of the Company due to their size or nature. Normalized measures are additional measures used by management and should not replace the measures determined in accordance with IFRS as indicators of the Company’s performance. Comparisons, unless otherwise stated, refer to the second quarter of 2019 (2Q19). Values in this release may not add up due to rounding.
Statements contained in this press release may contain information that is forward-looking and reflects management’s current view and estimates of future economic circumstances, industry conditions, Company performance, and finance results. Any statements, expectations, capabilities, plans and assumptions contained in this press release that do not describe historical facts, such as statements regarding the declaration or payment of dividends, the direction of future operations, the implementation of principal operating and financing strategies and capital expenditure plans, the factors or trends affecting financial condition, liquidity or results of operations, are forward-looking statements within the meaning of the U.S. Private Securities Litigation Reform Act of 1995 and involve a number of risks and uncertainties. There is no guarantee that these results will actually occur. The statements are based on many assumptions and factors, including general economic and market conditions, industry conditions, and operating factors. Any changes in such assumptions or factors could cause actual results to differ materially from current expectations.
AMBEV REPORTS 2020 SECOND QUARTER RESULTS UNDER IFRS |
| | Second Quarter 2020 Results July 30, 2020 Page | 26 |
| Ambev - Segment financial information | Brazil | CAC | LAS | Canada | Ambev | ||||||||||||||||
| Organic results | Beer | NAB | Total | Consolidated | |||||||||||||||||
| 2Q19 | 2Q20 | % | 2Q19 | 2Q20 | % | 2Q19 | 2Q20 | % | 2Q19 | 2Q20 | % | 2Q19 | 2Q20 | % | 2Q19 | 2Q20 | % | 2Q19 | 2Q20 | % | |
| Volume (000 hl) | 18,245.3 | 17,951.6 | -1.6% | 5,914.3 | 5,151.6 | -12.9% | 24,159.6 | 23,103.2 | -4.4% | 3,448.7 | 2,089.7 | -39.4% | 6,449.7 | 5,383.3 | -16.5% | 2,807.2 | 2,889.4 | 0.3% | 36,865.2 | 33,465.6 | -9.4% |
| R$ million | |||||||||||||||||||||
| Net revenue | 5,296.5 | 5,128.6 | -3.2% | 979.7 | 726.1 | -25.9% | 6,276.2 | 5,854.7 | -6.7% | 1,685.8 | 1,387.4 | -33.9% | 2,140.0 | 1,863.6 | -8.7% | 2,043.2 | 2,509.6 | -3.9% | 12,145.1 | 11,615.3 | -10.4% |
| % of total | 43.6% | 44.2% | 8.1% | 6.3% | 51.7% | 50.4% | 13.9% | 11.9% | 17.6% | 16.0% | 16.8% | 21.6% | 100.0% | 100.0% | |||||||
| COGS | (2,206.4) | (2,573.6) | 16.6% | (403.0) | (407.6) | 1.1% | (2,609.4) | (2,981.3) | 14.3% | (720.9) | (659.9) | -26.6% | (886.0) | (1,119.7) | 28.7% | (745.0) | (1,041.1) | 9.2% | (4,961.3) | (5,801.9) | 10.0% |
| % of total | 44.5% | 44.4% | 8.1% | 7.0% | 52.6% | 51.4% | 14.5% | 11.4% | 17.9% | 19.3% | 15.0% | 17.9% | 100.0% | 100.0% | |||||||
| Gross profit | 3,090.1 | 2,555.0 | -17.3% | 576.6 | 318.4 | -44.8% | 3,666.8 | 2,873.4 | -21.6% | 964.9 | 727.6 | -39.3% | 1,253.9 | 744.0 | -36.2% | 1,298.2 | 1,468.5 | -11.3% | 7,183.8 | 5,813.5 | -24.5% |
| % of total | 43.0% | 43.9% | 8.0% | 5.5% | 51.0% | 49.4% | 13.4% | 12.5% | 17.5% | 12.8% | 18.1% | 25.3% | 100.0% | 100.0% | |||||||
| SG&A | (1,752.9) | (1,725.8) | -1.5% | (338.6) | (300.2) | -11.3% | (2,091.5) | (2,026.1) | -3.1% | (347.7) | (323.1) | -26.2% | (639.7) | (707.1) | 18.0% | (713.6) | (776.0) | -16.3% | (3,792.5) | (3,832.3) | -4.4% |
| % of total | 46.2% | 45.0% | 8.9% | 7.8% | 55.1% | 52.9% | 9.2% | 8.4% | 16.9% | 18.5% | 18.8% | 20.2% | 100.0% | 100.0% | |||||||
| Other operating income/(expenses) | 94.7 | 117.2 | 23.8% | 85.4 | 23.7 | -72.2% | 180.1 | 140.9 | -21.8% | 51.5 | (18.4) | -132.0% | (27.3) | (42.2) | 93.6% | (13.5) | (15.3) | -9.8% | 190.8 | 64.9 | -68.5% |
| % of total | 49.6% | 180.5% | 44.8% | 36.6% | 94.4% | 217.1% | 27.0% | -28.4% | -14.3% | -65.0% | -7.1% | -23.6% | 100.0% | 100.0% | |||||||
| Normalized EBIT | 1,431.9 | 946.3 | -33.9% | 323.4 | 41.9 | -87.0% | 1,755.3 | 988.2 | -43.7% | 668.7 | 386.0 | -53.2% | 586.9 | (5.4) | -104.9% | 571.2 | 677.2 | -5.2% | 3,582.1 | 2,046.1 | -48.4% |
| % of total | 40.0% | 46.2% | 9.0% | 2.0% | 49.0% | 48.3% | 18.7% | 18.9% | 16.4% | -0.3% | 15.9% | 33.1% | 100.0% | 100.0% | |||||||
| Normalized EBITDA | 1,983.8 | 1,598.5 | -19.4% | 409.4 | 129.0 | -68.5% | 2,393.2 | 1,727.5 | -27.8% | 811.1 | 553.3 | -44.6% | 841.3 | 276.7 | -66.2% | 645.7 | 790.8 | -2.2% | 4,691.3 | 3,348.3 | -33.6% |
| % of total | 42.3% | 47.7% | 8.7% | 3.9% | 51.0% | 51.6% | 17.3% | 16.5% | 17.9% | 8.3% | 13.8% | 23.6% | 100.0% | 100.0% | |||||||
| % of net revenue | |||||||||||||||||||||
| Net revenue | 100.0% | 100.0% | 100.0% | 100.0% | 100.0% | 100.0% | 100.0% | 100.0% | 100.0% | 100.0% | 100.0% | 100.0% | 100.0% | 100.0% | |||||||
| COGS | -41.7% | -50.2% | -41.1% | -56.1% | -41.6% | -50.9% | -42.8% | -47.6% | -41.4% | -60.1% | -36.5% | -41.5% | -40.9% | -50.0% | |||||||
| Gross profit | 58.3% | 49.8% | 58.9% | 43.9% | 58.4% | 49.1% | 57.2% | 52.4% | 58.6% | 39.9% | 63.5% | 58.5% | 59.1% | 50.0% | |||||||
| SG&A | -33.1% | -33.7% | -34.6% | -41.4% | -33.3% | -34.6% | -20.6% | -23.3% | -29.9% | -37.9% | -34.9% | -30.9% | -31.2% | -33.0% | |||||||
| Other operating income/(expenses) | 1.8% | 2.3% | 8.7% | 3.3% | 2.9% | 2.4% | 3.1% | -1.3% | -1.3% | -2.3% | -0.7% | -0.6% | 1.6% | 0.6% | |||||||
| Normalized EBIT | 27.0% | 18.5% | 33.0% | 5.8% | 28.0% | 16.9% | 39.7% | 27.8% | 27.4% | -0.3% | 28.0% | 27.0% | 29.5% | 17.6% | |||||||
| Normalized EBITDA | 37.5% | 31.2% | 41.8% | 17.8% | 38.1% | 29.5% | 48.1% | 39.9% | 39.3% | 14.8% | 31.6% | 31.5% | 38.6% | 28.8% | |||||||
| Per hectoliter - (R$/hl) | |||||||||||||||||||||
| Net revenue | 290.3 | 285.7 | -1.6% | 165.6 | 140.9 | -14.9% | 259.8 | 253.4 | -2.5% | 488.8 | 663.9 | 9.1% | 331.8 | 346.2 | 9.4% | 727.8 | 868.5 | -4.1% | 329.4 | 347.1 | 2.2% |
| COGS | (120.9) | (143.4) | 18.6% | (68.1) | (79.1) | 16.1% | (108.0) | (129.0) | 19.5% | (209.0) | (315.8) | 21.1% | (137.4) | (208.0) | 54.2% | (265.4) | (360.3) | 8.6% | (134.6) | (173.4) | 21.4% |
| Gross profit | 169.4 | 142.3 | -16.0% | 97.5 | 61.8 | -36.6% | 151.8 | 124.4 | -18.1% | 279.8 | 348.2 | 0.2% | 194.4 | 138.2 | -24.2% | 462.5 | 508.2 | -11.3% | 194.9 | 173.7 | -16.9% |
| SG&A | (96.1) | (96.1) | 0.1% | (57.3) | (58.3) | 1.8% | (86.6) | (87.7) | 1.3% | (100.8) | (154.6) | 21.8% | (99.2) | (131.4) | 37.9% | (254.2) | (268.6) | -16.1% | (102.9) | (114.5) | 5.3% |
| Other operating income/(expenses) | 5.2 | 6.5 | 25.8% | 14.4 | 4.6 | -68.1% | 7.5 | 6.1 | -18.2% | 14.9 | (8.8) | -152.8% | (4.2) | (7.8) | 125.1% | (4.8) | (5.3) | -9.9% | 5.2 | 1.9 | -64.6% |
| Normalized EBIT | 78.5 | 52.7 | -32.8% | 54.7 | 8.1 | -85.1% | 72.7 | 42.8 | -41.1% | 193.9 | 184.7 | -22.8% | 91.0 | (1.0) | -98.9% | 203.5 | 234.4 | -5.4% | 97.2 | 61.1 | -42.9% |
| Normalized EBITDA | 108.7 | 89.0 | -18.1% | 69.2 | 25.0 | -63.8% | 99.1 | 74.8 | -24.5% | 235.2 | 264.8 | -8.6% | 130.4 | 51.4 | -57.4% | 230.0 | 273.7 | -2.5% | 127.3 | 100.1 | -26.8% |
AMBEV REPORTS 2020 SECOND QUARTER RESULTS UNDER IFRS |
| | Second Quarter 2020 Results July 30, 2020 Page | 27 |
| Ambev - Segment financial information | Brazil | CAC | LAS | Canada | Ambev | ||||||||||||||||
| Organic results | Beer | NAB | Total | Consolidated | |||||||||||||||||
| YTD19 | YTD20 | % | YTD19 | YTD20 | % | YTD19 | YTD20 | % | YTD19 | YTD20 | % | YTD19 | YTD20 | % | YTD19 | YTD20 | % | YTD19 | YTD20 | % | |
| Volume (000 hl) | 39,248.7 | 36,533.1 | -6.9% | 12,420.0 | 11,581.5 | -6.8% | 51,668.7 | 48,114.6 | -6.9% | 6,624.6 | 4,837.8 | -27.0% | 15,222.2 | 14,717.2 | -3.3% | 4,646.1 | 4,807.5 | 1.4% | 78,161.6 | 72,477.1 | -7.4% |
| R$ million | |||||||||||||||||||||
| Net revenue | 11,429.3 | 10,583.2 | -7.4% | 2,061.2 | 1,796.6 | -12.8% | 13,490.5 | 12,379.8 | -8.2% | 3,147.9 | 2,811.9 | -22.9% | 4,810.1 | 4,983.8 | 8.2% | 3,336.7 | 4,042.5 | -1.1% | 24,785.3 | 24,217.9 | -6.0% |
| % of total | 46.1% | 43.7% | 8.3% | 7.4% | 54.4% | 51.1% | 12.7% | 11.6% | 19.4% | 20.6% | 13.5% | 16.7% | 100.0% | 100.0% | |||||||
| COGS | (4,704.6) | (4,975.0) | 5.7% | (962.4) | (956.3) | -0.6% | (5,667.0) | (5,931.3) | 4.7% | (1,364.2) | (1,338.2) | -15.6% | (1,839.6) | (2,534.3) | 43.0% | (1,198.2) | (1,641.2) | 11.4% | (10,069.0) | (11,445.1) | 9.7% |
| % of total | 46.7% | 43.5% | 9.6% | 8.4% | 56.3% | 51.8% | 13.5% | 11.7% | 18.3% | 22.1% | 11.9% | 14.3% | 100.0% | 100.0% | |||||||
| Gross profit | 6,724.7 | 5,608.2 | -16.6% | 1,098.8 | 840.2 | -23.5% | 7,823.6 | 6,448.5 | -17.6% | 1,783.7 | 1,473.6 | -28.5% | 2,970.5 | 2,449.5 | -13.4% | 2,138.5 | 2,401.2 | -8.1% | 14,716.3 | 12,772.9 | -16.7% |
| % of total | 45.7% | 43.9% | 7.5% | 6.6% | 53.2% | 50.5% | 12.1% | 11.5% | 20.2% | 19.2% | 14.5% | 18.8% | 100.0% | 100.0% | |||||||
| SG&A | (3,555.5) | (3,646.0) | 2.5% | (633.2) | (632.3) | -0.1% | (4,188.8) | (4,278.3) | 2.1% | (704.8) | (679.2) | -17.5% | (1,316.4) | (1,517.6) | 21.1% | (1,272.1) | (1,429.4) | -8.4% | (7,482.0) | (7,904.5) | 1.8% |
| % of total | 47.5% | 46.1% | 8.5% | 8.0% | 56.0% | 54.1% | 9.4% | 8.6% | 17.6% | 19.2% | 17.0% | 18.1% | 100.0% | 100.0% | |||||||
| Other operating income/(expenses) | 270.2 | 248.0 | -8.2% | 143.2 | 55.3 | -61.4% | 413.4 | 303.4 | -26.6% | 56.2 | (13.1) | -120.4% | (27.3) | (25.6) | 21.6% | (20.3) | (28.5) | 16.8% | 422.0 | 236.2 | -44.3% |
| % of total | 64.0% | 105.0% | 33.9% | 23.4% | 98.0% | 128.4% | 13.3% | -5.5% | -6.5% | -10.8% | -4.8% | -12.1% | 100.0% | 100.0% | |||||||
| Normalized EBIT | 3,439.4 | 2,210.3 | -35.7% | 608.8 | 263.3 | -56.8% | 4,048.2 | 2,473.5 | -38.9% | 1,135.1 | 781.3 | -39.9% | 1,626.8 | 906.4 | -41.9% | 846.1 | 943.3 | -8.2% | 7,656.2 | 5,104.5 | -36.3% |
| % of total | 44.9% | 43.3% | 8.0% | 5.2% | 52.9% | 48.5% | 14.8% | 15.3% | 21.2% | 17.8% | 11.1% | 18.5% | 100.0% | 100.0% | |||||||
| Normalized EBITDA | 4,561.9 | 3,464.8 | -24.1% | 773.1 | 440.7 | -43.0% | 5,335.0 | 3,905.5 | -26.8% | 1,389.2 | 1,076.4 | -32.6% | 2,113.0 | 1,445.7 | -28.6% | 974.7 | 1,153.2 | -2.4% | 9,811.9 | 7,580.8 | -25.6% |
| % of total | 46.5% | 45.7% | 7.9% | 5.8% | 54.4% | 51.5% | 14.2% | 14.2% | 21.5% | 19.1% | 9.9% | 15.2% | 100.0% | 100.0% | |||||||
| % of net revenue | |||||||||||||||||||||
| Net revenue | 100.0% | 100.0% | 100.0% | 100.0% | 100.0% | 100.0% | 100.0% | 100.0% | 100.0% | 100.0% | 100.0% | 100.0% | 100.0% | 100.0% | |||||||
| COGS | -41.2% | -47.0% | -46.7% | -53.2% | -42.0% | -47.9% | -43.3% | -47.6% | -38.2% | -50.9% | -35.9% | -40.6% | -40.6% | -47.3% | |||||||
| Gross profit | 58.8% | 53.0% | 53.3% | 46.8% | 58.0% | 52.1% | 56.7% | 52.4% | 61.8% | 49.1% | 64.1% | 59.4% | 59.4% | 52.7% | |||||||
| SG&A | -31.1% | -34.5% | -30.7% | -35.2% | -31.0% | -34.6% | -22.4% | -24.2% | -27.4% | -30.4% | -38.1% | -35.4% | -30.2% | -32.6% | |||||||
| Other operating income/(expenses) | 2.4% | 2.3% | 6.9% | 3.1% | 3.1% | 2.5% | 1.8% | -0.5% | -0.6% | -0.5% | -0.6% | -0.7% | 1.7% | 1.0% | |||||||
| Normalized EBIT | 30.1% | 20.9% | 29.5% | 14.7% | 30.0% | 20.0% | 36.1% | 27.8% | 33.8% | 18.2% | 25.4% | 23.3% | 30.9% | 21.1% | |||||||
| Normalized EBITDA | 39.9% | 32.7% | 37.5% | 24.5% | 39.5% | 31.5% | 44.1% | 38.3% | 43.9% | 29.0% | 29.2% | 28.5% | 39.6% | 31.3% | |||||||
| Per hectoliter - (R$/hl) | |||||||||||||||||||||
| Net revenue | 291.2 | 289.7 | -0.5% | 166.0 | 155.1 | -6.5% | 261.1 | 257.3 | -1.5% | 475.2 | 581.2 | 5.6% | 316.0 | 338.6 | 11.9% | 718.2 | 840.9 | -2.5% | 317.1 | 334.1 | 1.6% |
| COGS | (119.9) | (136.2) | 13.6% | (77.5) | (82.6) | 6.6% | (109.7) | (123.3) | 12.4% | (205.9) | (276.6) | 15.6% | (120.9) | (172.2) | 47.9% | (257.9) | (341.4) | 9.6% | (128.8) | (157.9) | 18.5% |
| Gross profit | 171.3 | 153.5 | -10.4% | 88.5 | 72.6 | -18.0% | 151.4 | 134.0 | -11.5% | 269.3 | 304.6 | -2.1% | 195.1 | 166.4 | -10.4% | 460.3 | 499.5 | -9.2% | 188.3 | 176.2 | -10.0% |
| SG&A | (90.6) | (99.8) | 10.2% | (51.0) | (54.6) | 7.1% | (81.1) | (88.9) | 9.7% | (106.4) | (140.4) | 13.0% | (86.5) | (103.1) | 25.3% | (273.8) | (297.3) | -9.6% | (95.7) | (109.1) | 10.0% |
| Other operating income/(expenses) | 6.9 | 6.8 | -1.4% | 11.5 | 4.8 | -58.6% | 8.0 | 6.3 | -21.2% | 8.5 | (2.7) | -127.9% | (1.8) | (1.7) | 25.8% | (4.4) | (5.9) | 14.8% | 5.4 | 3.3 | -39.8% |
| Normalized EBIT | 87.6 | 60.5 | -31.0% | 49.0 | 22.7 | -53.6% | 78.4 | 51.4 | -34.4% | 171.3 | 161.5 | -17.6% | 106.9 | 61.6 | -39.9% | 182.1 | 196.2 | -9.3% | 98.0 | 70.4 | -31.2% |
| Normalized EBITDA | 116.2 | 94.8 | -18.4% | 62.2 | 38.1 | -38.9% | 103.3 | 81.2 | -21.4% | 209.7 | 222.5 | -7.6% | 138.8 | 98.2 | -26.1% | 209.8 | 239.9 | -3.7% | 125.5 | 104.6 | -19.6% |
AMBEV REPORTS 2020 SECOND QUARTER RESULTS UNDER IFRS |
| | Second Quarter 2020 Results July 30, 2020 Page | 28 |
| CONSOLIDATED BALANCE SHEET | ||
| R$ million | December 31, 2019 | June 30, 2020 |
| Assets | ||
| Current assets | ||
| Cash and cash equivalents | 11,900.7 | 17,439.0 |
| Investment securities | 14.6 | 44.8 |
| Derivative financial instruments | 172.1 | 444.8 |
| Trade receivables | 4,495.5 | 4,201.6 |
| Inventories | 5,978.6 | 7,771.6 |
| Income tax and social contributions receivable | 1,831.4 | 3,240.3 |
| Other taxes receivable | 2,242.7 | 2,150.1 |
| Other assets | 985.6 | 976.0 |
| Assets held for sale | ||
| 27,621.1 | 36,268.1 | |
| Non-current assets | ||
| Investment securities | 163.6 | 200.2 |
| Derivative financial instruments | 1.2 | 0.0 |
| Income tax and social contributions receivable | 4,331.9 | 3,080.5 |
| Deferred tax assets | 2,950.1 | 5,304.1 |
| Other taxes receivable | 671.1 | 806.6 |
| Other assets | 1,751.7 | 1,863.6 |
| Employee benefits | 56.2 | 74.9 |
| Investments in joint ventures | 303.4 | 335.8 |
| Property, plant and equipment | 22,576.3 | 25,111.7 |
| Intangible | 6,306.4 | 7,912.0 |
| Goodwill | 35,009.9 | 40,435.4 |
| 74,121.8 | 85,124.9 | |
| Total assets | 101,742.9 | 121,393.0 |
| Equity and liabilities | ||
| Current liabilities | ||
| Trade payables | 15,069.6 | 14,839.5 |
| Derivative financial instruments | 355.3 | 570.3 |
| Interest-bearing loans and borrowings | 653.1 | 4,118.7 |
| Bank overdrafts | 0.0 | 690.8 |
| Payroll and social security payables | 833.0 | 1,178.1 |
| Dividends and interest on shareholder´s equity payable | 956.6 | 1,308.4 |
| Income tax and social contribution payable | 1,394.2 | 1,542.2 |
| Taxes and contributions payable | 4,108.5 | 3,066.0 |
| Other liabilities | 1,530.7 | 1,804.6 |
| Provisions | 110.0 | 120.3 |
| 25,011.0 | 29,239.0 | |
| Non-current liabilities | ||
| Trade payables | 309.6 | 259.3 |
| Derivative financial instruments | 0.1 | 0.6 |
| Interest-bearing loans and borrowings | 2,409.7 | 2,664.1 |
| Deferred tax liabilities | 2,371.1 | 2,985.4 |
| Income tax and social contribution payable | 2,219.6 | 2,233.0 |
| Taxes and contributions payable | 645.2 | 691.2 |
| Put option granted on subsidiary and other liabilities | 3,145.4 | 4,124.3 |
| Provisions | 371.0 | 363.2 |
| Employee benefits | 2,704.5 | 3,300.5 |
| 14,175.9 | 16,621.7 | |
| Total liabilities | 39,186.9 | 45,860.7 |
| Equity | ||
| Issued capital | 57,866.8 | 57,899.1 |
| Reserves | 75,685.7 | 75,751.4 |
| Comprehensive income | (72,274.5) | (62,652.3) |
| Retained earnings | 2,924.7 | |
| Equity attributable to equity holders of Ambev | 61,278.0 | 73,922.8 |
| Non-controlling interests | 1,278.0 | 1,609.5 |
| Total Equity | 62,556.0 | 75,532.3 |
| Total equity and liabilities | 101,742.9 | 121,393.0 |
AMBEV REPORTS 2020 SECOND QUARTER RESULTS UNDER IFRS |
| | Second Quarter 2020 Results July 30, 2020 Page | 29 |
| CONSOLIDATED INCOME STATEMENT | 2Q19 | 2Q20 | YTD19 | YTD20 |
| R$ million | ||||
| Net revenue | 12,145.1 | 11,615.3 | 24,785.3 | 24,217.9 |
| Cost of goods sold | (4,961.3) | (5,801.9) | (10,069.0) | (11,445.1) |
| Gross profit | 7,183.8 | 5,813.5 | 14,716.3 | 12,772.9 |
| Distribution expenses | (1,650.2) | (1,843.1) | (3,276.9) | (3,694.4) |
| Sales and marketing expenses | (1,435.0) | (1,307.1) | (2,836.2) | (2,862.7) |
| Administrative expenses | (707.4) | (682.0) | (1,368.9) | (1,347.4) |
| Other operating income/(expenses) | 190.8 | 64.9 | 422.0 | 236.2 |
| Normalized EBIT | 3,582.1 | 2,046.1 | 7,656.2 | 5,104.5 |
| Exceptional items | (33.9) | (127.9) | (52.3) | (152.0) |
| Income from operations (EBIT) | 3,548.2 | 1,918.1 | 7,603.9 | 4,952.5 |
| Net finance results | (567.4) | (793.7) | (1,239.5) | (2,330.6) |
| Share of results of joint ventures | (0.7) | (16.2) | (2.9) | (22.9) |
| Profit before income tax | 2,980.0 | 1,108.2 | 6,361.5 | 2,599.1 |
| Income tax expense | (364.1) | 163.1 | (996.6) | (116.5) |
| Profit | 2,615.9 | 1,271.3 | 5,365.0 | 2,482.6 |
| Equity holders of Ambev | 2,520.7 | 1,226.8 | 5,182.6 | 2,318.6 |
| Non-controlling interest | 95.2 | 44.5 | 182.4 | 164.0 |
| Basic earnings per share (R$) | 0.16 | 0.08 | 0.33 | 0.15 |
| Diluted earnings per share (R$) | 0.16 | 0.08 | 0.33 | 0.15 |
| Normalized Profit | 2,712.1 | 1,372.6 | 5,474.5 | 2,600.4 |
| Normalized basic earnings per share (R$) | 0.17 | 0.08 | 0.34 | 0.15 |
| Normalized diluted earnings per share (R$) | 0.16 | 0.08 | 0.33 | 0.15 |
| Nº of basic shares outstanding (million of shares) | 15,727.0 | 15,733.1 | 15,725.1 | 15,732.3 |
| Nº of diluted shares outstanding (million if shares) | 15,863.1 | 15,872.0 | 15,861.3 | 15,871.2 |
AMBEV REPORTS 2020 SECOND QUARTER RESULTS UNDER IFRS |
| | Second Quarter 2020 Results July 30, 2020 Page | 30 |
| CONSOLIDATED STATEMENT OF CASH FLOWS | 2Q19 | 2Q20 | YTD19 | YTD20 |
| R$ million | ||||
| Profit | 2,615.9 | 1,271.3 | 5,365.0 | 2,482.6 |
| Depreciation, amortization and impairment | 1,109.2 | 1,302.2 | 2,155.7 | 2,476.2 |
| Impairment losses on receivables and inventories | 12.7 | 137.2 | 57.9 | 190.8 |
| Additions/(reversals) in provisions and employee benefits | 67.7 | 88.9 | 82.5 | 108.3 |
| Net finance cost | 567.4 | 793.7 | 1,239.5 | 2,330.6 |
| Loss/(gain) on sale of property, plant and equipment and intangible assets | (22.0) | 2.9 | (33.8) | (24.4) |
| Equity-settled share-based payment expense | 73.4 | 52.2 | 118.8 | 104.0 |
| Income tax expense | 364.1 | (163.1) | 996.6 | 116.5 |
| Share of result of joint ventures | 0.7 | 16.2 | 2.9 | 22.9 |
| Other non-cash items included in the profit | (224.1) | (379.4) | (662.9) | (726.2) |
| Cash flow from operating activities before changes in working capital and provisions | 4,565.1 | 3,122.2 | 9,322.1 | 7,081.2 |
| (Increase)/decrease in trade and other receivables | (206.2) | (1,302.0) | 481.0 | 1,363.8 |
| (Increase)/decrease in inventories | (166.1) | 10.0 | (832.1) | (1,132.7) |
| Increase/(decrease) in trade and other payables | (773.1) | 360.5 | (1,996.0) | (2,157.8) |
| Cash generated from operations | 3,419.6 | 2,190.7 | 6,974.9 | 5,154.5 |
| Interest paid | (121.5) | (82.6) | (194.7) | (215.6) |
| Interest received | 116.8 | 137.9 | 249.8 | 271.7 |
| Dividends received | 1.5 | 3.6 | 1.7 | 4.5 |
| Income tax and social contributions paid | (302.2) | (410.8) | (1,837.5) | (1,832.4) |
| Cash flow from operating activities | 3,114.1 | 1,838.8 | 5,194.2 | 3,382.8 |
| Proceeds from sale of property, plant, equipment and intangible assets | 20.9 | 16.8 | 40.7 | 47.1 |
| Proceeds from sale of operations in subsidiaries | 0.6 | 202.9 | ||
| Acquisition of property, plant, equipment and intangible assets | (895.8) | (807.1) | (1,441.8) | (2,153.5) |
| Acquisition of subsidiaries, net of cash acquired | (30.3) | (20.7) | (74.8) | (300.0) |
| Acquisition of other investments | (4.3) | (4.3) | ||
| (Investments)/net proceeds of debt securities | 10.2 | 0.3 | (4.4) | (74.9) |
| Net proceeds/(acquisition) of other assets | ||||
| Cash flow used in investing activities | (894.4) | (814.9) | (1,277.5) | (2,485.6) |
| Capital increase | 1.2 | 3.7 | ||
| Capital increase in non-controling | 0.7 | |||
| Proceeds/(repurchase) of shares | (1.4) | (1.5) | (2.8) | (6.0) |
| Acquisition of non-controlling interests | (0.3) | (0.4) | ||
| Proceeds from borrowings | 69.6 | 3,374.0 | 871.2 | 3,460.5 |
| Repayment of borrowings | (101.8) | (56.9) | (194.2) | (103.8) |
| Cash net finance costs other than interests | (130.2) | (1,191.3) | (1,016.9) | (1,199.5) |
| Payment of lease liabilities | (103.8) | (133.4) | (258.3) | (262.1) |
| Dividends and interest on shareholders’ equity paid | (10.4) | (4.7) | (63.4) | (51.3) |
| Cash flow used in financing activities | (277.2) | 1,986.1 | (661.1) | 1,838.5 |
| Net increase/(decrease) in Cash and cash equivalents | 1,942.5 | 3,009.9 | 3,255.7 | 2,735.7 |
| Cash and cash equivalents less bank overdrafts at beginning of period | 12,822.5 | 13,204.5 | 11,463.5 | 11,900.6 |
| Effect of exchange rate fluctuations | (569.5) | 533.8 | (523.6) | 2,111.9 |
| Cash and cash equivalents less bank overdrafts at end of period | 14,195.5 | 16,748.2 | 14,195.5 | 16,748.2 |
AMBEV REPORTS 2020 SECOND QUARTER RESULTS UNDER IFRS |
SIGNATURE
Pursuant to the requirements of the Securities Exchange Act of 1934, the registrant has duly caused this report to be signed on its behalf by the undersigned, thereunto duly authorized.
Date: July 30, 2020
| AMBEV S.A. | ||
| By: | /s/ Lucas Machado Lira | |
Lucas Machado Lira Chief Financial and Investor Relations Officer | ||