“The Next Chapter of the Energy Renaissance” 2014 Deloitte Oil & Gas Conference Thomas D. O’Malley Executive Chairman, PBF Energy November 18, 2014
Energy Policy and Conservation Act of 1975 An Act to increase domestic energy supplies and availability 2
Energy Security and Independence Act of 2007 An Act to move the United States toward greater energy independence and security 3
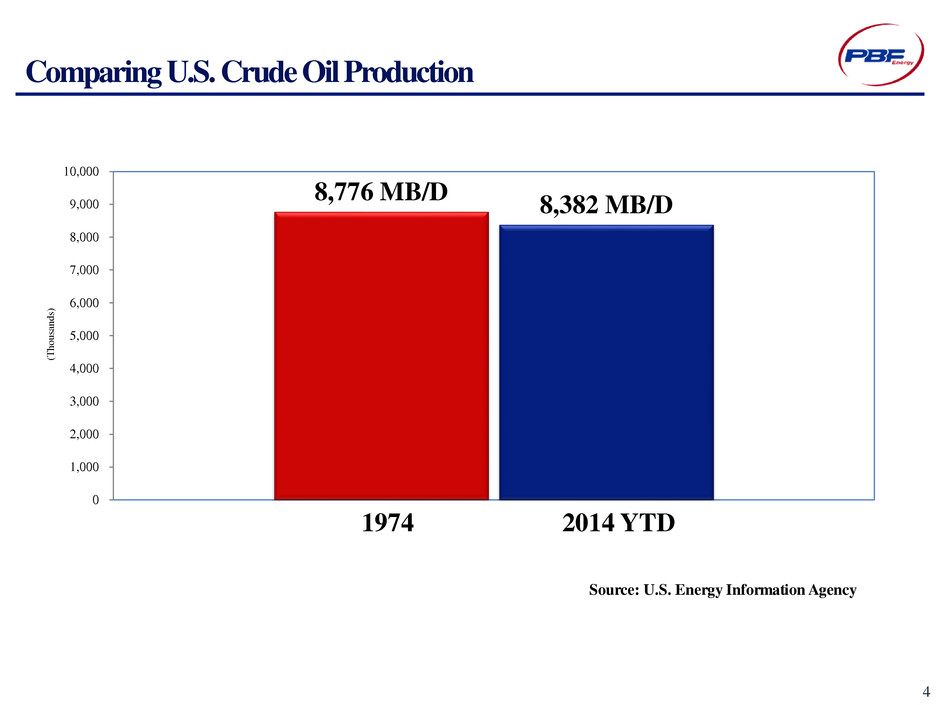
Comparing U.S. Crude Oil Production Source: U.S. Energy Information Agency 8,776 MB/D 8,382 MB/D 0 1,000 2,000 3,000 4,000 5,000 6,000 7,000 8,000 9,000 10,000 2014 YTD 1974 4 (T h o u sa n d s)
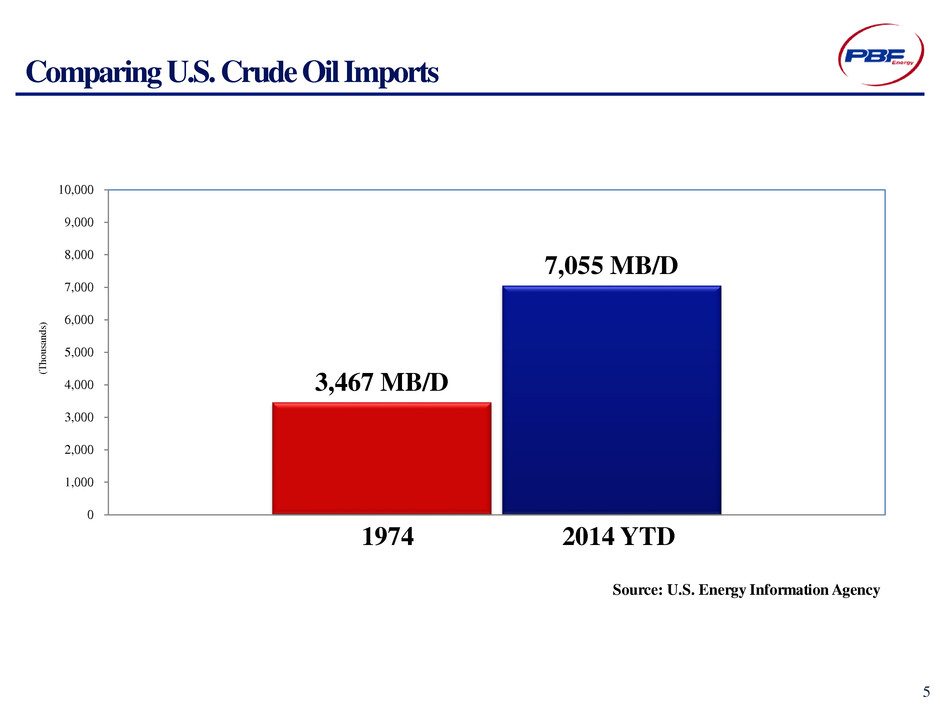
Comparing U.S. Crude Oil Imports 3,467 MB/D 7,055 MB/D 0 1,000 2,000 3,000 4,000 5,000 6,000 7,000 8,000 9,000 10,000 Source: U.S. Energy Information Agency 2014 YTD 1974 5 (T h o u sa n d s)
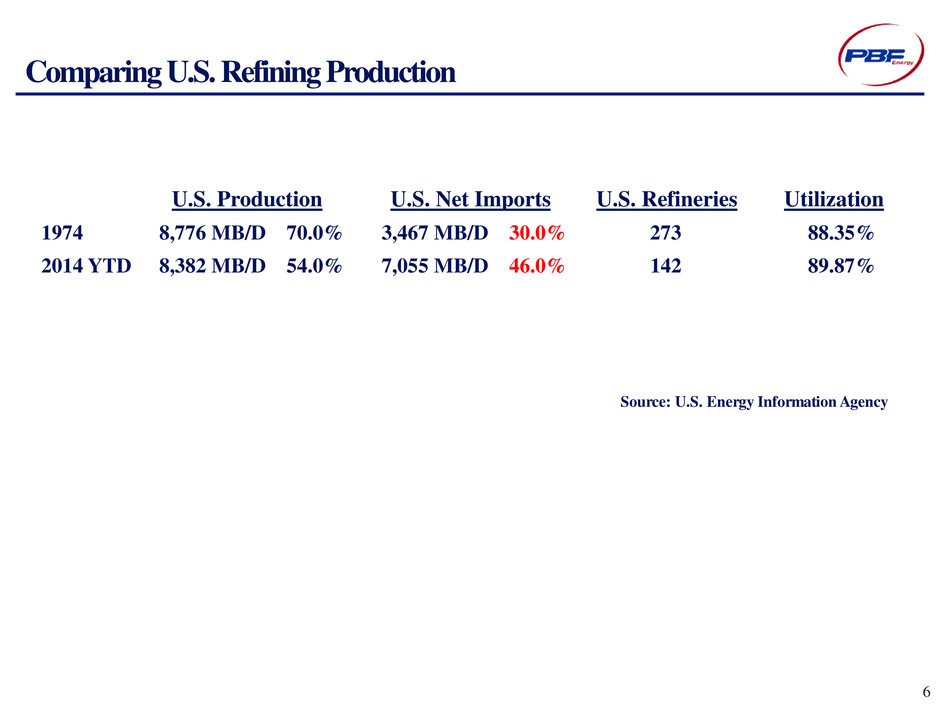
Comparing U.S. Refining Production U.S. Production U.S. Net Imports U.S. Refineries Utilization 1974 8,776 MB/D 70.0% 3,467 MB/D 30.0% 273 88.35% 2014 YTD 8,382 MB/D 54.0% 7,055 MB/D 46.0% 142 89.87% Source: U.S. Energy Information Agency 6
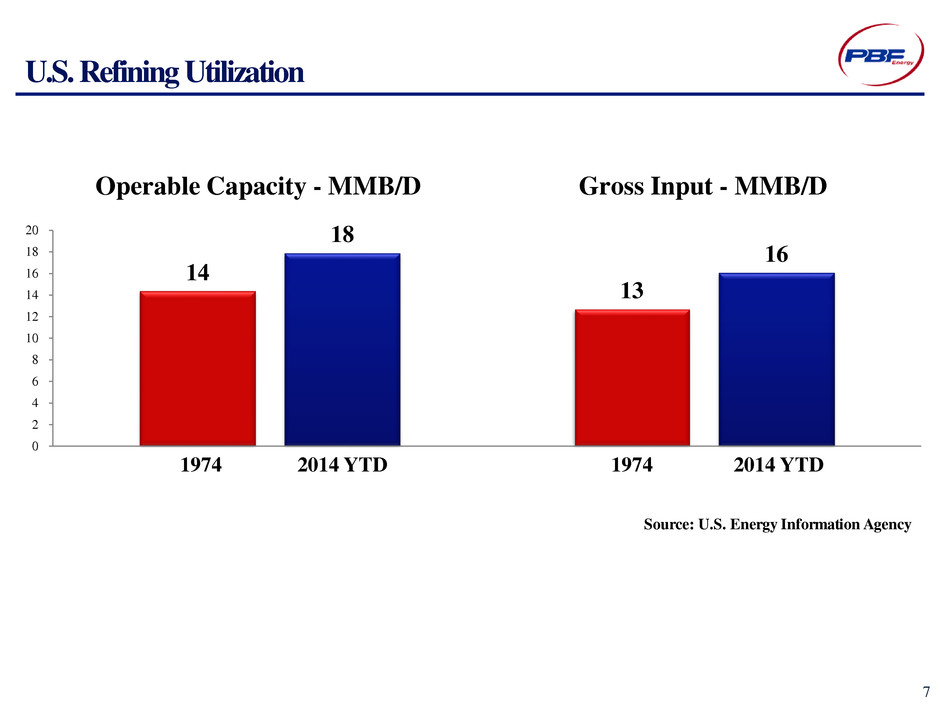
14 13 18 16 0 2 4 6 8 10 12 14 16 18 20 T h o u s a n d s Operable Capacity - MMB/D Gross Input - MMB/D U.S. Refining Utilization Source: U.S. Energy Information Agency 2014 YTD 2014 YTD 1974 1974 7
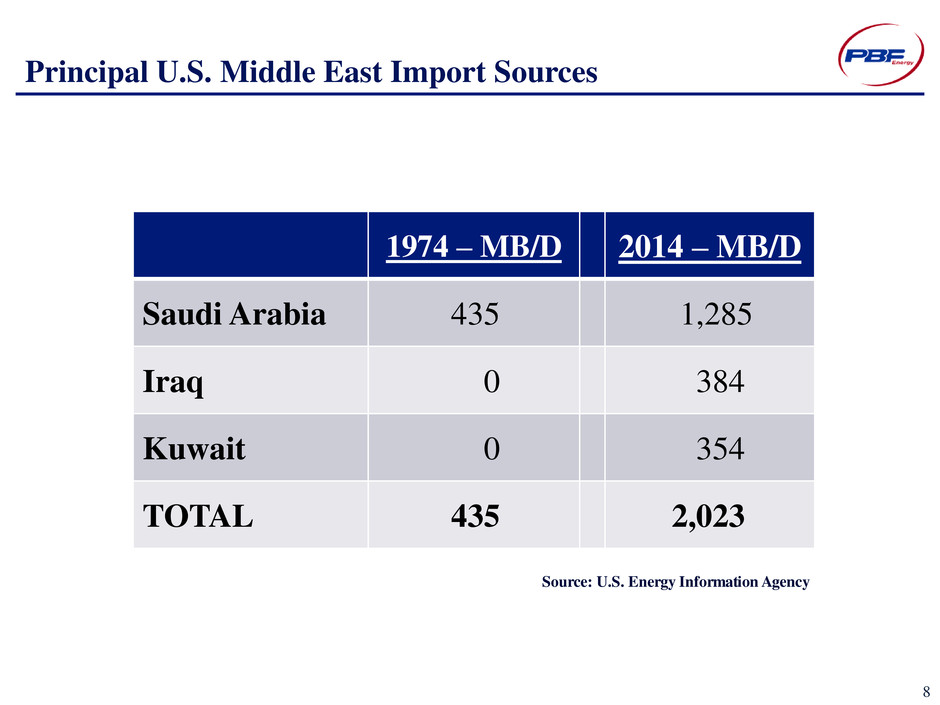
Principal U.S. Middle East Import Sources 1974 – MB/D 2014 – MB/D Saudi Arabia 435 1,285 Iraq 0 384 Kuwait 0 354 TOTAL 435 2,023 8 Source: U.S. Energy Information Agency
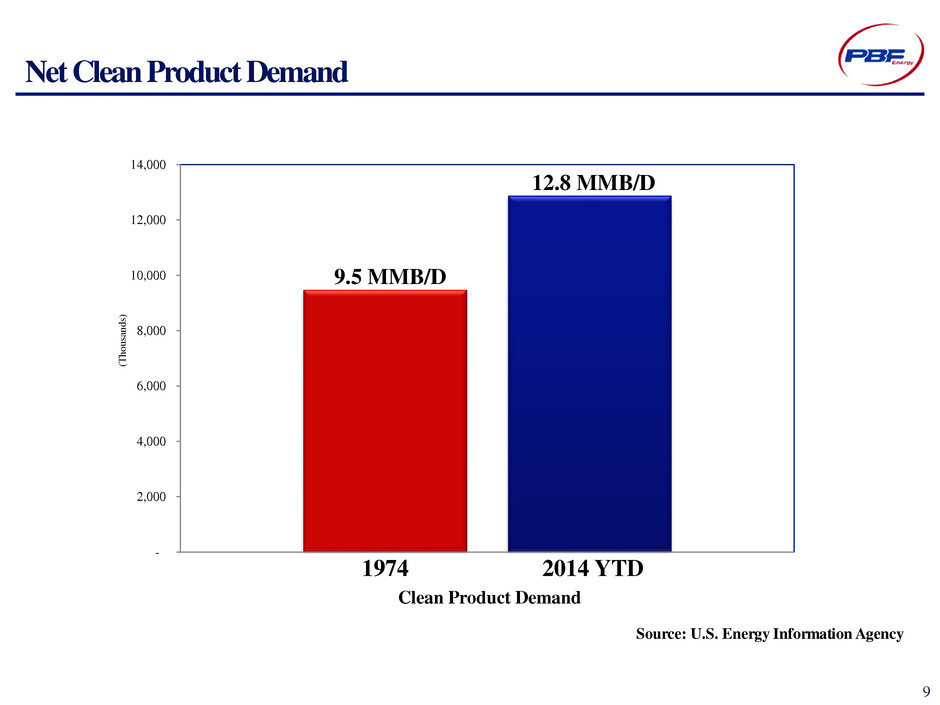
Net Clean Product Demand Clean Product Demand 1974 2014 YTD 9.5 MMB/D 12.8 MMB/D - 2,000 4,000 6,000 8,000 10,000 12,000 14,000 9 (T h o u sa n d s) Source: U.S. Energy Information Agency
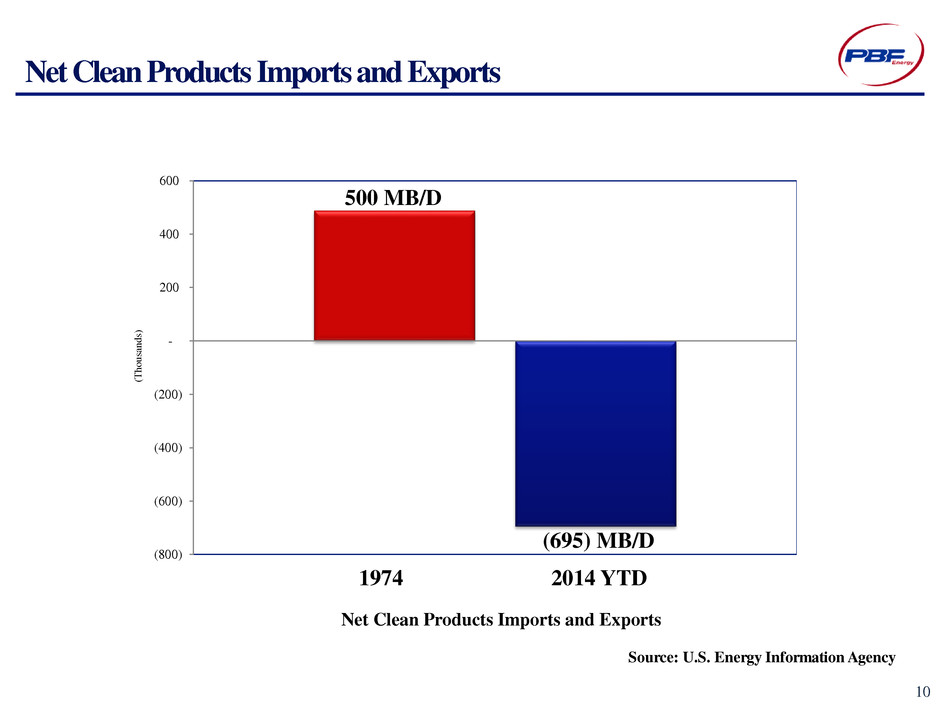
Net Clean Products Imports and Exports Net Clean Products Imports and Exports 500 MB/D (695) MB/D (800) (600) (400) (200) - 200 400 600 1974 2014 YTD 10 (T h o u sa n d s) Source: U.S. Energy Information Agency
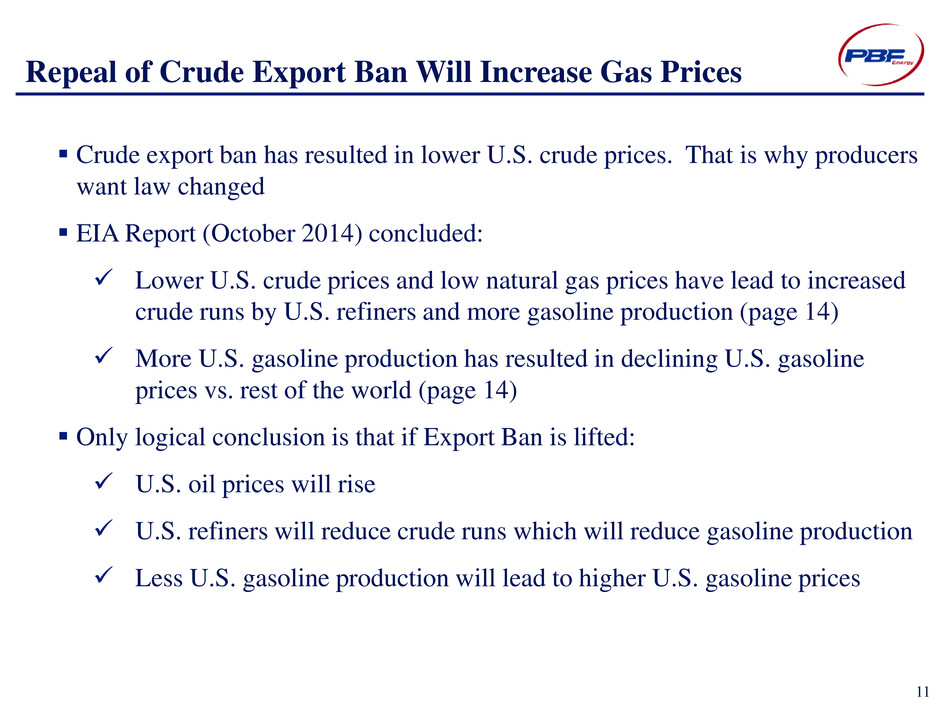
Repeal of Crude Export Ban Will Increase Gas Prices Crude export ban has resulted in lower U.S. crude prices. That is why producers want law changed EIA Report (October 2014) concluded: Lower U.S. crude prices and low natural gas prices have lead to increased crude runs by U.S. refiners and more gasoline production (page 14) More U.S. gasoline production has resulted in declining U.S. gasoline prices vs. rest of the world (page 14) Only logical conclusion is that if Export Ban is lifted: U.S. oil prices will rise U.S. refiners will reduce crude runs which will reduce gasoline production Less U.S. gasoline production will lead to higher U.S. gasoline prices 11
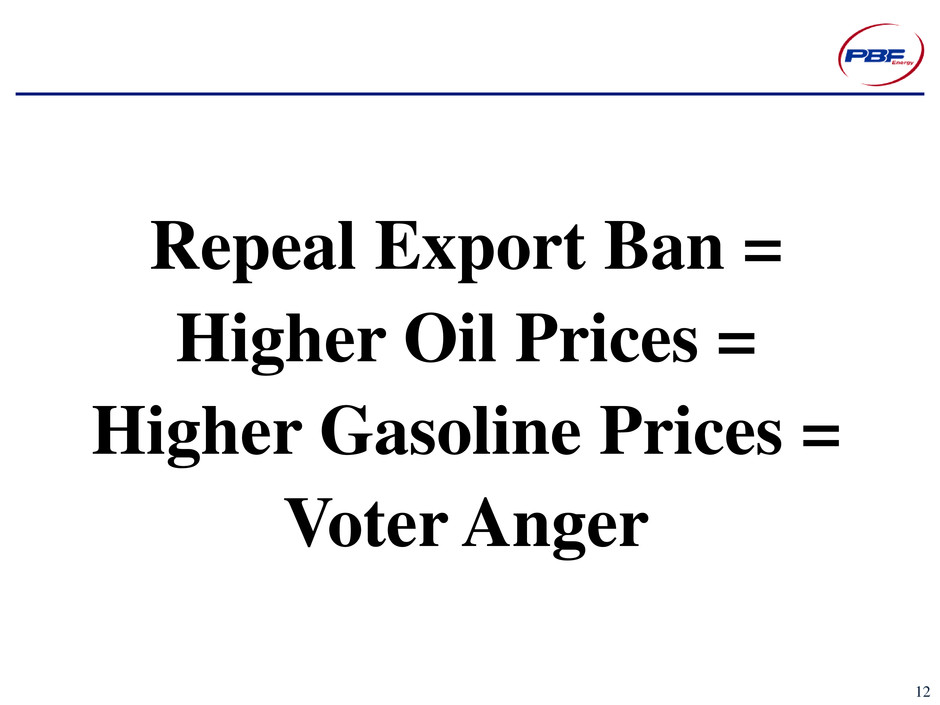
Repeal Export Ban = Higher Oil Prices = Higher Gasoline Prices = Voter Anger 12

“There is nothing more uncommon than common sense” - Frank Lloyd Wright 13


