Free Writing Prospectus Filed Pursuant to Rule 433
File No. 333-177891-03

Free Writing Prospectus
Structural and Collateral Term Sheet
$1,436,326,346
(Approximate Aggregate Cut-off Date Balance of Mortgage Pool)
$1,292,693,000
(Approximate Aggregate Principal Balance of Offered Certificates)
WFRBS Commercial Mortgage Trust 2013-C11
as Issuing Entity
RBS Commercial Funding Inc.
as Depositor
Wells Fargo Bank, National Association
The Royal Bank of Scotland
C-III Commercial Mortgage LLC
Liberty Island Group I LLC
Basis Real Estate Capital II, LLC
as Sponsors and Mortgage Loan Sellers
Commercial Mortgage Pass-Through Certificates
Series 2013-C11
January 18, 2013
RBS
| WELLS FARGO SECURITIES
| |
Co-Lead Manager and
Co-Bookrunner | Co-Lead Manager and
Co-Bookrunner |
Citigroup
Co-Manager
STATEMENT REGARDING THIS FREE WRITING PROSPECTUS
The depositor has filed a registration statement (including a prospectus) with the Securities and Exchange Commission (‘‘SEC’’) (SEC File No. 333-177891) for the offering to which this communication relates. Before you invest, you should read the prospectus in the registration statement and other documents the depositor has filed with the SEC for more complete information about the depositor, the issuing entity and this offering. You may get these documents for free by visiting EDGAR on the SEC Web site at www.sec.gov. Alternatively, the depositor, any underwriter, or any dealer participating in the offering will arrange to send you the prospectus after filing if you request it by calling toll free 1-866-884-2071 (8 a.m. – 5 p.m. EST) or by emailing rbscmbs@rbs.com.
Nothing in this document constitutes an offer to sell or a solicitation to buy securities in any jurisdiction where such offer, solicitation or sale is not permitted. The information contained herein is preliminary as of the date hereof, supersedes any such information previously delivered to you and will be superseded by any information subsequently delivered and ultimately by the final prospectus relating to the securities. These materials are subject to change, completion, supplement or amendment from time to time.
STATEMENT REGARDING ASSUMPTIONS AS TO SECURITIES, PRICING ESTIMATES AND OTHER INFORMATION
The attached information contains certain tables and other statistical analyses (the “Computational Materials”) which have been prepared in reliance upon information furnished by the Mortgage Loan Sellers. Numerous assumptions were used in preparing the Computational Materials, which may or may not be reflected herein. As such, no assurance can be given as to the Computational Materials’ accuracy, appropriateness or completeness in any particular context; or as to whether the Computational Materials and/or the assumptions upon which they are based reflect present market conditions or future market performance. The Computational Materials should not be construed as either projections or predictions or as legal, tax, financial or accounting advice. You should consult your own counsel, accountant and other advisors as to the legal, tax, business, financial and related aspects of a purchase of these securities. Any weighted average lives, yields and principal payment periods shown in the Computational Materials are based on prepayment and/or loss assumptions, and changes in such prepayment and/or loss assumptions may dramatically affect such weighted average lives, yields and principal payment periods. In addition, it is possible that prepayments or losses on the underlying assets will occur at rates higher or lower than the rates shown in the attached Computational Materials. The specific characteristics of the securities may differ from those shown in the Computational Materials due to differences between the final underlying assets and the preliminary underlying assets used in preparing the Computational Materials. The principal amount and designation of any security described in the Computational Materials are subject to change prior to issuance. None of RBS Securities Inc. (“RBSSI”), Wells Fargo Securities, LLC (“WFS”), Citigroup Global Markets Inc. or any of their respective affiliates make any representation or warranty as to the actual rate or timing of payments or losses on any of the underlying assets or the payments or yield on the securities. The information in this presentation is based upon management forecasts and reflects prevailing conditions and management’s views as of this date, all of which are subject to change. In preparing this presentation, we have relied upon and assumed, without independent verification, the accuracy and completeness of all information available from public sources or which was provided to us by or on behalf of the Mortgage Loan Sellers or which was otherwise reviewed by us.
This free writing prospectus contains certain forward-looking statements. If and when included in this free writing prospectus, the words “expects”, “intends”, “anticipates”, “estimates” and analogous expressions and all statements that are not historical facts, including statements about our beliefs or expectations, are intended to identify forward-looking statements. Any forward-looking statements are made subject to risks and uncertainties which could cause actual results to differ materially from those stated. Those risks and uncertainties include, among other things, declines in general economic and business conditions, increased competition, changes in demographics, changes in political and social conditions, regulatory initiatives and changes in customer preferences, many of which are beyond our control and the control of any other person or entity related to this offering. The forward-looking statements made in this free writing prospectus are made as of the date stated on the cover. We have no obligation to update or revise any forward-looking statement.
RBS is a trade name for the investment banking business of RBSSI. Securities, syndicated loan arranging, financial advisory and other investment banking activities are performed by RBSSI and their securities affiliates. Lending, derivatives and other commercial banking activities are performed by The Royal Bank of Scotland plc and their banking affiliates. RBSSI is a member of SIPC, FINRA and the NYSE.
Wells Fargo Securities is the trade name for certain capital markets and investment banking services of Wells Fargo & Company and its subsidiaries, including WFS, a member of FINRA and SIPC, and Wells Fargo Bank, National Association.
IRS CIRCULAR 230 NOTICE
THIS TERM SHEET IS NOT INTENDED OR WRITTEN TO BE USED, AND CANNOT BE USED, FOR THE PURPOSE OF AVOIDING U.S. FEDERAL, STATE OR LOCAL TAX PENALTIES. THIS TERM SHEET IS WRITTEN AND PROVIDED BY THE DEPOSITOR IN CONNECTION WITH THE PROMOTION OR MARKETING BY THE DEPOSITOR AND THE CO-LEAD BOOKRUNNING MANAGERS OF THE TRANSACTION OR MATTERS ADDRESSED HEREIN. INVESTORS SHOULD SEEK ADVICE BASED ON THEIR PARTICULAR CIRCUMSTANCES FROM AN INDEPENDENT TAX ADVISOR.
IMPORTANT NOTICE REGARDING THE OFFERED CERTIFICATES
The offered certificates referred to in these materials and the asset pool backing them are subject to modification or revision (including the possibility that one or more classes of certificates may be split, combined or eliminated at any time prior to issuance or availability of a final prospectus) and are offered on a “when, as and if issued” basis. Prospective investors should understand that, when considering the purchase of the offered certificates, a contract of sale will come into being no sooner than the date on which the relevant class of certificates has been priced and the underwriters have confirmed the allocation of certificates to be made to investors; any “indications of interest” expressed by any prospective investor, and any “soft circles” generated by the underwriters, will not create binding contractual obligations for such prospective investors, on the one hand, or the underwriters, the depositor or any of their respective agents or affiliates, on the other hand.
As a result of the foregoing, a prospective investor may commit to purchase certificates that have characteristics that may change, and each prospective investor is advised that all or a portion of the certificates referred to in these materials may be issued that differ from the characteristics described in these materials. The underwriters’ obligation to sell certificates to any prospective investor is conditioned on the certificates and the transaction having the characteristics described in these materials. If the underwriters determine that a condition is not satisfied in any material respect, such prospective investor will be notified, and neither the depositor nor the underwriters will have any obligation to such prospective investor to deliver any portion of the offered certificates which such prospective investor has committed to purchase, and there will be no liability between the underwriters, the depositor or any of their respective agents or affiliates, on the one hand, and such prospective investor, on the other hand, as a consequence of the non-delivery.
Each prospective investor has requested that the underwriters provide to such prospective investor information in connection with such prospective investor’s consideration of the purchase of the certificates described in these materials. These materials are being provided to each prospective investor for informative purposes only in response to such prospective investor’s specific request. The underwriters described in these materials may from time to time perform investment banking services for, or solicit investment banking business from, any company named in these materials. The underwriters and/or their affiliates or respective employees may from time to time have a long or short position in any security or contract discussed in these materials.
The information contained herein supersedes any previous such information delivered to any prospective investor and will be superseded by information delivered to such prospective investor prior to the time of sale.
IMPORTANT NOTICE RELATING TO AUTOMATICALLY-GENERATED EMAIL DISCLAIMERS
Any legends, disclaimers or other notices that may appear at the bottom of, or attached to, any email communication to which this free writing prospectus is attached relating to (1) these materials not constituting an offer (or a solicitation of an offer), (2) no representation that these materials are accurate or complete and may not be updated or (3) these materials possibly being confidential, are not applicable to these materials and should be disregarded. Such legends, disclaimers or other notices have been automatically generated as a result of these materials having been sent via Bloomberg or another system.
THE INFORMATION IN THIS STRUCTURAL AND COLLATERAL TERM SHEET IS NOT COMPLETE AND MAY BE AMENDED PRIOR TO THE TIME OF SALE. THIS TERM SHEET IS NOT AN OFFER TO SELL THESE SECURITIES AND IT IS NOT A SOLICITATION OF AN OFFER TO BUY THESE SECURITIES IN ANY JURISDICTION WHERE THE OFFER OR SALE IS NOT PERMITTED.
2
| WFRBS Commercial Mortgage Trust 2013-C11 | Issue Characteristics |
| I. | Certificate Structure |
| Class | Expected Ratings (Fitch/KBRA/S&P)(1) | Approximate Initial Certificate Balance or Notional Amount(2) | Approx. Initial Credit Support(3) | Pass- Through Rate Description | Weighted Average Life (Years)(4) | Expected Principal Window(4) | Certificate Principal to Value Ratio(5) | Certificate Principal U/W NOI Debt Yield(6) | ||||||||||
Offered Certificates | ||||||||||||||||||
| A-1 | AAA(sf)/AAA(sf)/AAA(sf) | $65,123,000 | 30.000% | (7) | 2.75 | 03/13 – 11/17 | 42.0% | 15.8% | ||||||||||
| A-2 | AAA(sf)/AAA(sf)/AAA(sf) | $278,494,000 | 30.000% | (7) | 4.88 | 11/17 – 02/18 | 42.0% | 15.8% | ||||||||||
| A-3 | AAA(sf)/AAA(sf)/AAA(sf) | $46,800,000 | 30.000% | (7) | 6.93 | 01/20 – 01/20 | 42.0% | 15.8% | ||||||||||
| A-4 | AAA(sf)/AAA(sf)/AAA(sf) | $517,757,000 | 30.000% | (7) | 9.84 | 11/22 – 01/23 | 42.0% | 15.8% | ||||||||||
| A-SB | AAA(sf)/AAA(sf)/AAA(sf) | $97,254,000 | 30.000% | (7) | 7.50 | 02/18 – 11/22 | 42.0% | 15.8% | ||||||||||
| A-S | AAA(sf)/AAA(sf)/AAA(sf) | $134,656,000 | 20.625% | (7) | 9.93 | 01/23 – 01/23 | 47.6% | 14.0% | ||||||||||
| B | AA-(sf)/AA-(sf)/AA-(sf) | $93,361,000 | 14.125% | (7) | 9.93 | 01/23 – 01/23 | 51.5% | 12.9% | ||||||||||
| C | A-(sf)/A-(sf)/A-(sf) | $59,248,000 | 10.000% | (7) | 9.93 | 01/23 – 01/23 | 54.0% | 12.3% | ||||||||||
Non-Offered Certificates | ||||||||||||||||||
| X-A | AAA(sf)/AAA(sf)/AAA(sf) | $1,140,084,000(8) | N/A | Variable(9) | N/A | N/A | N/A | N/A | ||||||||||
| X-B | A-(sf)/AAA(sf)/A-(sf) | $152,609,000(10) | N/A | Variable(11) | N/A | N/A | N/A | N/A | ||||||||||
| D | BBB-(sf)/BBB-(sf)/BBB-(sf) | $46,681,000 | 6.750% | (7) | 9.93 | 01/23 – 01/23 | 55.9% | 11.9% | ||||||||||
| E | BB(sf)/BB(sf)/BB(sf) | $32,317,000 | 4.500% | (7) | 9.93 | 01/23 – 01/23 | 57.3% | 11.6% | ||||||||||
| F | B(sf)/B(sf)/B(sf) | $25,136,000 | 2.750% | (7) | 9.97 | 01/23 – 02/23 | 58.3% | 11.4% | ||||||||||
| G | NR/NR/NR | $39,499,346 | 0.000% | (7) | 10.01 | 02/23 – 02/23 | 60.0% | 11.1% | ||||||||||
| Notes: | ||
| (1) | The expected ratings presented are those of Fitch, Inc. (“Fitch”), Kroll Bond Rating Agency, Inc. (“KBRA”) and Standard & Poor’s Ratings Services (“S&P”) which the depositor hired to rate the rated offered certificates. One or more other nationally recognized statistical ratings organizations that were not hired by the depositor may use information they receive pursuant to Rule 17g-5 under the Securities Exchange Act of 1934, as amended (the “Exchange Act”), to rate or provide market reports and/or published commentary related to the offered certificates. We cannot assure you as to what ratings a non-hired nationally recognized statistical ratings organization would assign or that its reports will not express differing, possibly negative, views of the mortgage loans and/or the offered certificates. See “Risk Factors—Risks Related to the Offered Certificates—Nationally Recognized Statistical Rating Organizations May Assign Different Ratings to the Certificates; Ratings of the Certificates Reflect Only the Views of the Applicable Rating Agencies as of the Dates Such Ratings Were Issued; Ratings May Affect ERISA Eligibility; Ratings May be Downgraded” in the free writing prospectus, dated January [], 2013 (the “Free Writing Prospectus”). | |
| (2) | The principal balances and notional amounts set forth in the table are approximate. The actual initial principal balances and notional amounts may be larger or smaller depending on the aggregate cut-off date principal balance of the mortgage loans definitively included in the pool of mortgage loans, which aggregate cut-off date principal balance may be as much as 5% larger or smaller than the amount presented in the Free Writing Prospectus. | |
| (3) | The approximate initial credit support with respect to the Class A-1, A-2, A-3, A-4 and A-SB Certificates represents the approximate credit enhancement for the Class A-1, A-2, A-3, A-4 and A-SB Certificates in the aggregate. | |
| (4) | Weighted Average Lives and Expected Principal Windows are calculated based on an assumed prepayment rate of 0% CPR and the “Structuring Assumptions” described on Annex D to the Free Writing Prospectus. | |
| (5) | The Certificate Principal to Value Ratio for each Class of Certificates (other than the Class A-1, A-2, A-3, A-4 and A-SB Certificates) is calculated by dividing the aggregate principal balance of such class of certificates and all classes of certificates senior to such class by the aggregate appraised value of $2,394,943,909 (calculated as described in the Free Writing Prospectus) of the mortgaged properties securing the mortgage loans (excluding, with respect to each of the Republic Plaza, Concord Mills and One South Wacker Drive loan combinations, apro rata portion of the related appraised value allocated to the relatedpari passucompanion loan based on its cut-off date principal balance). The Certificate Principal to Value Ratios for each of the Class A-1, A-2, A-3, A-4 and A-SB Certificates are calculated by dividing the aggregate principal balance of the Class A-1, A-2, A-3, A-4 and A-SB Certificates by such aggregate appraised value (excluding, with respect to each of the Republic Plaza, Concord Mills and One South Wacker Drive loan combinations, apro rata portion of the related appraised value allocated to the relatedpari passu companion loan based on its cut-off date principal balance). However, excess mortgaged property value associated with a mortgage loan will not be available to offset losses on any other mortgage loan (unless such mortgage loans are cross-collateralized and the cross-collateralization remains in effect). | |
| (6) | The Certificate Principal U/W NOI Debt Yield for each Class of Certificates (other than the Class A-1, A-2, A-3, A-4 and A-SB Certificates) is calculated by dividing the underwritten net operating income (which excludes, with respect to each of the Republic Plaza, Concord Mills and One South Wacker Drive loan combinations, a pro rata portion of the related underwritten net operating income allocated to the relatedpari passu companion loan based on its cut-off date principal balance) for the mortgage pool of $159,244,359 (calculated as described in the Free Writing Prospectus) by the aggregate certificate balance of such class of certificates and all classes of certificates senior to such class of certificates. The Underwritten NOI Debt Yield for each of the Class A-1, A-2, A-3, A-4 and A-SB Certificates is calculated by dividing such mortgage pool underwritten net operating income (which excludes, with respect to each of the Republic Plaza, Concord Mills and One South Wacker Drive loan combinations, apro rata portion of the related underwritten net operating income allocated to the relatedpari passu companion loan based on its cut-off date principal balance) by the aggregate principal balance of the Class A-1, A-2, A-3, A-4 and A-SB Certificates. However, cash flow from each mortgaged property supports only the related mortgage loan and will not be available to support any other mortgage loan (unless such mortgage loans are cross-collateralized and the cross-collateralization remains in effect). | |
| (7) | The pass-through rates for the Class A-1, A-2, A-3, A-4, A-SB, A-S, B, C, D, E, F and G Certificates in each case will be one of the following: (i) a fixed rateper annum, (ii) the WAC Rate (as defined in the Free Writing Prospectus) for the related distribution date, (iii) a variable rateper annumequal to the lesser of (a) a fixed rate and (b) the WAC Rate for the related distribution date or (iv) a variable rateper annumequal to the WAC Rate for the related distribution date minus a specified percentage. | |
| (8) | The Class X-A Certificates are notional amount certificates. The Notional Amount of the Class X-A Certificates will be equal to the aggregate principal balance of the Class A-1, A-2, A-3, A-4, A-SB and A-S Certificates outstanding from time to time. The Class X-A Certificates will not be entitled to distributions of principal. | |
| (9) | The pass-through rate for the Class X-A Certificates for any distribution date will equal the excess, if any, of (a) the WAC Rate for the related distribution date, over (b) the weighted average of the pass-through rates on the Class A-1, A-2, A-3, A-4, A-SB and A-S Certificates for the related distribution date, weighted on the basis of their respective aggregate principal balances outstanding immediately prior to that distribution date. | |
| (10) | The Class X-B Certificates are notional amount certificates. The Notional Amount of the Class X-B Certificates will be equal to the aggregate principal balance of the Class B and C Certificates outstanding from time to time. The Class X-B Certificates will not be entitled to distributions of principal. | |
| (11) | The pass-through rate for the Class X-B Certificates for any distribution date will equal the excess, if any, of (a) the WAC Rate for the related distribution date, over (b) the weighted average of the pass-through rates on the Class B and C Certificates for the related distribution date, weighted on the basis of their respective aggregate principal balances outstanding immediately prior to that distribution date. | |
THE INFORMATION IN THIS STRUCTURAL AND COLLATERAL TERM SHEET IS NOT COMPLETE AND MAY BE AMENDED PRIOR TO THE TIME OF SALE. THIS TERM SHEET IS NOT AN OFFER TO SELL THESE SECURITIES AND IT IS NOT A SOLICITATION OF AN OFFER TO BUY THESE SECURITIES IN ANY JURISDICTION WHERE THE OFFER OR SALE IS NOT PERMITTED.
3
| WFRBS Commercial Mortgage Trust 2013-C11 | Issue Characteristics |
| II. | Transaction Highlights |
Mortgage Loan Sellers:
Mortgage Loan Seller | Number of Mortgage Loans | Number of Mortgaged Properties | Aggregate Cut-off Date Balance | % of Cut-off Date Pool Balance | ||||||
Wells Fargo Bank, National Association | 38 | 60 | $712,905,232 | 49.6% | ||||||
The Royal Bank of Scotland(1) | 14 | 50 | 536,782,553 | 37.4 | ||||||
C-III Commercial Mortgage LLC | 18 | 19 | 75,213,636 | 5.2 | ||||||
Liberty Island Group I LLC | 7 | 19 | 73,557,198 | 5.1 | ||||||
Basis Real Estate Capital II, LLC | 5 | 5 | 37,867,727 | 2.6 | ||||||
|
|
|
|
| ||||||
Total | 82 | 153 | $1,436,326,346 | 100.0% | ||||||
|
|
|
| |||||||
| (1) | The mortgage loan seller referred to herein as The Royal Bank of Scotland is comprised of two affiliated companies: The Royal Bank of Scotland plc and RBS Financial Products Inc. With respect to the mortgage loans being sold for deposit into the trust by The Royal Bank of Scotland: (a) 9 mortgage loans, having an aggregate cut-off date principal balance of $370,902,337 and representing approximately 25.8% of the aggregate principal balance of the pool of mortgage loans as of the cut-off date, were originated, and are being sold to the issuing entity, only by The Royal Bank of Scotland plc, (b) 4 mortgage loans, having an aggregate cut-off date principal balance of $47,469,693 and representing approximately 3.3% of the aggregate principal balance of the pool of mortgage loans as of the cut-off date, were originated, and are being sold to the issuing entity, only by RBS Financial Products Inc. and (c) 1 mortgage loan, having a cut-off date principal balance of $118,410,523 and representing approximately 8.2% of the aggregate principal balance of the pool of mortgage loans as of the cut-off date, was jointly originated, and is being sold to the issuing entity, by both The Royal Bank of Scotland plc and RBS Financial Products Inc. |
Loan Pool:
Cut-off Date Balance: | $1,436,326,346 | |||||
Number of Mortgage Loans: | 82 | |||||
Average Cut-off Date Balance per Mortgage Loan: | $17,516,175 | |||||
Number of Mortgaged Properties: | 153 | |||||
Average Cut-off Date Balance per Mortgaged Property(1): | $9,387,754 | |||||
Weighted Average Mortgage Interest Rate: | 4.215% | |||||
Ten Largest Mortgage Loans as % of Cut-off Date Pool Balance: | 62.1% | |||||
Weighted Average Original Term to Maturity or ARD (months): | 107 | |||||
Weighted Average Remaining Term to Maturity or ARD (months): | 106 | |||||
Weighted Average Original Amortization Term (months)(2): | 348 | |||||
Weighted Average Remaining Amortization Term (months)(2): | 347 | |||||
Weighted Average Seasoning (months): | 1 |
(1) | Information regarding mortgage loans secured by multiple properties is based on an allocation according to relative appraised values or the allocated loan amounts or property-specific release prices set forth in the related loan documents or such other allocation as the related mortgage loan seller deemed appropriate. With respect to Republic Plaza, Concord Mills and One South Wacker Drive, loan-to-value ratio, debt service coverage ratio, debt yield and cut-off date balance per square foot calculations include the relatedpari passucompanion loan (unless otherwise stated) in total debt. | |||
(2) | Excludes any mortgage loan that does not amortize. | |||
Credit Statistics:
Weighted Average U/W Net Cash Flow DSCR(1): | 1.97x | |||||
Weighted Average U/W Net Operating Income Debt Yield Ratio(1): | 11.1% | |||||
Weighted Average Cut-off Date Loan-to-Value Ratio(1): | 61.1% | |||||
Weighted Average Balloon or ARD Loan-to-Value Ratio(1): | 53.7% | |||||
% of Mortgage Loans with Additional Subordinate Debt: | 3.6% | |||||
% of Mortgage Loans with Single Tenants(2): | 9.0% |
(1) | With respect to Republic Plaza, Concord Mills and One South Wacker Drive, loan-to-value ratio, debt service coverage ratio, debt yield and cut-off date balance per square foot calculations include the relatedpari passucompanion loan (unless otherwise stated) in total debt. | |||
(2) | Excludes mortgage loans that are secured by multiple single-tenant properties. | |||
THE INFORMATION IN THIS STRUCTURAL AND COLLATERAL TERM SHEET IS NOT COMPLETE AND MAY BE AMENDED PRIOR TO THE TIME OF SALE. THIS TERM SHEET IS NOT AN OFFER TO SELL THESE SECURITIES AND IT IS NOT A SOLICITATION OF AN OFFER TO BUY THESE SECURITIES IN ANY JURISDICTION WHERE THE OFFER OR SALE IS NOT PERMITTED.
4
| WFRBS Commercial Mortgage Trust 2013-C11 | Issue Characteristics |
Loan Structural Features:
Amortization:Based on the Cut-off Date Pool Balance, 70.3% of the mortgage pool (77 mortgage loans) has scheduled amortization, as follows:
34.5% (66 mortgage loans) requires amortization during the entire loan term
35.9% (11 mortgage loans) provides for an interest-only period followed by an amortization period
Interest-Only: Based on the Cut-off Date Pool Balance, 29.7% of the mortgage pool (5 mortgage loans) provides for interest-only payments during the entire loan term. The Weighted Average Cut-off Date Loan-to-Value Ratio and Weighted Average U/W Net Cash Flow DSCR for those mortgage loans is 61.0% and 2.72x, respectively.
Hard Lockboxes: Based on the Cut-off Date Pool Balance, 59.9% of the mortgage pool (33 mortgage loans) has hard lockboxes in place.
Reserves: The mortgage loans require amounts to be escrowed monthly as follows (excluding any mortgage loans with springing provisions):
Real Estate Taxes: | 69.6% of the pool | |||||
Insurance Premiums: | 38.7% of the pool | |||||
Capital Replacements: | 61.9% of the pool | |||||
TI/LC: | 59.3% of the pool(1) | |||||
| ||||||
(1) The percentage of Cut-off Date Balance for loans with TI/LC reserves is based on the aggregate principal balance allocable to office, retail, mixed use and industrial properties. |
| |||||
Call Protection/Defeasance: Based on the Cut-off Date Pool Balance, the mortgage pool has the following call protection and defeasance features:
69.9% of the mortgage pool (70 mortgage loans) features a lockout period, then defeasance only until an open period
27.2% of the mortgage pool (11 mortgage loans) features a lockout period, then the greater of a prepayment premium or yield maintenance until an open period
3.0% of the mortgage pool (1 mortgage loan) features a lockout period, then defeasance or the greater of a prepayment premium or yield maintenance until an open period
Please refer to Annex A to the Free Writing Prospectus for further description of individual loan call protection.
THE INFORMATION IN THIS STRUCTURAL AND COLLATERAL TERM SHEET IS NOT COMPLETE AND MAY BE AMENDED PRIOR TO THE TIME OF SALE. THIS TERM SHEET IS NOT AN OFFER TO SELL THESE SECURITIES AND IT IS NOT A SOLICITATION OF AN OFFER TO BUY THESE SECURITIES IN ANY JURISDICTION WHERE THE OFFER OR SALE IS NOT PERMITTED.
5
| WFRBS Commercial Mortgage Trust 2013-C11 | Issue Characteristics |
| III. | Issue Characteristics |
| Securities Offered: | $1,292,693,000 approximate monthly pay, multi-class, commercial mortgage REMIC pass-through certificates consisting of eight classes (Classes A-1, A-2, A-3, A-4, A-SB, A-S, B and C), which are offered pursuant to a registration statement filed with the SEC. | |
| Mortgage Loan Sellers: | Wells Fargo Bank, National Association (“WFB”); The Royal Bank of Scotland (“RBS”); C-III Commercial Mortgage LLC (“CIIICM”); Liberty Island Group I LLC (“LIG I”) and Basis Real Estate Capital II, LLC (“Basis”) | |
| Co-lead Bookrunning Managers: | RBS Securities Inc. and Wells Fargo Securities, LLC | |
| Co-Manager: | Citigroup Global Markets Inc. | |
| Rating Agencies: | Fitch, Inc., Kroll Bond Rating Agency, Inc. and Standard & Poor’s Ratings Services | |
| Master Servicer: | Wells Fargo Bank, National Association | |
| Special Servicer: | Midland Loan Services, a Division of PNC Bank, National Association | |
| Certificate Administrator: | Wells Fargo Bank, National Association | |
| Trustee: | U.S. Bank National Association | |
| Trust Advisor: | Trimont Real Estate Advisors, Inc. | |
| Cut-off Date: | The Cut-off Date with respect to each mortgage loan is the due date for the monthly debt service payment that is due in February 2013 (or, in the case of any mortgage loan that has its first due date in March 2013, the date that would have been its due date in February 2013 under the terms of that mortgage loan if a monthly debt service payment were scheduled to be due in that month). | |
| Expected Closing Date: | On or about February 12, 2013. | |
| Determination Dates: | The 11th day of each month (or if that day is not a business day, the next succeeding business day), commencing in March 2013. | |
| Distribution Dates: | The fourth business day following the Determination Date in each month, commencing in March 2013. | |
| Rated Final Distribution Date: | The Distribution Date in March 2045. | |
| Interest Accrual Period: | With respect to any Distribution Date, the calendar month preceding the month in which such Distribution Date occurs. | |
| Day Count: | The Offered Certificates will accrue interest on a 30/360 basis. | |
| Minimum Denominations: | $10,000 for each Class of Offered Certificates. Investments may also be made in any whole dollar denomination in excess of the applicable minimum denomination. | |
| Clean-up Call: | 1% | |
| Delivery: | DTC, Euroclear and Clearstream Banking | |
| ERISA/SMMEA Status: | Each Class of Offered Certificates is expected to be eligible for exemptive relief under ERISA. No Class of Offered Certificates will be SMMEA eligible. | |
| Risk Factors: | THE CERTIFICATES INVOLVE CERTAIN RISKS AND MAY NOT BE SUITABLE FOR ALL INVESTORS. SEE THE “RISK FACTORS” SECTION OF THE FREE WRITING PROSPECTUS. | |
| Bond Analytics Information: |
The Certificate Administrator will be authorized to make distribution date settlements, CREFC reports and certain supplemental reports (other than confidential information) available to certain financial modeling and data provision services, including Bloomberg Financial Markets L.P., Trepp LLC, Intex Solutions, Inc., Markit Group Limited, Interactive Data Corp. and BlackRock Financial Management Inc. | |
THE INFORMATION IN THIS STRUCTURAL AND COLLATERAL TERM SHEET IS NOT COMPLETE AND MAY BE AMENDED PRIOR TO THE TIME OF SALE. THIS TERM SHEET IS NOT AN OFFER TO SELL THESE SECURITIES AND IT IS NOT A SOLICITATION OF AN OFFER TO BUY THESE SECURITIES IN ANY JURISDICTION WHERE THE OFFER OR SALE IS NOT PERMITTED.
6
| WFRBS Commercial Mortgage Trust 2013-C11 | Characteristics of the Mortgage Pool |
| IV. | Characteristics of the Mortgage Pool(1) |
| A. | Ten Largest Mortgage Loans |
| Mortgage Loan Seller | Mortgage Loan Name | City | State | Number of Mortgage Loans / Mortgaged Properties | Mortgage Loan Cut-off Date Balance ($) |
% of Cut- | Property Type | Number of SF, Rooms or Pads | Cut-off Date Balance Per SF, Room or Pad($) | Cut-off Date LTV Ratio (%) | Balloon or ARD LTV Ratio (%) | U/W NCF DSCR (x) | U/W NOI Debt Yield (%) | |||||||||||||||||||||||||
WFB | Republic Plaza | Denver | CO | 1 / 1 | $155,000,000 | 10.8 | % | Office | 1,302,107 | $215 | 52.3% | 45.5% | 1.55x | 9.8% | ||||||||||||||||||||||||
RBS | Concord Mills | Concord | NC | 1 / 1 | 125,000,000 | 8.7 | Retail | 1,285,834 | 183 | 54.0 | 54.0 | 3.13 | 12.7 | |||||||||||||||||||||||||
RBS | RHP Portfolio I | Various | Various | 1 / 18 | 120,763,000 | 8.4 | Manufactured Housing Community | 3,302 | 36,573 | 73.7 | 62.8 | 1.47 | 8.9 | |||||||||||||||||||||||||
WFB | 515 Madison Avenue | New York | NY | 1 / 1 | 120,000,000 | 8.4 | Office | 324,265 | 370 | 52.2 | 45.0 | 1.61 | 9.3 | |||||||||||||||||||||||||
RBS | Brennan Industrial Portfolio II | Various | Various | 1 / 19 | 118,410,523 | 8.2 | Various | 3,913,170 | 30 | 65.0 | 65.0 | 2.50 | 11.5 | |||||||||||||||||||||||||
WFB | One South Wacker Drive | Chicago | IL | 1 / 1 | 70,000,000 | 4.9 | Office | 1,193,448 | 138 | 73.0 | 73.0 | 2.40 | 10.0 | |||||||||||||||||||||||||
WFB | Encana Oil & Gas | Plano | TX | 1 / 1 | 66,000,000 | 4.6 | Office | 318,582 | 207 | 55.0 | 55.0 | 2.52 | 10.9 | |||||||||||||||||||||||||
RBS | Salt Lake City FBI Building | Salt Lake City | UT | 1 / 1 | 46,800,000 | 3.3 | Office | 163,040 | 287 | 60.0 | 60.0 | 2.96 | 10.5 | |||||||||||||||||||||||||
WFB | Starwood Capital Hotel Portfolio II | Various | Various | 1 / 8 | 42,500,000 | 3.0 | Hospitality | 846 | 50,236 | 56.6 | 52.7 | 2.14 | 14.9 | |||||||||||||||||||||||||
WFB | Holiday Inn National Airport | Arlington | VA | 1 / 1 | 26,968,536 | 1.9 | Hospitality | 280 | 96,316 | 59.0 | 47.9 | 1.87 | 13.2 | |||||||||||||||||||||||||
Top Three Total/Weighted Average | 3 / 20 | $400,763,000 | 27.9 | % | 59.3% | 53.4% | 2.02x | 10.4% | ||||||||||||||||||||||||||||||
Top Five Total/Weighted Average | 5 / 40 | $639,173,523 | 44.5 | % | 59.0% | 53.9% | 2.03x | 10.4% | ||||||||||||||||||||||||||||||
Top Ten Total/Weighted Average | 10 / 52 | $891,442,059 | 62.1 | % | 59.7% | 55.6% | 2.15x | 10.7% | ||||||||||||||||||||||||||||||
| (1) | With respect to Republic Plaza, Concord Mills and One South Wacker Drive, Cut-off Date Balance per square foot, loan-to-value ratio, debt service coverage ratio and debt yield calculations include the relatedpari passu companion loan (unless otherwise stated) in total debt. |
| B. | Summary ofPari Passu Split Loan Structures |
| Property Name | Mortgage Loan Seller | Related Notes in Loan Group (Original Balance) | Holder of Note |
Whether Note is | Current Master Servicer Under Related Securitization PSA | Current Special Servicer Under Related Securitization PSA | ||||||||||
Republic Plaza | WFB | $155,000,000 | WFRBS 2013-C11 | Yes | Wells Fargo Bank, National Association | Midland Loan Services, a Division of PNC Bank, National Association | ||||||||||
| WFB | $125,000,000 | WFRBS 2012-C10 | No | Wells Fargo Bank, National Association | Midland Loan Services, a Division of PNC Bank, National Association | |||||||||||
Concord Mills | RBS | $125,000,000 | WFRBS 2013-C11 | Yes | Wells Fargo Bank, National Association | Midland Loan Services, a Division of PNC Bank, National Association | ||||||||||
| RBS | $110,000,000 | WFRBS 2012-C10 | No | Wells Fargo Bank, National Association | Midland Loan Services, a Division of PNC Bank, National Association | |||||||||||
One South Wacker Drive | WFB | $70,000,000 | WFRBS 2013-C11 | No | Wells Fargo Bank, National Association | Midland Loan Services, a Division of PNC Bank, National Association | ||||||||||
| WFB | $95,000,000 | (1) | (2) | TBD | TBD | |||||||||||
| (1) | The relatedpari passucompanion loan is currently held by the mortgage loan seller for the mortgage loan included in the WFRBS 2013-C11 trust. |
| (2) | The One South Wacker Drive loan combination will be serviced under the WFRBS 2013-C11 pooling and servicing agreement until the securitization of the relatedpari passu companion loan, after which such loan combination will be serviced under the pooling and servicing agreement related to the securitization of thatpari passu companion loan. The master servicer and special servicer under the latter pooling and servicing agreement will be identified in a notice, report or statement to holders of the WFRBS 2013-C11 certificates after the securitization of the One South Wacker Drivepari passu companion loan. |
THE INFORMATION IN THIS STRUCTURAL AND COLLATERAL TERM SHEET IS NOT COMPLETE AND MAY BE AMENDED PRIOR TO THE TIME OF SALE. THIS TERM SHEET IS NOT AN OFFER TO SELL THESE SECURITIES AND IT IS NOT A SOLICITATION OF AN OFFER TO BUY THESE SECURITIES IN ANY JURISDICTION WHERE THE OFFER OR SALE IS NOT PERMITTED.
7
| WFRBS Commercial Mortgage Trust 2013-C11 | Characteristics of the Mortgage Pool |
| C. | Previous Securitization History(1) |
| Loan No. | Mortgage Loan Seller | Mortgage Loan or Mortgaged Property Name | City | State | Property Type | Mortgage Loan or Mortgaged Property Cut-off Date Balance ($) | % of Cut-off Date Pool Balance (%) | Previous Securitization | ||||||||||
| 1 | WFB | Republic Plaza | Denver | CO | Office | $155,000,000 | 10.8% | JPMCC 2004-C2 | ||||||||||
| 2 | RBS | Concord Mills | Concord | NC | Retail | 125,000,000 | 8.7 | JPMCC 2003-C1 | ||||||||||
| 3.01 | RBS | Harmony Road | Fort Collins | CO | Manufactured Housing Community | 24,351,000 | 1.7 | Various(2) | ||||||||||
| 3.02 | RBS | The Meadows | Aurora | CO | Manufactured Housing Community | 17,984,000 | 1.3 | Various(3) | ||||||||||
| 3.03 | RBS | Mountainside Estates | Golden | CO | Manufactured Housing Community | 12,321,000 | 0.9 | Various(4) | ||||||||||
| 3.04 | RBS | Eastview | Gillette | WY | Manufactured Housing Community | 9,110,500 | 0.6 | Various(5) | ||||||||||
| 3.05 | RBS | Sheridan | Arvada | CO | Manufactured Housing Community | 6,916,500 | 0.5 | Various(6) | ||||||||||
| 3.06 | RBS | Countryside of Greeley | Greeley | CO | Manufactured Housing Community | 6,683,000 | 0.5 | Various(7) | ||||||||||
| 3.07 | RBS | Westview | Gillette | WY | Manufactured Housing Community | 5,824,500 | 0.4 | MSDWC 2002-TOP7 | ||||||||||
| 3.08 | RBS | Loveland | Loveland | CO | Manufactured Housing Community | 5,456,000 | 0.4 | Various(8) | ||||||||||
| 3.09 | RBS | Terrace | Casper | WY | Manufactured Housing Community | 4,525,500 | 0.3 | Various(9) | ||||||||||
| 3.10 | RBS | Highview | Gillette | WY | Manufactured Housing Community | 4,246,000 | 0.3 | Various(10) | ||||||||||
| 3.11 | RBS | Cimmaron | Cheyenne | WY | Manufactured Housing Community | 4,240,000 | 0.3 | Various(11) | ||||||||||
| 3.12 | RBS | Castle Acres | O’Fallon | IL | Manufactured Housing Community | 4,105,500 | 0.3 | Various(12) | ||||||||||
| 3.13 | RBS | Enchanted Village | Alton | IL | Manufactured Housing Community | 3,272,500 | 0.2 | Various(13) | ||||||||||
| 3.14 | RBS | Shady Lane | Commerce City | CO | Manufactured Housing Community | 2,970,500 | 0.2 | Various(14) | ||||||||||
| 3.15 | RBS | Northern Hills | Springdale | AR | Manufactured Housing Community | 2,925,500 | 0.2 | Various(15) | ||||||||||
| 3.16 | RBS | Terrace II | Casper | WY | Manufactured Housing Community | 2,660,500 | 0.2 | Various(16) | ||||||||||
| 3.17 | RBS | Western Park | Springdale | AR | Manufactured Housing Community | 1,704,500 | 0.1 | Various(17) | ||||||||||
| 3.18 | RBS | Plainview | Casper | WY | Manufactured Housing Community | 1,466,000 | 0.1 | Various(18) | ||||||||||
| 5.07 | RBS | Wincup – Georgia | Stone Mountain | GA | Industrial | 6,608,055 | 0.5 | JPMCC 2004-CB8 | ||||||||||
| 10 | WFB | Holiday Inn National Airport | Arlington | VA | Hospitality | 26,968,536 | 1.9 | JPMCC 2003-PM1A | ||||||||||
| 11 | RBS | Encino Courtyard | Encino | CA | Retail | 25,569,693 | 1.8 | CWCI 2007-C3 | ||||||||||
| 14 | LIG I | Community Corporate Center | Columbus | OH | Office | 15,580,521 | 1.1 | GSMS 2007-EOP | ||||||||||
| 15.01 | WFB | Piedmont Plaza | Gaffney | SC | Retail | 3,006,000 | 0.2 | CSFB 2001-CK1 | ||||||||||
| 15.02 | WFB | Peppers Ferry Centre | Radford | VA | Retail | 3,006,000 | 0.2 | CSFB 2001-CK1 | ||||||||||
| 15.03 | WFB | Tidewater Plaza | Southport | NC | Retail | 3,006,000 | 0.2 | CSFB 2001-CF2 | ||||||||||
| 15.04 | WFB | Boiling Springs Centre | Boiling Springs | SC | Retail | 3,006,000 | 0.2 | FUBOA 2001-C1 | ||||||||||
| 15.05 | WFB | Garber’s Crossing | Harrisonburg | VA | Retail | 3,006,000 | 0.2 | CSFB 2001-CK1 | ||||||||||
| 22 | WFB | Columbia Square | Kennewick | WA | Retail | 13,108,249 | 0.9 | BSCMS 2006-PW11 | ||||||||||
| 23 | LIG I | Milestone Crossing | Castle Rock | CO | Retail | 12,085,836 | 0.8 | GCCFC 2005-GG3 | ||||||||||
| 24 | WFB | US Playing Card | Erlanger | KY | Industrial | 11,956,058 | 0.8 | JPMCC 2005-LDP5 | ||||||||||
THE INFORMATION IN THIS STRUCTURAL AND COLLATERAL TERM SHEET IS NOT COMPLETE AND MAY BE AMENDED PRIOR TO THE TIME OF SALE. THIS TERM SHEET IS NOT AN OFFER TO SELL THESE SECURITIES AND IT IS NOT A SOLICITATION OF AN OFFER TO BUY THESE SECURITIES IN ANY JURISDICTION WHERE THE OFFER OR SALE IS NOT PERMITTED.
8
| WFRBS Commercial Mortgage Trust 2013-C11 | Characteristics of the Mortgage Pool |
| 27.01 | WFB | Liberty Square Shopping Center | Thomasville | NC | Retail | 3,593,972 | 0.3 | GSMS 2003-C1 | ||||||||||||
| 27.02 | WFB | Centre at Evans | Evans | GA | Retail | 2,907,623 | 0.2 | GMACC 2002-C3 | ||||||||||||
| 27.03 | WFB | Shoppes at Thomson | Thomson | GA | Retail | 2,583,167 | 0.2 | GMACC 2003-C1 | ||||||||||||
| 27.04 | WFB | Roxboro Commons | Roxboro | NC | Retail | 2,545,730 | 0.2 | GMACC 2003-C1 | ||||||||||||
| 33 | RBS | Bridgeworks | San Diego | CA | Retail | 10,320,000 | 0.7 | LBUBS 2006-C3 | ||||||||||||
| 36 | LIG I | County Square Shopping Center | Pleasant Hill | CA | Retail | 9,638,447 | 0.7 | WMCMS 2007-SL3 | ||||||||||||
| 38 | Basis | Lakes Brand | Lawrenceville | GA | Office | 9,000,000 | 0.6 | MSCS 2006-HQ8 | ||||||||||||
| 46 | WFB | Pine West Storage Center | Pembroke Pines | FL | Self Storage | 6,491,614 | 0.5 | BSCMS 2003-T10 | ||||||||||||
| 51 | LIG I | Country Club Apartments | Columbus | OH | Multifamily | 5,180,000 | 0.4 | CSFB 2003-C3 | ||||||||||||
| 53 | WFB | 2801 Magazine Street | New Orleans | LA | Retail | 4,395,056 | 0.3 | MSDWC 2003-TOP9 | ||||||||||||
| 63 | WFB | MNSC – Lake Mary | Lake Mary | FL | Self Storage | 3,500,000 | 0.2 | WBCMT 2003-C3 | ||||||||||||
| 66 | CIIICM | Sunset Village | Bradenton | FL | Manufactured Housing Community | 3,195,360 | 0.2 | WBCMT 2003-C4 | ||||||||||||
| 67.01 | CIIICM | Sherwood | Baytown | TX | Manufactured Housing Community | 1,889,866 | 0.1 | BACM 2003-1 | ||||||||||||
| 68.01 | WFB | MNSC – Kissimmee | Kissimmee | FL | Self Storage | 1,861,023 | 0.1 | LBUBS 2003-C3 | ||||||||||||
| 68.02 | WFB | MNSC – Apopka | Apopka | FL | Self Storage | 1,228,977 | 0.1 | LBUBS 2003-C3 | ||||||||||||
| 70 | Basis | Gale Valley Estates MHC | Galesburg | MI | Manufactured Housing Community | 2,900,000 | 0.2 | WBCMT 2003-C4 | ||||||||||||
| 71 | WFB | Indian River Plaza | Diberville | MS | Retail | 2,868,392 | 0.2 | GECMC 2002-3A | ||||||||||||
| 72 | WFB | Walgreens – Bixby | Bixby | OK | Retail | 2,796,926 | 0.2 | LBUBS 2003-C1 | ||||||||||||
| 73 | CIIICM | Keystone MHC | Alabaster | AL | Manufactured Housing Community | 2,694,646 | 0.2 | WBCMT 2003-C4 | ||||||||||||
| 74 | WFB | Walgreens – St. George | Saint George | UT | Retail | 2,645,508 | 0.2 | WBCMT 2003-C4 | ||||||||||||
Total
| $609,906,254 | 42.5% | ||||||||||||||||||
| (1) | The table above represents the most recent securitization with respect to the mortgaged property securing the related mortgage loan, based on information provided by the related borrower or obtained through searches of a third-party database. In instances in which the most recent securitization of a property took place across multiple trusts, all trusts are listed in the footnotes below. The information has not otherwise been confirmed by the mortgage loan sellers. |
| (2) | Harmony Road was previously securitized in five separate transactions: MLMT 2008-C1, MLCFC 2007-8, MLCFC 2007-9, MSDWC 2002-IQ2 and BALL 2007-BMB1. |
| (3) | The Meadows was previously securitized in three separate transactions: MLCFC 2007-8, MLCFC 2007-9 and MLMT 2008-C1. |
| (4) | Mountainside Estates was previously securitized in five separate transactions: JPMCC 2002-C3, BALL 2007-BMB1, MLCFC 2007-8, MLCFC 2007-9 and MLMT 2008-C1. |
| (5) | Eastview was previously securitized in five separate transactions: BALL 2007-BMB1, MLCFC 2007-8, MLCFC 2007-9, MLMT 2008-C1 and MSDWC 2002-TOP7. |
| (6) | Sheridan was previously securitized in five separate transactions: MLCFC 2007-8, MLCFC 2007-9, MLMT 2008-C1, BALL 2007-BMB1 and CGMT 2004-C1. |
| (7) | Countryside of Greeley was previously securitized in five separate transactions: JPMCC 2002-C3, MLMT 2008-C1, MLCFC 2007-8, MLCFC 2007-9 and BALL 2007-BMB1. |
| (8) | Loveland was previously securitized in three separate transactions: MLMT 2006-C2, MLFT 2006-1 and PSSF 1995-MCF2. |
| (9) | Terrace was previously securitized in four separate transactions: MSDWC 2003-HQ2, MLCFC 2007-8, MLCFC 2007-9 and MLMT 2008-C1. |
| (10) | Highview was previously securitized in four separate transactions: MLCFC 2007-8, MLCFC 2007-9, BALL 2007-BMB1 and MLMT 2008-C1. |
| (11) | Cimmaron was previously securitized in five separate transactions: MLCFC 2007-8, MLCFC 2007-9, MLMT 2008-C1, MSDWC 2002-TOP7 and BALL 2007-BMB1. |
| (12) | Castle Acres was previously securitized in five separate transactions: MLCFC 2007-8, MLCFC 2007-9, BALL 2007-BMB1, MLMT 2008-C1 and GMACC 2003-C1. |
| (13) | Enchanted Village was previously securitized in seven separate transactions: MLMT 2006-C2, MLCFC 2007-8, MLCFC 2007-9, MLMT 2008-C1, MLFT 2006-1, BALL 2007-BMB1 and CGCMT 2004-FL1. |
| (14) | Shady Lane was previously securitized in five separate transactions: MLCFC 2007-8, MLCFC 2008-9, MSDWC 2003-HQ2, BALL 2007-BMB1 and MLMT 2008-C1. |
| (15) | Northern Hills was previously securitized in five separate transactions: MSDWC 2002-IQ2, BALL 2007-BMB1, MLCFC 2007-8, MLCFC 2007-9 and MLMT 2008-C1. |
| (16) | Terrace II was previously securitized in five separate transactions: MLCFC 2007-8, BALL 2007-BMB1, MLMT 2008-C1, MLMT 2004-KEY2 and MLCFC 2007-9. |
| (17) | Western Park was previously securitized in five separate transactions: MLCFC 2007-8, MLCFC 2007-9, MSDWC 2002-IQ2, BALL 2007-BMB1 and MLMT 2008-C1. |
| (18) | Plainview was previously securitized in five separate transactions: MLCFC 2007-8, MLCFC 2008-9, MLMT 2004-MKB1, MLMT 2008-C1 and BALL 2007-BMB1. |
THE INFORMATION IN THIS STRUCTURAL AND COLLATERAL TERM SHEET IS NOT COMPLETE AND MAY BE AMENDED PRIOR TO THE TIME OF SALE. THIS TERM SHEET IS NOT AN OFFER TO SELL THESE SECURITIES AND IT IS NOT A SOLICITATION OF AN OFFER TO BUY THESE SECURITIES IN ANY JURISDICTION WHERE THE OFFER OR SALE IS NOT PERMITTED.
9
| WFRBS Commercial Mortgage Trust 2013-C11 | Characteristics of the Mortgage Pool |
| D. | Mortgage Loans with Scheduled Balloon Payments and Related Classes |
Class A-2(1)
| Loan No. | Mortgage Loan Seller | Mortgage Loan Name | State | Property Type | Mortgage Loan Cut-off Date Balance ($) | % of Cut-off Date Pool Balance (%) | Mortgage Loan Balance at Maturity ($) | % of Class A-2 Certificate Principal Balance (%)(2) | SF/ Rooms/ Pads | Loan per SF/ Room/ Pad ($) | U/W NCF DSCR (x) | U/W NOI Debt Yield (%) | Cut-off Date LTV Ratio (%) | Balloon LTV Ratio (%) | Rem. IO Period (mos.) | Rem. Term to Maturity (mos.) | ||||||||||||||||||||||
5 | RBS | Brennan Industrial Portfolio II | Various | Various | $118,410,523 | 8.2% | $118,410,523 | 42.5% | 3,913,170 | $30 | 2.50x | 11.5% | 65.0% | 65.0% | 58 | 58 | ||||||||||||||||||||||
6 | WFB | One South Wacker Drive | IL | Office | 70,000,000 | 4.9 | 70,000,000 | 25.1 | 1,193,448 | 138 | 2.40 | 10.0 | 73.0 | 73.0 | 59 | 59 | ||||||||||||||||||||||
9 | WFB | Starwood Capital Hotel Portfolio II | Various | Hospitality | 42,500,000 | 3.0 | 39,567,659 | 14.2 | 846 | 50,236 | 2.14 | 14.9 | 56.6 | 52.7 | 11 | 59 | ||||||||||||||||||||||
17 | RBS | Minot Hotel Portfolio | ND | Hospitality | 14,975,522 | 1.0 | 13,270,863 | 4.8 | 238 | 62,922 | 2.43 | 18.9 | 59.7 | 52.9 | 0 | 59 | ||||||||||||||||||||||
24 | WFB | US Playing Card | KY | Industrial | 11,956,058 | 0.8 | 10,492,371 | 3.8 | 769,604 | 16 | 1.73 | 12.7 | 58.9 | 51.7 | 0 | 58 | ||||||||||||||||||||||
26 | WFB | Clipper Mill | MD | Mixed Use | 11,701,165 | 0.8 | 10,654,066 | 3.8 | 141,318 | 83 | 1.62 | 10.4 | 58.2 | 53.0 | 0 | 57 | ||||||||||||||||||||||
44 | CIIICM | Ridgebrook Village & Valley Hills MHC | IN | Manufactured Housing Community | 6,633,179 | 0.5 | 6,059,395 | 2.2 | 739 | 8,976 | 1.71 | 10.8 | 75.0 | 68.5 | 0 | 58 | ||||||||||||||||||||||
56 | CIIICM | Morningside Estates | FL | Manufactured Housing Community | 4,150,000 | 0.3 | 3,803,689 | 1.4 | 399 | 10,401 | 1.73 | 11.0 | 70.7 | 64.8 | 0 | 58 | ||||||||||||||||||||||
Total/Weighted Average | $280,326,447 | 19.5% | $272,258,564 | 97.8% | 2.32x | 12.0% | 65.2% | 63.5% | 41 | 58 | ||||||||||||||||||||||||||||
| (1) | The table above presents the mortgage loans whose balloon payments would be applied to pay down the principal balance of the Class A-2 Certificates, assuming a 0% CPR and applying the “Structuring Assumptions” described in the Free Writing Prospectus, including the assumptions that (i) none of the mortgage loans in the pool experience prepayments, defaults or losses; (ii) there are no extensions of maturity dates of any mortgage loans in the pool; and (iii) each mortgage loan in the pool is paid in full on its stated maturity date. Each class of Certificates, including the Class A-2 Certificates, evidences undivided ownership interests in the entire pool of mortgage loans. |
| (2) | Reflects the percentage of the Mortgage Loan Balance at Maturity divided by the initial Class A-2 Certificate Principal Balance. |
Class A-3(1)
| Loan No. | Mortgage Loan Seller | Mortgage Loan Name | State | Property Type | Mortgage Loan Cut-off Date Balance ($) | % of Cut-off Date Balance (%) | Mortgage Loan Balance at Maturity or ARD ($) | % of Class A-3 Certificate Principal Balance (%)(2) | SF/ Rooms/ Pads | Loan per SF/ Room/ Pad ($) | U/W NCF DSCR (x) | U/W NOI Debt Yield (%) | Cut-off Date LTV Ratio (%) | Balloon or ARD LTV Ratio (%) | Rem. IO Period (mos.) | Rem. Term to Maturity (mos.) | ||||||||||||||||||||
8 | RBS | Salt Lake City FBI Building | UT | Office | $46,800,000 | 3.3% | $46,800,000 | 100.0% | 163,040 | $287 | 2.96x | 10.5% | 60.0% | 60.0% | 83 | 83 | ||||||||||||||||||||
Total/Weighted Average | $46,800,000 | 3.3% | $46,800,000 | 100.0% | 2.96x | 10.5% | 60.0% | 60.0% | 83 | 83 | ||||||||||||||||||||||||||
| (1) | The table above presents the mortgage loan whose balloon payment would be applied to pay down the principal balance of the Class A-3 Certificates, assuming a 0% CPR and applying the “Structuring Assumptions” described in the Free Writing Prospectus, including the assumptions that (i) none of the mortgage loans in the pool experience prepayments, defaults or losses; (ii) there are no extensions of maturity dates of any mortgage loans in the pool; and (iii) each mortgage loan in the pool is paid in full on its stated maturity date. Each class of Certificates, including the Class A-3 Certificates, evidences undivided ownership interests in the entire pool of mortgage loans. |
| (2) | Reflects the percentage of the Mortgage Loan Balance at Maturity divided by the initial Class A-3 Certificate Principal Balance. |
THE INFORMATION IN THIS STRUCTURAL AND COLLATERAL TERM SHEET IS NOT COMPLETE AND MAY BE AMENDED PRIOR TO THE TIME OF SALE. THIS TERM SHEET IS NOT AN OFFER TO SELL THESE SECURITIES AND IT IS NOT A SOLICITATION OF AN OFFER TO BUY THESE SECURITIES IN ANY JURISDICTION WHERE THE OFFER OR SALE IS NOT PERMITTED.
10
| WFRBS Commercial Mortgage Trust 2013-C11 | Characteristics of the Mortgage Pool |
| E. | Property Type Distribution |
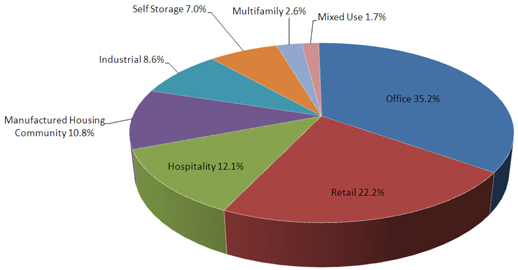
| Property Type | Number of Mortgaged Properties | Aggregate Cut- off Date Balance ($)(1) | % of Cut- off Date Balance (%) | Weighted Average Cut-off Date LTV Ratio (%) | Weighted Average Balloon or ARD LTV Ratio (%) | Weighted Average U/W NCF DSCR (x) | Weighted Average U/W NOI Debt Yield (%) | Weighted Average U/W NCF Debt Yield (%) | Weighted Average Mortgage Rate (%) | |||||||||||||||||||||||||
Office | 11 | $505,012,487 | 35.2% | 57.8% | 52.8% | 1.95x | 10.1% | 9.5% | 4.027% | |||||||||||||||||||||||||
CBD | 3 | 345,000,000 | 24.0 | 56.5 | 50.9 | 1.74 | 9.7 | 9.1 | 4.008 | |||||||||||||||||||||||||
Suburban | 7 | 155,812,487 | 10.8 | 60.7 | 57.2 | 2.43 | 11.1 | 10.4 | 4.037 | |||||||||||||||||||||||||
Medical | 1 | 4,200,000 | 0.3 | 56.8 | 46.9 | 1.41 | 10.4 | 9.2 | 5.150 | |||||||||||||||||||||||||
Retail | 41 | 318,395,404 | 22.2 | 61.7 | 52.6 | 2.16 | 11.4 | 10.8 | 4.244 | |||||||||||||||||||||||||
Regional Mall | 1 | 125,000,000 | 8.7 | 54.0 | 54.0 | 3.13 | 12.7 | 12.2 | 3.836 | |||||||||||||||||||||||||
Anchored | 6 | 75,168,239 | 5.2 | 68.4 | 55.3 | 1.53 | 10.0 | 9.3 | 4.492 | |||||||||||||||||||||||||
Shadow Anchored(2) | 15 | 56,446,857 | 3.9 | 69.3 | 55.5 | 1.58 | 10.6 | 9.8 | 4.464 | |||||||||||||||||||||||||
Unanchored | 6 | 32,437,874 | 2.3 | 63.7 | 52.0 | 1.63 | 10.8 | 10.1 | 4.504 | |||||||||||||||||||||||||
Single Tenant | 13 | 29,342,434 | 2.0 | 60.1 | 35.0 | 1.38 | 11.5 | 10.9 | 4.636 | |||||||||||||||||||||||||
Hospitality | 20 | 173,454,282 | 12.1 | 58.8 | 48.0 | 1.95 | 14.2 | 12.5 | 4.551 | |||||||||||||||||||||||||
Full Service | 7 | 92,415,783 | 6.4 | 57.6 | 46.6 | 1.95 | 14.2 | 12.5 | 4.539 | |||||||||||||||||||||||||
Limited Service | 13 | 81,038,499 | 5.6 | 60.0 | 49.7 | 1.94 | 14.2 | 12.4 | 4.565 | |||||||||||||||||||||||||
Manufactured Housing Community | 28 | 155,169,684 | 10.8 | 72.4 | 61.7 | 1.53 | 9.4 | 9.3 | 4.450 | |||||||||||||||||||||||||
Manufactured Housing Community | 28 | 155,169,684 | 10.8 | 72.4 | 61.7 | 1.53 | 9.4 | 9.3 | 4.450 | |||||||||||||||||||||||||
Industrial | 18 | 122,916,323 | 8.6 | 64.4 | 63.7 | 2.43 | 11.6 | 9.9 | 3.892 | |||||||||||||||||||||||||
Flex | 17 | 110,960,265 | 7.7 | 65.0 | 65.0 | 2.50 | 11.5 | 9.8 | 3.878 | |||||||||||||||||||||||||
Warehouse | 1 | 11,956,058 | 0.8 | 58.9 | 51.7 | 1.73 | 12.7 | 11.0 | 4.020 | |||||||||||||||||||||||||
Self Storage | 25 | 99,929,359 | 7.0 | 61.6 | 51.8 | 1.88 | 11.6 | 11.3 | 4.369 | |||||||||||||||||||||||||
Self Storage | 25 | 99,929,359 | 7.0 | 61.6 | 51.8 | 1.88 | 11.6 | 11.3 | 4.369 | |||||||||||||||||||||||||
Multifamily | 7 | 36,771,525 | 2.6 | 61.6 | 48.9 | 1.54 | 10.9 | 9.7 | 4.569 | |||||||||||||||||||||||||
Garden | 4 | 31,931,977 | 2.2 | 60.4 | 47.6 | 1.55 | 11.1 | 9.7 | 4.511 | |||||||||||||||||||||||||
Student Housing | 3 | 4,839,548 | 0.3 | 69.6 | 57.3 | 1.50 | 9.7 | 9.6 | 4.950 | |||||||||||||||||||||||||
Mixed Use | 3 | 24,677,282 | 1.7 | 49.1 | 42.2 | 1.55 | 10.9 | 9.3 | 4.315 | |||||||||||||||||||||||||
Office/Multifamily/Retail | 1 | 11,701,165 | 0.8 | 58.2 | 53.0 | 1.62 | 10.4 | 9.3 | 3.950 | |||||||||||||||||||||||||
Office/Retail | 1 | 9,976,117 | 0.7 | 34.6 | 28.1 | 1.48 | 11.2 | 9.0 | 4.500 | |||||||||||||||||||||||||
Multifamily/Retail | 1 | 3,000,000 | 0.2 | 62.2 | 46.7 | 1.51 | 11.5 | 10.7 | 5.120 | |||||||||||||||||||||||||
Total/Weighted Average | 153 | $1,436,326,346 | 100.0% | 61.1% | 53.7% | 1.97x | 11.1% | 10.3% | 4.215% | |||||||||||||||||||||||||
| (1) | Because this table presents information relating to the mortgaged properties and not the mortgage loans, (a) the information for mortgage loans secured by more than one mortgaged property (other than through cross-collateralization with other mortgage loans) is based on allocated amounts (allocating the mortgage loan principal balance to each of those properties according to the relative appraised values of the mortgaged properties or the allocated loan amounts or property-specific release prices set forth in the related mortgage loan documents or such other allocation as the related mortgage loan seller deemed appropriate), and (b) the information for each mortgaged property that relates to a mortgage loan that is cross-collateralized with other mortgage loans is based upon the principal balance of that mortgage loan, except that the applicable loan-to-value ratio, debt service coverage ratio or debt yield for each such mortgaged property is based upon the ratio or yield (as applicable) for the aggregate indebtedness evidenced by all loans in the group. On an individual basis, without regard to the cross-collateralization feature, any mortgaged property securing a mortgage loan that is part of a cross-collateralized group of mortgage loans may have a higher loan-to-value ratio, lower debt service coverage ratio and/or lower debt yield than is presented herein. With respect to Republic Plaza, Concord Mills and One South Wacker Drive, loan-to-value ratio, debt service coverage ratio and debt yield calculations include the relatedpari passucompanion loan (unless otherwise stated) in total debt. |
| (2) | A mortgaged property is classified as shadow anchored if it is located in close proximity to an anchored retail property. |
THE INFORMATION IN THIS STRUCTURAL AND COLLATERAL TERM SHEET IS NOT COMPLETE AND MAY BE AMENDED PRIOR TO THE TIME OF SALE. THIS TERM SHEET IS NOT AN OFFER TO SELL THESE SECURITIES AND IT IS NOT A SOLICITATION OF AN OFFER TO BUY THESE SECURITIES IN ANY JURISDICTION WHERE THE OFFER OR SALE IS NOT PERMITTED.
11
| WFRBS Commercial Mortgage Trust 2013-C11 | Characteristics of the Mortgage Pool |
| F. | Geographic Distribution(1) |
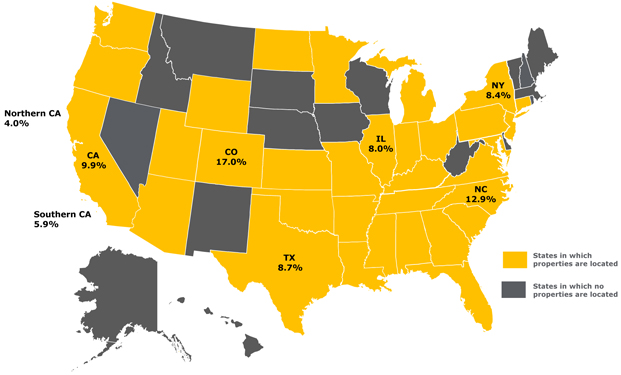
| Location(2) | Number of Mortgaged Properties | Aggregate Cut-off Date Balance ($)(3) | % of Cut-off | Weighted off Date LTV | Weighted Average Balloon or ARD LTV Ratio (%) | Weighted U/W NCF | Weighted U/W NOI (%) | Weighted U/W NCF Yield (%) | Weighted Average Mortgage Rate (%) | |||||||||||
| Colorado | 9 | $243,767,836 | 17.0% | 59.5% | 51.1% | 1.52x | 9.5% | 9.0% | 4.303% | |||||||||||
| North Carolina | 9 | 185,632,590 | 12.9 | 56.8 | 52.4 | 2.70 | 12.6 | 11.9 | 4.034 | |||||||||||
| California | 13 | 141,774,603 | 9.9 | 63.8 | 52.9 | 1.68 | 10.5 | 9.6 | 4.406 | |||||||||||
Southern | 7 | 84,875,999 | 5.9 | 65.5 | 56.3 | 1.77 | 10.3 | 9.5 | 4.331 | |||||||||||
Northern | 6 | 56,898,604 | 4.0 | 61.1 | 47.9 | 1.55 | 10.7 | 9.7 | 4.518 | |||||||||||
| Texas | 19 | 125,598,616 | 8.7 | 59.4 | 54.2 | 2.17 | 11.3 | 10.8 | 4.366 | |||||||||||
| New York | 1 | 120,000,000 | 8.4 | 52.2 | 45.0 | 1.61 | 9.3 | 9.1 | 3.860 | |||||||||||
| Illinois | 10 | 115,065,691 | 8.0 | 70.1 | 68.1 | 2.31 | 10.6 | 9.5 | 3.909 | |||||||||||
| Other States(4) | 92 | 504,487,011 | 35.1 | 63.3 | 54.4 | 1.96 | 11.9 | 10.8 | 4.302 | |||||||||||
| Total/Weighted Average | 153 | $1,436,326,346 | 100.0% | 61.1% | 53.7% | 1.97x | 11.1% | 10.3% | 4.215% |
| (1) | The Mortgaged Properties are located in 33 states. |
| (2) | For purposes of determining whether a mortgaged property is in Northern California or Southern California, Northern California includes areas with zip codes above 93600 and Southern California includes areas with zip codes of 93600 and below. |
| (3) | Because this table presents information relating to the mortgaged properties and not the mortgage loans, (a) the information for mortgage loans secured by more than one mortgaged property (other than through cross-collateralization with other mortgage loans) is based on allocated amounts (allocating the mortgage loan principal balance to each of those properties according to the relative appraised values of the mortgaged properties or the allocated loan amounts or property-specific release prices set forth in the related mortgage loan documents or such other allocation as the related mortgage loan seller deemed appropriate), and (b) the information for each mortgaged property that relates to a mortgage loan that is cross-collateralized with other mortgage loans is based upon the principal balance of that mortgage loan, except that the applicable loan-to-value ratio, debt service coverage ratio or debt yield for each such mortgaged property is based upon the ratio or yield (as applicable) for the aggregate indebtedness evidenced by all loans in the group. On an individual basis, without regard to the cross-collateralization feature, any mortgaged property securing a mortgage loan that is part of a cross-collateralized group of mortgage loans may have a higher loan-to-value ratio, lower debt service coverage ratio and/or lower debt yield than is presented herein. With respect to Republic Plaza, Concord Mills and One South Wacker Drive, loan-to-value ratio, debt service coverage ratio, debt yield and cut-off date balance per square foot calculations include the relatedpari passu companion loan (unless otherwise stated) in total debt. |
| (4) | Includes 27 other states. |
THE INFORMATION IN THIS STRUCTURAL AND COLLATERAL TERM SHEET IS NOT COMPLETE AND MAY BE AMENDED PRIOR TO THE TIME OF SALE. THIS TERM SHEET IS NOT AN OFFER TO SELL THESE SECURITIES AND IT IS NOT A SOLICITATION OF AN OFFER TO BUY THESE SECURITIES IN ANY JURISDICTION WHERE THE OFFER OR SALE IS NOT PERMITTED.
12
| WFRBS Commercial Mortgage Trust 2013-C11 | Characteristics of the Mortgage Pool |
| G. | Characteristics of the Mortgage Pool(1) |
CUT-OFF DATE BALANCE
| Range of Cut-off Date Balances ($) | Number of Mortgage Loans | Aggregate Cut- off Date Balance ($) | % of Cut-off Date Balance | |||||
1,098,848 – 2,000,000 | 6 | $10,130,623 | 0.7% | |||||
2,000,001 – 3,000,000 | 10 | 25,998,357 | 1.8 | |||||
3,000,001 – 4,000,000 | 10 | 34,252,006 | 2.4 | |||||
4,000,001 – 5,000,000 | 5 | 21,923,981 | 1.5 | |||||
5,000,001 – 6,000,000 | 2 | 10,460,000 | 0.7 | |||||
6,000,001 – 7,000,000 | 9 | 59,280,821 | 4.1 | |||||
7,000,001 – 8,000,000 | 1 | 7,560,000 | 0.5 | |||||
8,000,001 – 9,000,000 | 2 | 17,977,728 | 1.3 | |||||
9,000,001 – 14,000,000 | 19 | 216,739,633 | 15.1 | |||||
14,000,001 – 19,000,000 | 5 | 74,661,662 | 5.2 | |||||
19,000,001 – 29,000,000 | 4 | 92,868,012 | 6.5 | |||||
29,000,001 – 49,000,000 | 2 | 89,300,000 | 6.2 | |||||
49,000,001 – 69,000,000 | 1 | 66,000,000 | 4.6 | |||||
69,000,001 – 89,000,000 | 1 | 70,000,000 | 4.9 | |||||
109,000,001 – 129,000,000 | 4 | 484,173,523 | 33.7 | |||||
149,000,001 – 155,000,000 | 1 | 155,000,000 | 10.8 | |||||
Total: | 82 | $1,436,326,346 | 100.0% | |||||
Average: | $17,516,175 | |||||||
UNDERWRITTEN NOI DEBT SERVICE COVERAGE RATIO
| Range of U/W NOI DSCRs (x) | Number of Mortgage Loans | Aggregate Cut- off Date Balance ($) | % of Cut-off Date Balance | |||||
1.27 – 1.40 | 1 | $13,500,000 | 0.9% | |||||
1.41 – 1.50 | 3 | 153,892,693 | 10.7 | |||||
1.51 – 1.60 | 7 | 43,455,659 | 3.0 | |||||
1.61 – 1.70 | 15 | 351,817,607 | 24.5 | |||||
1.71 – 1.80 | 12 | 96,361,303 | 6.7 | |||||
1.81 – 1.90 | 15 | 107,025,827 | 7.5 | |||||
1.91 – 2.00 | 9 | 97,985,979 | 6.8 | |||||
2.01 – 2.25 | 6 | 58,230,003 | 4.1 | |||||
2.26 – 2.50 | 4 | 20,881,229 | 1.5 | |||||
2.51 – 2.75 | 4 | 181,400,000 | 12.6 | |||||
2.76 – 3.00 | 4 | 183,686,045 | 12.8 | |||||
3.01 – 3.89 | 2 | 128,090,000 | 8.9 | |||||
Total: | 82 | $1,436,326,346 | 100.0% | |||||
Weighted Average: | 2.12x | |||||||
UNDERWRITTEN NCF DEBT SERVICE COVERAGE RATIO
| Range of U/W NCF DSCRs (x) | Number of Mortgage Loans | Aggregate Cut- off Date Balance ($) | % of Cut-off Date Balance | |||||
1.21 – 1.40 | 1 | $13,500,000 | 0.9% | |||||
1.41 – 1.50 | 11 | 219,650,088 | 15.3 | |||||
1.51 – 1.60 | 15 | 268,855,942 | 18.7 | |||||
1.61 – 1.70 | 19 | 237,642,096 | 16.5 | |||||
1.71 – 1.80 | 14 | 109,323,303 | 7.6 | |||||
1.81 – 1.90 | 6 | 62,992,225 | 4.4 | |||||
1.91 – 2.00 | 1 | 6,765,418 | 0.5 | |||||
2.01 – 2.10 | 1 | 3,699,200 | 0.3 | |||||
2.11 – 2.20 | 3 | 57,027,383 | 4.0 | |||||
2.21 – 2.30 | 1 | 2,694,646 | 0.2 | |||||
2.31 – 2.40 | 2 | 73,500,000 | 5.1 | |||||
2.41 – 2.50 | 3 | 136,286,045 | 9.5 | |||||
2.51 – 2.70 | 1 | 66,000,000 | 4.6 | |||||
2.71 – 2.90 | 1 | 3,500,000 | 0.2 | |||||
2.91 – 3.00 | 1 | 46,800,000 | 3.3 | |||||
3.01 – 3.77 | 2 | 128,090,000 | 8.9 | |||||
Total: | 82 | $1,436,326,346 | 100.0% | |||||
Weighted Average: | 1.97x | |||||||
LOAN PURPOSE
| Loan Purpose | Number of Mortgage Loans | Aggregate Cut- off Date Balance ($) | % of Cut-off Date Balance | |||||
Refinance | 60 | $835,691,491 | 58.2% | |||||
Acquisition | 20 | 588,491,315 | 41.0 | |||||
Various | 2 | 12,143,540 | 0.8 | |||||
Total: | 82 | $1,436,326,346 | 100.0% | |||||
MORTGAGE RATE
| Range of Mortgage Rates (%) | Number of Mortgage Loans | Aggregate Cut- off Date Balance ($) | % of Cut-off Date Balance | |||||
3.470 – 4.500 | 38 | $1,134,963,788 | 79.0% | |||||
4.501 – 4.750 | 20 | 207,416,262 | 14.4 | |||||
4.751 – 5.000 | 14 | 66,812,277 | 4.7 | |||||
5.001 – 5.250 | 7 | 19,494,013 | 1.4 | |||||
5.251 – 5.400 | 3 | 7,640,006 | 0.5 | |||||
Total: | 82 | $1,436,326,346 | 100.0% | |||||
Weighted Average: | 4.215% | |||||||
UNDERWRITTEN NOI DEBT YIELD
| Range of U/W NOI Debt Yields (%) | Number of Mortgage Loans | Aggregate Cut- off Date Balance ($) | % of Cut-off Date Balance | |||||
8.9 – 8.9 | 2 | $128,323,000 | 8.9% | |||||
9.0 – 9.9 | 7 | 336,792,805 | 23.4 | |||||
10.0 – 10.9 | 22 | 340,408,610 | 23.7 | |||||
11.0 – 11.9 | 26 | 269,960,174 | 18.8 | |||||
12.0 – 12.9 | 9 | 191,189,160 | 13.3 | |||||
13.0 – 13.9 | 7 | 78,540,427 | 5.5 | |||||
14.0 – 14.9 | 2 | 49,265,418 | 3.4 | |||||
15.0 – 15.9 | 3 | 16,582,030 | 1.2 | |||||
16.0 – 16.9 | 2 | 7,199,200 | 0.5 | |||||
18.0 – 18.9 | 1 | 14,975,522 | 1.0 | |||||
20.0 – 22.8 | 1 | 3,090,000 | 0.2 | |||||
Total: | 82 | $1,436,326,346 | 100.0% | |||||
Weighted Average: | 11.1% | |||||||
UNDERWRITTEN NCF DEBT YIELD
| Range of U/W NCF Debt Yields (%) | Number of Mortgage Loans | Aggregate Cut- off Date Balance ($) | % of Cut-off Date Balance | |||||
8.7 – 8.9 | 5 | $180,054,148 | 12.5% | |||||
9.0 – 9.9 | 18 | 600,729,204 | 41.8 | |||||
10.0 – 10.9 | 27 | 269,824,936 | 18.8 | |||||
11.0 – 11.9 | 18 | 154,092,696 | 10.7 | |||||
12.0 – 12.9 | 5 | 179,513,193 | 12.5 | |||||
13.0 – 13.9 | 3 | 21,252,801 | 1.5 | |||||
14.0 – 14.9 | 2 | 6,599,200 | 0.5 | |||||
15.0 – 15.9 | 1 | 2,694,646 | 0.2 | |||||
16.0 – 16.9 | 2 | 18,475,522 | 1.3 | |||||
20.0 – 22.1 | 1 | 3,090,000 | 0.2 | |||||
Total: | 82 | $1,436,326,346 | 100.0% | |||||
Weighted Average: | 10.3% | |||||||
| (1) | Information regarding mortgage loans that are cross-collateralized with other mortgage loans is based upon the individual loan balances, except that the applicable loan-to value ratio, debt service coverage ratio or debt yield for each such mortgage loan is based upon the ratio or yield (as applicable) for the aggregate indebtedness evidenced by all loans in the group. On an individual basis, without regard to the cross-collateralization feature, any mortgage loan that is part of a cross-collateralized group of mortgage loans may have a higher loan-to-value ratio, lower debt service coverage ratio and/or lower debt yield than is presented herein. With respect to Republic Plaza, Concord Mills and One South Wacker Drive loan-to-value ratio, debt service coverage ratio and debt yield calculations include the relatedpari passu companion loan (unless otherwise stated) in total debt. |
THE INFORMATION IN THIS STRUCTURAL AND COLLATERAL TERM SHEET IS NOT COMPLETE AND MAY BE AMENDED PRIOR TO THE TIME OF SALE. THIS TERM SHEET IS NOT AN OFFER TO SELL THESE SECURITIES AND IT IS NOT A SOLICITATION OF AN OFFER TO BUY THESE SECURITIES IN ANY JURISDICTION WHERE THE OFFER OR SALE IS NOT PERMITTED.
13
| WFRBS Commercial Mortgage Trust 2013-C11 | Characteristics of the Mortgage Pool |
| ORIGINAL TERM TO MATURITY OR ARD | ||||||||
| Range of Original Terms to Maturity or ARD (months) | Number of Mortgage Loans | Aggregate Cut- off Date Balance ($) | % of Cut-off Date Balance | |||||
60 | 8 | $280,326,447 | 19.5% | |||||
84 | 1 | 46,800,000 | 3.3 | |||||
120 | 73 | 1,109,199,899 | 77.2 | |||||
Total: | 82 | $1,436,326,346 | 100.0% | |||||
Weighted Average: | 107 months | |||||||
| REMAINING TERM TO MATURITY OR ARD | ||||||||
Range of Remaining Terms (months) | Number of Mortgage Loans | Aggregate Cut- off Date Balance ($) | % of Cut-off Date Balance | |||||
57 – 60 | 8 | $280,326,447 | 19.5% | |||||
61 – 84 | 1 | 46,800,000 | 3.3 | |||||
85 – 120 | 73 | 1,109,199,899 | 77.2 | |||||
Total: | 82 | $1,436,326,346 | 100.0% | |||||
Weighted Average: | 106 months | |||||||
| ORIGINAL AMORTIZATION TERM(1) | ||||||||
| Range of Original Amortization Terms (months) | Number of Mortgage Loans | Aggregate Cut- off Date Balance ($) | % of Cut-off Date Balance | |||||
Non-Amortizing | 5 | $426,210,523 | 29.7% | |||||
180 – 240 | 1 | 13,500,000 | 0.9 | |||||
241 – 300 | 18 | 154,227,623 | 10.7 | |||||
301 – 360 | 58 | 842,388,201 | 58.6 | |||||
Total: | 82 | $1,436,326,346 | 100.0% | |||||
Weighted Average(2): | 348 months | |||||||
| (1) | The original amortization term shown for any mortgage loan that is interest-only for part of its term does not include the number of months in its interest-only period and reflects only the number of months as of the commencement of amortization remaining from the end of such interest-only period. |
| (2) | Excludes the non-amortizing loans. |
| REMAINING AMORTIZATION TERM(3) | ||||||||
Range of Remaining Amortization Terms | Number of Mortgage Loans | Aggregate Cut- off Date Balance ($) | % of Cut-off Date Balance | |||||
Non-Amortizing | 5 | $426,210,523 | 29.7% | |||||
180 – 240 | 1 | 13,500,000 | 0.9 | |||||
241 – 300 | 18 | 154,227,623 | 10.7 | |||||
301 – 360 | 58 | 842,388,201 | 58.6 | |||||
Total: | 82 | $1,436,326,346 | 100.0% | |||||
Weighted Average(4): | 347 months | |||||||
| (3) | The remaining amortization term shown for any mortgage loan that is interest-only for part of its term does not include the number of months in its interest-only period and reflects only the number of months as of the commencement of amortization remaining from the end of such interest-only period. |
| (4) | Excludes the non-amortizing loans. |
| LOCKBOXES | ||||||||
| Type of Lockbox | Number of Mortgage Loans | Aggregate Cut- off Date Balance ($) | % of Cut-off Date Balance | |||||
| Hard/Springing Cash Management | 25 | $536,795,847 | 37.4% | |||||
| Soft/Springing Cash Management | 9 | 331,169,975 | 23.1 | |||||
| Hard/Upfront Cash Management | 8 | 322,998,492 | 22.5 | |||||
| None | 21 | 120,815,970 | 8.4 | |||||
| Springing (W/Out Estab. Account) | 8 | 74,725,964 | 5.2 | |||||
| Springing (With Estab. Account) | 11 | 49,820,099 | 3.5 | |||||
Total: | 82 | $1,436,326,346 | 100.0% | |||||
| PREPAYMENT PROVISION SUMMARY(5) | ||||||||
| Prepayment Provision | Number of Mortgage Loans | Aggregate Cut- off Date Balance ($) | % of Cut- off Date Balance | |||||
| Lockout/Defeasance/Open | 70 | $1,003,842,323 | 69.9% | |||||
| Lockout/YM%/Open | 11 | 389,984,023 | 27.2 | |||||
| Lockout/Defeasance or YM%/Open | 1 | 42,500,000 | 3.0 | |||||
Total: | 82 | $1,436,326,346 | 100.0% | |||||
| (5) | With respect to certain mortgage loans, prepayments may occur during a lockout period in connection with a sale of a mortgaged property and termination of any cross-collateralization to which it was subject. |
| CUT-OFF DATE LOAN-TO-VALUE RATIO | ||||||||
| Range of Cut-off Date LTV Ratios (%) | Number of Mortgage Loans | Aggregate Cut- off Date Balance ($) | % of Cut-off Date Balance | |||||
34.6 – 35.0 | 1 | $9,976,117 | 0.7% | |||||
35.1 – 40.0 | 1 | 3,090,000 | 0.2 | |||||
40.1 – 45.0 | 1 | 3,500,000 | 0.2 | |||||
45.1 – 50.0 | 1 | 2,900,000 | 0.2 | |||||
50.1 – 55.0 | 7 | 486,617,806 | 33.9 | |||||
55.1 – 60.0 | 20 | 292,861,278 | 20.4 | |||||
60.1 – 65.0 | 18 | 216,202,964 | 15.1 | |||||
65.1 – 70.0 | 21 | 146,697,235 | 10.2 | |||||
70.1 – 75.0 | 11 | 261,372,698 | 18.2 | |||||
75.1 – 76.7 | 1 | 13,108,249 | 0.9 | |||||
Total: | 82 | $1,436,326,346 | 100.0% | |||||
Weighted Average: | 61.1% | |||||||
| BALLOON OR ARD LOAN-TO-VALUE RATIO | ||||||||
Range of Balloon or ARD LTV Ratios (%) | Number of Mortgage Loans | Aggregate Cut- off Date Balance ($) | % of Cut-off Date Balance | |||||
23.7 – 25.0 | 1 | $13,500,000 | 0.9% | |||||
25.1 – 30.0 | 2 | 13,066,117 | 0.9 | |||||
30.1 – 35.0 | 1 | 3,500,000 | 0.2 | |||||
35.1 – 40.0 | 2 | 5,545,508 | 0.4 | |||||
40.1 – 45.0 | 9 | 200,631,244 | 14.0 | |||||
45.1 – 50.0 | 17 | 279,681,355 | 19.5 | |||||
50.1 – 55.0 | 27 | 423,160,357 | 29.5 | |||||
55.1 – 60.0 | 15 | 133,566,294 | 9.3 | |||||
60.1 – 65.0 | 6 | 287,042,292 | 20.0 | |||||
65.1 – 70.0 | 1 | 6,633,179 | 0.5 | |||||
70.1 – 73.0 | 1 | 70,000,000 | 4.9 | |||||
Total: | 82 | $1,436,326,346 | 100.0% | |||||
Weighted Average: | 53.7% | |||||||
| AMORTIZATION TYPE | ||||||||
| Type of Amortization | Number of Mortgage Loans | Aggregate Cut- off Date Balance ($) | % of Cut-off Date Balance | |||||
| Interest-only, Amortizing Balloon | 11 | $515,103,000 | 35.9% | |||||
| Amortizing Balloon | 65 | 481,512,823 | 33.5 | |||||
| Interest-only, Balloon | 3 | 313,410,523 | 21.8 | |||||
| Interest-only, ARD | 2 | 112,800,000 | 7.9 | |||||
| Amortizing ARD | 1 | 13,500,000 | 0.9 | |||||
Total: | 82 | $1,436,326,346 | 100.0% | |||||
ORIGINAL TERM OF INTEREST-ONLY PERIOD FOR PARTIAL IO LOANS
| IO Term (months) | Number of Mortgage Loans | Aggregate Cut- off Date Balance ($) | % of Cut-off Date Balance | |||||
1 | 1 | $4,150,000 | 0.3% | |||||
12 | 2 | 50,060,000 | 3.5 | |||||
13 – 24 | 4 | 151,393,000 | 10.5 | |||||
25 – 48 | 2 | 275,000,000 | 19.1 | |||||
49 – 60 | 2 | 34,500,000 | 2.4 | |||||
Total: | 11 | $515,103,000 | 35.9% | |||||
Weighted Average: | 31 months | |||||||
| SEASONING | ||||||||
| Seasoning (months) | Number of Mortgage Loans | Aggregate Cut- off Date Balance ($) | % of Cut-off Date Balance | |||||
0 | 15 | $73,485,000 | 5.1% | |||||
1 – 3 | 67 | 1,362,841,346 | 94.9 | |||||
Total: | 82 | $1,436,326,346 | 100.0% | |||||
Weighted Average: | 1 month | |||||||
THE INFORMATION IN THIS STRUCTURAL AND COLLATERAL TERM SHEET IS NOT COMPLETE AND MAY BE AMENDED PRIOR TO THE TIME OF SALE. THIS TERM SHEET IS NOT AN OFFER TO SELL THESE SECURITIES AND IT IS NOT A SOLICITATION OF AN OFFER TO BUY THESE SECURITIES IN ANY JURISDICTION WHERE THE OFFER OR SALE IS NOT PERMITTED.
14
| WFRBS Commercial Mortgage Trust 2013-C11 | Certain Terms and Conditions |
| V. | Certain Terms and Conditions |
| Interest Entitlements: | The interest entitlement of each Class of Offered Certificates on each Distribution Date generally will be the interest accrued during the related Interest Accrual Period on the related Certificate Principal Balance or Notional Amount at the related pass-through rate, net of any prepayment interest shortfalls allocated to that Class for such Distribution Date as described below. If prepayment interest shortfalls arise from voluntary prepayments (without special servicer consent) on non-specially serviced mortgage loans during any collection period, the Master Servicer is required to make a compensating interest payment to offset those shortfalls, generally up to an amount equal to the portion of its master servicing fees that accrue at one basis pointper annum. The remaining amount of prepayment interest shortfalls will be allocated to reduce the interest entitlement on all Classes of Certificates (other than the Class X-A and Class X-B Certificates),pro rata, based on their respective amounts of accrued interest for the related Distribution Date. If a Class receives less than the entirety of its interest entitlement on any Distribution Date, then the shortfall will be added to its interest entitlement for the next succeeding Distribution Date. Interest entitlements on the Class D, C and B Certificates, in that order, may be reduced by certain Trust Advisor expenses. | |||
| Principal Distribution Amount: | The Principal Distribution Amount for each Distribution Date generally will be the aggregate amount of principal received or advanced in respect of the mortgage loans, net of any non-recoverable advances and interest thereon that are reimbursed to the Master Servicer, the Special Servicer or the Trustee during the related collection period. Non-recoverable advances and interest thereon are reimbursable from principal collections and advances before reimbursement from other amounts. The Principal Distribution Amount may also be reduced, with a corresponding loss, to the Class D, C, B and A-S Certificates, then to the Class A-1, A-2, A-3, A-4 and A-SB Certificates (with any losses on the Class A-1, A-2, A-3, A-4 and A-SB Certificates allocatedpro rata according to their respective Certificate Principal Balances immediately prior to that Distribution Date), in that order, in connection with certain Trust Advisor expenses to the extent that interest entitlements on the Class B, C and D Certificates are insufficient to absorb the effect of the expense on any particular Distribution Date. | |||
| Distributions: | On each Distribution Date, funds available for distribution from the mortgage loans, net of specified trust fees, expenses and reimbursements will generally be distributed in the following amounts and order of priority (in each case to the extent of remaining available funds): | |||
1. | Class A-1, A-2, A-3, A-4, A-SB, X-A and X-B Certificates: To interest on the Class A-1, A-2, A-3, A-4, A-SB, X-A and X-B Certificates,pro rata, according to their respective interest entitlements. | |||
2. | Class A-1, A-2, A-3, A-4 and A-SB Certificates: To principal on the Class A-1, A-2, A-3, A-4 and A-SB Certificates in the following amounts and order of priority: (i) first, to principal on the Class A-SB Certificates, in an amount up to the Principal Distribution Amount for such Distribution Date until their Certificate Principal Balance is reduced to the Class A-SB Planned Principal Balance; (ii) second, to principal on the Class A-1 Certificates until their Certificate Principal Balance is reduced to zero, up to the remainder of the Principal Distribution Amount for such Distribution Date; (iii) third, to principal on the Class A-2 Certificates until their Certificate Principal Balance is reduced to zero, up to the remainder of the Principal Distribution Amount for such Distribution Date; (iv) fourth, to principal on the Class A-3 Certificates until their Certificate Principal Balance is reduced to zero, up to the remainder of the Principal Distribution Amount for such Distribution Date; (v) fifth, to principal on the Class A-4 Certificates until their Certificate Principal Balance is reduced to zero, up to the remainder of the Principal Distribution Amount for such Distribution Date; and (vi) sixth, to principal on the Class A-SB Certificates until their Certificate Principal Balance is reduced to zero, up to the remainder of the Principal Distribution Amount for such Distribution Date. However, if the Certificate Principal Balance of each and every Class of Principal Balance Certificates other than the Class A-1, A-2, A-3, A-4 and A-SB Certificates has been reduced to zero as a result of the allocation of Mortgage Loan losses and expenses and any of the Class A-1, A-2, A-3, A-4 and A-SB Certificates remains outstanding, then the Principal Distribution Amount will be distributed on the Class A-1, A-2, A-3, A-4 and A-SB Certificates,pro rata, based on their respective outstanding Certificate Principal Balances, until their Certificate Principal Balances have been reduced to zero. | |||
THE INFORMATION IN THIS STRUCTURAL AND COLLATERAL TERM SHEET IS NOT COMPLETE AND MAY BE AMENDED PRIOR TO THE TIME OF SALE. THIS TERM SHEET IS NOT AN OFFER TO SELL THESE SECURITIES AND IT IS NOT A SOLICITATION OF AN OFFER TO BUY THESE SECURITIES IN ANY JURISDICTION WHERE THE OFFER OR SALE IS NOT PERMITTED.
15
| WFRBS Commercial Mortgage Trust 2013-C11 | Certain Terms and Conditions |
3. | Class A-1, A-2, A-3, A-4 and A-SB Certificates: To reimburse the holders of the Class A-1, A-2, A-3, A-4 and A-SB Certificates,pro rata, for any previously unreimbursed losses (other than certain Trust Advisor expenses) on the mortgage loans that were previously allocated in reduction of the Certificate Principal Balances of such Classes. | |||
4. | Class A-S Certificates: To make distributions on the Class A-S Certificates as follows: (a) first, to interest on Class A-S Certificates in the amount of the interest entitlement for that Class; (b) next, to the extent of the portion of the Principal Distribution Amount remaining after distributions in respect of principal to each Class with a higher distribution priority (in this case, the Class A-1, A-2, A-3, A-4 and A-SB Certificates), to principal on the Class A-S Certificates until their Certificate Principal Balance is reduced to zero; and (c) next, to reimburse the holders of the Class A-S Certificates for any previously unreimbursed losses (other than certain Trust Advisor expenses) on the mortgage loans that were previously allocated to that Class in reduction of its Certificate Principal Balance. | |||
5. | Class B Certificates: To make distributions on the Class B Certificates as follows: (a) first, to interest on Class B Certificates in the amount of the interest entitlement for that Class; (b) next, to the extent of the portion of the Principal Distribution Amount remaining after distributions in respect of principal to each Class with a higher distribution priority (in this case, the Class A-1, A-2, A-3, A-4, A-SB and A-S Certificates), to principal on the Class B Certificates until their Certificate Principal Balance is reduced to zero; and (c) next, to reimburse the holders of the Class B Certificates for any previously unreimbursed losses (other than certain Trust Advisor expenses) on the mortgage loans that were previously allocated to that Class in reduction of its Certificate Principal Balance. | |||
6. | Class C Certificates: To make distributions on the Class C Certificates as follows: (a) first, to interest on Class C Certificates in the amount of the interest entitlement for that Class; (b) next, to the extent of the portion of the Principal Distribution Amount remaining after distributions in respect of principal to each Class with a higher distribution priority (in this case, the Class A-1, A-2, A-3, A-4, A-SB, A-S and B Certificates), to principal on the Class C Certificates until their Certificate Principal Balance is reduced to zero; and (c) next, to reimburse the holders of the Class C Certificates for any previously unreimbursed losses (other than certain Trust Advisor expenses) on the mortgage loans that were previously allocated to that Class in reduction of its Certificate Principal Balance. | |||
7. | After the Class A-1, A-2, A-3, A-4, A-SB, A-S, B and C Certificates are paid all amounts to which they are entitled, the remaining funds available for distribution will be used to pay interest, principal and loss reimbursement amounts (other than certain Trust Advisor expenses) on the Class D, E, F and G Certificates sequentially in that order in a manner analogous to the Class C Certificates. | |||
| Allocation of Yield Maintenance and Prepayment Premiums: | If any yield maintenance charges and prepayment premiums are collected during any particular collection period with respect to any mortgage loan, then on the distribution date corresponding to that collection period, the certificate administrator will pay a portion of the yield maintenance charges and prepayment premiums (net of liquidation fees payable therefrom) in the following manner: (1)pro rata, between the (x) the group (the “YM Group A”) of the Class A-1, A-2, A-3, A-4, A-SB, A-S and X-A Certificates, and (y) the group (the “YM Group B” and, collectively with the YM Group A, the “YM Groups”) of the Class B, C, D and X-B Certificates, based upon the aggregate amount of principal distributed to the classes of principal balance certificates in each YM Group for that distribution date, and (2) among the classes of certificates in each YM Group, in the following manner, up to an amount equal to the product of (a) the yield maintenance or prepayment premium allocated to such YM Group, (b) the related Base Interest Fraction (as defined in the Free Writing Prospectus), and (c) a fraction, which in no event may be greater than 1.0, the numerator of which is equal to the amount of principal distributed to the holder(s) of such class for that distribution date, and the denominator of which is the aggregate amount of principal distributed to all the certificates in that YM Group for that distribution date. Any yield maintenance charges or prepayment premium allocated to such YM Group remaining after such distributions will be distributed to the Class X-A and/or Class X-B Certificates, as applicable, in such YM Group. | |||
THE INFORMATION IN THIS STRUCTURAL AND COLLATERAL TERM SHEET IS NOT COMPLETE AND MAY BE AMENDED PRIOR TO THE TIME OF SALE. THIS TERM SHEET IS NOT AN OFFER TO SELL THESE SECURITIES AND IT IS NOT A SOLICITATION OF AN OFFER TO BUY THESE SECURITIES IN ANY JURISDICTION WHERE THE OFFER OR SALE IS NOT PERMITTED.
16
| WFRBS Commercial Mortgage Trust 2013-C11 | Certain Terms and Conditions |
No prepayment premiums or yield maintenance charges will be distributed to the holders of the Class E, F, G, V or R Certificates. The holders of the Class X-B Certificates will be entitled to all prepayment premiums and yield maintenance charges collected after the Class A-1, A-2, A-3, A-4, A-SB, A-S, X-A, B, C and D Certificates are retired. For a description of when prepayment premiums and yield maintenance charges are generally required on the mortgage loans, see Annex A to the Free Writing Prospectus. See also “Risk Factors –Risks Related To The Offered Certificates - Your Yield May Be Affected by Defaults, Prepayments and Other Factors” in the Free Writing Prospectus. Prepayment premiums and yield maintenance charges will be distributed on each Distribution Date only to the extent they are actually received on the mortgage loans as of the related Determination Date.
| ||
| Realized Losses: | The Certificate Principal Balances of the Class A-1, A-2, A-3, A-4, A-SB, A-S, B, C, D, E, F and G Certificates will be reduced without distribution on any Distribution Date as a write-off to the extent of any losses realized on the mortgage loans allocated to such Class on such Distribution Date. Such losses (other than certain Trust Advisor expenses) will be applied in the following order, in each case until the related Certificate Principal Balance is reduced to zero: first, to Class G; second, to Class F; third, to Class E; fourth, to Class D; fifth, to Class C; sixth, to Class B; seventh, to Class A-S; and, finally,pro rata, to Classes A-1, A-2, A-3, A-4 and A-SB based on their outstanding Certificate Principal Balances. Certain Trust Advisor expenses (if not absorbed by reductions of interest entitlements on Classes D, C and B Certificates) will be applied as write-offs in a similar manner, except that such write-offs will be applied only to the Class D, C, B, A-S, A-1, A-2, A-3, A-4 and A-SB Certificates (with any write-offs on the Class A-1, A-2, A-3, A-4 and A-SB Certificates to be allocatedpro rata according to their respective Certificate Principal Balances immediately prior to that Distribution Date). The notional amount of the Class X-A Certificates will be reduced by the amount of all losses that are allocated to the Class A-1, A-2, A-3, A-4, A-SB or A-S Certificates as write-offs in reduction of their Certificate Principal Balances. The notional amount of the Class X-B Certificates will be reduced by the amount of all losses that are allocated to the Class B or C Certificates as write-offs in reduction of their Certificate Principal Balances.
| |
| Debt Service Advances: | The Master Servicer or, if the Master Servicer fails to do so, the Trustee, will be obligated to advance delinquent debt service payments (other than balloon payments and default interest) and assumed debt service payments on the mortgage loans (including the Republic Plaza, Concord Mills and One South Wacker Drive mortgage loans, but not their relatedpari passucompanion loans, including, in the case of the One South Wacker Drive mortgage loan, whether or not such loan combination is serviced by the pooling and servicing agreement for the WFRBS 2013-C11 securitization, or the securitization of its relatedpari passucompanion loan), except to the extent they are deemed non-recoverable from collections on the related mortgage loan. In addition, if an Appraisal Reduction Amount exists for a given mortgage loan, the interest portion of any debt service advance for such mortgage loan will be reduced, which will have the effect of reducing the amount of interest available for distribution to the Certificates in reverse alphabetical order of their Class designations (except that interest payments on the Class A-1, A-2, A-3, A-4, A-SB, X-A and X-B Certificates would be affected on apari passu basis).
| |
| Servicing Advances: | The Master Servicer or, if the Master Servicer fails to do so, the Trustee, will be obligated to make servicing advances, including the payment of delinquent property taxes, insurance premiums and ground rent, except to the extent that those advances are deemed non-recoverable from collections on the related mortgage loan. After the securitization of the One South Wacker Drive companion loan, the master servicer under that securitization will have the primary obligation to make any servicing advances with respect to the One South Wacker Drive loan combination.
| |
| Appraisal Reduction Amounts: | An Appraisal Reduction Amount generally will be created in the amount, if any, by which the principal balance of a required appraisal loan (which is a mortgage loan with respect to which certain defaults, modifications or insolvency events have occurred as further described in the Free Writing Prospectus) plus other amounts overdue or advanced in connection with such mortgage loan exceeds 90% of the appraised value of the related mortgaged property plus certain escrows and reserves (including letters of credit) held with respect to the mortgage loan.
| |
A mortgage loan will cease to be a required appraisal loan when the same has ceased to be a specially serviced mortgage loan (if applicable), has been brought current for at least three consecutive months and no other circumstances exist that would cause such mortgage loan to be a required appraisal loan. |
THE INFORMATION IN THIS STRUCTURAL AND COLLATERAL TERM SHEET IS NOT COMPLETE AND MAY BE AMENDED PRIOR TO THE TIME OF SALE. THIS TERM SHEET IS NOT AN OFFER TO SELL THESE SECURITIES AND IT IS NOT A SOLICITATION OF AN OFFER TO BUY THESE SECURITIES IN ANY JURISDICTION WHERE THE OFFER OR SALE IS NOT PERMITTED.
17
| WFRBS Commercial Mortgage Trust 2013-C11 | Certain Terms and Conditions |
Appraisal Reduction Amounts will affect the amount of debt service advances on the related mortgage loan. Appraisal Reduction Amounts will also be taken into account in the determination of the identity of the Class whose majority constitutes the “majority subordinate certificateholder” and is entitled to appoint the subordinate class representative.
| ||
| Clean-Up Call and Exchange Termination: | On each Distribution Date occurring after the aggregate unpaid principal balance of the mortgage loans is reduced below 1% of the initial aggregate principal balance of the mortgage loans as of the Cut-off Date, certain specified persons will have the option to purchase all of the remaining mortgage loans (and the trust’s interest in all property acquired through exercise of remedies in respect of any mortgage loan) at the price specified in the Free Writing Prospectus. Exercise of the option will terminate the trust and retire the then-outstanding certificates.
| |
If the aggregate Certificate Principal Balances of each of the Class A-1, A-2, A-3, A-4, A-SB, A-S, B, C and D Certificates have been reduced to zero, the trust may also be terminated in connection with an exchange of all the then-outstanding certificates, for the mortgage loans and REO properties then remaining in the issuing entity, but all of the holders of those Classes of outstanding certificates would have to voluntarily participate in the exchange.
| ||
| Liquidated Loan Waterfall: | Following the liquidation of any loan or property, the net liquidation proceeds generally will be applied (after reimbursement of advances and certain trust fund expenses), first, as a recovery of accrued interest, other than delinquent interest that was not advanced as a result of Appraisal Reduction Amounts, and then as a recovery of principal until all principal has been recovered. Any liquidation proceeds remaining thereafter will be applied as a recovery of delinquent interest that was not advanced as a result of Appraisal Reduction Amounts.
| |
| Majority Subordinate Certificateholder and Subordinate Class Representative: | A subordinate class representative may be appointed by the “majority subordinate certificate-holder”, which will be the holder(s) of a majority of: (a) during a “subordinate control period”, the most subordinate class among the Class E, F and G Certificates that has a Certificate Principal Balance, as notionally reduced by any Appraisal Reduction Amounts allocable to that class, that is at least equal to 25% of its total initial principal balance and (b) during a “collective consultation period”, the most subordinate class among the Class E, F and G Certificates that has a total principal balance, without regard to Appraisal Reduction Amounts, that is at least equal to 25% of its initial Certificate Principal Balance. The majority subordinate certificateholder will have a continuing right to appoint, remove or replace the subordinate class representative in its sole discretion. This right may be exercised at any time and from time to time. See “The Pooling and Servicing Agreement—The Majority Subordinate Certificateholder and the Subordinate Class Representative” in the Free Writing Prospectus.
| |
| Control and Consultation: | The rights of various parties to replace the Special Servicer and approve or consult with respect to major actions of the Special Servicer will vary according to defined periods. A “subordinate control period” will exist as long as the Class E Certificates have a Certificate Principal Balance, net of any Appraisal Reduction Amounts allocable to that class, that is not less than 25% of the initial principal balance of that class (unless a senior consultation period is deemed to occur generally or with respect to a particular mortgage loan, pursuant to clause (ii) of the definition of “senior consultation period”). In general, during a subordinate control period, (i) the subordinate class representative will be entitled to grant or withhold approval of asset status reports prepared, and material servicing actions proposed, by the Special Servicer, and (ii) the majority subordinate certificateholder, or the subordinate class representative on its behalf (or with respect to the One South Wacker Drive loan combination after the securitization of the related companion loan, the related controlling noteholder (or its representative) under the related intercreditor agreement) will be entitled to terminate and replace the Special Servicer with or without cause, and appoint itself or another person as the successor special servicer. It will be a condition to such appointment that Fitch, KBRA and S&P confirm that the appointment would not result in a qualification, downgrade or withdrawal of any of their then-current ratings of certificates. A “collective consultation period” will exist as long as the Class E Certificates have a Certificate Principal Balance that both (i) as notionally reduced by any Appraisal Reduction Amounts allocable to that class, is less than 25% of its initial principal balance and (ii) without regard to any Appraisal Reduction Amounts allocable to that class, is 25% or more of its initial Certificate Principal Balance (unless a senior consultation period is deemed to occur generally or with respect to a particular mortgage loan, pursuant to clause (ii) of the definition of “senior consultation period”). In general, during a collective consultation period, the Special Servicer will be required to consult with each of the subordinate class representative and the Trust Advisor in connection with asset status reports and material special servicing actions. A “senior consultation period” will exist as long as either (i) the Class E certificates have an aggregate principal balance, without regard to any appraisal reduction amounts allocable to that class, that is less than 25% of its initial principal balance or (ii) during such time as the Class E certificates are the most subordinate class of |
THE INFORMATION IN THIS STRUCTURAL AND COLLATERAL TERM SHEET IS NOT COMPLETE AND MAY BE AMENDED PRIOR TO THE TIME OF SALE. THIS TERM SHEET IS NOT AN OFFER TO SELL THESE SECURITIES AND IT IS NOT A SOLICITATION OF AN OFFER TO BUY THESE SECURITIES IN ANY JURISDICTION WHERE THE OFFER OR SALE IS NOT PERMITTED.
18
| WFRBS Commercial Mortgage Trust 2013-C11 | Certain Terms and Conditions |
control-eligible certificates that have a then outstanding principal balance, net of appraisal reduction amounts, at least equal to 25% of its initial principal balance, the then majority subordinate certificateholder has irrevocably waived its right to appoint a subordinate class representative and to exercise any of the rights of the majority subordinate certificateholder or cause the exercise of the rights of the subordinate class representative and such rights have not been reinstated to a successor majority subordinate certificateholder as set forth in the pooling and servicing agreement. In general, during a senior consultation period, the Special Servicer must seek to consult with the Trust Advisor in connection with asset status reports and material special servicing actions, and, in general, no subordinate class representative will be recognized or have any right to terminate the Special Servicer or approve, direct or consult with respect to servicing matters.
Notwithstanding any contrary description set forth above, with respect to the Republic Plaza mortgage loan and the Concord Mills mortgage loan (a) the subordinate class representative under the WFRBS 2012-C10 pooling and servicing agreement (or, during a senior consultation period under the series 2012-C10 pooling and servicing agreement, the special servicer under such pooling and servicing agreement) or any subsequent holder of the relatedpari passucompanion loan or its representative will have consultation rights with respect to asset status reports and material special servicing actions involving the related loan combination, as provided for in the related intercreditor agreement and as described in the Free Writing Prospectus. Those rights will be in addition to the rights of the subordinate class representative in this transaction described above; and (b) the existence of a subordinate control period, collective consultation period or senior consultation period under the WFRBS 2013-C11 pooling and servicing agreement will not limit the consultation rights of the holder of thepari passu companion loan.
Notwithstanding any contrary description set forth above, with respect to the One South Wacker Drive mortgage loan, in general (a) for as long as the One South Wacker Drive loan combination is serviced under the pooling and servicing agreement for this securitization, the initial holder of the relatedpari passu companion loan will have control rights that include the right to approve or disapprove various material servicing actions involving the loan combination and the subordinate class representative for this securitization will have the right to be consulted on a non-binding basis with respect to such actions, and (b) in connection with the securitization of the One South Wacker Drivepari passu companion loan, after which the One South Wacker Drive loan combination will be serviced under the pooling and servicing agreement for such other securitization, such pooling and servicing agreement may grant to a subordinate or controlling class representative or other third party control rights that include the right to approve or disapprove various material servicing actions involving the loan combination but the subordinate class representative for this securitization will nonetheless have the right to be consulted on a non-binding basis with respect to such actions. For purposes of the servicing of the One South Wacker Drive loan combination, the occurrence and continuance of a collective consultation period or senior consultation period with respect to the subordinate class representative under this securitization will not limit the control or other rights of the initial holder of the One South Wacker Drivepari passu companion loan or of a subordinate or controlling class representative or other third party under any securitization thereof, and any collective consultation period or senior consultation period or similar period under that other securitization will not limit the consultation rights of the subordinate class representative under this securitization. The Trust Advisor in this securitization will have no duties with respect to the One South Wacker Drive loan combination but a trust advisor may be appointed under the securitization of the relatedpari passu companion loan.
In general, loan combination control rights also include the right to replace the special servicer for the related loan combination only.
| ||
| Replacement of Special Servicer by General Vote of Certificateholders: | During any “collective consultation period” or “senior consultation period”, the Special Servicer may be terminated and replaced upon the affirmative direction of certificate owners holding not less than 75% of the appraisal-reduced voting rights of all certificates, following a proposal from certificate owners holding not less than 25% of the appraisal-reduced voting rights of all certificates. The certificateholders who initiate a vote on a termination and replacement of the Special Servicer without cause must cause Fitch, KBRA and S&P to confirm the then-current ratings of the certificates (or decline to review the matter) and cause the payment of the fees and expenses incurred in the replacement.
| |
| Appraisal Remedy: | Solely for purposes of determining whether a “subordinate control period” is in effect, whenever the Special Servicer obtains an appraisal or updated appraisal under the pooling and servicing agreement, the subordinate class representative, with respect to the mortgage loans (other than the One South Wacker Drive mortgage loan after the securitization of itspari passu companion loan) will have the right (at its expense) to direct the Special Servicer to hire a qualified appraiser to prepare a second appraisal of the mortgaged property. The Special Servicer must thereafter |
THE INFORMATION IN THIS STRUCTURAL AND COLLATERAL TERM SHEET IS NOT COMPLETE AND MAY BE AMENDED PRIOR TO THE TIME OF SALE. THIS TERM SHEET IS NOT AN OFFER TO SELL THESE SECURITIES AND IT IS NOT A SOLICITATION OF AN OFFER TO BUY THESE SECURITIES IN ANY JURISDICTION WHERE THE OFFER OR SALE IS NOT PERMITTED.
19
| WFRBS Commercial Mortgage Trust 2013-C11 | Certain Terms and Conditions |
determine whether, based on its assessment of such second appraisal, any recalculation of the Appraisal Reduction Amount is warranted. The Appraisal Reduction Amount, whether based on the first or the second appraisal, will become effective following the second appraisal, except that the Appraisal Reduction Amount based on the first appraisal shall become effective if the subordinate class representative declines to demand a second appraisal within a specified number of business days, or if a second appraisal is not received within 90 days after the direction of the subordinate class representative. In addition, for the same purposes, if there is a material change in the mortgaged property securing any mortgage loan for which an Appraisal Reduction Amount has been calculated, the majority certificateholder of the Class E, F or G Certificates or other designed certificate holders will be entitled (at its expense) to present an additional appraisal to the Special Servicer, which will generally be required to recalculate the Appraisal Reduction Amount based upon such additional appraisal. This latter right may not be exercised more frequently than once in any 12-month period for each mortgage loan for which an Appraisal Reduction Amount was calculated and can only be exercised during a subordinate control period or a collective consultation period as further described in the Free Writing Prospectus. | ||
| Sale of Defaulted Assets: | There will be no “fair value” purchase option. Instead, the pooling and servicing agreement will authorize the Special Servicer to sell defaulted mortgage loans (other than the One South Wacker Drive mortgage loan after the securitization of itspari passucompanion loan) to the highest bidder in a manner generally similar to sales of REO properties. The sale of a defaulted loan (other than the One South Wacker Drive mortgage loan after the securitization of itspari passucompanion loan) for less than par plus accrued interest and certain other fees and expenses owed on the loan will be subject to consent or consultation rights of the subordinate class representative and/or Trust Advisor, as described in the Free Writing Prospectus. In the case of the One South Wacker Drive mortgage loan, the sale will be subject to the consent and/or consultation rights of the holder of the relatedpari passucompanion loan, as described in the Free Writing Prospectus. After the securitization of the One South Wacker Drivepari passucompanion loan, pursuant to its intercreditor agreement, the party acting as special servicer of such mortgage loan pursuant to the pooling and servicing agreement of such other securitization, may offer to sell to any person (or may offer to purchase) for cash the One South Wacker Drive loan combination during such time as such mortgage loan constitutes a defaulted mortgage loan under such other pooling and servicing agreement, and, in connection with any such sale, the applicable special servicer is required to sell both the One South Wacker Drive mortgage loan and relatedpari passucompanion loan as a whole loan. The subordinate class representative will have consultation rights as the holder of an interest in the One South Wacker Drive mortgage loan, as described in the Free Writing Prospectus. | |
| “As-Is” Appraisals: | Appraisals must be conducted on an “as-is” basis, and must be no more than 9 months old, for purposes of determining Appraisal Reduction Amounts, market value in connection with REO sales, etc. Required appraisals may consist of updates of prior appraisals. Internal valuations by the Special Servicer are permitted if the principal balance of a mortgage loan is less than $2,000,000. | |
| Trust Advisor: | The Trust Advisor will perform certain review duties that will generally include a limited annual review of and report regarding the Special Servicer to the Certificate Administrator. The review and report generally will be based on: (a) during a collective consultation period or senior consultation period, any asset status reports and additional information delivered to the Trust Advisor by the Special Servicer with respect to any mortgage loan (other than the One South Wacker Drive mortgage loan andpari passucompanion loan), and/or (b) during a senior consultation period, in addition to the applicable information described above, a meeting with the Special Servicer to conduct a limited review of the Special Servicer’s operational practices on a platform basis in light of the servicing standard. In addition, during any collective consultation period or senior consultation period, the Special Servicer must seek to consult with the Trust Advisor (in addition to the subordinate class representative during a collective consultation period) in connection with material special servicing actions with respect to specially serviced mortgage loans (other than the One South Wacker Drive mortgage loan andpari passucompanion loan). Furthermore, under certain circumstances, but only during a senior consultation period, the Trust Advisor may recommend the replacement of the Special Servicer, in which case the Certificate Administrator will deliver notice of such recommendation to the certificateholders, and certificateholders with specified percentages of the voting rights may direct the replacement of the Special Servicer at their expense.
Notwithstanding any contrary provision described above, the Trust Advisor will have no rights or duties in connection with the One South Wacker Drive mortgage loan.
The Trust Advisor may be removed and replaced without cause upon the affirmative direction of certificates owners holding not less than 75% of the appraisal-reduced voting rights of all certificates, following a proposal from certificate owners holding not less than 25% of the | |
THE INFORMATION IN THIS STRUCTURAL AND COLLATERAL TERM SHEET IS NOT COMPLETE AND MAY BE AMENDED PRIOR TO THE TIME OF SALE. THIS TERM SHEET IS NOT AN OFFER TO SELL THESE SECURITIES AND IT IS NOT A SOLICITATION OF AN OFFER TO BUY THESE SECURITIES IN ANY JURISDICTION WHERE THE OFFER OR SALE IS NOT PERMITTED.
20
| WFRBS Commercial Mortgage Trust 2013-C11 | Certain Terms and Conditions |
appraisal-reduced voting rights of all certificates. The certificateholders who initiate a vote on a termination and replacement of the Trust Advisor without cause must cause Fitch, KBRA and S&P to confirm the then-current ratings of the certificates (or decline to review the matter) and cause the payment of the fees and expenses incurred in the replacement. During any “subordinate control period”, the proposed replacement trust advisor will be subject to the subordinate class representative’s consent (such consent not to be unreasonably withheld). If a proposed termination and replacement of the Trust Advisor is not consummated within 180 days following the initial request of the certificateholders who requested a vote, the proposed termination and replacement shall have no further force or effect. The Trust Advisor generally may be discharged from its duties if and when the Class A-1, A-2, A-3, A-4, A-SB, A-S, B, C and D Certificates are retired. | ||
| Certain Fee Offsets: | If a workout fee is earned by the Special Servicer following a loan default, then certain limitations will apply to the collection and retention of a modification fee from the borrower. The modification fee generally must not exceed 1% of the principal balance of the loan as modified. In addition, if the loan re-defaults within a specified period of months and other conditions are satisfied, any subsequent workout or liquidation fee on that loan must be reduced by a portion of the previously-collected modification fee. | |
| Deal Website: | The Certificate Administrator will be required to maintain a deal website which will include, among other items: (a) summaries of asset status reports prepared by the Special Servicer, (b) inspection reports, (c) appraisals, (d) various “special notices” described in the Free Writing Prospectus, (e) the “Investor Q&A Forum” and (f) a voluntary “Investor Registry”. Investors may access the deal website following execution of a certification and confidentiality agreement. | |
| Initial Majority Subordinate Certificateholder: | It is expected that Eightfold Real Estate Capital Fund II, L.P. or an affiliate will be the initial majority subordinate certificateholder. | |
| Loan Combinations: | Each of the mortgaged properties identified on Annex A to the Free Writing Prospectus as Republic Plaza, Concord Mills and One South Wacker Drive secures both a mortgage note to be included in the trust and one other mortgage note, referred to as a “pari passucompanion loan” that will not be included in the trust, which will bepari passuin right of payment with the mortgage note to be included in the trust. Each pair of mortgage notes is referred to herein as a “loan combination.” The Republic Plaza loan combination, the Concord Mills loan combination and, prior to the securitization of the One South Wacker Drivepari passucompanion loan, the One South Wacker Drive loan combination will be serviced under the WFRBS 2013-C11 pooling and servicing agreement. After the securitization of the One South Wacker Drivepari passucompanion loan, the One South Wacker Drive loan combination will be serviced under the pooling and servicing agreement related to the securitization of itspari passucompanion loan.
As of the closing date, the One South Wacker Drivepari passucompanion loan will be held by its related mortgage loan seller, which will reserve the right to sell suchpari passucompanion loan subject to the related intercreditor agreement. | |
THE INFORMATION IN THIS STRUCTURAL AND COLLATERAL TERM SHEET IS NOT COMPLETE AND MAY BE AMENDED PRIOR TO THE TIME OF SALE. THIS TERM SHEET IS NOT AN OFFER TO SELL THESE SECURITIES AND IT IS NOT A SOLICITATION OF AN OFFER TO BUY THESE SECURITIES IN ANY JURISDICTION WHERE THE OFFER OR SALE IS NOT PERMITTED.
21
REPUBLIC PLAZA

THE INFORMATION IN THIS STRUCTURAL AND COLLATERAL TERM SHEET IS NOT COMPLETE AND MAY BE AMENDED PRIOR TO THE TIME OF SALE. THIS TERM SHEET IS NOT AN OFFER TO SELL THESE SECURITIES AND IT IS NOT A SOLICITATION OF AN OFFER TO BUY THESE SECURITIES IN ANY JURISDICTION WHERE THE OFFER OR SALE IS NOT PERMITTED.
22
REPUBLIC PLAZA
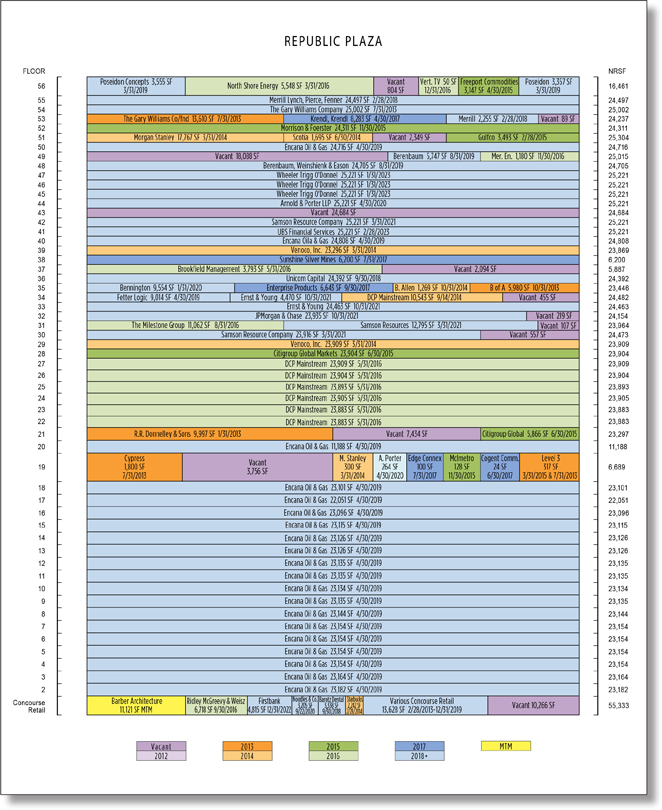
THE INFORMATION IN THIS STRUCTURAL AND COLLATERAL TERM SHEET IS NOT COMPLETE AND MAY BE AMENDED PRIOR TO THE TIME OF SALE. THIS TERM SHEET IS NOT AN OFFER TO SELL THESE SECURITIES AND IT IS NOT A SOLICITATION OF AN OFFER TO BUY THESE SECURITIES IN ANY JURISDICTION WHERE THE OFFER OR SALE IS NOT PERMITTED.
23
REPUBLIC PLAZA
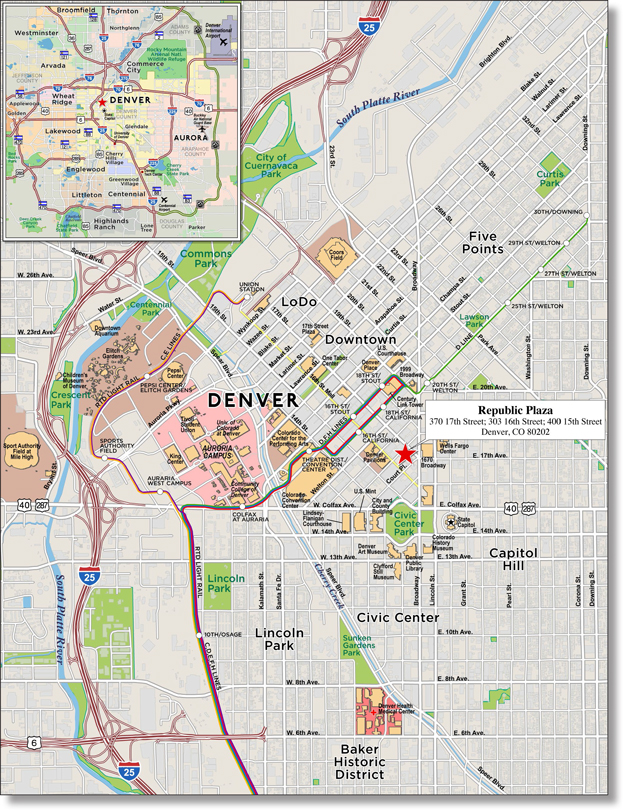
THE INFORMATION IN THIS STRUCTURAL AND COLLATERAL TERM SHEET IS NOT COMPLETE AND MAY BE AMENDED PRIOR TO THE TIME OF SALE. THIS TERM SHEET IS NOT AN OFFER TO SELL THESE SECURITIES AND IT IS NOT A SOLICITATION OF AN OFFER TO BUY THESE SECURITIES IN ANY JURISDICTION WHERE THE OFFER OR SALE IS NOT PERMITTED.
24
No. 1 - Republic Plaza
| Loan Information | ||
| Mortgage Loan Seller: | Wells Fargo Bank, National Association | |
Credit Assessment (Fitch/KBRA/S&P): | NR/NR/NR | |
| Original Principal Balance(1): | $155,000,000 | |
| Cut-off Date Principal Balance(1): | $155,000,000 | |
| % of Initial Pool Balance: | 10.8% | |
| Loan Purpose: | Refinance | |
| Borrower Name: | BOP Republic Plaza I LLC; BOP Republic Plaza II LLC | |
| Sponsor: | Brookfield Office Properties Inc. | |
| Mortgage Rate: | 4.240% | |
| Note Date: | November 2, 2012 | |
| Anticipated Repayment Date: | NAP | |
| Maturity Date: | December 1, 2022 | |
| IO Period: | 36 months | |
| Loan Term (Original): | 120 months | |
| Seasoning: | 2 months | |
| Amortization Term (Original): | 360 months | |
| Loan Amortization Type: | Interest-only, Amortizing Balloon | |
| Interest Accrual Method: | Actual/360 | |
| Call Protection: | L(26),D(90),O(4) | |
| Lockbox Type: | Hard/Upfront Cash Management | |
| Additional Debt(1): | Yes | |
| Additional Debt Type(1): | Pari Passu | |
| Escrows and Reserves(2): | ||
Type: | Initial | Monthly | Cap (If Any) | |||||||||
Taxes | $ | 3,495,886 | $ | 499,412 | NAP | |||||||
Insurance | $ | 0 | Springing | NAP | ||||||||
Replacement Reserves | $ | 27,217 | $ | 27,217 | NAP | |||||||
Deferred Maintenance(3) | $ | 74,688 | $ | 0 | NAP | |||||||
TI/LC(3) | $ | 0 | $ | 140,000 | $ | 5,000,000 | ||||||
Tenants Specific TI/LC Reserve(3) | $ | 2,358,462 | $ | 0 | NAP | |||||||
Free Rent Reserve(3) | $ | 238,060 | $ | 0 | NAP | |||||||
| Property Information | ||
| Single Asset/Portfolio: | Single Asset | |
| Property Type(3): | Office | |
| Specific Property Type: | CBD | |
| Location: | Denver, CO | |
| Size: | 1,302,107 SF | |
Cut-off Date Principal Balance Per Unit/SF(1): | $215.04 | |
| Year Built/Renovated: | 1982/2002 | |
| Title Vesting: | Fee | |
| Property Manager: | Self-managed | |
| 3rdMost Recent Occupancy (As of): | 94.3% (12/31/2009) | |
| 2nd Most Recent Occupancy (As of): | 94.2% (12/31/2010) | |
| Most Recent Occupancy (As of): | 92.1% (12/31/2011) | |
| Current Occupancy (As of): | 94.5% (9/30/2012) | |
| Underwriting and Financial Information: | ||
| 3rdMost Recent NOI (As of): | $24,754,363 (12/31/2010) | |
| 2ndMost Recent NOI (As of): | $24,258,113 (12/31/2011) | |
| Most Recent NOI (As of): | $25,132,202 (TTM 6/30/2012) | |
| U/W Revenues: | $43,855,093 | |
| U/W Expenses: | $16,311,223 | |
| U/W NOI: | $27,543,870 | |
| U/W NCF: | $25,543,693 | |
| U/W NOI DSCR(1): | 1.67x | |
| U/W NCF DSCR(1): | 1.55x | |
| U/W NOI Debt Yield(1): | 9.8% | |
| U/W NCF Debt Yield(1): | 9.1% | |
| As-Is Appraised Value: | $535,400,000 | |
| As-Is Appraisal Valuation Date: | October 8, 2012 | |
| Cut-off Date LTV Ratio(1): | 52.3% | |
| LTV Ratio at Maturity or ARD(1): | 45.5% | |
| (1) | The Republic Plaza Loan Combination, totalling $280,000,000, is comprised of twopari passu notes (Notes A-1 and A-2). Note A-2 had an original balance of $155,000,000, has an outstanding principal balance as of the Cut-off Date of $155,000,000 and will be contributed to the WFRBS 2013-C11 Trust. Note A-1 had an original balance of $125,000,000 and was contributed to the WFRBS 2012-C10 Trust. All presented statistical information related to balances per square foot, loan-to-value ratios, debt service coverage ratios, and debt yields are based on the Republic Plaza Loan Combination. |
| (2) | See “Escrows” section. |
| (3) | In lieu of escrow deposits, the Republic Plaza Loan Combination sponsor posted a guaranty for all of the following: outstanding tenant improvements and leasing commissions, monthly tenant improvement and leasing commissions escrow deposits, a deferred maintenance deposit and outstanding free rent. See “Sponsor’s Reserves Guaranty” section. |
| (4) | The collateral for the Republic Plaza Loan Combination also includes a non-contiguous 12-story parking garage with approximately 1,275 stalls located one block from the Republic Plaza property. |
The Mortgage Loan. The mortgage loan (the “Republic Plaza Loan Combination”) is evidenced by twopari passupromissory notes (Note A-1 and Note A-2) that are secured by a first mortgage encumbering a 56-story office building and a non-contiguous 12-story parking garage structure located in Denver, Colorado (the “Republic Plaza Property”). The Republic Plaza Loan Combination was originated on November 2, 2012 by Wells Fargo Bank, National Association. The Republic Plaza Loan Combination had an original balance of $280,000,000, has a Cut-off Date Balance of $280,000,000 and accrues interest at an interest rate of 4.240% per annum. The Republic Plaza Loan Combination had an initial term of 120 months, has a remaining term of 118 months as of the Cut-off Date and requires interest-only payments for the first 36 months following origination and thereafter requires payments of principal and interest based on a 30-year amortization schedule. The Republic Plaza Loan Combination matures on December 1, 2022.
THE INFORMATION IN THIS STRUCTURAL AND COLLATERAL TERM SHEET IS NOT COMPLETE AND MAY BE AMENDED PRIOR TO THE TIME OF SALE. THIS TERM SHEET IS NOT AN OFFER TO SELL THESE SECURITIES AND IT IS NOT A SOLICITATION OF AN OFFER TO BUY THESE SECURITIES IN ANY JURISDICTION WHERE THE OFFER OR SALE IS NOT PERMITTED.
25
REPUBLIC PLAZA
Note A-2, which represents the controlling interest in the Republic Plaza Loan Combination and will be contributed to the WFRBS 2013-C11 Trust, had an original principal balance of $155,000,000 and has an outstanding principal balance as of the Cut-off Date of $155,000,000 (the “Republic Plaza Mortgage Loan”). Note A-1 had an original principal balance of $125,000,000 and was contributed to the WFRBS 2012-C10 Trust (the “Republic Plaza Companion Loan”). See “Description of the Mortgage Pool – Additional Indebtedness – The Loan Combinations – The Republic Plaza Loan Combination” and “The Pooling and Servicing Agreement - Servicing of the Loan Combinations” in the Free Writing Prospectus.
Following the lockout period, the borrower has the right to defease the Republic Plaza Loan Combination in whole, or in part, on any due date before the scheduled maturity date. In addition, the Republic Plaza Loan Combination is prepayable without penalty on or after September 1, 2022.
Sources and Uses
Sources | Uses | |||||||||||||||||
Original loan combination amount | $ | 280,000,000 | 100.0 | % | Loan payoff(1) | $ | 162,714,963 | 58.1 | % | |||||||||
| Reserves | 3,529,103 | 1.3 | ||||||||||||||||
| Closing costs | 1,556,156 | 0.6 | ||||||||||||||||
| Return of equity | 112,199,778 | 40.0 | ||||||||||||||||
|
|
|
|
|
|
|
| |||||||||||
Total Sources | $ | 280,000,000 | 100.0 | % | Total Uses | $ | 280,000,000 | 100.0 | % | |||||||||
|
|
|
|
|
|
|
| |||||||||||
| (1) | The Republic Plaza Property was previously securitized in JPMCC 2004-C2. |
The Property. The Republic Plaza Property is a 56-story class A office building containing approximately 1,302,107 of rentable square feet (the “Office Building”) and a non-contiguous 12-story parking garage (the “Tremont Garage”) located one block southwest of the Office Building all located in the central business district of Denver, Colorado. Built in 1982, the Office Building is the tallest building in Denver and is situated on a 2.3-acre parcel. The Tremont Garage provides approximately 1,275 parking spaces and was also built in 1982. Additional parking is provided by a subterranean parking structure at the Office Building, which accounts for approximately 206 spaces and a combined parking ratio of 1.1 spaces per 1,000 square feet of rentable area. The Republic Plaza Property serves as the United States headquarters for Encana Oil & Gas, DCP Midstream, LP and Wheeler Trigg O’Donnell LLP. Tenancy also includes several wealth management divisions for financial institutions such as Merrill Lynch, Citigroup, Bank of America, Morgan Stanley and UBS. As of September 30, 2012, the Republic Plaza Property was 94.5% leased to 58 tenants.
THE INFORMATION IN THIS STRUCTURAL AND COLLATERAL TERM SHEET IS NOT COMPLETE AND MAY BE AMENDED PRIOR TO THE TIME OF SALE. THIS TERM SHEET IS NOT AN OFFER TO SELL THESE SECURITIES AND IT IS NOT A SOLICITATION OF AN OFFER TO BUY THESE SECURITIES IN ANY JURISDICTION WHERE THE OFFER OR SALE IS NOT PERMITTED.
26
REPUBLIC PLAZA
The following table presents certain information relating to the tenancies at the Republic Plaza Property:
Major Tenants
Tenant Name | Credit Rating | Tenant NRSF | % of NRSF | Annual U/W Base Rent PSF | Annual U/W Base Rent | % of Total Annual U/W Base Rent | Lease Expiration Date | |||||||||||||||||||
Major Tenants | ||||||||||||||||||||||||||
Encana Oil & Gas(2) | NR/Baa2/BBB | 452,972 | 34.8 | % | $ | 20.55 | $ | 9,308,575 | (3) | 36.0 | % | 4/30/2019 | (4)(5) | |||||||||||||
DCP Midstream, LP(6) | BBB-/NR/BBB- | 153,983 | 11.8 | % | $ | 24.06 | $ | 3,704,405 | 14.3 | % | 5/31/2016 | (7)(8) | ||||||||||||||
Wheeler Trigg O’Donnell LLP | NR/NR/NR | 77,264 | 5.9 | % | $ | 20.61 | $ | 1,592,420 | 6.2 | % | 1/31/2023 | (9) | ||||||||||||||
Venoco, Inc. | NR/NR/NR | 47,205 | 3.6 | % | $ | 22.85 | $ | 1,078,799 | 4.2 | % | 3/31/2014 | |||||||||||||||
Samson Resources | NR/NR/NR | 61,932 | 4.8 | % | $ | 17.17 | $ | 1,063,466 | 4.1 | % | 3/31/2021 | (10) | ||||||||||||||
The Gary Williams Company | NR/NR/NR | 38,612 | 3.0 | % | $ | 20.13 | $ | 777,230 | 3.0 | % | 7/31/2013 | |||||||||||||||
Merrill Lynch | A/Baa2/A- | 26,752 | 2.1 | % | $ | 24.00 | $ | 642,048 | 2.5 | % | 2/28/2018 | |||||||||||||||
Citigroup Global Markets | A/Baa2/A- | 29,770 | 2.3 | % | $ | 20.03 | $ | 596,293 | (11) | 2.3 | % | 6/30/2015 | (12) | |||||||||||||
|
|
|
|
|
|
|
| |||||||||||||||||||
Total Major Tenants | 888,490 | 68.2 | % | $ | 21.12 | $ | 18,763,235 | 72.6 | % | |||||||||||||||||
Non-Major Tenants | 342,507 | 26.3 | % | $ | 20.65 | $ | 7,072,674 | 24.4 | % | |||||||||||||||||
|
|
|
|
|
|
|
| |||||||||||||||||||
Occupied Collateral Total | 1,230,997 | 94.5 | % | $ | 20.99 | $ | 25,835,908 | 100.0 | % | |||||||||||||||||
|
|
|
| |||||||||||||||||||||||
Vacant Space | 71,110 | 5.5 | % | |||||||||||||||||||||||
|
|
|
| |||||||||||||||||||||||
Collateral Total | 1,302,107 | 100.0 | % | |||||||||||||||||||||||
|
|
|
| |||||||||||||||||||||||
| (1) | Certain ratings are those of the parent company whether or not the parent guarantees the lease. |
| (2) | Encana Corporation, the parent company of Encana Oil & Gas, is a North American energy company focusing on natural gas, oil and natural gas liquids. Encana Oil & Gas is the American exploration and production subsidiary of Encana Corporation. |
| (3) | The Annual U/W Base Rent was derived by averaging the annual rent including contractual rental increases through the lease term and assuming no surrender of floors described below. The current in-place rent is $17.50 per square foot, resulting in $7,927,010 of annual base rent. |
| (4) | On or after February 1, 2013, Encana Oil & Gas (“Encana”) has a one-time right to surrender one or two full floors with 12 months notice provided (i) the tenant is not subleasing more than 20% of leased square footage; (ii) the surrendered floors are on floor 18 or higher; and (iii) Encana will pay an amount equal to six months of rent for surrendered spaces plus the unamortized cost of the landlord concessions as outlined in the lease agreement. |
| (5) | Encana Oil & Gas has two, five-year lease extension options remaining. If Encana does not renew its lease for 452,927 square feet for a term of no less than five years from the lease expiration date, or replacement lease(s) approved by the lender are not signed prior to June 30, 2017, the Republic Plaza sponsor is required to post an escrow, letter of credit or a guaranty for $18,118,880 less any actual tenant improvements and leasing costs in connection with a replacement lease(s) or a renewed Encana lease for a portion of the 452,297 square feet. |
| (6) | DCP Midstream, LP is the second-largest natural gas gatherer and processor, the largest natural gas liquids producer, and one of the largest marketers of natural gas and natural gas by-products in the United States. They are headquartered at the Republic Plaza Property. |
| (7) | DCP Midstream, LP has a lease extension option remaining that may be exercised as two, five-year extension options or one extension option of more than five years. 10,543 square feet expires on September 14, 2014. |
| (8) | DCP Midstream, LP may terminate its lease with respect to 10,543 square feet if the tenant renews its lease or expands on the 21st floor. |
| (9) | Prior to January 31, 2019, the tenant has a one-time right to terminate its lease for one floor (25,221 square feet) of its leased space on either the highest or lowest floor occupied by the tenant. The tenant must provide notice of contraction no later than December 31, 2017. The tenant must also pay a termination fee equal to $48.19 per square foot of the contracted space and all related unamortized tenant improvements and leasing commissions. |
| (10) | Samson Resources may terminate its lease any time after March 31, 2017 so as long as it is not in default under the terms of its lease and not subleasing more than 50% of its leased square footage. |
| (11) | The Annual U/W Base Rent was derived by averaging the annual rent including contractual rental increases through the lease term. The current in-place rent is $18.50 per square foot, resulting in $550,745 of annual base rent. |
| (12) | Citigroup Global Markets has the right to terminate their lease with respect to 5,866 square feet after December 31, 2013. |
THE INFORMATION IN THIS STRUCTURAL AND COLLATERAL TERM SHEET IS NOT COMPLETE AND MAY BE AMENDED PRIOR TO THE TIME OF SALE. THIS TERM SHEET IS NOT AN OFFER TO SELL THESE SECURITIES AND IT IS NOT A SOLICITATION OF AN OFFER TO BUY THESE SECURITIES IN ANY JURISDICTION WHERE THE OFFER OR SALE IS NOT PERMITTED.
27
REPUBLIC PLAZA
The following table presents certain information relating to the lease rollover schedule at the Republic Plaza Property:
Lease Expiration Schedule(1)(2)
Year Ending | No. of Leases Expiring | Expiring NRSF | % of Total NRSF | Cumulative Expiring NRSF | Cumulative % of Total NRSF | Annual U/W Base Rent | % of Annual U/W Base Rent | Annual U/W Base Rent PSF(3) | ||||||||||||||||||||||
MTM | 1 | 11,121 | 0.9 | % | 11,121 | 0.9 | % | $ | 155,694 | 0.6 | % | $ | 14.00 | |||||||||||||||||
2013 | 20 | 62,740 | 4.8 | % | 73,861 | 5.7 | % | $ | 1,338,160 | 5.2 | % | $ | 21.33 | |||||||||||||||||
2014 | 13 | 81,845 | 6.3 | % | 155,706 | 12.0 | % | $ | 1,758,307 | 6.8 | % | $ | 21.48 | |||||||||||||||||
2015 | 12 | 63,465 | 4.9 | % | 219,171 | 16.8 | % | $ | 1,355,588 | 5.2 | % | $ | 21.36 | |||||||||||||||||
2016 | 17 | 173,324 | 13.3 | % | 392,495 | 30.1 | % | $ | 4,121,196 | 16.0 | % | $ | 23.78 | |||||||||||||||||
2017 | 6 | 22,230 | 1.7 | % | 414,725 | 31.9 | % | $ | 452,425 | 1.8 | % | $ | 20.35 | |||||||||||||||||
2018 | 11 | 54,538 | 4.2 | % | 469,263 | 36.0 | % | $ | 1,142,484 | 4.4 | % | $ | 20.95 | |||||||||||||||||
2019 | 28 | 501,315 | 38.5 | % | 970,578 | 74.5 | % | $ | 10,207,506 | 39.5 | % | $ | 20.36 | |||||||||||||||||
2020 | 7 | 38,286 | 2.9 | % | 1,008,864 | 77.5 | % | $ | 881,196 | 3.4 | % | $ | 23.02 | |||||||||||||||||
2021 | 13 | 114,800 | 8.8 | % | 1,123,664 | 86.3 | % | $ | 2,159,058 | 8.4 | % | $ | 18.81 | |||||||||||||||||
2022 | 3 | 4,848 | 0.4 | % | 1,128,512 | 86.7 | % | $ | 117,012 | 0.5 | % | $ | 24.14 | |||||||||||||||||
2023 | 5 | 102,485 | 7.9 | % | 1,230,997 | 94.5 | % | $ | 2,147,282 | 8.3 | % | $ | 20.95 | |||||||||||||||||
Thereafter | 0 | 0 | 0.0 | % | 1,230,997 | 94.5 | % | $ | 0 | 0.0 | % | $ | 0.00 | |||||||||||||||||
Vacant | 0 | 71,110 | 5.5 | % | 1,302,107 | 100.0 | % | $ | 0 | 0.0 | % | $ | 0.00 | |||||||||||||||||
|
|
|
|
|
|
|
|
|
|
| ||||||||||||||||||||
Total/Weighted Average | 136 | 1,302,107 | 100.0 | % | $ | 25,835,908 | 100.0 | % | $ | 20.99 | ||||||||||||||||||||
|
|
|
|
|
|
|
|
|
|
| ||||||||||||||||||||
| (1) | Information obtained from the underwritten rent roll. |
| (2) | Certain tenants may have lease termination options that are exercisable prior to the stated expiration date of the subject lease and that are not considered in the Lease Expiration Schedule. |
| (3) | Weighted Average Annual U/W Base Rent PSF excludes vacant space. |
The following table presents historical occupancy percentages at the Republic Plaza Property:
Historical Occupancy(1)
12/31/2007 | 12/31/2008 | 12/31/2009 | 12/31/2010 | 12/31/2011 | 12/31/2012 | |||||
98% | 98% | 94% | 94% | 92% | 95% |
| (1) | Information obtained from borrower rent rolls. |
Historical Average Base Rent (PSF)(1)
12/31/2009 | 12/31/2010 | 12/31/2011 | 12/31/2012 | |||
$18.59 | $18.27 | $19.09 | $19.16 |
| (1) | Information obtained from borrower operating statements. |
THE INFORMATION IN THIS STRUCTURAL AND COLLATERAL TERM SHEET IS NOT COMPLETE AND MAY BE AMENDED PRIOR TO THE TIME OF SALE. THIS TERM SHEET IS NOT AN OFFER TO SELL THESE SECURITIES AND IT IS NOT A SOLICITATION OF AN OFFER TO BUY THESE SECURITIES IN ANY JURISDICTION WHERE THE OFFER OR SALE IS NOT PERMITTED.
28
REPUBLIC PLAZA
Operating History and Underwritten Net Cash Flow.The following table presents certain information relating to the historical operating performance and the Underwritten Net Cash Flow at the Republic Plaza Property:
Cash Flow Analysis
| 2010 | 2011 | TTM 6/30/2012 | U/W(1) | U/W $ per SF | ||||||||||||||||
Base Rent | $ | 22,407,289 | $ | 22,898,843 | $ | 23,604,219 | $ | 25,835,908 | $ | 19.84 | ||||||||||
Grossed Up Vacant Space | 0 | 0 | 0 | 1,563,230 | 1.20 | |||||||||||||||
Total Reimbursables | 14,724,359 | 14,633,467 | 14,478,856 | 15,515,162 | 11.92 | |||||||||||||||
Other Income | 3,661,351 | 3,049,725 | 3,132,723 | 3,132,723 | 2.41 | |||||||||||||||
Less Vacancy & Credit Loss | 0 | 0 | 0 | (2,191,931 | )(2) | (1.68 | ) | |||||||||||||
|
|
|
|
|
|
|
|
|
| |||||||||||
Effective Gross Income | $ | 40,793,000 | $ | 40,582,035 | $ | 41,215,798 | $ | 43,855,093 | $ | 33.68 | ||||||||||
Total Operating Expenses | $ | 16,038,637 | $ | 16,323,922 | $ | 16,083,596 | $ | 16,311,223 | $ | 12.53 | ||||||||||
|
|
|
|
|
|
|
|
|
| |||||||||||
Net Operating Income | $ | 24,754,363 | $ | 24,258,113 | $ | 25,132,202 | $ | 27,543,870 | $ | 21.15 | ||||||||||
TI/LC | 0 | 0 | 0 | 1,739,755 | 1.34 | |||||||||||||||
Capital Expenditures | 0 | 0 | 0 | 260,421 | 0.20 | |||||||||||||||
|
|
|
|
|
|
|
|
|
| |||||||||||
Net Cash Flow | $ | 24,754,363 | $ | 24,258,113 | $ | 25,132,202 | $ | 25,543,693 | $ | 19.62 | ||||||||||
NOI DSCR(3) | 1.50x | 1.47x | 1.52x | 1.67x | ||||||||||||||||
NCF DSCR(3) | 1.50x | 1.47x | 1.52x | 1.55x | ||||||||||||||||
NOI DY(3) | 8.8 | % | 8.7 | % | 9.0 | % | 9.8 | % | ||||||||||||
NCF DY(3) | 8.8 | % | 8.7 | % | 9.0 | % | 9.1 | % | ||||||||||||
| (1) | The increase in U/W Net Operating Income from the Net Operating Income for trailing 12 months ending June 30, 2012 is primarily attributable to a new lease executed by Wheeler Trigg O’Donnell LLP in June 2012 and the averaging of Encana’s base rent through its lease term. |
| (2) | The underwritten economic vacancy is 8.0%. The Republic Plaza Property was 94.5% physically occupied as of September 30, 2012. |
| (3) | DSCRs and debt yields are based on the Republic Plaza Loan Combination. |
Appraisal.As of the appraisal valuation date of October 8, 2012, the Republic Plaza Property had an “as-is” appraised value of $535,400,000.
Environmental Matters.According to the Phase I environmental site assessment dated October 5, 2012, there was no evidence of any recognized environmental conditions at the Republic Plaza Property.
Market Overview and Competition. According to the appraisal, the Republic Plaza Property is located at the northwest corner of 16th Street and Tremont Place in the central business district of Denver, Colorado. The Republic Plaza Property is located approximately 24 miles from Denver International Airport, the fifth busiest airport in the nation, and the second largest in the world by land area. Access to the Republic Plaza Property is provided by the 16th Street Mall Shuttle and the Denver Regional Transport District bus line as well as Union Station, which is located approximately one mile away from the Republic Plaza Property. Denver’s central location in the country allows it to serve as a major transportation hub for the western United States and the largest employers are in the trade, transportation and utilities industries. As of year-end 2011, the unemployment rate for the Denver metropolitan statistical area was approximately 8.6%.
According to the appraisal, the Republic Plaza Property is located within the central business district office submarket, and the appraiser identified a competitive set that contains approximately 4.7 million square feet of office space. The submarket vacancy and market rental rate for the appraiser’s competitive set is approximately 9.9% and $26.11 per square foot on a triple net basis, respectively, as of the second quarter of 2012.
The following table presents certain information relating to comparable office properties for the Republic Plaza Property:
Competitive Set(1)
| Republic Plaza (Subject) | Tabor Center | 1801 California Street | Wells Fargo Center | 1900 Sixteenth Street | 1800 Larimer Street | Seventeenth Street Plaza | ||||||||
Location | Denver, CO | Denver, CO | Denver, CO | Denver, CO | Denver, CO | Denver, CO | Denver, CO | |||||||
Distance from Subject | — | 1.3 miles | 0.7 miles | 0.1 miles | 1.4 miles | 1.1 miles | 1.3 miles | |||||||
Property Type | Office | Office | Office | Office | Office | Office | Office | |||||||
Year Built/Renovated | 1982/2002 | 1985/2000 | 1982/NAP | 1983/NAP | 2009/NAP | 2010/NAP | 1982/NAP | |||||||
Number of Stories | 56 | 30 | 52 | 52 | 18 | 22 | 32 | |||||||
Total GLA | 1,302,107 SF | 571,722 SF | 1,317,046 SF | 1,204,089 SF | 400,538 SF | 495,518 SF | 666,653 SF | |||||||
Total Occupancy | 95% | 98% | 40% | 88% | 87% | 88% | 90% |
| (1) | Information obtained from the appraisal dated October 8, 2012. |
THE INFORMATION IN THIS STRUCTURAL AND COLLATERAL TERM SHEET IS NOT COMPLETE AND MAY BE AMENDED PRIOR TO THE TIME OF SALE. THIS TERM SHEET IS NOT AN OFFER TO SELL THESE SECURITIES AND IT IS NOT A SOLICITATION OF AN OFFER TO BUY THESE SECURITIES IN ANY JURISDICTION WHERE THE OFFER OR SALE IS NOT PERMITTED.
29
REPUBLIC PLAZA
The Borrower.The borrower is comprised of two tenants-in-common (“TIC”), BOP Republic Plaza I LLC and BOP Republic Plaza II LLC. Each TIC is a single purpose entity with two independent directors and the loan documents prohibit additional TIC sponsors. Each TIC is owned and controlled by Brookfield Office Properties Inc., the guarantor of certain nonrecourse carveouts under the Republic Plaza Loan Combination.
The Sponsor.The sponsor for the Republic Plaza Loan Combination is Brookfield Office Properties Inc. (“BOP”). BOP is a publically traded REIT (NYSE: BPO) headquartered in Toronto, Ontario and has ownership interests in 108 properties totaling approximately 78 million square feet located in the downtown core markets of New York, Washington DC, Houston, Los Angeles, Denver, Toronto, Calgary, Ottawa, Melbourne and Sydney.
Escrows.The loan documents provide for upfront escrows at closing in the amount of $3,495,886 for taxes and $27,217 for replacement reserves. The loan documents provide for monthly deposits of $499,412 for real estate taxes and $27,217 for replacement reserves. The loan documents do not require monthly escrow deposits for insurance provided the following conditions are satisfied: (i) no event of default exists and is continuing; (ii) the liability and casualty policies maintained by the borrower are part of a blanket or umbrella policy approved by the lender; and (iii) the borrower provides the lender with evidence of renewal of the policies and paid receipts for the payment of insurance premiums when due.
Sponsor’s Reserves Guaranty.So long as the Reserve Guaranty Conditions (as defined below) remain satisfied, the Republic Plaza sponsor may deliver a guaranty to the lender and will have no obligation to make any initial or monthly deposits for the following escrows: (i) a $2,358,462 initial deposit for existing tenant improvements and leasing costs associated with executed leases for the following tenants: Merrill Lynch ($675,560), Samson Resources ($455,021), Wheeler Trigg O’Donnell LLP ($378,315), Poseidon ($50,000), Sunshine Silver Mines ($30,000) and Bennington ($8,266); (ii) an initial deposit of $238,060 for future rent credits or abatements associated with executed leases for the following tenants: Unicom ($157,308), Enterprise Resources ($47,452) and Bennington ($33,300); (iii) an initial deposit of $74,688 for immediate repairs; and (iv) monthly deposits of $140,000 for tenant improvements and leasing commissions.
If at any time the Reserve Guaranty Conditions are not satisfied, the Republic Plaza sponsor will, within 10 days of the lender’s written demand, deposit with the lender an amount that would equal the amount that would have accumulated in each of the reserve accounts (subject to a cap of $5,000,000 for the tenant improvement and leasing commissions escrow) covered by the Republic Plaza sponsor’s guaranty and reserve amounts that would not have been required to be distributed to the Republic Plaza sponsor.
“Reserve Guaranty Conditions” means (i) no event of default has occurred and is continuing; (ii) the long-term credit rating of the Republic Plaza sponsor is rated above BBB- by any of the rating agencies; (iii) no permitted property transfer has occurred; and (iv) the Republic Plaza sponsor owns not less than 10 percent of the indirect legal and beneficial interests in the Republic Plaza borrower.
Lockbox and Cash Management.The Republic Plaza Loan Combination requires a lender-controlled lockbox account, which is already in place, and that the tenants be directed to pay their rents directly to such lockbox account. The loan documents also require that all cash revenues and all other monies received by the borrower or the property manager relating to the Republic Plaza Property be deposited into the lockbox account within three business days of receipt.
Upon the occurrence of a Cash Trap Event Period (as defined below) or an Encana Cash Trap Event Period (as defined below), all excess funds on deposit in the lockbox account will be swept to certain restricted accounts, and if an event of default exists, the lender will have the exclusive control of, and the right to withdraw and apply, the funds in the deposit account to payment of any and all debts, liabilities and obligations of the borrower in such order, proportion and priority as the lender may determine in its sole discretion.
A “Cash Trap Event Period” will commence upon the earlier of (i) the occurrence and continuance of an event of default or (ii) the NOI debt service coverage ratio falling below 1.32x as tested with respect to each calendar quarter. A Cash Trap Event Period will expire, with respect to clause (i), upon the cure of such event of default, or with respect to clause (ii), the NOI debt service coverage ratio being at least 1.42x for two consecutive calendar quarters.
In the event, the Cash Trap Event Period is caused by clause (ii) above and an event of default has not occurred or is continuing, the Republic Plaza sponsor may deliver a letter of credit in an amount that would reduce the outstanding principal balance of the Republic Plaza Loan Combination by an amount to cause the NOI debt service coverage ratio to be 1.42x or greater in order to cure a Cash Trap Event Period.
An “Encana Cash Trap Event Period” will occur on June 30, 2017 if Encana does not renew its lease for 452,927 square feet for a term of no less than five years from its lease expiration date, or replacement lease(s) approved by the lender are not signed for 452,927 square feet prior to June 30, 2017. An Encana Cash Trap Event Period will expire upon (i) the date that funds in the Encana cash trap subaccount equal $18,118,880 less any tenant improvements or leasing commissions associated with the releasing of a portion of the expiring 452,927 square feet; (ii) the date the borrower delivers a letter of credit equal to $18,118,880 less any tenant improvements or leasing commissions associated with the releasing of a portion of the expiring 452,927 square feet; or (iii) provided the Reserve Guaranty Conditions are satisfied, the date the borrower delivers to the lender a guaranty equal to $18,118,880 less any tenant improvements or leasing commissions associated with the releasing of a portion of the expiring 452,927 square feet.
THE INFORMATION IN THIS STRUCTURAL AND COLLATERAL TERM SHEET IS NOT COMPLETE AND MAY BE AMENDED PRIOR TO THE TIME OF SALE. THIS TERM SHEET IS NOT AN OFFER TO SELL THESE SECURITIES AND IT IS NOT A SOLICITATION OF AN OFFER TO BUY THESE SECURITIES IN ANY JURISDICTION WHERE THE OFFER OR SALE IS NOT PERMITTED.
30
REPUBLIC PLAZA
Property Management. The Republic Plaza Property is managed by an affiliate of the borrower.
Assumption.The borrower has the right to transfer the Republic Plaza Property, provided that no event of default has occurred and is continuing and certain other conditions are satisfied, including (i) the lender’s reasonable determination that the proposed transferee and guarantor satisfy the lender’s credit review and underwriting standards, taking into consideration transferee experience, financial strength and general business standing; (ii) execution of a recourse guaranty and an environmental indemnity by an affiliate of the transferee; and (iii) if requested by the lender, rating agency confirmation from Fitch, KBRA and S&P that the transfer will not result in a downgrade, withdrawal or qualification of the respective ratings assigned to the Series 2013-C11 Certificates, and similar confirmations with respect to the ratings of any securities backed by the Republic Plaza Companion Loan. The borrower parties are expected to change with a TIC assumption (permitted two months after the issuance of the series 2013-C11 Certificates): BOP Republic Plaza I LLC will assume the debt and obligations of BOP Republic Plaza II LLC.
Partial Release.Following the second anniversary of the issuance of the Series 2013-C11 certificates, the Republic Plaza borrower is permitted to release the Tremont Garage parcel in connection with a partial defeasance subject to certain conditions, including (i) no event of default has occurred and is continuing; (ii) the borrower will execute documents to amend and restate the Republic Plaza Loan Combination into four substitute notes, two (the “Defeased Notes”) having a total principal balance equal to $10,132,500 (the “Release Price”) and the other notes (the “Undefeased Notes”) having a total principal balance equal to the excess of (a) the principal amount of the Republic Plaza Loan Combination existing immediately prior to the applicable partial release date, over (b) the amount of the Defeased Notes (the “Undefeased Notes”). The Defeased Notes and the Undefeased Notes will have identical terms and the monthly debt service payment amount shall be divided between the Defeased Notes and the Undefeased Notes in the same proportion in each of the WFRBS 2012-C10 and WFRBS 2013-C11 trusts. The Defeased Notes and the Undefeased Notes will be cross defaulted and cross collateralized; and (iii) immediately after the release of the Tremont Garage parcel, the debt yield will be greater than the debt yield immediately prior to the proposed partial release date.
Real Estate Substitution.Not permitted.
Subordinate and Mezzanine Indebtedness.Not permitted.
Ground Lease.None.
Terrorism Insurance.The loan documents require that the “all risk” insurance policy required to be maintained by the borrower provide coverage for terrorism in an amount equal to the full replacement cost of the Republic Plaza Property; provided, however, if TRIPRA is discontinued or not renewed, the borrower will be required to carry terrorism coverage in an amount at least equal to the lesser of (i) the outstanding principal balance of the Republic Plaza Loan Combination or (ii) the sum of the business income insurance equal to 100% of the projected gross income from the Republic Plaza Property for a 12-month period from the date of casualty plus the full replacement cost. The loan documents also require business interruption insurance covering no less than the 36-month period following the occurrence of a casualty event, together with a 12-month extended period of indemnity.
THE INFORMATION IN THIS STRUCTURAL AND COLLATERAL TERM SHEET IS NOT COMPLETE AND MAY BE AMENDED PRIOR TO THE TIME OF SALE. THIS TERM SHEET IS NOT AN OFFER TO SELL THESE SECURITIES AND IT IS NOT A SOLICITATION OF AN OFFER TO BUY THESE SECURITIES IN ANY JURISDICTION WHERE THE OFFER OR SALE IS NOT PERMITTED.
31
CONCORD MILLS

THE INFORMATION IN THIS STRUCTURAL AND COLLATERAL TERM SHEET IS NOT COMPLETE AND MAY BE AMENDED PRIOR TO THE TIME OF SALE. THIS TERM SHEET IS NOT AN OFFER TO SELL THESE SECURITIES AND IT IS NOT A SOLICITATION OF AN OFFER TO BUY THESE SECURITIES IN ANY JURISDICTION WHERE THE OFFER OR SALE IS NOT PERMITTED.
32
CONCORD MILLS
THE INFORMATION IN THIS STRUCTURAL AND COLLATERAL TERM SHEET IS NOT COMPLETE AND MAY BE AMENDED PRIOR TO THE TIME OF SALE. THIS TERM SHEET IS NOT AN OFFER TO SELL THESE SECURITIES AND IT IS NOT A SOLICITATION OF AN OFFER TO BUY THESE SECURITIES IN ANY JURISDICTION WHERE THE OFFER OR SALE IS NOT PERMITTED.
33
CONCORD MILLS
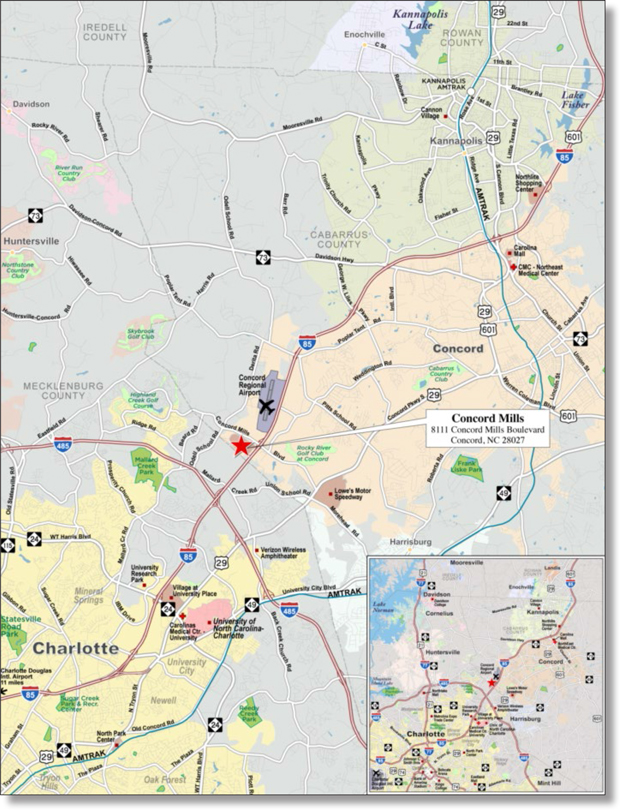
THE INFORMATION IN THIS STRUCTURAL AND COLLATERAL TERM SHEET IS NOT COMPLETE AND MAY BE AMENDED PRIOR TO THE TIME OF SALE. THIS TERM SHEET IS NOT AN OFFER TO SELL THESE SECURITIES AND IT IS NOT A SOLICITATION OF AN OFFER TO BUY THESE SECURITIES IN ANY JURISDICTION WHERE THE OFFER OR SALE IS NOT PERMITTED.
34
No. 2 - Concord Mills
| Loan Information | ||
| Mortgage Loan Seller: | The Royal Bank of Scotland | |
| Credit Assessment (Fitch/KBRA/S&P): | NR/BBB-/NR | |
| Original Principal Balance(1): | $125,000,000 | |
| Cut-off Date Principal Balance(1): | $125,000,000 | |
| % of Initial Pool Balance: | 8.7% | |
| Loan Purpose: | Refinance | |
| Borrower Name: | Mall at Concord Mills Limited Partnership | |
| Sponsor: | Simon Property Group, L.P.; Kan Am Group | |
| Mortgage Rate: | 3.836% | |
| Note Date: | October 15, 2012 | |
| Anticipated Repayment Date: | NAP | |
| Maturity Date: | November 1, 2022 | |
| IO Period: | 120 months | |
| Loan Term (Original): | 120 months | |
| Seasoning: | 3 months | |
| Amortization Term (Original): | NAP | |
| Loan Amortization Type: | Interest-only, Balloon | |
| Interest Accrual Method: | Actual/360 | |
| Call Protection: | L(27),D(86),O(7) | |
| Lockbox Type: | Hard/Springing Cash Management | |
| Additional Debt(1): | Yes | |
| Additional Debt Type(1): | Pari Passu | |
Escrows and Reserves(2):
Type: | Initial | Monthly | Cap (If Any) | |||||||
Taxes | $ | 0 | Springing | NAP | ||||||
Insurance | $ | 0 | Springing | NAP | ||||||
Replacement Reserves | $ | 0 | Springing | $ | 646,000 | |||||
TI/LC Reserve | $ | 0 | Springing | $ | 1,800,000 | |||||
| Property Information | ||
| Single Asset/Portfolio: | Single Asset | |
| Property Type: | Retail | |
| Specific Property Type: | Regional Mall | |
| Location: | Concord, NC | |
| Size: | 1,285,834 SF | |
| Cut-off Date Principal Balance Per Unit/SF(1): | $182.76 | |
| Year Built/Renovated: | 1999/NAP | |
| Title Vesting: | Fee | |
| Property Manager: | Self-managed | |
| 3rd Most Recent Occupancy (As of): | 92.1% (12/31/2009) | |
| 2nd Most Recent Occupancy (As of): | 95.9% (12/31/2010) | |
| Most Recent Occupancy (As of): | 96.6% (12/31/2011) | |
| Current Occupancy (As of)(3): | 98.3% (10/10/2012) | |
| Underwriting and Financial Information: | ||
| 3rdMost Recent NOI (As of): | $27,847,975 (12/31/2010) | |
| 2ndMost Recent NOI (As of): | $28,885,682 (12/31/2011) | |
| Most Recent NOI (As of): | $28,947,661 (TTM 8/31/2012) | |
| U/W Revenues: | $41,169,453 | |
| U/W Expenses: | $11,273,235 | |
| U/W NOI: | $29,896,218 | |
| U/W NCF: | $28,618,726 | |
| U/W NOI DSCR(1): | 3.27x | |
| U/W NCF DSCR(1): | 3.13x | |
| U/W NOI Debt Yield(1): | 12.7% | |
| U/W NCF Debt Yield(1): | 12.2% | |
| As-Is Appraised Value: | $435,000,000 | |
| As-Is Appraisal Valuation Date: | September 24, 2012 | |
| Cut-off Date LTV Ratio(1): | 54.0% | |
| LTV Ratio at Maturity or ARD(1): | 54.0% | |
| (1) | The Concord Mills Loan Combination, totalling $235,000,000, is comprised of twopari passunotes (Notes A-1 and A-2). Note A-2 had an original balance of $110,000,000, has an outstanding principal balance as of the Cut-off Date of $110,000,000 and was contributed to the WFRBS 2012-C10 Trust. Note A-1 had an original balance of $125,000,000, has an outstanding principal balance as of the Cut-off Date of $125,000,000 and will be contributed to the WFRBS 2013-C11 Trust. All presented statistical information related to balances per square foot, loan-to-value ratios, debt service coverage ratios, and debt yields are based on the Concord Mills Loan Combination. |
| (2) | See “Escrows” section. |
| (3) | Occupancy excludes temporary and seasonal tenants. For the trailing 12-month period ending July 31, 2012, the average occupancy, inclusive of these tenants, was 99.4%. |
The Mortgage Loan. The mortgage loan (the “Concord Mills Loan Combination”) is evidenced by twopari passunotes (Note A-1 and Note A-2) secured by a first mortgage encumbering a regional mall located in Concord, North Carolina (the “Concord Mills Property”). The Concord Mills Loan Combination was originated on October 15, 2012 by The Royal Bank of Scotland. The Concord Mills Loan Combination had an original principal balance of $235,000,000, has an outstanding principal balance as of the Cut-off Date of $235,000,000 and accrues interest at an interest rate of 3.836% per annum. The Concord Mills Loan Combination had an initial term of 120 months, has a remaining term of 117 months as of the Cut-off Date and requires interest-only payments through the term of the Concord Mills Loan Combination. The Concord Mills Loan Combination matures on November 1, 2022.
Note A-1 had an original principal balance of $125,000,000, has an outstanding principal balance as of the Cut-off Date of $125,000,000, will be contributed to the WFRBS 2013-C11 Trust, and represents the controlling interest in the Concord Mills Loan Combination (the “Concord Mills Mortgage Loan”). Note A-2 was contributed to the WFRBS 2012-C10 Trust, had an original principal balance of $110,000,000 and has an outstanding principal balance as of the Cut-off Date of $110,000,000 (the “Concord Mills Companion Loan”). See “Description of the Mortgage Pool – Additional Indebtedness – The Loan Combinations” and “The Pooling and Servicing Agreement - Servicing of the Loan Combinations” in the Free Writing Prospectus.
THE INFORMATION IN THIS STRUCTURAL AND COLLATERAL TERM SHEET IS NOT COMPLETE AND MAY BE AMENDED PRIOR TO THE TIME OF SALE. THIS TERM SHEET IS NOT AN OFFER TO SELL THESE SECURITIES AND IT IS NOT A SOLICITATION OF AN OFFER TO BUY THESE SECURITIES IN ANY JURISDICTION WHERE THE OFFER OR SALE IS NOT PERMITTED.
35
CONCORD MILLS
Following the lockout period, the borrower will have the right to defease the Concord Mills Loan Combination in whole, but not in part, on any due date before the scheduled maturity date. In addition, the Concord Mills Loan Combination is prepayable without penalty on or after May 1, 2022.
Sources and Uses
Sources | Uses | |||||||||||||||||
Original loan combination amount | $ | 235,000,000 | 100.0 | % | Loan payoff(1) | $ | 155,524,336 | 66.2 | % | |||||||||
| Closing costs | 883,389 | 0.4 | ||||||||||||||||
| Return of equity | 78,592,275 | 33.4 | ||||||||||||||||
|
|
|
|
|
|
|
| |||||||||||
Total Sources | $ | 235,000,000 | 100.0 | % | Total Uses | $ | 235,000,000 | 100.0 | % | |||||||||
|
|
|
|
|
|
|
| |||||||||||
| (1) | The Concord Mills Property was previously securitized in JPMCC 2003-C1. |
The Property.The Concord Mills Property is an approximately 1.3 million square foot single-level, regional mall located across Interstate 85 from the Charlotte Motor Speedway in Concord, North Carolina, approximately 14 miles north of the Charlotte, North Carolina central business district. The Concord Mills Property is anchored by Bass Pro Shops Outdoor, Burlington Coat Factory, AMC Theatres and Dave & Buster’s. The Concord Mills Property opened in 1999 and as of October 10, 2012, the Concord Mills Property was 98.3% leased by approximately 151 tenants, excluding seasonal and temporary tenants. In-line stores include Saks Fifth Avenue Off 5th, Michael Kors, Polo Ralph Lauren Factory Store, Coach, Tommy Hilfiger, Forever 21, Nike Factory Outlet and more than 145 other retailers and restaurants. The five largest tenants, Bass Pro Shops Outdoor, Burlington Coat Factory, AMC Theatres, Dave & Buster’s and TJ Maxx & More (representing aggregately 33.0% of net rentable area and 20.6% of base rent), have been at the Concord Mills Property since it was developed in 1999. In aggregate, tenants representing a total of 48.8% of net rentable area have been at the Concord Mills Property since it was developed in 1999.
For the trailing 12-month period ending July 31, 2012, tenants had comparable in-line average sales (tenants occupying less than 10,000 square feet) of $417 per square foot. Occupancy costs for comparable tenants occupying less than 10,000 square feet averaged 11.0% for the trailing 12-month period ending July 31, 2012.
The following table presents certain information relating to the tenancies at the Concord Mills Property:
Major Tenants
Tenant Name | Credit Rating (Fitch/ Moody’s/ S&P)(1) | Tenant NRSF | % of NRSF | Annual U/W Base Rent PSF(2) | Annual U/W Base Rent(2) | % of Total Annual U/W Base Rent | Sales PSF(3) | Occupancy Cost(3)(4) | Lease Expiration Date | |||||||||||||||||||||||||
Anchor Tenants | ||||||||||||||||||||||||||||||||||
Bass Pro Shops Outdoor | NR/NR/NR | 134,790 | 10.5 | % | $ | 9.09 | $ | 1,225,000 | 5.1 | % | $ | 348 | 2.6 | % | 9/10/2014 | (5) | ||||||||||||||||||
Burlington Coat Factory | NR/B3/B- | 100,498 | 7.8 | % | $ | 5.50 | $ | 552,739 | 2.3 | % | $ | 109 | 7.9 | % | 1/31/2015 | (6) | ||||||||||||||||||
|
|
|
|
|
|
|
| |||||||||||||||||||||||||||
Total Anchor Tenants | 235,288 | 18.3 | % | $ | 7.56 | $ | 1,777,739 | 7.4 | % | |||||||||||||||||||||||||
Major Tenants | ||||||||||||||||||||||||||||||||||
AMC Theatres | NR/NR/NR | 83,732 | 6.5 | % | $ | 21.00 | $ | 1,758,372 | 7.3 | % | (7) | 19.2 | % | 9/30/2019 | ||||||||||||||||||||
Dave & Buster’s | NR/NR/NR | 53,077 | 4.1 | % | $ | 18.00 | $ | 955,386 | 4.0 | % | $ | 148 | 15.4 | % | 8/28/2014 | |||||||||||||||||||
Forever 21 | NR/NR/NR | 29,367 | 2.3 | % | $ | 25.54 | $ | 750,000 | 3.1 | % | $ | 398 | 6.4 | % | 6/30/2022 | |||||||||||||||||||
T.J. Maxx & More | NR/A3/A | 51,937 | 4.0 | % | $ | 9.25 | $ | 480,417 | 2.0 | % | $ | 227 | 5.7 | % | 1/31/2015 | |||||||||||||||||||
Bed Bath & Beyond | NR/NR/BBB+ | 35,515 | 2.8 | % | $ | 10.25 | $ | 364,029 | 1.5 | % | $ | 243 | 5.5 | % | 1/31/2015 | |||||||||||||||||||
Best Buy | BB+/Baa2/BB+ | 35,807 | 2.8 | % | $ | 9.00 | $ | 322,263 | 1.3 | % | NAP | (8) | NAV | 1/31/2021 | ||||||||||||||||||||
|
|
|
|
|
|
|
| |||||||||||||||||||||||||||
Total Major Tenants | 289,435 | 22.5 | % | $ | 16.00 | $ | 4,630,467 | 19.2 | % | |||||||||||||||||||||||||
Non-Major Tenants | 738,697 | 57.4 | % | $ | 23.93 | $ | 17,675,703 | 73.4 | % | |||||||||||||||||||||||||
|
|
|
|
|
|
|
| |||||||||||||||||||||||||||
Occupied Collateral(9) | 1,263,420 | 98.3 | % | $ | 19.06 | $ | 24,083,909 | 100.0 | % | |||||||||||||||||||||||||
|
|
|
| |||||||||||||||||||||||||||||||
Vacant Space | 22,414 | 1.7 | % | |||||||||||||||||||||||||||||||
|
|
|
| |||||||||||||||||||||||||||||||
Collateral Total | 1,285,834 | 100.0 | % | |||||||||||||||||||||||||||||||
|
|
|
| |||||||||||||||||||||||||||||||
| (1) | Certain ratings are those of the parent company whether or not the parent guarantees the lease. |
| (2) | Annual Underwritten Base Rent includes contractual rent steps through June 2013. |
| (3) | Sales and Occupancy Costs are for the trailing 12-month period ending July 31, 2012. |
| (4) | Occupancy Costs include base rent, reimbursements and percentage rent as applicable. |
| (5) | Bass Pro Shops Outdoor has seven, five-year extension options remaining. |
| (6) | Burlington Coat Factory has three, five-year extension options remaining. |
| (7) | AMC Theatres operates with 24 screens at the Concord Mills Property and had sales per screen of $432,755 for the trailing 12-month period ending July 31, 2012. |
| (8) | Best Buy is not required to report sales under its lease. |
| (9) | Occupancy excludes temporary and seasonal tenants. For the trailing 12-month period ending July 31, 2012, the occupancy, inclusive of these tenants, was 99.4%. |
THE INFORMATION IN THIS STRUCTURAL AND COLLATERAL TERM SHEET IS NOT COMPLETE AND MAY BE AMENDED PRIOR TO THE TIME OF SALE. THIS TERM SHEET IS NOT AN OFFER TO SELL THESE SECURITIES AND IT IS NOT A SOLICITATION OF AN OFFER TO BUY THESE SECURITIES IN ANY JURISDICTION WHERE THE OFFER OR SALE IS NOT PERMITTED.
36
CONCORD MILLS
The following table presents certain information relating to the historical sales and occupancy costs at the Concord Mills Property:
Historical Sales (PSF) and Occupancy Costs(1)
Tenant Name | 2009 | 2010 | 2011 | TTM 7/31/2012 | ||||||||||||
Bass Pro Shops Outdoor | $ | 333 | $ | 330 | $ | 347 | $ | 348 | ||||||||
Burlington Coat Factory | $ | 122 | $ | 116 | $ | 117 | $ | 109 | ||||||||
AMC Theatres | (2 | ) | (2 | ) | (2 | ) | (2 | ) | ||||||||
Dave & Buster’s | $ | 147 | $ | 139 | $ | 139 | $ | 148 | ||||||||
Forever 21(3) | $ | 565 | $ | 565 | $ | 691 | $ | 398 | ||||||||
TJ Maxx & More | $ | 234 | $ | 240 | $ | 236 | $ | 227 | ||||||||
Bed Bath & Beyond | $ | 227 | $ | 213 | $ | 232 | $ | 243 | ||||||||
Best Buy(4) | NAV | NAV | NAV | NAV | ||||||||||||
Total In-line (<10,000 square feet)(5) | $ | 357 | $ | 387 | $ | 389 | $ | 417 | ||||||||
Occupancy Costs(5) | 12.5 | % | 11.6 | % | 11.8 | % | 11.0 | % | ||||||||
| (1) | Historical Sales (PSF) is based on historical statements provided by the borrower. |
| (2) | Sales per screen for AMC Theatres (24 screens) were $381,609, $423,684, $524,930 and $432,755 in 2009, 2010, 2011 and the trailing 12-month period ending July 31, 2012, respectively. |
| (3) | In 2012, Forever 21 expanded its space from 6,735 square feet (0.5% of net rentable square footage) to 29,367 square feet (2.3% of net rentable square footage). The TTM sales per square foot is based on the larger space, while 2009, 2010 and 2011 sales are based on the smaller space. |
| (4) | Best Buy is not required to report sales. |
| (5) | Represents tenants less than 10,000 square feet who were in occupancy since July 31, 2010, the date which is two years before the end of the trailing 12-month reporting period. |
The following table presents certain information relating to the lease rollover schedule at the Concord Mills Property:
Lease Expiration Schedule(1)(2)
| Annual | ||||||||||||||||||||||||||
| No. of | % of | Cumulative | Cumulative | Annual | U/W | |||||||||||||||||||||
| Year Ending | Leases | Expiring | Total | Expiring | % of Total | U/W | Base Rent | |||||||||||||||||||
December 31, | Expiring | NRSF | NRSF | NRSF | NRSF | Base Rent | PSF(3) | |||||||||||||||||||
MTM | 0 | 0 | 0.0 | % | 0 | 0.0 | % | $ | 0 | $ | 0.00 | |||||||||||||||
2012 | 6 | 11,287 | 0.9 | % | 11,287 | 0.9 | % | $ | 461,889 | $ | 40.92 | |||||||||||||||
2013 | 9 | 30,695 | 2.4 | % | 41,982 | 3.3 | % | $ | 531,534 | $ | 17.32 | |||||||||||||||
2014 | 27 | 311,345 | 24.2 | % | 353,327 | 27.5 | % | $ | 4,968,410 | $ | 15.96 | |||||||||||||||
2015 | 21 | 294,281 | 22.9 | % | 647,608 | 50.4 | % | $ | 4,140,120 | $ | 14.07 | |||||||||||||||
2016 | 16 | 83,196 | 6.5 | % | 730,804 | 56.8 | % | $ | 1,742,723 | $ | 20.95 | |||||||||||||||
2017 | 19 | 75,644 | 5.9 | % | 806,448 | 62.7 | % | $ | 2,208,596 | $ | 29.20 | |||||||||||||||
2018 | 6 | 48,458 | 3.8 | % | 854,906 | 66.5 | % | $ | 1,257,428 | $ | 25.95 | |||||||||||||||
2019 | 12 | 167,501 | 13.0 | % | 1,022,407 | 79.5 | % | $ | 3,534,195 | $ | 21.10 | |||||||||||||||
2020 | 9 | 39,627 | 3.1 | % | 1,062,034 | 82.6 | % | $ | 1,022,813 | $ | 25.81 | |||||||||||||||
2021 | 11 | 95,691 | 7.4 | % | 1,157,725 | 90.0 | % | $ | 1,824,284 | $ | 19.06 | |||||||||||||||
2022 | 13 | 70,735 | 5.5 | % | 1,228,460 | 95.5 | % | $ | 1,976,407 | $ | 27.94 | |||||||||||||||
2023 | 2 | 34,960 | 2.7 | % | 1,263,420 | 98.3 | % | $ | 415,510 | $ | 11.89 | |||||||||||||||
Thereafter | 0 | 0 | 0.0 | % | 1,263,420 | 98.3 | % | $ | 0 | $ | 0.00 | |||||||||||||||
Vacant(4) | 0 | 22,414 | 1.7 | % | 1,285,834 | 100.0 | % | $ | 0 | $ | 0.00 | |||||||||||||||
|
|
|
|
|
|
|
|
| ||||||||||||||||||
Total/Weighted Average | 151 | 1,285,834 | 100.0 | % | $ | 24,083,909 | $ | 19.06 | ||||||||||||||||||
|
|
|
|
|
|
|
|
| ||||||||||||||||||
| (1) | Information obtained from the underwritten rent roll. |
| (2) | Certain tenants may have lease termination options that are exercisable prior to the originally stated expiration date of the subject lease and that are not considered in the Lease Expiration Schedule. |
| (3) | Weighted Average Annual U/W Base Rent PSF excludes vacant space. |
| (4) | Occupancy excludes temporary and seasonal tenants. For the trailing 12-month period ending July 31, 2012, the average occupancy, inclusive of these tenants, was 99.4%. |
The following table presents historical occupancy percentages at the Concord Mills Property:
Historical Occupancy(1)(2)
12/31/2009 | 12/31/2010 | 12/31/2011 | ||
92% | 96% | 97% |
| (1) | Information obtained from the borrower. |
| (2) | Historical occupancy is presented exclusive of temporary and seasonal tenants. |
THE INFORMATION IN THIS STRUCTURAL AND COLLATERAL TERM SHEET IS NOT COMPLETE AND MAY BE AMENDED PRIOR TO THE TIME OF SALE. THIS TERM SHEET IS NOT AN OFFER TO SELL THESE SECURITIES AND IT IS NOT A SOLICITATION OF AN OFFER TO BUY THESE SECURITIES IN ANY JURISDICTION WHERE THE OFFER OR SALE IS NOT PERMITTED.
37
CONCORD MILLS
Operating History and Underwritten Net Cash Flow. The following table presents certain information relating to the historical operating performance and the Underwritten Net Cash Flow at the Concord Mills Property:
Cash Flow Analysis
| TTM | ||||||||||||||||||||
| 2010 | 2011 | 8/31/2012 | U/W | U/W $ per SF | ||||||||||||||||
Base Rent | $ | 22,574,643 | $ | 23,060,961 | $ | 23,346,699 | $ | 24,083,909 | $ | 18.73 | ||||||||||
Grossed Up Vacant Space | 0 | 0 | 0 | 1,026,037 | 0.80 | |||||||||||||||
Percentage Rent(1) | 625,318 | 493,317 | 579,610 | 942,075 | 0.73 | |||||||||||||||
Total Reimbursables | 10,763,810 | 11,760,012 | 11,954,838 | 12,299,356 | 9.57 | |||||||||||||||
Other Income | 5,055,387 | 5,006,296 | 4,860,357 | 4,860,357 | 3.78 | |||||||||||||||
Less Vacancy & Credit Loss | 68,928 | 30,110 | (207,365 | ) | (2,042,281 | )(2) | (1.59 | ) | ||||||||||||
|
|
|
|
|
|
|
|
|
| |||||||||||
Effective Gross Income | $ | 39,088,086 | $ | 40,350,696 | $ | 40,534,139 | $ | 41,169,453 | $ | 32.02 | ||||||||||
Total Operating Expenses | $ | 11,240,111 | $ | 11,465,014 | $ | 11,586,478 | $ | 11,273,235 | $ | 8.77 | ||||||||||
|
|
|
|
|
|
|
|
|
| |||||||||||
Net Operating Income | $ | 27,847,975 | $ | 28,885,682 | $ | 28,947,661 | $ | 29,896,218 | $ | 23.25 | ||||||||||
TI/LC | 0 | 0 | 0 | 956,034 | 0.74 | |||||||||||||||
Capital Expenditures | 0 | 0 | 0 | 321,459 | 0.25 | |||||||||||||||
|
|
|
|
|
|
|
|
|
| |||||||||||
Net Cash Flow | $ | 27,847,975 | $ | 28,885,682 | $ | 28,947,661 | $ | 28,618,726 | $ | 22.26 | ||||||||||
NOI DSCR(3) | 3.05x | 3.16x | 3.17x | 3.27x | ||||||||||||||||
NCF DSCR(3) | 3.05x | 3.16x | 3.17x | 3.13x | ||||||||||||||||
NOI DY(3) | 11.9 | % | 12.3 | % | 12.3 | % | 12.7 | % | ||||||||||||
NCF DY(3) | 11.9 | % | 12.3 | % | 12.3 | % | 12.2 | % | ||||||||||||
| (1) | Percentage Rent includes $481,355 of percentage rent in lieu of base rent and $460,720 of percentage overage rent. |
| (2) | The underwritten economic vacancy is 4.9%. The Concord Mills Property was 98.3% physically occupied as of October 10, 2012. |
| (3) | DSCRs and debt yields are based on the Concord Mills Loan Combination. |
Appraisal.As of the appraisal valuation date of September 24, 2012, the Concord Mills Property had an “as-is” appraised value of $435,000,000.
Environmental Matters. According to a Phase I environmental site assessment dated September 25, 2012, there was no evidence of any recognized environmental conditions at the Concord Mills Property.
Market Overview and Competition.The Concord Mills Property is located in Concord, North Carolina, approximately 14 miles northeast of the Charlotte central business district. The Concord Mills Property is located in a commercial area approximately two miles west of Charlotte Motor Speedway, and 1.5 miles north of the intersection of Interstate 85 and Interstate 485.
According to the appraisal, population within a 15-mile radius of the Concord Mills Property (the primary trade area) was reported as 828,654 in 2012, representing a 2.7% compounded annual growth rate since 2000. Within the same radius, average household income was recorded as $66,287 in 2012, representing a 1.0% compounded annual growth rate since 2000, which is in line with both the Charlotte central business district and national average household income of $69,255 and $67,303, respectively.
The appraiser estimated triple net market rent for in-line retail suites under 10,000 square feet to be $25.83 per square foot, excluding kiosk, restaurant and jewellery tenants. Additionally, based on an average of comparable properties, the appraiser projected a vacancy rate of four percent based on historical occupancy at the Concord Mills Property and the occupancy levels of competitive properties.
The following table presents certain information relating to some comparable retail centers provided in the appraisal for the Concord Mills Property:
Competitive Set(1)
| Concord Mills | Shoppes at | |||||||||
(Subject) | Afton Ridge SC | University Place | Carolina Mall | Northlake Mall | ||||||
Location | Concord, NC | Concord, NC | Charlotte, NC | Concord, NC | Charlotte, NC | |||||
Distance from Subject | –– | 5.0 miles | 6.0 miles | 10.0 miles | 11.0 miles | |||||
Property Type | Regional Mall | Anchored | Anchored | Regional Mall | Regional Mall | |||||
Year Built/Renovated | 1999/NAP | 2006/NAP | 1984/2011 | 1972/1999 | 2005/NAP | |||||
Anchors | Bass Pro Shops Outdoor, Burlington Coat, AMC Theatre, TJ Maxx | Target, Dick’s, Best Buy, Marshall’s | Dick’s, Office Depot, Old Navy, TJ Maxx | Belk, JC Penney, Sears | Belk, Dick’s, Dillard’s, Hecht’s, AMC Theatres | |||||
Total GLA | 1,285,834 SF | 503,366 SF | 801,295 SF | 554,270 SF | 1,096,719 SF | |||||
Total Occupancy | 98% | 98% | 76% | 99% | 98% |
| (1) | Information obtained from the appraisal dated October 4, 2012. |
THE INFORMATION IN THIS STRUCTURAL AND COLLATERAL TERM SHEET IS NOT COMPLETE AND MAY BE AMENDED PRIOR TO THE TIME OF SALE. THIS TERM SHEET IS NOT AN OFFER TO SELL THESE SECURITIES AND IT IS NOT A SOLICITATION OF AN OFFER TO BUY THESE SECURITIES IN ANY JURISDICTION WHERE THE OFFER OR SALE IS NOT PERMITTED.
38
CONCORD MILLS
The Borrower.The borrower is Mall at Concord Mills Limited Partnership, a Delaware limited partnership which is 99.0% owned by Concord Mills Mall Limited Partnership, the limited partner, and 1.0% owned by Mall at Concord Mills GP, LLC, the general partner of the borrower. Concord Mills GP, LLC is, in turn, 100.0% owned by Concord Mills Limited Partnership, the limited partner. The borrower is a single purpose entity with two independent directors and is 59.3% owned by entities owned and controlled by Simon Property Group, L.P. (“SPG”) and 40.7% owned by entities owned and controlled by the Kan Am Group. Legal counsel to the borrower delivered a non-consolidation opinion in connection with the origination of the Concord Mills Loan Combination. Simon Property Group, L.P. is the sole guarantor of certain nonrecourse carveouts under the Concord Mills Loan Combination.
The Sponsor.The sponsor for the Concord Mills Loan Combination is a joint venture between SPG and Kan Am Group. SPG is a large real estate company in the United States and is publicly traded on the New York Stock Exchange under the symbol SPG. SPG currently owns or has an interest in 337 properties comprising approximately 245 million square feet of gross leasable area in North America, Europe and Asia. SPG employs over 5,500 people in the United States and is headquartered in Indianapolis, Indiana. Kan Am Group, founded in 1978 and based in Germany, is a private asset manager of international real estate investments.
Escrows.No monthly tax escrow is required so long as (i) no Lockbox Event (as defined below) has occurred or is continuing under the Concord Mills Loan Combination and (ii) borrower delivers satisfactory evidence that tax payments are being made in a timely manner. No monthly insurance escrow is required so long as (i) no event of default has occurred or is continuing under the Concord Mills Loan Combination and (ii) the insurance required to be maintained by the borrower is effected under an acceptable blanket insurance policy. No monthly replacement reserve or tenant improvement and leasing commissions reserve is required so long as no Lockbox Event has occurred or is continuing.
Lockbox and Cash Management. The Concord Mills Loan Combination requires a lender-controlled lockbox account, which is already in place, and that the borrower direct tenants to pay their rents directly to such lockbox account. The loan documents also require that all rents received by the borrower or the property manager be deposited into the lockbox account within two business days after receipt. Prior to the occurrence of a Lockbox Event all funds on deposit in the lockbox account are swept into the property manager’s operating account on a weekly basis. During a Lockbox Event, all funds on deposit in the lockbox account are swept on a weekly basis (or on each business day during the continuance of an event of default) to a cash management account under the control of the lender.
A “Lockbox Event” will commence upon any of the following events occurring (i) the occurrence and continuance of an event of default; (ii) the commencement of any bankruptcy action against the borrower or the property manager; or (iii) as of the last day of any calendar quarter during the Concord Mills Loan Combination term, the debt service coverage ratio is less than 1.50x for two consecutive calendar quarters. If a Lockbox Event is triggered by (i) above, the Lockbox Event will end with the acceptance by the lender of a cure of such event of default. If a Lockbox Event is triggered by (ii) above, the Lockbox Event will end upon replacement of the manager by the borrower with an acceptable replacement manager. Finally, if a Lockbox Event is triggered by (iii) above, the Lockbox Event will end upon the achievement of a debt service coverage ratio of 1.50x for two consecutive calendar quarters.
Property Management.The Concord Mills Property is managed by an affiliate of the borrower.
Assumption.Other than during the period that is 60 days prior to and 60 days following a securitization, the borrower has the right to transfer the entire Concord Mills Property or greater than 50% of the aggregate interests in the borrower in one or a series of related transactions to one or more Qualified Transferees (as defined below), without the consent of the lender, subject to certain conditions set forth in the loan documents, including but not limited to (i) no event of default has occurred and is continuing under the Concord Mills Mortgage Loan; (ii) the lender receives written confirmation from Fitch, KBRA and S&P that the assumption will not, in and of itself, result in a downgrade, qualification or withdrawal of the then current ratings assigned to any class of Series 2013-C11 Certificates and similar confirmations with respect to the ratings of any securities backed by the Concord Mills Companion Loan; and (iii) the transferee and all other entities controlled directly or indirectly by principals of the transferee must not have been party to any voluntary or involuntary bankruptcy proceedings, within seven years prior to the proposed transfer. If the transfer is not to a Qualified Transferee, the lender may not unreasonably withhold, condition or delay its consent to any other transfer of the entire Concord Mills Property or entire interest in the borrower under the Concord Mills Loan Combination, provided that certain conditions set forth in the Concord Mills Mortgage Loan documents are met.
A “Qualified Transferee” is (a) any person or its affiliate (provided that such person owns, directly or indirectly, not less than 51% of such affiliate) who owns and operates at least five “regional malls” totaling at least in the aggregate 10,000,000 square feet of gross leasable area; or (b) any person who has a net worth in excess of $1,000,000,000; or (c) any person, provided that the lender has received written confirmation from Fitch, KBRA and S&P that the assumption to such person will not, in and of itself, result in a downgrade, qualification or withdrawal of the then current ratings assigned to any class of Series 2013-C11 Certificates and similar confirmations with respect to the ratings of any securities backed by the Concord Mills Companion Loan. In no event, however, may a person be deemed a Qualified Transferee if such person (a) is an embargoed person, (b) is or has during the previous 10 years been subject of a bankruptcy proceeding or (c) has been convicted in a criminal proceeding for a felony or any crime involving moral turpitude or is an organized crime figure or is reputed to have substantial business or other affiliations with any organized crime figure.
Free Release. The borrower may obtain a release of certain immaterial or non-income producing portions of the Concord Mills Property from the lien of the mortgage upon the satisfaction of certain conditions, including but not limited to: (i) no event of default has occurred and is continuing and (ii) the borrower has certified to the lender that the release of the parcel will not materially and adversely affect the use, operations or economic value of the remaining improvements.
Real Estate Substitution. Not permitted.
THE INFORMATION IN THIS STRUCTURAL AND COLLATERAL TERM SHEET IS NOT COMPLETE AND MAY BE AMENDED PRIOR TO THE TIME OF SALE. THIS TERM SHEET IS NOT AN OFFER TO SELL THESE SECURITIES AND IT IS NOT A SOLICITATION OF AN OFFER TO BUY THESE SECURITIES IN ANY JURISDICTION WHERE THE OFFER OR SALE IS NOT PERMITTED.
39
CONCORD MILLS
Subordinate and Mezzanine Indebtedness. Not permitted.
Ground Lease.None.
Terrorism Insurance. The loan documents require that the “all risk” insurance policy required to be maintained by the borrower provides coverage for damage from terrorism in an amount equal to the full replacement cost of the Concord Mills Property as well as business interruption insurance covering no less than the 18-month period following the occurrence of a casualty event, together with a six-month extended period of indemnity.
THE INFORMATION IN THIS STRUCTURAL AND COLLATERAL TERM SHEET IS NOT COMPLETE AND MAY BE AMENDED PRIOR TO THE TIME OF SALE. THIS TERM SHEET IS NOT AN OFFER TO SELL THESE SECURITIES AND IT IS NOT A SOLICITATION OF AN OFFER TO BUY THESE SECURITIES IN ANY JURISDICTION WHERE THE OFFER OR SALE IS NOT PERMITTED.
40
[THIS PAGE INTENTIONALLY LEFT BLANK.]
41
RHP PORTFOLIO I
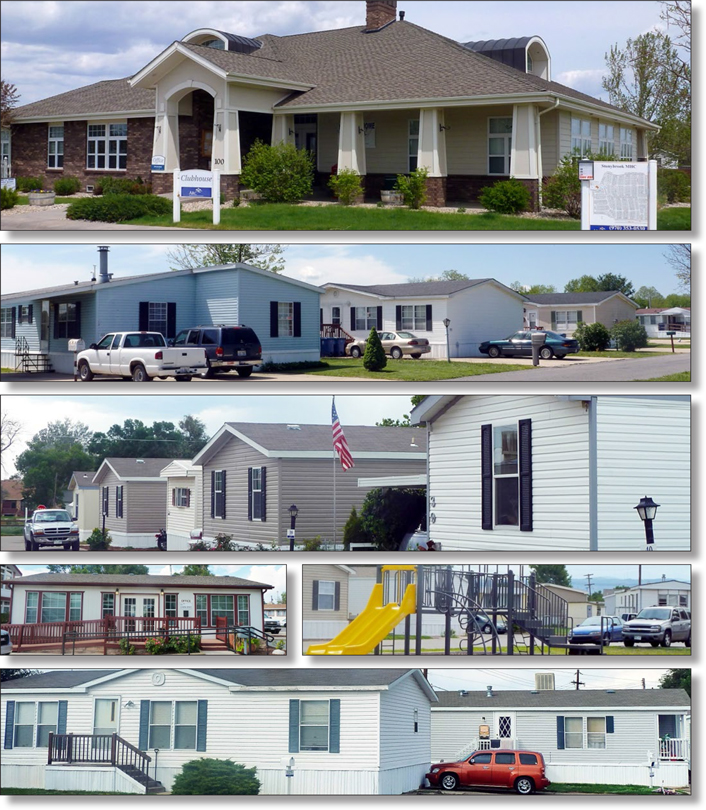
THE INFORMATION IN THIS STRUCTURAL AND COLLATERAL TERM SHEET IS NOT COMPLETE AND MAY BE AMENDED PRIOR TO THE TIME OF SALE. THIS TERM SHEET IS NOT AN OFFER TO SELL THESE SECURITIES AND IT IS NOT A SOLICITATION OF AN OFFER TO BUY THESE SECURITIES IN ANY JURISDICTION WHERE THE OFFER OR SALE IS NOT PERMITTED.
42
RHP PORTFOLIO I

THE INFORMATION IN THIS STRUCTURAL AND COLLATERAL TERM SHEET IS NOT COMPLETE AND MAY BE AMENDED PRIOR TO THE TIME OF SALE. THIS TERM SHEET IS NOT AN OFFER TO SELL THESE SECURITIES AND IT IS NOT A SOLICITATION OF AN OFFER TO BUY THESE SECURITIES IN ANY JURISDICTION WHERE THE OFFER OR SALE IS NOT PERMITTED.
43
No. 3 - RHP Portfolio I
| Loan Information | ||
| Mortgage Loan Seller: | The Royal Bank of Scotland | |
| Credit Assessment (Fitch/KBRA/S&P): | NR/NR/NR | |
| Original Principal Balance: | $120,763,000 | |
| Cut-off Date Principal Balance: | $120,763,000 | |
| % of Initial Pool Balance: | 8.4% | |
| Loan Purpose: | Acquisition | |
| Borrower Name(1): | Various | |
| Sponsors: | RHP Properties Inc.; Northstar Realty Finance Corporation | |
| Mortgage Rate: | 4.387% | |
| Note Date: | December 6, 2012 | |
| Anticipated Repayment Date: | NAP | |
| Maturity Date: | January 1, 2023 | |
| IO Period: | 24 months | |
| Loan Term (Original): | 120 months | |
| Seasoning: | 1 month | |
| Amortization Term (Original): | 360 months | |
| Loan Amortization Type: | Interest-only, Amortizing Balloon | |
| Interest Accrual Method: | Actual/360 | |
| Call Protection: | L(25),GRTR 1% or YM(90),O(5) | |
| Lockbox Type: | Soft/Springing Cash Management | |
| Additional Debt: | Yes | |
| Additional Debt Type: | Permitted Future Mezzanine | |
| Escrows and Reserves(2): | ||
Type: | Initial | Monthly | Cap (If Any) | |||||||||
Taxes | $ | 246,124 | $ | 42,704 | NAP | |||||||
Insurance | $ | 89,791 | $ | 22,448 | NAP | |||||||
Replacement Reserves | $ | 2,288,268 | Springing | $ | 500,000 | |||||||
Deferred Maintenance | $ | 261,732 | $ | 0 | NAP | |||||||
| Property Information | ||
| Single Asset/Portfolio: | Portfolio | |
| Property Type: | Manufactured Housing Community | |
| Specific Property Type: | Manufactured Housing Community | |
| Location: | Various – See Table | |
| Size: | 3,302 pads | |
Cut-off Date Principal Balance Per Pad: | $36,573 | |
| Year Built/Renovated: | Various – See Table | |
| Title Vesting: | Fee | |
| Property Manager: | Newbury Management Company | |
| 3rd Most Recent Occupancy (As of): | 84.9% (12/31/2009) | |
| 2nd Most Recent Occupancy (As of): | 82.8% (12/31/2010) | |
| Most Recent Occupancy (As of): | 82.4% (12/31/2011) | |
| Current Occupancy (As of): | 83.7% (11/14/2012) | |
Underwriting and Financial Information:
| ||
| 3rdMost Recent NOI (As of): | $9,877,159 (12/31/2010) | |
| 2ndMost Recent NOI (As of): | $10,090,230 (12/31/2011) | |
| Most Recent NOI (As of): | $10,634,589 (TTM 10/31/2012) | |
| U/W Revenues: | $16,420,264 | |
| U/W Expenses: | $5,619,292 | |
| U/W NOI: | $10,800,972 | |
| U/W NCF: | $10,628,905 | |
| U/W NOI DSCR : | 1.49x | |
| U/W NCF DSCR: | 1.47x | |
| U/W NOI Debt Yield: | 8.9% | |
| U/W NCF Debt Yield: | 8.8% | |
| As-Is Appraised Value: | $163,800,000 | |
| As-Is Appraisal Valuation Date(3): | Various | |
| Cut-off Date LTV Ratio: | 73.7% | |
| LTV Ratio at Maturity or ARD: | 62.8% | |
| (1) | The borrower is comprised of 18 separate limited liability companies. |
| (2) | See “Escrows” section. |
| (3) | The As-Is Appraisal Valuation Dates range from September 16, 2012 to October 16, 2012. |
The Mortgage Loan. The mortgage loan (the “RHP Portfolio I Mortgage Loan”) is evidenced by a single promissory note that is secured by a first mortgage encumbering 18 manufactured housing communities totaling 3,302 pads and located in four states (the “RHP Portfolio I Properties”). The RHP Portfolio I Mortgage Loan was originated on December 6, 2012 by The Royal Bank of Scotland. The RHP Portfolio I Mortgage Loan had an original principal balance of $120,763,000, has an outstanding principal balance as of the Cut-off Date of $120,763,000 and accrues interest at an interest rate of 4.387% per annum. The RHP Portfolio I Mortgage Loan had an initial term of 120 months, has a remaining term of 119 months as of the Cut-off Date and requires interest-only payments for the first 24 months following origination and thereafter requires payments of principal and interest based on a 30-year amortization schedule. The RHP Portfolio I Mortgage Loan matures on January 1, 2023.
Following the lockout period (except in the case of the Early Release Properties (as defined below)), the borrower has the right to prepay the RHP Portfolio I Mortgage Loan either in whole or in part (see “Partial Release” section), provided that the borrower pays the greater of a yield maintenance premium or a prepayment premium equal to 1.0% of the principal amount being prepaid. In addition, the RHP Portfolio I Mortgage Loan is prepayable without penalty on or after September 1, 2022.
THE INFORMATION IN THIS STRUCTURAL AND COLLATERAL TERM SHEET IS NOT COMPLETE AND MAY BE AMENDED PRIOR TO THE TIME OF SALE. THIS TERM SHEET IS NOT AN OFFER TO SELL THESE SECURITIES AND IT IS NOT A SOLICITATION OF AN OFFER TO BUY THESE SECURITIES IN ANY JURISDICTION WHERE THE OFFER OR SALE IS NOT PERMITTED.
44
RHP PORTFOLIO I
Sources and Uses
Sources | Uses | |||||||||||||||||
Original loan amount | $ | 120,763,000 | 74.9 | % | Purchase price | $ | 157,060,000 | 97.4 | % | |||||||||
Equity | 40,432,695 | 25.1 | Reserves | 2,885,915 | 1.8 | % | ||||||||||||
| Closing costs | 1,249,780 | 0.8 | % | |||||||||||||||
|
|
|
|
|
|
|
| |||||||||||
Total Sources | $ | 161,195,695 | 100.0 | % | Total Uses | $ | 161,195,695 | 100.0 | % | |||||||||
|
|
|
|
|
|
|
| |||||||||||
The Properties. The RHP Portfolio I Mortgage Loan is secured by the fee interest in 18 manufactured housing communities (“MHC”) totaling 3,302 pads and located in Colorado, Wyoming, Illinois and Arizona. The RHP Portfolio I Properties were acquired by the sponsors as a part of a 36 property portfolio in December of 2012. The remaining 18 properties in the portfolio (“RHP Portfolio II Properties”) are not collateral for the RHP Portfolio I Mortgage Loan. The RHP Portfolio I Properties include a range of amenities including playgrounds, basketball courts, RV storage, swimming pools and clubhouses. The RHP Portfolio I Properties were developed between 1948 and 1978 and have an average age of 43 years. Public utilities are provided in all but one of the RHP Portfolio I Properties (Sheridan). The Sheridan property is served by private well water.
The following table presents certain information relating to the RHP Portfolio I Properties:
Property Name – Location | Allocated Cut-off Date Principal Balance | % of Portfolio Cut-off Date Principal Balance | Current Occupancy | Year Built/ Renovated | Pads | Appraised Value | ||||||||||||||||||
Harmony Road – Fort Collins, CO | $ | 24,351,000 | 20.2 | % | 97.1 | % | 1972/NAP | 485 | $ | 32,400,000 | ||||||||||||||
The Meadows – Aurora, CO | $ | 17,984,000 | 14.9 | % | 96.0 | % | 1965/NAP | 303 | $ | 24,600,000 | ||||||||||||||
Mountainside Estates – Golden, CO | $ | 12,321,000 | 10.2 | % | 82.1 | % | 1954/NAP | 224 | $ | 16,700,000 | ||||||||||||||
Eastview – Gillette, WY | $ | 9,110,500 | 7.5 | % | 96.7 | % | 1969/NAP | 214 | $ | 12,660,000 | ||||||||||||||
Sheridan – Arvada, CO | $ | 6,916,500 | 5.7 | % | 97.3 | % | 1956/NAP | 112 | $ | 9,400,000 | ||||||||||||||
Countryside of Greeley – Greeley, CO | $ | 6,683,000 | 5.5 | % | 97.1 | % | 1972/NAP | 174 | $ | 9,100,000 | ||||||||||||||
Westview – Gillette, WY | $ | 5,824,500 | 4.8 | % | 97.7 | % | 1970/NAP | 130 | $ | 7,900,000 | ||||||||||||||
Loveland – Loveland, CO | $ | 5,456,000 | 4.5 | % | 100.0 | % | 1968/NAP | 113 | $ | 7,320,000 | ||||||||||||||
Terrace – Casper, WY | $ | 4,525,500 | 3.7 | % | 99.1 | % | 1977/NAP | 112 | $ | 5,850,000 | ||||||||||||||
Highview – Gillette, WY | $ | 4,246,000 | 3.5 | % | 96.8 | % | 1976/NAP | 95 | $ | 5,600,000 | ||||||||||||||
Cimmaron – Cheyenne, WY | $ | 4,240,000 | 3.5 | % | 85.7 | % | 1960/NAP | 154 | $ | 6,050,000 | ||||||||||||||
Castle Acres – O’Fallon, IL | $ | 4,105,500 | 3.4 | % | 85.6 | % | 1965/NAP | 167 | $ | 5,450,000 | ||||||||||||||
Enchanted Village – Alton, IL | $ | 3,272,500 | 2.7 | % | 45.4 | % | 1967/NAP | 520 | $ | 4,600,000 | ||||||||||||||
Shady Lane – Commerce City, CO | $ | 2,970,500 | 2.5 | % | 89.1 | % | 1948/NAP | 64 | $ | 3,800,000 | ||||||||||||||
Northern Hills – Springdale, AR | $ | 2,925,500 | 2.4 | % | 67.8 | % | 1955/NAP | 180 | $ | 4,300,000 | ||||||||||||||
Terrace II – Casper, WY | $ | 2,660,500 | 2.2 | % | 98.6 | % | 1975/NAP | 70 | $ | 3,400,000 | ||||||||||||||
Western Park – Springdale, AR | $ | 1,704,500 | 1.4 | % | 64.0 | % | 1965/NAP | 114 | $ | 2,500,000 | ||||||||||||||
Plainview – Casper, WY | $ | 1,466,000 | 1.2 | % | 80.3 | % | 1978/NAP | 71 | $ | 2,170,000 | ||||||||||||||
|
|
|
|
|
|
|
|
|
| |||||||||||||||
Total/Weighted Average | $ | 120,763,000 | 100.0 | % | 83.7 | % | 3,302 | $ | 163,800,000 | |||||||||||||||
|
|
|
|
|
|
|
|
|
| |||||||||||||||
The following table presents historical occupancy percentages at the RHP Portfolio I Properties:
Historical Occupancy(1)
12/31/2009 | 12/31/2010 | 12/31/2011 | ||
85% | 83% | 82% |
| (1) | Information obtained from the borrower. |
THE INFORMATION IN THIS STRUCTURAL AND COLLATERAL TERM SHEET IS NOT COMPLETE AND MAY BE AMENDED PRIOR TO THE TIME OF SALE. THIS TERM SHEET IS NOT AN OFFER TO SELL THESE SECURITIES AND IT IS NOT A SOLICITATION OF AN OFFER TO BUY THESE SECURITIES IN ANY JURISDICTION WHERE THE OFFER OR SALE IS NOT PERMITTED.
45
RHP PORTFOLIO I
Operating History and Underwritten Net Cash Flow. The following table presents certain information relating to the historical operating performance and the Underwritten Net Cash Flow at the RHP Portfolio I Properties:
Cash Flow Analysis
| TTM | U/W $ per | |||||||||||||||||||
| 2010 | 2011 | 10/31/2012 | U/W | Pad | ||||||||||||||||
Base Rent | $ | 13,006,532 | $ | 13,456,447 | $ | 14,067,867 | $ | 14,365,288 | $ | 4,350 | ||||||||||
Grossed Up Vacant Space | 0 | 0 | 0 | 2,312,561 | 700 | |||||||||||||||
Total Reimbursables | 0 | 0 | 0 | 0 | 0 | |||||||||||||||
Other Income | 2,200,625 | 2,207,916 | 2,323,719 | 2,316,069 | 701 | |||||||||||||||
Less Vacancy & Credit Loss | (383,941 | ) | (260,748 | ) | (256,066 | ) | (2,573,654 | ) (1) | (779 | ) | ||||||||||
|
|
|
|
|
|
|
|
|
| |||||||||||
Effective Gross Income | $ | 14,823,216 | $ | 15,403,615 | $ | 16,135,520 | $ | 16,420,264 | $ | 4,973 | ||||||||||
Total Operating Expenses | $ | 4,946,057 | $ | 5,313,385 | $ | 5,500,931 | $ | 5,619,292 | $ | 1,702 | ||||||||||
|
|
|
|
|
|
|
|
|
| |||||||||||
Net Operating Income | $ | 9,877,159 | $ | 10,090,230 | $ | 10,634,589 | $ | 10,800,972 | $ | 3,271 | ||||||||||
TI/LC | 0 | 0 | 0 | 0 | 0 | |||||||||||||||
Capital Expenditures | 0 | 0 | 0 | 172,067 | 52 | |||||||||||||||
|
|
|
|
|
|
|
|
|
| |||||||||||
Net Cash Flow | $ | 9,877,159 | $ | 10,090,230 | $ | 10,634,589 | $ | 10,628,905 | $ | 3,219 | ||||||||||
NOI DSCR | 1.36x | 1.39x | 1.47x | 1.49x | ||||||||||||||||
NCF DSCR | 1.36x | 1.39x | 1.47x | 1.47x | ||||||||||||||||
NOI DY | 8.2 | % | 8.4 | % | 8.8 | % | 8.9 | % | ||||||||||||
NCF DY | 8.2 | % | 8.4 | % | 8.8 | % | 8.8 | % | ||||||||||||
| (1) | The underwritten economic vacancy is 15.4%. The RHP Portfolio I Properties were 83.7% physically occupied as of October 31, 2012. |
Appraisal. As of the appraisal valuation dates ranging from September 16, 2012, to October 16, 2012, the RHP Portfolio I Properties had an aggregate “as-is” appraised value of $163,800,000.
Environmental Matters. According to the Phase I environmental site assessments dated from September 24, 2012 to October 9, 2012, there was no evidence of any recognized environmental conditions at the RHP Portfolio I Properties.
The Borrower. The borrower is comprised of 18 separate limited liability companies, each of which is a single purpose entity and has two independent directors. Legal counsel to the borrower delivered a non-consolidation opinion in connection with the origination of the RHP Portfolio I Mortgage Loan. Ross Partrich, the principal of the borrower, is the guarantor of certain nonrecourse carveouts under the RHP Portfolio I Mortgage Loan.
The Sponsors. The sponsors are Northstar Realty Finance Corporation (“Northstar”) and RHP Properties, Inc. Northstar is a publicly traded REIT (NYSE: NRF) and has approximately $7.0 billion of commercial real estate assets under management as of December 31, 2011. RHP Properties, Inc. is the nation’s second largest private owner and operator of manufactured housing communities. RHP Properties, Inc. currently owns and manages a total of 120 communities with over 28,000 housing units and sites across 21 states, with a combined value of approximately $1.0 billion. Northstar owns 85.0% of the borrower while affiliates of RHP Properties, Inc. own the remaining 15.0%. Northstar is the managing member of the borrower and Newbury Management Company (owned by Ross Partrich of RHP Properties, Inc.) is the asset and property manager of the RHP Portfolio I Properties.
Escrows. The loan documents provide for upfront escrows in the amount of $246,124 for real estate taxes, $89,791 for insurance premiums and $261,732 for immediate repairs. In addition, $2,288,268 was held back from loan proceeds in a lender controlled account to fund for maintenance, repairs and/or replacements at the RHP Portfolio I Properties over the term of the RHP Portfolio I Mortgage Loan.
The loan documents provide for ongoing monthly escrows in the amount of $42,704 for real estate taxes and $22,448 for insurance premiums. Additionally, the loan documents provide for a $13,758 monthly replacement reserve escrow beginning on February 1, 2016. The replacement reserve escrow will be capped at $500,000, exclusive of the initial deposit of $2,288,268.
Lockbox and Cash Management.The RHP Portfolio I Mortgage Loan requires a lender-controlled lockbox account, which is already in place, and that the property manager is obligated to deposit all revenues into such lockbox account. The loan documents also require that all cash revenues and all other monies received by the borrower or the property manager be deposited into the lockbox account within one business day after receipt. Prior to the occurrence of a Cash Management Period (as defined below), all funds on deposit in the lockbox account are swept into the borrower’s operating account. During a Cash Management Period, all funds on deposit in the lockbox account are swept to a lender-controlled cash management account.
A “Cash Management Period” will commence: (i) upon the occurrence and continuance of an event of default or (ii) if the debt service coverage ratio (or at any time when an approved mezzanine loan is outstanding, the Aggregate DSCR (as defined below)) is less than 1.05x. A Cash Management Period will end, with respect to matters in (i) above, if the event of default has been cured, or, with respect to matters in (ii) above, if the debt service coverage ratio (or at any time when an approved mezzanine loan is outstanding, the Aggregate DSCR) is at least 1.05x for two consecutive quarters.
The “Aggregate DSCR” is the aggregate debt service coverage ratio based on the amortizing debt service under the RHP Portfolio I Mortgage Loan and any approved mezzanine loan that is outstanding.
THE INFORMATION IN THIS STRUCTURAL AND COLLATERAL TERM SHEET IS NOT COMPLETE AND MAY BE AMENDED PRIOR TO THE TIME OF SALE. THIS TERM SHEET IS NOT AN OFFER TO SELL THESE SECURITIES AND IT IS NOT A SOLICITATION OF AN OFFER TO BUY THESE SECURITIES IN ANY JURISDICTION WHERE THE OFFER OR SALE IS NOT PERMITTED.
46
RHP PORTFOLIO I
Property Management. The RHP Portfolio I Properties are currently managed by an affiliate of the borrower.
Assumption. The borrower has the right to transfer all of the RHP Portfolio I Properties, subject to customary conditions set forth in the loan documents, including but not limited to: (i) no event of default has occurred and is continuing and (ii) if requested by the lender, rating agency confirmation from Fitch, KBRA and S&P that the transfer will not result in a downgrade, withdrawal or qualification of the respective ratings assigned to the Series 2013-C11 Certificates.
Partial Release.Following the second anniversary of the closing date of the Series 2013-C11 Certificates (except in the case of Early Release Properties) and in connection with a bona fide third party sale of an individual RHP Portfolio I property or a sale to an affiliate of RHP Properties, Inc. (but not to an affiliate of Northstar or the borrower), the borrower may obtain the release of an individual property from the lien of the RHP Portfolio I Mortgage Loan (and the related loan documents) in connection with a partial release upon the satisfaction of certain conditions including without limitation: (i) payment by the borrower of an amount equal to 120% of the then current allocated loan amount for the individual property to be released, together with applicable yield maintenance premium (or 110% of the allocated loan amount for Early Release Properties); (ii) all applicable REMIC requirements are satisfied; and (iii) after giving effect to such release, the debt service coverage ratio of the remaining RHP Portfolio I Properties is not less than the greater of (x) the debt service coverage ratio (or Aggregate DSCR if an approved mezzanine loan is outstanding) immediately prior to such release and (y) 1.15x. The debt service coverage ratio will be based upon the underwritten net cash flow of the remaining RHP Portfolio I Properties and the actual debt service constant of the loan at closing.
The “Early Release Properties” can be released at any time. They are the Enchanted Village property, the Shady Lane property, the Northern Hills property and the Western Park property.
Real Estate Substitution.At any time before December 6, 2021, the borrower may obtain a release of any individual RHP Portfolio I property from the lien of the mortgage in connection with a substitution of a different parcel subject to lender consent and the satisfaction of certain conditions, including without limitation: (i) no event of default exists at the time of substitution; (ii) the aggregate allocated loan amount of the properties released during the loan term will not exceed 25% of the original principal balance of the RHP Portfolio I Mortgage Loan; (iii) the fair market value of the new property will not be less than the fair market value of the substituted property both at closing and as of the date of substitution; (iv) the net operating income of the new property is not less than the net operating income of the substituted property both at closing and as of the date of substitution; (v) lender receives written confirmation from Fitch, KBRA and S&P that such substitution will not result in a qualification, downgrade or withdrawal of the then current ratings assigned to the WFRBS 2013-C11 certificates; (vi) all REMIC requirements are satisfied; (vii) the number of properties remaining under the RHP Portfolio I Mortgage Loan after giving effect to the substitution must not be less than prior to the substitution; (viii) the substitute properties must not be any of the RHP Portfolio II Properties; and (ix) the geographic diversity of the RHP Portfolio I Properties must not be diminished, in the lender’s discretion, as the result of a substitution.
Subordinate and Mezzanine Indebtedness.Northstar Realty Finance Corporation (“Northstar”), which indirectly owns 85% of the membership interests in the borrowers, was granted a preferred equity interest in a parent of the borrowers, RHP Western Portfolio Group, LLC. See “Description of the Mortgage Pool – Additional Indebtedness – Additional Financing and Preferred Equity” in the Free Writing Prospectus. Northstar has the ability to convert a portion of its preferred equity in the borrower into a mezzanine loan during the term of the RHP Portfolio I Mortgage Loan subject to certain conditions, including without limitation: (i) the mezzanine debt must be subordinate to the RHP Portfolio I Mortgage Loan and will be secured by the equity interests in the borrowers that own the RHP Portfolio I Properties; (ii) the mezzanine loan must not exceed $31,600,000; (iii) the Aggregate LTV (as defined below) must be no greater than 85%; and (iv) the Aggregate DSCR must be no less than 1.15x. Additionally, at Northstar’s option, the mezzanine loan may be alternatively structured as a larger mezzanine loan that is secured by both the equity in the borrower of the RHP Portfolio I Mortgage Loan and the equity interests in the borrower of the mortgage loan secured by the RHP Portfolio II Properties.
The “Aggregate LTV” is the aggregate loan-to-value ratio based on the outstanding balance of the RHP Portfolio I Mortgage Loan and any approved mezzanine loan that is outstanding.
Ground Lease. None.
Terrorism Insurance. The loan documents require that the “all risk” insurance policy required to be maintained by the borrower provide coverage for terrorism in an amount equal to the full replacement cost of the RHP Portfolio I Properties. The loan documents also require business interruption insurance covering no less than the 12-month period following the occurrence of a casualty event.
THE INFORMATION IN THIS STRUCTURAL AND COLLATERAL TERM SHEET IS NOT COMPLETE AND MAY BE AMENDED PRIOR TO THE TIME OF SALE. THIS TERM SHEET IS NOT AN OFFER TO SELL THESE SECURITIES AND IT IS NOT A SOLICITATION OF AN OFFER TO BUY THESE SECURITIES IN ANY JURISDICTION WHERE THE OFFER OR SALE IS NOT PERMITTED.
47
515 MADISON AVENUE
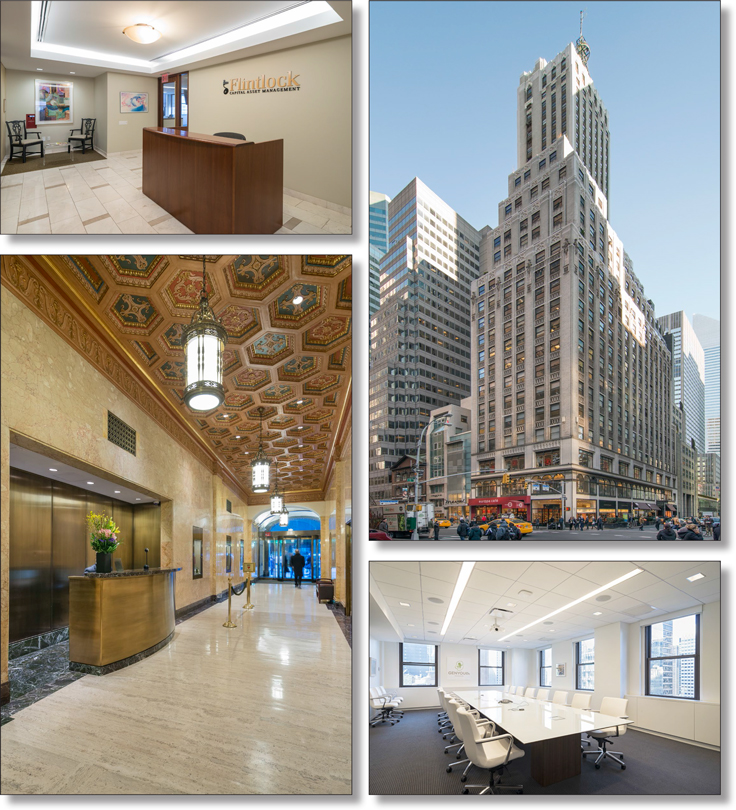
THE INFORMATION IN THIS STRUCTURAL AND COLLATERAL TERM SHEET IS NOT COMPLETE AND MAY BE AMENDED PRIOR TO THE TIME OF SALE. THIS TERM SHEET IS NOT AN OFFER TO SELL THESE SECURITIES AND IT IS NOT A SOLICITATION OF AN OFFER TO BUY THESE SECURITIES IN ANY JURISDICTION WHERE THE OFFER OR SALE IS NOT PERMITTED.
48
515 MADISON AVENUE
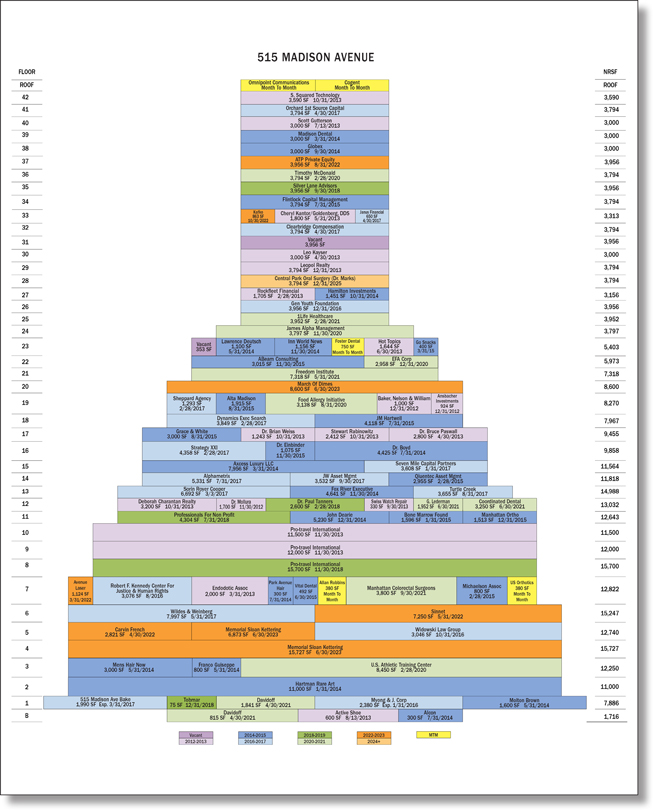
THE INFORMATION IN THIS STRUCTURAL AND COLLATERAL TERM SHEET IS NOT COMPLETE AND MAY BE AMENDED PRIOR TO THE TIME OF SALE. THIS TERM SHEET IS NOT AN OFFER TO SELL THESE SECURITIES AND IT IS NOT A SOLICITATION OF AN OFFER TO BUY THESE SECURITIES IN ANY JURISDICTION WHERE THE OFFER OR SALE IS NOT PERMITTED.
49
515 MADISON AVENUE
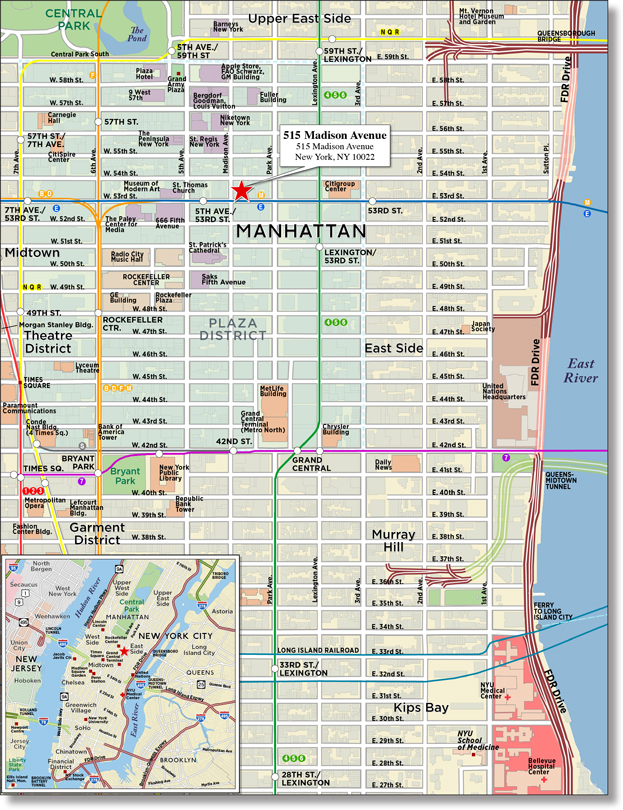
THE INFORMATION IN THIS STRUCTURAL AND COLLATERAL TERM SHEET IS NOT COMPLETE AND MAY BE AMENDED PRIOR TO THE TIME OF SALE. THIS TERM SHEET IS NOT AN OFFER TO SELL THESE SECURITIES AND IT IS NOT A SOLICITATION OF AN OFFER TO BUY THESE SECURITIES IN ANY JURISDICTION WHERE THE OFFER OR SALE IS NOT PERMITTED.
50
No. 4 - 515 Madison Avenue
Loan Information
Mortgage Loan Seller: | Wells Fargo Bank, National Association | |
Credit Assessment (Fitch/KBRA/S&P): | NR/NR/NR | |
Original Principal Balance: | $120,000,000 | |
Cut-off Date Principal Balance: | $120,000,000 | |
% of Initial Pool Balance: | 8.4% | |
Loan Purpose: | Refinance | |
Borrower Name: | 515 Madison LLC | |
Sponsors: | Jeffrey Gural | |
Mortgage Rate: | 3.860% | |
Note Date: | December 21, 2012 | |
Anticipated Repayment Date: | NAP | |
Maturity Date: | January 1, 2023 | |
IO Period: | 36 months | |
Loan Term (Original): | 120 months | |
Seasoning: | 1 month | |
Amortization Term (Original): | 360 | |
Loan Amortization Type: | Interest-only, Amortizing Balloon | |
Interest Accrual Method: | Actual/360 | |
Call Protection: | L(25),D(91),O(4) | |
Lockbox Type: | Soft/Springing Cash Management | |
Additional Debt: | None | |
Additional Debt Type: | NAP | |
| Escrows and Reserves(1): | ||||||||
Type: | Initial | Monthly | Cap (If Any) | |||||
Taxes | $228,177 | $228,177 | NAP | |||||
Insurance | $0 | Springing | NAP | |||||
Replacement Reserves | $1,000,000 | Springing | $ | 150,000 | ||||
TI/LC | $8,800,000 | Springing | $ | 2,000,000 | ||||
Property Information
Single Asset/Portfolio: | Single Asset | |
Property Type: | Office | |
Specific Property Type: | CBD | |
Location: | New York, NY | |
Size: | 324,265 SF | |
Cut-off Date Principal Balance Per Unit/SF: | $370.07 | |
Year Built/Renovated: | 1931/2010 | |
Title Vesting: | Fee | |
Property Manager: | Self-managed | |
3rdMost Recent Occupancy (As of): | 91.9% (12/31/2009) | |
2ndMost Recent Occupancy (As of): | 89.5% (12/31/2010) | |
Most Recent Occupancy (As of): | 97.3% (12/31/2011) | |
Current Occupancy (As of): | 98.7% (9/14/2012) | |
| Underwriting and Financial Information: | ||
3rdMost Recent NOI (As of): | $6,817,665 (12/31/2010) | |
2ndMost Recent NOI (As of): | $9,353,841 (12/31/2011) | |
Most Recent NOI (As of): | $11,376,613 (TTM 10/31/2012) | |
U/W Revenues: | $19,305,538 | |
U/W Expenses: | $8,189,640 | |
U/W NOI: | $11,115,898 | |
U/W NCF: | $10,893,129 | |
U/W NOI DSCR: | 1.64x | |
U/W NCF DSCR: | 1.61x | |
U/W NOI Debt Yield: | 9.3% | |
U/W NCF Debt Yield: | 9.1% | |
As-Is Appraised Value: | $230,000,000 | |
As-Is Appraisal Valuation Date: | December 4, 2012 | |
Cut-off Date LTV Ratio: | 52.2% | |
LTV Ratio at Maturity or ARD: | 45.0% | |
| (1) | See “Escrows” section. |
The Mortgage Loan. The mortgage loan (the “515 Madison Avenue Mortgage Loan”) is evidenced by a single promissory note that is secured by a first mortgage encumbering a 42-story office building located in New York, New York (the “515 Madison Avenue Property”). The 515 Madison Avenue Mortgage Loan was originated on December 21, 2012 by Wells Fargo Bank, National Association. The 515 Madison Avenue Mortgage Loan had an original balance of $120,000,000, has an outstanding principal balance as of the Cut-off Date of $120,000,000 and accrues interest at an interest rate of 3.860% per annum. The 515 Madison Avenue Mortgage Loan had an initial term of 120 months, has a remaining term of 119 months as of the Cut-off Date and requires interest-only payments for the first 36 months following origination and thereafter requires payments of principal and interest based on a 30-year amortization schedule. The 515 Madison Avenue Mortgage Loan matures on January 1, 2023.
Following the lockout period, the borrower has the right to defease the 515 Madison Avenue Mortgage Loan in whole, but not in part, on any due date before the scheduled maturity date. In addition, the 515 Madison Avenue Mortgage Loan is prepayable without penalty on or after October 1, 2022.
THE INFORMATION IN THIS STRUCTURAL AND COLLATERAL TERM SHEET IS NOT COMPLETE AND MAY BE AMENDED PRIOR TO THE TIME OF SALE. THIS TERM SHEET IS NOT AN OFFER TO SELL THESE SECURITIES AND IT IS NOT A SOLICITATION OF AN OFFER TO BUY THESE SECURITIES IN ANY JURISDICTION WHERE THE OFFER OR SALE IS NOT PERMITTED.
51
515 MADISON AVENUE
Sources and Uses
Sources | Uses | |||||||||||||||||
Original loan amount | $ | 120,000,000 | 100.0 | % | Loan payoff | $ | 72,725,820 | 60.6 | % | |||||||||
| Partner buyout | 29,859,645 | 24.9 | ||||||||||||||||
| Reserves | 10,028,177 | 8.4 | ||||||||||||||||
| Closing costs | 6,333,244 | 5.3 | ||||||||||||||||
| Return of equity | 1,053,115 | 0.9 | ||||||||||||||||
|
|
|
|
|
|
|
| |||||||||||
Total Sources | $ | 120,000,000 | 100.0 | % | Total Uses | $ | 120,000,000 | 100.0 | % | |||||||||
|
|
|
|
|
|
|
| |||||||||||
The Property. The 515 Madison Avenue Property is a 42-story, class B office building containing approximately 324,265 square feet located at the intersection of 53rd Street and Madison Avenue in the Plaza District of Midtown Manhattan. The 515 Madison Avenue Property was constructed in 1931 and a substantial renovation was completed in 2010. The renovation totaled approximately $8.0 million and included a lobby renovation, elevator modernization, new windows, new cooling tower, mechanical upgrades and new entrances. The 515 Madison Avenue Property also contains 8,701 square feet of ground floor retail space. The 515 Madison Avenue Property serves as the headquarters for Pro-Travel International. With annual sales of over $850.0 million, Pro-Travel International is one of the largest privately held full service travel agencies in the United States. Memorial Sloan Kettering’s space also houses the Sillerman Center for Rehabilitation, a state-of-the-art facility that provides services tailored to the special needs of people who are undergoing or have recently completed cancer treatment. Over the last 15 years, the 515 Madison Avenue Property has an average occupancy of approximately 97.5%. As of September 14, 2012, the 515 Madison Avenue Property was 98.7% leased to 91 tenants.
The following table presents certain information relating to the tenancies at the 515 Madison Avenue Property:
Major Tenants
Tenant Name | Credit Rating | Tenant NRSF | % of NRSF | Annual U/W Base Rent PSF(2) | Annual U/W Base Rent | % of Total Annual U/W Base Rent | Lease Expiration Date | |||||||||||||||||||
Major Tenants | ||||||||||||||||||||||||||
Pro-Travel International | NR/NR/NR | 39,200 | 12.1 | % | $ | 44.31 | $ | 1,736,800 | 9.8 | % | Various | (3) | ||||||||||||||
Memorial Sloan-Kettering | AA/Aa3/AA- | 22,600 | 7.0 | % | $ | 66.23 | $ | 1,496,798 | 8.5 | % | 6/30/2023 | |||||||||||||||
Davidoff | NR/NR/NR | 2,656 | 0.8 | % | $ | 232.20 | $ | 616,723 | 3.5 | % | 4/30/2021 | |||||||||||||||
Europa Cafe | NR/NR/NR | 1,990 | 0.6 | % | $ | 284.77 | $ | 566,692 | 3.2 | % | 3/31/2017 | |||||||||||||||
Hartman Rare Art | NR/NR/NR | 11,000 | 3.4 | % | $ | 49.96 | $ | 549,560 | 3.1 | % | 1/31/2014 | |||||||||||||||
March of Dimes | NR/NR/NR | 8,600 | 2.7 | % | $ | 56.28 | $ | 484,008 | 2.7 | % | 6/30/2023 | |||||||||||||||
Wildes and Weinberg | NR/NR/NR | 7,997 | 2.5 | % | $ | 53.06 | $ | 424,321 | 2.4 | % | 5/31/2017 | |||||||||||||||
|
|
|
|
|
|
|
| |||||||||||||||||||
Total Major Tenants | 94,043 | 29.0 | % | $ | 62.47 | $ | 5,874,902 | 33.3 | % | |||||||||||||||||
Non-Major Tenants | 225,913 | 69.7 | % | $ | 52.09 | $ | 11,768,328 | 66.7 | % | |||||||||||||||||
|
|
|
|
|
|
|
| |||||||||||||||||||
Occupied Collateral Total | 319,956 | 98.7 | % | $ | 55.14 | $ | 17,643,230 | 100.0 | % | |||||||||||||||||
|
|
|
| |||||||||||||||||||||||
Vacant Space | 4,309 | 1.3 | % | |||||||||||||||||||||||
|
|
|
| |||||||||||||||||||||||
Collateral Total | 324,265 | 100.0 | % | |||||||||||||||||||||||
|
|
|
| |||||||||||||||||||||||
| (1) | Certain ratings are those of the parent company whether or not the parent guarantees the lease. |
| (2) | Annual U/W Base Rent includes contractual rent steps through June 2013 and the average rent over the lesser of the lease term or loan term for investment grade rated tenants, unless otherwise noted below. |
| (3) | Pro-Travel International leases two spaces: 23,500 square feet with Annual U/W Base Rent of $928,250 ($39.50 per square foot) and a Lease Expiration Date of November 30, 2013 and 15,700 square feet with Annual U/W Base Rent of $808,550 ($51.50 per square foot) and a Lease Expiration Date of November 30, 2018. Pro-Travel International has a contractual renewal option for the 23,500 square feet space at a rent of $52.25 per square feet exercisable no later than February 28, 2013. |
THE INFORMATION IN THIS STRUCTURAL AND COLLATERAL TERM SHEET IS NOT COMPLETE AND MAY BE AMENDED PRIOR TO THE TIME OF SALE. THIS TERM SHEET IS NOT AN OFFER TO SELL THESE SECURITIES AND IT IS NOT A SOLICITATION OF AN OFFER TO BUY THESE SECURITIES IN ANY JURISDICTION WHERE THE OFFER OR SALE IS NOT PERMITTED.
52
515 MADISON AVENUE
The following table presents certain information relating to the lease rollover schedule at the 515 Madison Avenue Property:
Lease Expiration Schedule(1)(2)
Year Ending December 31, | No. of Leases Expiring | Expiring NRSF | % of Total NRSF | Cumulative Expiring NRSF | Cumulative % of Total NRSF | Annual U/W Base Rent | Annual U/W Base Rent PSF(3) | |||||||||||||||||||
MTM | 4 | 3,680 | 1.1 | % | 3,680 | 1.1 | % | $ | 160,359 | $ | 43.58 | |||||||||||||||
2013 | 15 | 53,618 | 16.5 | % | 57,298 | 17.7 | % | $ | 2,366,869 | $ | 44.14 | |||||||||||||||
2014 | 15 | 48,959 | 15.1 | % | 106,257 | 32.8 | % | $ | 2,446,403 | $ | 49.97 | |||||||||||||||
2015 | 12 | 24,673 | 7.6 | % | 130,930 | 40.4 | % | $ | 1,279,886 | $ | 51.87 | |||||||||||||||
2016 | 5 | 11,003 | 3.4 | % | 141,933 | 43.8 | % | $ | 585,887 | $ | 53.25 | |||||||||||||||
2017 | 13 | 50,543 | 15.6 | % | 192,476 | 59.4 | % | $ | 3,057,089 | $ | 60.48 | |||||||||||||||
2018 | 5 | 26,635 | 8.2 | % | 219,111 | 67.6 | % | $ | 1,500,058 | $ | 56.32 | |||||||||||||||
2019 | 0 | 0 | 0.0 | % | 219,111 | 67.6 | % | $ | 0 | $ | 0.00 | |||||||||||||||
2020 | 6 | 22,529 | 6.9 | % | 241,640 | 74.5 | % | $ | 1,028,065 | $ | 45.63 | |||||||||||||||
2021 | 6 | 22,928 | 7.1 | % | 264,568 | 81.6 | % | $ | 1,657,681 | $ | 72.30 | |||||||||||||||
2022 | 5 | 16,014 | 4.9 | % | 280,582 | 86.5 | % | $ | 828,836 | $ | 51.76 | |||||||||||||||
2023 | 3 | 32,200 | 10.2 | % | 313,782 | 96.8 | % | $ | 2,111,639 | $ | 63.60 | |||||||||||||||
Thereafter | 2 | 6,174 | 1.9 | % | 319,956 | 98.7 | % | $ | 620,459 | $ | 100.50 | |||||||||||||||
Vacant | 0 | 4,309 | 1.3 | % | 324,265 | 100.0 | % | $ | 0 | $ | 0.00 | |||||||||||||||
|
|
|
|
|
|
|
|
| ||||||||||||||||||
Total/Weighted Average | 91 | 324,265 | 100.0 | % | $ | 17,643,230 | $ | 55.14 | ||||||||||||||||||
|
|
|
|
|
|
|
|
| ||||||||||||||||||
| (1) | Information obtained from the underwritten rent roll. |
| (2) | Certain tenants may have lease termination options that are exercisable prior to the stated expiration date of the subject lease and that are not considered in the Lease Expiration Schedule. |
| (3) | Weighted Average Annual U/W Base Rent PSF excludes vacant space. |
The following table presents historical occupancy percentages at the 515 Madison Avenue Property:
Historical Occupancy(1)
12/31/2009 | 12/31/2010 | 12/31/2011 | ||
92% | 90% | 97% |
| (1) | Information obtained from a third party market resource. |
Operating History and Underwritten Net Cash Flow.The following table presents certain information relating to the historical operating performance and the Underwritten Net Cash Flow at the 515 Madison Avenue Property:
Cash Flow Analysis
| 2010 | 2011 | TTM 10/31/2012 | U/W | U/W $ per SF | ||||||||||||||||
Base Rent | $ | 11,810,472 | $ | 14,750,278 | $ | 15,881,982 | $ | 17,643,230 | $ | 54.41 | ||||||||||
Grossed Up Vacant Space | 0 | 0 | 0 | 256,775 | 0.79 | |||||||||||||||
Total Reimbursables(1) | 2,143,056 | 2,224,086 | 2,360,545 | 2,151,915 | 6.64 | |||||||||||||||
Other Income | 76,700 | 120,114 | 148,618 | 148,618 | 0.46 | |||||||||||||||
Less Vacancy & Credit Loss | 0 | 0 | 0 | (895,000 | )(1) | (2.76 | ) | |||||||||||||
|
|
|
|
|
|
|
|
|
| |||||||||||
Effective Gross Income | $ | 14,030,227 | $ | 17,094,479 | $ | 18,391,145 | $ | 19,305,538 | $ | 59.54 | ||||||||||
Total Operating Expenses | $ | 7,212,562 | $ | 7,740,638 | $ | 7,014,532 | $ | 8,189,640 | $ | 25.26 | ||||||||||
|
|
|
|
|
|
|
|
|
| |||||||||||
Net Operating Income | $ | 6,817,665 | $ | 9,353,841 | $ | 11,376,613 | $ | 11,115,898 | $ | 34.28 | ||||||||||
TI/LC | 0 | 0 | 0 | 157,916 | 0.49 | |||||||||||||||
Capital Expenditures | 0 | 0 | 0 | 64,853 | 0.20 | |||||||||||||||
|
|
|
|
|
|
|
|
|
| |||||||||||
Net Cash Flow | $ | 6,817,665 | $ | 9,353,841 | $ | 11,376,613 | $ | 10,893,129 | $ | 33.59 | ||||||||||
NOI DSCR | 1.01x | 1.38x | 1.68x | 1.64x | ||||||||||||||||
NCF DSCR | 1.01x | 1.38x | 1.68x | 1.61x | ||||||||||||||||
NOI DY | 5.7 | % | 7.8 | % | 9.5 | % | 9.3 | % | ||||||||||||
NCF DY | 5.7 | % | 7.8 | % | 9.5 | % | 9.1 | % | ||||||||||||
| (1) | The underwritten economic vacancy is 5.0%. The 515 Madison Avenue Property was 98.7% physically occupied as of September 14, 2012. |
Appraisal.As of the appraisal valuation date of December 4, 2012, the 515 Madison Avenue Property had an “as-is” appraised value of $230,000,000.
THE INFORMATION IN THIS STRUCTURAL AND COLLATERAL TERM SHEET IS NOT COMPLETE AND MAY BE AMENDED PRIOR TO THE TIME OF SALE. THIS TERM SHEET IS NOT AN OFFER TO SELL THESE SECURITIES AND IT IS NOT A SOLICITATION OF AN OFFER TO BUY THESE SECURITIES IN ANY JURISDICTION WHERE THE OFFER OR SALE IS NOT PERMITTED.
53
515 MADISON AVENUE
Environmental Matters.According to the Phase I environmental site assessment dated November 29, 2012, there was no evidence of any recognized environmental conditions at the 515 Madison Avenue Property.
Market Overview and Competition. According to the appraisal, the 515 Madison Avenue Property is located at the intersection of Madison Avenue and East 53rd Street in the Plaza District of Midtown Manhattan in New York, New York, directly above the E (Eighth Avenue Local) and V (Sixth Avenue Local) subway lines. Rockefeller Center, Grand Central Terminal, Central Park and the high-end retailers of Fifth Avenue are all located within close proximity. The 515 Madison Avenue Property is accessible from all major Manhattan commuter transportation hubs. According to the appraisal, the Plaza District office submarket contains approximately six million square feet of class B office space. The vacancy rate and average asking rental rate are 7.5% and $59.27 per square foot on a full service gross basis, respectively, as of the third quarter 2012.
The following table presents certain information relating to comparable office properties for the 515 Madison Avenue Property:
Competitive Set(1)
515 Madison Avenue (Subject) | 444 Madison Avenue | 477 Madison Avenue | 485 Madison Avenue | 488 Madison Avenue | 509 Madison Avenue | 600 Fifth Avenue | ||||||||
Location | New York, NY | New York, NY | New York, NY | New York, NY | New York, NY | New York, NY | New York, NY | |||||||
Distance from Subject | — | 0.2 miles | 0.1 miles | 0.1 miles | 0.1 miles | 0.1 miles | 0.4 miles | |||||||
Property Type | Office | Office | Office | Office | Office | Office | Office | |||||||
Year Built/Renovated | 1931/2010 | 1933/2009 | 1953/NAV | 1928/2004 | 1949/NAV | 1929/NAV | 1952/NAV | |||||||
Number of Stories | 42 | 42 | 24 | 25 | 24 | 23 | 28 | |||||||
Total GLA | 324,265 SF | 401,686 SF | 245,250 SF | 264,000 SF | 385,000 SF | 109,559 SF | 350,000 SF | |||||||
Total Occupancy | 99% | 89% | 83% | 97% | 96% | 92% | 88% |
| (1) | Information obtained from the appraisal dated December 7, 2012. |
The Borrower.The borrower is 515 Madison LLC, a Delaware limited liability company and single purpose entity with two independent directors. Legal counsel to the borrower delivered a non-consolidation opinion in connection with the origination of the 515 Madison Avenue Mortgage Loan. Jeffrey Gural, one of the principals of the borrowing entity, is the guarantor of certain nonrecourse carveouts under the 515 Madison Avenue Mortgage Loan.
The Sponsor.The sponsor for the 515 Madison Avenue Mortgage Loan is Jeffrey Gural. Mr. Gural’s commercial real estate portfolio totals 41 properties, primarily located throughout the New York City metropolitan area with a market value of approximately $3.4 billion. Mr. Gural is the chairman of Newmark Grubb Knight Frank, a full-service commercial real estate firm with more than 240 offices worldwide. Mr. Gural is responsible for the managing and leasing of the approximately eight million square feet of properties in which Newmark Grubb Knight Frank’s partners have ownership. Mr. Gural has one property in special servicing that matured in May 2010. See “Description of the Mortgage Pool – Statistical Characteristics of the Mortgage Loans – Default History, Prior Bankruptcy Issues and Other Proceedings” in the Free Writing Prospectus.
Escrows. The loan documents provide for an upfront reserve at closing in the amount of $1,000,000 for future capital expenditures. Should the replacement reserve balance fall below $150,000, monthly impounds of $5,404 will commence. There is an upfront $8,800,000 escrow for future tenant improvement and leasing costs (“TI/LC”). Should the TI/LC reserve balance fall below $2,000,000, monthly impounds of $40,533 will commence. Monthly escrow deposits for insurance are not required provided the following conditions are satisfied: (i) no event of default exists and is continuing; (ii) the liability and casualty policies maintained by the borrower are part of a blanket or umbrella policy approved by the lender; and (iii) the borrower provides the lender with evidence of renewal of the policies and paid receipts for the payment of insurance premiums when due.
Lockbox and Cash Management.The 515 Madison Avenue Mortgage Loan requires a lender-controlled lockbox account, which is already in place, and that the borrower deposit all rents directly to such lockbox account. The loan documents also require that all cash revenues and all other monies received by the borrower or the property manager relating to the 515 Madison Avenue Property be deposited into the lockbox account within two business days of receipt. Upon the occurrence of a Cash Trap Event Period (as defined below), all tenants will be directed to pay their rents directly into the lockbox account. Other than during a Cash Trap Event Period, all excess funds on deposit are distributed to the borrower.
A “Cash Trap Event Period” will commence upon the earlier of (i) the occurrence and continuance of an event of default or (ii) the NCF debt yield falling below 7.0% for two consecutive calendar quarters. A Cash Trap Event Period will expire upon (i) in the case of an event of default, the cure of such event of default or (ii) in the case of the NCF debt yield falling below 7.0%, the NCF debt yield being at least 7.5% for two consecutive calendar quarters.
Property Management. The 515 Madison Avenue Property is managed by an affiliate of the borrower.
THE INFORMATION IN THIS STRUCTURAL AND COLLATERAL TERM SHEET IS NOT COMPLETE AND MAY BE AMENDED PRIOR TO THE TIME OF SALE. THIS TERM SHEET IS NOT AN OFFER TO SELL THESE SECURITIES AND IT IS NOT A SOLICITATION OF AN OFFER TO BUY THESE SECURITIES IN ANY JURISDICTION WHERE THE OFFER OR SALE IS NOT PERMITTED.
54
515 MADISON AVENUE
Assumption.No assumptions are permitted, however the borrower has a right to certain permitted equity transfers of the 515 Madison Avenue Property, provided that (i) no event of default has occurred and is continuing; (ii) certain minimum equity requirements by the owners and principals of the borrowing entity have been met, as further defined in the loan documents; and (iii) certain other conditions are satisfied. Such permitted transfers include but are not limited to: (a) transfers among existing direct or indirect owners of the borrower and (b) transfers of not more than 49% of the interest in the borrower provided that any such transfer will not result in a change of management control.
Partial Release.Not permitted.
Real Estate Substitution.Not permitted.
Subordinate and Mezzanine Indebtedness.Not permitted.
Other Additional Financing.ATC0-515, LLC (“ATCO”), the indirect owner of 40% of the membership interest in the borrower, has pledged such interest to Carol Gold, Harry Subin and Strand Associates, a Pennsylvania limited partnership or any assignee thereof pursuant to a Purchase Money Pledge and Security Agreement dated as of December 31, 2009, as further detailed in the loan documents.
Ground Lease.None.
Terrorism Insurance.The loan documents require that the “all risk” insurance policy required to be maintained by the borrower provide coverage for terrorism in an amount equal to the full replacement cost of the 515 Madison Avenue Property; provided, however, that if TRIPRA is discontinued or not renewed, the borrower will not be required to spend more than two times the amount of the property insurance and business income coverage required by the loan documents on terrorism insurance at the time terrorism coverage is excluded. The loan documents also require business interruption insurance covering no less than the 18-month period following the occurrence of a casualty event, together with a 12-month extended period of indemnity.
THE INFORMATION IN THIS STRUCTURAL AND COLLATERAL TERM SHEET IS NOT COMPLETE AND MAY BE AMENDED PRIOR TO THE TIME OF SALE. THIS TERM SHEET IS NOT AN OFFER TO SELL THESE SECURITIES AND IT IS NOT A SOLICITATION OF AN OFFER TO BUY THESE SECURITIES IN ANY JURISDICTION WHERE THE OFFER OR SALE IS NOT PERMITTED.
55
BRENNAN INDUSTRIAL PORTFOLIO II
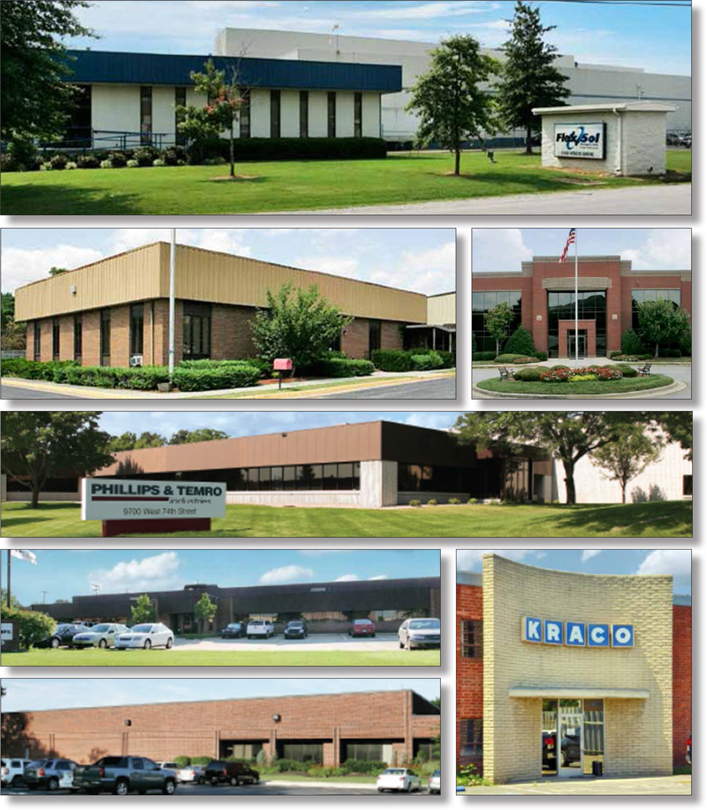
THE INFORMATION IN THIS STRUCTURAL AND COLLATERAL TERM SHEET IS NOT COMPLETE AND MAY BE AMENDED PRIOR TO THE TIME OF SALE. THIS TERM SHEET IS NOT AN OFFER TO SELL THESE SECURITIES AND IT IS NOT A SOLICITATION OF AN OFFER TO BUY THESE SECURITIES IN ANY JURISDICTION WHERE THE OFFER OR SALE IS NOT PERMITTED.
56
BRENNAN INDUSTRIAL PORTFOLIO II

THE INFORMATION IN THIS STRUCTURAL AND COLLATERAL TERM SHEET IS NOT COMPLETE AND MAY BE AMENDED PRIOR TO THE TIME OF SALE. THIS TERM SHEET IS NOT AN OFFER TO SELL THESE SECURITIES AND IT IS NOT A SOLICITATION OF AN OFFER TO BUY THESE SECURITIES IN ANY JURISDICTION WHERE THE OFFER OR SALE IS NOT PERMITTED.
57
No. 5 - Brennan Industrial Portfolio II
Loan Information
| Mortgage Loan Seller: | The Royal Bank of Scotland | |
Credit Assessment (Fitch/KBRA/S&P): | NR/NR/NR | |
| Original Principal Balance: | $118,410,523 | |
| Cut-off Date Principal Balance: | $118,410,523 | |
| % of Initial Pool Balance: | 8.2% | |
| Loan Purpose: | Acquisition | |
| Borrower Name(1): | Various | |
| Sponsor: | USIP-Brennan Ventures II, LLC | |
| Mortgage Rate: | 3.878% | |
| Note Date: | November 8, 2012 | |
| Anticipated Repayment Date: | NAP | |
| Maturity Date: | December 1, 2017 | |
| IO Period: | 60 months | |
| Loan Term (Original): | 60 months | |
| Seasoning: | 2 months | |
| Amortization Term (Original): | NAP | |
| Loan Amortization Type: | Interest-only, Balloon | |
| Interest Accrual Method: | Actual/360 | |
| Call Protection: | L(26),GRTR 1% or YM(30),O(4) | |
| Lockbox Type: | Hard/Springing Cash Management | |
| Additional Debt: | None | |
| Additional Debt Type: | NAP | |
Escrows and Reserves(2):
Type: | Initial | Monthly | Cap (If Any) | |||||||||
Tax | $ | 0 | Springing | NAP | ||||||||
Insurance | $ | 60,985 | $ | 8,712 | NAP | |||||||
Tenant Security Deposits | $ | 1,656,605 | $ | 0 | NAP | |||||||
Property Information
| Single Asset/Portfolio: | Portfolio | |
| Property Type: | Various | |
| Specific Property Type: | Various – See Table | |
| Location: | Various – See Table | |
| Size: | 3,913,170 SF | |
Cut-off Date Principal Balance Per Unit/SF: | $30.26 | |
| Year Built/Renovated: | Various – See Table | |
| Title Vesting: | Fee | |
| Property Manager: | Brennan Management LLC | |
| 3rdMost Recent Occupancy (As of): | 100.0% (12/31/2009) | |
| 2ndMost Recent Occupancy (As of): | 98.8% (12/31/2010) | |
| Most Recent Occupancy (As of): | 98.8% (12/31/2011) | |
| Current Occupancy (As of): | 100.0% (2/1/2013) | |
| Underwriting and Financial Information: | ||
| 3rdMost Recent NOI (As of): | $9,549,497 (12/31/2009) | |
| 2ndMost Recent NOI (As of): | $13,636,088 (12/31/2010) | |
| Most Recent NOI (As of): | $15,043,495 (12/31/2011) | |
| U/W Revenues: | $14,885,025 | |
| U/W Expenses: | $1,216,548 | |
| U/W NOI: | $13,668,478 | |
| U/W NCF: | $11,630,127 | |
| U/W NOI DSCR : | 2.94x | |
| U/W NCF DSCR: | 2.50x | |
| U/W NOI Debt Yield: | 11.5% | |
| U/W NCF Debt Yield: | 9.8% | |
| As-Is Appraised Value: | $182,075,000 | |
| As-Is Appraisal Valuation Date(3): | Various | |
| Cut-off Date LTV Ratio: | 65.0% | |
| LTV Ratio at Maturity or ARD: | 65.0% | |
| (1) | The borrower is comprised of 19 separate limited liability companies. |
| (2) | See “Escrows” section. |
| (3) | The As-Is Appraisal Valuation Dates range from October 5, 2012 to October 10, 2012. |
The Mortgage Loan. The mortgage loan (the “Brennan Industrial Portfolio II Mortgage Loan”) is evidenced by a single promissory note that is secured by a first mortgage encumbering 17 industrial buildings and two office buildings located in 13 states (the “Brennan Industrial Portfolio II Properties”). The Brennan Industrial Portfolio II Mortgage Loan was originated on November 8, 2012 by The Royal Bank of Scotland. The Brennan Industrial Portfolio II Mortgage Loan had an original principal balance of $118,410,523, has an outstanding principal balance as of the Cut-off Date of $118,410,523 and accrues interest at an interest rate of 3.878% per annum. The Brennan Industrial Portfolio II Mortgage Loan had an initial term of 60 months, has a remaining term of 58 months as of the Cut-off Date and requires interest-only payments through the term of the Brennan Industrial Portfolio II Mortgage Loan. The Brennan Industrial Portfolio II Mortgage Loan matures on December 1, 2017.
Following the lockout period (or at any time with respect to a release of the Sitel property), the borrower has the right to prepay the Brennan Industrial Portfolio II Mortgage Loan either in whole or in part (see “Partial Release” section), provided that the borrower pays the greater of a yield maintenance premium or a prepayment premium equal to 1.0% of the outstanding principal amount being prepaid. In addition, the Brennan Industrial Portfolio II Mortgage Loan is prepayable without penalty on or after September 1, 2017.
THE INFORMATION IN THIS STRUCTURAL AND COLLATERAL TERM SHEET IS NOT COMPLETE AND MAY BE AMENDED PRIOR TO THE TIME OF SALE. THIS TERM SHEET IS NOT AN OFFER TO SELL THESE SECURITIES AND IT IS NOT A SOLICITATION OF AN OFFER TO BUY THESE SECURITIES IN ANY JURISDICTION WHERE THE OFFER OR SALE IS NOT PERMITTED.
58
BRENNAN INDUSTRIAL PORTFOLIO II
Sources and Uses
Sources | Uses | |||||||||||||||||
Original loan amount | $ | 118,410,523 | 64.9 | % | Purchase price | $ | 178,618,385 | 97.9 | % | |||||||||
Sponsor’s new cash contribution | 64,100,000 | 35.1 | Reserves | 1,732,539 | 0.9 | |||||||||||||
| Closing costs | 2,159,549 | 1.2 | ||||||||||||||||
|
|
|
|
|
|
|
| |||||||||||
Total Sources | $ | 182,510,523 | 100.0 | % | Total Uses | $ | 182,510,523 | 100.0 | % | |||||||||
|
|
|
|
|
|
|
| |||||||||||
The Properties. The Brennan Industrial Portfolio II Mortgage Loan is secured by the fee interest in 17 industrial properties and two office properties totaling 3,913,170 rentable square feet and located in 13 states. The Brennan Industrial Portfolio II Properties range in size from 46,812 square feet to 437,911 square feet. All of the Brennan Industrial Portfolio II Properties are occupied by single tenants, and as of February 1, 2013, the Brennan Industrial Portfolio II Properties were 100.0% occupied. On average, tenants have occupied their respective spaces in the Brennan Industrial Portfolio II Properties for 18 years. Of the 19 Brennan Industrial Portfolio II Properties 15 are headquarters facilities for their respective tenants. Of the 19 Brennan Industrial Portfolio II Properties: four are occupied primarily by metals tenants; two are occupied by printing/mailing tenants; two are occupied by tenants manufacturing products used in automobiles or planes; two are occupied by tenants manufacturing styrofoam or packing products; two are occupied by craft products tenants; two are occupied by pool/hot tub and game room furniture tenants; and the remaining five are occupied by tenants in various other industries.
The following table presents certain information relating to the Brennan Industrial Portfolio II Properties:
Property Name – Location | Specific Property Type | Allocated Cut-off Date Principal Balance | % of Portfolio Cut-off Date Principal Balance | Current Occupancy | Year Built/ Renovated | Net Rentable Area (SF) | Appraised Value | |||||||||||||||||||
Kraco – Compton, CA | Flex | $ | 19,241,103 | 16.2 | % | 100.0 | % | 1956/1970 | 364,440 | $ | 29,600,000 | |||||||||||||||
Wincup – Arizona – Tolleson, AZ | Flex | $ | 13,475,250 | 11.4 | % | 100.0 | % | 1988/2010 | 322,070 | $ | 20,800,000 | |||||||||||||||
World’s Finest Chocolate – Chicago, IL | Flex | $ | 10,754,286 | 9.1 | % | 100.0 | % | 1950/1982 | 434,252 | $ | 16,600,000 | |||||||||||||||
Oracle – Polo – Winston-Salem, NC | Flex | $ | 8,292,462 | 7.0 | % | 100.0 | % | 1962/1999 | 437,911 | $ | 12,300,000 | |||||||||||||||
Plaid – Decatur – Decatur, GA | Flex | $ | 7,903,753 | 6.7 | % | 100.0 | % | 1980/NAP | 282,514 | $ | 12,200,000 | |||||||||||||||
Northwest Mailing – Chicago, IL | Flex | $ | 7,320,689 | 6.2 | % | 100.0 | % | 1953/2006 | 228,032 | $ | 11,300,000 | |||||||||||||||
Wincup – Georgia – Stone Mountain, GA | Flex | $ | 6,608,055 | 5.6 | % | 100.0 | % | 1966/1974 | 220,380 | $ | 10,200,000 | |||||||||||||||
Universal Pool – Armory – South Holland, IL | Flex | $ | 5,895,422 | 5.0 | % | 100.0 | % | 1970/NAP | 240,255 | $ | 9,100,000 | |||||||||||||||
Plaid – Norcross – Norcross, GA | Office | $ | 5,830,637 | 4.9 | % | 100.0 | % | 2000/NAP | 71,620 | $ | 9,000,000 | |||||||||||||||
Angstrom Graphics – Cleveland, OH | Flex | $ | 5,798,245 | 4.9 | % | 100.0 | % | 1938/1999 | 231,505 | $ | 8,950,000 | |||||||||||||||
Lyons – Louisville, KY | Flex | $ | 5,182,789 | 4.4 | % | 100.0 | % | 1981/2003 | 172,758 | $ | 8,000,000 | |||||||||||||||
Fitz Manufacturing – North Richland Hills, TX | Flex | $ | 4,049,054 | 3.4 | % | 100.0 | % | 1975/2000 | 129,000 | $ | 6,250,000 | |||||||||||||||
Phillips & Temro – Eden Prairie, MN | Flex | $ | 3,935,680 | 3.3 | % | 100.0 | % | 1979/2012 | 101,680 | $ | 6,075,000 | |||||||||||||||
Aramsco – Thorofare, NJ | Flex | $ | 3,287,831 | 2.8 | % | 100.0 | % | 1973/NAP | 99,783 | $ | 5,075,000 | |||||||||||||||
M.P. Pumps – Fraser, MI | Flex | $ | 2,801,945 | 2.4 | % | 100.0 | % | 1984/NAP | 81,769 | $ | 4,225,000 | |||||||||||||||
Microfinish – St. Louis, MO | Flex | $ | 2,461,825 | 2.1 | % | 100.0 | % | 1976/1996 | 144,786 | $ | 3,800,000 | |||||||||||||||
Shale Inland – Schiller Park, IL | Flex | $ | 2,137,900 | 1.8 | % | 100.0 | % | 1950/NAP | 193,789 | $ | 3,300,000 | |||||||||||||||
Universal Pool – 166thSt – South Holland, IL | Flex | $ | 1,813,976 | 1.5 | % | 100.0 | % | 1964/2006 | 109,814 | $ | 2,800,000 | |||||||||||||||
Sitel – Ocala, FL | Office | $ | 1,619,621 | 1.4 | % | 100.0 | % | 1960/2012 | 46,812 | $ | 2,500,000 | |||||||||||||||
|
|
|
|
|
|
|
|
|
| |||||||||||||||||
Total/Weighted Average | $ | 118,410,523 | 100.0 | % | 100.0 | % | 3,913,170 | $ | 182,075,000 | |||||||||||||||||
|
|
|
|
|
|
|
|
|
| |||||||||||||||||
THE INFORMATION IN THIS STRUCTURAL AND COLLATERAL TERM SHEET IS NOT COMPLETE AND MAY BE AMENDED PRIOR TO THE TIME OF SALE. THIS TERM SHEET IS NOT AN OFFER TO SELL THESE SECURITIES AND IT IS NOT A SOLICITATION OF AN OFFER TO BUY THESE SECURITIES IN ANY JURISDICTION WHERE THE OFFER OR SALE IS NOT PERMITTED.
59
BRENNAN INDUSTRIAL PORTFOLIO II
The following table presents certain information relating to the tenancies at the Brennan Industrial Portfolio II Properties:
Major Tenants
Tenant Name | Credit Rating | Tenant NRSF | % of NRSF | Annual U/W Base Rent PSF | Annual U/W Base Rent | % of Total Annual U/W Base Rent | Lease Expiration Date | |||||||||||||||||||
Major Tenants | ||||||||||||||||||||||||||
Kraco | NR/NR/NR | 364,440 | 9.3 | % | $ | 7.58 | $ | 2,762,292 | 16.9 | % | 8/31/2028 | |||||||||||||||
Wincup | NR/NR/NR | 542,450 | 13.9 | % | $ | 5.02 | $ | 2,720,949 | 16.6 | % | 12/31/2026 | |||||||||||||||
Plaid | NR/NR/NR | 354,134 | 9.0 | % | $ | 4.80 | $ | 1,700,014 | 10.4 | % | 10/31/2024 | |||||||||||||||
World’s Finest Chocolate | NR/NR/NR | 434,252 | 11.1 | % | $ | 3.43 | $ | 1,489,425 | 9.1 | % | 7/31/2027 | |||||||||||||||
Oracle Flexible Packaging | NR/NR/NR | 437,911 | 11.2 | % | $ | 2.44 | $ | 1,068,803 | 6.5 | % | 7/31/2030 | |||||||||||||||
Universal Pool | NR/NR/NR | 350,069 | 8.9 | % | $ | 2.99 | $ | 1,048,319 | 6.4 | % | 8/31/2027 | |||||||||||||||
Northwest Mailing | NR/NR/NR | 228,032 | 5.8 | % | $ | 4.27 | $ | 973,697 | 5.9 | % | 5/31/2023 | |||||||||||||||
Angstrom Graphics | NR/NR/NR | 231,505 | 5.9 | % | $ | 3.45 | $ | 799,762 | 4.9 | % | 1/31/2029 | |||||||||||||||
Lyons | NR/NR/NR | 172,758 | 4.4 | % | $ | 4.29 | $ | 741,935 | 4.5 | % | 10/31/2027 | |||||||||||||||
Shale Inland | NR/NR/NR | 193,789 | 5.0 | % | $ | 2.95 | $ | 572,012 | 3.5 | % | 9/30/2023 | |||||||||||||||
Fitz Manufacturing | NR/NR/NR | 129,000 | 3.3 | % | $ | 4.29 | $ | 552,920 | 3.4 | % | 4/30/2031 | |||||||||||||||
Phillips & Temro | NR/NR/NR | 101,680 | 2.6 | % | $ | 5.34 | $ | 542,562 | 3.3 | % | 12/31/2024 | |||||||||||||||
Aramsco | NR/NR/NR | 99,783 | 2.5 | % | $ | 4.54 | $ | 453,004 | 2.8 | % | 8/31/2024 | |||||||||||||||
M.P. Pumps | NR/NR/NR | 81,769 | 2.1 | % | $ | 4.75 | $ | 388,357 | 2.4 | % | 6/30/2023 | |||||||||||||||
Microfinish | NR/NR/NR | 144,786 | 3.7 | % | $ | 2.36 | $ | 341,695 | 2.1 | % | 2/28/2031 | |||||||||||||||
Sitel | NR/NR/NR | 46,812 | 1.2 | % | $ | 4.53 | $ | 212,244 | 1.3 | % | 5/31/2027 | (1) | ||||||||||||||
|
|
|
|
|
|
|
| |||||||||||||||||||
Occupied Collateral | 3,913,170 | 100.0 | % | $ | 4.18 | $ | 16,367,989 | 100.0 | % | |||||||||||||||||
|
|
|
| |||||||||||||||||||||||
Vacant Space | 0 | 0.0 | % | |||||||||||||||||||||||
|
|
|
| |||||||||||||||||||||||
Collateral Total | 3,913,170 | 100.0 | % | |||||||||||||||||||||||
|
|
|
| |||||||||||||||||||||||
| (1) | Sitel has the right to terminate its lease, upon provision of 180 days notice, on May 31, 2015, May 31, 2018, May 31, 2021 or May 31, 2024. |
The following table presents certain information relating to the lease rollover schedule at the Brennan Industrial Portfolio II Properties:
Lease Expiration Schedule(1)(2)
Year Ending December 31, | No. of Leases Expiring | Expiring NRSF | % of Total NRSF | Cumulative Expiring NRSF | Cumulative % of Total NRSF | Annual U/W Base Rent | Annual U/W Base Rent PSF | |||||||||||||||||||
MTM | 0 | 0 | 0.0 | % | 0 | 0.0 | % | $ | 0 | $ | 0.00 | |||||||||||||||
2013 | 0 | 0 | 0.0 | % | 0 | 0.0 | % | $ | 0 | $ | 0.00 | |||||||||||||||
2014 | 0 | 0 | 0.0 | % | 0 | 0.0 | % | $ | 0 | $ | 0.00 | |||||||||||||||
2015 | 0 | 0 | 0.0 | % | 0 | 0.0 | % | $ | 0 | $ | 0.00 | |||||||||||||||
2016 | 0 | 0 | 0.0 | % | 0 | 0.0 | % | $ | 0 | $ | 0.00 | |||||||||||||||
2017 | 0 | 0 | 0.0 | % | 0 | 0.0 | % | $ | 0 | $ | 0.00 | |||||||||||||||
2018 | 0 | 0 | 0.0 | % | 0 | 0.0 | % | $ | 0 | $ | 0.00 | |||||||||||||||
Thereafter | 19 | 3,913,170 | 100.0 | % | 3,913,170 | 100.0 | % | $ | 16,367,989 | $ | 4.18 | |||||||||||||||
Vacant | 0 | 0 | 0.0 | % | 3,913,170 | 100.0 | % | $ | 0 | $ | 0.00 | |||||||||||||||
|
|
|
|
|
|
|
|
| ||||||||||||||||||
Total/Weighted Average | 19 | 3,913,170 | 100.0 | % | $ | 16,367,989 | $ | 4.18 | ||||||||||||||||||
|
|
|
|
|
|
|
|
| ||||||||||||||||||
| (1) | Information obtained from the underwritten rent roll. |
| (2) | The termination option for Sitel (as referenced above) is not considered in the Lease Expiration Schedule. |
THE INFORMATION IN THIS STRUCTURAL AND COLLATERAL TERM SHEET IS NOT COMPLETE AND MAY BE AMENDED PRIOR TO THE TIME OF SALE. THIS TERM SHEET IS NOT AN OFFER TO SELL THESE SECURITIES AND IT IS NOT A SOLICITATION OF AN OFFER TO BUY THESE SECURITIES IN ANY JURISDICTION WHERE THE OFFER OR SALE IS NOT PERMITTED.
60
BRENNAN INDUSTRIAL PORTFOLIO II
The following table presents historical occupancy percentages at the Brennan Industrial Portfolio II Properties:
Historical Occupancy(1)(2)
12/31/2009 | 12/31/2010(3) | 12/31/2011(3) | ||
100% | 99% | 99% |
| (1) | Information obtained from the borrower. |
| (2) | The historical occupancies above represent occupancy on each date specified rather than an average over that particular year. |
| (3) | The vacancy in 2010 and 2011 reflects the space currently occupied by Sitel (1.2% of NRA). The previous tenant terminated its lease in August 2010 and Sitel took occupancy in June 2012. |
Operating History and Underwritten Net Cash Flow. The following table presents certain information relating to the historical operating performance and the Underwritten Net Cash Flow at the Brennan Industrial Portfolio II Properties:
Cash Flow Analysis
| 2009 | 2010 | 2011 | U/W | U/W $ per SF | ||||||||||||||||
Base Rent(1) | $ | 9,686,474 | $ | 13,782,592 | $ | 15,940,803 | $ | 16,367,989 | $ | 4.18 | ||||||||||
Grossed Up Vacant Space | 0 | 0 | 0 | 0 | 0.00 | |||||||||||||||
Total Reimbursables | 5,416 | 17,524 | 12,196 | 64,220 | 0.02 | |||||||||||||||
Other Income | 304,753 | 503,103 | 718,190 | 0 | 0.00 | |||||||||||||||
Less Vacancy & Credit Loss | 0 | 0 | 0 | (1,547,184 | )(2) | (0.40 | ) | |||||||||||||
|
|
|
|
|
|
|
|
|
| |||||||||||
Effective Gross Income | $ | 9,996,643 | $ | 14,303,219 | $ | 16,671,189 | $ | 14,885,025 | $ | 3.80 | ||||||||||
Total Operating Expenses | $ | 447,146 | $ | 667,131 | $ | 1,627,694 | $ | 1,216,548 | $ | 0.31 | ||||||||||
|
|
|
|
|
|
|
|
|
| |||||||||||
Net Operating Income | $ | 9,549,497 | $ | 13,636,088 | $ | 15,043,495 | $ | 13,668,478 | $ | 3.49 | ||||||||||
TI/LC | 0 | 0 | 0 | 663,125 | 0.17 | |||||||||||||||
Capital Expenditures | 0 | 0 | 0 | 1,375,225 | 0.35 | |||||||||||||||
|
|
|
|
|
|
|
|
|
| |||||||||||
Net Cash Flow | $ | 9,549,497 | $ | 13,636,088 | $ | 15,043,495 | $ | 11,630,127 | $ | 2.97 | ||||||||||
NOI DSCR | 2.05x | 2.93x | 3.23x | 2.94x | ||||||||||||||||
NCF DSCR | 2.05x | 2.93x | 3.23x | 2.50x | ||||||||||||||||
NOI DY | 8.1 | % | 11.5 | % | 12.7 | % | 11.5 | % | ||||||||||||
NCF DY | 8.1 | % | 11.5 | % | 12.7 | % | 9.8 | % | ||||||||||||
| (1) | Underwritten Base Rent is greater than 2009 and 2010 because the historical cash flows reflect periods of short-term vacancy at three properties, reduced rental collections at three properties and do not reflect full rent for several tenants that did not take occupancy until late 2009 or early 2010. |
| (2) | The underwritten economic vacancy is 9.4%. The Brennan Industrial Portfolio II Properties is 100.0% physically occupied as of February 1, 2013. |
Appraisal. As of the appraisal valuation dates ranging from October 5, 2012 to October 10, 2012, the Brennan Industrial Portfolio II Properties had an aggregate “as-is” appraised value of $182,075,000.
Environmental Matters. According to the Phase I environmental site assessments dated from October 3, 2012 to November 1, 2012, 10 of the Brennan Industrial Portfolio II Properties were found to have Recognized Environmental Conditions (“RECs”); however, no Phase II investigations were recommended for any of the Brennan Industrial Portfolio II Properties. The potential exposure from these RECs is mitigated in part by environmental indemnities in each lease under which the applicable tenants have agreed to indemnify the borrower against any losses, claims or judgments arising from environmental issues, for the life of their respective leases, other than any losses, claims or judgments (i) caused directly by the borrower or affiliates thereof or (ii) caused after the surrender of the premises. In addition, environmental insurance policies are in place at nine of the 10 Brennan Industrial Portfolio II Properties with RECs (the tenth property did not require insurance). The insurance policies cover both known and unknown environmental issues that pre-date issuance of the policies and the lender is named as an additional insured on all policies. All policies are provided by “A” rated insurance carriers and extend at least eighteen months beyond the term of the Brennan Industrial Portfolio II Mortgage Loan with expiries ranging from August 28, 2018 to November 7, 2022. In the case of the policy related to the tenant, Kraco, pre-existing pollution conditions coverage extends through August 28, 2018 and new pollution coverage expires on August 28, 2013. The borrower is required to extend the new pollution conditions coverage through the term of the Brennan Industrial II Portfolio Mortgage Loan upon the August 28, 2013 expiry. The new owner of the Brennan Industrial Portfolio II Properties is required to conduct a baseline environmental assessment of the MP Pumps property to qualify for the Michigan statutory defense to liability. The borrower, pursuant to the terms of the loan documents, completed a baseline environmental assessment of the MP Pumps property. For more information, see “Description of the Mortgage Pool – Assessments of Property Value and Condition – Environmental Assessments” in the Free Writing Prospectus.
The Borrower. The borrower is comprised of 19 separate single-purpose borrowing entities, each with the same managing member, RHP Western SPE-1, LLC, a Delaware limited liability company with two independent directors. Legal counsel to the borrower delivered a non-consolidation opinion in connection with the origination of the Brennan Industrial Portfolio II Mortgage Loan. Michael Brennan, Robert Vanecko, Samuel Mandarino, Scott McKibben, Allen Crosswell, Tod Greenwood and Troy MacMane serve as the guarantors of certain nonrecourse carveouts under the Brennan Industrial Portfolio II Mortgage Loan. Certain indirect investors in the transaction are members of the Islamic faith and require a Shari’ah compliant loan structure. In order to facilitate a
THE INFORMATION IN THIS STRUCTURAL AND COLLATERAL TERM SHEET IS NOT COMPLETE AND MAY BE AMENDED PRIOR TO THE TIME OF SALE. THIS TERM SHEET IS NOT AN OFFER TO SELL THESE SECURITIES AND IT IS NOT A SOLICITATION OF AN OFFER TO BUY THESE SECURITIES IN ANY JURISDICTION WHERE THE OFFER OR SALE IS NOT PERMITTED.
61
BRENNAN INDUSTRIAL PORTFOLIO II
Shari’ah compliant loan structure, the borrower master leases the Brennan Industrial Portfolio II Properties to 19 individual master lessees which are ultimately controlled by the nonrecourse carveout guarantors. See “Risk Factors – Risks Related to the Mortgage Loans and Mortgaged Properties – Shari’ah Compliant Loans” and “Description of the Mortgage Pool – Shari’ah Compliant Lending Structure” in the Free Writing Prospectus.
The Sponsor. The sponsor, USIP-Brennan Ventures II, LLC, is a joint venture between Brennan Investment Group, LLC and certain investors brought in by Gatehouse Bank plc (“Gatehouse”) and Arch Street Capital Advisors. Collectively, the managing principals of Brennan Investment Group, LLC have invested in over 4,000 properties in more than 60 cities in the United States, Europe and Canada throughout the course of their careers. Currently, Brennan Investment Group, LLC manages over 4.5 million square feet of industrial assets. Gatehouse is a public limited company in the United Kingdom and is majority owned by The Securities House KSCC. Gatehouse serves the Islamic finance sector, both in select markets globally and specifically in the City of London. Gatehouse focuses its core business activity on private wealth management, real estate investment, treasury products and services, and Shari’ah advisory. Founded in 1982, the Securities House KSCC is a Shari’ah-compliant investment company that is listed on the Kuwait Stock Exchange. Arch Street Capital Advisors, LLC assists international investors with their U.S. real estate strategies, including acquisition and joint venture advisory, financing advisory and asset management and disposition services. Arch Street Capital Advisors, LLC has advised clients on more than $4.0 billion of acquisitions, dispositions and financings. Arch Street Capital Advisors, LLC advised Gatehouse on this acquisition and has a participation interest in the venture.
Escrows. The loan documents provide for upfront escrows in the amount of $60,985 for insurance and $1,656,605 for tenant security deposits related to the Kraco, Northwest Mailing and Fitz Manufacturing tenants. The insurance escrow relates to the borrower’s umbrella insurance policy on the portfolio. Tenants are responsible for payment and maintenance of their own insurance and real estate taxes (with the exception of the Shale Inland tenant) and escrows for such payments will spring in the event that the borrower fails to provide evidence of full and timely payment or in the event of a default under any tenant lease or under the Brennan Industrial Portfolio II Mortgage Loan. The tenant security deposits will be held by the lender for the term of the Brennan Industrial Portfolio II Mortgage Loan.
The loan documents provide for ongoing monthly reserves in the amount of $8,712 for insurance.
Additionally, at closing, approximately $8.8 million of the $178.6 million purchase price was held in escrow at the title company to address any lost rental income and leasing costs associated with any tenants’ monetary defaults or early terminations over a 30-month period from the date of acquisition. At the end of such period, any amounts remaining in such escrow will be paid to the prior owner of the Brennan Industrial Portfolio II Properties.
Lockbox and Cash Management.The Brennan Industrial Portfolio II Mortgage Loan requires a lender-controlled lockbox account, which is already in place, and that the borrower directs tenants to pay their rents directly to such lockbox account. The loan documents also require that all cash revenues and all other monies received by the borrower or the manager be deposited into the lockbox account within one business day after receipt. Prior to the occurrence of a Cash Management Period (as defined below), all funds on deposit in the lockbox account are swept into the borrower’s operating account. During a Cash Management Period, all funds on deposit in the lockbox account are swept to a lender-controlled cash management account.
A “Cash Management Period” will commence (i) if an event of default has occurred and is continuing or (ii) if the debt service coverage ratio is less than 1.30x. A Cash Management Period will end either with respect to the matters described in clause (i) above, when such event of default has been cured, and with respect to the matters described in clause (ii) above, when the Brennan Industrial Portfolio II Properties have achieved a debt service coverage ratio of at least 1.30x for two consecutive calendar quarters.
Property Management. The Brennan Industrial Portfolio II Properties are managed by an affiliate of Brennan Investment Group, LLC.
Assumption. The borrower has the right to transfer all, but not less than all, of the Brennan Industrial Portfolio II Properties, subject to customary conditions set forth in the loan documents, including but not limited to: (i) no event of default has occurred and is continuing; (ii) the proposed transferee, property manager and management agreement are satisfactory to the lender and applicable rating agencies and (iii) the lender has received confirmation from Fitch, KBRA and S&P that such assumption will not result in a downgrade, withdrawal or qualification of the then current ratings assigned to the Series 2013-C11 Certificates.
Partial Release.Following the second anniversary of the issuance of the Series 2013-C11 Certificates, the borrower may obtain the release of an individual property (except for the Sitel property which may be released at any time) from the lien of the mortgage (and the related loan documents) in connection with a partial release upon the satisfaction of certain conditions including but not limited to: (i) the property to be released must be the subject of a sale to a bona fide third party purchaser who is not a Restricted Party (as defined below) or an affiliate of a Restricted Party; (ii) the borrower will provide the lender a written request at least 20 days prior to the proposed release date; (iii) no event of default has occurred or is continuing at the time that the release occurs; (iv) payment by the borrower in an amount equal to 120% of the allocated loan amount for the individual property to be released (110% for the Sitel property), along with any applicable yield maintenance or prepayment premium; and (v) after such release, the debt service coverage ratio of the remaining properties must not be less than 1.50x, provided that if such ratio is less than 1.50x but at least 1.30x, the borrower may still obtain such release by either (a) if the net sales proceeds for the applicable property being released exceeds the required release amount, making an additional payment of principal (together with any applicable yield maintenance premium) in an amount equal to the lesser of (x) the remaining net sales proceeds and (y) the amount that would cause the ratio to be no less than 1.50x or (b) if the net sales proceeds for the applicable property being released do not exceed the required release amount, by making an additional payment of principal (together with any applicable yield maintenance premium) in an amount that would cause the ratio to be no less than 1.50x.
A “Restricted Party” means the borrower, any principal or the guarantor or any affiliate thereof under the Brennan Industrial Portfolio II Mortgage Loan.
THE INFORMATION IN THIS STRUCTURAL AND COLLATERAL TERM SHEET IS NOT COMPLETE AND MAY BE AMENDED PRIOR TO THE TIME OF SALE. THIS TERM SHEET IS NOT AN OFFER TO SELL THESE SECURITIES AND IT IS NOT A SOLICITATION OF AN OFFER TO BUY THESE SECURITIES IN ANY JURISDICTION WHERE THE OFFER OR SALE IS NOT PERMITTED.
62
BRENNAN INDUSTRIAL PORTFOLIO II
Expansion Release: On any business day, the Brennan Industrial Portfolio II borrower may obtain the release of the Wincup Expansion Parcel (as defined below) from the lien of the mortgage encumbering the Wincup – Georgia property (and the related loan documents), upon the satisfaction of certain conditions including but not limited to the following: (i) the Wincup tenant exercised its expansion option pursuant to the terms of its lease; (ii) the borrower provides 20 days prior written notice, accompanied by all related purchase documents; (iii) the Brennan Industrial Portfolio II borrower pays the lender 100% of the net sales proceeds with respect to the Wincup Expansion Parcel together with the applicable yield maintenance premium; (iv) the improvements to be constructed on the Wincup Expansion Parcel are free standing and in no way connected to existing improvements on the Wincup - Georgia property; (v) the lender has received confirmation from Fitch, KBRA and S&P that the release of the Wincup Expansion Parcel will not result in a downgrade, withdrawal or qualification of the then current ratings assigned to the Series 2013-C11 Certificates; and (vi) the lender has received an opinion of counsel stating that the release of the Wincup Expansion Parcel will not adversely affect the status of the Series 2013-C11 Certificates.
The “Wincup Expansion Parcel” is a specific parcel of the Wincup – Georgia property as further described in the loan documents. No value was attributed to this parcel in the appraisal of the Wincup – Georgia property.
Real Estate Substitution.The borrower may obtain a release of any of the individual Brennan Industrial Portfolio II Properties from the lien of the mortgage in connection with a substitution of a different property subject to lender consent with 30 days notice and the satisfaction of certain conditions, including but not limited to: (i) no event of default has occurred or is continuing; (ii) the allocated loan amount for all properties substituted into the Brennan Industrial Portfolio II Mortgage Loan may not exceed 25% of the original principal amount of the Brennan Industrial Portfolio II Mortgage Loan; (iii) after giving effect to such substitution, the loan-to-value ratio of the Brennan Industrial Portfolio II Properties must not exceed the lesser of the loan-to-value ratio immediately prior to such substitution or 64.8%; (iv) after giving effect to such substitution, the debt service coverage ratio of the Brennan Industrial Portfolio II Properties must not be less than the greater of the debt service coverage ratio immediately prior to such substitution or 1.50x; (v) the lender receives written confirmation from Fitch, KBRA and S&P that the substitution will not result in a downgrade, qualification or withdrawal of the then current ratings assigned to any class of Series 2013-C11 Certificates; and (vi) at no time will the total number of properties secured by the Brennan Industrial Portfolio II Mortgage Loan exceed 25 and borrower may not request more than six substitutions.
Subordinate and Mezzanine Indebtedness.Not permitted.
Ground Lease. None.
Terrorism Insurance. The loan documents require that the “all risk” insurance policy required to be maintained by the borrower provide coverage for terrorism in an amount equal to the full replacement cost of the Brennan Industrial Portfolio II Properties. The loan documents also require business interruption insurance covering no less than the 12-month period following the occurrence of a casualty event.
THE INFORMATION IN THIS STRUCTURAL AND COLLATERAL TERM SHEET IS NOT COMPLETE AND MAY BE AMENDED PRIOR TO THE TIME OF SALE. THIS TERM SHEET IS NOT AN OFFER TO SELL THESE SECURITIES AND IT IS NOT A SOLICITATION OF AN OFFER TO BUY THESE SECURITIES IN ANY JURISDICTION WHERE THE OFFER OR SALE IS NOT PERMITTED.
63
ONE SOUTH WACKER DRIVE

THE INFORMATION IN THIS STRUCTURAL AND COLLATERAL TERM SHEET IS NOT COMPLETE AND MAY BE AMENDED PRIOR TO THE TIME OF SALE. THIS TERM SHEET IS NOT AN OFFER TO SELL THESE SECURITIES AND IT IS NOT A SOLICITATION OF AN OFFER TO BUY THESE SECURITIES IN ANY JURISDICTION WHERE THE OFFER OR SALE IS NOT PERMITTED.
64
ONE SOUTH WACKER DRIVE
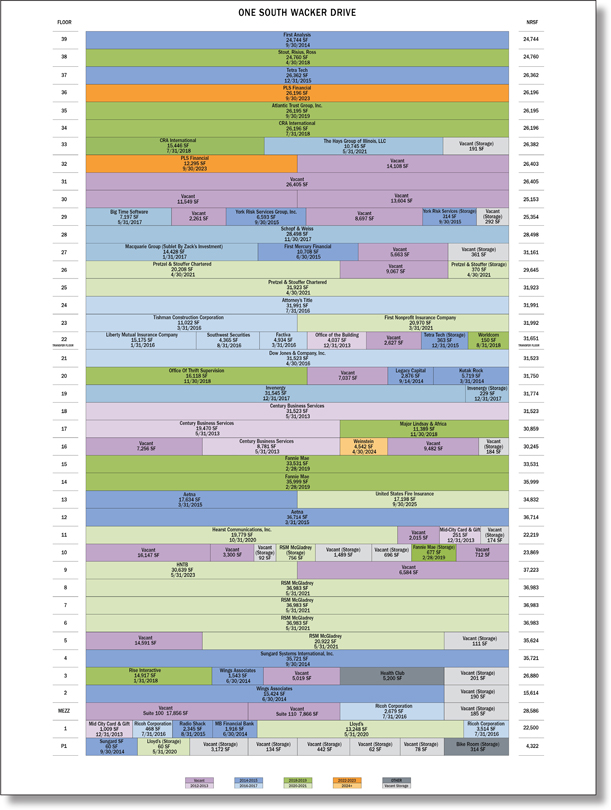
THE INFORMATION IN THIS STRUCTURAL AND COLLATERAL TERM SHEET IS NOT COMPLETE AND MAY BE AMENDED PRIOR TO THE TIME OF SALE. THIS TERM SHEET IS NOT AN OFFER TO SELL THESE SECURITIES AND IT IS NOT A SOLICITATION OF AN OFFER TO BUY THESE SECURITIES IN ANY JURISDICTION WHERE THE OFFER OR SALE IS NOT PERMITTED.
65
ONE SOUTH WACKER DRIVE

THE INFORMATION IN THIS STRUCTURAL AND COLLATERAL TERM SHEET IS NOT COMPLETE AND MAY BE AMENDED PRIOR TO THE TIME OF SALE. THIS TERM SHEET IS NOT AN OFFER TO SELL THESE SECURITIES AND IT IS NOT A SOLICITATION OF AN OFFER TO BUY THESE SECURITIES IN ANY JURISDICTION WHERE THE OFFER OR SALE IS NOT PERMITTED.
66
No. 6 - One South Wacker Drive
Loan Information
| Mortgage Loan Seller: | Wells Fargo Bank, National Association | |
Credit Assessment (Fitch/KBRA/S&P): | NR/NR/NR | |
| Original Principal Balance(1): | $70,000,000 | |
| Cut-off Date Principal Balance(1): | $70,000,000 | |
| % of Initial Pool Balance: | 4.9% | |
| Loan Purpose: | Acquisition | |
| Borrower Name: | 1 South Wacker Financial Associates, LLC | |
| Sponsors(2): | Various | |
| Mortgage Rate: | 3.750% | |
| Note Date: | December 6, 2012 | |
| Anticipated Repayment Date: | NAP | |
| Maturity Date: | January 1, 2018 | |
| IO Period: | 60 months | |
| Loan Term (Original): | 60 months | |
| Seasoning: | 1 month | |
| Amortization Term (Original): | NAP | |
| Loan Amortization Type: | Interest-only, Balloon | |
| Interest Accrual Method: | Actual/360 | |
| Call Protection: | L(25),D(31),O(4) | |
| Lockbox Type: | Hard/Upfront Cash Management | |
| Additional Debt(1): | Yes | |
| Additional Debt Type(1): | Pari Passu | |
Escrows and Reserves(3):
Type: | Initial | Monthly | Cap (If Any) | |||||||||
Taxes | $ | 4,492,124 | $ | 226,941 | NAP | |||||||
Insurance | $ | 0 | Springing | NAP | ||||||||
Replacement Reserves | $ | 0 | $ | 19,891 | NAP | |||||||
Initial Capital Improvements Reserve | $ | 5,000,000 | $ | 0 | NAP | |||||||
TI/LC | $ | 10,000,000 | Springing | $ | 5,000,000 | |||||||
Rent Concession Reserve | $ | 2,188,982 | $ | 0 | NAP | |||||||
Tenant Specific TI/LC Reserve | $ | 2,952,312 | $ | 0 | NAP | |||||||
Property Information
| Single Asset/Portfolio: | Single Asset | |
| Property Type: | Office | |
| Specific Property Type: | CBD | |
| Location: | Chicago, IL | |
| Size: | 1,193,448 SF | |
Cut-off Date Principal Balance Per Unit/SF(1): | $138.25 | |
| Year Built/Renovated: | 1982/2000 | |
| Title Vesting: | Fee | |
| Property Manager: | Self-managed | |
| 3rdMost Recent Occupancy (As of): | 80.6% (12/31/2009) | |
| 2ndMost Recent Occupancy (As of): | 82.8% (12/31/2010) | |
| Most Recent Occupancy (As of): | 78.3% (12/31/2011) | |
| Current Occupancy (As of)(4): | 82.0% (9/17/2012) | |
Underwriting and Financial Information:
| ||
| 3rdMost Recent NOI (As of): | $16,774,382 (12/31/2010) | |
| 2ndMost Recent NOI (As of): | $9,471,224 (12/31/2011) | |
| Most Recent NOI (As of): | $10,640,920 (TTM 8/31/2012) | |
| U/W Revenues: | $29,760,653 | |
| U/W Expenses: | $13,298,741 | |
| U/W NOI: | $16,461,911 | |
| U/W NCF: | $15,050,276 | |
| U/W NOI DSCR(1): | 2.62x | |
| U/W NCF DSCR(1): | 2.40x | |
| U/W NOI Debt Yield(1): | 10.0% | |
| U/W NCF Debt Yield(1): | 9.1% | |
| As-Is Appraised Value: | $226,000,000 | |
| As-Is Appraisal Valuation Date: | October 25, 2012 | |
| Cut-off Date LTV Ratio(1): | 73.0% | |
| LTV Ratio at Maturity or ARD(1): | 73.0% | |
| (1) | The One South Wacker Drive Loan Combination, totalling $165,000,000, is comprised of twopari passu notes (Notes A-1 and A-2). Note A-1 had an original balance of $70,000,000, has an outstanding principal balance as of the Cut-off Date of $70,000,000 and will be contributed to the WFRBS 2013-C11 Trust. Note A-2 had an original balance of $95,000,000 and is expected to be contributed to a future trust. All presented statistical information related to balances per square foot, loan-to-value ratio, debt service coverage ratio, and debt yields are based on the One South Wacker Drive Loan Combination. |
| (2) | The sponsors are HGGP Capital, LLC; HGGP Capital II, LLC; HGGP Capital III, LLC; HGGP Capital IV, LLC; HGGP Capital V, LLC; HGGP Capital VI, LLC; HGGP Capital VII, LLC and HGGP Capital VIII, LLC, each of which are subsidiaries of Harbor Group International LLC. |
| (3) | See “Escrows” section. |
| (4) | Current Occupancy includes Century Business Services (59,774 square feet or 5.0% of net rentable area), which has given notice that they will not renew their lease upon expiration on May 31, 2013. |
The Mortgage Loan. The mortgage loan (the “One South Wacker Drive Loan Combination”) is evidenced by twopari passupromissory notes (Note A-1 and Note A-2) secured by a first mortgage encumbering a 40-story office building located in the central business district of Chicago, Illinois (the “One South Wacker Drive Property”). The One South Wacker Drive Loan Combination was originated on December 6, 2012 by Wells Fargo Bank, National Association. The One South Wacker Drive Loan Combination had an original balance of $165,000,000, has an outstanding principal balance as of the Cut-off Date of $165,000,000 and accrues interest at an interest rate of 3.750% per annum. The One South Wacker Drive Loan Combination had an initial term of 60 months, has a remaining term of 59 months as of the Cut-off Date and requires interest-only payments through the term of the One South Wacker Drive Loan Combination. The One South Wacker Drive Loan Combination matures on January 1, 2018.
THE INFORMATION IN THIS STRUCTURAL AND COLLATERAL TERM SHEET IS NOT COMPLETE AND MAY BE AMENDED PRIOR TO THE TIME OF SALE. THIS TERM SHEET IS NOT AN OFFER TO SELL THESE SECURITIES AND IT IS NOT A SOLICITATION OF AN OFFER TO BUY THESE SECURITIES IN ANY JURISDICTION WHERE THE OFFER OR SALE IS NOT PERMITTED.
67
ONE SOUTH WACKER DRIVE
Note A-1 will be contributed to the WFRBS 2013-C11 Trust, had an original principal balance of $70,000,000 and has an outstanding principal balance as of the Cut-off Date of $70,000,000 (the “One South Wacker Drive Mortgage Loan”). Note A-2 had an original principal balance of $95,000,000, is expected to be securitized in a future trust and will represent the controlling interest in the One South Wacker Drive Loan Combination (the “One South Wacker Drive Companion Loan”). See “Description of the Mortgage Pool – Additional Indebtedness – The One South Wacker Drive Loan Combination” and “The Pooling and Servicing Agreement – Servicing of the Loan Combinations” in the Free Writing Prospectus.
Following the lockout period, the borrower has the right to defease the One South Wacker Drive Loan Combination in whole, but not in part, on any due date before the scheduled maturity date. In addition, the One South Wacker Drive Loan Combination is prepayable without penalty on or after October 1, 2017.
Sources and Uses
Sources | Uses | |||||||||||||||||
Original loan combination amount | $ | 165,000,000 | 65.8 | % | Purchase price | $ | 221,000,000 | 88.1 | % | |||||||||
Sponsor’s new cash contribution | 85,863,324 | 34.2 | Reserves | 24,633,418 | 9.8 | |||||||||||||
| Closing costs | 5,229,906 | 2.1 | ||||||||||||||||
|
|
|
|
|
|
|
| |||||||||||
Total Sources | $ | 250,863,324 | 100.0 | % | Total Uses | $ | 250,863,324 | 100.0 | % | |||||||||
|
|
|
|
|
|
|
| |||||||||||
The Property. The One South Wacker Drive Property is a 40-story, class B+ office building containing approximately 1,193,448 square feet located in the central business district of Chicago, Illinois. Built in 1982 and designed by the architect Helmut Jahn, the One South Wacker Drive Property is situated on a 1.1-acre parcel and includes a 129-space subterranean parking structure. The One South Wacker Drive Property contains 25,179 square feet of retail space, including Lloyd’s, a West Loop restaurant. The One South Wacker Drive Property serves as the headquarters for RSM McGladrey, the fifth largest United States provider of assurance, tax and consulting services. Tenancy also includes a variety of professional services firms and investment-grade rated tenants that make up approximately 21.2% of the net rentable area. In 2012, the borrower began a capital improvement program that will create a new atrium and winter garden, renovate the lobby (including the addition of a building concierge station), and update the elevators, common corridors and restrooms. As of September 17, 2012, the One South Wacker Drive Property was 82.0% leased to 45 tenants.
THE INFORMATION IN THIS STRUCTURAL AND COLLATERAL TERM SHEET IS NOT COMPLETE AND MAY BE AMENDED PRIOR TO THE TIME OF SALE. THIS TERM SHEET IS NOT AN OFFER TO SELL THESE SECURITIES AND IT IS NOT A SOLICITATION OF AN OFFER TO BUY THESE SECURITIES IN ANY JURISDICTION WHERE THE OFFER OR SALE IS NOT PERMITTED.
68
ONE SOUTH WACKER DRIVE
The following table presents certain information relating to the tenancies at the One South Wacker Drive Property:
Major Tenants
Tenant Name | Credit Rating (Fitch/Moody’s/ | Tenant NRSF | % of NRSF | Annual U/W Base Rent PSF(2) | Annual U/W Base Rent(2) | % of Total Annual U/W Base Rent | Lease Expiration Date | |||||||||||||||||||
Major Tenants | ||||||||||||||||||||||||||
RSM McGladrey | NR/NR/NR | 132,627 | 11.1 | % | $ | 16.46 | $ | 2,182,466 | 11.7 | % | 5/31/2021 | |||||||||||||||
Fannie Mae | AAA/Aaa/AA+(3) | 70,207 | 5.9 | % | $ | 19.04 | (4) | $ | 1,337,062 | (4) | 7.2 | % | 2/28/2019 | (5) | ||||||||||||
Century Business Services | NR/NR/NR | 59,774 | (6) | 5.0 | % | $ | 21.67 | $ | 1,295,303 | (6) | 6.9 | % | 5/31/2013 | (7) | ||||||||||||
CRA International | NR/NR/NR | 41,642 | 3.5 | % | $ | 26.49 | $ | 1,103,096 | 5.9 | % | 7/31/2018 | |||||||||||||||
Aetna | A/Baa1/A- | 54,348 | 4.6 | % | $ | 17.62 | (8) | $ | 957,612 | (8) | 5.1 | % | 3/31/2015 | |||||||||||||
Pretzel & Stouffer Chartered | NR/NR/NR | 52,501 | 4.4 | % | $ | 17.57 | $ | 922,366 | 4.9 | % | 4/30/2021 | (9) | ||||||||||||||
Dow Jones & Company | BBB+/NR/BBB+ | 31,523 | 2.6 | % | $ | 23.68 | (10) | $ | 746,538 | (10) | 4.0 | % | 4/30/2016 | |||||||||||||
|
|
|
|
|
|
|
| |||||||||||||||||||
Total Major Tenants | 442,622 | 37.1 | % | $ | 19.30 | $ | 8,544,443 | 45.7 | % | |||||||||||||||||
Non-Major Tenants | 535,761 | 44.9 | % | $ | 18.92 | $ | 10,136,685 | 54.3 | % | |||||||||||||||||
|
|
|
|
|
|
|
| |||||||||||||||||||
Occupied Collateral Total | 978,383 | 82.0 | % | $ | 19.09 | $ | 18,681,127 | 100.0 | % | |||||||||||||||||
|
|
|
| |||||||||||||||||||||||
Vacant Space | 215,065 | 18.0 | % | |||||||||||||||||||||||
|
|
|
| |||||||||||||||||||||||
Collateral Total | 1,193,448 | 100.0 | % | |||||||||||||||||||||||
|
|
|
| |||||||||||||||||||||||
| (1) | Certain ratings are those of the parent company whether or not the parent guarantees the lease. |
| (2) | Annual U/W Base Rent and Annual U/W Base Rent PSF includes contractual rent steps through April 2013 and the average rent over the lesser of the lease term or loan term for investment grade rated tenants, unless otherwise noted below. |
| (3) | Ratings are those of the United States whether or not the lease obligations are backed by the full faith and credit of the United States. Fannie Mae was placed into conservatorship of the Federal Housing Finance Agency (“FHFA”) on September 7, 2008, after the global financial crisis. The FHFA will act as the conservator until the agency has been stabilized. |
| (4) | The Annual U/W Base Rent was derived by averaging the annual rent including contractual rental increases through the loan term and assuming the termination option described below is not exercised. The current in-place rent is $17.73 per square foot, resulting in $1,244,770 of annual base rent. |
| (5) | On or after March 1, 2014, Fannie Mae has a one-time right to terminate their lease with 12 months notice and payment of a fee equal to their unamortized leasing costs plus three months base rent. |
| (6) | Major, Lindsey & Africa (11,389 square feet), Weinstein (4,542 square feet) and SKTYII (8,788 square feet) are current sublessees of Century Business Services. Major, Lindsey & Africa and Weinstein (the “Subtenants”) have executed direct leases that will commence June 1, 2013 upon the lease expiration of Century Business Services. The Subtenants have been underwritten based on their direct lease terms and Century Business Services NRSF and applicable Annual U/W Base Rent have been reduced by the Subtenants combined NRSF and Annual U/W Base Rent, respectively. |
| (7) | Century Business Services has given notice that they will not renew their lease and will vacate at lease expiration. |
| (8) | The Annual U/W Base Rent was derived by averaging the annual rent including contractual rental increases through the lease term. The current in-place rent is $17.25 per square foot, resulting in $937,503 of annual base rent. |
| (9) | On or after May 1, 2016, Pretzel & Stouffer has a one-time right to terminate their lease with 12 months notice and payment of a fee equal to $70.00 per square foot ($3,675,070 based on current square footage). The tenant also has a one-time right to terminate on May 1, 2018 with 12 months notice and payment of a fee equal to $40.00 per square foot ($2,100,040 based on current square footage). |
| (10) | The Annual U/W Base Rent was derived by averaging the annual rent including contractual rental increases through the lease term. The current in-place rent is $22.51 per square foot, resulting in $709,499 of annual base rent. |
THE INFORMATION IN THIS STRUCTURAL AND COLLATERAL TERM SHEET IS NOT COMPLETE AND MAY BE AMENDED PRIOR TO THE TIME OF SALE. THIS TERM SHEET IS NOT AN OFFER TO SELL THESE SECURITIES AND IT IS NOT A SOLICITATION OF AN OFFER TO BUY THESE SECURITIES IN ANY JURISDICTION WHERE THE OFFER OR SALE IS NOT PERMITTED.
69
ONE SOUTH WACKER DRIVE
The following table presents certain information relating to the lease rollover schedule at the One South Wacker Drive Property:
Lease Expiration Schedule(1)(2)
Year Ending December 31, | No. of Leases Expiring | Expiring NRSF | % of Total NRSF | Cumulative Expiring NRSF | Cumulative % of Total NRSF | Annual U/W Base Rent | Annual U/W Base Rent PSF(3) | |||||||||||||||||||
MTM | 0 | 0 | 0.0 | % | 0 | 0.0 | % | $ | 0 | $ | 0.00 | |||||||||||||||
2013 | 6 | 65,071 | 5.5 | % | 65,071 | 5.5 | % | $ | 1,442,743 | $ | 22.17 | |||||||||||||||
2014 | 8 | 73,019 | 6.1 | % | 138,090 | 11.6 | % | $ | 1,489,907 | $ | 20.40 | |||||||||||||||
2015 | 10 | 101,033 | 8.5 | % | 239,123 | 20.0 | % | $ | 1,900,652 | $ | 18.81 | |||||||||||||||
2016 | 10 | 105,671 | 8.9 | % | 344,794 | 28.9 | % | $ | 2,173,454 | $ | 20.57 | |||||||||||||||
2017 | 9 | 81,897 | 6.9 | % | 426,691 | 35.8 | % | $ | 1,507,508 | $ | 18.41 | |||||||||||||||
2018 | 8 | 84,216 | 7.1 | % | 510,907 | 42.8 | % | $ | 1,940,060 | $ | 23.04 | |||||||||||||||
Thereafter | 26 | 467,476 | 39.2 | % | 978,383 | 82.0 | % | $ | 8,226,803 | $ | 17.60 | |||||||||||||||
Vacant | 0 | 215,065 | 18.0 | % | 1,193,448 | 100.0 | % | $ | 0 | $ | 0.00 | |||||||||||||||
|
|
|
|
|
|
|
|
| ||||||||||||||||||
Total/Weighted Average | 77 | 1,193,448 | 100.0 | % | $ | 18,681,127 | $ | 19.09 | ||||||||||||||||||
|
|
|
|
|
|
|
|
| ||||||||||||||||||
| (1) | Information obtained from the underwritten rent roll. |
| (2) | Certain tenants may have lease termination options that are exercisable prior to the stated expiration date of the subject lease and that are not considered in the Lease Expiration Schedule. |
| (3) | Weighted Average Annual U/W Base Rent PSF excludes vacant space. |
The following table presents historical occupancy percentages at the One South Wacker Drive Property:
Historical Occupancy(1)
12/31/2009 | 12/31/2010 | 12/31/2011 | ||
81% | 83% | 78% |
| (1) | Information obtained from the borrower. |
Operating History and Underwritten Net Cash Flow.The following table presents certain information relating to the historical operating performance and the Underwritten Net Cash Flow at the One South Wacker Drive Property:
Cash Flow Analysis
| 2010 | 2011 | TTM 8/31/2012 | U/W(1) | U/W $ per SF | ||||||||||||||||
Base Rent | $ | 16,438,455 | $ | 16,697,689 | $ | 16,045,787 | $ | 18,681,127 | $ | 15.65 | ||||||||||
Grossed Up Vacant Space | 0 | 0 | 0 | 3,824,105 | 3.20 | |||||||||||||||
Total Reimbursables(1) | 10,941,134 | 5,690,603 | 7,912,136 | 10,519,526 | 8.81 | |||||||||||||||
Other Income | 635,474 | 390,602 | 436,378 | 560,000 | 0.47 | |||||||||||||||
Less Vacancy & Credit Loss | (863,285 | ) | (980,520 | ) | (942,006 | ) | (3,824,105 | )(2) | (3.20 | ) | ||||||||||
|
|
|
|
|
|
|
|
|
| |||||||||||
Effective Gross Income | $ | 27,151,778 | $ | 21,798,374 | $ | 23,452,295 | $ | 29,760,653 | $ | 24.94 | ||||||||||
Total Operating Expenses | $ | 10,377,396 | $ | 12,327,150 | $ | 12,811,375 | $ | 13,298,741 | $ | 11.14 | ||||||||||
|
|
|
|
|
|
|
|
|
| |||||||||||
Net Operating Income | $ | 16,774,382 | $ | 9,471,224 | $ | 10,640,920 | $ | 16,461,911 | $ | 13.79 | ||||||||||
TI/LC | 0 | 0 | 0 | 1,172,946 | 0.98 | |||||||||||||||
Capital Expenditures | 0 | 0 | 0 | 238,690 | 0.20 | |||||||||||||||
|
|
|
|
|
|
|
|
|
| |||||||||||
Net Cash Flow | $ | 16,774,382 | $ | 9,471,224 | $ | 10,640,920 | $ | 15,050,276 | $ | 12.61 | ||||||||||
NOI DSCR(3) | 2.67x | 1.51x | 1.70x | 2.62x | ||||||||||||||||
NCF DSCR(3) | 2.67x | 1.51x | 1.70x | 2.40x | ||||||||||||||||
NOI DY(3) | 10.2 | % | 5.7 | % | 6.4 | % | 10.0 | % | ||||||||||||
NCF DY(3) | 10.2 | % | 5.7 | % | 6.4 | % | 9.1 | % | ||||||||||||
| (1) | The increase in U/W Net Operating Income from the Net Operating Income for trailing 12 months ending August 31, 2012 and 2011 is primarily attributable to tax reimbursement reconciliation. Real estate taxes are paid one year in arrears, whereas tenants’ tax reimbursements are based upon the landlord’s estimate of the current year’s real estate tax expense (based upon the prior year’s taxes). Given that tax appeals are common in Cook County (Chicago), tax reimbursement adjustments are commonly realized one year following an appeal. Successful tax appeals resulted in tax credits for the calendar years 2009 and 2010 of approximately $1.4 million and $1.6 million, respectively. These credits were both included in the 2011 Total Reimbursables. Due to the 2010 real estate tax recoveries being billed at a higher tax estimate, the 2010 reimbursement income was approximately $1.6 million higher than normal. Also, because the 2011 real estate tax recoveries included both tax credits, the 2011 Total Reimbursables was lower than normal by approximately $3.0 million. Real estate tax reimbursements were also lower than normal for the trailing 12 months ending August 31, 2012, as the reconciliations were realized in December 2011. Total Reimbursables have been underwritten at a normalized level, reimbursing occupied tenants’ share of underwritten real estate taxes. |
| (2) | The underwritten economic vacancy is 17.0%. The One South Wacker Drive Property was 82.0% physically occupied as of September 17, 2012. Vacancy does not include Century Business Services (59,774 square feet or 5.0% of net rentable area), which has given notice that they will not renew their lease, which expires May 31, 2013. |
| (3) | DSCRs and debt yields are based on the One South Wacker Drive Loan Combination. |
THE INFORMATION IN THIS STRUCTURAL AND COLLATERAL TERM SHEET IS NOT COMPLETE AND MAY BE AMENDED PRIOR TO THE TIME OF SALE. THIS TERM SHEET IS NOT AN OFFER TO SELL THESE SECURITIES AND IT IS NOT A SOLICITATION OF AN OFFER TO BUY THESE SECURITIES IN ANY JURISDICTION WHERE THE OFFER OR SALE IS NOT PERMITTED.
70
ONE SOUTH WACKER DRIVE
Appraisal.As of the appraisal valuation date of October 25, 2012, the One South Wacker Drive Property had an “as-is” appraised value of $226,000,000.
Environmental Matters.According to the Phase I environmental site assessment dated November 2, 2012, there was no evidence of any recognized environmental conditions at the One South Wacker Drive Property.
Market Overview and Competition. According to the appraisal, the One South Wacker Drive Property is located at the southeast corner of the intersection of South Wacker Drive and West Madison Street in the central business district of Chicago, Illinois. The One South Wacker Drive Property is located two blocks northeast of Union Station, Chicago’s primary commuter train terminal and the only intercity rail terminal in Chicago. Furthermore, Ogilvie Transportation Center, which services three commuter rail (Metra) lines, is located two blocks west of the One South Wacker Drive Property. Metra operates commuter rail service between the Chicago central business district and northeast Illinois. Six of Metra’s 11 routes operate into and out of Union Station with nearly 130,000 passengers passing through the station on an average weekday and more than 42,000 each weekend. The One South Wacker Drive Property is also within walking distance of multiple stops for all five of the Chicago Transit Authority’s Elevated Train Lines. The third phase of “Revive Wacker Drive” reconstruction was recently completed by the City of Chicago at a total cost of approximately $300.0 million. The north-south portion of both Lower and Upper Wacker Drive was completely rebuilt, modernizing and creating safer, nicer and more efficient roadways for all travelers. As of March 2012, the unemployment rate for the Chicago metropolitan statistical area was 8.9%. 2012 population within a three-mile and five-mile radius of the One South Wacker Drive Property were 334,526 and 794,140, respectively. The average household income within the same three-mile and five-mile radii was $91,189 and $78,406, respectively.
According to the appraisal, the One South Wacker Drive Property is located within the West Loop office submarket, which contains approximately 35.5 million square feet of office space. The submarket vacancy and market rental rate for the West Loop submarket is approximately 13.0% and $35.43 per square foot on a full service gross basis, respectively, as of the second quarter of 2012.
The following table presents certain information relating to comparable office properties for the One South Wacker Drive Property:
Competitive Set(1)
| One South Wacker Drive (Subject) | 101 North Wacker Drive | 10, 20 and 30 South Wacker Drive | 311 South Wacker Drive | 123 North Wacker Drive | 191 North Wacker Drive | 300 South Wacker Drive | ||||||||
Location | Chicago, IL | Chicago, IL | Chicago, IL | Chicago, IL | Chicago, IL | Chicago, IL | Chicago, IL | |||||||
Distance from Subject | — | 0.1 miles | 0.5 miles | 0.6 miles | 0.2 miles | 0.3 miles | 0.6 miles | |||||||
Property Type | Office | Office | Office | Office | Office | Office | Office | |||||||
Year Built/Renovated | 1982/2000 | 1980/NAV | 1983 & 1987/NAV | 1990/NAV | 1986/NAV | 2003/NAV | 1971/NAV | |||||||
Number of Stories | 40 | 24 | 10 & 40 | 65 | 30 | 37 | 35 | |||||||
Total GLA | 1,193,448 SF | 599,503 SF | 2,351,265 SF | 1,276,850 SF | 540,621 SF | 732,000 SF | 512,436 SF | |||||||
Total Occupancy | 82% | 94% | 89% | 92% | 77% | 94% | 87% |
| (1) | Information obtained from the appraisal dated November 1, 2012. |
The Borrower.The borrower is 1 South Wacker Financial Associates, LLC, a Delaware limited liability company and single purpose entity with two independent directors. Legal counsel to the borrower delivered a non-consolidation opinion in connection with the origination of the One South Wacker Drive Loan Combination. Through various entities, Harbor Group International LLC owns 51.0% of the borrower with the remaining 49.0% owned by Clal Insurance Enterprises Holdings Ltd., an Israeli diversified financial services and insurance company. HGGP Capital, LLC, HGGP Capital II, LLC, HGGP Capital III, LLC, HGGP Capital IV, LLC, HGGP Capital V, LLC, HGGP Capital VI, LLC, HGGP Capital VII, LLC and HGGP Capital VIII, LLC (collectively, the “One South Wacker Drive Mortgage Loan Sponsors”) are the indirect owners of the borrower and guarantors of certain nonrecourse carveouts under the One South Wacker Drive Loan Combination.
The Sponsor.The One South Wacker Drive Mortgage Loan Sponsors are subsidiaries of Harbor Group International LLC (“Harbor”). Harbor’s holdings include over 90 properties with a total market value of approximately $3.8 billion, which includes approximately 10.5 million square feet of office, retail and hotel space, as well as approximately 24,500 multifamily units. Excluding the One South Wacker Drive Property, Harbor’s Chicago office portfolio totals approximately 1.9 million square feet across three properties: 2 North LaSalle, 300 South Wacker and the Burnham Center. Beginning in 2005, Harbor had various mortgage loan defaults and restructurings, and is currently in loan modification discussions on other mortgage loans. See “Description of the Mortgage Pool – Statistical Characteristics of the Mortgage Loans - Default History, Prior Bankruptcy Issues and Other Proceedings” in the Free Writing Prospectus.
Escrows.The loan documents provide for an upfront escrow at closing in the amount of $4,492,124 for taxes. There are also upfront escrows in the amount of $2,188,982 for rent concessions for the following tenants: PLS Group ($843,820), HNTB ($818,673), Major Lindsey Africa ($167,014), Big Time Software ($137,429), Weinstein ($120,198), The Hays Group ($62,242) and Rise Interactive ($39,606). There is an upfront escrow in the amount of $2,952,312 for existing tenant improvements and leasing costs (“TI/LC”) for the following tenants: HNTB ($1,747,069), RSM McGladrey ($657,221), Stout Risius Ross ($247,600), Major Lindsey Africa ($184,929), Weinstein ($79,286), Southwest Securities ($34,920) and Kutak Rock ($1,287). The loan documents also provide for upfront escrows at closing in the amount of $5,000,000 for a capital improvement program and $10,000,000 for
THE INFORMATION IN THIS STRUCTURAL AND COLLATERAL TERM SHEET IS NOT COMPLETE AND MAY BE AMENDED PRIOR TO THE TIME OF SALE. THIS TERM SHEET IS NOT AN OFFER TO SELL THESE SECURITIES AND IT IS NOT A SOLICITATION OF AN OFFER TO BUY THESE SECURITIES IN ANY JURISDICTION WHERE THE OFFER OR SALE IS NOT PERMITTED.
71
ONE SOUTH WACKER DRIVE
future tenant improvement and leasing costs. Should the TI/LC reserve balance fall below $5,000,000, monthly impounds of $99,454 will commence.
The loan documents provide for monthly deposits of $226,941 for real estate taxes and $19,891 for replacement reserves. The loan documents do not require monthly escrow deposits for insurance provided the following conditions are satisfied: (i) no event of default exists and is continuing; (ii) the liability and casualty policies maintained by the borrower are part of a blanket or umbrella policy approved by the lender; and (iii) the borrower provides the lender with evidence of renewal of the policies and paid receipts for the payment of insurance premiums when due.
Lockbox and Cash Management.The One South Wacker Drive Loan Combination requires a lender-controlled lockbox account, which is already in place, and that the tenants be directed to pay their rents directly to such lockbox account. The loan documents also require that all cash revenues and all other monies received by the borrower or the property manager relating to the One South Wacker Drive Property be deposited into the lockbox account within one business day of receipt. Prior to the occurrence of a Cash Trap Event Period (as defined below), all excess funds on deposit in the lockbox are swept into the borrower’s operating account on a daily basis.
Upon the occurrence of a Cash Trap Event Period all excess funds on deposit in the lockbox account will be swept to certain restricted accounts, and if an event of default exists, the lender will have the exclusive control of, and the right to withdraw and apply, the funds in the deposit account to payment of any and all debts, liabilities and obligations of the borrower in such order, proportion and priority as the lender may determine in its sole discretion.
A “Cash Trap Event Period” will commence upon the earlier of (i) the occurrence and continuance of an event of default or (ii) the NCF debt service coverage ratio (as defined in the loan documents) falling below 1.75x as tested with respect to each calendar quarter. A Cash Trap Event Period will expire upon: (i) in the case of an event of default, the cure of such event of default, or (ii) in the case of the NCF debt service coverage ratio falling below 1.75x, the NCF debt service coverage ratio being at least 1.85x for two consecutive calendar quarters.
Property Management. The One South Wacker Drive Property is managed by an affiliate of the borrower.
Assumption.The borrower has a two-time right to transfer the One South Wacker Drive Property, provided that no event of default has occurred and is continuing and certain other conditions are satisfied, including, but not limited to: (i) the lender’s reasonable determination that the proposed transferee and guarantor satisfy the lender’s credit review and underwriting standards, taking into consideration transferee experience, financial strength and general business standing; (ii) execution of a recourse guaranty and an environmental indemnity by an affiliate of the transferee; and (iii) if requested by the lender, rating agency confirmation from Fitch, KBRA and S&P that the transfer will not result in a downgrade, withdrawal or qualification of the respective ratings assigned to the Series 2013-C11 Certificates, and similar confirmations with respect to the ratings of any securities backed by the One South Wacker Drive Companion Loan.
Partial Release.Not permitted.
Real Estate Substitution.Not permitted.
Subordinate and Mezzanine Indebtedness.Not permitted.
Ground Lease.None.
Terrorism Insurance.The loan documents require that the “all risk” insurance policy required to be maintained by the borrower provide coverage for terrorism in an amount equal to the full replacement cost of the One South Wacker Drive Property. The loan documents also require business interruption insurance covering no less than the 18-month period following the occurrence of a casualty event, together with a six-month extended period of indemnity.
THE INFORMATION IN THIS STRUCTURAL AND COLLATERAL TERM SHEET IS NOT COMPLETE AND MAY BE AMENDED PRIOR TO THE TIME OF SALE. THIS TERM SHEET IS NOT AN OFFER TO SELL THESE SECURITIES AND IT IS NOT A SOLICITATION OF AN OFFER TO BUY THESE SECURITIES IN ANY JURISDICTION WHERE THE OFFER OR SALE IS NOT PERMITTED.
72
[THIS PAGE INTENTIONALLY LEFT BLANK.]
73
ENCANA OIL & GAS
THE INFORMATION IN THIS STRUCTURAL AND COLLATERAL TERM SHEET IS NOT COMPLETE AND MAY BE AMENDED PRIOR TO THE TIME OF SALE. THIS TERM SHEET IS NOT AN OFFER TO SELL THESE SECURITIES AND IT IS NOT A SOLICITATION OF AN OFFER TO BUY THESE SECURITIES IN ANY JURISDICTION WHERE THE OFFER OR SALE IS NOT PERMITTED.
74
ENCANA OIL & GAS

THE INFORMATION IN THIS STRUCTURAL AND COLLATERAL TERM SHEET IS NOT COMPLETE AND MAY BE AMENDED PRIOR TO THE TIME OF SALE. THIS TERM SHEET IS NOT AN OFFER TO SELL THESE SECURITIES AND IT IS NOT A SOLICITATION OF AN OFFER TO BUY THESE SECURITIES IN ANY JURISDICTION WHERE THE OFFER OR SALE IS NOT PERMITTED.
75
No. 7 - Encana Oil & Gas
| Loan Information | ||
| Mortgage Loan Seller: | Wells Fargo Bank, National Association | |
Credit Assessment (Fitch/KBRA/S&P): | NR/NR/NR | |
| Original Principal Balance: | $66,000,000 | |
| Cut-off Date Principal Balance: | $66,000,000 | |
| % of Initial Pool Balance: | 4.6% | |
| Loan Purpose: | Acquisition | |
| Borrower Name: | Cole of Plano (Legacy) TX, LLC | |
| Sponsor: | Cole Credit Property Trust III, Inc. | |
| Mortgage Rate: | 4.240% | |
| Note Date: | December 18, 2012 | |
| Anticipated Repayment Date: | January 1, 2023 | |
| Maturity Date: | January 1, 2033 | |
| IO Period: | 120 months | |
| Loan Term (Original): | 120 months | |
| Seasoning: | 1 month | |
| Amortization Term (Original): | NAP | |
| Loan Amortization Type: | Interest-only, ARD | |
| Interest Accrual Method: | Actual/360 | |
| Call Protection: | L(48),GRTR 1% or YM(68),O(4) | |
| Lockbox Type: | Hard/Upfront Cash Management | |
| Additional Debt: | None | |
| Additional Debt Type: | NAP | |
Escrows and Reserves(1):
Type: | Initial | Monthly | Cap (If Any) | |||||||||
Rent Reserve | $ | 1,226,030 | $ | 0 | NAP | |||||||
| Property Information | ||
| Single Asset/Portfolio: | Single Asset | |
| Property Type: | Office | |
| Specific Property Type: | Suburban | |
| Location: | Plano, TX | |
| Size: | 318,582 SF | |
Cut-off Date Principal Balance Per Unit/SF: | $207.17 | |
| Year Built/Renovated: | 2012/NAP | |
| Title Vesting: | Fee | |
| Property Manager: | Self-managed | |
| 3rd Most Recent Occupancy (As of)(2): | NAV | |
| 2nd Most Recent Occupancy (As of)(2): | NAV | |
| Most Recent Occupancy (As of)(2): | NAV | |
| Current Occupancy (As of)(3): | 100.0% (2/1/2013) | |
| Underwriting and Financial Information: | ||
| 3rdMost Recent NOI (As of)(2): | NAV | |
| 2ndMost Recent NOI (As of)(2): | NAV | |
| Most Recent NOI (As of)(2): | NAV | |
| U/W Revenues: | $11,558,165 | |
| U/W Expenses: | $4,355,883 | |
| U/W NOI: | $7,202,282 | |
| U/W NCF: | $7,138,566 | |
| U/W NOI DSCR: | 2.54x | |
| U/W NCF DSCR: | 2.52x | |
| U/W NOI Debt Yield: | 10.9% | |
| U/W NCF Debt Yield: | 10.8% | |
| As-Is Appraised Value: | $120,000,000 | |
| As-Is Appraisal Valuation Date: | November 21, 2012 | |
| Cut-off Date LTV Ratio: | 55.0% | |
| LTV Ratio at Maturity or ARD: | 55.0% | |
| (1) | See “Escrows” section. |
| (2) | Historical occupancy and NOI is not available as the property was built in 2012. |
| (3) | Encana Oil & Gas is delaying occupancy of the third and fourth floors (representing approximately 16.7% of the net rentale area) which remain in shell form. Encana Oil & Gas will be responsible for funding its own improvements for that space. |
The Mortgage Loan. The mortgage loan (the “Encana Oil & Gas Mortgage Loan”) is evidenced by a single promissory note that is secured by a first mortgage encumbering a single tenant office building in Plano, Texas (the “Encana Oil & Gas Property”). The Encana Oil & Gas Mortgage Loan was originated on December 18, 2012 by Wells Fargo Bank, National Association. The Encana Oil & Gas Mortgage Loan had an original principal balance of $66,000,000, has an outstanding principal balance as of the Cut-off Date of $66,000,000 and accrues interest at an interest rate of 4.240% per annum. The Encana Oil & Gas Mortgage Loan had an initial term of 120 months, has a remaining term of 119 months as of the Cut-off Date and requires payments of interest-only through the Anticipated Repayment Date (“ARD”). The ARD is January 1, 2023, and the final maturity date is January 1, 2033. In the event the Encana Oil & Gas Mortgage Loan is not paid off on or before the ARD, the borrower will be required to make payments of interest-only based on an interest rate equal to the greater of (i) the initial mortgage rate plus 5.0% and (ii) the sum of (a) the greater of (x) the offer side on the ARD of the 10-year swap yield (as described in the loan documents) and (y) the treasury rate as of the ARD and (b) 5.0%. The ARD automatically triggers a Cash Trap Event Period (as defined below) whereby all excess cash flow will be used to pay down the principal balance of the Encana Oil & Gas Mortgage Loan (see “Lockbox and Cash Management” section).
Following the lockout period, the borrower has the right to voluntarily prepay the Encana Oil & Gas Mortgage Loan in whole, but not in part, provided that the borrower pays the greater of a yield maintenance premium or a prepayment premium equal to 1.0% of the then outstanding principal balance. In addition, the Encana Oil & Gas Mortgage Loan is prepayable without penalty on or after October 1, 2022.
THE INFORMATION IN THIS STRUCTURAL AND COLLATERAL TERM SHEET IS NOT COMPLETE AND MAY BE AMENDED PRIOR TO THE TIME OF SALE. THIS TERM SHEET IS NOT AN OFFER TO SELL THESE SECURITIES AND IT IS NOT A SOLICITATION OF AN OFFER TO BUY THESE SECURITIES IN ANY JURISDICTION WHERE THE OFFER OR SALE IS NOT PERMITTED.
76
ENCANA OIL & GAS
Sources and Uses
Sources | Uses | |||||||||||||||||
Original loan amount | $ | 66,000,000 | 54.3 | % | Purchase price | $ | 120,000,000 | 98.6 | % | |||||||||
Rent credit | 1,226,030 | 1.0 | Reserves | 1,226,030 | 1.0 | |||||||||||||
Sponsor’s new cash contribution | 54,423,350 | 44.7 | Closing costs | 423,350 | 0.3 | |||||||||||||
|
|
|
|
|
|
|
| |||||||||||
Total Sources | $ | 121,649,380 | 100.0 | % | Total Uses | $ | 121,649,380 | 100.0 | % | |||||||||
|
|
|
|
|
|
|
| |||||||||||
The Property. The Encana Oil & Gas Property is a 12-story class A single-tenant office building containing approximately 318,582 rentable square feet and a contiguous seven-story parking garage located within the Legacy Town Center area of the Legacy Business Park in Plano, Texas. Constructed as a build-to-suit project in 2012, the property serves as the regional headquarters for Encana Oil & Gas, the exploration and production subsidiary of Encana Corporation, which is one of the largest natural gas producers in North America. The Encana Oil & Gas Property houses the company’s Mid-Continent Business Unit, which has relocated and expanded from its former North Dallas location. The Encana Oil & Gas Property is an architecturally distinctive office property with interior finishes including limestone, granite and marble as well as wood paneling and modular glass office walls. In addition, the building has 10-foot finished ceilings throughout, a unique interior staircase with glass guardrails and six high-speed elevators. The Encana Oil & Gas Property is situated on a 3.4-acre parcel and has a total of 1,280 parking spaces, accounting for a parking ratio of 4.0 spaces per 1,000 square feet of rentable area. As of February 1, 2013, the Encana Oil & Gas Property was 100.0% leased by Encana Oil & Gas. Please see footnote (1) to the Major Tenant table below regarding current occupancy status.
The following table presents certain information relating to the tenant at the Encana Oil & Gas Property:
Major Tenant
Tenant Name | Credit Rating | Tenant NRSF | % of NRSF | Annual U/W Base Rent PSF | Annual U/W Base Rent | % of Total Annual U/W Base Rent | Lease Expiration Date | |||||||||||||||||||||
Major Tenant | ||||||||||||||||||||||||||||
Encana Oil & Gas(1) | NR/Baa2/BBB | (2) | 318,582 | 100.0 | % | $ | 23.95 | $ | 7,631,428 | (1) | 100.0 | % | 6/30/2027 | (3) | ||||||||||||||
|
|
|
|
|
|
|
| |||||||||||||||||||||
Total Major Tenant | 318,582 | 100.0 | % | $ | 23.95 | $ | 7,631,428 | 100.0 | % | |||||||||||||||||||
|
|
|
|
|
|
|
| |||||||||||||||||||||
| (1) | Annual U/W Base Rent was derived by averaging the annual rent including contractual rental increases through the loan term. Encana Oil & Gas is currently paying a reduced rent through June 30, 2014 as a result of the tenant’s decision to delay occupancy of the third and fourth floors (representing approximately 16.7% of the net rentable area), which remain in shell form. Encana Oil & Gas will be responsible for funding its own improvements for the third and fourth floors, and an upfront reserve was established for the remaining amount of the reduced rent period (see “Escrows” section). In deriving the average rent over the loan term, Encana Oil & Gas was assumed to be paying full rent at the time of origination. Encana Oil & Gas’s full rent as of July 1, 2014 is $7,270,447, or $22.82 per square foot. |
| (2) | The ratings shown represent those of Encana Corporation, the parent company of Encana Oil & Gas. Encana Corporation does not guarantee Encana Oil & Gas’s lease. |
| (3) | Encana Oil & Gas has the right to terminate its lease on June 30, 2024 with 18 months notice and the payment of a termination fee of approximately $23.0 million. The termination fee is equal to approximately 89.7% of the tenant’s remaining scheduled contractual rent from the termination option date through the lease expiration date, as outlined in the lease. |
The following table presents certain information relating to the lease rollover schedule at the Encana Oil & Gas Property:
Lease Expiration Schedule(1)
Year Ending December 31, | No. of Leases Expiring | Expiring NRSF | % of Total NRSF | Cumulative Expiring NRSF | Cumulative % of Total NRSF | Annual U/W Base Rent | Annual U/W Base Rent PSF | |||||||||||||||||||||
MTM | 0 | 0 | 0.0 | % | 0 | 0.0 | % | $ | 0 | $ | 0.00 | |||||||||||||||||
2013 | 0 | 0 | 0.0 | % | 0 | 0.0 | % | $ | 0 | $ | 0.00 | |||||||||||||||||
2014 | 0 | 0 | 0.0 | % | 0 | 0.0 | % | $ | 0 | $ | 0.00 | |||||||||||||||||
2015 | 0 | 0 | 0.0 | % | 0 | 0.0 | % | $ | 0 | $ | 0.00 | |||||||||||||||||
2016 | 0 | 0 | 0.0 | % | 0 | 0.0 | % | $ | 0 | $ | 0.00 | |||||||||||||||||
2017 | 0 | 0 | 0.0 | % | 0 | 0.0 | % | $ | 0 | $ | 0.00 | |||||||||||||||||
2018 | 0 | 0 | 0.0 | % | 0 | 0.0 | % | $ | 0 | $ | 0.00 | |||||||||||||||||
2019 | 0 | 0 | 0.0 | % | 0 | 0.0 | % | $ | 0 | $ | 0.00 | |||||||||||||||||
2020 | 0 | 0 | 0.0 | % | 0 | 0.0 | % | $ | 0 | $ | 0.00 | |||||||||||||||||
2021 | 0 | 0 | 0.0 | % | 0 | 0.0 | % | $ | 0 | $ | 0.00 | |||||||||||||||||
2022 | 0 | 0 | 0.0 | % | 0 | 0.0 | % | $ | 0 | $ | 0.00 | |||||||||||||||||
2023 | 0 | 0 | 0.0 | % | 0 | 0.0 | % | $ | 0 | $ | 0.00 | |||||||||||||||||
Thereafter | 1 | (2) | 318,582 | 100.0 | % | 318,582 | 100.0 | % | $ | 7,631,428 | $ | 23.95 | ||||||||||||||||
Vacant | 0 | 0 | 0.0 | % | 318,582 | 100.0 | % | $ | 0 | $ | 0.00 | |||||||||||||||||
|
|
|
|
|
|
|
|
|
| |||||||||||||||||||
Total/Weighted Average | 1 | 318,582 | 100.0 | % | $ | 7,631,428 | $ | 23.95 | ||||||||||||||||||||
|
|
|
|
|
|
|
|
|
| |||||||||||||||||||
| (1) | Information obtained from the underwritten rent roll. |
| (2) | Encana Oil & Gas has the right to terminate its lease on June 30, 2024 with 18 months notice and the payment of a termination fee of approximately $23.0 million. The termination fee is equal to approximately 89.7% of the tenant’s remaining scheduled contractual rent from the termination option date through the lease expiration date, as outlined in the lease. |
THE INFORMATION IN THIS STRUCTURAL AND COLLATERAL TERM SHEET IS NOT COMPLETE AND MAY BE AMENDED PRIOR TO THE TIME OF SALE. THIS TERM SHEET IS NOT AN OFFER TO SELL THESE SECURITIES AND IT IS NOT A SOLICITATION OF AN OFFER TO BUY THESE SECURITIES IN ANY JURISDICTION WHERE THE OFFER OR SALE IS NOT PERMITTED.
77
ENCANA OIL & GAS
The following table presents historical occupancy percentages at the Encana Oil & Gas Property:
Historical Occupancy(1)
12/31/2009 | 12/31/2010 | 12/31/2011 | ||
| NAV | NAV | NAV |
| (1) | Historical occupancies are not available as the building was constructed in 2012. |
Operating History and Underwritten Net Cash Flow.The following table presents certain information relating to the Underwritten Net Cash Flow at the Encana Oil & Gas Property:
Cash Flow Analysis(1)
| U/W | U/W $ per SF | |||||||
Base Rent | $ | 7,631,428 | $ | 23.95 | ||||
Grossed Up Vacant Space | 0 | 0.00 | ||||||
Total Reimbursables | 4,155,680 | 13.04 | ||||||
Other Income | 0 | 0.00 | ||||||
Less Vacancy & Credit Loss | (228,943 | )(2) | (0.72 | ) | ||||
|
|
|
| |||||
Effective Gross Income | $ | 11,558,165 | $ | 36.28 | ||||
Total Operating Expenses | $ | 4,355,883 | $ | 13.67 | ||||
|
|
|
| |||||
Net Operating Income | $ | 7,202,282 | $ | 22.61 | ||||
TI/LC | 0 | 0.00 | ||||||
Capital Expenditures | 63,716 | 0.20 | ||||||
|
|
|
| |||||
Net Cash Flow | $ | 7,138,566 | $ | 22.41 | ||||
NOI DSCR | 2.54x | |||||||
NCF DSCR | 2.52x | |||||||
NOI DY | 10.9 | % | ||||||
NCF DY | 10.8 | % | ||||||
| (1) | Historical financials are not available as the building was constructed in 2012. |
| (2) | The underwritten economic vacancy is 3.0%. The Encana Oil & Gas Property is 100.0% leased as of February 1, 2013. |
Appraisal.As of the appraisal valuation date of November 21, 2012, the Encana Oil & Gas Property had an “as-is” appraised value of $120,000,000.
Environmental Matters.According to the Phase I environmental assessment dated October 25, 2012, there was no evidence of any recognized environmental conditions at the Encana Oil & Gas Property.
Market Overview and Competition.According to the appraisal, the Encana Oil & Gas Property is located within the Legacy Business Park development in Plano, Texas, approximately 20 miles north of the Dallas central business district and approximately 18 miles northeast of the Dallas Fort Worth International Airport. The Encana Oil & Gas Property is located one block east of the Dallas North Tollway, which provides direct access to the Dallas central business district and extends through the communities of Dallas, Addison, Plano and Frisco. The Legacy Business Park is a master-planned, 2,665-acre, mixed-use development, which has over 12 million square feet of office space and is home to many notable tenants’ national or regional headquarters including JC Penney, Rent-A-Center, Frito-Lay, Ericsson, Dr. Pepper Snapple Group, HP Enterprise Services (formerly EDS), PepsiCo, Capital One, Alliance Data, Bank of America Home Loans, McAfee and Pizza Hut/Yum! Restaurants International, among others. Situated within Legacy Business Park is Legacy Town Center, a pedestrian-oriented mixed-use development, which features urban style homes, retail establishments, a 400-room full-service Marriott hotel, casual and upscale restaurants, and open spaces in a community setting. In total, Legacy Town Center has over 3,300 residences including luxury apartments, lofts and townhomes, and more than 40,000 people work in the surrounding Legacy Business Park.
According to a third party market research report, the Encana Oil & Gas Property is located within the Upper Tollway/West Plano submarket, which has a total inventory of 55 class A buildings totaling approximately 13.5 million square feet. As of the third quarter of 2012, the submarket vacancy was 6.2% with average asking rents of $27.20 per square foot on a triple net basis. The submarket has experienced positive net absorption of approximately 213,000 square feet year-to-date.
THE INFORMATION IN THIS STRUCTURAL AND COLLATERAL TERM SHEET IS NOT COMPLETE AND MAY BE AMENDED PRIOR TO THE TIME OF SALE. THIS TERM SHEET IS NOT AN OFFER TO SELL THESE SECURITIES AND IT IS NOT A SOLICITATION OF AN OFFER TO BUY THESE SECURITIES IN ANY JURISDICTION WHERE THE OFFER OR SALE IS NOT PERMITTED.
78
ENCANA OIL & GAS
The following table presents certain information relating to comparable office properties for the Encana Oil & Gas Property:
Competitive Set(1)
Encana Oil & Gas | Legacy | Granite Park III | Campus at Legacy | Plaza at Legacy | One Legacy | |||||||
Location | Plano, TX | Plano, TX | Plano, TX | Plano, TX | Plano, TX | Plano, TX | ||||||
Distance from Subject | — | 0.6 miles | 1.1 miles | 2.2 miles | 0.9 miles | 1.5 miles | ||||||
Property Type | Office | Office | Office | Office | Office | Office | ||||||
Year Built/Renovated | 2012/NAP | 1999/NAP | 2006/NAP | 1982/2007 | 2001/NAP | 2008/NAP | ||||||
Total GLA | 318,582 SF | 254,482 SF | 361,271 SF | 379,404 SF | 215,499 SF | 214,110 SF | ||||||
Total Occupancy | 100% | 100% | 97% | 100% | 46% | 100% |
| (1) | Information obtained from the appraisal dated November 21, 2012. |
The Borrower.The borrower is Cole of Plano (Legacy) TX, LLC, a single purpose entity with two independent directors. Legal counsel to the borrower delivered a non-consolidation opinion in connection with the origination of the Encana Oil & Gas Mortgage Loan. Cole Credit Property Trust III, Inc. (“CCPT III”), the indirect owner of the borrower, is the guarantor of certain nonrecourse carveouts under the Encana Oil & Gas Mortgage Loan.
The Sponsor.The sponsor, CCPT III, is a non-traded public REIT that acquires and operates a diversified portfolio of commercial real estate investments primarily consisting of single-tenant income producing properties throughout the United States. As of November 30, 2012, CCPT III’s portfolio included 1,975 properties in 47 states totaling 71.3 million square feet with a combined acquisition cost of approximately $11.7 billion.
Escrows.The loan documents provide for an upfront escrow in the amount of $1,226,030, which was a credit from the seller and represents the remaining amount of reduced rent Encana Oil & Gas received for year one and year two of its lease due to its decision to delay occupancy of the third and fourth floors of the Encana Oil & Gas Property (representing approximately 16.7% of the net rentable area). The unoccupied space remains in shell form, and Encana Oil & Gas will be responsible for funding its own improvements for this space. Encana Oil & Gas will commence paying full rent on July 1, 2014. Provided no event of default has occurred and is continuing, lender will disburse an amount equal to one-third of the reserve amount ($408,677) on each of the monthly payment dates occurring in June 2013, January 2014 and July 2014.
Lockbox and Cash Management.The Encana Oil & Gas Mortgage Loan requires a lender-controlled lockbox account, which is already in place, and that the borrower direct the tenant to pay its rent directly to such lockbox account. The loan documents also require that all cash revenues and all other monies received by the borrower or manager relating to the Encana Oil & Gas Property be deposited into the lockbox account within two business days after receipt. Prior to the occurrence of a Cash Trap Event Period (as defined below), all funds on deposit in the lockbox account are swept into the borrower’s operating account on a daily basis. During a Cash Trap Event Period, all funds on deposit in the lockbox account are swept to a lender-controlled cash management account each business day (the “Excess Cash Flow Account”).
A “Cash Trap Event Period” will commence upon the earlier of: (i) the occurrence and continuance of an event of default; (ii) Encana Oil & Gas’s credit rating from S&P falling below ‘BBB-’; or (iii) the ARD. A Cash Trap Event Period will expire, with regard to the circumstances in clause (i), upon the cure of such event of default, or with regard to circumstances in clause (ii), (a) Encana Oil
& Gas being issued a rating from S&P of ‘BBB-’ or better; (b) the Encana Oil & Gas Property being re-leased to one or more replacement tenants, each of which (1) has a credit rating from S&P of ‘BBB-’ or better, or is otherwise acceptable to lender; (2) executes a lease containing terms and conditions acceptable to the lender; (3) has taken occupancy and has commenced paying rent; and (4) has delivered an estoppel agreement acceptable to the lender; or (c) the balance of the Excess Cash Flow Account being equal to or greater than $10.0 million. A Cash Trap Event Period triggered by the occurrence of the ARD will not expire.
Property Management. The Encana Oil & Gas Property is managed by an affiliate of the borrower.
Assumption.The borrower has a two-time right to transfer the Encana Oil & Gas Property, provided that no event of default has occurred and is continuing and certain other conditions are satisfied, including: (i) the lender’s reasonable determination that the proposed transferee and guarantor satisfy the lender’s credit review and underwriting standards, taking into consideration transferee experience, financial strength and general business standing; (ii) execution of a recourse guaranty and an environmental indemnity by an affiliate of the transferee; and (iii) if requested by the lender, rating agency confirmation from Fitch, KBRA and S&P that the transfer will not result in a downgrade, withdrawal or qualification of the respective ratings assigned to the Series 2013-C11 Certificates.
Right of First Refusal and Right of First Offer.Encana Oil & Gas has a right of first refusal (“ROFR”) and a right of first offer (“ROFO”) to purchase the Encana Oil & Gas Property. Neither the ROFR nor the ROFO is extinguished by a foreclosure of the Encana Oil & Gas Property; however, neither the ROFR nor the ROFO apply to a foreclosure or deed in lieu thereof.
Partial Release.Not permitted.
Real Estate Substitution.Not permitted.
Subordinate and Mezzanine Indebtedness.Not permitted.
THE INFORMATION IN THIS STRUCTURAL AND COLLATERAL TERM SHEET IS NOT COMPLETE AND MAY BE AMENDED PRIOR TO THE TIME OF SALE. THIS TERM SHEET IS NOT AN OFFER TO SELL THESE SECURITIES AND IT IS NOT A SOLICITATION OF AN OFFER TO BUY THESE SECURITIES IN ANY JURISDICTION WHERE THE OFFER OR SALE IS NOT PERMITTED.
79
ENCANA OIL & GAS
Ground Lease.None.
Terrorism Insurance.The loan documents require that the borrower maintain insurance against loss for acts of terrorism in an amount equal to the full replacement cost of the Encana Oil & Gas Property; provided, however, that the borrower is not required to pay premiums in excess of 200% of the current year’s stand alone terrorism policy premium. The loan documents also require business interruption insurance covering no less than the 12-month period following the occurrence of a casualty event, together with a 12-month extended period of indemnity.
THE INFORMATION IN THIS STRUCTURAL AND COLLATERAL TERM SHEET IS NOT COMPLETE AND MAY BE AMENDED PRIOR TO THE TIME OF SALE. THIS TERM SHEET IS NOT AN OFFER TO SELL THESE SECURITIES AND IT IS NOT A SOLICITATION OF AN OFFER TO BUY THESE SECURITIES IN ANY JURISDICTION WHERE THE OFFER OR SALE IS NOT PERMITTED.
80
[THIS PAGE INTENTIONALLY LEFT BLANK.]
81
SALT LAKE CITY FBI BUILDING

THE INFORMATION IN THIS STRUCTURAL AND COLLATERAL TERM SHEET IS NOT COMPLETE AND MAY BE AMENDED PRIOR TO THE TIME OF SALE. THIS TERM SHEET IS NOT AN OFFER TO SELL THESE SECURITIES AND IT IS NOT A SOLICITATION OF AN OFFER TO BUY THESE SECURITIES IN ANY JURISDICTION WHERE THE OFFER OR SALE IS NOT PERMITTED.
82
SALT LAKE CITY FBI BUILDING

THE INFORMATION IN THIS STRUCTURAL AND COLLATERAL TERM SHEET IS NOT COMPLETE AND MAY BE AMENDED PRIOR TO THE TIME OF SALE. THIS TERM SHEET IS NOT AN OFFER TO SELL THESE SECURITIES AND IT IS NOT A SOLICITATION OF AN OFFER TO BUY THESE SECURITIES IN ANY JURISDICTION WHERE THE OFFER OR SALE IS NOT PERMITTED.
83
No. 8 - Salt Lake City FBI Building
Loan Information
| Mortgage Loan Seller: | The Royal Bank of Scotland | |
Credit Assessment (Fitch/KBRA/S&P): | BBB-/NR/NR | |
| Original Principal Balance: | $46,800,000 | |
| Cut-off Date Principal Balance: | $46,800,000 | |
| % of Initial Pool Balance: | 3.3% | |
| Loan Purpose: | Acquisition | |
| Borrower Name: | SLK Funding Corp. | |
| Sponsor: | Gatehouse Bank | |
| Mortgage Rate: | 3.470% | |
| Note Date: | December 19, 2012 | |
| Anticipated Repayment Date: | January 1, 2020 | |
| Maturity Date: | January 1, 2043 | |
| IO Period: | 84 months | |
| Loan Term (Original): | 84 months | |
| Seasoning: | 1 month | |
| Amortization Term (Original): | NAP | |
| Loan Amortization Type: | Interest-only, ARD | |
| Interest Accrual Method: | Actual/360 | |
| Call Protection: | L(25),GRTR 1% or YM(55),O(4) | |
| Lockbox Type: | Hard/Springing Cash Management | |
| Additional Debt: | None | |
| Additional Debt Type: | NAP | |
Escrows and Reserves(1):
Type: | Initial | Monthly | Cap (If Any) | |||||||
Taxes | $ | 0 | Springing | NAP | ||||||
Insurance | $ | 0 | Springing | NAP | ||||||
Property Information
| Single Asset/Portfolio: | Single Asset | |
| Property Type: | Office | |
| Specific Property Type: | Suburban | |
| Location: | Salt Lake City, UT | |
| Size: | 163,040 SF | |
Cut-off Date Principal Balance Per Unit/SF: | $287.05 | |
| Year Built/Renovated: | 2012/NAP | |
| Title Vesting: | Fee | |
| Property Manager: | CBRE, Inc. | |
| 3rdMost Recent Occupancy (As of)(2): | NAV | |
| 2ndMost Recent Occupancy (As of)(2): | NAV | |
| Most Recent Occupancy (As of)(2): | NAV | |
| Current Occupancy (As of): | 100.0% (2/1/2013) | |
| Underwriting and Financial Information: | ||
| 3rdMost Recent NOI (As of)(2): | NAV | |
| 2ndMost Recent NOI (As of)(2): | NAV | |
| Most Recent NOI (As of)(2): | NAV | |
| U/W Revenues: | $6,368,884 | |
| U/W Expenses: | $1,466,725 | |
| U/W NOI: | $4,902,159 | |
| U/W NCF: | $4,869,551 | |
| U/W NOI DSCR: | 2.98x | |
| U/W NCF DSCR: | 2.96x | |
| U/W NOI Debt Yield: | 10.5% | |
| U/W NCF Debt Yield: | 10.4% | |
| As-Is Appraised Value: | $78,000,000 | |
| As-Is Appraisal Valuation Date: | October 17, 2012 | |
| Cut-off Date LTV Ratio: | 60.0% | |
| LTV Ratio at Maturity or ARD: | 60.0% | |
| (1) | See “Escrows” section. |
| (2) | Historical occupancy and NOI is not available as the property was built in 2012. |
The Mortgage Loan. The mortgage loan (the “Salt Lake City FBI Building Mortgage Loan”) is evidenced by a single promissory note that is secured by a first mortgage encumbering a recently constructed, regional headquarters office for the Federal Bureau of Investigation located in Salt Lake City, Utah (the “Salt Lake City FBI Building Property”). The Salt Lake City FBI Building Mortgage Loan was originated on December 19, 2012 by The Royal Bank of Scotland. The Salt Lake City FBI Building Mortgage Loan had an original principal balance of $46,800,000, has an outstanding principal balance as of the Cut-off Date of $46,800,000 and accrues interest at an interest rate of 3.470% per annum. The Salt Lake City FBI Building Mortgage Loan had an initial term of 84 months, has a remaining term of 83 months as of the Cut-off Date and requires payments of interest-only through the Anticipated Repayment Date (“ARD”). The ARD is January 1, 2020 and the final maturity date is January 1, 2043. In the event the Salt Lake City FBI Building Mortgage Loan is not paid in full on or before the ARD, the Salt Lake City FBI Building Mortgage Loan will accrue interest at an interest rate of 6.470% per annum and will have a remaining term of 276 months. The occurrence of the ARD without the repayment of the Salt Lake City FBI Mortgage Loan automatically triggers a full cash flow sweep whereby all excess cash flow will be used to pay down the principal balance.
Following the lockout period, the borrower has the right to voluntarily prepay the Salt Lake City FBI Building Mortgage Loan in whole, but not in part, provided that the borrower pays the greater of a yield maintenance premium or a prepayment premium equal to 1.0% of the principal amount being prepaid. In addition, the Salt Lake City FBI Building Mortgage Loan is prepayable without penalty on or after October 1, 2019.
THE INFORMATION IN THIS STRUCTURAL AND COLLATERAL TERM SHEET IS NOT COMPLETE AND MAY BE AMENDED PRIOR TO THE TIME OF SALE. THIS TERM SHEET IS NOT AN OFFER TO SELL THESE SECURITIES AND IT IS NOT A SOLICITATION OF AN OFFER TO BUY THESE SECURITIES IN ANY JURISDICTION WHERE THE OFFER OR SALE IS NOT PERMITTED.
84
SALT LAKE CITY FBI BUILDING
Sources and Uses
Sources | Uses | |||||||||||||||||
Original loan amount | $ | 46,800,000 | 59.8 | % | Purchase price | $ | 77,141,000 | 98.6 | % | |||||||||
Sponsor’s new cash contribution | 31,413,310 | 40.2 | Closing costs | 1,072,310 | 1.4 | |||||||||||||
|
|
|
|
|
|
|
| |||||||||||
Total Sources | $ | 78,213,310 | 100.0 | % | Total Uses | $ | 78,213,310 | 100.0 | % | |||||||||
|
|
|
|
|
|
|
| |||||||||||
The Property. The Salt Lake City FBI Building Property is a four-story class A office building containing approximately 163,040 net square feet, an adjacent single-story annex building, a guard station and a three-story parking garage located approximately seven miles west of the central business district of Salt Lake City, Utah. The Salt Lake City FBI Building Property was built to suit in 2012 for the Federal Bureau of Investigation and serves as their regional headquarters. The Salt Lake City FBI Building Property features a full security fence, x-ray machines at building entrances, 24-hour closed-circuit televised security coverage and a perimeter intrusion detection system. As currently configured, the primary building can be expanded by approximately 47,000 square feet. Situated on a 7.48-acre parcel, the Salt Lake City FBI Building Property includes a total of 264 parking spaces, for a parking ratio of 1.6 spaces per 1,000 square feet.
The following table presents certain information relating to the tenancies at the Salt Lake City FBI Building Property:
Major Tenant
| Credit Rating | Annual U/W | % of Total | Lease | |||||||||||||||||||||||
| (Fitch/Moody’s/ | Tenant | % of | Base Rent | Annual | Annual U/W | Expiration | ||||||||||||||||||||
Tenant Name | S&P)(1) | NRSF | NRSF | PSF | U/W Base Rent | Base Rent | Date | |||||||||||||||||||
Major Tenant | ||||||||||||||||||||||||||
Federal Bureau of Investigation | AAA/Aaa/AA+ | 163,040 | 100.0 | % | $ | 24.69 | (2) | $ | 4,025,425 | 100.0 | % | 10/23/2032 | ||||||||||||||
|
|
|
|
|
|
|
| |||||||||||||||||||
Total Major Tenant | 163,040 | 100.0 | % | $ | 24.69 | $ | 4,025,425 | 100.0 | % | |||||||||||||||||
|
|
|
|
|
|
|
| |||||||||||||||||||
| (1) | The tenant’s lease is backed by the full faith and credit of the United States government. The credit rating listed reflects the credit rating of the United States government. |
| (2) | If the tenant should cease operations at a portion of the Salt Lake City FBI Building Property at any time during the lease term, the full obligations of the lease will remain in effect for the duration of the lease term, however the base rental rate will be reduced by $1.35 per square foot, to a rental rate of $23.34 per square foot, for the portion of the Salt Lake City FBI Building Property which is vacated for the remainder of the lease term. The tenant has no termination rights or extension options and is not subject to appropriations clauses. |
The following table presents certain information relating to the lease rollover schedule at the Salt Lake City FBI Building Property:
Lease Expiration Schedule(1)
| No. of | % of | Cumulative | Cumulative | Annual | ||||||||||||||||||||||
| Year Ending | Leases | Expiring | Total | Expiring | % of Total | Annual U/W | U/W Base | |||||||||||||||||||
December 31, | Expiring | NRSF | NRSF | NRSF | NRSF | Base Rent | Rent PSF | |||||||||||||||||||
MTM | 0 | 0 | 0.0 | % | 0 | 0.0 | % | $ | 0 | $ | 0.00 | |||||||||||||||
2013 | 0 | 0 | 0.0 | % | 0 | 0.0 | % | $ | 0 | $ | 0.00 | |||||||||||||||
2014 | 0 | 0 | 0.0 | % | 0 | 0.0 | % | $ | 0 | $ | 0.00 | |||||||||||||||
2015 | 0 | 0 | 0.0 | % | 0 | 0.0 | % | $ | 0 | $ | 0.00 | |||||||||||||||
2016 | 0 | 0 | 0.0 | % | 0 | 0.0 | % | $ | 0 | $ | 0.00 | |||||||||||||||
2017 | 0 | 0 | 0.0 | % | 0 | 0.0 | % | $ | 0 | $ | 0.00 | |||||||||||||||
2018 | 0 | 0 | 0.0 | % | 0 | 0.0 | % | $ | 0 | $ | 0.00 | |||||||||||||||
2019 | 0 | 0 | 0.0 | % | 0 | 0.0 | % | $ | 0 | $ | 0.00 | |||||||||||||||
2020 | 0 | 0 | 0.0 | % | 0 | 0.0 | % | $ | 0 | $ | 0.00 | |||||||||||||||
2021 | 0 | 0 | 0.0 | % | 0 | 0.0 | % | $ | 0 | $ | 0.00 | |||||||||||||||
2022 | 0 | 0 | 0.0 | % | 0 | 0.0 | % | $ | 0 | $ | 0.00 | |||||||||||||||
2023 | 0 | 0 | 0.0 | % | 0 | 0.0 | % | $ | 0 | $ | 0.00 | |||||||||||||||
Thereafter | 1 | 163,040 | 100.0 | % | 163,040 | 100.0 | % | $ | 4,025,425 | $ | 24.69 | |||||||||||||||
Vacant | 0 | 0 | 0.0 | % | 0 | 0.0 | % | $ | 0 | $ | 0.00 | |||||||||||||||
|
|
|
|
|
|
|
|
| ||||||||||||||||||
Total/Weighted Average | 1 | 163,040 | 100.0 | % | $ | 4,025,425 | $ | 24.69 | ||||||||||||||||||
|
|
|
|
|
|
|
|
| ||||||||||||||||||
| (1) | Information obtained from the tenant’s lease. |
THE INFORMATION IN THIS STRUCTURAL AND COLLATERAL TERM SHEET IS NOT COMPLETE AND MAY BE AMENDED PRIOR TO THE TIME OF SALE. THIS TERM SHEET IS NOT AN OFFER TO SELL THESE SECURITIES AND IT IS NOT A SOLICITATION OF AN OFFER TO BUY THESE SECURITIES IN ANY JURISDICTION WHERE THE OFFER OR SALE IS NOT PERMITTED.
85
SALT LAKE CITY FBI BUILDING
Operating History and Underwritten Net Cash Flow.The following table presents certain information relating to the historical operating performance and the Underwritten Net Cash Flow at the Salt Lake City FBI Building Property:
Cash Flow Analysis(1)
| U/W | U/W $ per SF | |||||||
Base Rent | $ | 4,025,425 | $ | 24.69 | ||||
Grossed Up Vacant Space | 0 | 0.00 | ||||||
Total Reimbursables | 1,574,053 | 9.65 | ||||||
Other Income | 769,406 | 4.72 | ||||||
Less Vacancy & Credit Loss | 0 | (2) | 0.00 | |||||
|
|
|
| |||||
Effective Gross Income | $ | 6,368,884 | $ | 39.06 | ||||
Total Operating Expenses | $ | 1,466,725 | $ | 9.00 | ||||
|
|
|
| |||||
Net Operating Income | $ | 4,902,159 | $ | 30.07 | ||||
TI/LC | 0 | 0.00 | ||||||
Capital Expenditures | 32,608 | 0.20 | ||||||
|
|
|
| |||||
Net Cash Flow | $ | 4,869,551 | $ | 29.87 | ||||
NOI DSCR | 2.98x | |||||||
NCF DSCR | 2.96x | |||||||
NOI DY | 10.5 | % | ||||||
NCF DY | 10.4 | % | ||||||
| (1) | No historical financial information is available as the Salt Lake City FBI Building Property was constructed in 2012 and built-to-suit for the single tenant, the Federal Bureau of Investigation. |
| (2) | No vacancy was underwritten. The Salt Lake City FBI Building Property is 100.0% physically occupied as of February 1, 2013. |
Appraisal.As of the appraisal valuation date of October 17, 2012, the Salt Lake City FBI Building Property had an “as-is” appraised value of $78,000,000.
Environmental Matters.According to the Phase I environmental site assessment dated October 29, 2012, there was no evidence of any recognized environmental conditions at the Salt Lake City FBI Building Property.
Market Overview and Competition. The Salt Lake City FBI Building Property is located on West Amelia Earhart Drive, approximately two miles west of the Salt Lake City International Airport and approximately seven miles west of the central business district of Salt Lake City, Utah. The Salt Lake City FBI Building Property is located within the International Center, a business park which includes hotels, restaurants and office buildings. Access to the Salt Lake City FBI Building Property is provided by Interstate 80, which is in close proximity to the Salt Lake City FBI Building Property and serves as a major thoroughfare in Salt Lake City. According to the appraisal, the estimated 2012 population and median household income of Salt Lake County were 1,053,386 and $57,133, respectively.
According to the appraisal, the Salt Lake City FBI Building Property is located within the suburban submarket of the Salt Lake County office market. As of the end of 2011, the class A submarket vacancy rate was 9.3%. The average annual class A rental rate reported in the suburban submarket in Salt Lake City in 2011 was $22.53, on a full service gross basis. Based on an analysis of competitive rental properties, the appraiser concluded an annual market rental rate for the Salt Lake City FBI Building Property of $26.00 per square foot on a full service gross basis.
The following table presents certain information relating to comparable office properties for the Salt Lake City FBI Building Property:
Competitive Set(1)
| Salt Lake City FBI Building (Subject) | Xactware Office Campus | FLSmidth Phase II Office | Falcon Hill – Building 1575 | Thanksgiving Park II | Riverpark 11 | Vivint Office Building | ||||||||
Location | Salt Lake City, UT | Lehi, UT | Midvale, UT | Hill Air Force Base, UT | Lehi, UT | South Jordan, UT | Provo, UT | |||||||
Distance from Subject | — | 45.9 miles | 16.9 miles | 34.6 miles | 30.7 miles | 21.6 miles | 8.1 miles | |||||||
Property Type | Office | Office | Office | Office | Office | Office | Office | |||||||
Year Built/Renovated | 2012/NAP | 2013/NAP | 2013/NAP | 2012/NAP | 2011/NAP | 2011/NAP | 2003/NAV | |||||||
Number of Stories | 4 | 4 | 4 | 5 | 5 | 5 | 3 | |||||||
Total GLA | 163,040 SF | 200,000 SF | 78,058 SF | 149,312 SF | 36,932 SF | 117,687 SF | 125,225 SF | |||||||
Total Occupancy | 100% | 100% | 100% | 100% | 100% | 100% | 100% |
| (1) | Information obtained from the appraisal dated December 7, 2012. |
THE INFORMATION IN THIS STRUCTURAL AND COLLATERAL TERM SHEET IS NOT COMPLETE AND MAY BE AMENDED PRIOR TO THE TIME OF SALE. THIS TERM SHEET IS NOT AN OFFER TO SELL THESE SECURITIES AND IT IS NOT A SOLICITATION OF AN OFFER TO BUY THESE SECURITIES IN ANY JURISDICTION WHERE THE OFFER OR SALE IS NOT PERMITTED.
86
SALT LAKE CITY FBI BUILDING
The Borrower. The borrower is a Delaware corporation with two independent directors. Legal counsel to the borrower delivered a non-consolidation opinion in connection with the origination of the Salt Lake City FBI Building Mortgage Loan. Certain indirect owners of the master lessee are members of the Islamic faith and require a Shari’ah compliant loan structure. In order to facilitate a Shari’ah compliant loan structure: (i) there is no nonrecourse carveout guarantor under the loan documents, but certain obligations are recourse to the borrower and (ii) the borrower master leases the Salt Lake City FBI Building to a master lessee, the ownership interests in which are then syndicated to individual investors by Gatehouse Bank PLC (“Gatehouse”). See “Risk Factors – Risks Related to the Mortgage Loans and Mortgaged Properties – Shari’ah Compliant Loans” and “Description of the Mortgage Pool – Shari’ah Compliant Lending Structure” in the Free Writing Prospectus.
The Sponsor. Gatehouse, the sponsor, is advised by Arch Street Capital Advisors, LLC. Gatehouse is a public limited company in the United Kingdom, and is majority owned by The Securities House KSCC. Gatehouse serves the Islamic finance sector, both in select markets globally and specifically in the City of London. Gatehouse focuses its core business activity on private wealth management, real estate investment, treasury products and services, and Shari’ah advisory. Founded in 1982, the Securities House KSCC is a Shari’ah-compliant investment company that is listed on the Kuwait Stock Exchange. Arch Street Capital Advisors assists international investors with their U.S. real estate strategies, including acquisition and joint venture advisory, financing advisory and asset management and disposition services. Arch Street Capital Advisors has advised clients on more than $4.0 billion of acquisitions, dispositions and financings.
Escrows.Monthly tax and insurance escrows are not required as long as no event of default has occurred and is continuing.
Lockbox and Cash Management.The Salt Lake City FBI Building Mortgage Loan requires a lender-controlled lockbox account, which is already in place, and the tenant is directed to pay its rents directly to such lockbox account. The loan documents also require that all cash revenues and all other monies received by the borrower or the property manager relating to the Salt Lake City FBI Building Property be deposited into the lockbox account within one business day of receipt.
Upon the occurrence of a Cash Management Period (as defined below) all excess funds on deposit in the lockbox account will be swept to certain restricted accounts and the lender will have the exclusive control of, and the right to withdraw and apply, the funds in the deposit account to payment of any and all debts, liabilities and obligations of the borrower in such order, proportion and priority as the lender may determine in its sole discretion.
A “Cash Management Period” will commence upon the earlier of: (i) the occurrence and continuance of an event of default; (ii) the debt service coverage ratio falling below 1.30x as tested with respect to each calendar quarter; (iii) the commencement of a Lease Sweep Period (as defined below) or (iv) the commencement of a Purchase Price Sweep Period (as defined below). A Cash Management Period will end with respect to the matters described in clause (i) above, when such event of default has been cured; with respect to the matters described in clause (ii) above, when a debt service coverage ratio of at least 1.30x has been achieved for two consecutive calendar quarters; with respect to the matters described in clause (iii) above, when such Lease Sweep Period has ended; and with respect to the matters described in clause (iv) above, when such Purchase Price Sweep Period has ended.
A “Lease Sweep Period” will commence on the first payment date following the occurrence of any of the following: (i) the tenant has not given notice of its exercise of a renewal option under its lease by the date required under its lease; (ii) the tenant’s lease is surrendered, cancelled or terminated prior to lease expiration; (iii) after the date which is five years after closing, the tenant discontinues or gives notice to discontinue its operations on greater than fifty percent of net rentable area; (iv) the tenant’s credit rating is downgraded below BBB+ by S&P (or its functional equivalent by any other rating agency); or (v) a payment default under the tenant’s lease is uncured past all notice and cure periods under the lease (excluding a payment default as a result of administrative complications in connection with the transition of the Salt Lake City FBI Building Property to the borrower). A Lease Sweep Period will end when the lender determines that sufficient funds have accumulated in reserve to pay for all anticipated expenses associated with releasing the space or: with respect to the matters described in clause (i), (ii) and (iii) above, when the Salt Lake City FBI Building Property has been fully leased pursuant to a replacement lease(s) approved by the lender and all leasing costs have been paid; with respect to the matters described in clause (iv) above, when such credit rating has been restored to at least BBB+ by S&P (or its functional equivalent by any other rating agency) or with respect to the matters described in clause (v) above, when such event of default has been cured and no other payment default has occurred for a period of three consecutive months following such cure.
Purchase Price Adjustment.Pursuant to the purchase and sale agreement, within 120 days following October 23, 2013, the purchase price of $77.14 million paid by the borrower to acquire the Salt Lake City FBI Building Property will be adjusted based on actual NOI for the preceding year. Given this, the Salt Lake City FBI Building Mortgage Loan was structured to mitigate risks associated with an increase or decrease in such purchase price. The “Purchase Price Sweep Period” will commence: (i) in the case of an increase in purchase price, within thirty days of the borrower’s failure to pay any judgment brought by seller for a failure to pay such increase within the time constraints set forth in the purchase and sale agreement and (ii) in the case of a decrease in purchase price, if the ratio of the principal balance of the Salt Lake City FBI Building Mortgage Loan to the purchase price exceeds 62%, upon borrower failure to rebalance the Salt Lake City FBI Building Mortgage Loan such so that the ratio of the Salt Lake City FBI Building Mortgage Loan to the purchase price is less than 62% within ninety days of the decrease in purchase price. The borrower may rebalance the loan through posting the rebalancing amount in cash or by paying down the loan. The Purchase Price Sweep Period will end upon the payment date immediately following: (1) with respect to the matter described in clause (a) above, the earlier of (x) the borrower’s payment in full of the purchase price adjustment together with an applicable yield maintenance premium or (y) the determination by the lender that sufficient funds have accumulated in the cash collateral account to pay the purchase price adjustment and (2) with respect to the matter described in clause (b) above, upon the determination by the lender that the funds in an amount sufficient to pay down the Salt Lake City FBI Building Mortgage Loan to a mortgage loan to purchase price ratio of 62% or less have accumulated in the cash collateral account.
THE INFORMATION IN THIS STRUCTURAL AND COLLATERAL TERM SHEET IS NOT COMPLETE AND MAY BE AMENDED PRIOR TO THE TIME OF SALE. THIS TERM SHEET IS NOT AN OFFER TO SELL THESE SECURITIES AND IT IS NOT A SOLICITATION OF AN OFFER TO BUY THESE SECURITIES IN ANY JURISDICTION WHERE THE OFFER OR SALE IS NOT PERMITTED.
87
SALT LAKE CITY FBI BUILDING
Property Management.The Salt Lake City FBI Building Property is managed by CBRE, Inc. According to the management agreement, the property manager is entitled to a base management fee in an amount equal to $5,000 per month.
Assumption.The borrower has the right to transfer the Salt Lake City FBI Building Property, provided that no event of default has occurred and is continuing and certain other conditions are satisfied, including: (i) the lender’s reasonable determination that the proposed transferee and guarantor satisfy the lender’s credit review and underwriting standards, taking into consideration transferee experience, financial strength and general business standing; (ii) execution of a recourse guaranty and an environmental indemnity by an affiliate of the transferee and (iii) if requested by the lender, rating agency confirmation from Fitch, KBRA and S&P that the transfer will not result in a downgrade, withdrawal or qualification of the respective ratings assigned to the Series 2013-C11 Certificates.
Partial Release.Not permitted
Real Estate Substitution.Not permitted.
Subordinate and Mezzanine Indebtedness.Not permitted.
Ground Lease.None.
Terrorism Insurance. The loan documents require that the “all risk” insurance policy required to be maintained by the borrower provides coverage for damage from terrorism in an amount equal to the full replacement cost of the Salt Lake City FBI Building Property as well as business interruption insurance covering no less than the 18-month period following the occurrence of a casualty event, together with a six-month extended period of indemnity.
THE INFORMATION IN THIS STRUCTURAL AND COLLATERAL TERM SHEET IS NOT COMPLETE AND MAY BE AMENDED PRIOR TO THE TIME OF SALE. THIS TERM SHEET IS NOT AN OFFER TO SELL THESE SECURITIES AND IT IS NOT A SOLICITATION OF AN OFFER TO BUY THESE SECURITIES IN ANY JURISDICTION WHERE THE OFFER OR SALE IS NOT PERMITTED.
88
[THIS PAGE INTENTIONALLY LEFT BLANK.]
89
STARWOOD CAPITAL HOTEL PORTFOLIO II

THE INFORMATION IN THIS STRUCTURAL AND COLLATERAL TERM SHEET IS NOT COMPLETE AND MAY BE AMENDED PRIOR TO THE TIME OF SALE. THIS TERM SHEET IS NOT AN OFFER TO SELL THESE SECURITIES AND IT IS NOT A SOLICITATION OF AN OFFER TO BUY THESE SECURITIES IN ANY JURISDICTION WHERE THE OFFER OR SALE IS NOT PERMITTED.
90
STARWOOD CAPITAL HOTEL PORTFOLIO II

THE INFORMATION IN THIS STRUCTURAL AND COLLATERAL TERM SHEET IS NOT COMPLETE AND MAY BE AMENDED PRIOR TO THE TIME OF SALE. THIS TERM SHEET IS NOT AN OFFER TO SELL THESE SECURITIES AND IT IS NOT A SOLICITATION OF AN OFFER TO BUY THESE SECURITIES IN ANY JURISDICTION WHERE THE OFFER OR SALE IS NOT PERMITTED.
91
No. 9 - Starwood Capital Hotel Portfolio II
| Loan Information | ||
| Mortgage Loan Seller: | Wells Fargo Bank, National Association | |
Credit Assessment (Fitch/KBRA/S&P): | NR/NR/NR | |
| Original Principal Balance: | $42,500,000 | |
| Cut-off Date Principal Balance: | $42,500,000 | |
| % of Initial Pool Balance: | 3.0% | |
| Loan Purpose: | Acquisition | |
| Borrower Names(1): | Various | |
| Sponsors(2): | Various | |
| Mortgage Rate: | 4.280% | |
| Note Date: | December 20, 2012 | |
| Anticipated Repayment Date: | NAP | |
| Maturity Date: | January 1, 2018 | |
| IO Period: | 12 months | |
| Loan Term (Original): | 60 months | |
| Seasoning: | 1 month | |
| Amortization Term (Original): | 360 months | |
| Loan Amortization Type: | Interest-only, Amortizing Balloon | |
| Interest Accrual Method: | Actual/360 | |
| Call Protection: | L(25),D or GRTR 1% or YM(28),O(7) | |
| Lockbox Type: | Soft/Springing Cash Management | |
| Additional Debt: | None | |
| Additional Debt Type: | NAP | |
Escrows and Reserves(3):
Type: | Initial | Monthly | Cap (If Any) | |||||||||
Taxes | $ | 147,826 | $ | 74,974 | NAP | |||||||
Insurance | $ | 0 | Springing | NAP | ||||||||
FF&E | $ | 0 | $ | 78,220 | NAP | |||||||
| Property Information | ||
| Single Asset/Portfolio: | Portfolio | |
| Property Type: | Hospitality | |
| Specific Property Type: | Various – See Table | |
| Location: | Various – See Table | |
| Size: | 846 rooms | |
Cut-off Date Principal Balance Per Room: | $50,236 | |
| Year Built/Renovated: | Various/Various – See Table | |
| Title Vesting(4): | Various | |
| Property Manager: | Self-managed | |
| 3rdMost Recent Occupancy (As of): | 60.1% (12/31/2009) | |
| 2ndMost Recent Occupancy (As of): | 61.2% (12/31/2010) | |
| Most Recent Occupancy (As of): | 63.6% (12/31/2011) | |
| Current Occupancy (As of): | 63.1% (10/31/2012) | |
| Underwriting and Financial Information: | ||
| 3rdMost Recent NOI (As of): | $5,792,782 (12/31/2010) | |
| 2ndMost Recent NOI (As of): | $6,882,844 (12/31/2011) | |
| Most Recent NOI (As of): | $6,151,356 (TTM 10/31/2012) | |
| U/W Revenues: | $23,466,077 | |
| U/W Expenses: | $17,146,658 | |
| U/W NOI: | $6,319,418 | |
| U/W NCF: | $5,380,775 | |
| U/W NOI DSCR: | 2.51x | |
| U/W NCF DSCR: | 2.14x | |
| U/W NOI Debt Yield: | 14.9% | |
| U/W NCF Debt Yield: | 12.7% | |
| As-Is Appraised Value: | $75,100,000 | |
| As-Is Appraisal Valuation Date(5): | Various | |
| Cut-off Date LTV Ratio: | 56.6% | |
| LTV Ratio at Maturity or ARD: | 52.7% | |
| (1) | The borrower is comprised of eight separate limited liability companies. |
| (2) | The loan sponsors are Starwood U.S. Opportunity Fund VIII-J, L.P., Starwood Global Opportunity Fund VIII-J, L.P., Starwood U.S. Opportunity Fund VIII-1, L.P., Starwood Global Opportunity Fund VIII, L.P., Starwood Capital Hospitality Fund II U.S., L.P., and Starwood Capital Hospitality Fund II Global, L.P. The loan sponsors are owned by Starwood Capital Group. |
| (3) | See “Escrows” section. |
| (4) | The Hilton Garden Inn – Edison, NJ property is a leasehold interest. The remaining seven properties are fee interests. |
| (5) | The As-Is Appraisal Valuation Dates range from November 8, 2012 to November 19, 2012. |
The Mortgage Loan. The mortgage loan (the “Starwood Capital Hotel Portfolio II Mortgage Loan”) is evidenced by a single promissory note that is secured by a first mortgage encumbering the borrower’s fee interest in six limited service hotels and one full service hotel and the leasehold interest in one full service hotel located in Pennsylvania, Virginia, New Jersey, Connecticut and Maryland (the “Starwood Capital Hotel Portfolio II Properties”). The Starwood Capital Hotel Portfolio II Mortgage Loan was originated on December 20, 2012 by Wells Fargo Bank, National Association. The Starwood Capital Hotel Portfolio II Mortgage Loan had an original principal balance of $42,500,000, has an outstanding principal balance as of the Cut-off Date of $42,500,000 and accrues interest at an interest rate of 4.280% per annum. The Starwood Capital Hotel Portfolio II Mortgage Loan had an initial term of 60 months, has a remaining term of 59 months as of the Cut-off Date and requires interest-only payments for the first 12 months following origination and thereafter will require payments of principal and interest based on a 30-year amortization schedule. The Starwood Capital Hotel Portfolio II Mortgage Loan matures on January 1, 2018.
THE INFORMATION IN THIS STRUCTURAL AND COLLATERAL TERM SHEET IS NOT COMPLETE AND MAY BE AMENDED PRIOR TO THE TIME OF SALE. THIS TERM SHEET IS NOT AN OFFER TO SELL THESE SECURITIES AND IT IS NOT A SOLICITATION OF AN OFFER TO BUY THESE SECURITIES IN ANY JURISDICTION WHERE THE OFFER OR SALE IS NOT PERMITTED.
92
STARWOOD CAPITAL HOTEL PORTFOLIO II
Following the lockout period, the borrower has the right to either (i) defease the Starwood Capital Hotel Portfolio II Mortgage Loan in whole or in part, or (ii) voluntarily prepay the Starwood Capital Hotel Portfolio II Mortgage Loan in whole or in part, provided the borrower pays the greater of a yield maintenance premium or a prepayment premium equal to 1.0% of the principal amount being prepaid. In addition, the Starwood Capital Hotel Portfolio II Mortgage Loan is prepayable without penalty on or after July 1, 2017.
Sources and Uses
Sources | Uses | |||||||||||||||||
Original loan amount | $ | 42,500,000 | 78.6 | % | Purchase price | $ | 53,350,000 | 98.6 | % | |||||||||
Sponsor’s new cash contribution | 11,583,921 | 21.4 | Reserves | 147,826 | 0.3 | |||||||||||||
| Closing costs | 586,095 | 1.1 | ||||||||||||||||
|
|
|
|
|
|
|
| |||||||||||
Total Sources | $ | 54,083,921 | 100.0 | % | Total Uses | $ | 54,083,921 | 100.0 | % | |||||||||
|
|
|
|
|
|
|
| |||||||||||
The Properties. The Starwood Capital Hotel Portfolio II Mortgage Loan is secured by the borrower’s fee interest in six limited service hotels and one full service hotel and the leasehold interest in one full service hotel located in Pennsylvania, Virginia, New Jersey, Connecticut and Maryland. The Starwood Capital Hotel Portfolio II Properties comprise a total of 846 rooms.
The following table presents certain information relating to the Starwood Capital Hotel Portfolio II Properties:
Property Name - Location | Specific Property Type | Allocated Cut-off Date Principal Balance | % of Portfolio Cut-off Date Principal Balance | Rooms | Cut-off Date Principal Balance Per Room | Year Built/ Renovated | Appraised Value | |||||||||||||||||||
Residence Inn – Williamsburg, VA | Limited Service | $ | 7,435,000 | 17.5 | % | 108 | $ | 68,843 | 1999/2012 | $ | 12,500,000 | |||||||||||||||
Hilton Garden Inn – Edison, NJ | Full Service | $ | 6,225,000 | 14.6 | % | 132 | $ | 47,159 | 2002/NAP | $ | 11,000,000 | |||||||||||||||
Holiday Inn – Norwich, CT | Full Service | $ | 6,160,000 | 14.5 | % | 134 | $ | 45,970 | 1975/2007 | $ | 11,500,000 | |||||||||||||||
Hampton Inn – Carlisle, PA | Limited Service | $ | 5,775,000 | 13.6 | % | 97 | $ | 59,536 | 1997/2010 | $ | 10,200,000 | |||||||||||||||
Springhill Suites – Williamsburg, VA | Limited Service | $ | 4,820,000 | 11.3 | % | 120 | $ | 40,167 | 2000/2012 | $ | 9,000,000 | |||||||||||||||
Fairfield Inn – Laurel, MD | Limited Service | $ | 4,500,000 | 10.6 | % | 109 | $ | 41,284 | 1988/2006 | $ | 7,500,000 | |||||||||||||||
Hampton Inn – Danville, PA | Limited Service | $ | 3,905,000 | 9.2 | % | 71 | $ | 55,000 | 1998/2007 | $ | 6,900,000 | |||||||||||||||
Hampton Inn – Shamokin Dam, PA | Limited Service | $ | 3,680,000 | 8.7 | % | 75 | $ | 49,067 | 1995/2010 | $ | 6,500,000 | |||||||||||||||
|
|
|
|
|
|
|
|
|
| |||||||||||||||||
Total/Weighted Average | $ | 42,500,000 | 100.0 | % | 846 | $ | 50,236 | $ | 75,100,000 | |||||||||||||||||
|
|
|
|
|
|
|
|
|
| |||||||||||||||||
Residence Inn – Williamsburg, VA (17.5% of Portfolio Cut-off Date Principal Balance)
The property is a 108-room, limited service hotel located in Williamsburg, Virginia. The property was built in 1999 and renovated in 2012, and amenities include an outdoor pool, fitness room, all-purpose sport court, complimentary breakfast, business center and free high-speed internet access. The Residence Inn – Williamsburg, VA’s franchise agreement expires in August 2019.
Located halfway between Richmond and the Chesapeake Bay on the Virginia Peninsula, Williamsburg is part of the greater Hampton Roads metropolitan area of southeastern Virginia, which contains over 1.5 million residents. Over 95% of the world’s shipping lines call on the Port of Hampton Roads, linking this area to more than 250 ports in over 100 locations worldwide. The property benefits from its location along Richmond Road, a primary entertainment and commercial district, which also leads into Colonial Williamsburg. Approximately 2.1 million overnight tourists travel to Williamsburg each year for its theme parks and other local attractions. According to the appraisal, the property’s competitive set consists of six hotels, including the subject property, with a total of 690 rooms. The demand segment for the competitive market is estimated at 48% leisure, 26% commercial, 15% extended-stay and 11% meeting and group.
Subject and Market Historical Occupancy, ADR and RevPAR
(Residence Inn – Williamsburg, VA)(1)
| Competitive Set | Residence Inn –Williamsburg, VA | Penetration Factor | ||||||||||||||||||||||||||||||||||
Year | Occupancy | ADR | RevPAR | Occupancy | ADR | RevPAR | Occupancy | ADR | RevPAR | |||||||||||||||||||||||||||
10/31/2012 TTM | 51.4 | % | $ | 102.14 | $ | 52.52 | 55.8 | % | $ | 116.41 | $ | 64.96 | 108.5 | % | 114.0 | % | 123.7 | % | ||||||||||||||||||
10/31/2011 TTM | 48.1 | % | $ | 98.16 | $ | 47.22 | 63.5 | % | $ | 114.33 | $ | 72.58 | 132.0 | % | 116.5 | % | 153.7 | % | ||||||||||||||||||
10/31/2010 TTM | 51.4 | % | $ | 92.83 | $ | 47.71 | 67.2 | % | $ | 108.78 | $ | 73.07 | 130.7 | % | 117.2 | % | 153.1 | % | ||||||||||||||||||
| (1) | Information obtained from a third party hospitality report dated November 19, 2012. |
THE INFORMATION IN THIS STRUCTURAL AND COLLATERAL TERM SHEET IS NOT COMPLETE AND MAY BE AMENDED PRIOR TO THE TIME OF SALE. THIS TERM SHEET IS NOT AN OFFER TO SELL THESE SECURITIES AND IT IS NOT A SOLICITATION OF AN OFFER TO BUY THESE SECURITIES IN ANY JURISDICTION WHERE THE OFFER OR SALE IS NOT PERMITTED.
93
STARWOOD CAPITAL HOTEL PORTFOLIO II
Hilton Garden Inn – Edison, NJ (14.6% of Portfolio Cut-off Date Principal Balance)
The property is a 132-room, full service hotel located in Edison, New Jersey. The property was built in 2002 and amenities include an indoor pool, restaurant, fitness center, business center and meeting facilities. The Hilton Garden Inn – Edison, NJ’s franchise agreement expires in April 2022.
Edison, New Jersey is located in central New Jersey, approximately 32 miles southwest of New York City, approximately 68 miles north of Philadelphia and approximately 197 miles north of Washington, D.C. Primary access to the area is provided by Interstate 287 and the New Jersey Turnpike (Interstate 95), which provide access from the surrounding areas of New York City as well as northern and central New Jersey. Edison serves as a primary suburban commercial hub in proximity to major urban areas, and commercial, industrial and single tenant office developments provide substantial traffic into and through the area. According to the appraisal, the property’s primary competitive set consists of five hotels, including the subject property, with a total of 907 rooms. The demand segment for the competitive market is estimated at 59% commercial, 25% meeting and group and 16% leisure.
Subject and Market Historical Occupancy, ADR and RevPAR
(Hilton Garden Inn – Edison, NJ)(1)
| Competitive Set | Hilton Garden Inn – Edison, NJ | Penetration Factor | ||||||||||||||||||||||||||||||||||
Year | Occupancy | ADR | RevPAR | Occupancy | ADR | RevPAR | Occupancy | ADR | RevPAR | |||||||||||||||||||||||||||
10/31/2012 TTM | 63.3 | % | $ | 84.91 | $ | 53.74 | 72.0 | % | $ | 111.21 | $ | 80.05 | 113.7 | % | 131.0 | % | 148.9 | % | ||||||||||||||||||
10/31/2011 TTM | 60.4 | % | $ | 84.18 | $ | 50.86 | 64.4 | % | $ | 111.18 | $ | 71.57 | 106.5 | % | 132.1 | % | 140.7 | % | ||||||||||||||||||
10/31/2010 TTM | 54.7 | % | $ | 85.30 | $ | 46.65 | 61.1 | % | $ | 107.04 | $ | 65.42 | 111.8 | % | 125.5 | % | 140.3 | % | ||||||||||||||||||
| (1) | Information obtained from a third party hospitality report dated November 19, 2012. |
Holiday Inn – Norwich, CT (14.5% of Portfolio Cut-off Date Principal Balance)
The property is a 134-room, full service hotel located in Norwich, Connecticut. The property was built in 1975 and renovated in 2007, and amenities include an indoor pool, business center, restaurant and lounge, and approximately 7,400 square feet of meeting space. The Holiday Inn – Norwich, CT’s franchise agreement expires in February 2022.
Norwich, Connecticut is located in New London County, approximately 41 miles southeast of Hartford and approximately 17 miles north of the coast of the Atlantic Ocean. Primary access to the area is provided by Interstate 95, which services some of the largest urban areas in the country including Boston, New York City, Philadelphia, Baltimore and Washington, D.C. The property is located approximately eight miles from Foxwoods Casino, a 4.7 million square foot facility with approximately 340,000 square feet of gaming space. In addition, the Mohegan Sun Resort and Casino, a major destination for entertainment, gaming, shopping and conventions, is located just south of the property. According to the appraisal, the property’s primary competitive set consists of six hotels, including the subject property, with a total of 774 rooms. The demand segment for the competitive market is estimated at 56% leisure, 35% commercial and 10% meeting and group.
Subject and Market Historical Occupancy, ADR and RevPAR
(Holiday Inn – Norwich, CT)(1)
| Competitive Set | Holiday Inn – Norwich, CT | Penetration Factor | ||||||||||||||||||||||||||||||||||
Year | Occupancy | ADR | RevPAR | Occupancy | ADR | RevPAR | Occupancy | ADR | RevPAR | |||||||||||||||||||||||||||
10/31/2012 TTM | 49.0 | % | $ | 110.57 | $ | 54.16 | 50.7 | % | $ | 116.01 | $ | 58.80 | 103.5 | % | 104.9 | % | 108.6 | % | ||||||||||||||||||
10/31/2011 TTM | 52.6 | % | $ | 112.36 | $ | 59.05 | 48.7 | % | $ | 119.24 | $ | 58.01 | 92.6 | % | 106.1 | % | 98.3 | % | ||||||||||||||||||
10/31/2010 TTM | 53.6 | % | $ | 106.61 | $ | 57.11 | 47.3 | % | $ | 109.09 | $ | 51.63 | 88.4 | % | 102.3 | % | 90.4 | % | ||||||||||||||||||
| (1) | Information obtained from a third party hospitality report dated November 19, 2012. |
THE INFORMATION IN THIS STRUCTURAL AND COLLATERAL TERM SHEET IS NOT COMPLETE AND MAY BE AMENDED PRIOR TO THE TIME OF SALE. THIS TERM SHEET IS NOT AN OFFER TO SELL THESE SECURITIES AND IT IS NOT A SOLICITATION OF AN OFFER TO BUY THESE SECURITIES IN ANY JURISDICTION WHERE THE OFFER OR SALE IS NOT PERMITTED.
94
STARWOOD CAPITAL HOTEL PORTFOLIO II
Hampton Inn – Carlisle, PA (13.6% of Portfolio Cut-off Date Principal Balance)
The property is a 97-room, limited service hotel located in Carlisle, Pennsylvania. The property was built in 1997 and renovated in 2010, and amenities include an indoor pool and business center. The Hampton Inn – Carlisle, PA’s franchise agreement expires in February 2022.
Carlisle, Pennsylvania is located in Cumberland County, approximately 23 miles southwest of Harrisburg. The property benefits from easy accessibility via Interstate 76 and Interstate 81, which provide north-south access from Harrisburg. In addition to a variety of local businesses and restaurants, Carlisle is home to the headquarters office of Giant Food Stores, which is located just west of the property. Also located west of the property is The United States Army War College, a 500-acre facility that caters to high-level military personnel and civilians and prepares them for strategic leadership responsibilities. The facility is the U.S. Army’s most senior military educational institution, and there are approximately 600 students in attendance at any given time. According to the appraisal, the property’s primary competitive set consists of eight hotels, including the subject property, with a total of 713 rooms. The demand segment for the competitive market is estimated at 63% commercial, 24% leisure and 14% meeting and group.
Subject and Market Historical Occupancy, ADR and RevPAR
(Hampton Inn – Carlisle, PA)(1)
| Competitive Set | Hampton Inn – Carlisle, PA | Penetration Factor | ||||||||||||||||||||||||||||||||||
Year | Occupancy | ADR | RevPAR | Occupancy | ADR | RevPAR | Occupancy | ADR | RevPAR | |||||||||||||||||||||||||||
10/31/2012 TTM | 60.7 | % | $ | 87.69 | $ | 53.20 | 70.1 | % | $ | 118.26 | $ | 82.90 | 115.5 | % | 134.9 | % | 155.8 | % | ||||||||||||||||||
10/31/2011 TTM | 56.6 | % | $ | 88.44 | $ | 50.05 | 67.8 | % | $ | 113.39 | $ | 76.89 | 119.8 | % | 128.2 | % | 153.6 | % | ||||||||||||||||||
10/31/2010 TTM | 56.6 | % | $ | 86.14 | $ | 48.72 | 68.0 | % | $ | 106.03 | $ | 72.15 | 120.3 | % | 123.1 | % | 148.1 | % | ||||||||||||||||||
| (1) | Information obtained from a third party hospitality report dated November 19, 2012. |
Springhill Suites – Williamsburg, VA (11.3% of Portfolio Cut-off Date Principal Balance)
The property is a 120-room, limited service hotel located in Williamsburg, Virginia. The property was built in 2000 and renovated in 2012, and amenities include an indoor pool, business center and complimentary high speed internet access. The Springhill Suites – Williamsburg, VA’s franchise agreement expires in November 2019.
Located halfway between Richmond and the Chesapeake Bay on the Virginia Peninsula, Williamsburg is part of the greater Hampton Roads metropolitan area of southeastern Virginia, which contains over 1.5 million residents. Over 95% of the world’s shipping lines call on the Port of Hampton Roads, linking this area to more than 250 ports in over 100 locations worldwide. The property benefits from its location along Richmond Road, a primary entertainment and commercial district, which also leads into Colonial Williamsburg. Approximately 2.1 million overnight tourists travel to Williamsburg each year for its theme parks and other local attractions. According to the appraisal, the property’s primary competitive set consists of five hotels, including the subject property, with a total of 583 rooms. The demand segment for the competitive market is estimated at 46% commercial, 38% leisure, 9% meeting and group and 7% extended-stay.
Subject and Market Historical Occupancy, ADR and RevPAR
(Springhill Suites – Williamsburg, VA)(1)
| Competitive Set | Springhill Suites –Williamsburg, VA | Penetration Factor | ||||||||||||||||||||||||||||||||||
Year | Occupancy | ADR | RevPAR | Occupancy | ADR | RevPAR | Occupancy | ADR | RevPAR | |||||||||||||||||||||||||||
10/31/2012 TTM | 61.3 | % | $ | 99.22 | $ | 60.86 | 55.9 | % | $ | 93.51 | $ | 52.31 | 91.2 | % | 94.3 | % | 86.0 | % | ||||||||||||||||||
10/31/2011 TTM | 57.6 | % | $ | 95.95 | $ | 55.24 | 59.8 | % | $ | 92.02 | $ | 55.03 | 103.9 | % | 95.9 | % | 99.6 | % | ||||||||||||||||||
10/31/2010 TTM | 58.3 | % | $ | 93.59 | $ | 54.55 | 64.6 | % | $ | 90.15 | $ | 58.27 | 110.9 | % | 96.3 | % | 106.8 | % | ||||||||||||||||||
| (1) | Information obtained from a third party hospitality report dated November 19, 2012. |
THE INFORMATION IN THIS STRUCTURAL AND COLLATERAL TERM SHEET IS NOT COMPLETE AND MAY BE AMENDED PRIOR TO THE TIME OF SALE. THIS TERM SHEET IS NOT AN OFFER TO SELL THESE SECURITIES AND IT IS NOT A SOLICITATION OF AN OFFER TO BUY THESE SECURITIES IN ANY JURISDICTION WHERE THE OFFER OR SALE IS NOT PERMITTED.
95
STARWOOD CAPITAL HOTEL PORTFOLIO II
Fairfield Inn – Laurel, MD (10.6% of Portfolio Cut-off Date Principal Balance)
The property is a 109-room, limited service hotel located in Laurel, Maryland. The property was built in 1988 and renovated in 2006 and amenities include an outdoor pool, fitness room, business center and complimentary high speed internet access. The Fairfield Inn – Laurel, MD’s franchise agreement expires in April 2019.
Laurel, Maryland is located in northern Prince George’s County, approximately 21 miles southwest of Baltimore and approximately 23 miles northeast of Washington, D.C. Primary access to the area is provided by Interstate 95, which services some of the largest urban areas in the country including Boston, New York City, Philadelphia, Baltimore and Washington, D.C. The NASA Goddard Space Flight Center, which is one of the primary research facilities for NASA and employs approximately 10,000 workers, is located approximately three miles south of the property. In addition, the University of Maryland, which has an enrollment of approximately 36,000 students, is located approximately eight miles south of the property. According to the appraisal, the property’s primary competitive set consists of six hotels, including the subject property, with a total of 705 rooms. The demand segment for the competitive set is estimated at 45% commercial, 24% leisure, 21% government and 10% meeting and group.
Subject and Market Historical Occupancy, ADR and RevPAR
(Fairfield Inn – Laurel, MD)(1)
| Competitive Set | Fairfield Inn – Laurel, MD | Penetration Factor | ||||||||||||||||||||||||||||||||||
Year | Occupancy | ADR | RevPAR | Occupancy | ADR | RevPAR | Occupancy | ADR | RevPAR | |||||||||||||||||||||||||||
10/31/2012 TTM | 57.3 | % | $ | 78.49 | $ | 44.98 | 66.6 | % | $ | 98.14 | $ | 65.36 | 116.2 | % | 125.0 | % | 145.3 | % | ||||||||||||||||||
10/31/2011 TTM | 53.0 | % | $ | 79.67 | $ | 42.19 | 67.6 | % | $ | 96.61 | $ | 65.29 | 127.6 | % | 121.3 | % | 154.8 | % | ||||||||||||||||||
10/31/2010 TTM | 53.9 | % | $ | 81.90 | $ | 44.11 | 65.4 | % | $ | 92.89 | $ | 60.72 | 121.4 | % | 113.4 | % | 137.7 | % | ||||||||||||||||||
| (1) | Information obtained from a third party hospitality report dated November 19, 2012. |
Hampton Inn – Danville, PA (9.2% of Portfolio Cut-off Date Principal Balance)
The property is a 71-room, limited service hotel located in Danville, Pennsylvania. The property was built in 1998 and renovated in 2007, and amenities include an indoor pool, business center and exercise center. The Hampton Inn – Danville, PA’s franchise agreement expires in February 2022.
Danville, Pennsylvania is located approximately 66 miles northeast of Harrisburg and approximately 71 miles southwest of Scranton. Primary access to the area is provided by Interstate 80 and U.S. Route 54. The property is located approximately three miles from the Geisinger Medical Center, which serves as the primary tertiary care hospital for central Pennsylvania and is the primary place of practice for approximately 551 physicians. In addition, the property is located approximately 11 miles from the Bloomsburg Fairground, a 234-acre facility containing 20 buildings which hosts numerous events attracting visitors year-round. According to the appraisal, the property’s primary competitive set consists of six hotels, including the subject property, with a total of 579 rooms. The demand segment for the competitive market is estimated at 63% leisure, 25% commercial and 12% meeting and group.
Subject and Market Historical Occupancy, ADR and RevPAR
(Hampton Inn – Danville, PA)(1)
| Competitive Set | Hampton Inn – Danville, PA | Penetration Factor | ||||||||||||||||||||||||||||||||||
Year | Occupancy | ADR | RevPAR | Occupancy | ADR | RevPAR | Occupancy | ADR | RevPAR | |||||||||||||||||||||||||||
10/31/2012 TTM | 46.4 | % | $ | 75.79 | $ | 35.18 | 68.8 | % | $ | 113.90 | $ | 78.36 | 148.2 | % | 150.3 | % | 222.8 | % | ||||||||||||||||||
10/31/2011 TTM | 47.9 | % | $ | 73.52 | $ | 35.20 | 69.1 | % | $ | 113.55 | $ | 78.43 | 144.3 | % | 154.4 | % | 222.8 | % | ||||||||||||||||||
10/31/2010 TTM | 44.7 | % | $ | 70.87 | $ | 31.69 | 66.1 | % | $ | 108.98 | $ | 72.08 | 147.9 | %�� | 153.8 | % | 227.4 | % | ||||||||||||||||||
| (1) | Information obtained from a third party hospitality report dated November 19, 2012. |
THE INFORMATION IN THIS STRUCTURAL AND COLLATERAL TERM SHEET IS NOT COMPLETE AND MAY BE AMENDED PRIOR TO THE TIME OF SALE. THIS TERM SHEET IS NOT AN OFFER TO SELL THESE SECURITIES AND IT IS NOT A SOLICITATION OF AN OFFER TO BUY THESE SECURITIES IN ANY JURISDICTION WHERE THE OFFER OR SALE IS NOT PERMITTED.
96
STARWOOD CAPITAL HOTEL PORTFOLIO II
Hampton Inn – Shamokin Dam, PA (8.7% of Portfolio Cut-off Date Principal Balance)
The property is a 75-room, limited service hotel located in Shamokin Dam, Pennsylvania. The property was built in 1995 and renovated in 2010, and amenities include an indoor pool, business center and exercise facility. The Hampton Inn – Shamokin Dam, PA’s franchise agreement expires in February 2022.
Shamokin Dam, Pennsylvania is located approximately 51 miles northeast of Harrisburg with primary access to the area provided by Interstate 80 and Interstate 76. The property is located south of the Monroe Marketplace, an approximately 700,000 square foot open-air retail power center with tenants including Dick’s Sporting Goods, Best Buy and Famous Footwear. Also located in the area are Susquehanna University and Bucknell University, which have a total combined enrollment of approximately 5,800 students. According to the appraisal, the property’s primary competitive set consists of seven properties, including the subject property, with a total of 587 rooms. The demand segment for the competitive market is estimated at 49% commercial, 26% leisure and 25% meeting and group.
Subject and Market Historical Occupancy, ADR and RevPAR
(Hampton Inn – Shamokin Dam, PA) (1)
| Competitive Set | Hampton Inn –Shamokin Dam, PA | Penetration Factor | ||||||||||||||||||||||||||||||||||
Year | Occupancy | ADR | RevPAR | Occupancy | ADR | RevPAR | Occupancy | ADR | RevPAR | |||||||||||||||||||||||||||
10/31/2012 TTM | 48.9 | % | $ | 96.48 | $ | 47.19 | 72.3 | % | $ | 110.07 | $ | 79.61 | 147.9 | % | 114.1 | % | 168.7 | % | ||||||||||||||||||
10/31/2011 TTM | 50.5 | % | $ | 94.10 | $ | 47.51 | 64.0 | % | $ | 114.22 | $ | 73.07 | 126.7 | % | 121.4 | % | 153.8 | % | ||||||||||||||||||
10/31/2010 TTM | 46.2 | % | $ | 91.44 | $ | 42.27 | 62.8 | % | $ | 113.09 | $ | 71.07 | 135.9 | % | 123.7 | % | 168.1 | % | ||||||||||||||||||
| (1) | Information obtained from a third party hospitality report dated November 19, 2012. |
The following table presents historical occupancy percentages at the Starwood Capital Hotel Portfolio II Properties:
Historical Occupancy(1)
12/31/2009 | 12/31/2010 | 12/31/2011 | ||
60% | 61% | 64% |
| (1) | Information obtained from the borrower. |
Operating History and Underwritten Net Cash Flow.The following table presents certain information relating to the historical operating performance and the Underwritten Net Cash Flow at the Starwood Capital Hotel Portfolio II Properties:
Cash Flow Analysis
| 2010 | 2011 | TTM 10/31/2012 | U/W | U/W $ per Room | ||||||||||||||||
Occupancy | 61.2 | % | 63.6 | % | 63.1 | % | 63.8 | % | ||||||||||||
ADR | $ | 104.80 | $ | 109.43 | $ | 109.54 | $ | 109.54 | ||||||||||||
RevPAR | $ | 64.11 | $ | 69.57 | $ | 69.16 | $ | 69.93 | ||||||||||||
Total Revenue | $ | 21,536,505 | $ | 23,511,170 | $ | 23,289,732 | $ | 23,466,077 | $ | 27,738 | ||||||||||
Total Department Expenses | 6,261,192 | 6,660,002 | 6,739,260 | 6,809,152 | 8,049 | |||||||||||||||
|
|
|
|
|
|
|
|
|
| |||||||||||
Gross Operating Profit | $ | 15,275,313 | $ | 16,851,168 | $ | 16,550,472 | $ | 16,656,925 | $ | 19,689 | ||||||||||
Total Undistributed Expenses | 8,255,304 | 8,761,528 | 9,070,733 | 9,090,549 | 10,745 | |||||||||||||||
|
|
|
|
|
|
|
|
|
| |||||||||||
Profit Before Fixed Charges | $ | 7,020,009 | $ | 8,089,640 | $ | 7,479,739 | $ | 7,566,375 | $ | 8,944 | ||||||||||
Total Fixed Charges | 1,227,227 | 1,206,796 | 1,328,383 | 1,246,957 | 1,474 | |||||||||||||||
|
|
|
|
|
|
|
|
|
| |||||||||||
Net Operating Income | $ | 5,792,782 | $ | 6,882,844 | $ | 6,151,356 | $ | 6,319,418 | $ | 7,470 | ||||||||||
FF&E | 865,843 | 940,720 | 931,589 | 938,643 | 1,110 | |||||||||||||||
|
|
|
|
|
|
|
|
|
| |||||||||||
Net Cash Flow | $ | 4,926,939 | $ | 5,942,124 | $ | 5,219,768 | $ | 5,380,775 | $ | 6,360 | ||||||||||
NOI DSCR | 2.30x | 2.73x | 2.44x | 2.51x | ||||||||||||||||
NCF DSCR | 1.96x | 2.36x | 2.07x | 2.14x | ||||||||||||||||
NOI DY | 13.6 | % | 16.2 | % | 14.5 | % | 14.9 | % | ||||||||||||
NCF DY | 11.6 | % | 14.0 | % | 12.3 | % | 12.7 | % | ||||||||||||
THE INFORMATION IN THIS STRUCTURAL AND COLLATERAL TERM SHEET IS NOT COMPLETE AND MAY BE AMENDED PRIOR TO THE TIME OF SALE. THIS TERM SHEET IS NOT AN OFFER TO SELL THESE SECURITIES AND IT IS NOT A SOLICITATION OF AN OFFER TO BUY THESE SECURITIES IN ANY JURISDICTION WHERE THE OFFER OR SALE IS NOT PERMITTED.
97
STARWOOD CAPITAL HOTEL PORTFOLIO II
Appraisal. As of the appraisal valuation dates ranging from November 8, 2012 to November 19, 2012, the Starwood Capital Hotel Portfolio II Properties had an aggregate “as-is” appraised value of $75,100,000.
Environmental Matters.According to the Phase I environmental assessments dated November 27, 2012, there was no evidence of any recognized environmental conditions at seven of the Starwood Capital Hotel Portfolio II Properties.
With respect to the Hampton Inn – Carlisle, PA property, the Phase I environmental assessment identified recognized environmental conditions related to historical uses at the property and a neighboring property that was identified as a leaking underground storage tank (“LUST”) site. The assessment recommended (i) a limited subsurface investigation to determine the presence or absence of soil and/or groundwater contamination, (ii) a Tier II Vapor Encroachment Screening and (iii) a file review to determine the extent and status of underground storage tanks and contamination associated with the adjacent LUST site. A Phase II environmental assessment was performed in response to the aforementioned findings and recommended no further action.
The Borrower. The borrower is comprised of eight limited liability companies, each of which is a single purpose entity and has at least two independent directors. Legal counsel to the borrower delivered a non-consolidation opinion in connection with the origination of the Starwood Capital Hotel Portfolio II Mortgage Loan. The six sponsor entities, which are owned by Starwood Capital Group, are the guarantors of certain nonrecourse carveouts under the Starwood Capital Hotel Portfolio II Mortgage Loan.
The Sponsors.The sponsor consists of six entities which are owned by Starwood Capital Group. Starwood Capital Group has invested over $12.0 billion of equity since 1991 in all asset classes and levels of the capital structure. As of September 30, 2012, these investments have included over 2,200 hotels, 64,400 multifamily and condominium units, 32.8 million square feet of office, 23 million square feet of retail and 9.3 million square feet of industrial space.
Escrows.The loan documents provide for an initial deposit of $147,826 for real estate taxes as well as monthly deposits of $74,974 for real estate taxes. The loan documents also provide for an ongoing monthly FF&E reserve equal to 4.0% of total revenue (initially $78,220). The loan documents do not require monthly escrows for insurance provided the following conditions are satisfied: (i) no event of default exists and is continuing and (ii) the borrower provides the lender evidence of renewal of the policies and paid receipts for the payment of insurance premiums when due.
Guaranty of Scheduled PIP.In lieu of a deposit for costs associated with the upcoming Property Improvement Plan (“PIP”) work at all of the Starwood Portfolio II Properties except for Residence Inn – Williamsburg, VA and Springhill Suites – Williamsburg, VA, where PIPs have already been completed, the sponsor delivered a guaranty to the lender in connection with the completion of all PIP work, as required by the franchisors, within the time periods set forth in the loan documents. The sponsor’s total estimated cost of the remaining PIP work is approximately $7.8 million with an outside estimated completion date of February 23, 2014.
Lockbox and Cash Management.The Starwood Capital Hotel Portfolio II Mortgage Loan requires a lender-controlled lockbox account (“Primary Cash Management Account”), which is already in place, and that the borrower directs the manager to deliver all receipts payable with respect to the Starwood Capital Hotel Portfolio II Properties (after the payment of certain expenses, as outlined in the loan documents) directly into the Primary Cash Management Account. The loan documents also require that all revenues received by the borrower or the property manager be deposited into the Primary Cash Management Account within one business day after receipt. Prior to the occurrence of a Cash Trap Event Period (as defined below), all excess funds on deposit in the Primary Cash Management Account are disbursed to the borrower.
Furthermore, if the management agreement is terminated at any property, the borrower is required to set up a new lockbox account (“Clearing Account”) for such property, which shall remain in effect until a new qualified manager, as outlined in the loan documents, is in place. All amounts on deposit in the Clearing Account will be swept each business day to the Primary Cash Management Account.
A “Cash Trap Event Period” will commence upon (i) the occurrence and continuance of an event of default or (ii) the actual debt service coverage ratio falling below 1.50x. A Cash Trap Event Period will expire upon (i) in the case of an event of default, the cure of such event of default, or (ii) in the case of the actual debt service coverage ratio falling below 1.50x, the actual debt service coverage ratio being at least 1.55x for two consecutive calendar quarters.
Property Management.The Starwood Capital Hotel Portfolio II Properties are managed by an affiliate of the borrower.
Assumption.The borrower has a two-time right to transfer the Starwood Capital Hotel Portfolio II Properties, provided that no event of default has occurred and is continuing and certain other conditions are satisfied, including: (i) the lender’s reasonable determination that the proposed transferee and guarantor satisfy the lender’s credit review and underwriting standards, taking into consideration transferee experience, financial strength and general business standing; (ii) execution of a recourse guaranty and an environmental indemnity by an affiliate of the transferee; and (iii) if requested by the lender, rating agency confirmation from Fitch, KBRA and S&P that the transfer will not result in a downgrade, withdrawal or qualification of the respective ratings assigned to the Series 2013-C11 Certificates.
Right of First Refusal.With respect to three properties (Residence Inn – Williamsburg, VA; Springfield Suites – Williamsburg, VA; and Fairfield Inn – Laurel, MD), Marriott International, Inc., as franchisor, has a right of first refusal (“ROFR”) to acquire the related property if there is a transfer of the hotel or controlling direct or indirect interest in the related borrower to a “competitor” (any person having an interest, other than as a passive investor, in another hotel brand comprised of at least 20 full service hotels or 50 limited service hotels). The ROFRs are not extinguished by a foreclosure; however, the ROFRs do not apply to a foreclosure or deed-in-lieu thereof.
THE INFORMATION IN THIS STRUCTURAL AND COLLATERAL TERM SHEET IS NOT COMPLETE AND MAY BE AMENDED PRIOR TO THE TIME OF SALE. THIS TERM SHEET IS NOT AN OFFER TO SELL THESE SECURITIES AND IT IS NOT A SOLICITATION OF AN OFFER TO BUY THESE SECURITIES IN ANY JURISDICTION WHERE THE OFFER OR SALE IS NOT PERMITTED.
98
STARWOOD CAPITAL HOTEL PORTFOLIO II
Partial Release.Following the second anniversary of the issuance of the Series 2013-C11 Certificates (with the exception of the Hilton Garden Inn – Edison, NJ property, which is permitted to be released at any time), the borrower is permitted to release any individual property in connection with either (i) the payment of all applicable yield maintenance premiums or prepayment premiums or (ii) a partial defeasance. The aforementioned partial release or partial defeasance is subject to certain conditions, including (a) following the release, the outstanding loan balance is equal to or greater than $29,750,000; (b) having principal balance reduced by 120% of the released property’s allocated loan balance; (c) the debt service coverage ratio with respect to the remaining properties shall be no less than the greater of 2.14x and the debt service coverage ratio immediately prior to the release; and (d) rating agency confirmation that the release will not result in a downgrade, withdrawal or qualification of the respective ratings from Fitch, KBRA and S&P assigned to the Series 2013-C11 Certificates.
Real Estate Substitution.Not permitted.
Subordinate and Mezzanine Indebtedness.Not permitted.
Ground Lease. The borrower’s interest in the Hilton Garden Inn – Edison, NJ property is a leasehold interest. The ground lease expiration date is September 30, 2076.
Terrorism Insurance.The loan documents require that the “all risk” insurance policy required to be maintained by the borrower provide coverage for terrorism in an amount equal to the full replacement cost of the Starwood Capital Hotel Portfolio II Properties, as well as business interruption insurance covering no less than the 18-month period following the occurrence of a casualty event, together with an six-month extended period of indemnity.
THE INFORMATION IN THIS STRUCTURAL AND COLLATERAL TERM SHEET IS NOT COMPLETE AND MAY BE AMENDED PRIOR TO THE TIME OF SALE. THIS TERM SHEET IS NOT AN OFFER TO SELL THESE SECURITIES AND IT IS NOT A SOLICITATION OF AN OFFER TO BUY THESE SECURITIES IN ANY JURISDICTION WHERE THE OFFER OR SALE IS NOT PERMITTED.
99
HOLIDAY INN NATIONAL AIRPORT

THE INFORMATION IN THIS STRUCTURAL AND COLLATERAL TERM SHEET IS NOT COMPLETE AND MAY BE AMENDED PRIOR TO THE TIME OF SALE. THIS TERM SHEET IS NOT AN OFFER TO SELL THESE SECURITIES AND IT IS NOT A SOLICITATION OF AN OFFER TO BUY THESE SECURITIES IN ANY JURISDICTION WHERE THE OFFER OR SALE IS NOT PERMITTED.
100
HOLIDAY INN NATIONAL AIRPORT

THE INFORMATION IN THIS STRUCTURAL AND COLLATERAL TERM SHEET IS NOT COMPLETE AND MAY BE AMENDED PRIOR TO THE TIME OF SALE. THIS TERM SHEET IS NOT AN OFFER TO SELL THESE SECURITIES AND IT IS NOT A SOLICITATION OF AN OFFER TO BUY THESE SECURITIES IN ANY JURISDICTION WHERE THE OFFER OR SALE IS NOT PERMITTED.
101
No. 10 - Holiday Inn National Airport
Loan Information
| Mortgage Loan Seller: | Wells Fargo Bank, National Association | |
Credit Assessment (Fitch/KBRA/S&P): | NR/NR/NR | |
| Original Principal Balance: | $27,000,000 | |
| Cut-off Date Principal Balance: | $26,968,536 | |
| % of Initial Pool Balance: | 1.9% | |
| Loan Purpose: | Refinance | |
| Borrower Name: | Crystal City Hospitality Corp. | |
| Sponsor: | B.F. Saul Real Estate Investment Trust | |
| Mortgage Rate: | 4.600% | |
| Note Date: | December 18, 2012 | |
| Anticipated Repayment Date: | NAP | |
| Maturity Date: | January 1, 2023 | |
| IO Period: | None | |
| Loan Term (Original): | 120 months | |
| Seasoning: | 1 month | |
| Amortization Term (Original): | 360 months | |
| Loan Amortization Type: | Amortizing Balloon | |
| Interest Accrual Method: | Actual/360 | |
| Call Protection: | L(25),D(91),O(4) | |
| Lockbox Type: | Hard/Springing Cash Management | |
| Additional Debt: | None | |
| Additional Debt Type: | NAP | |
Escrows and Reserves(1):
Type: | Initial | Monthly | Cap (If Any) | |||||||||
Taxes | $ | 144,748 | $ | 36,184 | NAP | |||||||
Insurance | $ | 0 | Springing | NAP | ||||||||
FF&E | $ | 0 | $ | 36,987 | NAP | |||||||
PIP Reserve | $ | 2,765,580 | $ | 0 | NAP | |||||||
Property Information
Single Asset/Portfolio: | Single Asset | |
| Property Type: | Hospitality | |
| Specific Property Type: | Full Service | |
| Location: | Arlington, VA | |
| Size: | 280 rooms | |
Cut-off Date Principal Balance Per Unit/Room: | $96,316 | |
| Year Built/Renovated: | 1973/1999 | |
| Title Vesting: | Fee | |
| Property Manager: | Self-managed | |
| 3rdMost Recent Occupancy (As of): | 70.1% (12/31/2009) | |
| 2ndMost Recent Occupancy (As of): | 66.0% (12/31/2010) | |
| Most Recent Occupancy (As of): | 64.0% (12/31/2011) | |
| Current Occupancy (As of): | 62.6% (TTM 10/31/2012) | |
| Underwriting and Financial Information: | ||
| 3rdMost Recent NOI (As of): | $4,403,519 (12/31/2010) | |
| 2ndMost Recent NOI (As of): | $3,561,339 (12/31/2011) | |
| Most Recent NOI (As of): | $3,562,315 (TTM 10/31/2012) | |
| U/W Revenues: | $11,096,100 | |
| U/W Expenses: | $7,549,700 | |
| U/W NOI: | $3,546,400 | |
| U/W NCF: | $3,102,556 | |
| U/W NOI DSCR: | 2.14x | |
| U/W NCF DSCR: | 1.87x | |
| U/W NOI Debt Yield: | 13.2% | |
| U/W NCF Debt Yield: | 11.5% | |
| As-Is Appraised Value: | $45,700,000 | |
| As-Is Appraisal Valuation Date: | November 6, 2012 | |
| Cut-off Date LTV Ratio: | 59.0% | |
| LTV Ratio at Maturity or ARD: | 47.9% | |
| (1) | See “Escrows” section. |
The Mortgage Loan. The mortgage loan (the “Holiday Inn National Airport Mortgage Loan”) is evidenced by a single promissory note that is secured by a first mortgage encumbering a full service hotel located in Arlington, Virginia (the “Holiday Inn National Airport Property”). The Holiday Inn National Airport Mortgage Loan was originated on December 18, 2012 by Wells Fargo Bank, National Association. The Holiday Inn National Airport Mortgage Loan had an original principal balance of $27,000,000, has an outstanding principal balance as of the Cut-off Date of $26,968,536 and accrues interest at an interest rate of 4.600% per annum. The Holiday Inn National Airport Mortgage Loan had an initial term of 120 months, has a remaining term of 119 months as of the Cut-off Date and requires payments of principal and interest based on a 30-year amortization schedule. The Holiday Inn National Airport Mortgage Loan matures on January 1, 2023.
Following the lockout period, the borrower has the right to defease the Holiday Inn National Airport Mortgage Loan in whole, but not in part, on any due date before the scheduled maturity date. In addition, the Holiday Inn National Airport Mortgage Loan is prepayable without penalty on or after October 1, 2022.
THE INFORMATION IN THIS STRUCTURAL AND COLLATERAL TERM SHEET IS NOT COMPLETE AND MAY BE AMENDED PRIOR TO THE TIME OF SALE. THIS TERM SHEET IS NOT AN OFFER TO SELL THESE SECURITIES AND IT IS NOT A SOLICITATION OF AN OFFER TO BUY THESE SECURITIES IN ANY JURISDICTION WHERE THE OFFER OR SALE IS NOT PERMITTED.
102
HOLIDAY INN NATIONAL AIRPORT
Sources and Uses
Sources | Uses | |||||||||||||||||
Original loan amount | $ | 27,000,000 | 100.0 | % | Loan payoff(1) | $ | 9,470,523 | 35.1 | % | |||||||||
| Reserves | 2,910,328 | 10.8 | ||||||||||||||||
| Closing costs | 326,095 | 1.2 | ||||||||||||||||
| Return of equity | 14,293,054 | 52.9 | ||||||||||||||||
|
|
|
|
|
|
|
| |||||||||||
Total Sources | $ | 27,000,000 | 100.0 | % | Total Uses | $ | 27,000,000 | 100.0 | % | |||||||||
|
|
|
|
|
|
|
| |||||||||||
| (1) | The Holiday Inn National Airport Property was previously securitized in JPMCC 2003-PM1A. |
The Property.The Holiday Inn National Airport Property is a 280-room, 18-story, full service hotel located in Arlington, Virginia. The Holiday Inn National Airport Property was built in 1973 and renovated in 1999. Amenities at the Holiday Inn National Airport Property include 4,885 square feet of meeting/ballroom space, a restaurant, a lounge, an exercise room and a gift shop. The Holiday Inn National Airport Property offers 145 king guestrooms, 134 double guestrooms and one one-bedroom suite. Each guestroom features a 32-inch flat-panel television, an armoire, a desk, an ironing board and a coffee maker; while deluxe rooms also feature a larger living space, with a microwave and a small refrigerator. As part of the Property Improvement Plan (“PIP”) to be completed by December 31, 2015, the restaurant, the lounge, meeting space and pool area will undergo a complete redevelopment. In addition, the guestrooms and lobby will be upgraded. The franchise agreement between the Crystal City Hospitality Corp. and Intercontinental Hotel Group expires October 22, 2029.
Operating History and Underwritten Net Cash Flow.The following table represents certain information relating to the historical operating performance and the Underwritten Net Cash Flow at the Holiday Inn National Airport Property:
Cash Flow Analysis
| 2010 | 2011 | TTM 10/31/2012 | U/W | U/W $ per Room | ||||||||||||||||
Occupancy | 66.0 | % | 64.0 | % | 62.6 | % | 62.6 | % | ||||||||||||
ADR | $ | 143.74 | $ | 132.58 | $ | 134.96 | $ | 134.96 | ||||||||||||
RevPAR | $ | 94.89 | $ | 84.79 | $ | 84.50 | $ | 84.50 | ||||||||||||
Total Revenue | $ | 12,104,720 | $ | 10,983,463 | $ | 11,119,776 | $ | 11,096,100 | $ | 39,629 | ||||||||||
Total Department Expenses | 3,432,331 | 3,287,083 | 3,430,149 | 3,424,517 | 12,230 | |||||||||||||||
|
|
|
|
|
|
|
|
|
| |||||||||||
Gross Operating Profit | $ | 8,672,389 | $ | 7,696,380 | $ | 7,689,627 | $ | 7,671,583 | $ | 27,399 | ||||||||||
Total Undistributed Expenses | 3,796,220 | 3,577,649 | 3,585,575 | 3,583,446 | 12,798 | |||||||||||||||
|
|
|
|
|
|
|
|
|
| |||||||||||
Profit Before Fixed Charges | $ | 4,876,169 | $ | 4,118,731 | $ | 4,104,052 | $ | 4,088,137 | $ | 14,600 | ||||||||||
Total Fixed Charges | 472,650 | 557,392 | 541,737 | 541,737 | 1,935 | |||||||||||||||
|
|
|
|
|
|
|
|
|
| |||||||||||
Net Operating Income | $ | 4,403,519 | $ | 3,561,339 | $ | 3,562,315 | $ | 3,546,400 | $ | 12,666 | ||||||||||
FF&E | 229,501 | 279,670 | 365,196 | 443,844 | 1,585 | |||||||||||||||
|
|
|
|
|
|
|
|
|
| |||||||||||
Net Cash Flow | $ | 4,174,018 | $ | 3,281,669 | $ | 3,197,119 | $ | 3,102,556 | $ | 11,081 | ||||||||||
NOI DSCR | 2.65x | 2.14x | 2.14x | 2.14x | ||||||||||||||||
NCF DSCR | 2.51x | 1.98x | 1.92x | 1.87x | ||||||||||||||||
NOI DY | 16.3 | % | 13.2 | % | 13.2 | % | 13.2 | % | ||||||||||||
NCF DY | 15.5 | % | 12.2 | % | 11.9 | % | 11.5 | % | ||||||||||||
Appraisal.As of the appraisal valuation date of November 6, 2012, the Holiday Inn National Airport Property had an “as-is” appraised value of $45,700,000.
Environmental Matters.According to the Phase I environmental site assessment dated November 13, 2012, a limited subsurface investigation was recommended due to the former onsite presence of gasoline underground storage tanks. In lieu of the additional investigation, the borrower obtained a $2,000,000 environmental insurance policy with a term of 10 years with a three-year tail. See “Description of the Mortgage Pool – Assessments of Property Value and Condition – Environmental Assessments” in the Free Writing Prospectus.
Market Overview and Competition.The Holiday Inn National Airport Property is located within Crystal City in Arlington, Virginia, within the Washington-Baltimore-Northern Virginia metropolitan statistical area. The Holiday Inn National Airport Property is less than a half mile from the Ronald Reagan Washington National Airport, less than one mile from Interstate 395 and within walking distance to the Crystal City Metro Station, which provides convenient train access to downtown Washington, D.C. The location of the Holiday Inn National Airport Property benefits from numerous demand generators including the Pentagon, Ronald Reagan Washington National Airport, the tourist attractions in Washington, D.C., as well as various business and government agencies located in the area including the Environmental Protection Agency, Boeing, Raytheon and Lockheed Martin.
THE INFORMATION IN THIS STRUCTURAL AND COLLATERAL TERM SHEET IS NOT COMPLETE AND MAY BE AMENDED PRIOR TO THE TIME OF SALE. THIS TERM SHEET IS NOT AN OFFER TO SELL THESE SECURITIES AND IT IS NOT A SOLICITATION OF AN OFFER TO BUY THESE SECURITIES IN ANY JURISDICTION WHERE THE OFFER OR SALE IS NOT PERMITTED.
103
HOLIDAY INN NATIONAL AIRPORT
The following table presents certain information relating to the Holiday Inn National Airport Property’s competitive set:
Subject and Market Historical Occupancy, ADR and RevPAR(1)
| Competitive Set | Holiday Inn National Airport | Penetration Factor | ||||||||||||||||||||||||||||||||||
Year | Occupancy | ADR | RevPAR | Occupancy(2) | ADR | RevPAR(2) | Occupancy | ADR | RevPAR | |||||||||||||||||||||||||||
10/31/2012 TTM | 73.2 | % | $ | 129.34 | $ | 94.71 | 62.6 | % | $ | 138.45 | $ | 86.69 | 85.5 | % | 107.0 | % | 91.5 | % | ||||||||||||||||||
10/31/2011 TTM | 71.3 | % | $ | 133.96 | $ | 95.47 | 63.7 | % | $ | 139.11 | $ | 88.62 | 89.4 | % | 103.8 | % | 92.8 | % | ||||||||||||||||||
10/31/2010 TTM | 71.7 | % | $ | 137.54 | $ | 98.68 | 67.2 | % | $ | 146.27 | $ | 98.28 | 93.7 | % | 106.3 | % | 99.6 | % | ||||||||||||||||||
| (1) | Information obtained from a third party hospitality report dated November 19, 2012. |
| (2) | Occupancy and RevPAR decrease can be attributed to 625 rooms of new supply added to the Crystal City market in 2011 - the 300-room Renaissance and 325 rooms Residence Inn by Marriott. The impact of the additional supply, coupled with the Defense Department BRAC (Base Realignment and Closure) in which the Defense Department vacated a significant amount of office space over the past couple years and caused a drop in occupancy and ADR. The Holiday Inn National Airport Property has absorbed the impact of these events as evidenced by the TTM October 2012 RevPAR of $84.50 remaining relatively flat against the December 31, 2011 RevPAR of $84.79. |
The Borrower.The borrower is Crystal City Hospitality Corp., a Virginia corporation and a single purpose entity with an independent director. B.F. Saul Real Estate Investment Trust, the sponsor, is the guarantor of certain nonrecourse carveouts under the Holiday Inn National Airport Mortgage Loan.
The Sponsor.The loan sponsor is the B.F. Saul Real Estate Investment Trust, which is managed and 57.0% owned by the B.F. Saul Company. The remaining 43.0% of the B.F. Saul Real Estate Investment Trust is owned by other entities which are all ultimately owned and controlled by B.F. Saul II and his immediate family. The B.F. Saul Company was founded in 1892 and is based in Bethesda, Maryland. The company focuses on the ownership, development and construction of commercial real estate. The B.F. Saul Real Estate Investment Trust owns and manages 18 business class hotels in Virginia, Maryland, Florida and Michigan. As of December 31, 2011, the B.F. Saul Real Estate Investment Trust reported $1.15 billion in total assets and $322.4 million net worth.
Escrows.The loan documents provide for an upfront escrow at closing in the amount of $144,748 for real estate taxes and ongoing monthly escrows in the amount of $36,184. Ongoing monthly insurance escrows are not required as long as no event of default has occurred and is continuing and the borrower provides satisfactory evidence that the property is insured in accordance with the loan documents. The borrower is required to deposit an amount equal to one-twelfth of 4.0% of the annual gross revenues received over the prior 12-month period for FF&E expenditures. The first monthly FF&E deposit shall be $36,987. Additionally, the loan documents provide for an upfront escrow of $2,765,580 for PIP expenditures.
Lockbox and Cash Management.The Holiday Inn National Airport Mortgage Loan requires a lender-controlled lockbox account, which is already in place, and that the borrower and the property manager will cause all credit card receipts to be deposited directly into such lockbox. Other than during a Cash Trap Event Period (as defined below), all excess funds on deposit are distributed to the borrower or the property manager.
A “Cash Trap Event Period” will exist upon (i) the occurrence and continuance of an event of default or (ii) the debt service coverage falling below 1.55x at the end of any calendar quarter. A Cash Trap Event Period will expire upon (i) in the case of an event of default, the cure of such event of default, or (ii) in the case of the debt service coverage falling below 1.55x, the debt service coverage ratio being at least 1.55x for two consecutive calendar quarters. The determination of the debt service coverage ratio will occur on April 1st, July 1st, October 1st and January 1st of each year using trailing 12-month information.
Property Management.The Holiday Inn National Airport Property is self-managed.
Assumption.The borrower has a two-time right to transfer the Holiday Inn National Airport Property and cause an assumption of the loan, provided that no event of default has occurred and is continuing and certain other conditions are satisfied, including: (i) the lender’s reasonable determination that the proposed transferee and its principals satisfy the lender’s credit review and underwriting standards, taking into consideration transferee experience, financial strength, and general business standing; (ii) execution of recourse guaranty and an environmental indemnity by an affiliate of the transferee and (iii) rating agency confirmation that the transfer will not result in a downgrade, withdrawal or qualification of the respective ratings from Fitch, KBRA and S&P assigned to the Series 2013-C11 Certificates.
Partial Release.Not permitted.
Real Estate Substitution.Not permitted.
Subordinate and Mezzanine Indebtedness.Not permitted.
Other Additional Financing.A pledge by any member, partner or shareholder of the borrower of its indirect (but not direct) ownership interest in the borrower is permitted in favor of one or more Permitted Pledge Banks (as defined below) as security for the direct obligations of such member, partner or shareholder.
A “Permitted Pledge Bank” means a commercial bank, insurance company, trust company, investment bank pension fund or pension advisory firm or other financial institution with significant real estate experience involving properties similar to the Holiday Inn National Airport Property.
THE INFORMATION IN THIS STRUCTURAL AND COLLATERAL TERM SHEET IS NOT COMPLETE AND MAY BE AMENDED PRIOR TO THE TIME OF SALE. THIS TERM SHEET IS NOT AN OFFER TO SELL THESE SECURITIES AND IT IS NOT A SOLICITATION OF AN OFFER TO BUY THESE SECURITIES IN ANY JURISDICTION WHERE THE OFFER OR SALE IS NOT PERMITTED.
104
HOLIDAY INN NATIONAL AIRPORT
Ground Lease.None.
Terrorism Insurance.The loan documents require that the “all risk” insurance policy required to be maintained by the borrower provide coverage for terrorism in an amount equal to the full replacement cost of the Holiday Inn National Airport Property, as well as business interruption insurance covering no less than the 12-month period following the occurrence of a casualty event, together with a six-month extended period of indemnity.
THE INFORMATION IN THIS STRUCTURAL AND COLLATERAL TERM SHEET IS NOT COMPLETE AND MAY BE AMENDED PRIOR TO THE TIME OF SALE. THIS TERM SHEET IS NOT AN OFFER TO SELL THESE SECURITIES AND IT IS NOT A SOLICITATION OF AN OFFER TO BUY THESE SECURITIES IN ANY JURISDICTION WHERE THE OFFER OR SALE IS NOT PERMITTED.
105
No. 11 - Encino Courtyard
| Loan Information | ||
| Mortgage Loan Seller: | The Royal Bank of Scotland | |
Credit Assessment (Fitch/KBRA/S&P): | NR/NR/NR | |
| Original Principal Balance: | $25,600,000 | |
| Cut-off Date Principal Balance: | $25,569,693 | |
| % of Initial Pool Balance: | 1.8% | |
| Loan Purpose: | Refinance | |
| Borrower Name: | Encino Courtyard, LLC | |
| Sponsor: | Levy Affiliated Holdings, LLC | |
| Mortgage Rate: | 4.530% | |
| Note Date: | December 19, 2012 | |
| Anticipated Repayment Date: | NAP | |
| Maturity Date: | January 6, 2023 | |
| IO Period: | None | |
| Loan Term (Original): | 120 months | |
| Seasoning: | 1 month | |
| Amortization Term (Original): | 360 months | |
| Loan Amortization Type: | Amortizing Balloon | |
| Interest Accrual Method: | Actual/360 | |
| Call Protection: | L(25),D(91),O(4) | |
| Lockbox Type: | Hard/Springing Cash Management | |
| Additional Debt(1): | Yes | |
| Additional Debt Type(1): | Mezzanine | |
Escrows and Reserves: | ||
Type: | Initial | Monthly | Cap (If Any) | |||||||||
Taxes | $ | 162,300 | $ | 18,033 | NAP | |||||||
Insurance | $ | 7,640 | $ | 1,910 | NAP | |||||||
Replacement Reserves | $ | 0 | $ | 2,077 | NAP | |||||||
TI/LC Reserve(2) | $ | 0 | $ | 7,309 | $ | 263,124 | (2) | |||||
Deferred Maintenance | $ | 7,800 | $ | 0 | NAP | |||||||
LA Fitness Expansion | ||||||||||||
Reserve(3) | $ | 0 | Springing | NAP | ||||||||
| Property Information | ||
| Single Asset/Portfolio: | Single Asset | |
| Property Type: | Retail | |
| Specific Property Type: | Anchored | |
| Location: | Encino, CA | |
| Size(4): | 99,677 SF | |
Cut-off Date Principal Balance Per Unit/SF: | $256.53 | |
| Year Built/Renovated: | 1989/2002 | |
| Title Vesting: | Fee | |
| Property Manager: | Silver Platinum Realty Management Inc. | |
| 3rd Most Recent Occupancy (As of): | 90.3% (12/31/2009) | |
| 2nd Most Recent Occupancy (As of): | 89.2% (12/31/2010) | |
| Most Recent Occupancy (As of): | 97.5% (12/31/2011) | |
| Current Occupancy (As of): | 95.5% (12/1/2012) | |
| Underwriting and Financial Information: | ||
| 3rdMost Recent NOI (As of): | $2,012,028 (12/31/2010) | |
| 2ndMost Recent NOI (As of): | $1,815,895 (12/31/2011) | |
| Most Recent NOI (As of): | $2,105,254 (TTM 9/30/2012) | |
| U/W Revenues: | $3,342,457 | |
| U/W Expenses: | $1,002,405 | |
| U/W NOI: | $2,340,052 | |
| U/W NCF: | $2,221,792 | |
| U/W NOI DSCR : | 1.50x | |
| U/W NCF DSCR: | 1.42x | |
| U/W NOI Debt Yield: | 9.2% | |
| U/W NCF Debt Yield: | 8.7% | |
| As-Is Appraised Value: | $36,600,000 | |
| As-Is Appraisal Valuation Date: | September 13, 2012 | |
| Cut-off Date LTV Ratio: | 69.9% | |
| LTV Ratio at Maturity or ARD: | 56.6% | |
| (1) | The equity interests in the borrower have been pledged to secure mezzanine indebtedness with a balance as of the Cut-off Date of $2,500,000 (the “Encino Courtyard Mezzanine Loan”). As of the Cut-off Date, taking into account both the Encino Courtyard mortgage loan and the Encino Courtyard Mezzanine Loan, the total debt U/W NCF DSCR is 1.17x, the total debt Cut-off Date LTV ratio is 76.7% and the total debt U/W NCF Debt Yield is 7.9%. All LTV, DSCR, debt yield and Cut-off Date Principal Balance per square foot numbers presented in the table above are based solely on the $25,600,000 senior financing. |
| (2) | The lender has the right to adjust the monthly TI/LC reserve to reflect future changes in leasing. The TI/LC reserve is capped at 36 times the monthly reserve. $263,124 reflects the cap based on the current monthly TI/LC reserve. |
| (3) | The LA Fitness Expansion Reserve will spring, in the amount of $60,300, within 10 days of the execution of either a modification of the existing lease with LA Fitness or the execution of a new lease, in either such case consistent with the letter of intent discussed below. |
| (4) | The net rentable square footage shown does not include 10,600 square feet of new construction expansion space which is currently unleasable. LA Fitness has executed a letter of intent to take occupancy in this space for a 15-year term beginning in 2013. |
The Encino Courtyard mortgage loan is evidenced by a single promissory note that is secured by a first mortgage encumbering a 99,677 square foot anchored retail center located in Encino, California (the “Encino Courtyard Property”) approximately 20 miles northwest of downtown Los Angeles. The Encino Courtyard Property is anchored by Bed Bath & Beyond and LA Fitness. The Encino Courtyard Property was built in 1989, renovated in 2002 and was subsequently acquired by the sponsor in 2007. Parking at the Encino Courtyard Property consists of both subterranean garage parking and surface parking totaling approximately 429 parking spaces, or approximately 4.3 spaces per 1,000 square feet. As of December 1, 2012, the Encino Courtyard Property was 95.5% leased to 20 tenants. Additionally, there is currently an executed letter of intent with LA Fitness to expand its space by approximately 15,900 square feet, comprised of 5,300 square feet of space currently occupied by LyteSpeed Learning and 10,600 square feet of new construction space.
THE INFORMATION IN THIS STRUCTURAL AND COLLATERAL TERM SHEET IS NOT COMPLETE AND MAY BE AMENDED PRIOR TO THE TIME OF SALE. THIS TERM SHEET IS NOT AN OFFER TO SELL THESE SECURITIES AND IT IS NOT A SOLICITATION OF AN OFFER TO BUY THESE SECURITIES IN ANY JURISDICTION WHERE THE OFFER OR SALE IS NOT PERMITTED.
106
ENCINO COURTYARD
Sources and Uses
Sources | Uses | |||||||||||||||||
Original loan amount | $ | 25,600,000 | 91.1 | % | Loan payoff | $ | 27,178,556 | 96.7 | % | |||||||||
Mezzanine loan amount | 2,500,000 | 8.9 | Closing costs | 749,740 | 2.7 | |||||||||||||
Sponsor’s new cash contribution | 6,036 | 0.0 | Reserves | 177,740 | 0.6 | |||||||||||||
|
|
|
|
|
|
|
| |||||||||||
Total Sources | $ | 28,106,036 | 100.0 | % | Total Uses | $ | 28,106,036 | 100.0 | % | |||||||||
|
|
|
|
|
|
|
| |||||||||||
The following table presents certain information relating to the tenancies at the Encino Courtyard Property:
Major Tenants
Tenant Name | Credit S&P)(1) | Tenant NRSF | % of NRSF | Annual U/W Base Rent PSF(2) | Annual U/W Base Rent(2) | % of Total Annual U/W Base Rent | Sales PSF(3) | Occupancy Cost(3) | Lease Expiration Date | |||||||||||||||||||||||||
Anchor Tenants | ||||||||||||||||||||||||||||||||||
LA Fitness(4) | NR/NR/NR | 24,747 | 24.8 | % | $ | 36.44 | $ | 901,667 | 35.4 | % | NAV | NAV | 12/31/2016 | (5) | ||||||||||||||||||||
Bed Bath & Beyond | NR/NR/BBB+ | 30,000 | 30.1 | % | $ | 20.42 | $ | 612,482 | 24.0 | % | NAV | NAV | 1/31/2018 | (6) | ||||||||||||||||||||
|
|
|
|
|
|
|
| |||||||||||||||||||||||||||
Total Anchor Tenants | 54,747 | 54.9 | % | $ | 27.66 | $ | 1,514,149 | 59.4 | % | |||||||||||||||||||||||||
Major Tenants | ||||||||||||||||||||||||||||||||||
Western Bagel Baking | NR/NR/NR | 2,347 | 2.4 | % | $ | 46.34 | $ | 108,768 | 4.3 | % | $ | 433 | 13.5 | % | 5/31/2016 | |||||||||||||||||||
RAMLA USA | NR/NR/NR | 4,307 | 4.3 | % | $ | 24.10 | $ | 103,808 | 4.1 | % | NAV | NAV | 3/31/2022 | |||||||||||||||||||||
Mockingbird Enterprises | NR/NR/NR | 4,281 | 4.3 | % | $ | 21.60 | $ | 92,470 | 3.6 | % | NAV | NAV | 4/30/2016 | |||||||||||||||||||||
Butterfly Loft, LLC | NR/NR/NR | 3,379 | 3.4 | % | $ | 22.80 | $ | 77,041 | 3.0 | % | NAV | NAV | 5/15/2016 | |||||||||||||||||||||
Identity Salon, Inc. | NR/NR/NR | 2,366 | 2.4 | % | $ | 25.20 | $ | 59,623 | 2.3 | % | NAV | NAV | 4/30/2014 | |||||||||||||||||||||
LyteSpeed Learning(5) | NR/NR/NR | 5,300 | 5.3 | % | $ | 10.98 | $ | 58,200 | 2.3 | % | NAV | NAV | MTM | |||||||||||||||||||||
|
|
|
|
|
|
|
| |||||||||||||||||||||||||||
Total Major Tenants | 21,980 | 22.1 | % | $ | 22.74 | $ | 499,910 | 19.6 | % | |||||||||||||||||||||||||
Non-Major Tenants | 18,448 | 18.5 | % | $ | 28.93 | $ | 533,667 | 20.9 | % | |||||||||||||||||||||||||
|
|
|
|
|
|
|
| |||||||||||||||||||||||||||
Occupied Collateral | 95,175 | 95.5 | % | $ | 26.77 | $ | 2,547,726 | 100.0 | % | |||||||||||||||||||||||||
|
|
|
| |||||||||||||||||||||||||||||||
Vacant Space | 4,502 | 4.5 | % | |||||||||||||||||||||||||||||||
|
|
|
| |||||||||||||||||||||||||||||||
Collateral Total | 99,677 | 100.0 | % | |||||||||||||||||||||||||||||||
|
|
|
| |||||||||||||||||||||||||||||||
| (1) | Certain ratings are those of the parent company whether or not the parent guarantees the lease. |
| (2) | The underwritten base rent includes contractual rent steps through June of 2013. |
| (3) | The only tenant required to report sales is Western Bagel Baking. Sales are as of year-end 2011 and occupancy costs reflect 2011 sales and current base rent and reimbursement charges. |
| (4) | LA Fitness has executed a letter of intent to expand its space by approximately 15,900 square feet, comprised of 5,300 square feet of space currently occupied by LyteSpeed Learning and 10,600 square feet of new construction expansion space. Pursuant to the letter of intent, the total 15,900 square feet will be leased for a term of 15 years under the terms of the letter of intent. No rent has been underwritten from this space. |
| (5) | LA Fitness has three five-year extension options remaining. |
| (6) | Bed Bath & Beyond has three, five-year extension options remaining. |
THE INFORMATION IN THIS STRUCTURAL AND COLLATERAL TERM SHEET IS NOT COMPLETE AND MAY BE AMENDED PRIOR TO THE TIME OF SALE. THIS TERM SHEET IS NOT AN OFFER TO SELL THESE SECURITIES AND IT IS NOT A SOLICITATION OF AN OFFER TO BUY THESE SECURITIES IN ANY JURISDICTION WHERE THE OFFER OR SALE IS NOT PERMITTED.
107
ENCINO COURTYARD
The following table presents certain information relating to the lease rollover schedule at the Encino Courtyard Property:
Lease Expiration Schedule(1)(2)
Year Ending December 31, | No. of Leases Expiring | Expiring NRSF | % of Total NRSF | Cumulative Expiring NRSF | Cumulative % of Total NRSF | Annual U/W Base Rent | Annual U/W Base Rent PSF(3) | |||||||||||||||||||
MTM(4) | 3 | 9,011 | 9.0 | % | 9,011 | 9.0 | % | $ | 125,141 | $ | 13.89 | |||||||||||||||
2013 | 2 | 3,461 | 3.5 | % | 12,472 | 12.5 | % | $ | 84,648 | $ | 24.46 | |||||||||||||||
2014 | 3 | 4,337 | 4.4 | % | 16,809 | 16.9 | % | $ | 127,288 | $ | 29.35 | |||||||||||||||
2015 | 1 | 1,020 | 1.0 | % | 17,829 | 17.9 | % | $ | 35,300 | $ | 34.61 | |||||||||||||||
2016 | 8 | 40,983 | 41.1 | % | 58,812 | 59.0 | % | $ | 1,393,678 | $ | 34.01 | |||||||||||||||
2017 | 1 | 2,056 | 2.1 | % | 60,868 | 61.1 | % | $ | 65,381 | $ | 31.80 | |||||||||||||||
2018 | 1 | 30,000 | 30.1 | % | 90,868 | 91.2 | % | $ | 612,482 | $ | 20.42 | |||||||||||||||
2019 | 0 | 0 | 0.0 | % | 90,868 | 91.2 | % | $ | 0 | $ | 0.00 | |||||||||||||||
2020 | 0 | 0 | 0.0 | % | 90,868 | 91.2 | % | $ | 0 | $ | 0.00 | |||||||||||||||
2021 | 0 | 0 | 0.0 | % | 90,868 | 91.2 | % | $ | 0 | $ | 0.00 | |||||||||||||||
2022 | 1 | 4,307 | 4.3 | % | 95,175 | 95.5 | % | $ | 103,808 | $ | 24.10 | |||||||||||||||
2023 | 0 | 0 | 0.0 | % | 95,175 | 95.5 | % | $ | 0 | $ | 0.00 | |||||||||||||||
Thereafter | 0 | 0 | 0.0 | % | 95,175 | 95.5 | % | $ | 0 | $ | 0.00 | |||||||||||||||
Vacant | 0 | 4,502 | 4.5 | % | 99,677 | 100.0 | % | $ | 0 | $ | 0.00 | |||||||||||||||
|
|
|
|
|
|
|
|
| ||||||||||||||||||
Total/Weighted Average | 20 | 99,677 | 100.0 | % | $ | 2,547,726 | $ | 26.77 | ||||||||||||||||||
|
|
|
|
|
|
|
|
| ||||||||||||||||||
| (1) | Information was obtained from the underwritten rent roll. |
| (2) | Certain tenants may have lease termination options that are exercisable prior to the stated expiration date of the subject lease and that are not considered in the Lease Expiration Schedule. |
| (3) | Weighted Average Annual U/W Base Rent PSF excludes vacant space. |
| (4) | LyteSpeed Learning (5,300 square feet) is on a month-to-month lease and plans to vacate its space. LA Fitness has executed a letter of intent on this space and an additional 10,600 square feet of new construction space for a 15-year term extending to 2028. The new construction expansion space is not included in the square footage presented in the Lease Expiration Schedule. |
The following table presents historical occupancy percentages at the Encino Courtyard Property:
Historical Occupancy(1)
12/31/2009 | 12/31/2010 | 12/31/2011 | ||
90% | 89% | 98% |
| (1) | Information obtained from the borrower rent rolls. |
Operating History and Underwritten Net Cash Flow. The following table presents certain information relating to the historical operating performance and the Underwritten Net Cash Flow at the Encino Courtyard Property:
Cash Flow Analysis(1)
| 2010 | 2011 | TTM 9/30/2012 | U/W(2) | U/W $ per SF | ||||||||||||||||
Base Rent | $ | 2,041,362 | $ | 2,067,259 | $ | 2,247,573 | $ | 2,547,726 | $ | 25.56 | ||||||||||
Grossed Up Vacant Space | 0 | 0 | 0 | 193,586 | 1.94 | |||||||||||||||
Percentage Rent | 0 | 0 | 0 | 0 | 0.00 | |||||||||||||||
Total Reimbursables | 917,613 | 733,815 | 833,004 | 805,439 | 8.08 | |||||||||||||||
Other Income | 10,992 | 8,511 | 22,716 | 8,511 | 0.09 | |||||||||||||||
Less Vacancy & Credit Loss | 0 | 0 | 0 | (212,805 | )(3) | (2.13 | ) | |||||||||||||
|
|
|
|
|
|
|
|
|
| |||||||||||
Effective Gross Income | $ | 2,969,967 | $ | 2,809,585 | $ | 3,103,293 | $ | 3,342,457 | $ | 33.53 | ||||||||||
Total Operating Expenses | $ | 957,939 | $ | 993,690 | $ | 998,039 | $ | 1,002,405 | $ | 10.06 | ||||||||||
|
|
|
|
|
|
|
|
|
| |||||||||||
Net Operating Income | $ | 2,012,028 | $ | 1,815,895 | $ | 2,105,254 | $ | 2,340,052 | $ | 23.48 | ||||||||||
TI/LC | 0 | 0 | 0 | 95,334 | 0.96 | |||||||||||||||
Capital Expenditures | 0 | 0 | 0 | 22,926 | 0.23 | |||||||||||||||
|
|
|
|
|
|
|
|
|
| |||||||||||
Net Cash Flow | $ | 2,012,028 | $ | 1,815,895 | $ | 2,105,254 | $ | 2,221,792 | $ | 22.29 | ||||||||||
NOI DSCR | 1.29x | 1.16x | 1.35x | 1.50x | ||||||||||||||||
NCF DSCR | 1.29x | 1.16x | 1.35x | 1.42x | ||||||||||||||||
NOI DY | 7.9 | % | 7.1 | % | 8.2 | % | 9.2 | % | ||||||||||||
NCF DY | 7.9 | % | 7.1 | % | 8.2 | % | 8.7 | % | ||||||||||||
| (1) | The underwritten net operating income is higher than historical net operating income due in large part to approximately $335,138 in rental income (8.4% of net rentable area and 10.0% of underwritten effective gross income) from six tenants whose leases began after September 30, 2011, and thus were not fully reflected in the trailing 12-month operating statements as of September 30, 2012. |
| (2) | No income was underwritten for the 10,600 square feet of new construction space which LA Fitness has signed a letter of intent to occupy for a 15-year term extending to 2028. |
| (3) | The underwritten economic vacancy is 6.0%. The Encino Courtyard Property was 95.5% physically occupied as of December 1, 2012. |
THE INFORMATION IN THIS STRUCTURAL AND COLLATERAL TERM SHEET IS NOT COMPLETE AND MAY BE AMENDED PRIOR TO THE TIME OF SALE. THIS TERM SHEET IS NOT AN OFFER TO SELL THESE SECURITIES AND IT IS NOT A SOLICITATION OF AN OFFER TO BUY THESE SECURITIES IN ANY JURISDICTION WHERE THE OFFER OR SALE IS NOT PERMITTED.
108
[THIS PAGE INTENTIONALLY LEFT BLANK.]
109
No. 12 - Doubletree Asheville
Loan Information
| Mortgage Loan Seller: | The Royal Bank of Scotland | |
Credit Assessment (Fitch/KBRA/S&P): | NR/NR/NR | |
| Original Principal Balance: | $20,900,000 | |
| Cut-off Date Principal Balance: | $20,829,782 | |
| % of Initial Pool Balance: | 1.5% | |
| Loan Purpose: | Refinance | |
| Borrower Name: | BFHG II, LLC | |
| Sponsor: | Biltmore Farms, LLC | |
| Mortgage Rate: | 4.523% | |
| Note Date: | November 21, 2012 | |
| Anticipated Repayment Date: | NAP | |
| Maturity Date: | December 1, 2022 | |
| IO Period: | None | |
| Loan Term (Original): | 120 months | |
| Seasoning: | 2 months | |
| Amortization Term (Original): | 300 months | |
| Loan Amortization Type: | Amortizing Balloon | |
| Interest Accrual Method: | Actual/360 | |
| Call Protection: | L(26),D(90),O(4) | |
| Lockbox Type: | Springing (Without Established Account) | |
| Additional Debt: | None | |
| Additional Debt Type: | NAP | |
Escrows and Reserves:
Type: | Initial | Monthly | Cap (If Any) | |||||||||
Taxes | $ | 16,911 | $ | 16,911 | NAP | |||||||
Insurance | $ | 42,020 | $ | 0 | NAP | |||||||
Replacement Reserve | $ | 0 | $ | 25,790 | NAP | |||||||
PIP Reserve(1) | $ | 2,483,546 | $ | 0 | NAP | |||||||
Seasonality Reserve(2) | $ | 200,000 | $ | 20,000 | $ | 200,000 | ||||||
Property Information
| Single Asset/Portfolio: | Single Asset | |
| Property Type: | Hospitality | |
| Specific Property Type: | Full Service | |
| Location: | Asheville, NC | |
| Size: | 197 rooms | |
Cut-off Date Principal Balance Per Room: | $105,735 | |
| Year Built/Renovated: | 1989/2008 | |
| Title Vesting: | Fee | |
| Property Manager: | Self-managed | |
| 3rdMost Recent Occupancy (As of): | 67.3% (12/31/2009) | |
| 2ndMost Recent Occupancy (As of): | 66.9% (12/31/2010) | |
| Most Recent Occupancy (As of): | 70.0% (12/31/2011) | |
| Current Occupancy (As of): | 74.8% (9/30/2012) | |
| Underwriting and Financial Information: | ||
| 3rd Most Recent NOI (As of): | $2,104,435 (12/31/2010) | |
| 2nd Most Recent NOI (As of): | $2,372,859 (12/31/2011) | |
| Most Recent NOI (As of): | $2,767,354 (TTM 9/30/2012) | |
| U/W Revenues: | $7,714,369 | |
| U/W Expenses: | $4,974,689 | |
| U/W NOI: | $2,739,680 | |
| U/W NCF: | $2,431,105 | |
| U/W NOI DSCR: | 1.96x | |
| U/W NCF DSCR: | 1.74x | |
| U/W NOI Debt Yield: | 13.2% | |
| U/W NCF Debt Yield: | 11.7% | |
| As-Is Appraised Value: | $35,300,000 | |
| As-Is Appraisal Valuation Date: | October 9, 2012 | |
| Cut-off Date LTV Ratio: | 59.0% | |
| LTV Ratio at Maturity or ARD: | 43.5% | |
| (1) | The Property Improvement Plan (“PIP”) is expected to cost approximately $2.8 million and is expected to be completed by the end of the first quarter of 2013. The $2,483,546 initial PIP Reserve deposit represents the remaining cost of the PIP. |
| (2) | The lender may adjust the Seasonality Reserve Cap annually, provided such cap does not exceed $200,000. Monthly deposits are required each calendar month other than January and February, provided that the lender may adjust or waive altogether the Seasonality Reserve and the monthly deposits required to be made therein and disburse any excess to the borrower at anytime following the completion of the PIP which commenced on the closing of the loan. |
The Doubletree Asheville mortgage loan is evidenced by a single promissory note that is secured by a first mortgage encumbering a full service hotel containing a total of 197 rooms located in Asheville, North Carolina (the “Doubletree Asheville Property”). Located adjacent to the Biltmore Estate, the Doubletree Asheville Property was built in 1989, originally with 160 rooms, and, in 2008, was expanded by 37 rooms in a concierge tower. The five-story Doubletree Asheville Property amenities include an indoor swimming pool and whirlpool, an exercise room and 7,290 square feet of meeting and group space. All guestrooms include a dresser with a 38-inch flat-panel television, an armchair, a work desk and chair, a coffeemaker and high-speed internet access. Suites comprise two rooms, with additional amenities such as a second television in the living area and additional seating. The Doubletree Asheville Property is located approximately nine miles to the north of the Asheville Regional Airport. Asheville, North Carolina is a tourist destination that, according to the appraisal, has over three million overnight leisure visitors each year that have an economic impact of more than $2.0 billion annually. The Doubletree Asheville Property’s franchise agreement expires in October 2016 and will be extended by 10 years upon the completion of the PIP.
THE INFORMATION IN THIS STRUCTURAL AND COLLATERAL TERM SHEET IS NOT COMPLETE AND MAY BE AMENDED PRIOR TO THE TIME OF SALE. THIS TERM SHEET IS NOT AN OFFER TO SELL THESE SECURITIES AND IT IS NOT A SOLICITATION OF AN OFFER TO BUY THESE SECURITIES IN ANY JURISDICTION WHERE THE OFFER OR SALE IS NOT PERMITTED.
110
DOUBLETREE ASHEVILLE
Sources and Uses
Sources | Uses | |||||||||||||||||
Original loan amount | $ | 20,900,000 | 99.1 | % | Loan payoff | $ | 17,523,540 | 83.1 | % | |||||||||
Sponsor’s new cash contribution | 186,859 | 0.9 | Closing costs | 820,842 | 3.9 | |||||||||||||
Reserves | 2,742,477 | 13.0 | ||||||||||||||||
|
|
|
|
|
|
|
| |||||||||||
Total Sources | $ | 21,086,859 | 100.0 | % | Total Uses | $ | 21,086,859 | 100.0 | % | |||||||||
|
|
|
|
|
|
|
| |||||||||||
Operating History and Underwritten Net Cash Flow:The following table presents certain information relating to the historical operating performance and the Underwritten Net Cash Flow at the Doubletree Asheville Property:
Cash Flow Analysis
| 2010 | 2011 | TTM 9/30/2012 | U/W | U/W $ per Room | ||||||||||||||||
Occupancy | 66.9 | % | 70.0 | % | 74.8 | % | 74.8 | % | ||||||||||||
ADR | $ | 118.53 | $ | 120.38 | $ | 123.84 | $ | 123.84 | ||||||||||||
RevPAR | $ | 79.30 | $ | 84.27 | $ | 92.63 | $ | 92.63 | ||||||||||||
Total Revenue | $ | 6,735,578 | $ | 7,044,918 | $ | 7,736,005 | $ | 7,714,369 | $ | 39,159 | ||||||||||
Total Department Expenses | 2,405,100 | 2,292,958 | 2,525,129 | 2,518,227 | 12,783 | |||||||||||||||
|
|
|
|
|
|
|
|
|
| |||||||||||
Gross Operating Profit | $ | 4,330,478 | $ | 4,751,960 | $ | 5,210,876 | $ | 5,196,142 | $ | 26,376 | ||||||||||
Total Undistributed Expenses | 2,025,528 | 2,181,678 | 2,249,262 | 2,243,228 | 11,387 | |||||||||||||||
|
|
|
|
|
|
|
|
|
| |||||||||||
Profit Before Fixed Charges | $ | 2,304,950 | $ | 2,570,282 | $ | 2,961,614 | $ | 2,952,914 | $ | 14,989 | ||||||||||
Total Fixed Charges | 200,515 | 197,423 | 194,260 | 213,234 | 1,082 | |||||||||||||||
|
|
|
|
|
|
|
|
|
| |||||||||||
Net Operating Income | $ | 2,104,435 | $ | 2,372,859 | $ | 2,767,354 | $ | 2,739,680 | $ | 13,907 | ||||||||||
FF&E | 0 | 0 | 0 | 308,575 | 1,566 | |||||||||||||||
|
|
|
|
|
|
|
|
|
| |||||||||||
Net Cash Flow | $ | 2,104,435 | $ | 2,372,859 | $ | 2,767,354 | $ | 2,431,105 | $ | 12,341 | ||||||||||
NOI DSCR | 1.51x | 1.70x | 1.98x | 1.96x | ||||||||||||||||
NCF DSCR | 1.51x | 1.70x | 1.98x | 1.74x | ||||||||||||||||
NOI DY | 10.1 | % | 11.4 | % | 13.2 | % | 13.2 | % | ||||||||||||
NCF DY | 10.1 | % | 11.4 | % | 13.2 | % | 11.7 | % | ||||||||||||
The following table presents certain information relating the historical performance of the Doubletree Asheville Property’s competitive set:
Subject and Market Historical Occupancy, ADR and RevPAR(1)
| Competitive Set | Doubletree Asheville | Penetration Factor | ||||||||||||||||||||||||||||||||||
Year | Occupancy | ADR | RevPAR | Occupancy | ADR | RevPAR | Occupancy | ADR | RevPAR | |||||||||||||||||||||||||||
9/30/2012 TTM | 66.6 | % | $ | 118.83 | $ | 79.13 | 75.0 | % | $ | 123.50 | $ | 92.64 | 112.6 | % | 103.9 | % | 117.1 | % | ||||||||||||||||||
9/30/2011 TTM | 65.1 | % | $ | 112.29 | $ | 73.06 | 68.5 | % | $ | 119.08 | $ | 81.58 | 105.3 | % | 106.1 | % | 111.7 | % | ||||||||||||||||||
9/30/2010 TTM | 62.2 | % | $ | 109.22 | $ | 67.89 | 66.6 | % | $ | 118.89 | $ | 79.14 | 107.1 | % | 108.9 | % | 116.6 | % | ||||||||||||||||||
| (1) | Data provided by a third party hospitality market research report dated October 18, 2012. |
THE INFORMATION IN THIS STRUCTURAL AND COLLATERAL TERM SHEET IS NOT COMPLETE AND MAY BE AMENDED PRIOR TO THE TIME OF SALE. THIS TERM SHEET IS NOT AN OFFER TO SELL THESE SECURITIES AND IT IS NOT A SOLICITATION OF AN OFFER TO BUY THESE SECURITIES IN ANY JURISDICTION WHERE THE OFFER OR SALE IS NOT PERMITTED.
111
No. 13 - Midland Odessa Self Storage Portfolio
| Loan Information | ||
| Mortgage Loan Seller: | Wells Fargo Bank, National Association | |
| Credit Assessment (Fitch/KBRA/S&P): | NR/NR/NR | |
| Original Principal Balance: | $19,500,000 | |
| Cut-off Date Principal Balance: | $19,500,000 | |
| % of Initial Pool Balance: | 1.4% | |
| Loan Purpose: | Acquisition | |
| Borrower Name: | Odessa Storage 17 (TX) LLC | |
| Sponsor: | Corporate Property Associates 17 | |
| Global Incorporated | ||
| Mortgage Rate: | 4.240% | |
| Note Date: | December 12, 2012 | |
| Anticipated Repayment Date: | NAP | |
| Maturity Date: | January 1, 2023 | |
| IO Period: | 60 months | |
| Loan Term (Original): | 120 months | |
| Seasoning: | 1 month | |
| Amortization Term (Original): | 360 months | |
| Loan Amortization Type: | Interest-only, Amortizing Balloon | |
| Interest Accrual Method: | Actual/360 | |
| Call Protection: | L(25),D(91),O(4) | |
| Lockbox Type: | Hard/Springing Cash Management | |
| Additional Debt: | None | |
| Additional Debt Type: | NAP | |
Escrows and Reserves:
Type: | Initial | Monthly | Cap (If Any) | |||||||||
Taxes(1) | $ | 0 | Springing | NAP | ||||||||
Insurance(2) | $ | 0 | Springing | NAP | ||||||||
Replacement Reserves(3) | $ | 0 | Springing | NAP | ||||||||
| Property Information | ||
| Single Asset/Portfolio: | Portfolio | |
| Property Type: | Self Storage | |
| Specific Property Type: | Self Storage | |
| Location: | Various – See Table Below | |
| Size: | 361,940 SF | |
Cut-off Date Principal Balance Per Unit/SF: | $53.88 | |
| Year Built/Renovated: | Various – See Table Below | |
| Title Vesting: | Fee | |
| Property Manager: | CubeSmart Asset Management, LLC | |
| 3rd Most Recent Occupancy (As of): | 65.7% (12/31/2009) | |
| 2nd Most Recent Occupancy (As of): | 68.0% (12/31/2010) | |
| Most Recent Occupancy (As of): | 78.1% (12/31/2011) | |
| Current Occupancy (As of): | 89.6% (11/27/2012) | |
| Underwriting and Financial Information: | ||
| 3rdMost Recent NOI (As of): | $1,519,562 (12/31/2010) | |
| 2ndMost Recent NOI (As of): | $1,966,769 (12/31/2011) | |
| Most Recent NOI (As of): | $2,314,196 (TTM 9/30/2012) | |
| U/W Revenues: | $3,499,349 | |
| U/W Expenses: | $1,275,650 | |
| U/W NOI: | $2,223,699 | |
| U/W NCF: | $2,169,408 | |
| U/W NOI DSCR : | 1.93x | |
| U/W NCF DSCR: | 1.89x | |
| U/W NOI Debt Yield: | 11.4% | |
| U/W NCF Debt Yield: | 11.1% | |
| As-Is Appraised Value: | $32,950,000 | |
| As-Is Appraisal Valuation Date: | October 23, 2012 | |
| Cut-off Date LTV Ratio: | 59.2% | |
| LTV Ratio at Maturity or ARD: | 53.9% | |
| (1) | Monthly tax escrows are not required as long as no event of default has occurred and is continuing and the borrower provides satisfactory evidence that taxes have been paid. |
| (2) | Monthly insurance escrows are not required as long as no event of default has occurred and is continuing and the borrower provides satisfactory evidence that the Midland Odessa Self Storage Portfolio is insured in accordance with the loan documents. |
| (3) | Upon the occurrence of an event of default, the borrower is required to commence monthly deposits of $4,524 into the Replacement Reserves escrow. After a cure of such event of default, the lender is required to disburse the Replacement Reserve funds to the borrower to be used for capital expenditures. |
The Midland Odessa Self Storage Portfolio mortgage loan is evidenced by a single promissory note encumbering four self storage properties totaling 361,940 rentable square feet located in Midland and Odessa, Texas (the “Midland Odessa Self Storage Portfolio Properties”). As of November 27, 2012, the weighted average occupancy of the Midland Odessa Self Storage Portfolio Properties was 89.6%. The Midland Odessa Self Storage Portfolio Properties were built between 2004 and 2008 and feature security cameras, electronically controlled entry gates and exterior security lighting.
Sources and Uses
Sources | Uses | |||||||||||||||||
Original loan amount | $ | 19,500,000 | 58.6 | % | Purchase price | $ | 32,600,000 | 98.0 | % | |||||||||
Sponsor’s new cash contribution | 13,770,748 | 41.4 | Closing costs | 670,748 | 2.0 | |||||||||||||
|
|
|
|
|
|
|
| |||||||||||
Total Sources | $ | 33,270,748 | 100.0 | % | Total Uses | $ | 33,270,748 | 100.0 | % | |||||||||
|
|
|
|
|
|
|
| |||||||||||
THE INFORMATION IN THIS STRUCTURAL AND COLLATERAL TERM SHEET IS NOT COMPLETE AND MAY BE AMENDED PRIOR TO THE TIME OF SALE. THIS TERM SHEET IS NOT AN OFFER TO SELL THESE SECURITIES AND IT IS NOT A SOLICITATION OF AN OFFER TO BUY THESE SECURITIES IN ANY JURISDICTION WHERE THE OFFER OR SALE IS NOT PERMITTED.
112
MIDLAND ODESSA SELF STORAGE PORTFOLIO
The following table presents certain information relating to the Midland Odessa Self Storage Portfolio Properties:
Property Name - Location | Allocated Cut- off Date Principal Balance | % of Portfolio Cut-off Date Principal Balance | Current Occupancy | Number of Units | Year Built/ Renovated | Net Rentable Area (SF) | Appraised Value | |||||||||||||||||||
Loop 250 - Midland, TX | $ | 5,830,000 | 29.9 | % | 95.5 | % | 680 | 2004/NAP | 102,275 | $ | 9,800,000 | |||||||||||||||
Grandview - Odessa, TX | $ | 5,400,000 | 27.7 | % | 96.3 | % | 669 | 2006/NAP | 88,990 | $ | 8,400,000 | |||||||||||||||
Midkiff - Midland, TX | $ | 4,300,000 | 22.1 | % | 73.6 | % | 679 | 2008/NAP | 104,455 | $ | 8,300,000 | |||||||||||||||
West County Road - Odessa, TX | $ | 3,970,000 | 20.4 | % | 96.6 | % | 513 | 2006/NAP | 66,220 | $ | 6,450,000 | |||||||||||||||
|
|
|
|
|
|
|
|
|
|
|
| |||||||||||||||
Total/Weighted Average | $ | 19,500,000 | 100.0 | % | 89.6 | % | 2,541 | 361,940 | $ | 32,950,000 | ||||||||||||||||
|
|
|
|
|
|
|
|
|
|
|
| |||||||||||||||
The following table presents information relating to the historical occupancy for the Midland Odessa Self Storage Portfolio Properties:
Historical Occupancy(1)
12/31/2009 | 12/31/2010 | 12/31/2011 | ||
66% | 68% | 78% |
| (1) | Information obtained from the borrower. |
Operating History and Underwritten Net Cash Flow. The following table presents certain information relating to the historical operating performance and the Underwritten Net Cash Flow at the Midland Odessa Self Storage Portfolio Properties:
Cash Flow Analysis
| 2010 | 2011 | TTM 9/31/2012 | U/W | U/W $ per SF | ||||||||||||||||
Base Rent | $ | 2,697,262 | $ | 3,147,263 | $ | 3,621,795 | $ | 3,436,409 | $ | 9.49 | ||||||||||
Grossed Up Vacant Space | 0 | 0 | 0 | 643,975 | 1.78 | |||||||||||||||
Concessions | 0 | 0 | 0 | 0 | 0.00 | |||||||||||||||
Other Income | 48,012 | 52,912 | 62,940 | 62,940 | 0.17 | |||||||||||||||
Less Vacancy & Credit Loss | 0 | 0 | 0 | (643,975 | )(1) | (1.78 | ) | |||||||||||||
|
|
|
|
|
|
|
|
|
| |||||||||||
Effective Gross Income | $ | 2,745,274 | $ | 3,200,175 | $ | 3,684,735 | $ | 3,499,349 | $ | 9.67 | ||||||||||
Total Operating Expenses | $ | 1,225,712 | $ | 1,233,406 | $ | 1,370,539 | $ | 1,275,650 | $ | 3.52 | ||||||||||
|
|
|
|
|
|
|
|
|
| |||||||||||
Net Operating Income | $ | 1,519,562 | $ | 1,966,769 | $ | 2,314,196 | $ | 2,223,699 | $ | 6.14 | ||||||||||
Replacement Reserves | 0 | 0 | 0 | 54,291 | 0.15 | |||||||||||||||
|
|
|
|
|
|
|
|
|
| |||||||||||
Net Cash Flow | $ | 1,519,562 | $ | 1,966,769 | $ | 2,314,196 | $ | 2,169,408 | $ | 5.99 | ||||||||||
NOI DSCR | 1.32x | 1.71x | 2.01x | 1.93x | ||||||||||||||||
NCF DSCR | 1.32x | 1.71x | 2.01x | 1.89x | ||||||||||||||||
NOI DY | 7.8 | % | 10.1 | % | 11.9 | % | 11.4 | % | ||||||||||||
NCF DY | 7.8 | % | 10.1 | % | 11.9 | % | 11.1 | % | ||||||||||||
| (1) | The underwritten economic vacancy is 17.3%. The Midland Odessa Self Storage Portfolio Properties were 89.6% physically occupied as of November 27, 2012. |
THE INFORMATION IN THIS STRUCTURAL AND COLLATERAL TERM SHEET IS NOT COMPLETE AND MAY BE AMENDED PRIOR TO THE TIME OF SALE. THIS TERM SHEET IS NOT AN OFFER TO SELL THESE SECURITIES AND IT IS NOT A SOLICITATION OF AN OFFER TO BUY THESE SECURITIES IN ANY JURISDICTION WHERE THE OFFER OR SALE IS NOT PERMITTED.
113
No. 14 - Community Corporate Center
| Loan Information | ||
| Mortgage Loan Seller: | Liberty Island Group I LLC | |
Credit Assessment (Fitch/KBRA/S&P): | NR/NR/NR | |
| Original Principal Balance: | $15,600,000 | |
| Cut-off Date Principal Balance: | $15,580,521 | |
| % of Initial Pool Balance: | 1.1% | |
| Loan Purpose: | Acquisition | |
| Borrower Name: | 445 Hutchinson LP | |
| Sponsor: | Raymond Massa, Thomas Marmaros, Maher Cherfan | |
| Mortgage Rate: | 4.290% | |
| Note Date: | December 7, 2012 | |
| Anticipated Repayment Date: | NAP | |
| Maturity Date: | January 1, 2023 | |
| IO Period: | None | |
| Loan Term (Original): | 120 months | |
| Seasoning: | 1 month | |
| Amortization Term (Original): | 360 months | |
| Loan Amortization Type: | Amortizing Balloon | |
| Interest Accrual Method: | Actual/360 | |
| Call Protection: | L(25),D(91),O(4) | |
| Lockbox Type: | Hard/Springing Cash Management | |
| Additional Debt: | None | |
| Additional Debt Type: | NAP | |
Escrows and Reserves:
Type: | Initial | Monthly | Cap (If Any) | |||||||||
Taxes | $ | 458,693 | $ | 65,528 | NAP | |||||||
Insurance | $ | 48,908 | $ | 4,446 | NAP | |||||||
Replacement Reserves | $ | 6,032 | $ | 6,032 | NAP | |||||||
TI/LC | $ | 134,000 | $ | 34,000 | $ | 500,000 | ||||||
Deferred Maintenance Reserve | $ | 129,219 | NAP | NAP | ||||||||
| Property Information | ||
| Single Asset/Portfolio: | Single Asset | |
| Property Type: | Office | |
| Specific Property Type: | Suburban | |
| Location: | Columbus, OH | |
| Size: | 255,371 SF | |
Cut-off Date Principal Balance Per Unit/SF: | $61.01 | |
| Year Built/Renovated: | 1988/2008 | |
| Title Vesting: | Fee | |
| Property Manager: | 445 Hutchinson Management LLC | |
| 3rd Most Recent Occupancy (As of): | 75.4% (12/31/2009) | |
| 2nd Most Recent Occupancy (As of): | 69.3% (12/31/2010) | |
| Most Recent Occupancy (As of): | 83.0% (12/31/2011) | |
| Current Occupancy (As of): | 86.3% (10/29/2012) | |
| Underwriting and Financial Information: | ||
| 3rdMost Recent NOI (As of): | $580,614 (12/31/2010) | |
| 2ndMost Recent NOI (As of): | $1,519,440 (12/31/2011) | |
| Most Recent NOI (As of): | $1,501,407 (TTM 8/31/2012) | |
| U/W Revenues: | $4,424,975 | |
| U/W Expenses: | $2,548,346 | |
| U/W NOI: | $1,876,629 | |
| U/W NCF: | $1,446,170 | |
| U/W NOI DSCR: | 2.03x | |
| U/W NCF DSCR: | 1.56x | |
| U/W NOI Debt Yield: | 12.0% | |
| U/W NCF Debt Yield: | 9.3% | |
| As-Is Appraised Value: | $20,800,000 | |
| As-Is Appraisal Valuation Date: | October 16, 2012 | |
| Cut-off Date LTV Ratio: | 74.9% | |
| LTV Ratio at Maturity or ARD: | 60.2% | |
The Community Corporate Center mortgage loan is evidenced by a single promissory note that is secured by a first mortgage encumbering a suburban office building in Columbus, Ohio (the “Community Corporate Center Property”). The Community Corporate Center Property contains 255,371 rentable square feet. The Community Corporate Center Property, located approximately ten miles south of the Columbus central business district, was built in 1988, renovated in 2008 and is situated on a 7.9-acre parcel along Interstate 270 and Hutchinson Avenue. The building is L-shaped, with two wings that spur off of the central core and features a three-story atrium in the interior corner of the bend. Additionally, the building includes an accent striped red granite exterior and a central stone water feature in the atrium. Parking is provided by subterranean parking area as well as additional parking spaces surrounding the building, which account for 787 total spaces and a parking ratio of 3.1 spaces per 1,000 square feet of rentable area. As of October 29, 2012, the Community Corporate Center Property was 86.3% leased to 25 tenants.
THE INFORMATION IN THIS STRUCTURAL AND COLLATERAL TERM SHEET IS NOT COMPLETE AND MAY BE AMENDED PRIOR TO THE TIME OF SALE. THIS TERM SHEET IS NOT AN OFFER TO SELL THESE SECURITIES AND IT IS NOT A SOLICITATION OF AN OFFER TO BUY THESE SECURITIES IN ANY JURISDICTION WHERE THE OFFER OR SALE IS NOT PERMITTED.
114
COMMUNITY CORPORATE CENTER
Sources and Uses
Sources | Uses | |||||||||||||||||
Original loan amount | $ | 15,600,000 | 71.9 | % | Purchase price | $ | 20,550,000 | 94.7 | % | |||||||||
Sponsor’s new cash contribution | 6,107,087 | 28.1 | Closing costs | 776,852 | 3.6 | |||||||||||||
| Upfront Reserves | 380,235 | 1.8 | ||||||||||||||||
|
|
|
|
|
|
|
| |||||||||||
Total Sources | $ | 21,707,087 | 100.0 | % | Total Uses | $ | 21,707,087 | 100.0 | % | |||||||||
|
|
|
|
|
|
|
| |||||||||||
The following table presents certain information relating to the tenancies at the Community Corporate Center Property:
Major Tenants
Tenant Name | Credit Rating | Tenant NRSF | % of NRSF | Annual U/W Base Rent PSF | Annual U/W Base Rent | % of Total Annual U/W Base Rent | Lease Expiration Date | |||||||||||||||||||
Major Tenants | ||||||||||||||||||||||||||
Pearson Education, Inc. | NR/NR/NR | 42,787 | 16.8 | % | $ | 12.00 | $ | 513,444 | 21.3 | % | 12/31/2016 | |||||||||||||||
Equity Inc. | NR/NR/NR | 23,126 | 9.1 | % | $ | 12.57 | $ | 290,612 | 12.1 | % | 1/31/2015 | |||||||||||||||
Kinder Morgan Bulk Terminal, Inc. | NR/NR/NR | 24,250 | 9.5 | % | $ | 9.48 | $ | 229,798 | 9.6 | % | 1/31/2021 | |||||||||||||||
Provident Insurance Co.(1) | NR/NR/NR | 13,427 | 5.3 | % | $ | 10.00 | $ | 134,270 | 5.6 | % | 8/31/2015 | |||||||||||||||
Amerassist Holding Company, Ltd. | NR/NR/NR | 13,621 | 5.3 | % | $ | 9.75 | $ | 132,805 | 5.5 | % | 3/31/2015 | |||||||||||||||
|
|
|
|
|
|
|
| |||||||||||||||||||
Total Major Tenants | 117,211 | 45.9 | % | $ | 11.10 | $ | 1,300,930 | 54.1 | % | |||||||||||||||||
Non-Major Tenants | 103,118 | 40.4 | % | $ | 10.71 | $ | 1,104,307 | 45.9 | % | |||||||||||||||||
|
|
|
|
|
|
|
| |||||||||||||||||||
Occupied Collateral Total | 220,329 | 86.3 | % | $ | 10.92 | $ | 2,405,237 | 100.0 | % | |||||||||||||||||
|
|
|
| |||||||||||||||||||||||
Vacant Space | 35,042 | 13.7 | % | |||||||||||||||||||||||
|
|
|
| |||||||||||||||||||||||
Collateral Total | 255,371 | 100.0 | % | |||||||||||||||||||||||
|
|
|
| |||||||||||||||||||||||
| (1) | The full name of the tenant is Provident Life and Accident Insurance Company, a Tennessee Corporation. |
THE INFORMATION IN THIS STRUCTURAL AND COLLATERAL TERM SHEET IS NOT COMPLETE AND MAY BE AMENDED PRIOR TO THE TIME OF SALE. THIS TERM SHEET IS NOT AN OFFER TO SELL THESE SECURITIES AND IT IS NOT A SOLICITATION OF AN OFFER TO BUY THESE SECURITIES IN ANY JURISDICTION WHERE THE OFFER OR SALE IS NOT PERMITTED.
115
COMMUNITY CORPORATE CENTER
The following table presents certain information relating to the lease rollover schedule at the Community Corporate Center Property:
Lease Expiration Schedule(1)(2)
| No. of | Cumulative | Cumulative | Annual U/W | |||||||||||||||||||||||
| Year Ending | Leases | Expiring | % of Total | Expiring | % of Total | Annual U/W | Base Rent | |||||||||||||||||||
December 31, | Expiring | NRSF | NRSF | NRSF | NRSF | Base Rent | PSF(3) | |||||||||||||||||||
MTM(4) | 2 | 2,138 | 0.8 | % | 2,138 | 0.8 | % | $ | 0 | $ | 0.00 | |||||||||||||||
2013 | 3 | 21,304 | 8.3 | % | 23,442 | 9.2 | % | $ | 241,286 | $ | 11.33 | |||||||||||||||
2014 | 4 | 21,050 | 8.2 | % | 44,492 | 17.4 | % | $ | 251,968 | $ | 11.97 | |||||||||||||||
2015 | 7 | 63,402 | 24.8 | % | 107,894 | 42.2 | % | $ | 689,250 | $ | 10.87 | |||||||||||||||
2016 | 5 | 61,562 | 24.1 | % | 169,456 | 66.4 | % | $ | 711,254 | $ | 11.55 | |||||||||||||||
2017 | 0 | 0 | 0.0 | % | 169,456 | 66.4 | % | $ | 0 | $ | 0.00 | |||||||||||||||
2018 | 1 | 9,940 | 3.9 | % | 179,396 | 70.2 | % | $ | 89,460 | $ | 9.00 | |||||||||||||||
2019 | 1 | 10,156 | 4.0 | % | 189,552 | 74.2 | % | $ | 126,950 | $ | 12.50 | |||||||||||||||
2020 | 0 | 0 | 0.0 | % | 189,552 | 74.2 | % | $ | 0 | $ | 0.00 | |||||||||||||||
2021 | 2 | 30,777 | 12.1 | % | 220,329 | 86.3 | % | $ | 295,068 | $ | 9.59 | |||||||||||||||
2022 | 0 | 0 | 0.0 | % | 220,329 | 86.3 | % | $ | 0 | $ | 0.00 | |||||||||||||||
2023 | 0 | 0 | 0.0 | % | 220,329 | 86.3 | % | $ | 0 | $ | 0.00 | |||||||||||||||
Thereafter | 0 | 0 | 0.0 | % | 220,329 | 86.3 | % | $ | 0 | $ | 0.00 | |||||||||||||||
Vacant | 0 | 35,042 | 13.7 | % | 255,371 | 100.0 | % | $ | 0 | $ | 0.00 | |||||||||||||||
|
|
|
|
|
|
|
|
| ||||||||||||||||||
Total/Weighted Average | 25 | 255,371 | 100.0 | % | $ | 2,405,237 | $ | 10.92 | ||||||||||||||||||
|
|
|
|
|
|
|
|
| ||||||||||||||||||
| (1) | Information obtained from the underwritten rent roll. |
| (2) | Certain tenants may have lease termination options that are exercisable prior to the stated expiration date of the subject lease and that are not considered in the Lease Expiration Schedule. |
| (3) | Annual U/W Base Rent PSF excludes vacant space. |
| (4) | MTM tenants include conference/training room and management office, consisting of 1,364 square feet and 774 square feet respectively. They are considered in occupancy but no income was underwritten. |
The following table presents historical occupancy percentages at the Community Corporate Center Property:
Historical Occupancy(1)
12/31/2009 | 12/31/2010 | 12/31/2011 | ||
75% | 69% | 83% |
| (1) | Information obtained from the borrower. |
Operating History and Underwritten Net Cash Flow.The following table presents certain information relating to the historical operating performance and the Underwritten Net Cash Flow at the Community Corporate Center Property:
Cash Flow Analysis
| 2010 | 2011 | TTM 8/31/2012 | U/W | U/W $ per SF | ||||||||||||||||
Base Rent | $ | 1,580,009 | $ | 1,883,473 | $ | 1,960,817 | $ | 2,405,237 | $ | 9.42 | ||||||||||
Grossed Up Vacant Space | 0 | 0 | 0 | 375,650 | 1.47 | |||||||||||||||
Parking | 2,922 | 2,200 | 1,400 | 1,400 | 0.01 | |||||||||||||||
Total Reimbursables | 866,402 | 1,691,219 | 1,902,883 | 2,114,652 | 8.28 | |||||||||||||||
Other Income | 39,968 | 52,995 | 60,416 | 42,500 | 0.17 | |||||||||||||||
Less Vacancy & Credit Loss | 0 | 0 | 0 | (514,464 | )(1) | (2.01 | ) | |||||||||||||
|
|
|
|
|
|
|
|
|
| |||||||||||
Effective Gross Income | $ | 2,489,301 | $ | 3,629,887 | $ | 3,925,516 | $ | 4,424,975 | $ | 17.33 | ||||||||||
Total Operating Expenses | $ | 1,908,687 | $ | 2,110,447 | $ | 2,424,109 | $ | 2,548,346 | $ | 9.98 | ||||||||||
|
|
|
|
|
|
|
|
|
| |||||||||||
Net Operating Income | $ | 580,614 | $ | 1,519,440 | $ | 1,501,407 | $ | 1,876,629 | $ | 7.35 | ||||||||||
TI/LC | 0 | 0 | 0 | 358,072 | 1.40 | |||||||||||||||
Capital Expenditures | 0 | 0 | 0 | 72,387 | 0.28 | |||||||||||||||
|
|
|
|
|
|
|
|
|
| |||||||||||
Net Cash Flow | $ | 580,614 | $ | 1,519,440 | $ | 1,501,407 | $ | 1,446,170 | $ | 5.66 | ||||||||||
NOI DSCR | 0.63 | x | 1.64 | x | 1.62 | x | 2.03 | x | ||||||||||||
NCF DSCR | 0.63 | x | 1.64 | x | 1.62 | x | 1.56 | x | ||||||||||||
NOI DY | 3.7 | % | 9.8 | % | 9.6 | % | 12.0 | % | ||||||||||||
NCF DY | 3.7 | % | 9.8 | % | 9.6 | % | 9.3 | % | ||||||||||||
| (1) | The underwritten economic vacancy is 18.5%. The Community Corporate Center Property was 86.3% physically occupied as of October 29, 2012. |
THE INFORMATION IN THIS STRUCTURAL AND COLLATERAL TERM SHEET IS NOT COMPLETE AND MAY BE AMENDED PRIOR TO THE TIME OF SALE. THIS TERM SHEET IS NOT AN OFFER TO SELL THESE SECURITIES AND IT IS NOT A SOLICITATION OF AN OFFER TO BUY THESE SECURITIES IN ANY JURISDICTION WHERE THE OFFER OR SALE IS NOT PERMITTED.
116
[THIS PAGE INTENTIONALLY LEFT BLANK.]
117
No. 15 - Rivercrest Realty Portfolio
| Loan Information | ||
| Mortgage Loan Seller: | Wells Fargo Bank, National Association | |
Credit Assessment (Fitch/KBRA/S&P): | NR/NR/NR | |
| Original Principal Balance: | $15,030,000 | |
| Cut-off Date Principal Balance: | $15,030,000 | |
| % of Initial Pool Balance: | 1.0% | |
| Loan Purpose: | Refinance | |
| Borrower Name(1): | Various | |
| Sponsors: | Jonathan Gaines; Stanley Werb | |
| Mortgage Rate: | 4.160% | |
| Note Date: | December 20, 2012 | |
| Anticipated Repayment Date: | NAP | |
| Maturity Date: | January 1, 2023 | |
| IO Period: | 18 months | |
| Loan Term (Original): | 120 months | |
| Seasoning: | 1 month | |
| Amortization Term (Original): | 360 months | |
| Loan Amortization Type: | Interest-only, Amortizing Balloon | |
| Interest Accrual Method: | Actual/360 | |
| Call Protection: | L(25),D(91),O(4) | |
| Lockbox Type: | Hard/Springing Cash Management | |
| Additional Debt: | None | |
| Additional Debt Type: | NAP | |
| Escrows and Reserves: | ||||||||||||
Type: | Initial | Monthly | Cap (If Any) | |||||||||
Taxes | $ | 16,058 | $ | 16,065 | NAP | |||||||
Insurance(2) | $ | 0 | Springing | NAP | ||||||||
Replacement Reserves | $ | 0 | $ | 4,523 | NAP | |||||||
TI/LC | $ | 200,000 | $ | 9,530 | $ | 500,000 | ||||||
Dollar Tree Reserve(3) | $ | 107,241 | $ | 0 | NAP | |||||||
| Property Information | ||
| Single Asset/Portfolio: | Portfolio | |
| Property Type: | Retail | |
| Specific Property Type: | Shadow Anchored | |
| Location: | Various – See Table | |
| Size: | 152,473 SF | |
| Cut-off Date Principal Balance Per Unit/SF: | $98.57 | |
| Year Built/Renovated: | Various – See Table | |
| Title Vesting: | Fee | |
| Property Manager: | Rivercrest Realty Associates, LLC | |
| 3rdMost Recent Occupancy (As of): | 91.7% (12/31/2009) | |
| 2ndMost Recent Occupancy (As of): | 93.7% (12/31/2010) | |
| Most Recent Occupancy (As of): | 94.2% (12/31/2011) | |
| Current Occupancy (As of): | 96.6% (10/11/2012) | |
| Underwriting and Financial Information: | ||
| 3rdMost Recent NOI (As of): | $1,601,260 (12/31/2010) | |
| 2ndMost Recent NOI (As of): | $1,565,072 (12/31/2011) | |
| Most Recent NOI (As of): | $1,563,359 (TTM 9/30/2012) | |
| U/W Revenues: | $2,041,636 | |
| U/W Expenses: | $490,037 | |
| U/W NOI: | $1,551,600 | |
| U/W NCF: | $1,415,724 | |
| U/W NOI DSCR: | 1.77x | |
| U/W NCF DSCR: | 1.61x | |
| U/W NOI Debt Yield: | 10.3% | |
| U/W NCF Debt Yield: | 9.4% | |
| As-Is Appraised Value: | $20,040,000 | |
| As-Is Appraisal Valuation Date(4): | Various | |
| Cut-off Date LTV Ratio: | 75.0% | |
| LTV Ratio at Maturity or ARD: | 62.6% | |
| (1) | The borrower is comprised of five separate limited liability companies. |
| (2) | Monthly insurance escrows are waived as long as no event of default has occurred and is continuing and the borrower provides satisfactory evidence that the Rivercrest Realty Portfolio Properties are insured in accordance with the loan documents. |
| (3) | The Dollar Tree Reserve represents the remaining 15 months of free rent at the Boiling Springs Centre property. |
| (4) | The As-Is Appraisal Valuation Dates range from October 21, 2012 to November 8, 2012. |
The Rivercrest Realty Portfolio mortgage loan is evidenced by a single promissory note that is secured by a first mortgage encumbering five shadow anchored retail properties located in South Carolina, Virginia and North Carolina (the “Rivercrest Realty Portfolio Properties”). The Rivercrest Realty Portfolio Properties contain 152,473 square feet, were built between 1999 and 2000 and each property is shadow anchored by Wal-Mart Supercenters. As of October 11, 2012, the Rivercrest Realty Portfolio Properties were 96.6% occupied.
Sources and Uses
Sources | Uses | |||||||||||||||||
Original loan amount | $ | 15,030,000 | 100.0 | % | Loan payoff(1) | $ | 11,207,613 | 74.6 | % | |||||||||
| Reserves | 323,299 | 2.2 | ||||||||||||||||
| Closing costs | 334,960 | 2.2 | ||||||||||||||||
| Return of equity | 3,164,128 | 21.1 | ||||||||||||||||
|
|
|
|
|
|
|
| |||||||||||
Total Sources | $ | 15,030,000 | 100.0 | % | Total Uses | $ | 15,030,000 | 100.0 | % | |||||||||
|
|
|
|
|
|
|
| |||||||||||
| (1) | The Rivercrest Realty Portfolio Properties were previously securitized in the following transactions: Piedmont Plaza, Peppers Ferry Centre and Garber’s Crossing – CSFB 2001-CK1; Tidewater Plaza – CSFB 2001-CF2; and Boiling Springs Centre – FUBOA 2001-C1. |
THE INFORMATION IN THIS STRUCTURAL AND COLLATERAL TERM SHEET IS NOT COMPLETE AND MAY BE AMENDED PRIOR TO THE TIME OF SALE. THIS TERM SHEET IS NOT AN OFFER TO SELL THESE SECURITIES AND IT IS NOT A SOLICITATION OF AN OFFER TO BUY THESE SECURITIES IN ANY JURISDICTION WHERE THE OFFER OR SALE IS NOT PERMITTED.
118
RIVERCREST REALTY PORTFOLIO
The following table presents certain information relating to the Rivercrest Realty Portfolio Properties:
| % of | ||||||||||||||||||||||||
| Allocated | Portfolio Cut- | |||||||||||||||||||||||
| Cut-off Date | off Date | |||||||||||||||||||||||
| Principal | Principal | Current | Year Built/ | Net Rentable | Appraised | |||||||||||||||||||
Property Name – Location | Balance | Balance | Occupancy | Renovated | Area (SF) | Value | ||||||||||||||||||
Piedmont Plaza – Gaffney, SC | $ | 3,006,000 | 20.0 | % | 100.0 | % | 2000/NAP | 33,066 | $ | 4,250,000 | ||||||||||||||
Peppers Ferry Centre – Radford, VA | $ | 3,006,000 | 20.0 | % | 100.0 | % | 1999/NAP | 30,108 | $ | 4,100,000 | ||||||||||||||
Tidewater Plaza – Southport, NC | $ | 3,006,000 | 20.0 | % | 89.4 | % | 2000/NAP | 30,208 | $ | 4,040,000 | ||||||||||||||
Boiling Springs Centre – Boiling Springs, SC | $ | 3,006,000 | 20.0 | % | 93.3 | % | 1999/NAP | 29,983 | $ | 3,850,000 | ||||||||||||||
Garber’s Crossing – Harrisonburg, VA | $ | 3,006,000 | 20.0 | % | 100.0 | % | 1999/NAP | 29,108 | $ | 3,800,000 | ||||||||||||||
|
|
|
|
|
|
|
|
|
| |||||||||||||||
Total/Weighted Average | $ | 15,030,000 | 100.0 | % | 96.6 | % | 152,473 | $ | 20,040,000 | |||||||||||||||
|
|
|
|
|
|
|
|
|
| |||||||||||||||
The following table presents certain information relating to the tenancies at the Rivercrest Realty Portfolio Properties:
Major Tenants
Tenant Name | Credit Rating (Fitch/Moody’s/ S&P) | Tenant NRSF | % of NRSF | Annual U/W Base Rent PSF | Annual U/W Base Rent | % of Total Annual U/W Base Rent | Sales PSF(1) | Occupancy Cost(1)(2) | Lease Expiration Date | |||||||||||||||||||||||||
Major Tenants - Collateral | ||||||||||||||||||||||||||||||||||
Dollar Tree(3) | NR/NR/NR | 38,059 | 25.0 | % | $ | 9.99 | $ | 380,318 | (4) | 21.8 | % | Various | (4) | Various | (4) | Various | (4) | |||||||||||||||||
Cato | NR/NR/NR | 20,080 | 13.2 | % | $ | 11.08 | $ | 222,480 | (5) | 12.7 | % | $ | 147 | (5) | 9.5 | %(5) | Various | (5) | ||||||||||||||||
Shoe Show | NR/NR/NR | 12,000 | 7.9 | % | $ | 11.02 | $ | 132,200 | (6) | 7.6 | % | $ | 146 | (6) | 9.1 | %(6) | Various | (6) | ||||||||||||||||
RadioShack | NR/NR/NR | 7,400 | 4.9 | % | $ | 11.17 | $ | 82,650 | (7) | 4.7 | % | NAV | NAV | Various | (7) | |||||||||||||||||||
Sally Beauty Supply | NR/NR/NR | 4,400 | 2.9 | % | $ | 13.82 | $ | 60,800 | (8) | 3.5 | % | $ | 256 | (8) | 6.9 | %(8) | Various | (8) | ||||||||||||||||
|
|
|
|
|
|
|
| |||||||||||||||||||||||||||
Total Major Tenants | 81,939 | 53.7 | % | $ | 10.72 | $ | 878,448 | 50.3 | % | |||||||||||||||||||||||||
Non-Major Tenants | 65,321 | 42.8 | % | $ | 13.27 | $ | 867,085 | 49.7 | % | |||||||||||||||||||||||||
|
|
|
|
|
|
|
| |||||||||||||||||||||||||||
Occupied Collateral Total | 147,260 | 96.6 | % | $ | 11.85 | $ | 1,745,533 | 100.0 | % | |||||||||||||||||||||||||
|
|
|
| |||||||||||||||||||||||||||||||
Vacant Space | 5,213 | 3.4 | % | |||||||||||||||||||||||||||||||
|
|
|
| |||||||||||||||||||||||||||||||
Collateral Total | 152,473 | 100.0 | % | |||||||||||||||||||||||||||||||
|
|
|
| |||||||||||||||||||||||||||||||
| (1) | Sales and occupancy costs are for the 12-month period ending December 31, 2011. |
| (2) | Occupancy costs include base rent, reimbursements and percentage rent, as applicable. |
| (3) | Dollar Tree at the Boiling Springs Centre has a free rent period until March 2014. At closing, the borrower deposited $107,241, which represents the remaining 15 months of free rent, which will be released to the borrower over the first 15 monthly payment dates. |
| (4) | Dollar Tree leases five spaces: Garber’s Crossing (9,500 square feet, 5.4% of U/W Base Rent, lease expires 8/31/2017); Boiling Springs Centre (8,018 square feet, 4.8% of U/W Base Rent, $169 Sales PSF, 8.2% occupancy cost, lease expires 6/30/2022); Piedmont Plaza (8,000 square feet, 4.8% U/W Base Rent, $122 Sales PSF, 11.3% occupancy cost, lease expires 8/31/2015); Tidewater Plaza (8,041 square feet, 4.3% U/W Base Rent, lease expires 8/31/2017); and Peppers Ferry Centre (4,500 square feet, 2.4% U/W Base Rent, $129 Sales PSF, 7.4% occupancy cost, lease expires 9/30/2014). Sales were not reported at the Garber’s Crossing and Tidewater Plaza properties. |
| (5) | Cato leases five spaces: Boiling Springs Centre (4,160 square feet, 3.1% U/W Base Rent, $196 Sales PSF, 8.4% occupancy cost, lease expires 1/31/2015); Piedmont Plaza (4,160 square feet, 3.1% U/W Base Rent, $145 Sales PSF, 11.3% occupancy cost, lease expires 1/31/2016); Peppers Ferry Centre (4,000 square feet, 2.6% U/W Base Rent, $162 Sales PSF, 8.8% occupancy cost, lease expires 1/31/2015); Tidewater Plaza (4,160 square feet, 2.3% U/W Base Rent, $111 Sales PSF, 10.4% occupancy cost, lease expires 1/31/2015); and Garber’s Crossing (3,600 square feet, 1.6% U/W Base Rent, $116 Sales PSF, 8.3% occupancy cost and a month-to-month lease term). |
| (6) | Shoe Show leases three spaces: Piedmont Plaza (6,000 square feet, 3.6% U/W Base Rent, $138 Sales PSF, 10.1% occupancy cost, lease expires 11/30/2017); Tidewater Plaza (3,200 square feet, 2.2% U/W Base Rent, $151 Sales PSF, 9.3% occupancy cost, lease expires 5/31/2015); and Peppers Ferry Centre (2,800 square feet, 1.8% U/W Base Rent, $159 Sales, 6.9% occupancy cost, lease expires 4/30/2015). |
| (7) | RadioShack leases three spaces: Piedmont Plaza (2,500 square feet, 1.9% U/W Base Rent, lease expires 2/29/2016); Boiling Springs Centre (2,400 square feet, 1.5% U/W Base Rent, lease expires 1/31/2016); and Peppers Ferry Centre (2,500 square feet, 1.3% U/W Base Rent, lease expires 3/31/2014). |
| (8) | Sally Beauty Supply leases three spaces: Boiling Springs Centre (1,600 square feet, 1.2% U/W Base Rent, $325 Sales PSF, 5.2% occupancy cost, lease expires 10/31/2014); Piedmont Plaza (1,500 square feet, 1.2% U/W Base Rent, $208 Sales PSF, 8.3% occupancy cost, lease expires 1/31/2017); and Peppers Ferry Centre (1,300 square feet, 1.0% U/W Base Rent, $225 Sales PSF, 7.5% occupancy cost, lease expires 9/30/2013). |
THE INFORMATION IN THIS STRUCTURAL AND COLLATERAL TERM SHEET IS NOT COMPLETE AND MAY BE AMENDED PRIOR TO THE TIME OF SALE. THIS TERM SHEET IS NOT AN OFFER TO SELL THESE SECURITIES AND IT IS NOT A SOLICITATION OF AN OFFER TO BUY THESE SECURITIES IN ANY JURISDICTION WHERE THE OFFER OR SALE IS NOT PERMITTED.
119
RIVERCREST REALTY PORTFOLIO
The following table presents certain information relating to the historical sales and occupancy costs at the Rivercrest Realty Portfolio Properties:
Historical Sales (PSF) and Occupancy Costs(1)
Tenant Name | 2009 | 2010 | 2011 | |||||||||
Dollar Tree | $ | 90 | (2) | $ | 73 | (2) | $ | 77 | (2) | |||
Cato | $ | 144 | (3) | $ | 144 | (3) | $ | 147 | (3) | |||
Shoe Show | $ | 142 | (4) | $ | 156 | (4) | $ | 146 | (4) | |||
Radio Shack | NAV | NAV | NAV | |||||||||
Sally Beauty Supply | $ | 230 | (5) | $ | 238 | (5) | $ | 256 | (5) | |||
Occupancy Cost(5) | NAP | NAP | NAP | |||||||||
| (1) | Historical Sales (PSF) is based on historical statements provided by the borrower. |
| (2) | Piedmont Plaza (2009: $114 Sales PSF, 2010: $115 Sales PSF, 2011: $122 Sales PSF); Peppers Ferry Centre (2009: $119 Sales PSF, 2010: $124 Sales PSF, 2011: $129 Sales PSF); Tidewater Plaza (2009: $84 Sales PSF); and Boiling Springs Centre (2009: $161 Sales PSF, 2010: $160 Sales PSF, 2011: $169 Sales PSF). Sales were not reported at the Garber’s Crossing property and were only reported for 2009 at Tidewater Plaza property. |
| (3) | Cato leases five spaces: Piedmont Plaza (2009: $148 Sales PSF, 2010: $145 Sales PSF, 2011: $145 Sales PSF); Peppers Ferry Centre (2009: $149 Sales PSF, 2010: $150 Sales PSF, 2011: $162 Sales PSF); Tidewater Plaza (2009: $121 Sales PSF, 2010: $111 Sales PSF, 2011: $111 Sales PSF); Boiling Springs Centre (2009: 186 Sales PSF, 2010: 196 Sales PSF, 2011: $196 Sales PSF); and Garber’s Crossing (2009: $111 Sales PSF, 2010: $112 Sales PSF, 2011: $116 Sales PSF). |
| (4) | Shoe Show leases three spaces: Piedmont Plaza (2009: $139 Sales PSF, 2010: $145 Sales PSF, 2011: $138 Sales PSF); Peppers Ferry Centre (2009: $138 Sales PSF, 2010: $164 Sales PSF, 2011: $159 Sales); and Tidewater Plaza (2009: $151 Sales PSF, 2010: $171 Sales PSF, 2011: $151 Sales PSF). |
| (5) | Sally Beauty Supply leases three spaces: Piedmont Plaza (2009: $184 Sales PSF, 2010: $197 Sales PSF, 2011: $208 Sales PSF); Peppers Ferry Centre (2009: $200 Sales PSF, 2010: $204 Sales PSF, 2011: $225 Sales PSF); and Boiling Springs Centre (2009: $298 Sales PSF, 2010: $304 Sales PSF, 2011: $325 Sales PSF). |
| (6) | Occupancy cost not shown as not all tenants are required to report sales figures. |
The following table presents certain information relating to the lease rollover schedule at the Rivercrest Realty Portfolio Properties:
Lease Expiration Schedule(1)(2)
Year Ending December 31, | No. of Leases Expiring | Expiring NRSF | % of Total NRSF | Cumulative Expiring NRSF | Cumulative % of Total NRSF | Annual U/W Base Rent | Annual U/W Base Rent PSF(3) | |||||||||||||||||||
MTM | 2 | 5,100 | 3.3 | % | 5,100 | 3.3 | % | $ | 43,800 | $ | 8.59 | |||||||||||||||
2013 | 6 | 11,311 | 7.4 | % | 16,411 | 10.8 | % | $ | 159,975 | $ | 14.14 | |||||||||||||||
2014 | 13 | 32,310 | 21.2 | % | 48,721 | 32.0 | % | $ | 396,555 | $ | 12.27 | |||||||||||||||
2015 | 13 | 40,020 | 26.2 | % | 88,741 | 58.2 | % | $ | 474,337 | $ | 11.85 | |||||||||||||||
2016 | 5 | 13,059 | 8.6 | % | 101,800 | 66.8 | % | $ | 164,218 | $ | 12.58 | |||||||||||||||
2017 | 8 | 33,954 | 22.3 | % | 135,754 | 89.0 | % | $ | 372,667 | $ | 10.98 | |||||||||||||||
2018 | 1 | 1,488 | 1.0 | % | 137,242 | 90.0 | % | $ | 20,832 | $ | 14.00 | |||||||||||||||
2019 | 1 | 2,000 | 1.3 | % | 139,242 | 91.3 | % | $ | 28,960 | $ | 14.48 | |||||||||||||||
2020 | 0 | 0 | 0.0 | % | 139,242 | 91.3 | % | $ | 0 | $ | 0.00 | |||||||||||||||
2021 | 0 | 0 | 0.0 | % | 139,242 | 91.3 | % | $ | 0 | $ | 0.00 | |||||||||||||||
2022 | 1 | 8,018 | 5.3 | % | 147,260 | 96.6 | % | $ | 84,189 | $ | 10.50 | |||||||||||||||
2023 | 0 | 0 | 0.0 | % | 147,260 | 96.6 | % | $ | 0 | $ | 0.00 | |||||||||||||||
Thereafter | 0 | 0 | 0.0 | % | 147,260 | 96.6 | % | $ | 0 | $ | 0.00 | |||||||||||||||
Vacant | 0 | 5,213 | 3.4 | % | 152,473 | 100.0 | % | $ | 0 | $ | 0.00 | |||||||||||||||
|
|
|
|
|
|
|
|
| ||||||||||||||||||
Total/Weighted Average | 50 | 152,473 | 100.0 | % | $ | 1,745,533 | $ | 11.85 | ||||||||||||||||||
|
|
|
|
|
|
|
|
| ||||||||||||||||||
| (1) | Information obtained from the underwritten rent roll. |
| (2) | Certain tenants may have lease termination options that are exercisable prior to the originally stated expiration date of the subject lease and that are not considered in the Lease Expiration Schedule. |
| (3) | Annual U/W Base Rent PSF excludes vacant space. |
The following table presents historical occupancy percentages at the Rivercrest Realty Portfolio Properties:
Historical Occupancy(1)(2)
12/31/2009 | 12/31/2010 | 12/31/2011 | ||
92% | 94% | 94% |
| (1) | Information obtained from the borrower. |
| (2) | Historical occupancy at each property is as follows: Piedmont Plaza (2009: 84.2%, 2010: 84.2%, 2011: 85.2%); Peppers Ferry Centre (2009: 94.7%, 2010: 99.1%, 2011: 100.0%); Tidewater Plaza (2009: 90.0%, 2010: 95.0%, 2011: 93.8%); Boiling Springs Centre (2009: 93.3%, 2010: 91.1%, 2011: 92.9%); and Garber’s Crossing (2009: 97.3%, 2010: 100.0%, 2011: 100.0%). |
THE INFORMATION IN THIS STRUCTURAL AND COLLATERAL TERM SHEET IS NOT COMPLETE AND MAY BE AMENDED PRIOR TO THE TIME OF SALE. THIS TERM SHEET IS NOT AN OFFER TO SELL THESE SECURITIES AND IT IS NOT A SOLICITATION OF AN OFFER TO BUY THESE SECURITIES IN ANY JURISDICTION WHERE THE OFFER OR SALE IS NOT PERMITTED.
120
RIVERCREST REALTY PORTFOLIO
Operating History and Underwritten Net Cash Flow. The following table presents certain information relating to the historical operating performance and the Underwritten Net Cash Flow at the Rivercrest Realty Portfolio Properties:
Cash Flow Analysis
| 2010 | 2011 | TTM 9/30/2012 | U/W | U/W $ per SF | ||||||||||||||||
Base Rent | $ | 1,710,257 | $ | 1,683,703 | $ | 1,675,631 | $ | 1,745,533 | $ | 11.45 | ||||||||||
Grossed Up Vacant Space | 0 | 0 | 0 | 73,583 | 0.48 | |||||||||||||||
Percentage Rent | 0 | 0 | 0 | 0 | 0.00 | |||||||||||||||
Total Reimbursables | 359,615 | 357,167 | 355,597 | 355,597 | 2.33 | |||||||||||||||
Other Income | 9,776 | 11,624 | 21,392 | 24,765 | 0.16 | |||||||||||||||
Less Vacancy & Credit Loss | 0 | 0 | (4,916 | ) | (157,841 | )(1) | (1.04 | ) | ||||||||||||
|
|
|
|
|
|
|
|
|
| |||||||||||
Effective Gross Income | $ | 2,079,648 | $ | 2,052,494 | $ | 2,047,704 | $ | 2,041,636 | $ | 13.39 | ||||||||||
Total Operating Expenses | $ | 478,388 | $ | 487,422 | $ | 484,345 | $ | 490,036 | $ | 3.21 | ||||||||||
|
|
|
|
|
|
|
|
|
| |||||||||||
Net Operating Income | $ | 1,601,260 | $ | 1,565,072 | $ | 1,563,359 | $ | 1,551,600 | $ | 10.18 | ||||||||||
TI/LC | 0 | 0 | 0 | 81,665 | 0.54 | |||||||||||||||
Capital Expenditures | 0 | 0 | 0 | 54,211 | 0.36 | |||||||||||||||
|
|
|
|
|
|
|
|
|
| |||||||||||
Net Cash Flow | $ | 1,601,260 | $ | 1,565,072 | $ | 1,563,359 | $ | 1,415,724 | $ | 9.29 | ||||||||||
NOI DSCR | 1.82x | 1.78x | 1.78x | 1.77x | ||||||||||||||||
NCF DSCR | 1.82x | 1.78x | 1.78x | 1.61x | ||||||||||||||||
NOI DY | 10.7 | % | 10.4 | % | 10.4 | % | 10.3 | % | ||||||||||||
NCF DY | 10.7 | % | 10.4 | % | 10.4 | % | 9.4 | % | ||||||||||||
| (1) | The underwritten economic vacancy is 8.7%. The Rivercrest Realty Portfolio Properties were 96.6% physically occupied as of October 11, 2012. |
THE INFORMATION IN THIS STRUCTURAL AND COLLATERAL TERM SHEET IS NOT COMPLETE AND MAY BE AMENDED PRIOR TO THE TIME OF SALE. THIS TERM SHEET IS NOT AN OFFER TO SELL THESE SECURITIES AND IT IS NOT A SOLICITATION OF AN OFFER TO BUY THESE SECURITIES IN ANY JURISDICTION WHERE THE OFFER OR SALE IS NOT PERMITTED.
121
| WFRBS Commercial Mortgage Trust 2013-C11 | Transaction Contact Information |
| VI. | Transaction Contact Information |
Questions regarding this Structural and Collateral Term Sheet may be directed to any of the following individuals:
| RBS Securities Inc. | Wells Fargo Securities, LLC | |||||
| Jeff Wilson - Trading | Tel. (203) 897-2900 | Brigid Mattingly | Tel. (312) 269-3062 | |||
| Fax (312) 658-0140 | ||||||
| Adam Ansaldi | Tel. (203) 897-0881 | A.J. Sfarra | Tel. (212) 214-5613 | |||
| Fax (203) 873-3542 | Fax (212) 214-8970 | |||||
| Jim Barnard | Tel. (203) 897-4417 | Alex Wong | Tel. (212) 214-5615 | |||
| Fax (203) 873-4310 | Fax (212) 214-8970 | |||||
THE INFORMATION IN THIS STRUCTURAL AND COLLATERAL TERM SHEET IS NOT COMPLETE AND MAY BE AMENDED PRIOR TO THE TIME OF SALE. THIS TERM SHEET IS NOT AN OFFER TO SELL THESE SECURITIES AND IT IS NOT A SOLICITATION OF AN OFFER TO BUY THESE SECURITIES IN ANY JURISDICTION WHERE THE OFFER OR SALE IS NOT PERMITTED.
122