UNITED STATES
SECURITIES AND EXCHANGE COMMISSION
Washington, D.C. 20549
FORM N-CSR
CERTIFIED SHAREHOLDER REPORT OF REGISTERED
MANAGEMENT INVESTMENT COMPANIES
Investment Company Act file number 811-22811
Bridge Builder Trust
(Exact name of registrant as specified in charter)
615 East Michigan Street
Milwaukee, WI 53202
(Address of principal executive offices) (Zip code)
Elaine E. Richards, Secretary
Bridge Builder Trust
c/o 2020 East Financial Way
Glendora, CA 91741
(Name and address of agent for service)
414-287-3700
Registrant’s telephone number, including area code
Date of fiscal year end: June 30, 2014
Date of reporting period: December 31, 2013
Item 1. Reports to Stockholders.

Bridge Builder Mutual Funds
Letter to Shareholders
Dear Shareholder,
It is our pleasure to welcome you to the Bridge Builder Bond Fund. This first shareholder report provides us the opportunity to share with you the vision and purpose behind the Fund, as well as other important details.
Available exclusively through Edward Jones Advisory Solutions®, the Bridge Builder Bond Fund was launched October 28, 2013. The Fund employs a sub-advised, multi-manager structure in which third-party money managers (sub-advisers) are selected by the
Fund’s investment adviser, Olive Street Investment Advisers, LLC – an affiliate of Edward Jones. While Olive Street sets the overall investment strategies for the Fund, the sub-advisers are responsible for the day-to-day individual security selection and trading.
This approach is intended to benefit shareholders through a number of different avenues. One intended benefit is increased access to multiple money managers through a single mutual fund. Our research team will continue to seek out managers who share our long-term approach to investing to execute the Fund’s strategies. Additionally, as noted in the Fund’s prospectus, Olive Street has contractually agreed to waive its management fees over and above those paid to the sub-advisers, potentially reducing the Fund’s internal fees and expenses.
Three sub-advisers currently manage the Bridge Builder Bond Fund – J.P. Morgan Investment Management, Inc., Prudential Investment Management Inc., and Robert W. Baird & Co., Inc. It is our belief that all three sub-advisers bring important investment strategies and
BRIDGE BUILDER BOND FUND (BBTBX)
Investment Sub-advisers:
J.P. Morgan Investment Management, Inc.
~
Prudential Investment Management, Inc.
~
Robert W. Baird & Co., Inc.
Investment Objective:
Provide total return through capital appreciation plus income.
| Semiannual Report Ÿ December 31, 2013 | 1 |
Bridge Builder Mutual Funds
Letter to Shareholders (Continued)
perspectives that will contribute to the Fund’s overall investment objective. Through future shareholder reports such as this, we will update you on the Fund’s investment makeup and performance. Additionally, we will use future reports to share our overall market outlook and how that will shape the Fund’s future performance expectations.
We will provide our next report in late summer 2014. In the meantime, please allow us again to welcome you to the Fund. We look forward to playing an important role in helping you pursue your financial goals.
Sincerely,
| ||
William H. Broderick, III | Chairman, Bridge Builder Trust | |
 | ||
| Stephen R. Seifert | Vice President, Olive Street Investment Advisers
Principal, Edward Jones Investment Advisory | |
| 2 | Semiannual Report Ÿ December 31, 2013 |
Bridge Builder Mutual Funds
Letter to Shareholders (Continued)
Opinions expressed are subject to change at any time, are not guaranteed and should not be considered investment advice.
Must be preceded or accompanied by a prospectus.
Mutual fund investing involves risk. The value of your investment in the Fund could go down as well as up. You may lose money investing in the Fund, including the loss of principal. Investing in the bond market is subject to certain risks including market, credit, interest-rate, liquidity and reinvestment risk. The Fund may invest in asset-backed, mortgage-related and mortgage-backed securities, which may be more sensitive to changes in interest rates, prepayments and impairment of the value of the collateral underlying the security. The Fund may invest in derivatives, which may be more sensitive to market, counterparty, liquidity and correlation risk. The Fund may invest in U.S dollar-denominated foreign securities (including emerging markets), which may be more sensitive to currency fluctuations, political and economic instability, differing government regulations and liquidity risk. Multi-investment management styles may lead to overlapping securities transactions and higher transaction expenses compared to single investment management styles. Outcomes depend on the skill of the sub-advisers and adviser and the allocation of assets amongst them.
The Bridge Builder Bond Fund is distributed by Quasar Distributors, LLC.
| Semiannual Report Ÿ December 31, 2013 | 3 |
Bridge Builder Bond Fund
Performance
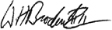
The following chart compares the value of a hypothetical $10,000 investment in the Bridge Builder Bond Fund from its inception (October 28, 2013) to December 31, 2013 as compared with the Barclays U.S. Aggregate Bond Index.
Bridge Builder Bond Fund
Growth of a Hypothetical $10,000 Investment as of December 31, 2013
vs.
Barclays U.S. Aggregate Bond Index
| Cumulative total returns for the period ending December 31, 2013 | ||||
| Since Inception | ||||
Bridge Builder Bond Fund | -0.96 | % | ||
Barclays U.S. Aggregate Bond Index | -1.01 | % | ||
| 4 | Semiannual Report Ÿ December 31, 2013 |
Bridge Builder Bond Fund
Performance (Continued)
Performance data quoted represents past performance and does not guarantee future results. The investment return and principal value of an investment will fluctuate so that an investor's shares, when redeemed, may be worth more or less than their original cost. Current performance of the Fund may be lower or higher than the performance quoted.
The line graph and performance table do not reflect the deduction of taxes that a shareholder may pay on fund distributions or the redemption of Fund shares. Returns shown for the Fund include the reinvestment of all dividends, if any.
The Barclays U.S. Aggregate Bond Index is a total return index that reflects the price changes and interest of each fixed-income security in the index. The Barclays U.S. Aggregate Bond Index is an unmanaged, capitalization-weighted index generally representative of the market for investment grade U.S. government and U.S. corporate debt securities.
The Fund's portfolio holdings may differ significantly from the securities held in the relevant index and, unlike a mutual fund, the performance of an unmanaged index does not reflect deductions for transaction costs, taxes, management fees or other expenses.
You cannot invest directly in an index.
| Semiannual Report Ÿ December 31, 2013 | 5 |
Bridge Builder Mutual Funds
Expenses
Expense Example
For the Period Ended December 31, 2013
As a shareholder of the Fund, you incur two types of costs: (1) ongoing costs, including management and sub-adviser fees, and other Fund expenses; and (2) annual Edward Jones Advisory Solutions® program and administrative fees. This Example is intended to help you understand your ongoing costs (in dollars) of investing in the Fund and to compare these costs with the ongoing costs of investing in other mutual funds.
The Example is based on $1,000 invested at the beginning of the period and held for the entire period from October 28, 2013, to December 31, 2013.
Actual Expenses
The table below provides information about actual account values and actual expenses. You may use the information in this line, together with the amount you invested, to estimate the expenses you paid over the period. Simply divide your account value by $1,000 (for example, an $8,600 account value divided by $1,000 equals 8.6), then multiply the result by the number in the applicable line under the heading titled “Expenses paid during the period ended” to estimate the expenses you paid on your account during the period.
| Beginning account value | Ending account value | Expenses paid during the period ended* | ||||||||||
Bridge Builder Bond Fund | $ | 1,000.00 | $ | 990.40 | $ | 0.37 | ||||||
| * | Expenses are equal to the Fund’s annualized expense ratio of 0.21%, multiplied by the average account value over the period, multiplied by 64/365 (to reflect the period since inception). Expenses do not include Edward Jones Advisory Solutions® program and administrative fees. |
| 6 | Semiannual Report Ÿ December 31, 2013 |
Bridge Builder Mutual Funds
Expenses (Continued)
Expense Example
For the Period Ended December 31, 2013
Hypothetical Example for Comparison Purposes
The table below provides information about hypothetical account values and hypothetical expenses based on the Fund’s actual expense ratio and an assumed rate of return of 5% per year before expenses, which is not the Fund’s actual return. The hypothetical account values and expenses may not be used to estimate the actual ending account balance or expenses you paid for the period. You may use this information to compare the ongoing costs of investing in the Fund with other funds. To do so, compare this 5% hypothetical example with the 5% hypothetical examples that appear in the shareholder reports of other funds.
Please note that the expenses shown in the table are meant to highlight your ongoing costs only and do not reflect any annual Edward Jones Advisory Solutions® program and administrative fees. Therefore, the table below is useful in comparing the ongoing costs only, and will not help you determine the relative total costs of owning different funds. In addition, if these transactional costs were included, your costs could have been higher.
| Beginning account value | Ending account value | Expenses paid during the period ended* | ||||||||||
Bridge Builder Bond Fund | $ | 1,000.00 | $ | 1,008.40 | $ | 0.37 | ||||||
| * | Expenses are equal to the Fund’s annualized expense ratio of 0.21%, multiplied by the average account value over the period, multiplied by 64/365 (to reflect the period since inception). Expenses do not include Edward Jones Advisory Solutions® program and administrative fees. |
| Semiannual Report Ÿ December 31, 2013 | 7 |
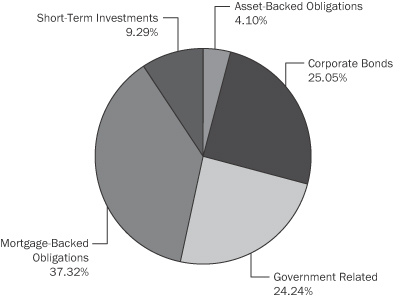
Bridge Builder Bond Fund
Portfolio Composition
Bridge Builder Bond Fund
Investments by Security Type as of December 31, 2013
(As a Percentage of Total Investments)
| 8 | Semiannual Report Ÿ December 31, 2013 |
Bridge Builder Bond Fund
Summary Schedule of Investments
December 31, 2013 (Unaudited)
| Principal Amount | Value | Percentage of Net Assets | ||||||||||
| BONDS & NOTES – 94.07% | ||||||||||||
Asset-Backed Obligations |
| |||||||||||
Atlas Senior Loan Fund Ltd., | $ | 15,000,000 | $ | 14,956,814 | 0.25 | % | ||||||
Chase Issuance Trust, | 15,200,000 | 15,000,895 | 0.26 | % | ||||||||
Other Securities (1)(2) | 223,491,725 | 219,862,508 | 3.74 | % | ||||||||
Total Asset-Backed Obligations | $ | 249,820,217 | 4.25 | % | ||||||||
Corporate Bonds |
| |||||||||||
| Basic Materials | ||||||||||||
Various Securities (2) | $ | 64,644,000 | $ | 66,081,261 | 1.12 | % | ||||||
Total Basic Materials | 66,081,261 | 1.12 | % | |||||||||
| Communications | ||||||||||||
Verizon Communications, Inc., | 16,483,000 | 18,957,444 | 0.32 | % | ||||||||
Other Securities (2) | 109,081,161 | 115,630,276 | 1.97 | % | ||||||||
Total Communications | 134,587,720 | 2.29 | % | |||||||||
| Consumer Cyclical | ||||||||||||
Various Securities (2) | 61,176,168 | 62,887,080 | 1.07 | % | ||||||||
Total Consumer Cyclical | 62,887,080 | 1.07 | % | |||||||||
| Consumer Non-cyclical | ||||||||||||
Various Securities (2) | 155,444,387 | 160,066,809 | 2.72 | % | ||||||||
Total Consumer Non-Cyclical | 160,066,809 | 2.72 | % | |||||||||
| Diversified | ||||||||||||
Various Securities (2) | 7,237,000 | 8,142,592 | 0.14 | % | ||||||||
Total Diversified | 8,142,592 | 0.14 | % | |||||||||
| Energy | ||||||||||||
Various Securities (2) | 172,464,687 | 180,146,474 | 3.07 | % | ||||||||
Total Energy | 180,146,474 | 3.07 | % | |||||||||
| Financials | ||||||||||||
American International Group, | 15,100,000 | 17,846,101 | 0.30 | % | ||||||||
Bank of America Corp., | 15,340,000 | 17,631,581 | 0.30 | % | ||||||||
| Semiannual Report Ÿ December 31, 2013 | 9 |
Bridge Builder Bond Fund
Summary Schedule of Investments
December 31, 2013 (Unaudited)(Continued)
| Principal Amount | Value | Percentage of Net Assets | ||||||||||
Corporate Bonds – (continued) |
| |||||||||||
| Financials – (continued) | ||||||||||||
Goldman Sachs Group, Inc., | $ | 17,547,000 | $ | 19,752,447 | 0.34 | % | ||||||
Other Securities (2) | 620,632,834 | 662,664,371 | 11.29 | % | ||||||||
Total Financials | 717,894,500 | 12.23 | % | |||||||||
| Industrials | ||||||||||||
Various Securities (2) | 56,977,693 | 57,705,644 | 0.98 | % | ||||||||
Total Industrials | 57,705,644 | 0.98 | % | |||||||||
| Technology | ||||||||||||
Various Securities | 43,172,000 | 44,670,661 | 0.76 | % | ||||||||
Total Technology | 44,670,661 | 0.76 | % | |||||||||
| Utilities | ||||||||||||
Various Securities (2) | 89,866,822 | 93,946,627 | 1.60 | % | ||||||||
Total Utilities | 93,946,627 | 1.60 | % | |||||||||
Total Corporate Bonds | $ | 1,526,129,368 | 25.98 | % | ||||||||
Government Related | ||||||||||||
| U.S. Treasury | ||||||||||||
U.S. Treasury Note, 0.25%, | $ | 45,000,000 | $ | 44,880,480 | 0.76 | % | ||||||
U.S. Treasury Note, 0.63%, | 47,150,000 | 47,006,334 | 0.80 | % | ||||||||
U.S. Treasury Note, 3.25%, | 20,315,000 | 21,789,422 | 0.37 | % | ||||||||
U.S. Treasury Note, 3.13%, | 13,814,000 | 14,788,536 | 0.25 | % | ||||||||
U.S. Treasury Note, 2.38%, | 40,000,000 | 41,796,880 | 0.71 | % | ||||||||
U.S. Treasury Note, 0.13%, | 20,676,199 | 21,088,110 | 0.36 | % | ||||||||
U.S. Treasury Note, 1.50%, | 19,561,000 | 19,461,669 | 0.33 | % | ||||||||
U.S. Treasury Note, 1.25%, | 23,000,000 | 22,548,993 | 0.38 | % | ||||||||
| 10 | Semiannual Report Ÿ December 31, 2013 |
Bridge Builder Bond Fund
Summary Schedule of Investments
December 31, 2013 (Unaudited)(Continued)
| Principal Amount | Value | Percentage of Net Assets | ||||||||||
Government Related – (continued) |
| |||||||||||
| U.S. Treasury – (continued) | ||||||||||||
U.S. Treasury Note, 1.25%, | $ | 16,965,000 | $ | 16,601,847 | 0.28 | % | ||||||
U.S. Treasury Note, 1.38%, | 17,239,000 | 16,980,415 | 0.29 | % | ||||||||
U.S. Treasury Note, 1.50%, | 249,890,000 | 247,078,738 | 4.21 | % | ||||||||
U.S. Treasury Note, 1.25%, | 116,225,600 | 112,602,616 | 1.92 | % | ||||||||
U.S. Treasury Note, 3.13%, | 20,774,000 | 22,137,294 | 0.38 | % | ||||||||
U.S. Treasury Note, 0.88%, | 74,610,000 | 70,255,835 | 1.20 | % | ||||||||
U.S. Treasury Note, 2.38%, | 59,875,000 | 59,641,128 | 1.02 | % | ||||||||
U.S. Treasury Note, 2.75%, | 22,050,000 | 21,571,096 | 0.37 | % | ||||||||
U.S. Treasury Bond, 5.25%, | 30,665,500 | 36,918,379 | 0.63 | % | ||||||||
U.S. Treasury Bond, 3.50%, | 59,819,100 | 56,332,783 | 0.96 | % | ||||||||
U.S. Treasury IO Strip, 0.00%, | 18,857,000 | 16,804,208 | 0.29 | % | ||||||||
U.S. Treasury IO Strip, 0.00%, | 33,605,000 | 29,010,995 | 0.49 | % | ||||||||
U.S. Treasury IO Strip, 0.00%, | 20,243,000 | 17,267,158 | 0.29 | % | ||||||||
U.S. Treasury IO Strip, 0.00%, | 18,630,000 | 15,487,194 | 0.26 | % | ||||||||
U.S. Treasury Notes/Bonds, 0.13%–11.25%, | 146,394,401 | 167,351,890 | 2.85 | % | ||||||||
U.S. Treasury IO Strips, 0.00%, Aug. 2015–May 2036 | 261,954,000 | 181,774,558 | 3.09 | % | ||||||||
Other Securities | 55,587,651 | 40,054,555 | 0.68 | % | ||||||||
Total U.S. Treasury | 1,361,231,113 | 23.17 | % | |||||||||
| Semiannual Report Ÿ December 31, 2013 | 11 |
Bridge Builder Bond Fund
Summary Schedule of Investments
December 31,2013 (Unaudited)(Continued)
| Principal Amount | Value | Percentage of Net Assets | ||||||||||
Government Related – (continued) |
| |||||||||||
| Other Government Related | ||||||||||||
Resolution Funding Federal Bank | $ | 24,949,000 | $ | 20,821,887 | 0.35 | % | ||||||
Other Securities (2) | 97,631,000 | 94,330,325 | 1.61 | % | ||||||||
Total Other Government Related | 115,152,212 | 1.96 | % | |||||||||
Total Government Related | $ | 1,476,383,325 | 25.13 | % | ||||||||
Mortgage-Backed Obligations | ||||||||||||
Banc of America Commercial Mortgage Trust, | $ | 16,116,615 | $ | 17,357,755 | 0.30 | % | ||||||
Citigroup Commercial Mortgage Trust, | 15,000,000 | 15,279,630 | 0.25 | % | ||||||||
Fannie Mae 3.50%, Jan. 2026 | 25,000,000 | 26,143,555 | 0.45 | % | ||||||||
Fannie Mae 3.00%, Dec. 2028 | 24,500,000 | 25,023,721 | 0.43 | % | ||||||||
Fannie Mae 5.50%, Jan. 2041 | 20,000,000 | 21,999,218 | 0.37 | % | ||||||||
Fannie Mae 3.50%, Feb. 2041 | 22,714,300 | 22,589,837 | 0.38 | % | ||||||||
Fannie Mae 4.50%, Nov. 2041 | 41,500,000 | 43,972,167 | 0.75 | % | ||||||||
Fannie Mae 7.00%, Nov. 2041 | 13,579,195 | 15,612,990 | 0.27 | % | ||||||||
Fannie Mae 3.50%, Nov. 2042 | 14,922,208 | 14,838,584 | 0.25 | % | ||||||||
Fannie Mae 4.00%, Nov. 2043 | 14,925,211 | 15,374,368 | 0.26 | % | ||||||||
Fannie Mae 3.50%, Dec. 2043 | 29,816,814 | 29,650,371 | 0.50 | % | ||||||||
Fannie Mae 4.00%, Dec. 2043 | 32,686,540 | 33,678,559 | 0.57 | % | ||||||||
Fannie Mae 5.00%, Feb. 2044 | 23,000,000 | 24,906,484 | 0.42 | % | ||||||||
Fannie Mae 0.00%–1184.78%, | 183,395,071 | 151,533,031 | 2.58 | % | ||||||||
Fannie Mae 0.51%–12.50%, | 523,760,474 | 535,723,226 | 9.12 | % | ||||||||
Freddie Mac 4.50%, Jan. 2041 | 20,000,000 | 21,161,718 | 0.36 | % | ||||||||
Freddie Mac 3.50%, July 2042 | 23,745,170 | 23,587,181 | 0.40 | % | ||||||||
Freddie Mac 3.00%, June 2043 | 20,816,187 | 19,745,410 | 0.34 | % | ||||||||
Freddie Mac 0.00%–1179.20%, Jan. 2014–Nov. 2046 | 127,188,535 | 106,946,674 | 1.82 | % | ||||||||
Freddie Mac 2.50%–10.00%, | 162,402,105 | 167,343,168 | 2.85 | % | ||||||||
| 12 | Semiannual Report Ÿ December 31, 2013 |
Bridge Builder Bond Fund
Summary Schedule of Investments
December 31, 2013 (Unaudited)(Continued)
| Principal Amount | Value | Percentage of Net Assets | ||||||||||
Mortgage-Backed Obligations – (continued) |
| |||||||||||
Ginnie Mae 4.50%, June 2041 | $ | 22,614,934 | $ | 24,216,275 | 0.41 | % | ||||||
Ginnie Mae 4.00%, Jan. 2042 | 25,000,000 | 25,993,165 | 0.44 | % | ||||||||
Ginnie Mae 4.50%, Jan. 2042 | 25,000,000 | 26,728,515 | 0.46 | % | ||||||||
Ginnie Mae 3.50%, Oct. 2042 | 14,849,847 | 15,004,086 | 0.26 | % | ||||||||
Ginnie Mae 0.00%–38.66%, | 170,144,344 | 122,700,287 | 2.09 | % | ||||||||
Ginnie Mae 3.00%–8.50%, | 53,337,409 | 55,186,571 | 0.94 | % | ||||||||
JPMBB Commercial Mortgage Securities Trust, 3.93%, Jan. 2047 | 15,000,000 | 14,997,428 | 0.26 | % | ||||||||
Other Securities (1)(2) | 1,417,173,290 | 656,155,403 | 11.18 | % | ||||||||
Total Mortgage-Backed Obligations | $ | 2,273,449,377 | 38.71 | % | ||||||||
Total Bonds & Notes | $ | 5,525,782,287 | 94.07 | % | ||||||||
| Shares | Value | Percentage of Net Assets | ||||||||||
| SHORT-TERM INVESTMENTS – 9.64% | ||||||||||||
Money Market Funds | ||||||||||||
Fidelity Institutional Money Market Fund, 0.01% (4) | 282,949,260 | $ | 282,949,260 | 4.82 | % | |||||||
Goldman Sachs Financial Square Fund, 0.01% (4) | 282,949,260 | 282,949,260 | 4.82 | % | ||||||||
Total Short-Term Investments | $ | 565,898,520 | 9.64 | % | ||||||||
| ||||||||||||
TOTAL INVESTMENT IN SECURITIES |
| $ | 6,091,680,807 | 103.71 | % | |||||||
LIABILITIES IN EXCESS OF OTHER ASSETS |
| (217,926,680 | ) | -3.71 | % | |||||||
TOTAL NET ASSETS |
| $ | 5,873,754,127 | 100.00 | % | |||||||
| Semiannual Report Ÿ December 31, 2013 | 13 |
Bridge Builder Bond Fund
Summary Schedule of Investments
December 31, 2013 (Unaudited)(Continued)
| (1) | Includes restricted securities as defined in Rule 144(A) under the Securities Act of 1933 that are treated as illiquid by the Adviser. The value of these securities total $3,018,082, which represents 0.05% of total net assets. See Note 2(b) in the Notes to Financial Statements. |
| (2) | Includes restricted securities as defined in Rule 144(A) under the Securities Act of 1933. The value of these securities total $534,455,098, which represents 9.10% of total net assets. See Note 2(b) in the Notes to Financial Statements. |
| (3) | Partially assigned as collateral for certain futures contracts. |
| (4) | Partially assigned as collateral for certain delayed delivery securities. See Note 2(a) in the Notes to Financial Statements. |
| 14 | Semiannual Report Ÿ December 31, 2013 |
Bridge Builder Bond Fund
Schedule of Open Futures Contracts
December 31, 2013 (Unaudited)
Number of | Description | Settlement Month | Notional Amount | Value | Cumulative Appreciation (Depreciation) | |||||||||||||
| 393 | U.S. 5 Year Note Future | March 2014 | $ | 47,211,086 | $ | 46,889,813 | $ | (321,273 | ) | |||||||||
| 54 | U.S. 2 Year Note Future | March 2014 | 11,879,129 | 11,869,875 | (9,254 | ) | ||||||||||||
| (334) | U.S. 10 Year Note Future | March 2014 | 41,709,769 | 41,097,656 | 612,113 | |||||||||||||
| 42 | U.S. Long Bond Future | March 2014 | 5,403,614 | 5,389,125 | (14,489 | ) | ||||||||||||
| (372) | U.S. Ultra Bond Future | March 2014 | 51,162,225 | 50,685,000 | 477,225 | |||||||||||||
|
|
|
|
|
| |||||||||||||
| $ | 157,365,823 | $ | 155,931,469 | $ | 744,322 | |||||||||||||
|
|
|
|
|
| |||||||||||||
| Semiannual Report Ÿ December 31, 2013 | 15 |
Bridge Builder Mutual Funds
Statement of Assets and Liabilities
December 31, 2013 (Unaudited)
| Bridge Builder Bond Fund | ||||
| Assets: | ||||
Investments, at value | $ | 6,091,680,807 | ||
Cash | 107,717 | |||
Receivable for investments sold | 51,662,186 | |||
Receivable for fund shares sold | 41,290,265 | |||
Dividends, interest and other receivables | 30,197,475 | |||
Variation margin on futures | 337,251 | |||
Prepaid expenses | 169,601 | |||
Total Assets | $ | 6,215,445,302 | ||
| Liabilities: | ||||
Payable for investments purchased | $ | 337,521,892 | ||
Payable for fund shares redeemed | 3,017,866 | |||
Payable to Adviser | 583,390 | |||
Payable to Trustees | 9,460 | |||
Accrued expenses and other liabilities | 558,567 | |||
Total Liabilities | $ | 341,691,175 | ||
Net Assets | $ | 5,873,754,127 | ||
| Net Assets Consist of: | ||||
Capital stock | $ | 5,934,619,792 | ||
Undistributed net investment loss | (2,285,372 | ) | ||
Accumulated net realized loss | (8,510,016 | ) | ||
Net unrealized depreciation on investments | (50,070,277 | ) | ||
Net Assets | $ | 5,873,754,127 | ||
Shares of beneficial interest outstanding | 595,305,536 | |||
Net Assets | $ | 5,873,754,127 | ||
Net asset value price per share | $ | 9.87 | ||
The accompanying notes are an integral part of these financial statements.
| 16 | Semiannual Report Ÿ December 31, 2013 |
Bridge Builder Mutual Funds
Statement of Operations
For the Period Ended December 31, 2013 (Unaudited)
| Bridge Builder Bond Fund | ||||
| Investment Income: | ||||
Interest | $ | 15,737,036 | ||
Other Income | 59,217 | |||
Total Investment Income | 15,796,253 | |||
| Expenses: | ||||
Investment advisory fees | 2,736,358 | |||
Professional fees | 151,264 | |||
Administration fees | 126,108 | |||
Fund accounting fees | 133,278 | |||
Transfer agent fees and expenses | 4,632 | |||
Trustee fees and expenses | 73,600 | |||
Printing and mailing expense | 36,124 | |||
Custody fees | 16,782 | |||
Insurance expense | 24,566 | |||
Registration fees | 196,950 | |||
Other expenses | 21,410 | |||
Total expenses before reimbursement | 3,521,072 | |||
Reimbursement of expenses by Adviser | (1,714,866 | ) | ||
Net expenses | 1,806,206 | |||
Net Investment Income | $ | 13,990,047 | ||
| Realized and Unrealized Gain/(Loss): | ||||
Net realized loss on investments | (8,440,575 | ) | ||
Net realized loss on futures | (69,441 | ) | ||
Net change in unrealized depreciation on investments | (50,070,277 | ) | ||
Net realized and unrealized loss on investments | (58,580,293 | ) | ||
Net Decrease in Net Assets Resulting from Operations | $ | (44,590,246 | ) | |
The accompanying notes are an integral part of these financial statements.
| Semiannual Report Ÿ December 31, 2013 | 17 |
Bridge Builder Mutual Funds
Statement of Changes in Net Assets (Unaudited)
| Bridge Builder Bond Fund | ||||
| From October 28, 2013 (Inception Date) to December 31, 2013 | ||||
| Operations: | ||||
Net investment income | $ | 13,990,047 | ||
Net realized loss on investments | (8,510,016 | ) | ||
Net change in unrealized depreciation on investments | (50,070,277 | ) | ||
Net decrease in net assets resulting from operations | (44,590,246 | ) | ||
| Dividends and Distributions to Shareholders: | ||||
Net investment income | (16,275,419 | ) | ||
Total dividends and distributions | (16,275,419 | ) | ||
| Fund Share Transactions: | ||||
Proceeds from shares sold | $ | 5,982,936,788 | ||
Shares issued to holders in reinvestment of dividends | 16,275,419 | |||
Cost of shares redeemed | (64,592,415 | ) | ||
Net increase in net assets from capital share transactions | 5,934,619,792 | |||
Total increase in net assets | 5,873,754,127 | |||
| Net Assets: | ||||
Beginning of period | — | |||
End of period* | $ | 5,873,754,127 | ||
* Including undistributed net investment loss of: | $ | (2,285,372 | ) | |
| Change in Shares Outstanding: | ||||
Shares sold | 600,170,222 | |||
Shares issued to holders in reinvestment of dividends | 1,644,132 | |||
Shares redeemed | (6,508,818 | ) | ||
Net increase | 595,305,536 | |||
The accompanying notes are an integral part of these financial statements.
| 18 | Semiannual Report Ÿ December 31, 2013 |
Bridge Builder Mutual Funds
Financial Highlights (Unaudited)
| Bridge Builder Bond Fund | ||||
| Per share operating performance (for a share outstanding throughout each period) | From October 28, 2013 (Inception Date) to December 31, 2013 | |||
Net asset value, beginning of period | $ | 10.00 | ||
Income (Loss) from Operations: | ||||
Net investment income | 0.03 | |||
Net realized and unrealized (loss) | (0.13 | ) | ||
Total income (loss) from operations | (0.10 | ) | ||
Dividends and Distributions to Shareholders: | ||||
Dividends from net investment income | (0.03 | ) | ||
Change in net asset value for the period | (0.13 | ) | ||
Net asset value, end of period | $ | 9.87 | ||
Total return | (0.96 | )%(1) | ||
| Ratios / Supplemental Data | ||||
Net assets, end of period (millions) | $ | 5,874 | ||
Ratio of Net Expenses to Average Net Assets: | ||||
Before expense limitation arrangement | 0.41 | %(2) | ||
After expense limitation arrangement | 0.21 | %(2) | ||
Ratio of Net Investment Income (Loss) to Average Net Assets: | ||||
Before expense limitation arrangement | 1.44 | %(2) | ||
After expense limitation arrangement | 1.64 | %(2) | ||
Portfolio turnover rate | 160 | %(3) | ||
| (1) | Since Inception (October 28, 2013) |
| (2) | Annualized |
| (3) | Not Annualized |
The accompanying notes are an integral part of these financial statements.
| Semiannual Report Ÿ December 31, 2013 | 19 |
Bridge Builder Mutual Funds
Notes to Financial Statements (Unaudited)
1. ORGANIZATION
The Bridge Builder Trust (the “Trust”) is a Delaware statutory trust organized under the laws of the State of Delaware on December 19, 2012, and is registered with the Securities and Exchange Commission (the “SEC”) as an open-end management investment company under the Investment Company Act of 1940, as amended (the “1940 Act”). Currently, the Trust consists of a single series: the Bridge Builder Bond Fund (the “Fund”), which commenced operations on October 28, 2013. The Fund is diversified and currently offers a single class of shares. The Fund has adopted a non-fundamental policy to invest at least 80% of its net assets (plus the amount of borrowings for investment purposes) in fixed-income securities and other instruments, such as derivatives and certain investment companies, with economic characteristics similar to fixed-income securities. The investment objective of the Fund is to provide total return (capital appreciation plus income).
2. SIGNIFICANT ACCOUNTING POLICIES
The following is a summary of significant accounting policies consistently followed by the Trust in the preparation of its financial statements. These policies are in conformity with generally accepted accounting principles (“GAAP”) in the United States of America. The presentation of financial statements in conformity with GAAP requires management to make estimates and assumptions that affect the reported amounts of assets and liabilities at the date of the financial statements and the reported amounts of revenues and expenses during the reporting period. Actual results could differ from those estimates and assumptions.
In preparing these financial statements, the Fund has evaluated events and transactions for potential recognition or disclosure through the date the financial statements were issued.
a) Investment Valuation – Bonds and other fixed-income securities (other than short-term securities) are valued using the bid price on the day of the valuation provided by an independent pricing service.
| 20 | Semiannual Report Ÿ December 31, 2013 |
Bridge Builder Mutual Funds
Notes to Financial Statements (Unaudited)(Continued)
Fixed-income securities, including corporate, convertible and municipal bonds and notes, U.S. government agencies, U.S. Treasury obligations, sovereign issues, bank loans, convertible preferred securities and non-U.S. bonds, are normally valued on the basis of quotes obtained from brokers and dealers or independent pricing services or sources. Independent pricing services typically use information provided by market makers or estimates of market values obtained from yields and other relevant data relating to investments or securities with similar characteristics. The service providers’ internal models use inputs that are observable such as, among other things, issuer details, interest rates, yield curves, prepayment speeds, credit risks/spreads, default rates and quoted prices for similar assets. Securities that use similar valuation techniques and inputs as described above are categorized as Level 2 of the fair value hierarchy.
Fixed-income securities purchased on a delayed-delivery basis are typically marked-to-market daily until settlement at the forward settlement date and are categorized as Level 2 of the fair value hierarchy.
Mortgage- and asset-backed securities are usually issued as separate tranches, or classes, of securities within each package of underlying securities. These securities are also normally valued by pricing service providers that use broker-dealer quotations or valuation estimates from their internal pricing models. The pricing models for these securities usually consider tranche level attributes, estimated cash flows and market-based yield spreads for each tranche, current market data and incorporate packaged collateral performance, as available. Mortgage- and asset-backed securities that use such valuation techniques and inputs are categorized as Level 2 of the fair value hierarchy only if there are significant observable inputs used.
Equity securities traded on a national securities exchange are valued at the last reported sale price at the close of regular trading on each
| Semiannual Report Ÿ December 31, 2013 | 21 |
Bridge Builder Mutual Funds
Notes to Financial Statements (Unaudited)(Continued)
day the exchange is open for trading. Securities listed on the NASDAQ National Market System for which market quotations are readily available are valued using the NASDAQ Official Closing Price. Securities traded on an exchange for which there have been no sales are valued at the mean between last bid and ask price on such day. Securities for which quotations are not readily available are valued at their respective fair values, as determined in good faith pursuant to procedures adopted by the Board of Trustees.
Common stocks, exchange-traded fund shares and financial derivative instruments, such as futures contracts or options contracts that are traded on a national securities or commodities exchange, are valued at the last reported sales price, in the case of common stocks and exchange-traded fund shares, or, in the case of futures contracts or options contracts, the settlement price determined by the relevant exchange. To the extent these securities are actively traded and valuation adjustments are not applied, they are categorized as Level 1 of the fair value hierarchy.
Securities with less than 60 days remaining to maturity when acquired by the Fund are valued on an amortized cost basis. Short-term securities, including U.S. Government and other fixed-income securities, with more than 60 days remaining to maturity are valued at the current market value, as provided by an independent pricing service on the day of valuation until the 60th day prior to maturity, and are then valued at amortized cost based upon the value on such date unless the Board determines during such 60-day period that this amortized cost basis does not represent fair value.
Open-ended mutual funds (including money market funds) are valued at the end of the day’s net asset value and are categorized as Level 1 of the fair value hierarchy.
Foreign securities will be priced in their local currencies as of the close of their primary exchange or market. Foreign securities, currencies and other assets denominated in foreign currencies are
| 22 | Semiannual Report Ÿ December 31, 2013 |
Bridge Builder Mutual Funds
Notes to Financial Statements (Unaudited)(Continued)
then translated into U.S. dollars at the exchange rate of such currencies against the U.S. dollar, as provided by a pricing service. Foreign securities are recorded in the financial statements after translation to U.S. dollars, based on the applicable exchange rate at the end of the period. The Fund reports certain foreign currency-related transactions as components of realized gains or losses for financial reporting purposes, whereas such components are treated as ordinary income for federal income tax purposes.
Valuation adjustments may be applied to certain securities that are solely traded on a foreign exchange to account for the market movement between the close of the foreign market and the close of the New York Stock Exchange (“NYSE.”) These securities are generally valued using pricing service providers that consider the correlation of the trading patterns of the foreign security to the intraday trading in the U.S. markets for investments. Securities using these valuation adjustments are categorized as Level 2 of the fair value hierarchy.
The Trust has adopted valuation procedures that allow for fair value pricing for use in appropriate circumstances. For example, such circumstances may arise when trading in a security has been halted or suspended or a security has been delisted from a national exchange, a security has not been traded for an extended period of time, or a significant event with respect to a security occurs after the close of the market or exchange on which the security principally trades and before the time the Fund calculates its own share price. If no price, or in the investment advisor’s determination no price representing fair value, is provided for a security held by the Fund by an independent pricing agent, then the security will be fair valued. Thinly traded securities and certain foreign securities may be impacted more by the use of fair valuations than other securities.
In using fair value pricing, the Fund attempts to establish the price that it might reasonably have expected to receive upon a sale of the security at 4:00 p.m. Eastern time. Valuing securities at fair value
| Semiannual Report Ÿ December 31, 2013 | 23 |
Bridge Builder Mutual Funds
Notes to Financial Statements (Unaudited)(Continued)
involves greater reliance on judgment than valuation of securities based on readily available market quotations. When using fair value to price securities, the Fund may value those securities higher or lower than another fund using market quotations or fair value to price the same securities. Further, there can be no assurance that the Fund could obtain the fair value assigned to a security if it were to sell the security at approximately the time at which the Fund determines its net asset value.
The Valuation Committee is generally responsible for overseeing the day-to-day valuation processes and reports periodically to the Board. The Valuation Committee is authorized to make all necessary determinations of the fair value of portfolio securities and other assets for which market quotations are not readily available or if it is deemed that the prices obtained from brokers and dealers or independent pricing services are unreliable. The securities fair valued by the Valuation Committee are indicated on the Schedule of Investments. These securities are classified as Level 2 or Level 3 of the fair value hierarchy. Certain vendor-priced securities may also be considered Level 3 if significant unobservable inputs are used by the vendors.
The Fund has performed an analysis of all existing investments to determine the significance and character of all inputs to its fair value determination. Various inputs are used in determining the value of the Fund’s investments. These inputs are summarized in the following three broad categories:
| • | Level 1 – Quoted unadjusted prices for identical instruments in active markets to which the Corporation has access at the date of measurement. |
| • | Level 2 – Quoted prices for similar instruments in active markets; quoted prices for identical or similar instruments in markets that are not active; and model-derived valuations in which all significant inputs and significant value drivers are observable in active markets. Level 2 inputs are those in |
| 24 | Semiannual Report Ÿ December 31, 2013 |
Bridge Builder Mutual Funds
Notes to Financial Statements (Unaudited)(Continued)
markets for which there are few transactions, the prices are not current, little public information exists or there are instances where prices vary substantially over time or among brokered market makers. |
| • | Level 3 – Model derived valuations in which one or more significant inputs or significant value drivers are unobservable. Unobservable inputs are those inputs that reflect the Funds’ own assumptions that market participants would use to price the asset or liability based on the best available information. |
Bridge Builder Bond Fund
| Level 1 | Level 2 | Level 3 | Total | |||||||||||||
Asset-Backed Obligations | $ | — | $ | 249,820,217 | $ | — | $ | 249,820,217 | ||||||||
Corporate Bonds | — | 1,526,129,368 | — | 1,526,129,368 | ||||||||||||
Government Related | — | 1,476,383,325 | — | 1,476,383,325 | ||||||||||||
Mortgage-Backed Obligations | — | 2,273,449,377 | — | 2,273,449,377 | ||||||||||||
Short-Term Investments | 565,898,520 | — | — | 565,898,520 | ||||||||||||
Total Investments in Securities | $ | 565,898,520 | $ | 5,525,782,287 | $ | — | $ | 6,091,680,807 | ||||||||
Other Financial Instruments (1) | ||||||||||||||||
Purchased Futures | $ | (345,016 | ) | $ | — | $ | — | $ | (345,016 | ) | ||||||
Written Futures | 1,089,338 | — | — | 1,089,338 | ||||||||||||
Total Investments in Other Financial Instruments | $ | 744,322 | $ | — | $ | — | $ | 744,322 | ||||||||
| (1) | Includes cumulative appreciation/depreciation on futures contracts as reported in the Schedule of Future Contracts. |
See the Schedule of Investments for the investments detailed by industry classification.
There were no transfers between Levels 1 and 2 during the period. Transfers between levels are recognized at the end of the reporting period.
| Semiannual Report Ÿ December 31, 2013 | 25 |
Bridge Builder Mutual Funds
Notes to Financial Statements (Unaudited)(Continued)
Delayed Delivery Securities – The Fund may enter into contracts to purchase mortgage securities for a fixed price at a future date beyond customary settlement time if the Fund sets aside on its books liquid assets in an amount sufficient to meet the purchase price, or if the Fund enters into offsetting contracts for the forward sale of other securities it owns. In the case of delayed delivery mortgage purchase commitments, the unit price and the estimated principal amount are established when the Fund enters into a contract, with the actual principal amount being within a specified range of the estimate. For these obligations, the Fund will segregate or earmark liquid assets in an amount sufficient to cover its obligations. Forward commitments may be considered securities in themselves, and involve a risk of loss if the value of the security to be purchased declines prior to the settlement date, which risk is in addition to the risk of decline in the value of the Fund’s other assets. Where such purchases are made through dealers, the Fund relies on the dealer to consummate the sale. The dealer’s failure to do so may result in a loss to the Fund of an advantageous yield or price. Although the Fund will generally enter into forward commitments with the intention of acquiring securities for its portfolio, the Fund may dispose of a commitment prior to settlement if it deems it appropriate to do so. The Fund may realize short-term profits or losses upon the sale of forward commitments.
The Fund may enter into delayed delivery sale commitments to hedge its portfolio positions or to sell securities it owns under delayed delivery arrangements. Proceeds of the sale commitments are not received until the contractual settlement date. Unsettled sale commitments are valued at current market value of the underlying securities. If the sale commitment is closed through the acquisition of an offsetting purchase commitment, the Fund realizes a gain or loss on the commitment without regard to any unrealized gain or loss on the underlying security. If the Fund delivers securities under the commitment, the Fund realizes a gain or loss from the sale of the securities based upon the unit price established at the date the commitment was entered into.
| 26 | Semiannual Report Ÿ December 31, 2013 |
Bridge Builder Mutual Funds
Notes to Financial Statements (Unaudited)(Continued)
Delayed delivery purchase and sale commitments of the same security are shown net on the Statement of Assets and Liabilities. As of December 31, 2013, the Fund held $253,564,705 in delayed delivery purchase and sale commitments that represent 4.32% of the Fund’s net assets.
Derivatives – The Fund invests in derivatives to the extent permitted by its investment objectives and policies. Derivatives are financial instruments whose value is based on the value of another underlying asset, interest rate, index or financial instrument.
The Fund’s use of derivatives may increase or decrease its exposure to market risk, including the risk that the change in the value of the derivative may not correlate with changes in the value of the underlying securities. The Fund also is exposed to additional risks from investing in derivatives, such as liquidity risk and counterparty risk. Liquidity risk is the risk that the Fund will be unable to sell a particular derivative in the open market in a timely manner. Counterparty risk is the risk that a counterparty will not be able to fulfill its obligations to the Fund pursuant to the terms of a derivative investment. The Fund’s maximum risk of loss from counterparty risk is generally the aggregate unrealized appreciation and unpaid counterparty fees in excess of any collateral pledged by the counterparty to the Fund.
Futures Contracts – The Fund may enter into interest rate and Treasury futures contracts, which are agreements between two parties to buy or sell a specified underlying instrument for a fixed price on a specified future date, to the extent permitted by its investment objectives and policies. Upon entering into futures contracts, the Fund is required to deposit cash or pledge securities as initial margin, with additional securities segregated up to the current market value of all of the Fund’s futures contracts. Any subsequent margin deposit increases or decreases, which are dependent on the daily fluctuations in the value of the instrument underlying the contract, are made or received by the Fund periodically
| Semiannual Report Ÿ December 31, 2013 | 27 |
Bridge Builder Mutual Funds
Notes to Financial Statements (Unaudited)(Continued)
(Variation Margin) and are recorded as unrealized gains or losses until the contracts are closed. When the contracts are closed, the Fund will record a realized gain or loss equal to the difference between the proceeds from (or cost of) the closing transactions and the Fund’s basis in the contracts.
The Fund had an average monthly notional amount long of $31,801,085 and sold short of $49,454,206 during the period ended December 31, 2013. As a result of these futures contract investments, the Fund recognized net realized losses of $69,441 during the period ended December 31, 2013. This amount is included in the Fund’s Statement of Operations. The counterparty for these futures contracts was JP Morgan Chase. See the Schedule of Investments for the Fund’s open futures contracts as of December 31, 2013.
b) Restricted Securities – The Fund may own investment securities that are unregistered and thus restricted as to resale. These securities are valued after giving due consideration to pertinent factors, including recent private sales, market conditions and the issuer’s financial performance. Where future disposition of these securities requires registration under the Securities Act of 1933, the Fund has the right to include these securities in such registration, generally without cost to the Fund. The Fund has no right to require registration of the unregistered securities it holds. As of December 31, 2013, the Fund held restricted securities with an aggregate value of $534,455,098, which accounted for 9.10% of the Fund’s net assets.
c) Federal Income and Excise Taxes – It is the Fund’s policy to meet the requirements of Subtitle A, Chapter 1, Subchapter M of the Internal Revenue Code, as amended, applicable to regulated investment companies and to distribute all investment company net taxable income and net capital gains to shareholders in a manner that results in no tax cost to the Fund. Therefore, no federal income or excise tax provision is required.
| 28 | Semiannual Report Ÿ December 31, 2013 |
Bridge Builder Mutual Funds
Notes to Financial Statements (Unaudited)(Continued)
The Fund commenced operations on October 28, 2013, and therefore has no prior tax years.
d) Distributions to Shareholders – The Fund will make distributions of dividends monthly and capital gains, if any, at least annually. The Fund will make a distribution of any undistributed capital gains earned annually. The Fund may make an additional payment of dividends or other distributions if it deems it to be desirable or necessary at other times during any year. All distributions that are reinvested will be in shares of the Fund. Distributions to shareholders are recorded on the ex-dividend date.
A Fund may make reclassifications periodically among certain of its capital accounts as a result of the characterization of certain income and realized gains determined annually in accordance with federal tax regulations that may differ from generally accepted accounting principles. These reclassifications between capital accounts are made for only those differences that are permanent in nature, such as net operating losses, non-deductible costs and dividend reclasses.
e) Guarantees and Indemnifications – In the normal course of business, the Trust may enter into a contract with service providers that contain general indemnification clauses. The Trust’s maximum exposure under these arrangements is unknown, as this would involve future claims against the Trust that have not yet occurred.
f) Other – Investment and shareholder transactions are recorded on the trade date. Dividend income is recognized on the ex-dividend date and interest income is recognized on the accrual basis. Withholding taxes on foreign dividends and capital, if any, are included as a component of net investment income and realized gain/loss on investments, respectively, and have been provided for in accordance with the Fund’s understanding of the applicable country’s tax rules and rates. Discounts and premiums on securities purchased are amortized and accreted, respectively, using the constant yield
| Semiannual Report Ÿ December 31, 2013 | 29 |
Bridge Builder Mutual Funds
Notes to Financial Statements (Unaudited)(Continued)
method over the life of the respective securities. Realized gains and losses are evaluated on the bases of identified costs.
3. INVESTMENT ADVISER
Olive Street Investment Advisers, LLC (the “Adviser”) acts as investment adviser to the Fund pursuant to an investment advisory agreement (the “Advisory Agreement”) with the Trust. The Adviser is a wholly owned subsidiary of The Jones Financial Companies, L.L.L.P. Under the Advisory Agreement, the Adviser furnishes, at its own expense, all services, facilities and personnel necessary in connection with managing the Fund’s investments.
The Adviser shall provide the Trust through investment “Sub-advisers” with such investment research, advice and supervision as the Trust may from time to time consider necessary for the proper management of the assets of the Fund, shall furnish continuously an investment program for the Fund, and shall determine from time to time which securities or other investments shall be purchased, sold or exchanged for the Fund, including providing or obtaining such services as may be necessary in managing, acquiring or disposing of securities, cash or other investments.
The Adviser has selected Robert W. Baird & Co., Inc., (“Baird”), J.P. Morgan Investment Management, Inc. (“JPMIM”), and Prudential Investment Management, Inc. (“Prudential”), to sub-advise discrete portions of the Fund’s assets. For their services as Sub-advisers to the Fund, Baird, JPMIM and Prudential are entitled to receive fees from the Adviser.
In consideration of the services to be provided by the Adviser pursuant to the Advisory Agreement, the Fund will pay the Adviser an investment management fee at an annual rate equal to 0.32% of the Fund’s average daily net assets. The Adviser has contractually agreed to waive its management fees to the extent management fees to be paid to the Adviser exceed the management fees the Adviser is required to pay the Fund’s Sub-advisers. During the period ended
| 30 | Semiannual Report Ÿ December 31, 2013 |
Bridge Builder Mutual Funds
Notes to Financial Statements (Unaudited)(Continued)
December 31, 2013, the Adviser waived $1,714,866 of advisory fees which are not subject to recoupment by the Adviser.
Pursuant to an operating expense limitation agreement between the Adviser and the Fund, the Adviser has contractually agreed to reduce its fees and/or pay Fund expenses (excluding acquired fund fees and expenses, portfolio transaction expenses, interest expense in connection with investment activities, taxes and extraordinary expenses) to limit total annual fund operating expenses after fee waivers and/or expense reimbursement to 0.48% of the Fund’s annual net assets (“Expense Cap”).
Any Fund expenses reimbursed or waived by the Adviser are subject to reimbursement by the Fund if requested by the Adviser. This reimbursement may be requested by the Adviser if the aggregate amount actually paid by a Fund toward operating expenses for such fiscal year (taking into account any reimbursements) does not exceed the Expense Cap. The Adviser is permitted to be reimbursed for expenses it waived or reimbursed to the Fund in the prior three fiscal years. The Fund must pay its current ordinary operating expenses before the Adviser is entitled to any reimbursement of expenses.
4. INVESTMENT TRANSACTIONS
For the period ended December 31, 2013, purchases and sales of investment securities, other than short-term investments, were as follows:
| Bridge Builder Bond Fund | ||||
Purchases: | ||||
U.S. Government | $ | 4,791,841,391 | ||
Other | $ | 1,316,236,072 | ||
Sales: | ||||
U.S. Government | $ | 3,118,836,870 | ||
Other | $ | 11,816,498 | ||
5. FEDERAL INCOME TAX INFORMATION
The Fund commenced operations on October 28, 2013; therefore, the Fund has no prior year tax information.
| Semiannual Report Ÿ December 31, 2013 | 31 |
Bridge Builder Mutual Funds
Board Consideration of Investment Advisory and Sub-advisory Agreements
Pursuant to Section 15 of the 1940 Act, the Fund’s advisory and sub-advisory agreements (the “Agreements”) must be approved: (i) by a vote of a majority of the shareholders of the Fund; and (ii) by the vote of a majority of the members of the Board of Trustees (the “Board” or the “Trustees”) of the Trust who are not parties to the Agreements or “interested persons” of any party thereto, as defined in the 1940 Act (the “Independent Trustees”), cast in person at a meeting called for the purpose of voting on such approval.(1)
A Board meeting was held on May 22, 2013 to decide whether to approve the Agreements, each for an initial two-year term. In preparation for the meeting, the Adviser and the Sub-advisers furnished information to the Board necessary for the Board to evaluate the terms of the Agreements. The Trustees used this information, as well as other information that the Adviser, the Sub-advisers and other service providers of the Fund presented or submitted to the Board at the meeting, to help them decide whether to approve the Agreements for initial two-year terms.
Specifically, the Board received written materials from the Adviser, the Sub-advisers and other service providers of the Fund regarding, among other matters: (i) the nature, extent and quality of the services to be provided by the Adviser and the Sub-advisers; (ii) the Adviser’s and the Sub-advisers’ investment management personnel; (iii) the Adviser’s and the Sub-advisers’ operations; (iv) the Adviser’s and the Sub-advisers’ investment strategies; (v) the Fund’s proposed advisory fees to be paid to the Adviser and the Fund’s overall fees and operating expenses compared with those of a peer group of mutual funds; (vi) the Adviser’s and the Sub-advisers’ policies and compliance procedures related to personal securities transactions; (vii) the Adviser’s and its affiliates’ experience in selecting and monitoring third-party investment managers; and (viii) the Sub-advisers’ performance in managing accounts with strategies similar to the Fund’s.
| 32 | Semiannual Report Ÿ December 31, 2013 |
Bridge Builder Mutual Funds
Board Consideration of Investment Advisory and Sub-advisory Agreements (Continued)
Representatives from the Adviser and the Sub-advisers, along with other Fund service providers, presented additional information and participated in question and answer sessions at the meeting to help the Trustees evaluate the Adviser’s and the Sub-advisers’ services, fees and other aspects of the Agreements. The Independent Trustees received advice from Fund counsel, including advice regarding the legal standards applicable to the consideration of advisory arrangements, and met in executive session outside the presence of Fund management and the Adviser and the Sub-advisers to discuss the terms of the Agreements and the services to be provided by the Adviser and the Sub-advisers.
In considering the approval of the Agreements, the Board considered various factors that they determined were relevant, including: (i) the nature, extent and quality of the services to be provided by the Adviser and the Sub-advisers; and (ii) the fees to be paid to the Adviser and the Sub-advisers, as discussed in further detail below.
Nature, Extent and Quality of Services Provided by the Adviser and the Sub-advisers
In considering the nature, extent and quality of the services to be provided by the Adviser and the Sub-advisers, the Board reviewed the portfolio management services to be provided by the Adviser and the Sub-advisers to the Fund, including the background and experience of the Adviser’s and the Sub-advisers’ portfolio management personnel and the resources of the Adviser and the Sub-advisers. The Trustees reviewed the terms of the proposed Agreements and considered that the Adviser would supervise and monitor the performance of the Sub-advisers.
The Trustees also considered other services to be provided to the Fund by the Adviser and the Sub-advisers such as selecting broker-dealers to execute portfolio transactions, monitoring adherence to the Fund’s investment restrictions, and monitoring compliance with various Fund policies and procedures and with applicable securities
| Semiannual Report Ÿ December 31, 2013 | 33 |
Bridge Builder Mutual Funds
Board Consideration of Investment Advisory and Sub-advisory Agreements (Continued)
laws and regulations. Based on the factors above, as well as those discussed below, the Board concluded, within the context of its full deliberations, that the nature, extent and quality of the services to be provided to the Fund by the Adviser and the Sub-advisers would be satisfactory.
Costs of Advisory Services
In considering the advisory fees payable by the Fund to the Adviser, as well as the fees payable by the Adviser to the Sub-advisers, the Trustees reviewed, among other things, a report of the proposed advisory fees to be paid to the Adviser and the Sub-advisers. The Trustees also reviewed reports prepared by the Fund’s administrator comparing the Fund’s net and gross expense ratios and advisory fees to those paid by a peer group of mutual funds. The Trustees considered that the Adviser, not the Fund, would pay the Sub-advisers pursuant to the sub-advisory agreements. The Trustees evaluated both the fee that would be payable under the sub-advisory agreements and the portion of the fee under the advisory agreement that would be retained by the Adviser. In this regard, the Board considered that the Adviser has contractually agreed to waive its management fees to the extent management fees to be paid to the Adviser exceed the management fees the Adviser is required to pay the Sub-advisers. Based on the factors above, as well as those discussed below, the Board concluded, within the context of its full deliberations, that the advisory fees were reasonable in light of the nature and quality of the services expected to be rendered by the Adviser and the Sub-advisers. The Board also considered the Adviser’s and the Sub-advisers’ commitment to managing the Fund.
Because the Fund is new and has not commenced operations, it did not yet have an investment performance record and it was not possible to determine the profitability that the Adviser or the Sub-advisers might achieve with respect to the Fund or the extent to which economies of scale would be realized by the Adviser or the Sub-advisers as the assets of the Fund grow. Accordingly, the
| 34 | Semiannual Report Ÿ December 31, 2013 |
Bridge Builder Mutual Funds
Board Consideration of Investment Advisory and Sub-advisory Agreements (Continued)
Trustees did not make any conclusions regarding the Fund’s investment performance, the Adviser’s or the Sub-advisers’ profitability, or the extent to which economies of scale would be realized by the Adviser or the Sub-advisers as the assets of the Fund grow, but expect to do so during future considerations of the Agreements.
In considering the approval of the Agreements, the Board took into account that Fund shares are currently available exclusively to investors participating in Edward Jones Advisory Solutions®, an investment advisory program or asset-based fee program sponsored by Edward D. Jones & Co., L.P. (“Edward Jones”), and that investors pay asset-based fees to Edward Jones in connection with their participation in Edward Jones Advisory Solutions®. The Board further took into account that the Fund is designed to facilitate the relationship between the investors participating in Edward Jones Advisory Solutions® and the Adviser and Edward Jones, an affiliate of the Adviser.
Based on the Board’s deliberations and its evaluation of the information described above and other factors and information it believed relevant, the Board, including all of the Independent Trustees, unanimously concluded that the terms of the Agreements, including the fees to be paid thereunder, were fair and reasonable and agreed to approve the Agreements for initial terms of two years. In its deliberations, the Board did not identify any particular factor (or conclusion with respect thereto) or single piece of information that was all-important, controlling or determinative of its decision and each Trustee may have attributed different weights to the various factors (and conclusions with respect thereto) and information.
| (1) | The Fund and the Adviser have received an exemptive order from the SEC permitting them to enter into and materially amend sub-advisory agreements without shareholder approval and granting them relief from certain disclosure requirements. |
| Semiannual Report Ÿ December 31, 2013 | 35 |
Bridge Builder Mutual Funds
Additional Information
Independent Trustees of the Trust
| Name | Role | Term | Principal Occupation | |||
Jean E. Carter (Born: 1957) | Lead Independent Trustee | Indefinite Term; Since Inception | Retired since 2005; Director of Investment Management Group for Russell Investment Group (2000 – 2005) | |||
Janice L. Innis- Thompson (Born: 1966) | Trustee, Chair of the Nominating and Governance Committee | Indefinite Term; Since Inception | Senior Vice President, Chief Compliance & Ethics Officer, TIAA-CREF (since 2006) | |||
William N. Scheffel (Born: 1953) | Trustee | Indefinite Term; Since Inception | Executive Vice President, Chief Financial Officer and Treasurer, Centene Corporation (since 2003) | |||
John M. Tesoro (Born: 1952) | Trustee, Chair of the Audit Committee | Indefinite Term; Since Inception | Retired; Partner, KPMG LLP (2002-2012) |
| 36 | Semiannual Report Ÿ December 31, 2013 |
Bridge Builder Mutual Funds
Additional Information (Continued)
Interested Trustees of the Trust
| Name | Role | Term | Principal Occupation | |||
William H. Broderick III (Born: 1952) | Trustee, Chairman | Indefinite Term; Since Inception | Retired. Principal, Investment Advisory, Edward Jones and General Partner, The Jones Financial Companies, LLLP (1986-2012) | |||
William E. Fiala (Born: 1967) | Trustee, Chair of the Valuation Committee | Indefinite Term; Since Inception | Principal, Edward Jones and General Partner, The Jones Financial Companies, LLLP (1994 - Present) |
Officers of the Trust
| Name | Role | Term | Principal Occupation | |||
Joseph C. Neuberger (Born: 1962) | President | Indefinite Term; Since Inception | Executive Vice President, U.S. Bancorp Fund Services, LLC (1994-Present) | |||
Jason F. Hadler (Born: 1975) | Treasurer | Indefinite Term; Since Inception | Senior Vice President, U.S. Bancorp Fund Services, LLC (Since 2003) | |||
Robert M. Slotky (Born: 1947) | Chief Compliance Officer | Indefinite Term; Since Inception | Senior Vice President, U.S. Bancorp Fund Services, LLC (Since July 2001) | |||
Elaine E. Richards (Born: 1968) | Secretary | Indefinite Term; Since Inception | Vice President and Legal Compliance Officer, U.S. Bancorp Fund Services, LLC (Since July 2007) |
The Statement of Additional Information includes additional information about the Trustees and is available upon request, without charge, by calling 1-855-823-3611.
| Semiannual Report Ÿ December 31, 2013 | 37 |
Bridge Builder Mutual Funds
General Information
Proxy Voting Procedures and Proxy Voting Record
A description of the policies and procedures that the Fund uses to determine how to vote proxies relating to portfolio securities is available, free of charge, by calling toll-free 1-855-823-3611. This information is also available through the Securities and Exchange Commission’s website at http://www.sec.gov. Information regarding how the Trust voted proxies relating to portfolio securities during the 12-month period ending June 30 will be available without charge, upon request, by calling 1-855-823-3611. This information is also available through the Securities and Exchange Commission’s website at http://www.sec.gov.
Form N-Q Disclosure
The Trust files its complete schedule of portfolio holdings with the Securities and Exchange Commission for the first and third quarters of each fiscal year on Form N-Q. The Trust’s Form N-Q filings are available on the Securities and Exchange Commission’s website at http://www.sec.gov. The Trust’s Form N-Q filings may be reviewed and copied at the Commission’s Public Reference Room in Washington, D.C., and information on the operation of the Public Reference Room may be obtained by calling 1-800-SEC-0330. Information regarding the Trust’s Form N-Q filings is also available, without charge, by calling toll-free, 1-855-823-3611.
Household Delivery of Shareholder Documents
To reduce expenses the Fund may mail only one copy of the Fund’s prospectus, SAI and each annual and semi-annual report to those addresses shared by two or more accounts. If you wish to receive individual copies of these documents, please call the Fund at 1-855-823-3611. You will begin receiving individual copies thirty days after your request is received.
Schedule of Investments
The Fund’s complete schedule of investments in securities of unaffiliated issuers is available without charge, upon request, by calling 1-855-823-3611, and on the SEC website at http://www.sec.gov as a part of Form N-CSR.
| 38 | Semiannual Report Ÿ December 31, 2013 |
Bridge Builder Mutual Funds
Privacy Policy
FACTS | What Does the Bridge Builder Trust (“Bridge Builder”) Do with Your Personal Information? | |||
Why? | Financial companies choose how they share your personal information. Federal law gives consumers the right to limit some but not all sharing. Federal law also requires us to tell you how we collect, share and protect your personal information. Please read this notice carefully to understand what we do. | |||
What? | The types of personal information we collect and share depend on the product or service you have with us. This information can include: | |||
| * Social Security number | * Investment experience | |||
| * Account transactions | * Risk tolerance | |||
| * Transaction history | * Account transactions | |||
| When you are no longer our customer, we continue to share your information as described in this notice. | ||||
How? | All financial companies need to share customers’ personal information to run their everyday business. In the section below, we list the reasons financial companies can share their customers’ personal information; the reasons Bridge Builder chooses to share; and whether you can limit this sharing. | |||
REASONS WE CAN SHARE YOUR PERSONAL INFORMATION | DOES BRIDGE BUILDER SHARE? | CAN YOU LIMIT THIS SHARING? | ||
For our everyday business purposes – such as to process your transactions, maintain your account(s), respond to court orders and legal investigations, or report to credit bureaus | Yes | No | ||
For our marketing purposes – to offer our products and services to you | No | We don’t share | ||
For joint marketing with other financial companies | No | We don’t share | ||
For our affiliates’ everyday business purposes – information about your transactions and experiences | Yes | No | ||
For our affiliates’ everyday business purposes – information about your creditworthiness | No | We don’t share | ||
For nonaffiliates to market to you | No | We don’t share |
Questions? Call 1-855-823-3611 or go to www.bridgebuildermutualfunds.com |
| Semiannual Report Ÿ December 31, 2013 | 39 |
Bridge Builder Mutual Funds
Privacy Policy
WHO WE ARE | ||
Who is providing this notice? | Bridge Builder Trust |
WHAT WE DO | ||
How does Bridge Builder protect my personal information? | To protect your personal information from unauthorized access and use, we use security measures that comply with federal law. These measures include computer safeguards and secured files and buildings. | |
How does Bridge Builder collect my personal information? | We collect your personal information, for example, when you deposit money with us, if you ever were to give us your contact information, open an account with us, provide us account information or make a wire transfer. | |
Why can’t I limit all sharing? | Federal law gives you the right to limit only:
* Sharing for affiliates’ everyday business purposes – information about your creditworthiness * Affiliates from using your information to market to you * Sharing for nonaffiliates to market to you
State laws and individual companies may give you additional rights to limit sharing. |
DEFINITIONS | ||
Affiliates | Companies related by common ownership or control. They can be financial and nonfinancial companies.
* Olive Street Investment Advisers, LLC (“Olive Street”), our investment adviser, may be deemed to be affiliated with us. Olive Street is a wholly owned subsidiary of The Jones Financial Companies, L.L.L.P. (“JFC”), and is affiliated with other subsidiaries of JFC, including Edward D. Jones & Co., L.P., and Edward Jones Trust Company. | |
Nonaffiliates | Companies not related by common ownership or control. They can be financial and nonfinancial companies.
* Bridge Builder does not share with nonaffiliates so they can market to you. | |
Joint Marketing | A formal agreement between nonaffiliated financial companies that together market financial products or services to you.
* Bridge Builder does not currently engage in joint marketing efforts. | |
| 40 | Semiannual Report Ÿ December 31, 2013 |
Investment Adviser
Olive Street Investment Advisers, LLC
12555 Manchester Road
St. Louis, MO 63131
Administrator, Fund Accountant & Transfer Agent
U.S. Bancorp Fund Services, LLC
615 East Michigan Street
Milwaukee, WI 53202
Distributor
Quasar Distributors, LLC
615 East Michigan Street
Milwaukee, WI 53202
Custodian
U.S. Bank, N.A.
1555 North RiverCenter Drive, Suite 302
Milwaukee, WI 53212
Legal Counsel
Morgan Lewis & Bockius, LLP
1701 Market Street
Philadelphia, PA 19103

Item 2. Code of Ethics.
Not applicable for semi-annual reports.
Item 3. Audit Committee Financial Expert.
Not applicable for semi-annual reports.
Item 4. Principal Accountant Fees and Services.
Not applicable for semi-annual reports.
Item 5. Audit Committee of Listed Registrants.
Not applicable to registrants who are not listed issuers (as defined in Rule 10A-3 under the Securities Exchange Act of 1934).
Item 6. Investments.
| (a) |
Bridge Builder Bond Fund
Schedule of Investments
December 31, 2013 (Unaudited)
| Principal Amount | Value | |||||||
BONDS & NOTES - 94.07% | ||||||||
Asset Backed Obligations - 4.25% | ||||||||
ABFC 2005-AQ1 Trust | ||||||||
4.92%, 06/25/2035 | $ | 1,034,932 | $ | 1,047,339 | ||||
Academic Loan Funding Trust 2012-1 | ||||||||
0.96%, 12/27/2022 (Acquired 10/28/2013, Cost $1,438,986) (a) | 1,426,317 | 1,439,069 | ||||||
Academic Loan Funding Trust 2013-1 | ||||||||
0.96%, 12/26/2044 | 2,500,000 | 2,500,000 | ||||||
Ally Auto Receivables Trust 2010-3 | ||||||||
1.55%, 08/17/2015 | 288,146 | 288,916 | ||||||
Ally Auto Receivables Trust 2012-1 | ||||||||
1.21%, 07/15/2016 | 229,000 | 231,095 | ||||||
Ally Auto Receivables Trust 2012-2 | ||||||||
0.74%, 04/15/2016 | 1,004,920 | 1,006,660 | ||||||
Ally Auto Receivables Trust 2012-3 | ||||||||
0.85%, 08/15/2016 | 1,002,000 | 1,004,718 | ||||||
American Credit Acceptance Receivables Trust | ||||||||
1.64%, 11/15/2016 (Acquired 10/28/2013, Cost $675,626) (a) | 675,985 | 677,287 | ||||||
2.28%, 09/17/2018 (Acquired 10/28/2013, Cost $331,500) (a) | 332,000 | 334,143 | ||||||
American Credit Acceptance Receivables Trust 2012-1 | ||||||||
3.04%, 10/15/2015 (Acquired 10/28/2013, Cost $97,598) (a) | 97,268 | 97,467 | ||||||
American Credit Acceptance Receivables Trust 2012-2 | ||||||||
1.89%, 07/15/2016 (Acquired 10/28/2013, Cost $721,981) (a) | 720,467 | 722,799 | ||||||
2.75%, 02/15/2018 (Acquired 10/28/2013, Cost $224,891) (a) | 223,000 | 224,757 | ||||||
American Credit Acceptance Receivables Trust 2013-1 | ||||||||
1.45%, 04/16/2018 (Acquired 10/28/2013, Cost $893,781) (a) | 894,606 | 893,724 | ||||||
AmeriCredit Automobile Receivables Trust 2011-4 | ||||||||
1.17%, 05/09/2016 | 598,636 | 599,462 | ||||||
AmeriCredit Automobile Receivables Trust 2011-5 | ||||||||
1.55%, 07/08/2016 | 1,003,077 | 1,006,026 | ||||||
AmeriCredit Automobile Receivables Trust 2012-1 | ||||||||
0.91%, 10/08/2015 | 25,993 | 25,994 | ||||||
1.23%, 09/08/2016 | 243,000 | 243,560 | ||||||
AmeriCredit Automobile Receivables Trust 2012-2 | ||||||||
0.76%, 10/08/2015 | 62,077 | 62,088 | ||||||
1.05%, 10/11/2016 | 261,000 | 261,779 | ||||||
AmeriCredit Automobile Receivables Trust 2012-3 | ||||||||
0.71%, 12/08/2015 | 178,449 | 178,493 | ||||||
0.96%, 01/09/2017 | 398,000 | 399,406 | ||||||
AmeriCredit Automobile Receivables Trust 2012-4 | ||||||||
0.49%, 04/08/2016 | 194,695 | 194,636 | ||||||
AmeriCredit Automobile Receivables Trust 2012-5 | ||||||||
0.51%, 01/08/2016 | 671,325 | 671,076 | ||||||
0.62%, 06/08/2017 | 339,000 | 338,868 | ||||||
AmeriCredit Automobile Receivables Trust 2013-1 | ||||||||
0.49%, 06/08/2016 | 792,596 | 792,251 | ||||||
0.61%, 10/10/2017 | 137,000 | 136,758 | ||||||
AmeriCredit Automobile Receivables Trust 2013-5 | ||||||||
0.90%, 09/10/2018 | 393,220 | 393,081 | ||||||
Ameriquest Mortgage Securities Inc Asset-Backed Pass-Through Ctfs Ser 2003-13 | ||||||||
5.09%, 01/25/2034 | 17,369 | 17,287 | ||||||
AMRESCO Residential Securities Corp Mortgage Loan Trust 1997-3 | ||||||||
6.96%, 03/25/2027 | 2 | 2 | ||||||
Anchorage Capital CLO 2013-1 Ltd | ||||||||
1.43%, 07/13/2025 (Acquired 11/25/2013, Cost $14,336,876) (a) | 14,500,000 | 14,216,351 | ||||||
Argent Securities Inc | ||||||||
1.30%, 03/25/2034 | 3,570,651 | 3,355,209 | ||||||
Argent Securities Inc Asset Back Pass Thr Certs Ser 2004-W5 | ||||||||
1.20%, 04/25/2034 | 3,287,939 | 3,082,561 | ||||||
Argent Securities Inc Asset-Backed Pass-Through Certificates Series 2005-W3 | ||||||||
0.50%, 11/25/2035 | 7,618,104 | 7,139,474 | ||||||
Ascentium Equipment Receivables LLC | ||||||||
1.83%, 09/15/2019 (Acquired 10/28/2013, Cost $475,825) (a) | 476,247 | 475,802 | ||||||
Asset Backed Securities Corp Home Equity Loan Trust Series 2003-HE6 | ||||||||
0.84%, 11/25/2033 | 1,862,969 | 1,728,541 | ||||||
Asset Backed Securities Corp Home Equity Loan Trust Series 2004-HE6 | ||||||||
0.52%, 09/25/2034 | 8,691,395 | 8,351,188 |
Atlas Senior Loan Fund Ltd | ||||||||
1.74%, 02/17/2026 | 15,000,000 | 14,956,814 | ||||||
AXIS Equipment Finance Receivables II LLC | ||||||||
1.75%, 03/20/2017 (Acquired 11/13/2013, Cost $1,774,710) (a) | 1,774,788 | 1,783,688 | ||||||
Bank of America Auto Trust 2012-1 | ||||||||
0.78%, 06/15/2016 | 613,971 | 615,381 | ||||||
Bayview Financial Mortgage Pass-Through Trust 2006-A | ||||||||
5.48%, 02/28/2041 | 66,453 | 67,217 | ||||||
Bayview Financial Mortgage Pass-Through Trust 2007-B | ||||||||
6.83%, 08/28/2047 | 268,602 | 224,336 | ||||||
Bayview Opportunity Master Fund IIa Trust 2012-4NPL | ||||||||
3.47%, 07/28/2032 (Acquired 10/28/2013, Cost $340,138) (a) | 340,754 | 340,652 | ||||||
Bayview Opportunity Master Fund IIa Trust 2013-8NPL | ||||||||
3.23%, 03/28/2033 (Acquired 10/28/2013, Cost $2,419,986) (a) | 2,388,182 | 2,384,719 | ||||||
Bear Stearns Asset Backed Securities Trust 2006-SD1 | ||||||||
0.53%, 04/25/2036 | 97,200 | 92,753 | ||||||
BMW Vehicle Lease Trust 2012-1 | ||||||||
0.75%, 02/20/2015 | 566,428 | 566,798 | ||||||
BMW Vehicle Lease Trust 2013-1 | ||||||||
0.54%, 09/21/2015 | 344,000 | 344,109 | ||||||
BXG Receivables Note Trust 2012-A | ||||||||
2.66%, 12/02/2027 (Acquired 10/28/2013, Cost $852,947) (a) | 861,844 | 850,593 | ||||||
Cabela’s Master Credit Card Trust | ||||||||
1.63%, 02/18/2020 (Acquired 10/28/2013, Cost $793,481) (a) | 784,000 | 790,895 | ||||||
California Republic Auto Receivables Trust 2012-1 | ||||||||
1.18%, 08/15/2017 (Acquired 10/28/2013, Cost $1,260,761) (a) | 1,262,314 | 1,260,707 | ||||||
Capital Auto Receivables Asset Trust / Ally | ||||||||
0.62%, 07/20/2016 | 1,314,000 | 1,313,760 | ||||||
Capital Auto Receivables Asset Trust 2013-4 | ||||||||
1.09%, 03/20/2018 | 957,000 | 953,409 | ||||||
Carfinance Capital Auto Trust 2013-1 | ||||||||
1.65%, 07/17/2017 (Acquired 10/28/2013, Cost $98,739) (a) | 98,958 | 98,740 | ||||||
2.75%, 11/15/2018 (Acquired 10/28/2013, Cost $170,016) (a) | 172,000 | 169,925 | ||||||
Carfinance Capital Auto Trust 2013-2 | ||||||||
1.75%, 11/15/2017 (Acquired 10/28/2013, Cost $323,102) (a) | 323,112 | 323,103 | ||||||
CarMax Auto Owner Trust 2011-1 | ||||||||
1.29%, 09/15/2015 | 130,559 | 130,677 | ||||||
2.16%, 09/15/2016 | 1,148,000 | 1,162,807 |
CarMax Auto Owner Trust 2013-1 | ||||||||
0.60%, 10/16/2017 | 187,000 | 186,904 | ||||||
CarMax Auto Owner Trust 2013-4 | ||||||||
0.80%, 07/16/2018 | 308,000 | 307,538 | ||||||
1.28%, 05/15/2019 | 275,000 | 273,127 | ||||||
Carnow Auto Receivables Trust 2013-1 | ||||||||
1.16%, 10/16/2017 (Acquired 10/28/2013, Cost $172,463) (a) | 172,542 | 172,459 | ||||||
1.97%, 11/15/2017 (Acquired 10/28/2013, Cost $451,209) (a) | 451,000 | 451,225 | ||||||
Carrington Mortgage Loan Trust Series 2006-OPT1 | ||||||||
0.34%, 02/25/2036 | 2,180,496 | 2,042,983 | ||||||
Chase Funding Trust Series 2003-4 | ||||||||
5.42%, 05/25/2033 | 321,688 | 337,166 | ||||||
Chase Funding Trust Series 2003-6 | ||||||||
4.28%, 11/25/2034 | 863,343 | 872,067 | ||||||
5.35%, 11/25/2034 | 439,000 | 455,037 | ||||||
Chase Issuance Trust | ||||||||
0.63%, 04/15/2019 | 15,200,000 | 15,000,895 | ||||||
Citifinancial Mortgage Securities Inc | ||||||||
5.85%, 08/25/2033 | 240,694 | 233,860 | ||||||
Citigroup Mortgage Loan Trust 2011-5 | ||||||||
0.35%, 02/25/2046 (Acquired 10/28/2013, Cost $821,894) (a) | 874,279 | 821,974 | ||||||
Citigroup Mortgage Loan Trust Inc | ||||||||
0.54%, 12/25/2033 | 108,002 | 102,194 | ||||||
CNH Equipment Trust 2011-A | ||||||||
1.20%, 05/16/2016 | 108,370 | 108,451 | ||||||
2.04%, 10/17/2016 | 495,000 | 501,311 | ||||||
CNH Equipment Trust 2012-A | ||||||||
0.94%, 05/15/2017 | 612,488 | 614,055 | ||||||
CNH Equipment Trust 2012-C | ||||||||
0.44%, 02/16/2016 | 490,244 | 490,249 | ||||||
Concord Funding Co LLC | ||||||||
2.42%, 02/15/2015 | 1,445,000 | 1,408,875 | ||||||
3.15%, 01/15/2017 (Acquired 10/28/2013, Cost $3,096,001) (a) | 3,096,000 | 3,096,000 | ||||||
Conseco Financial Corp | ||||||||
6.40%, 10/15/2018 | 11,476 | 11,779 | ||||||
7.05%, 01/15/2019 | 5,631 | 5,819 | ||||||
6.86%, 03/15/2028 | 1,115 | 1,136 |
6.24%, 12/01/2028 | 98,388 | 101,246 | ||||||
7.07%, 01/15/2029 | 2,839 | 2,929 | ||||||
6.22%, 03/01/2030 | 207,639 | 221,214 | ||||||
6.18%, 04/01/2030 | 56,788 | 58,393 | ||||||
Contimortgage Home Equity Loan Trust 1997-2 | ||||||||
7.09%, 04/15/2028 | 5 | 5 | ||||||
Countrywide Asset-Backed Certificates | ||||||||
4.58%, 01/25/2033 | 296,195 | 302,126 | ||||||
5.41%, 01/25/2034 | 49,707 | 48,250 | ||||||
0.91%, 03/25/2034 | 133,000 | 125,535 | ||||||
0.99%, 03/25/2034 | 18,293 | 17,494 | ||||||
0.72%, 04/25/2034 | 1,112 | 1,040 | ||||||
0.76%, 10/25/2034 | 109,963 | 102,623 | ||||||
5.12%, 02/25/2035 | 172,944 | 176,606 | ||||||
4.61%, 04/25/2035 | 444,616 | 430,544 | ||||||
5.03%, 07/25/2035 | 506,797 | 516,754 | ||||||
4.78%, 02/25/2036 | 1,236,028 | 1,189,886 | ||||||
4.92%, 02/25/2036 | 1,745,171 | 1,688,111 | ||||||
5.10%, 04/25/2036 | 414,085 | 354,552 | ||||||
5.14%, 05/25/2036 | 55,112 | 59,097 | ||||||
5.14%, 05/25/2036 | 132,168 | 136,265 | ||||||
5.11%, 09/25/2046 | 161,161 | 98,095 | ||||||
CPS Auto Receivables Trust 2011-B | ||||||||
3.68%, 09/17/2018 (Acquired 10/28/2013, Cost $193,462) (a) | 189,166 | 193,112 | ||||||
CPS Auto Receivables Trust 2011-C | ||||||||
4.21%, 03/15/2019 (Acquired 10/28/2013, Cost $698,487) (a) | 681,241 | 697,694 | ||||||
CPS Auto Receivables Trust 2012-A | ||||||||
2.78%, 06/17/2019 (Acquired 10/28/2013, Cost $365,061) (a) | 359,461 | 362,642 | ||||||
CPS Auto Receivables Trust 2012-B | ||||||||
2.52%, 09/16/2019 (Acquired 10/28/2013, Cost $1,622,049) (a) | 1,603,759 | 1,612,376 | ||||||
CPS Auto Receivables Trust 2013-A | ||||||||
1.31%, 06/15/2020 (Acquired 10/28/2013, Cost $1,027,127) (a) | 1,030,171 | 1,013,798 | ||||||
CPS Auto Receivables Trust 2013-C | ||||||||
1.64%, 04/16/2018 (Acquired 10/28/2013, Cost $1,158,252) (a) | 1,160,504 | 1,161,302 | ||||||
CPS Auto Receivables Trust 2013-D | ||||||||
1.54%, 07/16/2018 (Acquired 12/10/2013, Cost $3,155,712) (a) | 3,156,000 | 3,153,381 |
CPS Auto Trust | ||||||||
1.82%, 12/16/2019 (Acquired 10/28/2013, Cost $1,144,987) (a) | 1,139,065 | 1,133,895 | ||||||
1.48%, 03/16/2020 (Acquired 10/28/2013, Cost $627,356) (a) | 626,689 | 620,056 | ||||||
Credit Acceptance Auto Loan Trust 2011-1 | ||||||||
2.61%, 03/15/2019 (Acquired 10/28/2013, Cost $616,010) (a) | 611,275 | 615,249 | ||||||
Credit Acceptance Auto Loan Trust 2012-1 | ||||||||
2.20%, 09/16/2019 (Acquired 10/28/2013, Cost $490,027) (a) | 486,000 | 489,401 | ||||||
Credit Acceptance Auto Loan Trust 2012-2 | ||||||||
1.52%, 03/16/2020 (Acquired 10/28/2013, Cost $1,127,478) (a) | 1,124,000 | 1,127,157 | ||||||
Credit-Based Asset Servicing and Securitization LLC | ||||||||
4.42%, 12/25/2035 | 37,276 | 34,936 | ||||||
CSMC Trust 2006-CF1 | ||||||||
0.47%, 11/25/2035 (Acquired 10/28/2013, Cost $22,308) (a) | 22,564 | 22,325 | ||||||
CWHEQ Home Equity Loan Trust Series 2007-S1 | ||||||||
5.69%, 11/25/2036 | 120,220 | 117,753 | ||||||
DT Auto Owner Trust 2012-2 | ||||||||
0.91%, 11/16/2015 (Acquired 10/28/2013, Cost $70,935) (a) | 70,929 | 70,928 | ||||||
EquiVantage Home Equity Loan Trust 1996-3 | ||||||||
7.70%, 09/25/2027 | 329 | 328 | ||||||
Exeter Automobile Receivables Trust 2012-2 | ||||||||
1.30%, 06/15/2017 (Acquired 10/28/2013, Cost $649,969) (a) | 650,234 | 651,480 | ||||||
Exeter Automobile Receivables Trust 2013-1 | ||||||||
1.29%, 10/16/2017 (Acquired 10/28/2013, Cost $142,825) (a) | 143,047 | 143,316 | ||||||
Exeter Automobile Receivables Trust 2013-2 | ||||||||
1.49%, 11/15/2017 (Acquired 10/28/2013, Cost $666,741) (a) | 666,666 | 669,072 | ||||||
First Franklin Mortgage Loan Trust 2006-FF17 | ||||||||
0.26%, 12/25/2036 | 27,910 | 27,628 | ||||||
First Investors Auto Owner Trust 2012-2 | ||||||||
1.47%, 05/15/2018 (Acquired 10/28/2013, Cost $784,461) (a) | 780,685 | 784,752 | ||||||
First Investors Auto Owner Trust 2013-1 | ||||||||
0.90%, 10/15/2018 (Acquired 10/28/2013, Cost $522,485) (a) | 524,223 | 524,460 | ||||||
Flagship Credit Auto Trust 2013-1 | ||||||||
1.32%, 04/16/2018 (Acquired 10/28/2013, Cost $1,105,037) (a) | 1,106,742 | 1,104,933 | ||||||
Flagship Credit Auto Trust 2013-2 | ||||||||
1.94%, 01/15/2019 (Acquired 10/28/2013, Cost $1,176,203) (a) | 1,176,191 | 1,176,093 | ||||||
Ford Credit Floorplan Master Owner Trust A | ||||||||
0.54%, 01/15/2018 | 1,150,000 | 1,151,420 |
Freedom Trust 2011-2 | ||||||||
3.51%, 08/01/2046 (Acquired 10/28/2013, Cost $992,836) (a) | 967,968 | 995,158 | ||||||
Fremont Home Loan Trust 2004-2 | ||||||||
1.02%, 07/25/2034 | 1,229,294 | 1,052,096 | ||||||
FRT 2013-1 Trust | ||||||||
4.21%, 10/25/2018 (Acquired 11/8/2013, Cost $495,448) (b) | 495,479 | 495,615 | ||||||
3.96%, 10/25/2033 (Acquired 11/8/2013, Cost $1,036,490) (b) | 1,036,594 | 1,046,907 | ||||||
GE Capital Mortgage Services Inc 1999-HE1 Trust | ||||||||
6.27%, 04/25/2029 | 523 | 521 | ||||||
6.71%, 04/25/2029 | 75,512 | 74,128 | ||||||
GE Equipment Midticket LLC | ||||||||
0.47%, 01/22/2015 | 301,555 | 301,585 | ||||||
0.60%, 05/23/2016 | 1,280,000 | 1,279,304 | ||||||
0.78%, 09/22/2020 | 433,000 | 432,689 | ||||||
GE Equipment Transportation LLC Series 2012-2 | ||||||||
0.47%, 04/24/2015 | 291,098 | 291,059 | ||||||
GE Mortgage Services LLC | ||||||||
6.74%, 12/25/2028 | 16 | 16 | ||||||
GMAT 2013-1 Trust | ||||||||
3.97%, 11/25/2043 (Acquired 11/6/2013, Cost $1,408,877) (a) | 1,408,877 | 1,408,877 | ||||||
GSAA Home Equity Trust 2006-3 | ||||||||
0.24%, 03/25/2036 | 18,339 | 10,079 | ||||||
HLSS Servicer Advance Receivables Backed Notes | ||||||||
0.90%, 01/15/2044 (Acquired 10/28/2013, Cost $1,722,586) (a) | 1,725,000 | 1,725,000 | ||||||
1.64%, 01/15/2044 (Acquired 10/28/2013, Cost $309,753) (a) | 310,000 | 310,000 | ||||||
2.49%, 01/15/2044 (Acquired 10/28/2013, Cost $174,896) (a) | 175,000 | 175,052 | ||||||
1.99%, 10/15/2045 (Acquired 10/28/2013, Cost $1,260,176) (a) | 1,255,000 | 1,263,283 | ||||||
1.50%, 01/16/2046 (Acquired 10/28/2013, Cost $1,470,441) (a) | 1,482,000 | 1,476,517 | ||||||
HLSS Servicer Advance Receivables Backed Notes Series 2013-T2 | ||||||||
1.15%, 05/16/2044 (Acquired 10/28/2013, Cost $850,316) (a) | 857,000 | 852,544 | ||||||
HLSS Servicer Advance Receivables Backed Notes Series 2013-T7 | ||||||||
1.79%, 11/15/2046 (Acquired 11/22/2013, Cost $1,782,996) (a) | 1,783,000 | 1,779,969 | ||||||
Home Equity Mortgage Loan Asset-Backed Trust Series INABS 2006-A | ||||||||
0.36%, 03/25/2036 | 106,483 | 79,105 | ||||||
Honda Auto Receivables 2011-1 Owner Trust | ||||||||
1.80%, 04/17/2017 | 447,032 | 448,966 | ||||||
Honda Auto Receivables 2012-1 Owner Trust | ||||||||
0.97%, 04/16/2018 | 349,000 | 351,178 |
HSBC Home Equity Loan Trust USA 2006-1 | ||||||||
0.32%, 01/20/2036 | 349,805 | 340,793 | ||||||
HSBC Home Equity Loan Trust USA 2006-2 | ||||||||
0.31%, 03/20/2036 | 150,797 | 147,347 | ||||||
HSBC Home Equity Loan Trust USA 2007-1 | ||||||||
0.36%, 03/20/2036 | 63,122 | 61,671 | ||||||
HSBC Home Equity Loan Trust USA 2007-3 | ||||||||
1.36%, 11/20/2036 | 796,812 | 790,749 | ||||||
Huntington Auto Trust 2011-1 | ||||||||
1.01%, 01/15/2016 (Acquired 10/28/2013, Cost $351,937) (a) | 351,079 | 351,924 | ||||||
1.31%, 11/15/2016 (Acquired 10/28/2013, Cost $895,828) (a) | 888,000 | 895,953 | ||||||
Huntington Auto Trust 2012-1 | ||||||||
0.81%, 09/15/2016 | 542,382 | 543,716 | ||||||
Hyundai Auto Receivables Trust 2010-B | ||||||||
1.63%, 03/15/2017 | 631,064 | 636,764 | ||||||
Hyundai Auto Receivables Trust 2011-B | ||||||||
1.65%, 02/15/2017 | 598,000 | 603,236 | ||||||
Imc Home Equity Loan Trust 1997-5 | ||||||||
6.88%, 11/20/2028 | 1,295 | 1,293 | ||||||
ING Investment Management Co | ||||||||
1.69%, 01/18/2026 | 7,400,000 | 7,400,000 | ||||||
2.04%, 01/18/2026 | 9,000,000 | 8,853,210 | ||||||
John Deere Owner Trust 2011 | ||||||||
1.29%, 01/15/2016 | 71,379 | 71,444 | ||||||
1.96%, 04/16/2018 | 404,000 | 406,708 | ||||||
John Deere Owner Trust 2012-B | ||||||||
0.43%, 02/17/2015 | 260,477 | 260,485 | ||||||
0.69%, 01/15/2019 | 675,000 | 673,092 | ||||||
JP Morgan Mortgage Acquisition Trust 2007-CH1 | ||||||||
0.29%, 11/25/2036 | 442,494 | 437,534 | ||||||
Kondaur Mortgage Asset Trust 2013-1 LLC | ||||||||
4.46%, 08/25/2052 (Acquired 10/28/2013, Cost $1,220,427) (a) | 1,173,025 | 1,175,019 | ||||||
Lake Country Mortgage Loan Trust 2006-HE1 | ||||||||
0.51%, 07/25/2034 (Acquired 10/28/2013, Cost $547,454) (a) | 553,228 | 549,515 | ||||||
Long Beach Mortgage Loan Trust 2004-1 | ||||||||
0.91%, 02/25/2034 | 2,253,000 | 2,098,075 |
Long Beach Mortgage Loan Trust 2004-3 | ||||||||
1.02%, 07/25/2034 | 149,742 | 143,282 | ||||||
Long Beach Mortgage Loan Trust 2006-WL2 | ||||||||
0.36%, 01/25/2036 | 120,392 | 109,789 | ||||||
Macquarie Equipment Funding Trust 2012-A | ||||||||
0.61%, 04/20/2015 (Acquired 10/28/2013, Cost $1,685,338) (a) | 1,689,040 | 1,685,405 | ||||||
Madison Avenue Manufactured Housing Contract Trust 2002-A | ||||||||
2.41%, 03/25/2032 | 674,624 | 674,014 | ||||||
Mastr Asset Backed Securities Trust 2005-HE1 | ||||||||
0.88%, 05/25/2035 | 2,000,000 | 1,920,926 | ||||||
Mercedes-Benz Auto Receivables Trust 2011-1 | ||||||||
0.85%, 03/16/2015 | 45,538 | 45,570 | ||||||
Mid-State Capital Corp 2006-1 Trust | ||||||||
6.08%, 10/15/2040 (Acquired 10/28/2013, Cost $1,139,205) (a) | 1,148,392 | 1,139,083 | ||||||
Mid-State Capital Trust 2010-1 | ||||||||
3.50%, 12/15/2045 (Acquired 10/28/2013, Cost $621,890) (a) | 603,801 | 621,835 | ||||||
5.25%, 12/15/2045 (Acquired 10/28/2013, Cost $1,128,219) (a) | 1,086,517 | 1,128,095 | ||||||
MMCA Auto Owner Trust 2012-A | ||||||||
1.57%, 08/15/2017 (Acquired 10/28/2013, Cost $2,210,077) (a) | 2,198,000 | 2,209,770 | ||||||
Morgan Stanley ABS Capital I Inc Trust 2004-OP1 | ||||||||
1.03%, 11/25/2034 | 970,641 | 857,143 | ||||||
Nationstar Agency Advance Funding Trust 2013-T1A | ||||||||
1.00%, 02/15/2045 (Acquired 10/28/2013, Cost $950,150) (a) | 956,000 | 950,924 | ||||||
1.25%, 02/15/2045 (Acquired 10/28/2013, Cost $205,004) (a) | 206,000 | 205,141 | ||||||
Nationstar Agency Advance Funding Trust 2013-T2A | ||||||||
1.89%, 02/18/2048 (Acquired 10/28/2013, Cost $372,246) (a) | 381,000 | 371,326 | ||||||
Nationstar Home Equity Loan Trust 2006-B | ||||||||
0.33%, 09/25/2036 | 1,279,673 | 1,246,006 | ||||||
Nationstar Mortgage Advance Receivables Trust 2013-T2 | ||||||||
1.68%, 06/20/2046 (Acquired 10/28/2013, Cost $1,102,559) (a) | 1,104,000 | 1,102,322 | ||||||
Navitas Equipment Receivables LLC 2013-1 | ||||||||
1.95%, 11/15/2016 (Acquired 10/31/2013, Cost $938,550) (a) | 938,561 | 938,246 | ||||||
New Century Home Equity Loan Trust Series 2003-5 | ||||||||
5.10%, 11/25/2033 | 413,000 | 419,376 | ||||||
Newcastle Investment Trust 2011-MH1 | ||||||||
2.45%, 12/10/2033 (Acquired 10/28/2013, Cost $231,534) (a) | 229,078 | 231,292 | ||||||
Nissan Auto Receivables 2012-A Owner Trust | ||||||||
1.00%, 07/16/2018 | 344,000 | 346,354 |
Normandy Mortgage Loan Co 2013-NPL3 LLC | ||||||||
4.95%, 09/16/2043 (Acquired 10/28/2013, Cost $1,603,632) (a) | 1,603,631 | 1,617,262 | ||||||
Oakwood Mortgage Investors Inc | ||||||||
6.45%, 11/15/2017 | 5,466 | 5,706 | ||||||
Option One Mortgage Loan Trust | ||||||||
1.00%, 02/25/2033 | 21,565 | 19,828 | ||||||
Option One Mortgage Loan Trust 2004-3 | ||||||||
1.06%, 11/25/2034 | 1,691,802 | 1,508,320 | ||||||
Park Place Securities Inc Asset-Backed Pass-Through Certificates Series 2004-MCW | ||||||||
1.10%, 10/25/2034 | 1,449,610 | 1,439,861 | ||||||
Park Place Securities Inc Asset-Backed Pass-Through Certificates Series 2005-WCH | ||||||||
0.72%, 01/25/2036 | 2,800,000 | 2,579,976 | ||||||
RAAC Series 2004-SP1 Trust | ||||||||
5.29%, 08/25/2027 | 32,758 | 32,749 | ||||||
RAMP Series 2003-RS7 Trust | ||||||||
5.34%, 08/25/2033 | 78,868 | 79,106 | ||||||
RAMP Series 2004-RS11 Trust | ||||||||
0.78%, 11/25/2034 | 503,815 | 489,610 | ||||||
RAMP Series 2005-EFC5 Trust | ||||||||
0.50%, 10/25/2035 | 831,781 | 818,749 | ||||||
RAMP Series 2005-RS1 Trust | ||||||||
4.71%, 01/25/2035 | 32,037 | 31,382 | ||||||
RAMP Series 2006-RZ1 Trust | ||||||||
0.46%, 03/25/2036 | 2,443,273 | 2,301,245 | ||||||
RASC Series 2002-KS4 Trust | ||||||||
0.66%, 07/25/2032 | 6,174 | 5,275 | ||||||
RASC Series 2003-KS2 Trust | ||||||||
3.99%, 04/25/2033 | 99,059 | 98,991 | ||||||
RASC Series 2003-KS5 Trust | ||||||||
0.74%, 07/25/2033 | 7,935 | 6,589 | ||||||
3.62%, 07/25/2033 | 5,881 | 5,625 | ||||||
RASC Series 2003-KS9 Trust | ||||||||
0.80%, 11/25/2033 | 9,324 | 7,350 | ||||||
RASC Series 2004-KS2 Trust | ||||||||
4.30%, 03/25/2034 | 12,173 | 12,312 | ||||||
RASC Series 2005-KS6 Trust | ||||||||
0.78%, 07/25/2035 | 1,550,000 | 1,401,298 |
RASC Series 2005-KS9 Trust | ||||||||
0.53%, 10/25/2035 | 6,312 | 6,301 | ||||||
Renaissance Home Equity Loan Trust | ||||||||
5.61%, 04/25/2037 | 315,953 | 165,592 | ||||||
Salomon Brothers Mortgage Securities VII Inc | ||||||||
3.95%, 04/25/2032 (Acquired 10/28/2013, Cost $76,037) (a) | 77,586 | 76,000 | ||||||
Santander Drive Auto Receivables Trust | ||||||||
0.47%, 09/15/2015 | 460,350 | 460,331 | ||||||
0.62%, 07/15/2016 | 447,000 | 447,237 | ||||||
Santander Drive Auto Receivables Trust 2011-1 | ||||||||
2.35%, 11/16/2015 | 612,835 | 615,616 | ||||||
Santander Drive Auto Receivables Trust 2011-S2 | ||||||||
1.83%, 11/17/2014 (Acquired 10/28/2013, Cost $8,674) (a) | 8,664 | 8,670 | ||||||
2.06%, 06/15/2017 (Acquired 10/28/2013, Cost $105,343) (a) | 105,280 | 105,284 | ||||||
2.39%, 06/15/2017 (Acquired 10/28/2013, Cost $477,502) (a) | 474,000 | 477,619 | ||||||
3.35%, 06/15/2017 (Acquired 10/28/2013, Cost $1,728) (a) | 1,724 | 1,727 | ||||||
Santander Drive Auto Receivables Trust 2012-1 | ||||||||
1.49%, 10/15/2015 | 229,484 | 229,835 | ||||||
Santander Drive Auto Receivables Trust 2012-2 | ||||||||
0.91%, 05/15/2015 | 870 | 870 | ||||||
1.22%, 12/15/2015 | 378,000 | 378,586 | ||||||
Santander Drive Auto Receivables Trust 2012-3 | ||||||||
1.08%, 04/15/2016 | 352,779 | 353,435 | ||||||
Santander Drive Auto Receivables Trust 2012-5 | ||||||||
0.57%, 12/15/2015 | 123,343 | 123,354 | ||||||
0.83%, 12/15/2016 | 421,000 | 421,087 | ||||||
Santander Drive Auto Receivables Trust 2013-1 | ||||||||
0.48%, 02/16/2016 | 419,903 | 419,886 | ||||||
Saxon Asset Securities Trust 2003-1 | ||||||||
4.80%, 06/25/2033 | 309,951 | 314,332 | ||||||
Securitized Asset Backed Receivables LLC Trust 2006-CB1 | ||||||||
3.64%, 01/25/2036 | 89,640 | 56,225 | ||||||
SNAAC Auto Receivables Trust | ||||||||
1.78%, 06/15/2016 (Acquired 10/28/2013, Cost $73,846) (a) | 73,691 | 73,786 | ||||||
SNAAC Auto Receivables Trust 2013-1 | ||||||||
1.14%, 07/16/2018 (Acquired 10/28/2013, Cost $335,879) (a) | 336,138 | 335,867 |
Specialty Underwriting & Residential Finance Trust Series 2004-BC4 | ||||||||
0.83%, 10/25/2035 | 611,939 | 595,044 | ||||||
SpringCastle America Funding LLC | ||||||||
3.75%, 04/03/2021 (Acquired 10/28/2013, Cost $3,197,384) (a) | 3,206,361 | 3,212,386 | ||||||
Springleaf Funding Trust 2013-A | ||||||||
2.58%, 09/15/2021 (Acquired 10/28/2013, Cost $6,313,844) (a) | 6,347,000 | 6,337,765 | ||||||
Springleaf Funding Trust 2013-B | ||||||||
3.92%, 01/16/2023 (Acquired 10/28/2013, Cost $509,551) (a) | 516,000 | 523,740 | ||||||
4.82%, 01/16/2023 (Acquired 10/28/2013 through 12/20/2013, Cost $1,116,909) (a) | 1,140,000 | 1,132,134 | ||||||
Stanwich Mortgage Loan Co 2012-NPL4 LLC | ||||||||
2.98%, 09/15/2042 (Acquired 10/28/2013, Cost $1,335,301) (a) | 1,329,607 | 1,334,484 | ||||||
Stanwich Mortgage Loan Co 2012-NPL5 LLC | ||||||||
2.98%, 10/18/2042 (Acquired 10/28/2013, Cost $1,967,414) (a) | 1,968,398 | 1,967,413 | ||||||
Stanwich Mortgage Loan Trust | ||||||||
2.98%, 02/16/2043 (Acquired 10/28/2013, Cost $2,481,750) (a) | 2,457,493 | 2,481,247 | ||||||
Structured Asset Investment Loan Trust 2004-4 | ||||||||
0.96%, 04/25/2034 | 720,327 | 653,982 | ||||||
Structured Asset Investment Loan Trust 2005-5 | ||||||||
0.57%, 06/25/2035 | 43,830 | 43,807 | ||||||
Structured Asset Sec Corp Pass Through Cert Series 2002-al1 | ||||||||
3.45%, 02/25/2032 | 86,526 | 86,093 | ||||||
3.45%, 02/25/2032 | 234,228 | 231,066 | ||||||
Structured Asset Securities Corp Mortgage Loan Trust 2005-7XS | ||||||||
5.44%, 04/25/2035 | 70,443 | 72,820 | ||||||
Structured Asset Securities Corp Mortgage Pass-Through Ctfs Ser 2004-6XS | ||||||||
5.53%, 03/25/2034 | 383,150 | 386,264 | ||||||
5.55%, 03/25/2034 | 306,421 | 309,004 | ||||||
Structured Asset Secutities Corp Mor Pa Th Ce Se 2002 23XS | ||||||||
6.58%, 11/25/2032 | 164,966 | 172,935 | ||||||
Toyota Auto Receivables 2011-A Owner Trust | ||||||||
1.56%, 05/15/2015 | 455,264 | 456,917 | ||||||
Trafigura Securitisation Finance PLC | ||||||||
2.56%, 10/15/2015 (Acquired 10/28/2013, Cost $2,601,236) (a) | 2,569,000 | 2,600,237 | ||||||
United Auto Credit Securitization Trust 2012-1 | ||||||||
1.10%, 03/16/2015 (Acquired 10/28/2013, Cost $153,450) (a) | 153,455 | 153,442 | ||||||
USAA Auto Owner Trust | ||||||||
0.38%, 06/15/2015 | 77,414 | 77,402 |
Volkswagen Auto Lease Trust 2012-A | ||||||||
0.87%, 07/20/2015 | 1,141,931 | 1,144,465 | ||||||
VOLT NPL X LLC | ||||||||
3.96%, 11/25/2053 (Acquired 11/4/2013, Cost $721,174) (a) | 721,232 | 721,457 | ||||||
VOLT RLF XII Trust | ||||||||
4.21%, 04/25/2052 (Acquired 12/4/2013, Cost $1,486,280) (a) | 1,486,279 | 1,486,949 | ||||||
VOLT XIX LLC | ||||||||
3.63%, 04/25/2055 (Acquired 11/21/2013, Cost $2,172,798) (a) | 2,181,164 | 2,172,797 | ||||||
VOLT XX LLC | ||||||||
3.63%, 03/25/2054 (Acquired 12/11/2013, Cost $3,982,683) (a) | 4,000,000 | 3,982,680 | ||||||
VOLT XXI LLC | ||||||||
3.63%, 11/25/2053 (Acquired 12/18/2013, Cost $3,311,828) (a) | 3,325,000 | 3,312,531 | ||||||
Westgate Resorts 2012-1 LLC | ||||||||
4.50%, 09/20/2025 (Acquired 10/28/2013, Cost $1,386,377) (a) | 1,364,794 | 1,383,137 | ||||||
Westgate Resorts 2012-2 LLC | ||||||||
3.00%, 01/20/2025 (Acquired 10/28/2013, Cost $1,277,474) (a) | 1,274,577 | 1,284,532 | ||||||
Westgate Resorts LLC | ||||||||
2.50%, 03/20/2025 (Acquired 10/28/2013, Cost $817,291) (a) | 818,124 | 821,446 | ||||||
World Omni Automobile Lease Securitization Trust 2012-A | ||||||||
0.71%, 01/15/2015 | 70,143 | 70,160 | ||||||
0.93%, 11/16/2015 | 230,000 | 230,626 | ||||||
|
| |||||||
Total Asset Backed Obligations (Cost $250,027,631) | 249,820,217 | |||||||
|
| |||||||
Corporate Bonds - 25.98% | ||||||||
Basic Materials - 1.12% | ||||||||
Agrium Inc | ||||||||
6.13%, 01/15/2041 | $ | 2,850,000 | $ | 3,067,552 | ||||
Anglo American Capital PLC | ||||||||
9.38%, 04/08/2014 (Acquired 10/28/2013, Cost $439,386) (a) | 430,000 | 439,532 | ||||||
9.38%, 04/08/2019 (Acquired 10/28/2013, Cost $269,946) (a) | 215,000 | 272,427 | ||||||
BHP Billiton Finance USA Ltd | ||||||||
1.00%, 02/24/2015 | 194,000 | 195,064 | ||||||
5.40%, 03/29/2017 | 165,000 | 184,793 | ||||||
6.50%, 04/01/2019 | 284,000 | 340,485 | ||||||
3.85%, 09/30/2023 | 646,000 | 648,802 |
Dow Chemical Co/The | ||||||||
8.55%, 05/15/2019 | 211,000 | 272,442 | ||||||
4.25%, 11/15/2020 | 499,000 | 531,505 | ||||||
4.13%, 11/15/2021 | 326,000 | 336,747 | ||||||
3.00%, 11/15/2022 | 448,000 | 417,823 | ||||||
7.38%, 11/01/2029 | 139,000 | 178,631 | ||||||
5.25%, 11/15/2041 | 199,000 | 198,268 | ||||||
4.38%, 11/15/2042 | 2,380,000 | 2,089,716 | ||||||
Eastman Chemical Co | ||||||||
4.50%, 01/15/2021 | 5,175,000 | 5,314,383 | ||||||
Ecolab Inc | ||||||||
1.45%, 12/08/2017 | 5,928,000 | 5,792,966 | ||||||
5.50%, 12/08/2041 | 103,000 | 110,300 | ||||||
EI du Pont de Nemours & Co | ||||||||
4.88%, 04/30/2014 | 52,000 | 52,756 | ||||||
1.95%, 01/15/2016 | 382,000 | 389,795 | ||||||
6.00%, 07/15/2018 | 516,000 | 599,040 | ||||||
5.60%, 12/15/2036 | 155,000 | 166,835 | ||||||
4.90%, 01/15/2041 | 222,000 | 218,890 | ||||||
Freeport-McMoRan Copper & Gold Inc | ||||||||
2.15%, 03/01/2017 | 1,001,000 | 1,007,522 | ||||||
3.10%, 03/15/2020 | 620,000 | 602,350 | ||||||
3.55%, 03/01/2022 | 4,000,000 | 3,801,600 | ||||||
3.88%, 03/15/2023 | 103,000 | 97,401 | ||||||
5.45%, 03/15/2043 | 269,000 | 257,443 | ||||||
Georgia-Pacific LLC | ||||||||
5.40%, 11/01/2020 (Acquired 11/22/2013, Cost $3,570,230) (a) | 3,160,000 | 3,530,671 | ||||||
3.73%, 07/15/2023 (Acquired 12/10/2013, Cost $5,239,497) (a) | 5,380,000 | 5,178,164 | ||||||
Glencore Funding LLC | ||||||||
6.00%, 04/15/2014 (Acquired 10/28/2013, Cost $881,212) (a) | 869,000 | 881,496 | ||||||
2.50%, 01/15/2019 (Acquired 10/28/2013, Cost $517,733) (a) | 537,000 | 519,987 | ||||||
4.13%, 05/30/2023 (Acquired 12/02/2013, Cost $51,496) (a) | 54,000 | 50,464 | ||||||
International Paper Co | ||||||||
6.00%, 11/15/2041 | 3,150,000 | 3,420,761 | ||||||
Lubrizol Corp | ||||||||
8.88%, 02/01/2019 | 1,205,000 | 1,563,395 | ||||||
Mosaic Co/The | ||||||||
3.75%, 11/15/2021 | 227,000 | 222,207 | ||||||
4.25%, 11/15/2023 | 496,000 | 489,848 | ||||||
5.45%, 11/15/2033 | 814,000 | 829,342 | ||||||
4.88%, 11/15/2041 | 52,000 | 47,083 | ||||||
5.63%, 11/15/2043 | 2,650,000 | 2,688,377 |
Nucor Corp | ||||||||
4.00%, 08/01/2023 | 176,000 | 171,808 | ||||||
Placer Dome Inc | ||||||||
6.45%, 10/15/2035 | 203,000 | 187,609 | ||||||
Plum Creek Timberlands LP | ||||||||
5.88%, 11/15/2015 | 468,000 | 506,592 | ||||||
Potash Corp of Saskatchewan Inc | ||||||||
3.25%, 12/01/2017 | 31,000 | 32,348 | ||||||
6.50%, 05/15/2019 | 392,000 | 465,162 | ||||||
PPG Industries Inc | ||||||||
6.65%, 03/15/2018 | 645,000 | 745,873 | ||||||
9.00%, 05/01/2021 | 217,000 | 278,051 | ||||||
5.50%, 11/15/2040 | 118,000 | 123,000 | ||||||
Praxair Inc | ||||||||
4.38%, 03/31/2014 | 88,000 | 88,847 | ||||||
4.63%, 03/30/2015 | 196,000 | 205,909 | ||||||
5.20%, 03/15/2017 | 50,000 | 55,450 | ||||||
Rio Tinto Alcan Inc | ||||||||
5.75%, 06/01/2035 | 54,000 | 56,626 | ||||||
Rio Tinto Finance USA Ltd | ||||||||
8.95%, 05/01/2014 | 164,000 | 168,455 | ||||||
9.00%, 05/01/2019 | 797,000 | 1,040,581 | ||||||
3.50%, 11/02/2020 | 132,000 | 134,768 | ||||||
3.75%, 09/20/2021 | 388,000 | 391,724 | ||||||
Rio Tinto Finance USA PLC | ||||||||
1.63%, 08/21/2017 | 461,000 | 460,817 | ||||||
Samarco Mineracao SA | ||||||||
5.75%, 10/24/2023 (Acquired 10/28/2013, Cost $537,665) (a) | 537,000 | 531,630 | ||||||
Union Carbide Corp | ||||||||
7.50%, 06/01/2025 | 624,000 | 722,607 | ||||||
7.75%, 10/01/2096 | 681,000 | 743,570 | ||||||
Vale Overseas Ltd | ||||||||
4.38%, 01/11/2022 | 5,000,000 | 4,857,965 | ||||||
8.25%, 01/17/2034 | 424,000 | 488,424 | ||||||
6.88%, 11/21/2036 | 167,000 | 172,470 | ||||||
6.88%, 11/10/2039 | 107,000 | 110,683 |
Westvaco Corp | ||||||||
9.75%, 06/15/2020 | 17,000 | 21,505 | ||||||
8.20%, 01/15/2030 | 537,000 | 636,313 | ||||||
Xstrata Finance Canada Ltd | ||||||||
5.80%, 11/15/2016 (Acquired 10/28/2013 through 11/26/2013, Cost $206,554) (a) | 188,000 | 207,132 | ||||||
4.25%, 10/25/2022 (Acquired 11/20/2013, Cost $4,797,579) (a) | 5,000,000 | 4,767,406 | ||||||
Yara International ASA | ||||||||
5.25%, 12/15/2014 (Acquired 10/28/2013, Cost $699,895) (a) | 676,000 | 701,073 | ||||||
|
| |||||||
| 66,081,261 | ||||||||
|
| |||||||
Communications - 2.29% | ||||||||
21st Century Fox America Inc | ||||||||
8.00%, 10/17/2016 | 114,000 | 134,180 | ||||||
7.25%, 05/18/2018 | 203,000 | 245,189 | ||||||
8.88%, 04/26/2023 | 108,000 | 137,770 | ||||||
9.50%, 07/15/2024 | 175,000 | 228,984 | ||||||
7.30%, 04/30/2028 | 454,000 | 531,471 | ||||||
7.63%, 11/30/2028 | 310,000 | 384,506 | ||||||
6.20%, 12/15/2034 | 258,000 | 285,597 | ||||||
6.65%, 11/15/2037 | 310,000 | 361,851 | ||||||
6.90%, 08/15/2039 | 155,000 | 184,737 | ||||||
6.15%, 02/15/2041 | 3,790,000 | 4,224,050 | ||||||
America Movil SAB de CV | ||||||||
2.38%, 09/08/2016 | 441,000 | 453,864 | ||||||
5.00%, 10/16/2019 | 3,500,000 | 3,823,750 | ||||||
3.13%, 07/16/2022 | 374,000 | 345,257 | ||||||
6.13%, 03/30/2040 | 283,000 | 299,447 | ||||||
AT&T Inc | ||||||||
0.80%, 12/01/2015 | 116,000 | 115,707 | ||||||
0.90%, 02/12/2016 | 213,000 | 211,918 | ||||||
5.63%, 06/15/2016 | 237,000 | 261,549 | ||||||
1.40%, 12/01/2017 | 241,000 | 237,589 | ||||||
5.50%, 02/01/2018 | 302,000 | 339,955 | ||||||
4.45%, 05/15/2021 | 722,000 | 760,143 | ||||||
3.88%, 08/15/2021 | 134,000 | 135,755 | ||||||
6.30%, 01/15/2038 | 743,000 | 821,200 | ||||||
5.35%, 09/01/2040 | 1,094,000 | 1,082,439 | ||||||
4.30%, 12/15/2042 | 6,322,000 | 5,362,567 | ||||||
4.35%, 06/15/2045 | 511,000 | 432,608 |
BellSouth Corp | ||||||||
5.20%, 09/15/2014 | 604,000 | 623,699 | ||||||
BellSouth Telecommunications LLC | ||||||||
6.30%, 12/15/2015 | 76,161 | 79,853 | ||||||
British Telecommunications PLC | ||||||||
5.95%, 01/15/2018 | 289,000 | 330,462 | ||||||
9.63%, 12/15/2030 | 101,000 | 150,717 | ||||||
CBS Corp | ||||||||
1.95%, 07/01/2017 | 4,840,000 | 4,848,775 | ||||||
8.88%, 05/15/2019 | 181,000 | 231,414 | ||||||
5.75%, 04/15/2020 | 147,000 | 165,011 | ||||||
4.30%, 02/15/2021 | 155,000 | 157,794 | ||||||
7.88%, 09/01/2023 | 129,000 | 152,180 | ||||||
7.88%, 07/30/2030 | 622,000 | 773,880 | ||||||
5.50%, 05/15/2033 | 77,000 | 75,691 | ||||||
5.90%, 10/15/2040 | 67,000 | 67,945 | ||||||
Cellco Partnership / Verizon Wireless Capital LLC | ||||||||
8.50%, 11/15/2018 | 619,000 | 783,736 | ||||||
Centel Capital Corp | ||||||||
9.00%, 10/15/2019 | 464,000 | 550,115 | ||||||
CenturyLink Inc | ||||||||
5.15%, 06/15/2017 | 322,000 | 345,345 | ||||||
6.45%, 06/15/2021 | 970,000 | 1,008,800 | ||||||
7.60%, 09/15/2039 | 516,000 | 459,240 | ||||||
Cisco Systems Inc | ||||||||
5.50%, 02/22/2016 | 155,000 | 170,521 | ||||||
5.90%, 02/15/2039 | 515,000 | 572,565 | ||||||
5.50%, 01/15/2040 | 481,000 | 508,914 | ||||||
Comcast Cable Communications Holdings Inc | ||||||||
9.46%, 11/15/2022 | 542,000 | 750,711 | ||||||
Comcast Cable Communications LLC | ||||||||
8.88%, 05/01/2017 | 103,000 | 126,484 | ||||||
Comcast Cable Holdings LLC | ||||||||
10.13%, 04/15/2022 | 186,000 | 252,164 |
Comcast Corp | ||||||||
5.90%, 03/15/2016 | 134,000 | 147,988 | ||||||
6.50%, 01/15/2017 | 103,000 | 117,997 | ||||||
4.25%, 01/15/2033 | 1,895,000 | 1,760,301 | ||||||
6.50%, 11/15/2035 | 1,342,000 | 1,565,313 | ||||||
6.45%, 03/15/2037 | 310,000 | 359,768 | ||||||
6.95%, 08/15/2037 | 107,000 | 131,535 | ||||||
4.50%, 01/15/2043 | 5,000,000 | 4,516,595 | ||||||
COX Communications Inc | ||||||||
5.45%, 12/15/2014 | 86,000 | 89,874 | ||||||
3.25%, 12/15/2022 (Acquired 10/28/2013, Cost $317,164) (a) | 348,000 | 314,900 | ||||||
8.38%, 03/01/2039 (Acquired 10/28/2013, Cost $165,140) (a) | 134,000 | 162,512 | ||||||
Cox Enterprises Inc | ||||||||
7.38%, 07/15/2027 (Acquired 10/28/2013, Cost $321,045) (a) | 273,000 | 316,965 | ||||||
Crown Castle Towers LLC | ||||||||
3.21%, 08/15/2015 (Acquired 10/28/2013, Cost $291,814) (a) | 287,000 | 292,613 | ||||||
Deutsche Telekom International Finance BV | ||||||||
4.88%, 07/08/2014 | 433,000 | 442,200 | ||||||
2.25%, 03/06/2017 (Acquired 10/28/2013 through 12/11/2013, Cost $4,630,644) (a) | 4,529,000 | 4,593,516 | ||||||
6.00%, 07/08/2019 | 209,000 | 241,955 | ||||||
8.75%, 06/15/2030 | 648,000 | 914,187 | ||||||
4.88%, 03/06/2042 (Acquired 10/28/2013, Cost $233,049) (a) | 240,000 | 229,030 | ||||||
DIRECTV Holdings LLC / DIRECTV Financing Co Inc | ||||||||
4.60%, 02/15/2021 | 578,000 | 596,892 | ||||||
5.00%, 03/01/2021 | 446,000 | 468,527 | ||||||
3.80%, 03/15/2022 | 619,000 | 594,634 | ||||||
6.00%, 08/15/2040 | 2,146,000 | 2,119,177 | ||||||
6.38%, 03/01/2041 | 329,000 | 341,126 | ||||||
Discovery Communications LLC | ||||||||
4.38%, 06/15/2021 | 752,000 | 777,063 | ||||||
4.95%, 05/15/2042 | 261,000 | 242,429 | ||||||
eBay Inc | ||||||||
2.60%, 07/15/2022 | 236,000 | 217,056 | ||||||
4.00%, 07/15/2042 | 213,000 | 180,381 | ||||||
GTE Corp | ||||||||
6.84%, 04/15/2018 | 2,356,000 | 2,744,165 | ||||||
8.75%, 11/01/2021 | 114,000 | 144,314 | ||||||
6.94%, 04/15/2028 | 351,000 | 398,432 |
GTP Acquisition Partners I LLC | ||||||||
4.35%, 06/15/2016 (Acquired 10/28/2013, Cost $1,149,435) (a) | 1,087,000 | 1,144,026 | ||||||
Historic TW Inc | ||||||||
9.15%, 02/01/2023 | 347,000 | 460,150 | ||||||
NBCUniversal Media LLC | ||||||||
5.15%, 04/30/2020 | 287,000 | 320,793 | ||||||
4.38%, 04/01/2021 | 413,000 | 437,128 | ||||||
6.40%, 04/30/2040 | 372,000 | 427,662 | ||||||
5.95%, 04/01/2041 | 527,000 | 576,452 | ||||||
New Cingular Wireless Services Inc | ||||||||
8.75%, 03/01/2031 | 140,000 | 198,063 | ||||||
Nippon Telegraph & Telephone Corp | ||||||||
1.40%, 07/18/2017 | 237,000 | 234,146 | ||||||
Orange SA | ||||||||
2.75%, 09/14/2016 | 437,000 | 453,802 | ||||||
8.75%, 03/01/2031 | 655,000 | 904,341 | ||||||
Qwest Corp | ||||||||
6.75%, 12/01/2021 | 841,000 | 920,865 | ||||||
Rogers Communications Inc | ||||||||
4.10%, 10/01/2023 | 955,000 | 956,798 | ||||||
8.75%, 05/01/2032 | 258,000 | 334,483 | ||||||
SK Telecom Co Ltd | ||||||||
6.63%, 07/20/2027 (Acquired 10/28/2013 through 11/27/2013, Cost $436,999) (a) | 361,000 | 418,382 | ||||||
Sprint Capital Corp | ||||||||
6.90%, 05/01/2019 | 301,000 | 328,843 | ||||||
8.75%, 03/15/2032 | 38,000 | 40,755 | ||||||
TCI Communications Inc | ||||||||
8.75%, 08/01/2015 | 44,000 | 49,485 | ||||||
7.13%, 02/15/2028 | 138,000 | 169,720 | ||||||
Telecom Italia Capital SA | ||||||||
6.18%, 06/18/2014 | 178,000 | 182,005 | ||||||
7.00%, 06/04/2018 | 5,219,000 | 5,780,042 | ||||||
7.18%, 06/18/2019 | 215,000 | 241,338 | ||||||
7.20%, 07/18/2036 | 644,000 | 619,850 |
Telefonica Emisiones SAU | ||||||||
6.42%, 06/20/2016 | 468,000 | 521,516 | ||||||
6.22%, 07/03/2017 | 880,000 | 992,042 | ||||||
3.19%, 04/27/2018 | 221,000 | 225,070 | ||||||
5.88%, 07/15/2019 | 155,000 | 172,841 | ||||||
5.46%, 02/16/2021 | 233,000 | 245,848 | ||||||
Thomson Reuters Corp | ||||||||
4.70%, 10/15/2019 | 222,000 | 240,223 | ||||||
3.95%, 09/30/2021 | 934,000 | 930,517 | ||||||
4.50%, 05/23/2043 | 312,000 | 264,105 | ||||||
Time Warner Cable Inc | ||||||||
8.25%, 02/14/2014 | 164,000 | 165,408 | ||||||
5.85%, 05/01/2017 | 100,000 | 109,070 | ||||||
6.75%, 07/01/2018 | 470,000 | 527,076 | ||||||
8.75%, 02/14/2019 | 184,000 | 219,483 | ||||||
8.25%, 04/01/2019 | 222,000 | 260,074 | ||||||
6.55%, 05/01/2037 | 375,000 | 347,007 | ||||||
7.30%, 07/01/2038 | 253,000 | 252,286 | ||||||
6.75%, 06/15/2039 | 539,000 | 507,578 | ||||||
5.88%, 11/15/2040 | 475,000 | 410,897 | ||||||
5.50%, 09/01/2041 | 2,264,000 | 1,875,982 | ||||||
Time Warner Entertainment Co LP | ||||||||
8.38%, 03/15/2023 | 208,000 | 239,238 | ||||||
8.38%, 07/15/2033 | 671,000 | 731,042 | ||||||
Time Warner Inc | ||||||||
4.75%, 03/29/2021 | 585,000 | 623,828 | ||||||
7.63%, 04/15/2031 | 4,513,000 | 5,711,499 | ||||||
7.70%, 05/01/2032 | 842,000 | 1,081,103 | ||||||
6.50%, 11/15/2036 | 257,000 | 290,378 | ||||||
6.20%, 03/15/2040 | 323,000 | 355,836 | ||||||
6.25%, 03/29/2041 | 170,000 | 188,782 | ||||||
5.38%, 10/15/2041 | 181,000 | 183,082 | ||||||
5.35%, 12/15/2043 | 4,275,000 | 4,329,421 | ||||||
Verizon Communications Inc | ||||||||
5.55%, 02/15/2016 | 26,000 | 28,434 | ||||||
2.50%, 09/15/2016 | 199,000 | 205,773 | ||||||
5.50%, 02/15/2018 | 224,000 | 253,066 | ||||||
8.75%, 11/01/2018 | 101,000 | 129,237 | ||||||
4.50%, 09/15/2020 | 1,070,000 | 1,145,506 | ||||||
7.75%, 12/01/2030 | 1,817,000 | 2,320,752 |
6.40%, 09/15/2033 | 16,483,000 | 18,957,445 | ||||||
5.85%, 09/15/2035 | 149,000 | 158,188 | ||||||
6.40%, 02/15/2038 | 114,000 | 128,018 | ||||||
7.35%, 04/01/2039 | 454,000 | 563,865 | ||||||
6.55%, 09/15/2043 | 4,850,000 | 5,674,301 | ||||||
Verizon Maryland LLC | ||||||||
5.13%, 06/15/2033 | 103,000 | 97,655 | ||||||
Verizon New England Inc | ||||||||
7.88%, 11/15/2029 | 279,000 | 327,453 | ||||||
Verizon New York Inc | ||||||||
7.38%, 04/01/2032 | 91,000 | 103,166 | ||||||
Verizon Pennsylvania LLC | ||||||||
6.00%, 12/01/2028 | 439,000 | 432,361 | ||||||
8.35%, 12/15/2030 | 540,000 | 642,005 | ||||||
Viacom Inc | ||||||||
4.38%, 09/15/2014 | 2,401,000 | 2,463,620 | ||||||
1.25%, 02/27/2015 | 173,000 | 173,862 | ||||||
4.50%, 03/01/2021 | 62,000 | 64,871 | ||||||
3.88%, 12/15/2021 | 581,000 | 577,425 | ||||||
3.13%, 06/15/2022 | 224,000 | 206,929 | ||||||
3.25%, 03/15/2023 | 69,000 | 63,909 | ||||||
4.50%, 02/27/2042 | 209,000 | 178,312 | ||||||
4.38%, 03/15/2043 | 718,000 | 606,258 | ||||||
Vodafone Group PLC | ||||||||
5.00%, 09/15/2015 | 529,000 | 565,653 | ||||||
1.63%, 03/20/2017 | 857,000 | 856,696 | ||||||
1.50%, 02/19/2018 | 784,000 | 764,390 | ||||||
5.45%, 06/10/2019 | 78,000 | 88,665 | ||||||
|
| |||||||
| 134,587,720 | ||||||||
|
| |||||||
Consumer, Cyclical - 1.07% | ||||||||
Air Canada 2013-1 Class A Pass Through Trust | ||||||||
4.13%, 05/15/2025 (Acquired 10/28/2013, Cost $379,784) (a) | 398,000 | 388,050 | ||||||
American Airlines 2011-1 Class A Pass Through Trust | ||||||||
5.25%, 01/31/2021 | 148,148 | 156,666 | ||||||
American Airlines 2013-2 Class A Pass Through Trust | ||||||||
4.95%, 01/15/2023 (Acquired 10/28/2013 through 11/20/2013, Cost $5,393,442) (a) | 5,144,000 | 5,362,620 |
Arrow Electronics Inc | ||||||||
3.38%, 11/01/2015 | 336,000 | 347,721 | ||||||
3.00%, 03/01/2018 | 197,000 | 197,101 | ||||||
6.88%, 06/01/2018 | 279,000 | 316,118 | ||||||
6.00%, 04/01/2020 | 478,000 | 509,766 | ||||||
4.50%, 03/01/2023 | 183,000 | 175,994 | ||||||
7.50%, 01/15/2027 | 992,000 | 1,139,230 | ||||||
Continental Airlines 1997-4 Class A Pass Through Trust | ||||||||
6.90%, 01/02/2018 | 28,400 | 30,104 | ||||||
Continental Airlines 1999-2 Class A-1 Pass Through Trust | ||||||||
7.26%, 03/15/2020 | 50,464 | 56,142 | ||||||
Continental Airlines 2007-1 Class A Pass Through Trust | ||||||||
5.98%, 04/19/2022 | 3,034,817 | 3,315,538 | ||||||
Continental Airlines 2012-2 Class A Pass Through Trust | ||||||||
4.00%, 10/29/2024 | 219,000 | 217,905 | ||||||
CVS Caremark Corp | ||||||||
4.00%, 12/05/2023 | 6,000,000 | 5,987,304 | ||||||
6.13%, 09/15/2039 | 206,000 | 233,628 | ||||||
5.75%, 05/15/2041 | 701,000 | 765,049 | ||||||
5.30%, 12/05/2043 | 6,120,000 | 6,329,078 | ||||||
CVS Pass-Through Trust | ||||||||
5.93%, 01/10/2034 (Acquired 10/28/2013, Cost $789,158) (a) | 712,464 | 776,486 | ||||||
Daimler Finance North America LLC | ||||||||
1.65%, 04/10/2015 (Acquired 10/28/2013, Cost $1,200,097) (a) | 1,189,000 | 1,198,210 | ||||||
2.63%, 09/15/2016 (Acquired 10/28/2013, Cost $559,071) (a) | 542,000 | 560,483 | ||||||
2.95%, 01/11/2017 (Acquired 10/28/2013, Cost $1,048,687) (a) | 1,011,000 | 1,043,957 | ||||||
1.88%, 01/11/2018 (Acquired 10/28/2013 through 12/10/2013, Cost $3,075,245) (a) | 3,080,000 | 3,033,929 | ||||||
2.38%, 08/01/2018 (Acquired 10/28/2013, Cost $196,143) (a) | 195,000 | 194,569 | ||||||
2.25%, 07/31/2019 (Acquired 11/19/2013 through 11/20/2013, Cost $3,215,206) (a) | 3,250,000 | 3,185,302 | ||||||
8.50%, 01/18/2031 | 155,000 | 225,050 | ||||||
Delta Air Lines 2010-2 Class A Pass Through Trust | ||||||||
4.95%, 05/23/2019 | 363,906 | 392,109 | ||||||
Delta Air Lines 2011-1 Class A Pass Through Trust | ||||||||
5.30%, 04/15/2019 | 119,754 | 130,532 | ||||||
Delta Air Lines 2012-1 Class A Pass Through Trust | ||||||||
4.75%, 05/07/2020 | 376,622 | 402,985 | ||||||
DR Horton Inc | ||||||||
6.50%, 04/15/2016 | 107,000 | 116,898 |
Ford Motor Co | ||||||||
4.75%, 01/15/2043 | 6,130,000 | 5,528,488 | ||||||
Gap Inc/The | ||||||||
5.95%, 04/12/2021 | 391,000 | 432,044 | ||||||
Home Depot Inc/The | ||||||||
5.40%, 03/01/2016 | 475,000 | 521,021 | ||||||
4.40%, 04/01/2021 | 77,000 | 83,158 | ||||||
5.88%, 12/16/2036 | 5,490,000 | 6,334,900 | ||||||
Johnson Controls Inc | ||||||||
4.25%, 03/01/2021 | 344,000 | 357,423 | ||||||
3.75%, 12/01/2021 | 475,000 | 471,590 | ||||||
6.00%, 01/15/2036 | 107,000 | 114,997 | ||||||
5.25%, 12/01/2041 | 722,000 | 701,891 | ||||||
Kohl’s Corp | ||||||||
6.25%, 12/15/2017 | 103,000 | 118,125 | ||||||
Lowe’s Cos Inc | ||||||||
7.11%, 05/15/2037 | 361,000 | 445,434 | ||||||
5.13%, 11/15/2041 | 238,000 | 244,774 | ||||||
4.65%, 04/15/2042 | 449,000 | 434,230 | ||||||
Macy’s Retail Holdings Inc | ||||||||
7.45%, 07/15/2017 | 134,000 | 156,712 | ||||||
2.88%, 02/15/2023 | 421,000 | 381,015 | ||||||
4.38%, 09/01/2023 | 192,000 | 192,723 | ||||||
5.13%, 01/15/2042 | 101,000 | 96,380 | ||||||
Newell Rubbermaid Inc | ||||||||
4.70%, 08/15/2020 | 310,000 | 325,144 | ||||||
Nissan Motor Acceptance Corp | ||||||||
1.80%, 03/15/2018 (Acquired 10/28/2013, Cost $714,844) (a) | 727,000 | 709,772 | ||||||
Nordstrom Inc | ||||||||
4.00%, 10/15/2021 | 398,000 | 412,791 | ||||||
PACCAR Financial Corp | ||||||||
1.60%, 03/15/2017 | 407,000 | 406,414 | ||||||
0.84%, 12/06/2018 | 3,000,000 | 3,004,308 | ||||||
Target Corp | ||||||||
6.00%, 01/15/2018 | 217,000 | 250,599 |
Toyota Motor Credit Corp | ||||||||
3.20%, 06/17/2015 | 572,000 | 594,847 | ||||||
2.00%, 09/15/2016 | 1,600,000 | 1,645,775 | ||||||
2.05%, 01/12/2017 | 402,000 | 410,841 | ||||||
1.75%, 05/22/2017 | 516,000 | 518,434 | ||||||
US Airways 1998-1A Pass Through Trust | ||||||||
6.85%, 01/30/2018 | 25,593 | 26,744 | ||||||
Walgreen Co | ||||||||
3.10%, 09/15/2022 | 871,000 | 816,552 | ||||||
Wal-Mart Stores Inc | ||||||||
7.55%, 02/15/2030 | 72,000 | 96,926 | ||||||
5.25%, 09/01/2035 | 124,000 | 134,704 | ||||||
6.20%, 04/15/2038 | 108,000 | 129,800 | ||||||
|
| |||||||
| 62,887,080 | ||||||||
|
| |||||||
Consumer, Non-cyclical - 2.72% | ||||||||
AbbVie Inc | ||||||||
1.75%, 11/06/2017 | 866,000 | 864,517 | ||||||
2.90%, 11/06/2022 | 574,000 | 536,492 | ||||||
4.40%, 11/06/2042 | 3,600,000 | 3,357,626 | ||||||
Actavis Inc | ||||||||
3.25%, 10/01/2022 | 271,000 | 252,767 | ||||||
4.63%, 10/01/2042 | 3,330,000 | 3,029,634 | ||||||
ADT Corp/The | ||||||||
3.50%, 07/15/2022 | 577,000 | 502,251 | ||||||
4.13%, 06/15/2023 | 217,000 | 192,590 | ||||||
4.88%, 07/15/2042 | 323,000 | 243,059 | ||||||
Aetna Inc | ||||||||
6.50%, 09/15/2018 | 4,000,000 | 4,711,748 | ||||||
6.75%, 12/15/2037 | 341,000 | 415,858 | ||||||
4.50%, 05/15/2042 | 205,000 | 190,570 | ||||||
Amgen Inc | ||||||||
5.70%, 02/01/2019 | 204,000 | 235,090 | ||||||
4.50%, 03/15/2020 | 123,000 | 131,881 | ||||||
3.88%, 11/15/2021 | 722,000 | 741,631 | ||||||
5.75%, 03/15/2040 | 5,865,000 | 6,283,831 | ||||||
4.95%, 10/01/2041 | 464,000 | 440,830 | ||||||
5.15%, 11/15/2041 | 1,496,000 | 1,490,444 | ||||||
5.65%, 06/15/2042 | 242,000 | 256,287 |
Anheuser-Busch Cos LLC | ||||||||
5.50%, 01/15/2018 | 103,000 | 117,090 | ||||||
5.75%, 04/01/2036 | 114,000 | 127,113 | ||||||
Anheuser-Busch InBev Worldwide Inc | ||||||||
7.75%, 01/15/2019 | 728,000 | 909,024 | ||||||
Archer-Daniels-Midland Co | ||||||||
5.94%, 10/01/2032 | 227,000 | 251,290 | ||||||
Baxter International Inc | ||||||||
4.63%, 03/15/2015 | 52,000 | 54,509 | ||||||
1.85%, 06/15/2018 | 183,000 | 180,711 | ||||||
3.65%, 08/15/2042 | 1,900,000 | 1,576,076 | ||||||
Becton Dickinson and Co | ||||||||
5.00%, 05/15/2019 | 72,000 | 80,731 | ||||||
Bunge Ltd Finance Corp | ||||||||
5.10%, 07/15/2015 | 138,000 | 146,079 | ||||||
8.50%, 06/15/2019 | 4,456,000 | 5,474,120 | ||||||
Bunge NA Finance LP | ||||||||
5.90%, 04/01/2017 | 470,000 | 513,163 | ||||||
Cargill Inc | ||||||||
6.00%, 11/27/2017 (Acquired 10/28/2013, Cost $184,146) (a) | 160,000 | 182,690 | ||||||
7.35%, 03/06/2019 (Acquired 10/28/2013, Cost $360,997) (a) | 294,000 | 355,864 | ||||||
4.31%, 05/14/2021 (Acquired 10/28/2013, Cost $300,452) (a) | 281,000 | 291,607 | ||||||
3.30%, 03/01/2022 (Acquired 12/28/2013, Cost $791,781) (a) | 800,000 | 765,303 | ||||||
Celgene Corp | ||||||||
3.25%, 08/15/2022 | 1,020,000 | 965,692 | ||||||
4.00%, 08/15/2023 | 298,000 | 293,410 | ||||||
Cigna Corp | ||||||||
5.38%, 02/15/2042 | 3,040,000 | 3,160,691 | ||||||
Coca-Cola Co/The | ||||||||
4.88%, 03/15/2019 | 160,000 | 179,360 | ||||||
Coca-Cola Femsa SAB de CV | ||||||||
2.38%, 11/26/2018 | 9,890,000 | 9,816,933 | ||||||
ConAgra Foods Inc | ||||||||
1.30%, 01/25/2016 | 235,000 | 235,407 | ||||||
5.82%, 06/15/2017 | 181,000 | 203,986 | ||||||
2.10%, 03/15/2018 | 238,000 | 235,384 | ||||||
4.95%, 08/15/2020 | 215,000 | 230,823 | ||||||
9.75%, 03/01/2021 | 1,750,000 | 2,258,967 | ||||||
7.00%, 10/01/2028 | 1,250,000 | 1,467,404 |
Diageo Capital PLC | ||||||||
1.50%, 05/11/2017 | 405,000 | 404,126 | ||||||
4.83%, 07/15/2020 | 287,000 | 317,810 | ||||||
Diageo Finance BV | ||||||||
5.30%, 10/28/2015 | 222,000 | 240,327 | ||||||
Diageo Investment Corp | ||||||||
8.00%, 09/15/2022 | 516,000 | 672,293 | ||||||
ERAC USA Finance LLC | ||||||||
2.25%, 01/10/2014 (Acquired 10/28/2013, Cost $282,107) (a) | 282,000 | 282,085 | ||||||
2.75%, 03/15/2017 (Acquired 10/28/2013, Cost $283,687) (a) | 275,000 | 282,858 | ||||||
6.38%, 10/15/2017 (Acquired 10/28/2013, Cost $47,532) (a) | 41,000 | 47,445 | ||||||
4.50%, 08/16/2021 (Acquired 10/28/2013, Cost $422,090) (a) | 400,000 | 416,858 | ||||||
6.70%, 06/01/2034 (Acquired 10/28/2013, Cost $584,379) (a) | 508,000 | 563,885 | ||||||
5.63%, 03/15/2042 (Acquired 10/28/2013, Cost $369,169) (a) | 357,000 | 364,622 | ||||||
Express Scripts Holding Co | ||||||||
2.65%, 02/15/2017 | 7,518,000 | 7,748,615 | ||||||
4.75%, 11/15/2021 | 4,000,000 | 4,226,656 | ||||||
FBG Finance Pty Ltd | ||||||||
5.13%, 06/15/2015 (Acquired 10/28/2013, Cost $434,827) (a) | 410,000 | 434,996 | ||||||
Fomento Economico Mexicano SAB de CV | ||||||||
4.38%, 05/10/2043 | 526,000 | 433,984 | ||||||
Gilead Sciences Inc | ||||||||
5.65%, 12/01/2041 | 2,910,000 | 3,239,520 | ||||||
GlaxoSmithKline Capital Inc | ||||||||
5.65%, 05/15/2018 | 320,000 | 368,365 | ||||||
6.38%, 05/15/2038 | 217,000 | 265,597 | ||||||
Health Management Associates Inc | ||||||||
6.13%, 04/15/2016 | 3,145,000 | 3,483,087 | ||||||
Heineken NV | ||||||||
1.40%, 10/01/2017 (Acquired 10/28/2013, Cost $295,660) (a) | 299,000 | 293,341 | ||||||
Hospira Inc | ||||||||
6.05%, 03/30/2017 | 537,000 | 592,520 | ||||||
Humana Inc | ||||||||
7.20%, 06/15/2018 | 215,000 | 254,356 |
Johnson & Johnson | ||||||||
4.38%, 12/05/2033 | 1,070,000 | 1,076,966 | ||||||
4.50%, 12/05/2043 | 3,650,000 | 3,623,231 | ||||||
Kellogg Co | ||||||||
1.75%, 05/17/2017 | 262,000 | 261,690 | ||||||
3.25%, 05/21/2018 | 234,000 | 243,353 | ||||||
3.13%, 05/17/2022 | 437,000 | 414,322 | ||||||
Kimberly-Clark Corp | ||||||||
7.50%, 11/01/2018 | 52,000 | 64,458 | ||||||
2.40%, 03/01/2022 | 140,000 | 130,133 | ||||||
Kraft Foods Group Inc | ||||||||
6.13%, 08/23/2018 | 531,000 | 618,946 | ||||||
5.38%, 02/10/2020 | 318,000 | 358,768 | ||||||
3.50%, 06/06/2022 | 588,000 | 573,061 | ||||||
6.88%, 01/26/2039 | 1,049,000 | 1,277,514 | ||||||
6.50%, 02/09/2040 | 310,000 | 361,522 | ||||||
5.00%, 06/04/2042 | 505,000 | 497,825 | ||||||
Kroger Co/The | ||||||||
7.50%, 01/15/2014 | 230,000 | 230,525 | ||||||
2.20%, 01/15/2017 | 399,000 | 403,853 | ||||||
6.40%, 08/15/2017 | 62,000 | 71,036 | ||||||
6.15%, 01/15/2020 | 206,000 | 234,787 | ||||||
7.50%, 04/01/2031 | 1,271,000 | 1,542,883 | ||||||
5.40%, 07/15/2040 | 95,000 | 94,008 | ||||||
5.00%, 04/15/2042 | 1,434,000 | 1,368,198 | ||||||
McKesson Corp | ||||||||
0.95%, 12/04/2015 | 144,000 | 143,907 | ||||||
Medco Health Solutions Inc | ||||||||
2.75%, 09/15/2015 | 223,000 | 230,197 | ||||||
Merck & Co Inc | ||||||||
1.30%, 05/18/2018 | 107,000 | 104,069 | ||||||
2.40%, 09/15/2022 | 376,000 | 343,451 | ||||||
2.80%, 05/18/2023 | 361,000 | 334,208 | ||||||
4.15%, 05/18/2043 | 4,000,000 | 3,654,360 | ||||||
Mondelez International Inc | ||||||||
5.38%, 02/10/2020 | 1,161,000 | 1,311,222 | ||||||
Mylan Inc/PA | ||||||||
6.00%, 11/15/2018 (Acquired 12/26/2013, Cost $707,543) (a) | 662,000 | 705,424 | ||||||
2.55%, 03/28/2019 | 600,000 | 594,012 | ||||||
7.88%, 07/15/2020 (Acquired 11/18/2013, Cost $5,678,044) (a) | 5,000,000 | 5,657,710 |
Novartis Capital Corp | ||||||||
2.40%, 09/21/2022 | 6,440,000 | 5,904,385 | ||||||
PepsiCo Inc | ||||||||
0.80%, 08/25/2014 | 96,000 | 96,244 | ||||||
1.25%, 08/13/2017 | 1,175,000 | 1,162,412 | ||||||
7.90%, 11/01/2018 | 24,000 | 30,000 | ||||||
3.00%, 08/25/2021 | 258,000 | 254,420 | ||||||
Perrigo Co Plc | ||||||||
2.30%, 11/08/2018 (Acquired 12/17/2013, Cost $4,220,425) (a) | 4,223,000 | 4,168,219 | ||||||
Pfizer Inc | ||||||||
3.00%, 06/15/2023 | 449,000 | 421,867 | ||||||
4.30%, 06/15/2043 | 4,170,000 | 3,921,260 | ||||||
Procter & Gamble - Esop | ||||||||
9.36%, 01/01/2021 | 201,387 | 256,798 | ||||||
Procter & Gamble Co/The | ||||||||
5.50%, 02/01/2034 | 103,000 | 115,135 | ||||||
Roche Holdings Inc | ||||||||
7.00%, 03/01/2039 (Acquired 11/26/2013, Cost $3,206,395) (a) | 2,400,000 | 3,147,252 | ||||||
RR Donnelley & Sons Co | ||||||||
8.60%, 08/15/2016 | 269,000 | 311,368 | ||||||
6.13%, 01/15/2017 | 11,000 | 11,990 | ||||||
7.63%, 06/15/2020 | 107,000 | 116,362 | ||||||
SABMiller Holdings Inc | ||||||||
1.85%, 01/15/2015 (Acquired 10/28/2013, Cost $395,228) (a) | 391,000 | 395,687 | ||||||
2.20%, 08/01/2018 (Acquired 12/17/2013, Cost $5,119,123) (a) | 5,080,000 | 5,072,024 | ||||||
3.75%, 01/15/2022 (Acquired 10/28/2013, Cost $493,342) (a) | 481,000 | 482,794 | ||||||
SABMiller PLC | ||||||||
5.70%, 01/15/2014 (Acquired 10/28/2013, Cost $475,902) (a) | 475,000 | 475,816 | ||||||
6.50%, 07/01/2016 (Acquired 10/28/2013, Cost $99,199) (a) | 88,000 | 99,278 | ||||||
UnitedHealth Group Inc | ||||||||
3.38%, 11/15/2021 | 685,000 | 676,548 | ||||||
2.75%, 02/15/2023 | 186,000 | 170,312 | ||||||
2.88%, 03/15/2023 | 310,000 | 288,457 | ||||||
6.63%, 11/15/2037 | 562,000 | 679,938 | ||||||
4.38%, 03/15/2042 | 5,170,000 | 4,724,119 |
Warner Chilcott Co LLC / Warner Chilcott Finance LLC | ||||||||
7.75%, 09/15/2018 | 6,250,000 | 6,765,625 | ||||||
WellPoint Inc | ||||||||
2.30%, 07/15/2018 | 289,000 | 286,706 | ||||||
3.13%, 05/15/2022 | 484,000 | 453,933 | ||||||
3.30%, 01/15/2023 | 271,000 | 252,901 | ||||||
4.63%, 05/15/2042 | 400,000 | 369,686 | ||||||
4.65%, 01/15/2043 | 391,000 | 361,989 | ||||||
5.10%, 01/15/2044 | 5,191,000 | 5,147,640 | ||||||
WM Wrigley Jr Co | ||||||||
2.90%, 10/21/2019 (Acquired 12/10/2013, Cost $4,986,034) (a) | 4,960,000 | 4,918,996 | ||||||
Wyeth LLC | ||||||||
6.45%, 02/01/2024 | 82,000 | 98,181 | ||||||
Zoetis Inc | ||||||||
4.70%, 02/01/2043 | 3,230,000 | 3,018,949 | ||||||
|
| |||||||
| 160,066,809 | ||||||||
|
| |||||||
Diversified - 0.14% | ||||||||
Hutchison Whampoa International 09 Ltd | ||||||||
7.63%, 04/09/2019 (Acquired 10/28/2013, Cost $741,553) (a) | 612,000 | 745,367 | ||||||
Hutchison Whampoa International 09/19 Ltd | ||||||||
5.75%, 09/11/2019 (Acquired 12/03/2013, Cost $7,042,938) (a) | 6,175,000 | 6,985,629 | ||||||
Hutchison Whampoa International 12 II Ltd | ||||||||
3.25%, 11/08/2022 (Acquired 10/28/2013, Cost $419,246) (a) | 450,000 | 411,596 | ||||||
|
| |||||||
| 8,142,592 | ||||||||
|
| |||||||
Energy - 3.07% | ||||||||
Alberta Energy Co Ltd | ||||||||
7.38%, 11/01/2031 | 274,000 | 321,697 | ||||||
Anadarko Finance Co | ||||||||
7.50%, 05/01/2031 | 206,000 | 250,457 | ||||||
Anadarko Holding Co | ||||||||
7.15%, 05/15/2028 | 170,000 | 197,118 | ||||||
Anadarko Petroleum Corp | ||||||||
7.63%, 03/15/2014 | 877,000 | 888,659 | ||||||
5.75%, 06/15/2014 | 42,000 | 42,881 | ||||||
6.38%, 09/15/2017 | 722,000 | 828,906 | ||||||
8.70%, 03/15/2019 | 664,000 | 840,671 | ||||||
6.95%, 06/15/2019 | 2,975,000 | 3,540,937 | ||||||
6.45%, 09/15/2036 | 4,125,000 | 4,632,107 | ||||||
0.00%, 10/10/2036 | 4,000,000 | 1,438,640 |
ANR Pipeline Co | ||||||||
9.63%, 11/01/2021 | 337,000 | 455,016 | ||||||
Apache Corp | ||||||||
6.90%, 09/15/2018 | 258,000 | 310,112 | ||||||
3.25%, 04/15/2022 | 99,000 | 97,540 | ||||||
4.75%, 04/15/2043 | 416,000 | 403,498 | ||||||
BP Capital Markets PLC | ||||||||
3.88%, 03/10/2015 | 568,000 | 590,889 | ||||||
1.85%, 05/05/2017 | 689,000 | 695,917 | ||||||
1.38%, 11/06/2017 | 229,000 | 225,518 | ||||||
4.74%, 03/11/2021 | 640,000 | 700,073 | ||||||
3.25%, 05/06/2022 | 262,000 | 253,947 | ||||||
2.75%, 05/10/2023 | 262,000 | 239,231 | ||||||
Buckeye Partners LP | ||||||||
2.65%, 11/15/2018 | 2,900,000 | 2,857,387 | ||||||
Burlington Resources Finance Co | ||||||||
7.40%, 12/01/2031 | 53,000 | 68,714 | ||||||
Burlington Resources Inc | ||||||||
8.20%, 03/15/2025 | 206,000 | 270,200 | ||||||
Cameron International Corp | ||||||||
1.60%, 04/30/2015 | 177,000 | 178,081 | ||||||
3.60%, 04/30/2022 | 5,900,000 | 5,780,826 | ||||||
4.00%, 12/15/2023 | 163,000 | 161,076 | ||||||
Canadian Natural Resources Ltd | ||||||||
5.90%, 02/01/2018 | 41,000 | 46,668 | ||||||
7.20%, 01/15/2032 | 41,000 | 49,125 | ||||||
6.45%, 06/30/2033 | 150,000 | 169,920 | ||||||
6.50%, 02/15/2037 | 118,000 | 133,410 | ||||||
6.25%, 03/15/2038 | 478,000 | 535,614 | ||||||
6.75%, 02/01/2039 | 206,000 | 243,797 | ||||||
Cenovus Energy Inc | ||||||||
3.00%, 08/15/2022 | 184,000 | 172,544 | ||||||
6.75%, 11/15/2039 | 351,000 | 411,415 | ||||||
4.45%, 09/15/2042 | 427,000 | 384,492 |
CenterPoint Energy Resources Corp | ||||||||
6.13%, 11/01/2017 | 55,000 | 63,130 | ||||||
4.50%, 01/15/2021 | 103,000 | 109,862 | ||||||
Chevron Corp | ||||||||
4.95%, 03/03/2019 | 526,000 | 596,646 | ||||||
2.43%, 06/24/2020 | 314,000 | 305,541 | ||||||
CNOOC Finance 2013 Ltd | ||||||||
3.00%, 05/09/2023 | 2,000,000 | 1,786,366 | ||||||
Conoco Funding Co | ||||||||
7.25%, 10/15/2031 | 54,000 | 69,739 | ||||||
ConocoPhillips | ||||||||
5.20%, 05/15/2018 | 155,000 | 174,902 | ||||||
5.75%, 02/01/2019 | 206,000 | 237,884 | ||||||
6.00%, 01/15/2020 | 150,000 | 175,967 | ||||||
6.50%, 02/01/2039 | 150,000 | 188,103 | ||||||
ConocoPhillips Canada Funding Co I | ||||||||
5.63%, 10/15/2016 | 126,000 | 140,977 | ||||||
Continental Resources Inc/OK | ||||||||
4.50%, 04/15/2023 | 5,700,000 | 5,778,375 | ||||||
DCP Midstream LLC | ||||||||
9.75%, 03/15/2019 (Acquired 10/28/2013 through 12/09/2013, Cost $6,282,757) (a) | 4,960,000 | 6,171,416 | ||||||
Devon Energy Corp | ||||||||
0.78%, 12/15/2016 | 4,000,000 | 4,006,948 | ||||||
1.88%, 05/15/2017 | 3,385,000 | 3,409,657 | ||||||
6.30%, 01/15/2019 | 1,174,000 | 1,360,499 | ||||||
3.25%, 05/15/2022 | 596,000 | 568,315 | ||||||
4.75%, 05/15/2042 | 323,000 | 299,521 | ||||||
El Paso Pipeline Partners Operating Co LLC | ||||||||
5.00%, 10/01/2021 | 4,875,000 | 5,105,651 | ||||||
7.50%, 11/15/2040 | 483,000 | 579,409 | ||||||
Encana Corp | ||||||||
6.50%, 05/15/2019 | 240,000 | 280,355 | ||||||
6.50%, 08/15/2034 | 118,000 | 129,128 | ||||||
Energy Transfer Partners LP | ||||||||
9.70%, 03/15/2019 | 107,000 | 138,539 | ||||||
4.65%, 06/01/2021 | 5,000,000 | 5,143,210 | ||||||
Eni SpA | ||||||||
5.70%, 10/01/2040 (Acquired 10/28/2013, Cost $546,581) (a) | 557,000 | 541,692 |
Enterprise Products Operating LLC | ||||||||
4.85%, 08/15/2042 | 4,000,000 | 3,767,068 | ||||||
EOG Resources Inc | ||||||||
6.88%, 10/01/2018 | 186,000 | 223,697 | ||||||
4.10%, 02/01/2021 | 547,000 | 571,393 | ||||||
2.63%, 03/15/2023 | 249,000 | 226,533 | ||||||
Gazprom OAO Via Gaz Capital SA | ||||||||
9.25%, 04/23/2019 (Acquired 11/21/2013, Cost $2,160,522) (a) | 1,750,000 | 2,152,500 | ||||||
Halliburton Co | ||||||||
6.15%, 09/15/2019 | 77,000 | 91,050 | ||||||
3.50%, 08/01/2023 | 332,000 | 321,832 | ||||||
6.70%, 09/15/2038 | 350,000 | 431,250 | ||||||
7.45%, 09/15/2039 | 521,000 | 701,227 | ||||||
7.60%, 08/15/2096 (Acquired 10/28/2013, Cost $351,109) (a) | 258,000 | 341,683 | ||||||
Hess Corp | ||||||||
7.88%, 10/01/2029 | 173,000 | 220,469 | ||||||
Husky Energy Inc | ||||||||
6.20%, 09/15/2017 | 3,630,000 | 4,138,091 | ||||||
6.15%, 06/15/2019 | 119,000 | 136,516 | ||||||
Kerr-McGee Corp | ||||||||
6.95%, 07/01/2024 | 127,000 | 147,531 | ||||||
7.88%, 09/15/2031 | 1,041,000 | 1,302,647 | ||||||
Kinder Morgan Energy Partners LP | ||||||||
9.00%, 02/01/2019 | 107,000 | 135,948 | ||||||
7.30%, 08/15/2033 | 1,650,000 | 1,942,968 | ||||||
6.95%, 01/15/2038 | 242,000 | 278,009 | ||||||
6.50%, 09/01/2039 | 107,000 | 117,307 | ||||||
5.00%, 08/15/2042 | 3,544,000 | 3,273,097 | ||||||
Kinder Morgan Finance Co LLC | ||||||||
5.70%, 01/05/2016 | 97,000 | 104,191 | ||||||
Magellan Midstream Partners LP | ||||||||
6.55%, 07/15/2019 | 206,000 | 243,769 | ||||||
5.15%, 10/15/2043 | 481,000 | 474,116 | ||||||
Marathon Oil Corp | ||||||||
6.00%, 10/01/2017 | 289,000 | 327,518 | ||||||
5.90%, 03/15/2018 | 291,000 | 331,123 | ||||||
Maritimes & Northeast Pipeline LLC | ||||||||
7.50%, 05/31/2014 (Acquired 10/28/2013, Cost $902,826) (a) | 883,687 | 902,907 |
Murphy Oil Corp | ||||||||
4.00%, 06/01/2022 | 537,000 | 510,906 | ||||||
Nabors Industries Inc | ||||||||
2.35%, 09/15/2016 (Acquired 12/10/2013, Cost $5,088,767) (a) | 5,000,000 | 5,050,375 | ||||||
6.15%, 02/15/2018 | 118,000 | 132,600 | ||||||
4.63%, 09/15/2021 | 600,000 | 600,703 | ||||||
National Oilwell Varco Inc | ||||||||
6.13%, 08/15/2015 | 757,000 | 757,840 | ||||||
1.35%, 12/01/2017 | 162,000 | 159,161 | ||||||
Nexen Energy ULC | ||||||||
6.40%, 05/15/2037 | 408,000 | 464,433 | ||||||
7.50%, 07/30/2039 | 4,000,000 | 5,101,036 | ||||||
Noble Energy Inc | ||||||||
8.25%, 03/01/2019 | 323,000 | 401,472 | ||||||
5.25%, 11/15/2043 | 2,675,000 | 2,672,814 | ||||||
Noble Holding International Ltd | ||||||||
3.95%, 03/15/2022 | 90,000 | 87,985 | ||||||
5.25%, 03/15/2042 | 64,000 | 61,407 | ||||||
Occidental Petroleum Corp | ||||||||
1.75%, 02/15/2017 | 251,000 | 251,863 | ||||||
ONEOK Partners LP | ||||||||
6.15%, 10/01/2016 | 365,000 | 409,885 | ||||||
3.20%, 09/15/2018 | 1,300,000 | 1,329,277 | ||||||
8.63%, 03/01/2019 | 353,000 | 442,726 | ||||||
6.20%, 09/15/2043 | 2,500,000 | 2,698,517 | ||||||
PC Financial Partnership | ||||||||
5.00%, 11/15/2014 | 119,000 | 123,327 | ||||||
Pemex Project Funding Master Trust | ||||||||
5.75%, 03/01/2018 | 301,000 | 335,615 | ||||||
6.63%, 06/15/2035 | 5,107,000 | 5,375,117 | ||||||
Petrobras Global Finance BV | ||||||||
2.00%, 05/20/2016 | 3,000,000 | 2,997,627 | ||||||
4.38%, 05/20/2023 | 788,000 | 702,023 | ||||||
Petrobras International Finance Co | ||||||||
3.50%, 02/06/2017 | 537,000 | 541,914 | ||||||
5.88%, 03/01/2018 | 4,000,000 | 4,263,140 | ||||||
7.88%, 03/15/2019 | 206,000 | 233,345 |
5.75%, 01/20/2020 | 107,000 | 110,097 | ||||||
5.38%, 01/27/2021 | 743,000 | 737,344 | ||||||
6.75%, 01/27/2041 | 114,000 | 106,069 | ||||||
Petro-Canada | ||||||||
6.05%, 05/15/2018 | 263,000 | 303,080 | ||||||
6.80%, 05/15/2038 | 330,000 | 394,964 | ||||||
Petrofac Ltd | ||||||||
3.40%, 10/10/2018 (Acquired 10/28/2013 through 11/14/2013, Cost $5,116,266) (a) | 5,029,000 | 5,064,983 | ||||||
Petrohawk Energy Corp | ||||||||
7.25%, 08/15/2018 | 5,742,000 | 6,189,876 | ||||||
Petroleos Mexicanos | ||||||||
5.50%, 01/21/2021 | 7,000,000 | 7,525,000 | ||||||
Phillips 66 | ||||||||
2.95%, 05/01/2017 | 241,000 | 250,734 | ||||||
4.30%, 04/01/2022 | 3,136,000 | 3,186,853 | ||||||
Pioneer Natural Resources Co | ||||||||
5.88%, 07/15/2016 | 211,000 | 234,060 | ||||||
Plains Exploration & Production Co | ||||||||
7.63%, 04/01/2020 | 918,000 | 1,013,125 | ||||||
QEP Resources Inc | ||||||||
6.80%, 03/01/2020 | 107,000 | 112,350 | ||||||
Reliance Holdings USA Inc | ||||||||
5.40%, 02/14/2022 (Acquired 11/20/2013, Cost $2,034,730) (a) | 2,000,000 | 2,022,684 | ||||||
Rockies Express Pipeline LLC | ||||||||
5.63%, 04/15/2020 (Acquired 10/28/2013, Cost $181,317) (a) | 215,000 | 190,812 | ||||||
Schlumberger Investment SA | ||||||||
3.30%, 09/14/2021 (Acquired 10/28/2013, Cost $340,138) (a) | 337,000 | 335,045 | ||||||
3.65%, 12/01/2023 | 3,754,000 | 3,721,314 | ||||||
Shell International Finance BV | ||||||||
3.10%, 06/28/2015 | 103,000 | 106,892 | ||||||
1.13%, 08/21/2017 | 504,000 | 497,055 | ||||||
4.30%, 09/22/2019 | 310,000 | 339,796 | ||||||
4.38%, 03/25/2020 | 885,000 | 970,178 | ||||||
6.38%, 12/15/2038 | 619,000 | 768,791 | ||||||
Sinopec Group Overseas Development 2013 Ltd | ||||||||
4.38%, 10/17/2023 (Acquired 10/28/2013, Cost $476,150) (a) | 475,000 | 466,412 |
Southern Natural Gas Co LLC | ||||||||
5.90%, 04/01/2017 (Acquired 10/28/2013, Cost $169,381) (a) | 150,000 | 168,102 | ||||||
Spectra Energy Capital LLC | ||||||||
5.67%, 08/15/2014 | 143,000 | 147,252 | ||||||
8.00%, 10/01/2019 | 515,000 | 613,449 | ||||||
5.65%, 03/01/2020 | 253,000 | 275,498 | ||||||
3.30%, 03/15/2023 | 467,000 | 413,583 | ||||||
7.50%, 09/15/2038 | 257,000 | 295,521 | ||||||
Spectra Energy Partners LP | ||||||||
2.95%, 09/25/2018 | 306,000 | 310,169 | ||||||
5.95%, 09/25/2043 | 207,000 | 221,292 | ||||||
Statoil ASA | ||||||||
3.13%, 08/17/2017 | 304,000 | 319,118 | ||||||
1.20%, 01/17/2018 | 221,000 | 215,720 | ||||||
5.25%, 04/15/2019 | 382,000 | 432,945 | ||||||
3.15%, 01/23/2022 | 237,000 | 231,450 | ||||||
2.45%, 01/17/2023 | 280,000 | 255,223 | ||||||
2.65%, 01/15/2024 | 663,000 | 598,027 | ||||||
4.25%, 11/23/2041 | 193,000 | 176,910 | ||||||
Suncor Energy Inc | ||||||||
6.10%, 06/01/2018 | 196,000 | 226,568 | ||||||
5.95%, 12/01/2034 | 248,000 | 270,034 | ||||||
6.85%, 06/01/2039 | 93,000 | 111,886 | ||||||
Talisman Energy Inc | ||||||||
7.75%, 06/01/2019 | 682,000 | 816,808 | ||||||
5.85%, 02/01/2037 | 171,000 | 165,223 | ||||||
6.25%, 02/01/2038 | 164,000 | 166,764 | ||||||
5.50%, 05/15/2042 | 860,000 | 810,031 | ||||||
Texas Eastern Transmission LP | ||||||||
2.80%, 10/15/2022 (Acquired 10/28/2013, Cost $658,003) (a) | 714,000 | 638,461 | ||||||
Tosco Corp | ||||||||
7.80%, 01/01/2027 | 392,000 | 515,687 | ||||||
8.13%, 02/15/2030 | 361,000 | 502,911 | ||||||
Total Capital Canada Ltd | ||||||||
0.62%, 01/15/2016 | 174,000 | 174,920 | ||||||
Total Capital International SA | ||||||||
0.75%, 01/25/2016 | 256,000 | 255,512 | ||||||
1.50%, 02/17/2017 | 218,000 | 218,398 | ||||||
1.55%, 06/28/2017 | 581,000 | 581,125 | ||||||
2.88%, 02/17/2022 | 144,000 | 136,938 |
Total Capital SA | ||||||||
2.30%, 03/15/2016 | 1,032,000 | 1,063,280 | ||||||
4.13%, 01/28/2021 | 229,000 | 242,217 | ||||||
TransCanada PipeLines Ltd | ||||||||
6.50%, 08/15/2018 | 196,000 | 230,669 | ||||||
7.13%, 01/15/2019 | 273,000 | 329,978 | ||||||
6.20%, 10/15/2037 | 155,000 | 176,580 | ||||||
7.25%, 08/15/2038 | 217,000 | 274,974 | ||||||
Transocean Inc | ||||||||
6.50%, 11/15/2020 | 697,000 | 795,932 | ||||||
6.38%, 12/15/2021 | 195,000 | 219,124 | ||||||
3.80%, 10/15/2022 | 287,000 | 272,026 | ||||||
7.50%, 04/15/2031 | 52,000 | 59,432 | ||||||
7.35%, 12/15/2041 | 153,000 | 184,518 | ||||||
Weatherford International Ltd/Bermuda | ||||||||
4.50%, 04/15/2022 | 249,000 | 250,569 | ||||||
6.50%, 08/01/2036 | 114,000 | 118,901 | ||||||
9.88%, 03/01/2039 | 275,000 | 385,000 | ||||||
6.75%, 09/15/2040 | 2,000,000 | 2,163,110 | ||||||
5.95%, 04/15/2042 | 97,000 | 97,188 | ||||||
Williams Partners LP | ||||||||
6.30%, 04/15/2040 | 333,000 | 357,879 | ||||||
5.80%, 11/15/2043 | 3,550,000 | 3,623,595 | ||||||
|
| |||||||
| 180,146,474 | ||||||||
|
| |||||||
Financials - 12.23% | ||||||||
ABN AMRO Bank NV | ||||||||
2.50%, 10/30/2018 (Acquired 10/28/13 through 11/15/13, Cost $4,991,031) (a) | 4,967,000 | 4,956,271 | ||||||
ACE INA Holdings Inc | ||||||||
5.60%, 05/15/2015 | 206,000 | 219,722 | ||||||
2.60%, 11/23/2015 | 375,000 | 387,958 | ||||||
Aflac Inc | ||||||||
2.65%, 02/15/2017 | 214,000 | 220,829 | ||||||
8.50%, 05/15/2019 | 155,000 | 197,966 | ||||||
4.00%, 02/15/2022 | 245,000 | 246,584 | ||||||
3.63%, 06/15/2023 | 585,000 | 566,266 | ||||||
6.45%, 08/15/2040 | 219,000 | 257,676 |
African Development Bank | ||||||||
8.80%, 09/01/2019 | 2,720,000 | 3,511,697 | ||||||
AIG SunAmerica Global Financing X | ||||||||
6.90%, 03/15/2032 (Acquired 10/28/2013, Cost $1,191,395) (a) | 955,000 | 1,157,829 | ||||||
Allstate Corp/The | ||||||||
3.15%, 06/15/2023 | 420,000 | 398,304 | ||||||
Ally Financial Inc | ||||||||
6.75%, 12/01/2014 | 16,000 | 16,740 | ||||||
2.75%, 01/30/2017 | 5,000,000 | 5,018,750 | ||||||
8.00%, 12/31/2018 | 43,000 | 50,740 | ||||||
American Express Centurion Bank | ||||||||
6.00%, 09/13/2017 | 506,000 | 580,519 | ||||||
American Express Co | ||||||||
7.00%, 03/19/2018 | 284,000 | 339,335 | ||||||
American Express Credit Corp | ||||||||
5.13%, 08/25/2014 | 464,000 | 478,129 | ||||||
2.80%, 09/19/2016 | 831,000 | 868,295 | ||||||
2.38%, 03/24/2017 | 287,000 | 295,001 | ||||||
American Honda Finance Corp | ||||||||
1.45%, 02/27/2015 (Acquired 10/28/2013, Cost $833,772) (a) | 826,000 | 833,711 | ||||||
2.60%, 09/20/2016 (Acquired 10/28/2013, Cost $1,231,294) (a) | 1,184,000 | 1,231,849 | ||||||
2.13%, 02/28/2017 (Acquired 10/28/2013, Cost $432,639) (a) | 425,000 | 429,786 | ||||||
1.50%, 09/11/2017 (Acquired 10/28/2013, Cost $351,084) (a) | 352,000 | 346,804 | ||||||
1.60%, 02/16/2018 (Acquired 10/28/2013, Cost $298,788) (a) | 302,000 | 297,407 | ||||||
2.13%, 10/10/2018 | 69,000 | 68,716 | ||||||
American International Group Inc | ||||||||
5.45%, 05/18/2017 | 611,000 | 682,927 | ||||||
8.25%, 08/15/2018 | 215,000 | 268,939 | ||||||
6.40%, 12/15/2020 | 15,100,000 | 17,846,101 | ||||||
4.13%, 02/15/2024 | 622,000 | 618,394 | ||||||
8.18%, 05/15/2058 | 107,000 | 129,470 | ||||||
American Tower Corp | ||||||||
3.50%, 01/31/2023 | 341,000 | 310,905 | ||||||
American Tower Trust I | ||||||||
1.55%, 03/15/2018 (Acquired 10/28/2013, Cost $388,565) (a) | 396,000 | 386,488 |
Ameriprise Financial Inc | ||||||||
7.30%, 06/28/2019 | 215,000 | 263,687 | ||||||
4.00%, 10/15/2023 | 650,000 | 648,073 | ||||||
Ameritech Capital Funding Corp | ||||||||
9.10%, 06/01/2016 | 135,792 | 151,802 | ||||||
6.45%, 01/15/2018 | 321,000 | 363,736 | ||||||
AmSouth Bancorp | ||||||||
6.75%, 11/01/2025 | 27,000 | 28,308 | ||||||
ANZ New Zealand Int’l Ltd/London | ||||||||
3.13%, 08/10/2015 (Acquired 10/28/2013, Cost $312,884) (a) | 302,000 | 313,002 | ||||||
Aon Corp | ||||||||
3.50%, 09/30/2015 | 208,000 | 217,087 | ||||||
3.13%, 05/27/2016 | 256,000 | 266,975 | ||||||
6.25%, 09/30/2040 | 172,000 | 196,689 | ||||||
Aon PLC | ||||||||
4.00%, 11/27/2023 | 9,550,000 | 9,369,133 | ||||||
Associates Corp of North America | ||||||||
6.95%, 11/01/2018 | 2,915,000 | 3,468,293 | ||||||
Australia & New Zealand Banking Group Ltd | ||||||||
3.25%, 03/01/2016 (Acquired 10/28/2013, Cost $668,553) (a) | 640,000 | 670,625 | ||||||
2.40%, 11/23/2016 (Acquired 10/28/2013, Cost $1,066,722) (a) | 1,028,000 | 1,064,391 | ||||||
4.88%, 01/12/2021 (Acquired 10/28/2013, Cost $327,705) (a) | 296,000 | 322,002 | ||||||
BAC Capital Trust VI | ||||||||
5.63%, 03/08/2035 | 43,000 | 41,985 | ||||||
Bank of America Corp | ||||||||
7.38%, 05/15/2014 | 595,000 | 609,808 | ||||||
5.45%, 07/15/2014 | 384,000 | 393,968 | ||||||
5.00%, 01/15/2015 | 72,000 | 75,019 | ||||||
10.20%, 07/15/2015 | 184,000 | 206,778 | ||||||
3.63%, 03/17/2016 | 245,000 | 257,756 | ||||||
6.50%, 08/01/2016 | 515,000 | 581,480 | ||||||
5.63%, 10/14/2016 | 670,000 | 746,637 | ||||||
6.40%, 08/28/2017 | 2,293,000 | 2,643,613 | ||||||
5.75%, 12/01/2017 | 480,000 | 546,294 | ||||||
2.00%, 01/11/2018 | 733,000 | 731,700 | ||||||
6.88%, 04/25/2018 | 843,000 | 996,736 | ||||||
5.65%, 05/01/2018 | 825,000 | 939,072 | ||||||
7.63%, 06/01/2019 | 360,000 | 446,518 |
5.63%, 07/01/2020 | 1,825,000 | 2,085,451 | ||||||
5.88%, 01/05/2021 | 15,340,000 | 17,631,581 | ||||||
5.00%, 05/13/2021 | 1,330,000 | 1,453,388 | ||||||
3.30%, 01/11/2023 | 4,343,000 | 4,109,638 | ||||||
4.10%, 07/24/2023 | 217,000 | 217,921 | ||||||
6.11%, 01/29/2037 | 3,580,000 | 3,860,926 | ||||||
7.75%, 05/14/2038 | 137,000 | 176,876 | ||||||
Bank of America NA | ||||||||
5.30%, 03/15/2017 | 5,191,000 | 5,721,634 | ||||||
Bank of Montreal | ||||||||
1.40%, 09/11/2017 | 1,416,000 | 1,394,060 | ||||||
2.55%, 11/06/2022 | 878,000 | 802,690 | ||||||
Bank of New York Mellon Corp/The | ||||||||
3.10%, 01/15/2015 | 258,000 | 264,949 | ||||||
1.20%, 02/20/2015 | 295,000 | 297,266 | ||||||
2.95%, 06/18/2015 | 826,000 | 855,075 | ||||||
2.40%, 01/17/2017 | 1,010,000 | 1,033,667 | ||||||
4.60%, 01/15/2020 | 387,000 | 417,043 | ||||||
3.55%, 09/23/2021 | 355,000 | 363,215 | ||||||
Bank of Nova Scotia | ||||||||
3.40%, 01/22/2015 | 730,000 | 753,110 | ||||||
0.66%, 12/13/2016 | 5,650,000 | 5,658,170 | ||||||
2.55%, 01/12/2017 | 867,000 | 899,176 | ||||||
Bank of Tokyo-Mitsubishi UFJ Ltd/The | ||||||||
3.85%, 01/22/2015 (Acquired 10/28/2013, Cost $464,917) (a) | 451,000 | 465,238 | ||||||
2.35%, 02/23/2017 (Acquired 10/28/2013, Cost $1,003,021) (a) | 980,000 | 994,682 | ||||||
4.10%, 09/09/2023 (Acquired 10/28/2013, Cost $246,308) (a) | 239,000 | 239,448 | ||||||
Banponce Trust I | ||||||||
8.33%, 02/01/2027 | 234,000 | 201,240 | ||||||
Barclays Bank PLC | ||||||||
5.20%, 07/10/2014 | 960,000 | 983,969 | ||||||
2.75%, 02/23/2015 | 1,193,000 | 1,219,949 | ||||||
2.50%, 09/21/2015 (Acquired 10/28/2013, Cost $890,624) (a) | 864,000 | 890,730 | ||||||
5.00%, 09/22/2016 | 114,000 | 125,508 | ||||||
2.25%, 05/10/2017 (Acquired 10/28/2013, Cost $284,866) (a) | 275,000 | 283,387 | ||||||
6.05%, 12/04/2017 (Acquired 10/28/2013, Cost $428,068) (a) | 382,000 | 427,070 | ||||||
6.75%, 05/22/2019 | 430,000 | 518,267 | ||||||
5.13%, 01/08/2020 | 5,000,000 | 5,544,155 |
BB&T Corp | ||||||||
3.95%, 04/29/2016 | 645,000 | 686,650 | ||||||
4.90%, 06/30/2017 | 284,000 | 310,776 | ||||||
1.60%, 08/15/2017 | 384,000 | 380,573 | ||||||
6.85%, 04/30/2019 | 170,000 | 204,428 | ||||||
Bear Stearns Cos LLC/The | ||||||||
5.30%, 10/30/2015 | 274,000 | 295,542 | ||||||
Berkshire Hathaway Finance Corp | ||||||||
1.30%, 05/15/2018 | 100,000 | 97,718 | ||||||
5.40%, 05/15/2018 | 1,207,000 | 1,388,326 | ||||||
2.90%, 10/15/2020 | 605,000 | 599,971 | ||||||
3.00%, 05/15/2022 | 268,000 | 256,920 | ||||||
5.75%, 01/15/2040 | 134,000 | 148,230 | ||||||
4.40%, 05/15/2042 | 1,524,000 | 1,393,665 | ||||||
4.30%, 05/15/2043 | 322,000 | 289,995 | ||||||
Berkshire Hathaway Inc | ||||||||
3.75%, 08/15/2021 | 605,000 | 623,774 | ||||||
3.40%, 01/31/2022 | 1,193,000 | 1,186,661 | ||||||
BlackRock Inc | ||||||||
3.50%, 12/10/2014 | 335,000 | 344,790 | ||||||
5.00%, 12/10/2019 | 959,000 | 1,082,799 | ||||||
3.38%, 06/01/2022 | 898,000 | 888,201 | ||||||
Blackstone Holdings Finance Co LLC | ||||||||
5.88%, 03/15/2021 (Acquired 10/28/2013, Cost $1,630,970) (a) | 1,445,000 | 1,607,625 | ||||||
BNP Paribas SA | ||||||||
3.25%, 03/03/2023 | 430,000 | 406,841 | ||||||
BPCE SA | ||||||||
1.49%, 04/25/2016 | 306,000 | 309,982 | ||||||
2.50%, 12/10/2018 | 2,500,000 | 2,486,615 | ||||||
5.70%, 10/22/2023 (Acquired 10/28/2013 through 11/04/2013, Cost $3,752,991) (a) | 3,645,000 | 3,755,298 | ||||||
Branch Banking & Trust Co | ||||||||
5.63%, 09/15/2016 | 480,000 | 534,020 | ||||||
0.54%, 05/23/2017 | 2,500,000 | 2,471,332 | ||||||
Caisse Centrale Desjardins | ||||||||
2.55%, 03/24/2016 (Acquired 10/28/2013, Cost $649,291) (a) | 624,000 | 649,272 |
Canadian Imperial Bank of Commerce/Canada | ||||||||
2.60%, 07/02/2015 (Acquired 10/28/2013, Cost $1,303,937) (a) | 1,264,000 | 1,303,816 | ||||||
0.90%, 10/01/2015 | 256,000 | 257,402 | ||||||
Capital One Bank USA NA | ||||||||
2.15%, 11/21/2018 | 5,000,000 | 4,973,250 | ||||||
3.38%, 02/15/2023 | 2,164,000 | 2,011,828 | ||||||
Capital One Financial Corp | ||||||||
7.38%, 05/23/2014 | 627,000 | 643,147 | ||||||
2.15%, 03/23/2015 | 262,000 | 266,344 | ||||||
1.00%, 11/06/2015 | 211,000 | 210,908 | ||||||
4.75%, 07/15/2021 | 7,058,000 | 7,505,117 | ||||||
3.50%, 06/15/2023 | 942,000 | 884,263 | ||||||
CDP Financial Inc | ||||||||
4.40%, 11/25/2019 (Acquired 10/28/2013, Cost $346,057) (a) | 310,000 | 341,265 | ||||||
Charles Schwab Corp/The | ||||||||
3.23%, 09/01/2022 | 165,000 | 158,807 | ||||||
Chubb Corp/The | ||||||||
5.75%, 05/15/2018 | 117,000 | 134,483 | ||||||
Cie de Financement Foncier SA | ||||||||
2.50%, 09/16/2015 (Acquired 10/28/2013, Cost $205,742) (a) | 200,000 | 205,722 | ||||||
CIT Group Inc | ||||||||
6.63%, 04/01/2018 (Acquired 11/22/2013, Cost $1,466,787) (a) | 1,300,000 | 1,460,875 | ||||||
Citigroup Inc | ||||||||
6.38%, 08/12/2014 | 193,000 | 199,489 | ||||||
5.00%, 09/15/2014 | 546,000 | 561,553 | ||||||
6.01%, 01/15/2015 | 523,000 | 550,742 | ||||||
4.75%, 05/19/2015 | 551,000 | 579,791 | ||||||
4.70%, 05/29/2015 | 155,000 | 163,176 | ||||||
2.25%, 08/07/2015 | 1,342,000 | 1,369,884 | ||||||
4.59%, 12/15/2015 | 1,197,000 | 1,279,131 | ||||||
1.25%, 01/15/2016 | 568,000 | 569,885 | ||||||
4.45%, 01/10/2017 | 984,000 | 1,066,458 | ||||||
5.50%, 02/15/2017 | 103,000 | 113,489 | ||||||
6.00%, 08/15/2017 | 1,393,000 | 1,587,686 | ||||||
6.13%, 11/21/2017 | 850,000 | 979,803 | ||||||
8.50%, 05/22/2019 | 1,484,000 | 1,901,878 | ||||||
5.38%, 08/09/2020 | 884,000 | 1,005,676 | ||||||
4.50%, 01/14/2022 | 10,172,000 | 10,779,391 |
3.38%, 03/01/2023 | 127,000 | 120,715 | ||||||
3.50%, 05/15/2023 | 5,000,000 | 4,658,955 | ||||||
5.50%, 09/13/2025 | 494,000 | 520,300 | ||||||
6.63%, 01/15/2028 | 387,000 | 449,199 | ||||||
6.88%, 03/05/2038 | 23,000 | 28,283 | ||||||
8.13%, 07/15/2039 | 294,000 | 412,390 | ||||||
5.88%, 01/30/2042 | 212,000 | 238,261 | ||||||
6.68%, 09/13/2043 | 2,800,000 | 3,221,758 | ||||||
CME Group Inc/IL | ||||||||
3.00%, 09/15/2022 | 1,135,000 | 1,071,801 | ||||||
5.30%, 09/15/2043 | 115,000 | 120,351 | ||||||
CNA Financial Corp | ||||||||
5.85%, 12/15/2014 | 702,000 | 735,265 | ||||||
6.50%, 08/15/2016 | 537,000 | 603,942 | ||||||
5.88%, 08/15/2020 | 523,000 | 596,236 | ||||||
7.25%, 11/15/2023 | 5,470,000 | 6,557,994 | ||||||
Comerica Inc | ||||||||
3.00%, 09/16/2015 | 202,000 | 209,661 | ||||||
Commonwealth Bank of Australia | ||||||||
0.84%, 10/08/2015 (Acquired 12/05/2013, Cost $536,191) (a) | 537,000 | 536,726 | ||||||
0.75%, 09/20/2016 (Acquired 11/22/2013, Cost $5,015,341) (a) | 5,000,000 | 5,012,135 | ||||||
2.25%, 03/16/2017 (Acquired 10/28/2013, Cost $861,873) (a) | 836,000 | 859,646 | ||||||
CommonWealth REIT | ||||||||
6.65%, 01/15/2018 | 401,000 | 437,255 | ||||||
5.88%, 09/15/2020 | 723,000 | 743,836 | ||||||
Cooperatieve Centrale Raiffeisen-Boerenleenbank BA/Netherlands | ||||||||
3.20%, 03/11/2015 (Acquired 10/28/2013, Cost $1,350,773) (a) | 1,311,000 | 1,351,802 | ||||||
2.13%, 10/13/2015 | 241,000 | 247,212 | ||||||
0.49%, 03/07/2016 (Acquired 10/28/2013, Cost $1,071,755) (a) | 1,074,000 | 1,072,809 | ||||||
3.38%, 01/19/2017 | 258,000 | 271,646 | ||||||
4.50%, 01/11/2021 | 712,000 | 755,721 | ||||||
3.88%, 02/08/2022 | 4,611,000 | 4,636,135 | ||||||
5.80%, 09/30/2110 (Acquired 10/28/2013, Cost $375,773) (a) | 361,000 | 361,280 | ||||||
Corp Andina de Fomento | ||||||||
3.75%, 01/15/2016 | 939,000 | 976,276 | ||||||
4.38%, 06/15/2022 | 735,000 | 727,783 |
Countrywide Financial Corp | ||||||||
6.25%, 05/15/2016 | 1,461,000 | 1,612,211 | ||||||
Credit Agricole SA | ||||||||
1.10%, 10/03/2016 (Acquired 10/28/2013, Cost $250,477) (a) | 250,000 | 250,677 | ||||||
6.64%, 05/29/2049 (Acquired 10/28/2013, Cost $104,194) (a) | 107,000 | 106,996 | ||||||
Credit Suisse USA Inc | ||||||||
4.88%, 01/15/2015 | 124,000 | 129,553 | ||||||
Credit Suisse/New York NY | ||||||||
5.30%, 08/13/2019 | 169,000 | 189,709 | ||||||
Deutsche Bank AG/London | ||||||||
3.88%, 08/18/2014 | 363,000 | 370,616 | ||||||
3.25%, 01/11/2016 | 805,000 | 841,921 | ||||||
6.00%, 09/01/2017 | 341,000 | 389,481 | ||||||
Discover Bank/Greenwood DE | ||||||||
4.20%, 08/08/2023 | 6,711,000 | 6,619,126 | ||||||
DNB Boligkreditt AS | ||||||||
2.10%, 10/14/2015 (Acquired 10/28/2013, Cost $1,525,135) (a) | 1,488,000 | 1,525,944 | ||||||
Dresdner Bank AG/New York NY | ||||||||
7.25%, 09/15/2015 | 3,259,000 | 3,518,671 | ||||||
Duke Realty LP | ||||||||
3.88%, 02/15/2021 | 344,000 | 339,388 | ||||||
ERP Operating LP | ||||||||
4.63%, 12/15/2021 | 434,000 | 457,548 | ||||||
Export-Import Bank of Korea | ||||||||
4.00%, 01/11/2017 | 200,000 | 211,878 | ||||||
4.38%, 09/15/2021 | 250,000 | 260,767 | ||||||
Fifth Third Bancorp | ||||||||
5.45%, 01/15/2017 | 150,000 | 164,849 | ||||||
Fifth Third Bank/Cincinnati OH | ||||||||
1.15%, 11/18/2016 | 5,000,000 | 4,996,535 | ||||||
First Hawaiian Capital I | ||||||||
8.34%, 07/01/2027 | 403,000 | 409,549 | ||||||
First Tennessee Bank NA | ||||||||
5.05%, 01/15/2015 | 542,000 | 562,771 | ||||||
5.65%, 04/01/2016 | 680,000 | 733,649 | ||||||
FMR LLC | ||||||||
4.95%, 02/01/2033 (Acquired 10/28/2013, Cost $247,283) (a) | 250,000 | 245,304 | ||||||
6.45%, 11/15/2039 (Acquired 10/28/2013, Cost $299,986) (a) | 258,000 | 294,522 |
FNBC 1993-A Pass Through Trust | ||||||||
8.08%, 01/05/2018 | 84,417 | 91,783 | ||||||
Ford Motor Credit Co LLC | ||||||||
7.00%, 04/15/2015 | 140,000 | 150,691 | ||||||
4.21%, 04/15/2016 | 345,000 | 367,611 | ||||||
1.49%, 05/09/2016 | 332,000 | 336,871 | ||||||
3.98%, 06/15/2016 | 1,249,000 | 1,328,185 | ||||||
3.00%, 06/12/2017 | 905,000 | 940,583 | ||||||
6.63%, 08/15/2017 | 3,473,000 | 4,023,238 | ||||||
2.88%, 10/01/2018 | 1,072,000 | 1,097,294 | ||||||
4.25%, 09/20/2022 | 397,000 | 398,825 | ||||||
General Electric Capital Corp | ||||||||
1.63%, 07/02/2015 | 1,187,000 | 1,206,290 | ||||||
2.25%, 11/09/2015 | 426,000 | 439,040 | ||||||
1.00%, 12/11/2015 | 258,000 | 260,067 | ||||||
0.41%, 02/15/2017 | 361,000 | 357,081 | ||||||
5.40%, 02/15/2017 | 155,000 | 172,503 | ||||||
2.30%, 04/27/2017 | 790,000 | 812,020 | ||||||
5.63%, 09/15/2017 | 764,000 | 869,124 | ||||||
1.60%, 11/20/2017 | 328,000 | 325,841 | ||||||
5.63%, 05/01/2018 | 2,376,000 | 2,728,522 | ||||||
6.00%, 08/07/2019 | 547,000 | 641,802 | ||||||
2.10%, 12/11/2019 | 152,000 | 147,792 | ||||||
5.50%, 01/08/2020 | 2,028,000 | 2,322,391 | ||||||
5.55%, 05/04/2020 | 666,000 | 766,384 | ||||||
4.38%, 09/16/2020 | 1,486,000 | 1,610,511 | ||||||
4.63%, 01/07/2021 | 8,824,000 | 9,622,104 | ||||||
5.30%, 02/11/2021 | 184,000 | 205,826 | ||||||
4.65%, 10/17/2021 | 8,987,000 | 9,790,869 | ||||||
3.15%, 09/07/2022 | 1,935,000 | 1,872,532 | ||||||
6.75%, 03/15/2032 | 954,000 | 1,181,343 | ||||||
5.88%, 01/14/2038 | 196,000 | 223,266 | ||||||
6.88%, 01/10/2039 | 8,263,000 | 10,622,880 | ||||||
Genworth Holdings Inc | ||||||||
5.75%, 06/15/2014 | 652,000 | 665,528 | ||||||
4.90%, 08/15/2023 | 161,000 | 160,920 |
Goldman Sachs Capital I | ||||||||
6.35%, 02/15/2034 | 343,000 | 346,088 | ||||||
Goldman Sachs Group Inc/The | ||||||||
3.30%, 05/03/2015 | 388,000 | 399,767 | ||||||
3.70%, 08/01/2015 | 415,000 | 432,136 | ||||||
1.60%, 11/23/2015 | 688,000 | 695,395 | ||||||
3.63%, 02/07/2016 | 667,000 | 700,003 | ||||||
6.25%, 09/01/2017 | 878,000 | 1,005,187 | ||||||
5.95%, 01/18/2018 | 1,331,000 | 1,513,264 | ||||||
6.15%, 04/01/2018 | 1,193,000 | 1,367,986 | ||||||
2.90%, 07/19/2018 | 263,000 | 267,648 | ||||||
7.50%, 02/15/2019 | 3,617,000 | 4,405,394 | ||||||
5.38%, 03/15/2020 | 1,007,000 | 1,119,914 | ||||||
6.00%, 06/15/2020 | 1,514,000 | 1,735,918 | ||||||
5.25%, 07/27/2021 | 694,000 | 759,820 | ||||||
5.75%, 01/24/2022 | 17,547,000 | 19,752,447 | ||||||
3.63%, 01/22/2023 | 263,000 | 254,677 | ||||||
6.75%, 10/01/2037 | 4,938,000 | 5,493,747 | ||||||
Great-West Life & Annuity Insurance Capital LP II | ||||||||
7.15%, 05/16/2046 (Acquired 10/28/2013, Cost $315,085) (a) | 301,000 | 310,030 | ||||||
Hartford Financial Services Group Inc | ||||||||
4.00%, 10/15/2017 | 537,000 | 571,164 | ||||||
5.13%, 04/15/2022 | 5,500,000 | 5,990,661 | ||||||
8.13%, 06/15/2038 | 236,000 | 275,058 | ||||||
HCP Inc | ||||||||
3.75%, 02/01/2019 | 149,000 | 154,764 | ||||||
2.63%, 02/01/2020 | 325,000 | 309,786 | ||||||
5.38%, 02/01/2021 | 638,000 | 694,513 | ||||||
Health Care REIT Inc | ||||||||
4.50%, 01/15/2024 | 461,000 | 455,167 | ||||||
Highmark Inc | ||||||||
4.75%, 05/15/2021 (Acquired 10/30/2013 through 11/20/2013, Cost $309,763) (a) | 322,000 | 302,755 | ||||||
HSBC Bank PLC | ||||||||
1.63%, 07/07/2014 (Acquired 10/28/2013, Cost $911,450) (a) | 904,000 | 909,586 | ||||||
3.50%, 06/28/2015 (Acquired 10/28/2013, Cost $496,633) (a) | 477,000 | 497,190 | ||||||
1.50%, 05/15/2018 (Acquired 10/28/2013, Cost $928,034) (a) | 944,000 | 921,787 | ||||||
4.13%, 08/12/2020 (Acquired 10/28/2013, Cost $656,471) (a) | 615,000 | 650,725 | ||||||
4.75%, 01/19/2021 (Acquired 10/28/2013, Cost $1,129,937) (a) | 1,032,000 | 1,120,162 |
HSBC Bank USA NA/New York NY | ||||||||
4.63%, 04/01/2014 | 702,000 | 709,228 | ||||||
HSBC Finance Corp | ||||||||
5.00%, 06/30/2015 | 671,000 | 709,058 | ||||||
0.67%, 06/01/2016 | 2,605,000 | 2,600,816 | ||||||
7.35%, 11/27/2032 | 32,000 | 37,061 | ||||||
HSBC Holdings PLC | ||||||||
5.10%, 04/05/2021 | 482,000 | 535,719 | ||||||
4.88%, 01/14/2022 | 743,000 | 801,786 | ||||||
4.00%, 03/30/2022 | 1,012,000 | 1,040,183 | ||||||
6.50%, 09/15/2037 | 5,996,000 | 7,091,685 | ||||||
6.10%, 01/14/2042 | 743,000 | 885,160 | ||||||
HSBC USA Capital Trust I | ||||||||
7.81%, 12/15/2026 (Acquired 10/28/13 through 11/25/13, Cost $1,112,685) (a) | 1,100,000 | 1,113,750 | ||||||
HSBC USA Capital Trust II | ||||||||
8.38%, 05/15/2027 (Acquired 10/28/13 through 11/25/13, Cost $54,835) (a) | 54,000 | 54,892 | ||||||
HSBC USA Capital Trust III | ||||||||
7.75%, 11/15/2026 | 107,000 | 108,177 | ||||||
HSBC USA Inc | ||||||||
2.38%, 02/13/2015 | 1,032,000 | 1,053,019 | ||||||
1.63%, 01/16/2018 | 769,000 | 758,278 | ||||||
9.13%, 05/15/2021 | 75,000 | 94,095 | ||||||
Hyundai Capital Services Inc | ||||||||
6.00%, 05/05/2015 (Acquired 10/28/2013, Cost $228,037) (a) | 215,000 | 228,651 | ||||||
4.38%, 07/27/2016 (Acquired 10/28/2013, Cost $257,681) (a) | 242,000 | 257,468 | ||||||
3.50%, 09/13/2017 (Acquired 10/28/2013, Cost $208,952) (a) | 200,000 | 206,753 | ||||||
ING Bank NV | ||||||||
2.00%, 09/25/2015 (Acquired 10/28/2013, Cost $259,591) (a) | 256,000 | 260,241 | ||||||
1.38%, 03/07/2016 (Acquired 10/28/2013, Cost $514,190) (a) | 516,000 | 516,814 | ||||||
4.00%, 03/15/2016 (Acquired 10/28/2013, Cost $412,990) (a) | 392,000 | 414,306 | ||||||
3.75%, 03/07/2017 (Acquired 10/28/2013, Cost $1,445,152) (a) | 1,369,000 | 1,441,858 | ||||||
ING US Inc | ||||||||
5.50%, 07/15/2022 | 5,000,000 | 5,437,460 | ||||||
IntercontinentalExchange Group Inc | ||||||||
2.50%, 10/15/2018 | 243,000 | 244,787 | ||||||
4.00%, 10/15/2023 | 578,000 | 581,426 |
International Bank for Reconstruction & Development | ||||||||
0.00%, 02/15/2016 | 980,000 | 963,289 | ||||||
Intesa Sanpaolo SpA | ||||||||
3.13%, 01/15/2016 (Acquired 11/21/2013, Cost $3,266,508) (a) | 3,200,000 | 3,260,998 | ||||||
Invesco Finance PLC | ||||||||
3.13%, 11/30/2022 | 710,000 | 656,959 | ||||||
4.00%, 01/30/2024 | 2,400,000 | 2,378,832 | ||||||
Jackson National Life Global Funding | ||||||||
4.70%, 06/01/2018 (Acquired 10/28/2013, Cost $329,905) (a) | 310,000 | 323,320 | ||||||
Jefferies Group LLC | ||||||||
3.88%, 11/09/2015 | 317,000 | 330,730 | ||||||
5.13%, 04/13/2018 | 1,534,000 | 1,658,637 | ||||||
8.50%, 07/15/2019 | 955,000 | 1,165,100 | ||||||
6.88%, 04/15/2021 | 430,000 | 489,783 | ||||||
6.45%, 06/08/2027 | 578,000 | 600,583 | ||||||
6.25%, 01/15/2036 | 155,000 | 149,575 | ||||||
John Deere Capital Corp | ||||||||
1.20%, 10/10/2017 | 560,000 | 546,079 | ||||||
2.25%, 04/17/2019 | 5,335,000 | 5,323,610 | ||||||
1.70%, 01/15/2020 | 123,000 | 115,826 | ||||||
3.15%, 10/15/2021 | 257,000 | 253,396 | ||||||
2.80%, 01/27/2023 | 373,000 | 348,549 | ||||||
John Hancock Life Insurance Co | ||||||||
7.38%, 02/15/2024 (Acquired 10/28/2013, Cost $893,419) (a) | 731,000 | 865,196 | ||||||
JPMorgan Chase & Co | ||||||||
5.13%, 09/15/2014 | 6,000,000 | 6,181,638 | ||||||
4.25%, 10/15/2020 | 64,000 | 67,842 | ||||||
4.35%, 08/15/2021 | 10,000,000 | 10,539,200 | ||||||
3.38%, 05/01/2023 | 3,800,000 | 3,541,600 | ||||||
5.60%, 07/15/2041 | 494,000 | 536,111 | ||||||
5.63%, 08/16/2043 | 3,550,000 | 3,751,548 | ||||||
JPMorgan Chase Bank NA | ||||||||
5.88%, 06/13/2016 | 322,000 | 357,127 | ||||||
Kemper Corp | ||||||||
6.00%, 05/15/2017 | 5,000,000 | 5,482,420 | ||||||
KeyCorp | ||||||||
2.30%, 12/13/2018 | 211,000 | 209,469 |
Kookmin Bank | ||||||||
7.25%, 05/14/2014 (Acquired 10/28/2013, Cost $511,389) (a) | 500,000 | 511,437 | ||||||
LeasePlan Corp NV | ||||||||
2.50%, 05/16/2018 (Acquired 10/28/2013 through 12/27/2013, Cost $2,274,466) (a) | 2,306,000 | 2,241,893 | ||||||
Liberty Mutual Group Inc | ||||||||
5.00%, 06/01/2021 (Acquired 10/28/2013, Cost $376,515) (a) | 351,000 | 368,125 | ||||||
4.25%, 06/15/2023 (Acquired 10/28/2013, Cost $319,167) (a) | 322,000 | 310,901 | ||||||
6.50%, 03/15/2035 (Acquired 11/19/2013, Cost $4,441,688) (a) | 4,000,000 | 4,367,088 | ||||||
10.75%, 06/15/2058 (Acquired 10/28/2013, Cost $408,513) (a) | 269,000 | 402,155 | ||||||
Liberty Mutual Insurance Co | ||||||||
7.70%, 10/15/2097 (Acquired 10/28/2013, Cost $106,317) (a) | 100,000 | 101,995 | ||||||
Lincoln National Corp | ||||||||
8.75%, 07/01/2019 | 5,000,000 | 6,435,780 | ||||||
4.85%, 06/24/2021 | 168,000 | 180,449 | ||||||
4.20%, 03/15/2022 | 265,000 | 270,040 | ||||||
7.00%, 06/15/2040 | 5,160,000 | 6,464,825 | ||||||
6.05%, 04/20/2067 | 121,000 | 120,093 | ||||||
Lloyds Bank PLC | ||||||||
2.30%, 11/27/2018 | 1,075,000 | 1,072,211 | ||||||
5.80%, 01/13/2020 (Acquired 10/28/2013, Cost $197,429) (a) | 172,000 | 197,193 | ||||||
M&I Marshall & Ilsley Bank | ||||||||
4.85%, 06/16/2015 | 1,360,000 | 1,433,421 | ||||||
M&T Capital Trust I | ||||||||
8.23%, 02/01/2027 | 337,000 | 341,711 | ||||||
M&T Capital Trust II | ||||||||
8.28%, 06/01/2027 | 169,000 | 172,364 | ||||||
Mack-Cali Realty LP | ||||||||
2.50%, 12/15/2017 | 5,050,000 | 4,996,268 | ||||||
Macquarie Bank Ltd | ||||||||
5.00%, 02/22/2017 (Acquired 10/28/2013, Cost $2,963,221) (a) | 2,719,000 | 2,948,592 | ||||||
Macquarie Group Ltd | ||||||||
7.30%, 08/01/2014 (Acquired 10/28/2013, Cost $748,507) (a) | 722,000 | 748,439 | ||||||
3.00%, 12/03/2018 (Acquired 11/25/2013, Cost $5,976,001) (a) | 6,000,000 | 5,975,838 | ||||||
7.63%, 08/13/2019 (Acquired 10/28/2013, Cost $91,358) (a) | 77,000 | 92,217 | ||||||
6.00%, 01/14/2020 (Acquired 10/28/2013, Cost $522,491) (a) | 475,000 | 524,656 | ||||||
6.25%, 01/14/2021 (Acquired 10/28/2013, Cost $1,141,302) (a) | 1,034,000 | 1,142,941 | ||||||
Manufacturers & Traders Trust Co | ||||||||
6.63%, 12/04/2017 | 464,000 | 537,166 |
Markel Corp | ||||||||
7.13%, 09/30/2019 | 3,780,000 | 4,500,714 | ||||||
Marsh & McLennan Cos Inc | ||||||||
2.30%, 04/01/2017 | 269,000 | 270,914 | ||||||
9.25%, 04/15/2019 | 177,000 | 229,296 | ||||||
4.80%, 07/15/2021 | 5,000,000 | 5,330,160 | ||||||
Massachusetts Mutual Life Insurance Co | ||||||||
8.88%, 06/01/2039 (Acquired 10/28/2013 through 12/02/2013, Cost $8,073,484) (a) | 5,548,000 | 7,950,628 | ||||||
5.38%, 12/01/2041 (Acquired 10/28/2013, Cost $213,185) (a) | 203,000 | 209,870 | ||||||
MassMutual Global Funding II | ||||||||
3.13%, 04/14/2016 (Acquired 10/28/2013, Cost $293,172) (a) | 280,000 | 293,092 | ||||||
2.00%, 04/05/2017 (Acquired 10/28/2013, Cost $1,674,979) (a) | 1,652,000 | 1,656,854 | ||||||
2.50%, 10/17/2022 (Acquired 10/28/2013, Cost $358,070) (a) | 386,000 | 348,636 | ||||||
MBIA Insurance Corp | ||||||||
11.50%, 01/15/2033 (Acquired 10/28/2013, Cost $58,385) (a) | 86,000 | 64,930 | ||||||
MetLife Inc | ||||||||
6.82%, 08/15/2018 | 84,000 | 100,501 | ||||||
7.72%, 02/15/2019 | 118,000 | 146,262 | ||||||
4.37%, 09/15/2023 | 7,200,000 | 7,350,379 | ||||||
6.50%, 12/15/2032 | 56,000 | 66,631 | ||||||
4.88%, 11/13/2043 | 3,000,000 | 2,944,320 | ||||||
Metlife of Connecticut Global Funding I | ||||||||
5.13%, 08/15/2014 (Acquired 10/28/2013, Cost $339,483) (a) | 330,000 | 339,292 | ||||||
Metropolitan Life Global Funding I | ||||||||
1.70%, 06/29/2015 (Acquired 10/28/2013, Cost $926,839) (a) | 916,000 | 929,765 | ||||||
2.50%, 09/29/2015 (Acquired 10/28/2013, Cost $1,062,036) (a) | 1,032,000 | 1,062,886 | ||||||
3.13%, 01/11/2016 (Acquired 10/28/2013, Cost $347,285) (a) | 334,000 | 348,142 | ||||||
1.50%, 01/10/2018 (Acquired 10/28/2013, Cost $469,951) (a) | 476,000 | 462,960 | ||||||
3.65%, 06/14/2018 (Acquired 10/28/2013, Cost $1,464,094) (a) | 1,373,000 | 1,447,577 | ||||||
1.88%, 06/22/2018 (Acquired 10/28/2013, Cost $223,465) (a) | 225,000 | 220,902 | ||||||
3.88%, 04/11/2022 (Acquired 10/28/2013, Cost $1,523,560) (a) | 1,480,000 | 1,492,383 | ||||||
Metropolitan Life Insurance Co | ||||||||
7.70%, 11/01/2015 (Acquired 11/21/2013, Cost $3,348,233) (a) | 3,000,000 | 3,295,896 | ||||||
Mizuho Bank Ltd | ||||||||
1.85%, 03/21/2018 (Acquired 10/28/2013, Cost $370,889) (a) | 376,000 | 366,476 |
Morgan Stanley | ||||||||
4.75%, 04/01/2014 | 115,000 | 115,914 | ||||||
6.00%, 05/13/2014 | 599,000 | 610,424 | ||||||
4.20%, 11/20/2014 | 440,000 | 453,992 | ||||||
6.00%, 04/28/2015 | 340,000 | 362,112 | ||||||
4.00%, 07/24/2015 | 791,000 | 825,917 | ||||||
1.75%, 02/25/2016 | 170,000 | 172,282 | ||||||
5.45%, 01/09/2017 | 537,000 | 595,534 | ||||||
5.95%, 12/28/2017 | 110,000 | 125,677 | ||||||
6.63%, 04/01/2018 | 457,000 | 534,733 | ||||||
7.30%, 05/13/2019 | 1,482,000 | 1,799,753 | ||||||
5.63%, 09/23/2019 | 1,702,000 | 1,934,640 | ||||||
5.50%, 07/24/2020 | 774,000 | 865,642 | ||||||
5.75%, 01/25/2021 | 10,335,000 | 11,691,613 | ||||||
5.50%, 07/28/2021 | 372,000 | 415,694 | ||||||
4.88%, 11/01/2022 | 1,895,000 | 1,939,838 | ||||||
4.10%, 05/22/2023 | 1,645,000 | 1,591,950 | ||||||
5.00%, 11/24/2025 | 4,306,000 | 4,318,875 | ||||||
6.38%, 07/24/2042 | 2,000,000 | 2,342,562 | ||||||
Murray Street Investment Trust I | ||||||||
4.65%, 03/09/2017 | 258,000 | 277,837 | ||||||
NASDAQ OMX Group Inc/The | ||||||||
4.00%, 01/15/2015 | 1,932,000 | 1,982,516 | ||||||
National Australia Bank Ltd | ||||||||
3.75%, 03/02/2015 (Acquired 10/28/2013, Cost $369,753) (a) | 357,000 | 370,303 | ||||||
2.75%, 09/28/2015 (Acquired 10/28/2013, Cost $830,295) (a) | 805,000 | 833,562 | ||||||
0.74%, 10/08/2015 (Acquired 10/28/2013, Cost $1,099,793) (a) | 1,100,000 | 1,099,629 | ||||||
3.00%, 07/27/2016 (Acquired 10/28/2013, Cost $756,049) (a) | 722,000 | 755,703 | ||||||
0.67%, 12/02/2016 (Acquired 11/21/2013, Cost $5,000,001) (a) | 5,000,000 | 4,999,950 | ||||||
2.00%, 06/20/2017 (Acquired 10/28/2013, Cost $2,112,603) (a) | 2,064,000 | 2,102,390 | ||||||
National City Bank/Cleveland OH | ||||||||
5.80%, 06/07/2017 | 1,013,000 | 1,141,735 | ||||||
National Rural Utilities Cooperative Finance Corp | ||||||||
10.38%, 11/01/2018 | 3,522,000 | 4,763,097 | ||||||
8.00%, 03/01/2032 | 341,000 | 457,424 | ||||||
Nationwide Mutual Insurance Co | ||||||||
6.60%, 04/15/2034 (Acquired 10/28/2013, Cost $104,622) (a) | 103,000 | 104,931 | ||||||
9.38%, 08/15/2039 (Acquired 10/28/2013, Cost $1,794,289) (a) | 1,283,000 | 1,799,190 |
New York Life Global Funding | ||||||||
1.30%, 01/12/2015 (Acquired 10/28/2013, Cost $644,787) (a) | 640,000 | 645,729 | ||||||
3.00%, 05/04/2015 (Acquired 10/28/2013, Cost $671,087) (a) | 650,000 | 670,781 | ||||||
0.75%, 07/24/2015 (Acquired 10/28/2013, Cost $582,836) (a) | 582,000 | 583,227 | ||||||
0.80%, 02/12/2016 (Acquired 10/28/2013, Cost $155,302) (a) | 155,000 | 155,701 | ||||||
2.10%, 01/02/2019 (Acquired 12/5/2013, Cost $8,140,628) (a) | 8,150,000 | 8,059,616 | ||||||
Nomura Holdings Inc | ||||||||
5.00%, 03/04/2015 | 292,000 | 305,050 | ||||||
4.13%, 01/19/2016 | 864,000 | 909,491 | ||||||
2.00%, 09/13/2016 | 6,532,000 | 6,586,000 | ||||||
6.70%, 03/04/2020 | 300,000 | 344,004 | ||||||
Nordea Bank AB | ||||||||
3.13%, 03/20/2017 (Acquired 10/28/2013, Cost $1,661,736) (a) | 1,584,000 | 1,656,359 | ||||||
1.63%, 05/15/2018 (Acquired 10/28/2013, Cost $253,981) (a) | 258,000 | 252,090 | ||||||
4.88%, 05/13/2021 (Acquired 10/28/2013, Cost $673,209) (a) | 640,000 | 661,518 | ||||||
Northern Trust Corp | ||||||||
3.95%, 10/30/2025 | 6,915,000 | 6,738,633 | ||||||
Oversea-Chinese Banking Corp Ltd | ||||||||
1.63%, 03/13/2015 (Acquired 10/28/2013, Cost $684,976) (a) | 678,000 | 685,819 | ||||||
Pacific Life Global Funding | ||||||||
5.00%, 05/15/2017 (Acquired 10/28/2013, Cost $435,459) (a) | 413,000 | 431,865 | ||||||
Pacific Life Insurance Co | ||||||||
9.25%, 06/15/2039 (Acquired 10/28/2013, Cost $739,788) (a) | 526,000 | 730,462 | ||||||
Pemex Finance Ltd | ||||||||
10.61%, 08/15/2017 | 301,875 | 347,483 | ||||||
PNC Bank NA | ||||||||
2.95%, 01/30/2023 | 6,500,000 | 5,982,041 | ||||||
4.20%, 11/01/2025 | 322,000 | 315,632 | ||||||
PNC Funding Corp | ||||||||
3.00%, 05/19/2014 | 105,000 | 106,065 | ||||||
5.25%, 11/15/2015 | 124,000 | 133,159 | ||||||
2.70%, 09/19/2016 | 133,000 | 138,727 | ||||||
5.63%, 02/01/2017 | 127,000 | 140,970 | ||||||
6.70%, 06/10/2019 | 423,000 | 508,097 | ||||||
5.13%, 02/08/2020 | 588,000 | 660,417 | ||||||
4.38%, 08/11/2020 | 468,000 | 500,330 | ||||||
3.30%, 03/08/2022 | 575,000 | 565,022 |
Portigon AG/New York | ||||||||
4.80%, 07/15/2015 | 300,000 | 316,936 | ||||||
Pricoa Global Funding I | ||||||||
5.45%, 06/11/2014 (Acquired 10/28/2013, Cost $674,227) (a) | 660,000 | 674,115 | ||||||
Principal Financial Group Inc | ||||||||
1.85%, 11/15/2017 | 149,000 | 147,652 | ||||||
Principal Life Global Funding I | ||||||||
5.05%, 03/15/2015 (Acquired 10/28/2013, Cost $173,054) (a) | 165,000 | 173,022 | ||||||
Principal Life Global Funding II | ||||||||
1.00%, 12/11/2015 (Acquired 10/28/2013, Cost $183,327) (a) | 183,000 | 183,372 | ||||||
Private Export Funding Corp | ||||||||
4.38%, 03/15/2019 | 970,000 | 1,071,009 | ||||||
2.80%, 05/15/2022 | 1,200,000 | 1,163,814 | ||||||
ProLogis LP | ||||||||
4.25%, 08/15/2023 | 295,000 | 291,417 | ||||||
Protective Life Corp | ||||||||
7.38%, 10/15/2019 | 854,000 | 1,041,527 | ||||||
Prudential Covered Trust 2012-1 | ||||||||
3.00%, 09/30/2015 (Acquired 10/28/2013, Cost $840,910) (a) | 815,150 | 840,403 | ||||||
Prudential Holdings LLC | ||||||||
8.70%, 12/18/2023 (Acquired 10/28/2013, Cost $235,932) (a) | 187,600 | 238,037 | ||||||
Prudential Insurance Co of America/The | ||||||||
8.30%, 07/01/2025 (Acquired 10/28/2013, Cost $1,554,456) (a) | 1,191,000 | 1,494,955 | ||||||
Realty Income Corp | ||||||||
2.00%, 01/31/2018 | 4,700,000 | 4,602,992 | ||||||
Regions Bank/Birmingham AL | ||||||||
7.50%, 05/15/2018 | 1,537,000 | 1,818,711 | ||||||
Regions Financial Corp | ||||||||
7.75%, 11/10/2014 | 30,000 | 31,651 | ||||||
5.75%, 06/15/2015 | 215,000 | 229,088 | ||||||
Royal Bank of Canada | ||||||||
2.30%, 07/20/2016 | 867,000 | 896,286 | ||||||
1.20%, 09/19/2017 | 727,000 | 720,336 | ||||||
2.20%, 07/27/2018 | 155,000 | 155,629 | ||||||
2.00%, 10/01/2018 | 1,231,000 | 1,224,611 | ||||||
Royal Bank of Scotland PLC/The | ||||||||
6.13%, 01/11/2021 | 338,000 | 382,569 |
Santander Bank NA | ||||||||
8.75%, 05/30/2018 | 4,878,000 | 5,861,132 | ||||||
Santander Issuances SAU | ||||||||
6.50%, 08/11/2019 (Acquired 10/28/2013, Cost $204,989) (a) | 200,000 | 205,458 | ||||||
Simon Property Group LP | ||||||||
6.75%, 05/15/2014 | 170,000 | 171,191 | ||||||
5.63%, 08/15/2014 | 183,000 | 187,334 | ||||||
4.20%, 02/01/2015 | 46,000 | 47,352 | ||||||
6.10%, 05/01/2016 | 219,000 | 241,842 | ||||||
2.15%, 09/15/2017 | 946,000 | 959,056 | ||||||
6.13%, 05/30/2018 | 379,000 | 438,811 | ||||||
7.38%, 06/15/2018 | 3,000,000 | 3,587,628 | ||||||
5.65%, 02/01/2020 | 114,000 | 129,615 | ||||||
4.38%, 03/01/2021 | 6,818,000 | 7,208,958 | ||||||
4.13%, 12/01/2021 | 442,000 | 457,248 | ||||||
Skandinaviska Enskilda Banken AB | ||||||||
1.75%, 03/19/2018 (Acquired 10/28/2013, Cost $295,591) (a) | 299,000 | 292,908 | ||||||
2.38%, 11/20/2018 (Acquired 11/13/2013, Cost $4,995,551) (a) | 5,000,000 | 4,967,450 | ||||||
SLM Corp | ||||||||
5.38%, 05/15/2014 | 420,000 | 427,350 | ||||||
5.63%, 08/01/2033 | 54,000 | 44,752 | ||||||
SouthTrust Bank | ||||||||
7.69%, 05/15/2025 | 253,000 | 299,208 | ||||||
SpareBank 1 Boligkreditt AS | ||||||||
1.75%, 11/15/2019 (Acquired 10/28/2013, Cost $1,697,528) (a) | 1,757,000 | 1,668,271 | ||||||
Springleaf Finance Corp | ||||||||
6.90%, 12/15/2017 | 100,000 | 109,300 | ||||||
Stadshypotek AB | ||||||||
1.88%, 10/02/2019 (Acquired 10/28/2013, Cost $670,722) (a) | 683,000 | 658,275 | ||||||
Standard Chartered PLC | ||||||||
5.20%, 01/26/2024 (Acquired 10/28/2013, Cost $632,088) (a) | 609,000 | 607,779 | ||||||
State Street Corp | ||||||||
3.10%, 05/15/2023 | 321,000 | 298,468 | ||||||
3.70%, 11/20/2023 | 1,385,000 | 1,374,111 | ||||||
Sumitomo Mitsui Banking Corp | ||||||||
3.95%, 07/19/2023 | 250,000 | 248,899 | ||||||
SunTrust Bank/Atlanta GA | ||||||||
7.25%, 03/15/2018 | 226,000 | 265,908 |
SunTrust Banks Inc | ||||||||
6.00%, 09/11/2017 | 103,000 | 116,650 | ||||||
Susa Partnership LP | ||||||||
8.20%, 06/01/2017 | 111,000 | 131,340 | ||||||
Svenska Handelsbanken AB | ||||||||
3.13%, 07/12/2016 | 691,000 | 722,722 | ||||||
0.72%, 09/23/2016 | 5,000,000 | 5,005,435 | ||||||
2.50%, 01/25/2019 | 2,000,000 | 2,015,556 | ||||||
Swedbank AB | ||||||||
2.13%, 09/29/2017 (Acquired 10/28/2013, Cost $217,516) (a) | 215,000 | 215,065 | ||||||
Symetra Financial Corp | ||||||||
6.13%, 04/01/2016 (Acquired 10/28/2013, Cost $114,219) (a) | 107,000 | 113,901 | ||||||
TD Ameritrade Holding Corp | ||||||||
5.60%, 12/01/2019 | 355,000 | 409,783 | ||||||
Teachers Insurance & Annuity Association of America | ||||||||
6.85%, 12/16/2039 (Acquired 11/22/2013, Cost $3,215,317) (a) | 2,580,000 | 3,184,724 | ||||||
Toronto-Dominion Bank/The | ||||||||
2.20%, 07/29/2015 (Acquired 10/28/2013, Cost $958,129) (a) | 933,000 | 957,725 | ||||||
2.50%, 07/14/2016 | 556,000 | 576,724 | ||||||
1.50%, 03/13/2017 (Acquired 10/28/2013, Cost $1,465,288) (a) | 1,445,000 | 1,460,461 | ||||||
Travelers Cos Inc/The | ||||||||
5.80%, 05/15/2018 | 110,000 | 126,715 | ||||||
UBS AG/Stamford CT | ||||||||
3.88%, 01/15/2015 | 783,000 | 809,508 | ||||||
5.75%, 04/25/2018 | 511,000 | 586,654 | ||||||
Wachovia Bank NA | ||||||||
5.00%, 08/15/2015 | 485,000 | 517,213 | ||||||
0.57%, 03/15/2016 | 457,000 | 454,801 | ||||||
6.00%, 11/15/2017 | 2,224,000 | 2,566,274 | ||||||
Wachovia Corp | ||||||||
5.75%, 06/15/2017 | 315,000 | 359,319 | ||||||
5.75%, 02/01/2018 | 1,865,000 | 2,150,490 | ||||||
WEA Finance LLC / WT Finance Aust Pty Ltd | ||||||||
6.75%, 09/02/2019 (Acquired 10/28/2013 through 11/27/2013, Cost $7,699,431) (a) | 6,415,000 | 7,627,467 | ||||||
WEA Finance LLC / WT Finance Aust Pty Ltd / WT Finance NZ Ltd | ||||||||
3.38%, 10/03/2022 (Acquired 10/28/2013, Cost $401,506) (a) | 418,000 | 395,718 |
Wells Fargo & Co | ||||||||
3.68%, 06/15/2016 | 1,723,000 | 1,834,554 | ||||||
2.63%, 12/15/2016 | 1,583,000 | 1,657,849 | ||||||
5.63%, 12/11/2017 | 948,000 | 1,086,593 | ||||||
4.60%, 04/01/2021 | 877,000 | 961,391 | ||||||
3.50%, 03/08/2022 | 929,000 | 929,245 | ||||||
5.61%, 01/15/2044 (Acquired 10/28/2013, Cost $345,626) (a) | 317,000 | 329,264 | ||||||
Wells Fargo Bank NA | ||||||||
4.75%, 02/09/2015 | 503,000 | 525,600 | ||||||
Westpac Banking Corp | ||||||||
4.20%, 02/27/2015 | 495,000 | 516,068 | ||||||
2.45%, 11/28/2016 (Acquired 10/28/2013, Cost $702,556) (a) | 676,000 | 701,215 | ||||||
1.60%, 01/12/2018 | 846,000 | 833,422 | ||||||
0.98%, 07/30/2018 | 3,060,000 | 3,075,110 | ||||||
4.88%, 11/19/2019 | 1,105,000 | 1,226,152 | ||||||
Weyerhaeuser Co | ||||||||
7.38%, 03/15/2032 | 500,000 | 611,828 | ||||||
Willis North America Inc | ||||||||
5.63%, 07/15/2015 | 81,000 | 86,450 | ||||||
7.00%, 09/29/2019 | 537,000 | 621,348 | ||||||
XLIT Ltd | ||||||||
2.30%, 12/15/2018 | 4,375,000 | 4,297,077 | ||||||
5.25%, 12/15/2043 | 2,700,000 | 2,718,083 | ||||||
|
| |||||||
| 717,894,500 | ||||||||
|
| |||||||
Industrials - 0.98% | ||||||||
ABB Finance USA Inc | ||||||||
1.63%, 05/08/2017 | 173,000 | 172,656 | ||||||
2.88%, 05/08/2022 | 241,000 | 227,729 | ||||||
4.38%, 05/08/2042 | 107,000 | 98,055 | ||||||
Acuity Brands Lighting Inc | ||||||||
6.00%, 12/15/2019 | 451,000 | 486,297 | ||||||
BAE Systems Holdings Inc | ||||||||
6.38%, 06/01/2019 (Acquired 10/28/2013, Cost $280,526) (a) | 243,000 | 281,228 | ||||||
BAE Systems PLC | ||||||||
5.80%, 10/11/2041 (Acquired 10/28/2013, Cost $579,956) (a) | 550,000 | 569,711 | ||||||
Boeing Co/The | ||||||||
3.50%, 02/15/2015 | 26,000 | 26,857 | ||||||
4.88%, 02/15/2020 | 52,000 | 57,977 | ||||||
7.95%, 08/15/2024 | 124,000 | 165,441 | ||||||
Burlington Northern Santa Fe LLC | ||||||||
7.00%, 02/01/2014 | 134,000 | 134,669 | ||||||
5.65%, 05/01/2017 | 378,000 | 423,931 | ||||||
5.75%, 03/15/2018 | 173,000 | 197,234 | ||||||
3.60%, 09/01/2020 | 146,000 | 148,108 | ||||||
3.45%, 09/15/2021 | 215,000 | 212,331 | ||||||
3.05%, 03/15/2022 | 440,000 | 417,047 | ||||||
3.00%, 03/15/2023 | 206,000 | 191,840 | ||||||
6.70%, 08/01/2028 | 62,000 | 71,517 | ||||||
7.29%, 06/01/2036 | 134,000 | 168,008 | ||||||
5.75%, 05/01/2040 | 373,000 | 409,328 | ||||||
5.40%, 06/01/2041 | 542,000 | 562,171 | ||||||
4.38%, 09/01/2042 | 462,000 | 412,768 | ||||||
5.15%, 09/01/2043 | 4,889,000 | 4,966,652 | ||||||
Canadian Pacific Railway Co | ||||||||
7.13%, 10/15/2031 | 155,000 | 186,400 | ||||||
Caterpillar Financial Services Corp | ||||||||
5.50%, 03/15/2016 | 93,000 | 101,902 | ||||||
5.45%, 04/15/2018 | 103,000 | 117,078 | ||||||
7.05%, 10/01/2018 | 361,000 | 435,544 | ||||||
7.15%, 02/15/2019 | 62,000 | 76,212 | ||||||
2.85%, 06/01/2022 | 446,000 | 424,219 | ||||||
3.75%, 11/24/2023 | 2,825,000 | 2,789,105 | ||||||
Caterpillar Inc | ||||||||
1.50%, 06/26/2017 | 193,000 | 192,065 | ||||||
2.60%, 06/26/2022 | 220,000 | 203,955 | ||||||
CRH America Inc | ||||||||
6.00%, 09/30/2016 | 172,000 | 192,145 | ||||||
CSX Corp | ||||||||
6.25%, 04/01/2015 | 175,000 | 187,048 | ||||||
7.90%, 05/01/2017 | 413,000 | 493,471 | ||||||
7.38%, 02/01/2019 | 72,000 | 87,351 | ||||||
4.25%, 06/01/2021 | 205,000 | 214,059 | ||||||
5.50%, 04/15/2041 | 402,000 | 422,774 | ||||||
4.10%, 03/15/2044 | 3,535,000 | 2,995,566 | ||||||
Danaher Corp | ||||||||
3.90%, 06/23/2021 | 387,000 | 400,418 | ||||||
Deere & Co | ||||||||
2.60%, 06/08/2022 | 619,000 | 578,806 | ||||||
3.90%, 06/09/2042 | 275,000 | 241,269 | ||||||
EADS Finance BV | ||||||||
2.70%, 04/17/2023 (Acquired 10/28/2013, Cost $353,429) (a) | 376,000 | 344,823 | ||||||
Eaton Corp | ||||||||
1.50%, 11/02/2017 | 163,000 | 159,794 | ||||||
5.60%, 05/15/2018 | 273,000 | 306,159 | ||||||
7.63%, 04/01/2024 | 206,000 | 249,549 | ||||||
4.00%, 11/02/2032 | 143,000 | 131,333 | ||||||
Federal Express Corp 1998 Pass Through Trust | ||||||||
6.85%, 01/15/2019 | 271,692 | 300,219 | ||||||
6.72%, 01/15/2022 | 233,554 | 273,258 | ||||||
Fluor Corp | ||||||||
3.38%, 09/15/2021 | 565,000 | 550,709 | ||||||
General Electric Co | ||||||||
2.70%, 10/09/2022 | 350,000 | 327,600 | ||||||
Hanson Ltd | ||||||||
6.13%, 08/15/2016 | 625,000 | 685,937 | ||||||
Holcim US Finance Sarl & Cie SCS | ||||||||
6.00%, 12/30/2019 (Acquired 10/28/2013, Cost $169,136) (a) | 148,000 | 167,278 | ||||||
Honeywell International Inc | ||||||||
5.30%, 03/01/2018 | 155,000 | 175,214 | ||||||
Illinois Tool Works Inc | ||||||||
3.90%, 09/01/2042 | 1,754,000 | 1,501,001 | ||||||
Ingersoll-Rand Co | ||||||||
6.39%, 11/15/2027 | 80,000 | 91,325 | ||||||
Ingersoll-Rand Global Holding Co Ltd | ||||||||
4.25%, 06/15/2023 (Acquired 10/28/2013, Cost $331,232) (a) | 329,000 | 321,338 | ||||||
Koninklijke Philips NV | ||||||||
5.75%, 03/11/2018 | 172,000 | 196,774 | ||||||
3.75%, 03/15/2022 | 864,000 | 864,467 | ||||||
7.20%, 06/01/2026 | 57,000 | 67,871 | ||||||
Lafarge SA | ||||||||
6.50%, 07/15/2016 | 1,650,000 | 1,823,250 | ||||||
7.13%, 07/15/2036 | 107,000 | 111,547 | ||||||
Lockheed Martin Corp | ||||||||
2.13%, 09/15/2016 | 318,000 | 326,264 | ||||||
4.25%, 11/15/2019 | 103,000 | 110,759 | ||||||
4.85%, 09/15/2041 | 181,000 | 177,876 | ||||||
4.07%, 12/15/2042 | 462,000 | 403,979 | ||||||
Martin Marietta Materials Inc | ||||||||
6.25%, 05/01/2037 | 107,000 | 100,212 | ||||||
Masco Corp | ||||||||
6.13%, 10/03/2016 | 175,000 | 196,000 | ||||||
Norfolk Southern Corp | ||||||||
7.70%, 05/15/2017 | 14,000 | 16,617 | ||||||
3.25%, 12/01/2021 | 570,000 | 552,315 | ||||||
2.90%, 02/15/2023 | 294,000 | 271,562 | ||||||
5.59%, 05/17/2025 | 6,000 | 6,557 | ||||||
3.95%, 10/01/2042 | 332,000 | 279,349 | ||||||
4.80%, 08/15/2043 | 3,400,000 | 3,292,825 | ||||||
6.00%, 03/15/2105 | 351,000 | 372,908 | ||||||
6.00%, 05/23/2111 | 1,274,000 | 1,348,948 | ||||||
Northrop Grumman Systems Corp | ||||||||
7.75%, 02/15/2031 | 206,000 | 262,723 | ||||||
Odebrecht Finance Ltd | ||||||||
5.13%, 06/26/2022 (Acquired 12/02/2013, Cost $1,274,271) (a) | 1,300,000 | 1,272,375 | ||||||
Pactiv LLC | ||||||||
7.95%, 12/15/2025 | 34,000 | 31,875 | ||||||
Parker Hannifin Corp | ||||||||
5.50%, 05/15/2018 | 80,000 | 90,625 | ||||||
Penske Truck Leasing Co Lp / PTL Finance Corp | ||||||||
2.88%, 07/17/2018 (Acquired 10/28/2013, Cost $433,656) (a) | 431,000 | 433,536 | ||||||
Precision Castparts Corp | ||||||||
0.70%, 12/20/2015 | 244,000 | 244,029 | ||||||
Republic Services Inc | ||||||||
5.25%, 11/15/2021 | 2,795,000 | 3,047,235 | ||||||
3.55%, 06/01/2022 | 496,000 | 478,260 | ||||||
Ryder System Inc | ||||||||
3.60%, 03/01/2016 | 278,000 | 290,035 | ||||||
2.50%, 03/01/2017 | 330,000 | 335,730 | ||||||
Siemens Financieringsmaatschappij NV | ||||||||
5.75%, 10/17/2016 (Acquired 10/28/2013, Cost $156,848) (a) | 139,000 | 156,626 | ||||||
Tyco Electronics Group SA | ||||||||
6.55%, 10/01/2017 | 752,000 | 860,586 | ||||||
2.38%, 12/17/2018 | 7,025,000 | 6,927,268 | ||||||
Union Pacific Corp | ||||||||
4.88%, 01/15/2015 | 18,000 | 18,802 | ||||||
4.16%, 07/15/2022 | 453,000 | 466,039 | ||||||
2.95%, 01/15/2023 | 149,000 | 137,709 | ||||||
3.65%, 02/15/2024 (Acquired 10/28/2013, Cost $143,361) (a) | 142,000 | 137,206 | ||||||
4.30%, 06/15/2042 | 165,000 | 149,306 | ||||||
4.82%, 02/01/2044 (Acquired 10/28/2013, Cost $108,429) (a) | 106,000 | 102,663 | ||||||
Union Pacific Railroad Co 2003 Pass Through Trust | ||||||||
4.70%, 01/02/2024 | 29,447 | 31,903 | ||||||
United Parcel Service Inc | ||||||||
2.45%, 10/01/2022 | 186,000 | 170,918 | ||||||
United Parcel Service of America Inc | ||||||||
8.38%, 04/01/2020 | 243,000 | 314,354 | ||||||
8.38%, 04/01/2030 | 83,000 | 112,028 | ||||||
United Technologies Corp | ||||||||
1.80%, 06/01/2017 | 205,000 | 208,160 | ||||||
6.13%, 02/01/2019 | 867,000 | 1,023,410 | ||||||
3.10%, 06/01/2022 | 524,000 | 512,358 | ||||||
4.50%, 06/01/2042 | 693,000 | 672,963 | ||||||
Vulcan Materials Co | ||||||||
7.00%, 06/15/2018 | 215,000 | 244,562 | ||||||
7.15%, 11/30/2037 | 54,000 | 53,460 | ||||||
Wabtec Corp/DE | ||||||||
4.38%, 08/15/2023 | 322,000 | 318,233 | ||||||
Waste Management Inc | ||||||||
7.38%, 03/11/2019 | 1,275,000 | 1,542,063 | ||||||
4.75%, 06/30/2020 | 195,000 | 212,045 | ||||||
|
| |||||||
| 57,705,644 | ||||||||
|
| |||||||
Technology - 0.76% | ||||||||
Apple Inc | ||||||||
0.49%, 05/03/2018 | 790,000 | 788,663 | ||||||
2.40%, 05/03/2023 | 2,081,000 | 1,871,258 | ||||||
Computer Sciences Corp | ||||||||
2.50%, 09/15/2015 | 564,000 | 575,684 | ||||||
Dell Inc | ||||||||
7.10%, 04/15/2028 | 196,000 | 172,480 | ||||||
EMC Corp/MA | ||||||||
1.88%, 06/01/2018 | 640,000 | 632,730 | ||||||
3.38%, 06/01/2023 | 764,000 | 734,052 | ||||||
Fidelity National Information Services Inc | ||||||||
7.88%, 07/15/2020 | 4,371,000 | 4,768,582 | ||||||
3.50%, 04/15/2023 | 430,000 | 391,950 | ||||||
Fiserv Inc | ||||||||
4.63%, 10/01/2020 | 215,000 | 220,106 | ||||||
Hewlett-Packard Co | ||||||||
4.75%, 06/02/2014 | 196,000 | 199,139 | ||||||
2.35%, 03/15/2015 | 3,650,000 | 3,707,119 | ||||||
4.30%, 06/01/2021 | 372,000 | 377,040 | ||||||
4.38%, 09/15/2021 | 293,000 | 298,341 | ||||||
4.65%, 12/09/2021 | 326,000 | 335,674 | ||||||
6.00%, 09/15/2041 | 1,003,000 | 1,004,933 | ||||||
HP Enterprise Services LLC | ||||||||
7.45%, 10/15/2029 | 250,000 | 281,279 | ||||||
Intel Corp | ||||||||
3.30%, 10/01/2021 | 504,000 | 500,720 | ||||||
4.00%, 12/15/2032 | 595,000 | 548,397 | ||||||
International Business Machines Corp | ||||||||
1.95%, 07/22/2016 | 532,000 | 546,549 | ||||||
1.25%, 02/06/2017 | 571,000 | 569,514 | ||||||
5.70%, 09/14/2017 | 408,000 | 468,505 | ||||||
7.63%, 10/15/2018 | 464,000 | 580,400 | ||||||
1.63%, 05/15/2020 | 2,670,000 | 2,503,742 | ||||||
6.22%, 08/01/2027 | 68,000 | 80,426 | ||||||
4.00%, 06/20/2042 | 79,000 | 70,541 | ||||||
Intuit Inc | ||||||||
5.75%, 03/15/2017 | 359,000 | 401,393 | ||||||
Microsoft Corp | ||||||||
0.88%, 11/15/2017 | 238,000 | 234,320 | ||||||
2.13%, 11/15/2022 | 350,000 | 316,186 | ||||||
2.38%, 05/01/2023 | 655,000 | 592,580 | ||||||
3.63%, 12/15/2023 | 5,470,000 | 5,478,550 | ||||||
4.50%, 10/01/2040 | 125,000 | 118,747 | ||||||
National Semiconductor Corp | ||||||||
6.60%, 06/15/2017 | 855,000 | 999,202 | ||||||
Oracle Corp | ||||||||
5.25%, 01/15/2016 | 239,000 | 260,893 | ||||||
5.75%, 04/15/2018 | 351,000 | 405,604 | ||||||
5.00%, 07/08/2019 | 547,000 | 619,251 | ||||||
3.63%, 07/15/2023 | 149,000 | 147,803 | ||||||
6.50%, 04/15/2038 | 201,000 | 244,889 | ||||||
6.13%, 07/08/2039 | 265,000 | 308,775 | ||||||
Pitney Bowes Inc | ||||||||
5.60%, 03/15/2018 | 175,000 | 188,264 | ||||||
Seagate HDD Cayman | ||||||||
6.88%, 05/01/2020 | 5,679,000 | 6,140,419 | ||||||
Texas Instruments Inc | ||||||||
1.65%, 08/03/2019 | 434,000 | 418,052 | ||||||
Xerox Corp | ||||||||
8.25%, 05/15/2014 | 593,000 | 608,893 | ||||||
6.40%, 03/15/2016 | 1,379,000 | 1,524,195 | ||||||
6.75%, 02/01/2017 | 2,170,000 | 2,464,573 | ||||||
2.95%, 03/15/2017 | 202,000 | 207,371 | ||||||
5.63%, 12/15/2019 | 521,000 | 574,518 | ||||||
4.50%, 05/15/2021 | 183,000 | 188,359 | ||||||
|
| |||||||
| 44,670,661 | ||||||||
|
| |||||||
Utilities - 1.60% | ||||||||
AGL Capital Corp | ||||||||
4.95%, 01/15/2015 | 1,600,000 | 1,664,062 | ||||||
6.38%, 07/15/2016 | 691,000 | 770,499 | ||||||
3.50%, 09/15/2021 | 530,000 | 527,299 | ||||||
5.88%, 03/15/2041 | 1,210,000 | 1,327,168 | ||||||
4.40%, 06/01/2043 | 160,000 | 144,265 | ||||||
Alabama Power Co | ||||||||
6.13%, 05/15/2038 | 219,000 | 258,826 | ||||||
6.00%, 03/01/2039 | 89,000 | 103,850 | ||||||
Ameren Corp | ||||||||
8.88%, 05/15/2014 | 741,000 | 762,250 | ||||||
American Electric Power Co Inc | ||||||||
1.65%, 12/15/2017 | 246,000 | 241,034 | ||||||
American Water Capital Corp | ||||||||
3.85%, 03/01/2024 | 500,000 | 493,969 | ||||||
6.59%, 10/15/2037 | 386,000 | 468,195 | ||||||
Appalachian Power Co | ||||||||
6.70%, 08/15/2037 | 430,000 | 498,056 | ||||||
Arizona Public Service Co | ||||||||
4.65%, 05/15/2015 | 115,000 | 120,789 | ||||||
8.75%, 03/01/2019 | 91,000 | 115,660 | ||||||
5.05%, 09/01/2041 | 349,000 | 358,206 | ||||||
4.50%, 04/01/2042 | 221,000 | 211,618 | ||||||
Atmos Energy Corp | ||||||||
8.50%, 03/15/2019 | 71,000 | 90,984 | ||||||
4.15%, 01/15/2043 | 830,000 | 746,562 | ||||||
Baltimore Gas & Electric Co | ||||||||
2.80%, 08/15/2022 | 509,000 | 473,815 | ||||||
Beaver Valley II Funding Corp | ||||||||
9.00%, 06/01/2017 | 55,000 | 55,314 | ||||||
Boston Gas Co | ||||||||
4.49%, 02/15/2042 (Acquired 10/28/2013, Cost $241,241) (a) | 253,000 | 239,164 | ||||||
CenterPoint Energy Inc | ||||||||
6.50%, 05/01/2018 | 390,000 | 455,058 | ||||||
Centrica PLC | ||||||||
4.00%, 10/16/2023 (Acquired 11/18/2013, Cost $4,975,201) (a) | 5,000,000 | 4,869,840 | ||||||
Cleveland Electric Illuminating Co/The | ||||||||
7.88%, 11/01/2017 | 356,000 | 427,269 | ||||||
Comision Federal de Electricidad | ||||||||
4.88%, 05/26/2021 (Acquired 10/28/2013, Cost $572,420) (a) | 551,000 | 568,908 | ||||||
4.88%, 01/15/2024 (Acquired 10/28/2013 through 11/22/2013, Cost $1,822,365) (a) | 1,822,000 | 1,808,335 | ||||||
Connecticut Light & Power Co/The | ||||||||
5.65%, 05/01/2018 | 95,000 | 108,515 | ||||||
Consolidated Edison Co of New York Inc | ||||||||
5.70%, 06/15/2040 | 318,000 | 360,877 | ||||||
Constellation Energy Group Inc | ||||||||
4.55%, 06/15/2015 | 630,000 | 661,329 | ||||||
Consumers Energy Co | ||||||||
5.65%, 04/15/2020 | 144,000 | 166,003 | ||||||
2.85%, 05/15/2022 | 155,000 | 147,681 | ||||||
Delmarva Power & Light Co | ||||||||
4.00%, 06/01/2042 | 170,000 | 150,833 | ||||||
Dominion Resources Inc/VA | ||||||||
6.00%, 11/30/2017 | 61,000 | 69,816 | ||||||
8.88%, 01/15/2019 | 165,000 | 209,652 | ||||||
5.25%, 08/01/2033 | 583,000 | 614,905 | ||||||
7.00%, 06/15/2038 | 124,000 | 155,794 | ||||||
4.90%, 08/01/2041 | 212,000 | 203,482 | ||||||
DTE Electric Co | ||||||||
2.65%, 06/15/2022 | 194,000 | 181,947 | ||||||
DTE Energy Co | ||||||||
3.85%, 12/01/2023 | 292,000 | 288,298 | ||||||
Duke Energy Carolinas LLC | ||||||||
5.10%, 04/15/2018 | 144,000 | 162,257 | ||||||
4.30%, 06/15/2020 | 205,000 | 219,827 | ||||||
6.00%, 01/15/2038 | 161,000 | 189,786 | ||||||
4.25%, 12/15/2041 | 141,000 | 131,288 | ||||||
Duke Energy Corp | ||||||||
3.95%, 09/15/2014 | 194,000 | 198,605 | ||||||
2.15%, 11/15/2016 | 439,000 | 449,907 | ||||||
6.25%, 06/15/2018 | 1,781,000 | 2,061,718 | ||||||
3.55%, 09/15/2021 | 306,000 | 306,075 | ||||||
Duke Energy Florida Inc | ||||||||
5.65%, 06/15/2018 | 116,000 | 132,949 | ||||||
6.40%, 06/15/2038 | 72,000 | 88,772 | ||||||
Duke Energy Indiana Inc | ||||||||
3.75%, 07/15/2020 | 398,000 | 412,575 | ||||||
6.35%, 08/15/2038 | 320,000 | 389,849 | ||||||
Duke Energy Progress Inc | ||||||||
5.30%, 01/15/2019 | 206,000 | 234,309 | ||||||
3.00%, 09/15/2021 | 372,000 | 364,312 | ||||||
2.80%, 05/15/2022 | 335,000 | 319,148 | ||||||
4.10%, 05/15/2042 | 217,000 | 200,384 | ||||||
4.10%, 03/15/2043 | 181,000 | 166,943 |
Enel Finance International NV | ||||||||
5.13%, 10/07/2019 (Acquired 10/28/2013, Cost $949,380) (a) | 888,000 | 948,073 | ||||||
6.80%, 09/15/2037 (Acquired 10/28/2013, Cost $211,129) (a) | 204,000 | 211,450 | ||||||
6.00%, 10/07/2039 (Acquired 10/28/2013, Cost $98,541) (a) | 103,000 | 98,791 | ||||||
Exelon Generation Co LLC | ||||||||
6.20%, 10/01/2017 | 3,436,000 | 3,882,838 | ||||||
4.00%, 10/01/2020 | 619,000 | 618,760 | ||||||
5.75%, 10/01/2041 | 192,000 | 183,911 | ||||||
Florida Power & Light Co | ||||||||
5.95%, 10/01/2033 | 402,000 | 473,333 | ||||||
5.63%, 04/01/2034 | 57,000 | 64,680 | ||||||
5.95%, 02/01/2038 | 103,000 | 120,697 | ||||||
Georgia Power Co | ||||||||
5.95%, 02/01/2039 | 41,000 | 45,311 | ||||||
GG1C Funding Corp | ||||||||
5.13%, 01/15/2014 (Acquired 10/28/2013, Cost $19,742) (a) | 19,723 | 19,741 | ||||||
Great Plains Energy Inc | ||||||||
4.85%, 06/01/2021 | 156,000 | 164,368 | ||||||
Hydro-Quebec | ||||||||
9.40%, 02/01/2021 | 186,000 | 248,921 | ||||||
8.40%, 01/15/2022 | 826,000 | 1,079,425 | ||||||
8.05%, 07/07/2024 | 258,000 | 343,643 | ||||||
Indiana Michigan Power Co | ||||||||
7.00%, 03/15/2019 | 112,000 | 133,200 | ||||||
3.20%, 03/15/2023 | 991,000 | 926,382 | ||||||
Jersey Central Power & Light Co | ||||||||
7.35%, 02/01/2019 | 31,000 | 36,608 | ||||||
John Sevier Combined Cycle Generation LLC | ||||||||
4.63%, 01/15/2042 | 477,520 | 467,731 | ||||||
Kansas City Power & Light Co | ||||||||
3.15%, 03/15/2023 | 375,000 | 347,753 | ||||||
5.30%, 10/01/2041 | 1,032,000 | 1,032,675 | ||||||
Korea Electric Power Corp | ||||||||
6.75%, 08/01/2027 | 233,000 | 278,024 | ||||||
Korea Gas Corp | ||||||||
4.25%, 11/02/2020 (Acquired 10/28/2013, Cost $293,649) (a) | 279,000 | 289,785 | ||||||
Korea Hydro & Nuclear Power Co Ltd | ||||||||
2.88%, 10/02/2018 (Acquired 11/18/2013, Cost $4,042,903) (a) | 4,000,000 | 3,976,852 | ||||||
Mega Advance Investments Ltd | ||||||||
5.00%, 05/12/2021 (Acquired 10/28/2013, Cost $620,943) (a) | 591,000 | 605,368 | ||||||
MidAmerican Energy Co | ||||||||
5.30%, 03/15/2018 | 72,000 | 81,598 | ||||||
MidAmerican Energy Holdings Co | ||||||||
5.75%, 04/01/2018 | 168,000 | 191,771 | ||||||
Nevada Power Co | ||||||||
6.50%, 08/01/2018 | 232,000 | 274,700 | ||||||
7.13%, 03/15/2019 | 188,000 | 228,748 | ||||||
5.38%, 09/15/2040 | 38,000 | 40,700 | ||||||
5.45%, 05/15/2041 | 386,000 | 418,097 | ||||||
NextEra Energy Capital Holdings Inc | ||||||||
1.20%, 06/01/2015 | 168,000 | 168,861 | ||||||
7.88%, 12/15/2015 | 165,000 | 186,493 | ||||||
6.00%, 03/01/2019 | 124,000 | 140,479 | ||||||
7.30%, 09/01/2067 | 295,000 | 324,500 | ||||||
Niagara Mohawk Power Corp | ||||||||
4.88%, 08/15/2019 (Acquired 10/28/2013, Cost $188,092) (a) | 168,000 | 185,716 | ||||||
Nisource Finance Corp | ||||||||
5.40%, 07/15/2014 | 6,000,000 | 6,147,528 | ||||||
4.45%, 12/01/2021 | 186,000 | 188,464 | ||||||
3.85%, 02/15/2023 | 283,000 | 272,314 | ||||||
5.80%, 02/01/2042 | 774,000 | 805,050 | ||||||
Northern States Power Co/MN | ||||||||
6.25%, 06/01/2036 | 258,000 | 311,215 | ||||||
Ohio Power Co | ||||||||
6.05%, 05/01/2018 | 160,000 | 182,900 | ||||||
5.38%, 10/01/2021 | 65,000 | 72,521 | ||||||
Oncor Electric Delivery Co LLC | ||||||||
6.80%, 09/01/2018 | 635,000 | 746,266 | ||||||
7.00%, 09/01/2022 | 124,000 | 147,931 | ||||||
Pacific Gas & Electric Co | ||||||||
5.63%, 11/30/2017 | 204,000 | 231,127 | ||||||
8.25%, 10/15/2018 | 4,484,000 | 5,608,036 | ||||||
3.25%, 09/15/2021 | 146,000 | 143,397 | ||||||
2.45%, 08/15/2022 | 581,000 | 521,590 | ||||||
3.25%, 06/15/2023 | 206,000 | 195,407 | ||||||
6.05%, 03/01/2034 | 46,000 | 52,693 | ||||||
4.50%, 12/15/2041 | 749,000 | 704,197 | ||||||
4.45%, 04/15/2042 | 194,000 | 181,975 | ||||||
PacifiCorp | ||||||||
5.65%, 07/15/2018 | 294,000 | 337,723 | ||||||
5.50%, 01/15/2019 | 26,000 | 29,858 | ||||||
3.85%, 06/15/2021 | 103,000 | 106,674 | ||||||
Peco Energy Co | ||||||||
5.35%, 03/01/2018 | 93,000 | 105,512 | ||||||
2.38%, 09/15/2022 | 578,000 | 525,266 | ||||||
Pennsylvania Electric Co | ||||||||
6.05%, 09/01/2017 | 93,000 | 103,663 | ||||||
Potomac Electric Power Co | ||||||||
6.50%, 11/15/2037 | 136,000 | 168,744 | ||||||
PPL Electric Utilities Corp | ||||||||
2.50%, 09/01/2022 | 178,000 | 164,092 | ||||||
PPL Energy Supply LLC | ||||||||
5.70%, 10/15/2015 | 221,000 | 233,193 | ||||||
4.60%, 12/15/2021 | 980,000 | 941,727 | ||||||
Progress Energy Inc | ||||||||
6.05%, 03/15/2014 | 75,000 | 75,834 | ||||||
4.40%, 01/15/2021 | 390,000 | 411,568 | ||||||
3.15%, 04/01/2022 | 389,000 | 374,553 | ||||||
7.75%, 03/01/2031 | 153,000 | 197,027 | ||||||
PSEG Power LLC | ||||||||
5.50%, 12/01/2015 | 226,000 | 244,825 | ||||||
5.32%, 09/15/2016 | 346,000 | 380,697 | ||||||
5.13%, 04/15/2020 | 679,000 | 740,486 | ||||||
4.15%, 09/15/2021 | 83,000 | 84,223 | ||||||
8.63%, 04/15/2031 | 130,000 | 176,800 | ||||||
Public Service Co of Colorado | ||||||||
5.80%, 08/01/2018 | 28,000 | 32,411 | ||||||
3.20%, 11/15/2020 | 120,000 | 120,617 | ||||||
2.25%, 09/15/2022 | 210,000 | 190,368 | ||||||
Public Service Co of New Hampshire | ||||||||
3.50%, 11/01/2023 | 101,000 | 98,891 | ||||||
Public Service Co of Oklahoma | ||||||||
5.15%, 12/01/2019 | 143,000 | 158,424 | ||||||
4.40%, 02/01/2021 | 203,000 | 214,808 | ||||||
6.63%, 11/15/2037 | 449,000 | 519,278 | ||||||
Public Service Electric & Gas Co | ||||||||
5.30%, 05/01/2018 | 85,000 | 96,058 | ||||||
5.38%, 11/01/2039 | 117,000 | 127,717 | ||||||
RGS I&M Funding Corp | ||||||||
9.82%, 12/07/2022 | 105,579 | 128,676 | ||||||
San Diego Gas & Electric Co | ||||||||
6.00%, 06/01/2026 | 213,000 | 254,214 | ||||||
3.95%, 11/15/2041 | 310,000 | 279,648 | ||||||
Sempra Energy | ||||||||
6.50%, 06/01/2016 | 93,000 | 104,644 | ||||||
6.15%, 06/15/2018 | 237,000 | 272,070 | ||||||
9.80%, 02/15/2019 | 841,000 | 1,110,992 | ||||||
2.88%, 10/01/2022 | 361,000 | 332,382 | ||||||
4.05%, 12/01/2023 | 10,325,000 | 10,195,256 | ||||||
6.00%, 10/15/2039 | 155,000 | 170,262 | ||||||
Southern California Edison Co | ||||||||
4.15%, 09/15/2014 | 124,000 | 127,243 | ||||||
5.50%, 08/15/2018 | 144,000 | 164,843 | ||||||
3.88%, 06/01/2021 | 102,000 | 107,157 | ||||||
3.50%, 10/01/2023 | 328,000 | 321,456 | ||||||
5.95%, 02/01/2038 | 67,000 | 77,980 | ||||||
6.05%, 03/15/2039 | 253,000 | 297,075 | ||||||
3.90%, 12/01/2041 | 392,000 | 346,574 | ||||||
Southern Co/The | ||||||||
4.15%, 05/15/2014 | 60,000 | 60,800 | ||||||
1.95%, 09/01/2016 | 307,000 | 313,299 | ||||||
Southern Power Co | ||||||||
5.15%, 09/15/2041 | 146,000 | 142,933 | ||||||
Southwestern Public Service Co | ||||||||
8.75%, 12/01/2018 | 351,000 | 447,374 | ||||||
State Grid Overseas Investment 2013 Ltd | ||||||||
1.75%, 05/22/2018 (Acquired 10/28/2013, Cost $237,491) (a) | 241,000 | 233,767 | ||||||
Talent Yield Investments Ltd | ||||||||
4.50%, 04/25/2022 (Acquired 10/28/2013, Cost $216,000) (a) | 215,000 | 211,393 | ||||||
Virginia Electric and Power Co | ||||||||
5.95%, 09/15/2017 | 83,000 | 95,705 | ||||||
5.40%, 04/30/2018 | 475,000 | 539,129 | ||||||
2.95%, 01/15/2022 | 80,000 | 77,292 | ||||||
4.65%, 08/15/2043 | 3,500,000 | 3,485,944 | ||||||
Westar Energy Inc | ||||||||
4.13%, 03/01/2042 | 4,175,000 | 3,805,174 | ||||||
Wisconsin Electric Power Co | ||||||||
6.25%, 12/01/2015 | 134,000 | 147,866 | ||||||
2.95%, 09/15/2021 | 27,000 | 26,531 | ||||||
Xcel Energy Inc | ||||||||
0.75%, 05/09/2016 | 28,000 | 27,764 | ||||||
4.70%, 05/15/2020 | 62,000 | 68,043 | ||||||
6.50%, 07/01/2036 | 351,000 | 418,169 | ||||||
4.80%, 09/15/2041 | 95,000 | 92,510 | ||||||
|
| |||||||
| 93,946,627 | ||||||||
|
| |||||||
| Total Corporate Bonds (Cost $1,533,633,801) | $ | 1,526,129,368 | ||||||
|
| |||||||
Government Related - 25.13% | ||||||||
American Municipal Power Inc | ||||||||
7.50%, 02/15/2050 | $ | 1,350,000 | $ | 1,648,458 | ||||
Atlanta Independent School System | ||||||||
5.56%, 03/01/2026 | 535,000 | 561,830 | ||||||
Brazilian Government International Bond | ||||||||
4.25%, 01/07/2025 | 3,150,000 | 3,000,375 | ||||||
California Qualified School Bond Joint Powers Authority | ||||||||
7.16%, 03/01/2027 | 805,000 | 852,511 | ||||||
California School Finance Authority | ||||||||
5.04%, 07/01/2020 | 270,000 | 286,141 | ||||||
5.04%, 01/01/2021 | 215,000 | 218,268 | ||||||
City of Los Angeles Department of Airports | ||||||||
6.58%, 05/15/2039 | 350,000 | 398,927 | ||||||
County of Contra Costa CA | ||||||||
5.14%, 06/01/2017 | 640,000 | 688,384 | ||||||
County of Cuyahoga OH | ||||||||
9.13%, 10/01/2023 | 105,000 | 95,784 | ||||||
Eaton Community City School District | ||||||||
5.39%, 08/25/2027 | 275,000 | 278,427 | ||||||
Elgin Local School District | ||||||||
5.50%, 08/31/2027 | 535,000 | 536,551 | ||||||
Fannie Mae Interest Strip | ||||||||
0.00%, 11/15/2021 | 1,187,000 | 914,354 | ||||||
Fannie Mae Principal Strip | ||||||||
0.00%, 05/15/2030 | 929,000 | 444,997 | ||||||
Federal Farm Credit Banks | ||||||||
5.13%, 11/15/2018 | 666,000 | 760,705 | ||||||
Federal Home Loan Banks | ||||||||
5.50%, 07/15/2036 | 1,135,000 | 1,313,010 | ||||||
Federal Home Loan Mortgage Corp | ||||||||
5.50%, 08/23/2017 | 996,000 | 1,146,187 | ||||||
5.13%, 11/17/2017 | 413,000 | 471,230 | ||||||
Federal National Mortgage Association | ||||||||
0.00%, 06/01/2017 | 2,735,000 | 2,607,205 | ||||||
2.00%, 09/20/2028 | 826,000 | 815,422 | ||||||
Financing Corp Fico | ||||||||
0.00%, 11/30/2017 | 404,000 | 378,109 | ||||||
0.00%, 04/06/2018 | 194,000 | 179,388 | ||||||
0.00%, 05/11/2018 | 6,860,000 | 6,323,253 | ||||||
0.00%, 08/03/2018 | 276,000 | 252,439 | ||||||
0.00%, 03/07/2019 | 205,000 | 182,805 | ||||||
0.00%, 04/05/2019 | 2,766,000 | 2,455,608 | ||||||
0.00%, 09/26/2019 | 3,174,000 | 2,740,530 | ||||||
Government Trust Certificate | ||||||||
0.00%, 04/01/2019 | 1,375,000 | 1,217,048 | ||||||
Indonesia Government International Bond | ||||||||
5.88%, 03/13/2020 | 5,000,000 | 5,285,000 | ||||||
Iowa Tobacco Settlement Authority | ||||||||
6.50%, 06/01/2023 | 700,000 | 679,385 | ||||||
Israel Government AID Bond | ||||||||
0.00%, 03/15/2018 | 1,032,000 | 958,377 | ||||||
0.00%, 08/15/2018 | 474,000 | 432,780 | ||||||
0.00%, 11/01/2019 | 345,000 | 298,776 | ||||||
0.00%, 08/15/2020 | 827,000 | 688,021 | ||||||
0.00%, 02/15/2022 | 464,000 | 354,991 | ||||||
5.50%, 09/18/2023 | 8,856,000 | 10,224,580 | ||||||
0.00%, 11/01/2023 | 413,000 | 286,468 | ||||||
0.00%, 11/01/2024 | 2,549,000 | 1,672,738 | ||||||
0.00%, 11/15/2026 | 258,000 | 150,913 | ||||||
5.50%, 09/18/2033 | 619,000 | 721,511 | ||||||
Mexico Government International Bond | ||||||||
5.88%, 01/15/2014 | 210,000 | 210,210 | ||||||
3.63%, 03/15/2022 | 2,000,000 | 2,000,000 | ||||||
4.00%, 10/02/2023 | 842,000 | 833,580 | ||||||
8.30%, 08/15/2031 | 103,000 | 139,050 | ||||||
7.50%, 04/08/2033 | 504,000 | 636,300 | ||||||
4.75%, 03/08/2044 | 450,000 | 405,562 | ||||||
5.75%, 10/12/2110 | 588,000 | 543,900 | ||||||
New Hampshire Housing Finance Authority | ||||||||
3.05%, 01/01/2021 | 135,000 | 132,855 | ||||||
3.75%, 07/01/2034 | 395,000 | 388,609 | ||||||
New York State Dormitory Authority | ||||||||
5.60%, 03/15/2040 | 260,000 | 285,506 | ||||||
Ohio State University/The | ||||||||
4.80%, 06/01/2111 | 1,102,000 | 953,539 | ||||||
Panama Government International Bond | ||||||||
5.20%, 01/30/2020 | 2,930,000 | 3,190,038 | ||||||
Poland Government International Bond | ||||||||
6.38%, 07/15/2019 | 1,000,000 | 1,168,750 | ||||||
Port Authority of New York & New Jersey | ||||||||
5.65%, 11/01/2040 | 1,260,000 | 1,356,340 | ||||||
4.46%, 10/01/2062 | 2,500,000 | 2,129,700 | ||||||
Province of Ontario Canada | ||||||||
2.95%, 02/05/2015 | 1,264,000 | 1,299,215 | ||||||
1.65%, 09/27/2019 | 1,315,000 | 1,262,137 | ||||||
Province of Quebec Canada | ||||||||
7.37%, 03/06/2026 | 58,000 | 75,158 | ||||||
Residual Funding Corp Principal Strip | ||||||||
0.00%, 07/15/2020 | 24,949,000 | 20,821,887 | ||||||
0.00%, 10/15/2020 | 5,841,000 | 4,808,200 | ||||||
0.00%, 01/15/2021 | 2,270,000 | 1,845,471 | ||||||
Rhode Island Housing & Mortgage Finance Corp/RI | ||||||||
4.00%, 10/01/2023 | 4,000,000 | 3,937,440 |
Russian Foreign Bond - Eurobond | ||||||||
7.50%, 03/31/2030 (Acquired 11/21/2013, Cost $2,686,984) (a) | 2,288,000 | 2,665,978 | ||||||
San Dieguito Public Facilities Authority | ||||||||
6.46%, 05/01/2027 | 685,000 | 724,442 | ||||||
South Africa Government International Bond | ||||||||
5.88%, 09/16/2025 | 403,000 | 419,120 | ||||||
State of California | ||||||||
7.30%, 10/01/2039 | 275,000 | 345,702 | ||||||
State of Illinois | ||||||||
5.10%, 06/01/2033 | 560,000 | 520,206 | ||||||
State Public School Building Authority | ||||||||
5.00%, 09/15/2027 | 537,000 | 558,340 | ||||||
Tennessee Valley Authority | ||||||||
5.88%, 04/01/2036 | 882,000 | 1,021,730 | ||||||
5.50%, 06/15/2038 | 57,000 | 62,606 | ||||||
5.25%, 09/15/2039 | 949,000 | 1,012,881 | ||||||
4.63%, 09/15/2060 | 303,000 | 271,012 | ||||||
Tennessee Valley Authority Generic Strip | ||||||||
0.00%, 01/15/2019 | 775,000 | 683,410 | ||||||
0.00%, 05/01/2019 | 1,238,000 | 1,077,278 | ||||||
Tennessee Valley Authority Principal Strip | ||||||||
0.00%, 12/15/2017 | 427,000 | 394,046 | ||||||
0.00%, 11/01/2025 | 1,847,000 | 1,111,159 | ||||||
0.00%, 06/15/2035 | 258,000 | 89,710 | ||||||
Three Rivers Local School District | ||||||||
5.21%, 09/15/2027 | 285,000 | 285,832 | ||||||
Tunisia Government AID Bonds | ||||||||
1.69%, 07/16/2019 | 1,032,000 | 997,385 | ||||||
United States Treasury Inflation Indexed Bonds | ||||||||
2.00%, 01/15/2014 | 652,198 | 651,740 | ||||||
1.25%, 04/15/2014 | 2,619,804 | 2,636,586 | ||||||
0.50%, 04/15/2015 | 2,780,414 | 2,841,453 | ||||||
0.13%, 04/15/2016 | 436,979 | 448,689 | ||||||
0.13%, 04/15/2018 | 20,676,199 | 21,088,110 | ||||||
1.13%, 01/15/2021 | 523,139 | 549,827 | ||||||
0.38%, 07/15/2023 | 2,428,615 | 2,342,285 | ||||||
3.63%, 04/15/2028 | 1,506,050 | 1,992,221 | ||||||
2.50%, 01/15/2029 | 449,253 | 527,943 |
United States Treasury Note/Bond | ||||||||
11.25%, 02/15/2015 | 1,032,000 | 1,159,065 | ||||||
0.25%, 12/31/2015 | 45,000,000 | 44,880,480 | ||||||
3.13%, 10/31/2016 | 3,400,000 | 3,627,905 | ||||||
0.63%, 11/15/2016 (c) | 47,150,000 | 47,006,334 | ||||||
7.50%, 11/15/2016 | 5,820,000 | 6,934,891 | ||||||
2.75%, 11/30/2016 | 258,000 | 272,734 | ||||||
3.25%, 12/31/2016 | 20,315,000 | 21,789,422 | ||||||
3.13%, 01/31/2017 | 206,000 | 220,227 | ||||||
4.63%, 02/15/2017 | 980,000 | 1,093,006 | ||||||
3.25%, 03/31/2017 | 6,295,000 | 6,765,161 | ||||||
3.13%, 04/30/2017 | 13,814,000 | 14,788,536 | ||||||
4.50%, 05/15/2017 | 5,682,000 | 6,340,760 | ||||||
2.75%, 05/31/2017 | 5,000,000 | 5,293,750 | ||||||
2.38%, 07/31/2017 | 40,000,000 | 41,796,880 | ||||||
4.75%, 08/15/2017 | 7,303,000 | 8,250,681 | ||||||
8.88%, 08/15/2017 | 8,230,000 | 10,500,970 | ||||||
4.25%, 11/15/2017 | 12,353,000 | 13,754,300 | ||||||
2.25%, 11/30/2017 | 206,000 | 213,789 | ||||||
2.75%, 12/31/2017 | 1,459,000 | 1,541,981 | ||||||
0.88%, 01/31/2018 | 245,000 | 240,330 | ||||||
2.63%, 01/31/2018 | 2,683,000 | 2,821,341 | ||||||
3.50%, 02/15/2018 | 2,993,000 | 3,249,276 | ||||||
2.88%, 03/31/2018 | 3,159,000 | 3,348,294 | ||||||
0.63%, 04/30/2018 | 8,045,000 | 7,758,397 | ||||||
1.50%, 08/31/2018 | 19,561,000 | 19,461,669 | ||||||
1.25%, 10/31/2018 | 23,000,000 | 22,548,993 | ||||||
1.75%, 10/31/2018 | 1,930,000 | 1,938,444 | ||||||
1.25%, 11/30/2018 | 16,965,000 | 16,601,847 | ||||||
1.38%, 11/30/2018 | 17,239,000 | 16,980,415 | ||||||
1.38%, 12/31/2018 | 722,000 | 709,985 | ||||||
1.50%, 12/31/2018 | 249,890,000 | 247,078,737 | ||||||
1.25%, 04/30/2019 | 116,225,600 | 112,602,616 | ||||||
3.13%, 05/15/2019 | 20,774,000 | 22,137,294 | ||||||
0.88%, 07/31/2019 (c) | 74,610,000 | 70,255,835 |
1.00%, 11/30/2019 | 2,392,000 | 2,247,545 | ||||||
8.50%, 02/15/2020 | 4,972,000 | 6,816,692 | ||||||
3.50%, 05/15/2020 | 2,580,000 | 2,783,376 | ||||||
8.75%, 05/15/2020 | 2,596,000 | 3,622,230 | ||||||
2.63%, 08/15/2020 | 7,709,000 | 7,865,585 | ||||||
8.75%, 08/15/2020 | 6,304,000 | 8,847,273 | ||||||
2.13%, 08/31/2020 | 1,032,000 | 1,018,778 | ||||||
2.63%, 11/15/2020 | 3,096,000 | 3,146,310 | ||||||
2.00%, 11/30/2020 | 5,000 | 4,867 | ||||||
2.38%, 12/31/2020 | 59,875,000 | 59,641,128 | ||||||
3.63%, 02/15/2021 | 1,961,000 | 2,116,195 | ||||||
7.88%, 02/15/2021 | 900,000 | 1,224,562 | ||||||
3.13%, 05/15/2021 | 4,592,000 | 4,786,802 | ||||||
8.13%, 05/15/2021 | 1,718,000 | 2,378,222 | ||||||
2.13%, 08/15/2021 | 5,805,000 | 5,623,594 | ||||||
8.00%, 11/15/2021 | 826,000 | 1,147,365 | ||||||
7.25%, 08/15/2022 | 1,444,000 | 1,951,205 | ||||||
7.13%, 02/15/2023 | 683,000 | 921,143 | ||||||
2.75%, 11/15/2023 | 22,050,000 | 21,571,096 | ||||||
6.00%, 02/15/2026 | 444,000 | 566,793 | ||||||
6.75%, 08/15/2026 | 805,000 | 1,095,051 | ||||||
6.50%, 11/15/2026 | 779,000 | 1,040,452 | ||||||
6.63%, 02/15/2027 | 753,000 | 1,017,491 | ||||||
6.38%, 08/15/2027 | 490,000 | 650,628 | ||||||
6.13%, 11/15/2027 | 470,000 | 611,587 | ||||||
5.50%, 08/15/2028 | 1,481,000 | 1,825,564 | ||||||
5.25%, 11/15/2028 | 30,665,500 | 36,918,379 | ||||||
5.25%, 02/15/2029 | 913,000 | 1,099,024 | ||||||
6.13%, 08/15/2029 | 258,000 | 338,867 | ||||||
6.25%, 05/15/2030 | 789,000 | 1,053,931 | ||||||
5.38%, 02/15/2031 | 712,000 | 872,534 | ||||||
4.50%, 02/15/2036 | 7,389,000 | 8,221,415 | ||||||
4.75%, 02/15/2037 | 3,955,000 | 4,550,105 | ||||||
5.00%, 05/15/2037 | 6,294,000 | 7,489,860 | ||||||
4.38%, 02/15/2038 | 7,422,600 | 8,079,040 | ||||||
4.50%, 05/15/2038 | 789,000 | 874,804 | ||||||
3.50%, 02/15/2039 | 59,819,100 | 56,332,783 | ||||||
4.50%, 08/15/2039 | 206,000 | 228,338 | ||||||
3.75%, 11/15/2043 | 6,505,000 | 6,287,486 |
United States Treasury Strip Coupon | ||||||||
0.00%, 08/15/2015 | 3,000 | 2,984 | ||||||
0.00%, 02/15/2016 | 7,205,000 | 7,136,228 | ||||||
0.00%, 08/15/2016 | 3,966,000 | 3,899,403 | ||||||
0.00%, 11/15/2016 | 5,261,000 | 5,146,700 | ||||||
0.00%, 02/15/2017 | 10,719,000 | 10,415,288 | ||||||
0.00%, 08/15/2017 | 4,176,000 | 4,003,122 | ||||||
0.00%, 11/15/2017 | 9,529,000 | 9,062,365 | ||||||
0.00%, 02/15/2018 | 3,658,000 | 3,449,739 | ||||||
0.00%, 05/15/2018 | 3,044,000 | 2,845,008 | ||||||
0.00%, 08/15/2018 | 5,839,000 | 5,405,227 | ||||||
0.00%, 02/15/2019 | 1,228,000 | 1,117,915 | ||||||
0.00%, 05/15/2019 | 8,810,000 | 7,937,916 | ||||||
0.00%, 08/15/2019 | 18,857,000 | 16,804,208 | ||||||
0.00%, 02/15/2020 | 1,858,000 | 1,620,934 | ||||||
0.00%, 05/15/2020 | 33,605,000 | 29,010,995 | ||||||
0.00%, 05/15/2020 | 470,000 | 406,605 | ||||||
0.00%, 08/15/2020 | 20,243,000 | 17,267,158 | ||||||
0.00%, 02/15/2021 | 18,630,000 | 15,487,194 | ||||||
0.00%, 05/15/2021 | 11,063,000 | 9,095,335 | ||||||
0.00%, 08/15/2021 | 6,139,000 | 4,985,961 | ||||||
0.00%, 11/15/2021 | 12,779,000 | 10,264,936 | ||||||
0.00%, 02/15/2022 | 6,377,000 | 5,060,590 | ||||||
0.00%, 05/15/2022 | 619,000 | 485,477 | ||||||
0.00%, 02/15/2023 | 7,512,000 | 5,677,705 | ||||||
0.00%, 05/15/2023 | 3,870,000 | 2,891,888 | ||||||
0.00%, 02/15/2024 | 124,000 | 89,317 | ||||||
0.00%, 05/15/2024 | 722,000 | 513,874 | ||||||
0.00%, 08/15/2024 | 1,334,000 | 936,145 | ||||||
0.00%, 11/15/2024 | 2,105,000 | 1,458,714 | ||||||
0.00%, 02/15/2025 | 599,000 | 409,645 | ||||||
0.00%, 05/15/2025 | 279,000 | 188,350 | ||||||
0.00%, 02/15/2026 | 1,352,000 | 877,202 | ||||||
0.00%, 05/15/2026 | 2,301,000 | 1,475,295 | ||||||
0.00%, 08/15/2026 | 1,681,000 | 1,064,091 |
0.00%, 11/15/2026 | 10,222,000 | 6,390,948 | ||||||
0.00%, 02/15/2027 | 17,916,000 | 11,063,058 | ||||||
0.00%, 05/15/2027 | 2,366,000 | 1,442,723 | ||||||
0.00%, 08/15/2027 | 4,314,000 | 2,598,823 | ||||||
0.00%, 11/15/2027 | 8,107,000 | 4,818,582 | ||||||
0.00%, 02/15/2028 | 7,769,000 | 4,566,921 | ||||||
0.00%, 05/15/2028 | 1,166,000 | 677,384 | ||||||
0.00%, 08/15/2028 | 918,000 | 526,963 | ||||||
0.00%, 11/15/2028 | 3,540,000 | 2,007,187 | ||||||
0.00%, 02/15/2029 | 4,243,000 | 2,377,277 | ||||||
0.00%, 05/15/2029 | 330,000 | 182,677 | ||||||
0.00%, 08/15/2029 | 2,188,000 | 1,196,477 | ||||||
0.00%, 11/15/2029 | 1,664,000 | 899,231 | ||||||
0.00%, 02/15/2030 | 11,187,000 | 5,973,880 | ||||||
0.00%, 05/15/2030 | 6,764,000 | 3,566,995 | ||||||
0.00%, 08/15/2030 | 3,462,000 | 1,804,685 | ||||||
0.00%, 11/15/2030 | 2,064,000 | 1,062,801 | ||||||
0.00%, 02/15/2031 | 3,798,000 | 1,931,822 | ||||||
0.00%, 05/15/2031 | 2,825,000 | 1,420,136 | ||||||
0.00%, 08/15/2031 | 2,737,000 | 1,360,346 | ||||||
0.00%, 11/15/2031 | 1,589,000 | 780,601 | ||||||
0.00%, 02/15/2032 | 2,159,000 | 1,049,375 | ||||||
0.00%, 05/15/2032 | 3,053,000 | 1,467,217 | ||||||
0.00%, 08/15/2032 | 175,000 | 83,146 | ||||||
0.00%, 11/15/2032 | 4,412,000 | 2,072,696 | ||||||
0.00%, 05/15/2033 | 5,145,000 | 2,365,316 | ||||||
0.00%, 08/15/2033 | 2,412,000 | 1,096,442 | ||||||
0.00%, 11/15/2033 | 4,466,000 | 2,008,074 | ||||||
0.00%, 02/15/2034 | 2,959,000 | 1,316,134 | ||||||
0.00%, 05/15/2034 | 1,450,000 | 638,096 | ||||||
0.00%, 08/15/2034 | 2,895,000 | 1,259,328 | ||||||
0.00%, 11/15/2034 | 2,487,000 | 1,070,748 | ||||||
0.00%, 02/15/2035 | 4,334,000 | 1,843,991 | ||||||
0.00%, 05/15/2035 | 1,920,000 | 808,752 | ||||||
0.00%, 08/15/2035 | 175,000 | 72,958 | ||||||
0.00%, 05/15/2036 | 121,000 | 48,808 |
United States Treasury Strip Principal | ||||||||
0.00%, 02/15/2043 | 23,515,000 | 6,975,701 | ||||||
Utility Debt Securitization Authority | ||||||||
5.00%, 12/15/2041 | 1,250,000 | 1,311,938 | ||||||
West Contra Costa Unified School District | ||||||||
6.25%, 08/01/2030 | 215,000 | 210,431 | ||||||
Westlake City School District | ||||||||
5.23%, 12/01/2026 | 430,000 | 444,074 | ||||||
|
| |||||||
| Total Government Related (Cost $1,501,103,029) | $ | 1,476,383,325 | ||||||
|
| |||||||
Mortgage Backed Obligations - 38.71% | ||||||||
A10 Securitization 2013-1 LLC | ||||||||
2.40%, 11/15/2025 (Acquired 10/28/2013, Cost $1,262,487) (a) | $ | 1,266,000 | $ | 1,261,765 | ||||
A10 Securitization LLC | ||||||||
3.49%, 04/15/2024 (Acquired 10/28/2013, Cost $1,626,947) (a) | 1,615,596 | 1,624,571 | ||||||
A10 Term Asset Financing 2013-2 LLC | ||||||||
4.38%, 11/15/2027 (Acquired 10/30/2013, Cost $424,869) (a) | 425,000 | 420,425 | ||||||
AAM ACE 2007-HE3 Resecuritization Trust 2011-1 | ||||||||
0.40%, 02/02/2037 | 219,638 | 214,850 | ||||||
Ajax Mortgage Loan Trust 2013-C | ||||||||
4.50%, 03/25/2035 (Acquired 11/15/2013, Cost $1,474,423) (b) | 1,480,420 | 1,475,560 | ||||||
Alternative Loan Trust 2002-11 | ||||||||
6.25%, 10/25/2032 | 7,067 | 7,223 | ||||||
Alternative Loan Trust 2002-12 | ||||||||
0.00%, 11/25/2032 | 23,966 | 19,714 | ||||||
Alternative Loan Trust 2002-18 | ||||||||
6.00%, 02/25/2033 | 216,957 | 209,557 | ||||||
Alternative Loan Trust 2002-8 | ||||||||
6.50%, 07/25/2032 | 96,252 | 98,847 | ||||||
Alternative Loan Trust 2003-20CB | ||||||||
5.50%, 10/25/2033 | 811,206 | 857,925 | ||||||
Alternative Loan Trust 2003-6T2 | ||||||||
5.50%, 06/25/2033 | 38,362 | 35,626 | ||||||
Alternative Loan Trust 2004-14T2 | ||||||||
5.50%, 08/25/2034 | 24,354 | 24,335 | ||||||
Alternative Loan Trust 2004-18CB | ||||||||
5.70%, 09/25/2034 | 189,387 | 191,547 |
Alternative Loan Trust 2004-2CB | ||||||||
5.75%, 03/25/2034 | 10,648,200 | 10,849,961 | ||||||
5.75%, 03/25/2034 | 1,294,949 | 1,278,050 | ||||||
Alternative Loan Trust 2005-1CB | ||||||||
6.94%, 03/25/2035 | 477,393 | 98,188 | ||||||
Alternative Loan Trust 2005-20CB | ||||||||
4.59%, 07/25/2035 | 1,441,119 | 148,163 | ||||||
Alternative Loan Trust 2005-22T1 | ||||||||
4.91%, 06/25/2035 | 1,308,758 | 210,176 | ||||||
Alternative Loan Trust 2005-28CB | ||||||||
5.50%, 08/25/2035 | 638,372 | 603,587 | ||||||
6.00%, 08/25/2035 | 18,524 | 14,984 | ||||||
Alternative Loan Trust 2005-37T1 | ||||||||
4.89%, 09/25/2035 | 4,732,866 | 675,702 | ||||||
Alternative Loan Trust 2005-50CB | ||||||||
5.00%, 11/25/2020 | 109,438 | 108,324 | ||||||
Alternative Loan Trust 2005-54CB | ||||||||
4.69%, 11/25/2035 | 2,890,471 | 393,546 | ||||||
5.50%, 11/25/2035 | 732,387 | 667,779 | ||||||
5.50%, 11/25/2035 | 8,954 | 9,106 | ||||||
Alternative Loan Trust 2005-64CB | ||||||||
5.50%, 12/25/2035 | 267,615 | 234,545 | ||||||
Alternative Loan Trust 2005-J1 | ||||||||
4.94%, 02/25/2035 | 882,698 | 91,059 | ||||||
Alternative Loan Trust 2006-28CB | ||||||||
6.00%, 10/25/2036 | 147,435 | 113,171 | ||||||
Alternative Loan Trust 2006-43CB | ||||||||
6.00%, 02/25/2022 | 58,951 | 60,635 | ||||||
Alternative Loan Trust 2006-7CB | ||||||||
5.25%, 05/25/2021 | 279,584 | 272,433 | ||||||
Alternative Loan Trust 2006-J5 | ||||||||
5.41%, 07/25/2021 | 111,762 | 109,100 | ||||||
Alternative Loan Trust Resecuritization 2005-5R | ||||||||
5.25%, 12/25/2018 | 17,173 | 17,266 | ||||||
American General Mortgage Loan Trust 2006-1 | ||||||||
5.75%, 12/25/2035 (Acquired 10/28/2013, Cost $209,182) (a) | 201,392 | 208,522 | ||||||
American General Mortgage Loan Trust 2009-1 | ||||||||
5.75%, 09/25/2048 (Acquired 10/28/2013, Cost $3,503,439) (a) | 3,437,000 | 3,474,456 |
American General Mortgage Loan Trust 2010-1 | ||||||||
5.15%, 03/25/2058 (Acquired 10/28/2013, Cost $242,767) (a) | 240,001 | 242,142 | ||||||
5.65%, 03/25/2058 (Acquired 10/28/2013, Cost $475,341) (a) | 463,000 | 473,810 | ||||||
5.65%, 03/25/2058 (Acquired 10/28/2013, Cost $1,016,219) (a) | 980,000 | 1,014,141 | ||||||
5.65%, 03/25/2058 (Acquired 10/28/2013, Cost $481,785) (a) | 464,000 | 481,187 | ||||||
ASG Resecuritization Trust 2009-1 | ||||||||
2.19%, 06/26/2037 | 368,958 | 362,850 | ||||||
ASG Resecuritization Trust 2009-2 | ||||||||
4.91%, 05/24/2036 (Acquired 10/28/2013, Cost $570,347) (a) | 547,000 | 568,683 | ||||||
4.91%, 05/24/2036 (Acquired 10/28/2013, Cost $528,247) (a) | 518,740 | 527,126 | ||||||
ASG Resecuritization Trust 2009-3 | ||||||||
2.28%, 03/26/2037 (Acquired 10/28/2013, Cost $2,322,215) (a) | 2,317,535 | 2,317,018 | ||||||
ASG Resecuritization Trust 2009-4 | ||||||||
6.00%, 06/28/2037 (Acquired 10/28/2013, Cost $853,322) (a) | 836,771 | 852,730 | ||||||
ASG Resecuritization Trust 2009-5 | ||||||||
3.19%, 02/28/2037 (Acquired 10/28/2013, Cost $252,923) (a) | 250,476 | 252,211 | ||||||
ASG Resecuritization Trust 2010-1 | ||||||||
0.57%, 02/27/2036 (Acquired 10/28/2013, Cost $270,596) (a) | 277,533 | 269,207 | ||||||
ASG Resecuritization Trust 2010-2 | ||||||||
2.02%, 01/28/2037 | 885,948 | 871,323 | ||||||
ASG Resecuritization Trust 2010-3 | ||||||||
0.37%, 10/28/2036 (Acquired 10/28/2013, Cost $182,941) (a) | 184,554 | 183,170 | ||||||
ASG Resecuritization Trust 2010-4 | ||||||||
0.38%, 11/28/2036 (Acquired 10/28/2013, Cost $74,513) (a) | 75,264 | 74,606 | ||||||
ASG Resecuritization Trust 2011-1 | ||||||||
4.00%, 09/28/2020 (Acquired 10/28/2013, Cost $238,181) (a) | 235,772 | 238,035 | ||||||
2.44%, 11/28/2035 (Acquired 10/28/2013, Cost $761,468) (a) | 775,540 | 759,377 | ||||||
6.00%, 09/28/2036 (Acquired 10/28/2013, Cost $767,033) (a) | 738,205 | 762,197 | ||||||
ASG Resecuritization Trust 2011-2 | ||||||||
23.61%, 02/28/2036 (Acquired 10/28/2013, Cost $118,142) (a) | 94,494 | 117,173 | ||||||
BAMLL Commercial Mortgage Securities Trust 2012-PARK | ||||||||
2.96%, 12/10/2030 (Acquired 10/28/2013, Cost $778,136) (a) | 809,000 | 757,702 | ||||||
Banc of America Alternative Loan Trust 2003-1 | ||||||||
0.00%, 02/25/2033 | 25,559 | 21,190 | ||||||
Banc of America Alternative Loan Trust 2003-11 | ||||||||
4.75%, 01/25/2019 | 29,851 | 30,211 | ||||||
0.00%, 01/25/2034 | 64,960 | 49,002 | ||||||
6.00%, 01/25/2034 | 571,539 | 597,672 | ||||||
6.00%, 01/25/2034 | 607,167 | 632,971 |
Banc of America Alternative Loan Trust 2003-4 | ||||||||
5.00%, 06/25/2018 | 15,892 | 16,376 | ||||||
Banc of America Alternative Loan Trust 2003-5 | ||||||||
5.00%, 07/25/2018 | 198,834 | 204,754 | ||||||
Banc of America Alternative Loan Trust 2003-7 | ||||||||
5.00%, 09/25/2018 | 311,511 | 315,856 | ||||||
5.50%, 09/25/2033 | 588,330 | 603,879 | ||||||
Banc of America Alternative Loan Trust 2003-9 | ||||||||
5.50%, 11/25/2033 | 264,680 | 269,568 | ||||||
Banc of America Alternative Loan Trust 2004-1 | ||||||||
5.50%, 02/25/2019 | 120,222 | 123,451 | ||||||
6.00%, 02/25/2034 | 174,597 | 181,768 | ||||||
Banc of America Alternative Loan Trust 2004-11 | ||||||||
5.50%, 12/25/2019 | 21,390 | 22,130 | ||||||
Banc of America Alternative Loan Trust 2004-6 | ||||||||
0.00%, 07/25/2019 | 26,798 | 24,313 | ||||||
5.00%, 07/25/2019 | 20,918 | 21,299 | ||||||
6.00%, 07/25/2034 | 1,625 | 1,620 | ||||||
Banc of America Alternative Loan Trust 2004-7 | ||||||||
5.00%, 08/25/2019 | 390,645 | 400,833 | ||||||
Banc of America Alternative Loan Trust 2004-8 | ||||||||
5.50%, 09/25/2019 | 215,131 | 225,385 | ||||||
Banc of America Alternative Loan Trust 2005-10 | ||||||||
5.25%, 11/25/2020 | 79,766 | 81,615 | ||||||
Banc of America Alternative Loan Trust 2005-11 | ||||||||
5.50%, 12/25/2035 | 30,458 | 26,893 | ||||||
Banc of America Alternative Loan Trust 2005-2 | ||||||||
5.50%, 03/25/2020 | 33,123 | 34,528 | ||||||
5.50%, 03/25/2035 | 25,934 | 24,723 | ||||||
Banc of America Alternative Loan Trust 2005-4 | ||||||||
5.50%, 05/25/2020 | 199,032 | 204,720 | ||||||
Banc of America Alternative Loan Trust 2005-5 | ||||||||
5.50%, 06/25/2035 | 106,280 | �� | 99,539 | |||||
Banc of America Alternative Loan Trust 2005-9 | ||||||||
5.50%, 10/25/2035 | 53,733 | 47,499 |
Banc of America Alternative Loan Trust 2006-5 | ||||||||
6.00%, 06/25/2046 | 119,190 | 98,129 | ||||||
Banc of America Alternative Loan Trust 2007-1 | ||||||||
8.64%, 04/25/2022 | 136,155 | 140,356 | ||||||
Banc of America Commercial Mortgage Trust 2006-1 | ||||||||
5.37%, 09/10/2045 | 295,000 | 316,601 | ||||||
5.38%, 09/10/2045 | 16,116,615 | 17,357,755 | ||||||
Banc of America Commercial Mortgage Trust 2006-3 | ||||||||
5.89%, 07/10/2044 | 1,811,840 | 1,971,023 | ||||||
Banc of America Commercial Mortgage Trust 2006-4 | ||||||||
5.63%, 07/10/2046 | 1,187,000 | 1,286,726 | ||||||
Banc of America Commercial Mortgage Trust 2006-5 | ||||||||
0.64%, 09/10/2047 (Acquired 10/28/2013, Cost $324,303) (a) | 24,634,139 | 318,445 | ||||||
5.41%, 09/10/2047 | 970,000 | 1,052,485 | ||||||
Banc of America Funding 2004-1 Trust | ||||||||
0.00%, 03/25/2034 | 72,499 | 65,465 | ||||||
Banc of America Funding 2004-2 Trust | ||||||||
5.75%, 09/20/2034 | 98,569 | 104,120 | ||||||
Banc of America Funding 2004-C Trust | ||||||||
5.08%, 12/20/2034 | 177,602 | 175,375 | ||||||
Banc of America Funding 2005-6 Trust | ||||||||
5.50%, 10/25/2035 | 113,698 | 111,820 | ||||||
Banc of America Funding 2005-7 Trust | ||||||||
0.00%, 11/25/2035 | 89,217 | 70,943 | ||||||
Banc of America Funding 2005-8 Trust | ||||||||
0.00%, 01/25/2036 | 38,277 | 28,396 | ||||||
Banc of America Funding 2005-C Trust | ||||||||
0.40%, 05/20/2035 | 6,072,896 | 5,473,878 | ||||||
Banc of America Funding 2005-E Trust | ||||||||
2.67%, 03/20/2035 | 236,093 | 237,195 | ||||||
Banc of America Funding 2006-1 Trust | ||||||||
0.00%, 01/25/2036 | 87,727 | 76,076 | ||||||
Banc of America Funding 2010-R11 Trust | ||||||||
5.18%, 08/26/2035 (Acquired 10/28/2013, Cost $832,345) (a) | 816,544 | 831,935 | ||||||
Banc of America Funding 2010-R4 Trust | ||||||||
0.31%, 07/26/2036 (Acquired 10/28/2013, Cost $9,124) (a) | 9,149 | 9,137 |
Banc of America Funding 2010-R5 Trust | ||||||||
5.50%, 10/26/2037 (Acquired 10/28/2013, Cost $289,244) (a) | 283,336 | 288,467 | ||||||
Banc of America Merrill Lynch Commercial Mortgage Inc | ||||||||
5.29%, 11/10/2042 | 516,000 | 541,285 | ||||||
4.67%, 07/10/2043 | 516,000 | 539,800 | ||||||
4.73%, 07/10/2043 | 1,097,000 | 1,139,736 | ||||||
0.09%, 10/10/2045 (Acquired 10/28/2013, Cost $117,134) (a) | 55,843,607 | 118,054 | ||||||
5.12%, 10/10/2045 | 10,258,000 | 10,854,800 | ||||||
5.18%, 09/10/2047 | 243,069 | 243,316 | ||||||
Banc of America Mortgage 2003-3 Trust | ||||||||
0.71%, 05/25/2018 | 151,383 | 145,775 | ||||||
5.50%, 05/25/2033 | 424,354 | 436,426 | ||||||
Banc of America Mortgage 2003-5 Trust | ||||||||
7.50%, 02/25/2031 | 72,625 | 74,954 | ||||||
Banc of America Mortgage 2003-6 Trust | ||||||||
0.61%, 08/25/2018 | 53,274 | 52,793 | ||||||
Banc of America Mortgage 2003-7 Trust | ||||||||
4.75%, 09/25/2018 | 8,514 | 8,775 | ||||||
Banc of America Mortgage 2003-8 Trust | ||||||||
0.00%, 11/25/2033 | 35,085 | 29,748 | ||||||
Banc of America Mortgage 2003-C Trust | ||||||||
2.87%, 04/25/2033 | 77,364 | 77,728 | ||||||
Banc of America Mortgage 2003-E Trust | ||||||||
2.86%, 06/25/2033 | 290,864 | 291,249 | ||||||
Banc of America Mortgage 2004-J Trust | ||||||||
2.65%, 11/25/2034 | 192,048 | 190,340 | ||||||
Banc of America Mortgage Trust 2004-1 | ||||||||
0.00%, 02/25/2034 | 9,998 | 8,658 | ||||||
Banc of America Mortgage Trust 2004-3 | ||||||||
5.50%, 04/25/2034 | 766,511 | 777,868 | ||||||
Banc of America Mortgage Trust 2004-4 | ||||||||
0.00%, 05/25/2034 | 10,759 | 9,091 | ||||||
Banc of America Mortgage Trust 2004-5 | ||||||||
4.75%, 06/25/2019 | 58,280 | 59,226 | ||||||
5.50%, 06/25/2034 | 194,871 | 202,070 | ||||||
Banc of America Mortgage Trust 2004-6 | ||||||||
5.50%, 05/25/2034 | 933,482 | 976,229 | ||||||
0.00%, 07/25/2034 | 58,134 | 47,931 | ||||||
5.50%, 07/25/2034 | 32,432 | 33,977 |
Banc of America Mortgage Trust 2004-8 | ||||||||
0.00%, 05/25/2032 | 4,968 | 4,214 | ||||||
0.00%, 10/25/2034 | 25,523 | 21,600 | ||||||
Banc of America Mortgage Trust 2004-9 | ||||||||
0.00%, 09/25/2032 | 4,171 | 3,704 | ||||||
6.50%, 09/25/2032 | 87,976 | 92,285 | ||||||
Banc of America Mortgage Trust 2005-1 | ||||||||
5.00%, 02/25/2020 | 197,782 | 203,897 | ||||||
Banc of America Re-REMIC Trust 2009-UBER1 | ||||||||
5.61%, 06/24/2050 (Acquired 10/28/2013, Cost $1,079,389) (a) | 979,364 | 1,073,118 | ||||||
BB-UBS Trust | ||||||||
2.89%, 06/05/2030 (Acquired 10/28/2013, Cost $2,823,802) (a) | 2,941,000 | 2,770,422 | ||||||
BB-UBS Trust 2012-SHOW | ||||||||
3.43%, 11/05/2036 (Acquired 10/28/2013 through 12/04/2013, Cost $2,459,788) (a) | 2,602,000 | 2,384,858 | ||||||
BCAP LLC 2009-RR10 Trust | ||||||||
5.75%, 06/26/2037 (Acquired 10/28/2013, Cost $431,332) (a) | 431,879 | 431,220 | ||||||
BCAP LLC 2009-RR13-I Trust | ||||||||
5.50%, 04/26/2037 (Acquired 10/28/2013, Cost $805,353) (a) | 771,241 | 806,179 | ||||||
BCAP LLC 2009-RR14 Trust | ||||||||
2.59%, 08/26/2035 (Acquired 10/28/2013, Cost $658,823) (a) | 712,954 | 711,790 | ||||||
2.57%, 03/26/2036 (Acquired 10/28/2013, Cost $51,955) (a) | 51,991 | 51,929 | ||||||
BCAP LLC 2009-RR5 Trust | ||||||||
5.50%, 11/26/2034 (Acquired 10/28/2013, Cost $536,327) (a) | 524,987 | 539,424 | ||||||
BCAP LLC 2010-RR12 Trust | ||||||||
4.50%, 01/26/2036 (Acquired 10/28/2013, Cost $174,349) (a) | 171,545 | 174,171 | ||||||
2.65%, 10/26/2036 (Acquired 10/28/2013, Cost $577,883) (a) | 571,641 | 575,760 | ||||||
BCAP LLC 2010-RR4-I Trust | ||||||||
4.00%, 07/26/2036 (Acquired 10/28/2013, Cost $132,746) (a) | 132,242 | 132,612 | ||||||
BCAP LLC 2010-RR5-I Trust | ||||||||
5.33%, 04/26/2037 (Acquired 10/28/2013, Cost $759,602) (a) | 760,788 | 773,265 | ||||||
BCAP LLC 2010-RR7 Trust | ||||||||
4.99%, 04/26/2035 (Acquired 10/28/2013, Cost $415,012) (a) | 423,242 | 415,087 | ||||||
0.96%, 01/26/2036 (Acquired 10/28/2013, Cost $131,906) (a) | 134,690 | 132,891 | ||||||
2.35%, 07/26/2045 (Acquired 10/28/2013, Cost $2,049,903) (a) | 2,114,578 | 2,048,493 | ||||||
0.84%, 02/26/2047 (Acquired 10/28/2013, Cost $540,402) (a) | 554,967 | 541,049 |
BCAP LLC 2010-RR8 Trust | ||||||||
5.04%, 05/26/2035 (Acquired 10/28/2013, Cost $296,201) (a) | 288,755 | 295,573 | ||||||
5.04%, 05/26/2035 (Acquired 10/28/2013, Cost $978,858) (a) | 1,032,000 | 972,351 | ||||||
BCAP LLC 2011-RR10 Trust | ||||||||
1.02%, 09/26/2037 (Acquired 10/28/2013, Cost $1,657,861) (a) | 1,832,860 | 1,654,404 | ||||||
BCAP LLC 2011-RR11 Trust | ||||||||
4.00%, 08/26/2021 (Acquired 10/28/2013, Cost $532,774) (a) | 522,217 | 532,576 | ||||||
3.00%, 08/26/2022 (Acquired 10/28/2013, Cost $398,684) (a) | 396,519 | 398,685 | ||||||
BCAP LLC 2011-RR2 Trust | ||||||||
2.71%, 11/21/2035 (Acquired 10/28/2013, Cost $215,355) (a) | 215,256 | 215,255 | ||||||
BCAP LLC 2011-RR4-I Trust | ||||||||
5.00%, 08/26/2037 (Acquired 10/28/2013, Cost $1,408,060) (a) | 1,397,922 | 1,409,830 | ||||||
BCAP LLC 2011-RR5-I Trust | ||||||||
0.31%, 05/28/2036 (Acquired 10/28/2013, Cost $1,342,215) (a) | 1,438,964 | 1,336,304 | ||||||
2.66%, 07/26/2036 (Acquired 10/28/2013, Cost $540,657) (a) | 542,238 | 539,862 | ||||||
BCAP LLC 2012-RR1 Trust | ||||||||
5.22%, 07/26/2037 (Acquired 10/28/2013, Cost $700,959) (a) | 679,061 | 701,207 | ||||||
BCAP LLC 2012-RR10-I Trust | ||||||||
0.36%, 05/26/2036 (Acquired 10/28/2013, Cost $2,087,434) (a) | 2,219,622 | 2,082,125 | ||||||
0.40%, 02/26/2037 (Acquired 10/28/2013, Cost $729,255) (a) | 773,495 | 729,130 | ||||||
BCAP LLC 2012-RR2 Trust | ||||||||
0.33%, 08/26/2036 (Acquired 10/28/2013, Cost $1,260,385) (a) | 1,303,871 | 1,263,108 | ||||||
BCAP LLC 2012-RR3 Trust | ||||||||
2.26%, 05/26/2037 (Acquired 10/28/2013, Cost $2,232,125) (a) | 2,257,814 | 2,229,383 | ||||||
BCAP LLC 2012-RR4 Trust | ||||||||
0.39%, 06/26/2047 (Acquired 10/28/2013, Cost $1,047,833) (a) | 1,105,207 | 1,047,397 | ||||||
BCAP LLC Trust | ||||||||
4.61%, 06/26/2036 (Acquired 10/28/2013, Cost $453,379) (a) | 436,704 | 452,342 | ||||||
4.59%, 11/26/2037 (Acquired 10/28/2013, Cost $19,066) (a) | 19,133 | 19,062 | ||||||
Bear Stearns ALT-A Trust 2005-2 | ||||||||
0.66%, 03/25/2035 | 513,017 | 488,088 | ||||||
Bear Stearns ARM Trust 2003-2 | ||||||||
2.49%, 01/25/2033 (Acquired 10/28/2013, Cost $311,316) (a) | 328,695 | 320,760 | ||||||
Bear Stearns ARM Trust 2003-7 | ||||||||
2.47%, 10/25/2033 | 27,324 | 26,871 | ||||||
Bear Stearns ARM Trust 2004-2 | ||||||||
4.87%, 05/25/2034 | 215,248 | 213,775 |
Bear Stearns ARM Trust 2005-5 | ||||||||
2.21%, 08/25/2035 | 973,124 | 973,639 | ||||||
Bear Stearns ARM Trust 2006-1 | ||||||||
2.38%, 02/25/2036 | 836,722 | 827,579 | ||||||
Bear Stearns Asset Backed Securities I Trust 2004-AC2 | ||||||||
5.00%, 05/25/2034 | 154,965 | 155,786 | ||||||
Bear Stearns Commercial Mortgage Securities Trust 2004-PWR4 | ||||||||
5.47%, 06/11/2041 | 549,836 | 552,979 | ||||||
Bear Stearns Commercial Mortgage Securities Trust 2005-PWR9 | ||||||||
4.80%, 09/11/2042 | 103,576 | 104,856 | ||||||
4.87%, 09/11/2042 | 2,225,714 | 2,334,834 | ||||||
Bear Stearns Commercial Mortgage Securities Trust 2006-PWR11 | ||||||||
5.44%, 03/11/2039 | 883,000 | 951,155 | ||||||
Bear Stearns Commercial Mortgage Securities Trust 2006-PWR14 | ||||||||
0.64%, 12/11/2038 (Acquired 10/28/2013, Cost $338,625) (a) | 23,806,187 | 424,845 | ||||||
Bear Stearns Commercial Mortgage Securities Trust 2006-TOP24 | ||||||||
5.54%, 10/12/2041 | 279,000 | 304,910 | ||||||
Bear Stearns Commercial Mortgage Securities Trust 2007-TOP26 | ||||||||
0.04%, 01/12/2045 (Acquired 10/28/2013, Cost $381,420) (a) | 67,478,880 | 385,169 | ||||||
CD 2005-CD1 Commercial Mortgage Trust | ||||||||
5.22%, 07/15/2044 | 4,386,175 | 4,650,508 | ||||||
5.22%, 07/15/2044 | 619,000 | 650,487 | ||||||
CD 2006-CD3 Mortgage Trust | ||||||||
0.50%, 10/15/2048 (Acquired 10/28/2013, Cost $225,580) (a) | 14,447,437 | 223,170 | ||||||
CD 2007-CD4 Commercial Mortgage Trust | ||||||||
0.17%, 12/11/2049 | 24,586,268 | 234,676 | ||||||
5.32%, 12/11/2049 | 7,250,000 | 7,939,533 | ||||||
Chase Mortgage Finance Trust Series 2006-A1 | ||||||||
2.70%, 09/25/2036 | 400,118 | 336,638 | ||||||
Chase Mortgage Finance Trust Series 2007-A1 | ||||||||
2.68%, 02/25/2037 | 56,839 | 56,985 | ||||||
2.69%, 02/25/2037 | 182,417 | 182,550 | ||||||
2.71%, 02/25/2037 | 360,904 | 361,231 | ||||||
2.72%, 02/25/2037 | 183,157 | 182,156 | ||||||
Chase Mortgage Finance Trust Series 2007-A2 | ||||||||
2.65%, 07/25/2037 | 212,780 | 212,307 | ||||||
2.80%, 07/25/2037 | 144,205 | 144,507 | ||||||
CHL Mortgage Pass-Through Trust 2002-18 | ||||||||
0.00%, 11/25/2032 | 23,001 | 19,634 |
CHL Mortgage Pass-Through Trust 2002-22 | ||||||||
6.25%, 10/25/2032 | 115,562 | 120,546 | ||||||
CHL Mortgage Pass-Through Trust 2003-26 | ||||||||
3.50%, 08/25/2033 | 206,602 | 206,225 | ||||||
CHL Mortgage Pass-Through Trust 2003-29 | ||||||||
5.50%, 08/25/2033 | 77,550 | 80,368 | ||||||
CHL Mortgage Pass-Through Trust 2003-39 | ||||||||
5.00%, 10/25/2033 | 537,866 | 554,074 | ||||||
CHL Mortgage Pass-Through Trust 2003-44 | ||||||||
0.00%, 10/25/2033 | 17,179 | 17,129 | ||||||
CHL Mortgage Pass-Through Trust 2003-J13 | ||||||||
0.00%, 01/25/2034 | 7,084 | 6,237 | ||||||
5.25%, 01/25/2034 | 491,470 | 507,403 | ||||||
CHL Mortgage Pass-Through Trust 2003-J7 | ||||||||
9.56%, 08/25/2018 | 57,759 | 60,351 | ||||||
CHL Mortgage Pass-Through Trust 2004-3 | ||||||||
5.50%, 04/25/2034 | 106,280 | 108,307 | ||||||
5.75%, 04/25/2034 | 72,410 | 73,990 | ||||||
CHL Mortgage Pass-Through Trust 2004-5 | ||||||||
5.50%, 06/25/2034 | 488,550 | 509,039 | ||||||
CHL Mortgage Pass-Through Trust 2004-7 | ||||||||
2.69%, 06/25/2034 | 27,586 | 26,520 | ||||||
CHL Mortgage Pass-Through Trust 2004-8 | ||||||||
4.50%, 06/25/2019 | 283,348 | 292,167 | ||||||
CHL Mortgage Pass-Through Trust 2004-HYB1 | ||||||||
2.65%, 05/20/2034 | 51,086 | 47,981 | ||||||
CHL Mortgage Pass-Through Trust 2004-HYB3 | ||||||||
2.50%, 06/20/2034 | 205,272 | 192,027 | ||||||
CHL Mortgage Pass-Through Trust 2004-HYB6 | ||||||||
2.54%, 11/20/2034 | 131,462 | 122,753 | ||||||
CHL Mortgage Pass-Through Trust 2004-J6 | ||||||||
4.75%, 07/25/2014 | 2,618 | 2,621 | ||||||
CHL Mortgage Pass-Through Trust 2004-J8 | ||||||||
4.75%, 11/25/2019 | 25,152 | 25,788 | ||||||
CHL Mortgage Pass-Through Trust 2005-14 | ||||||||
5.50%, 07/25/2035 | 67,897 | 67,777 |
CHL Mortgage Pass-Through Trust 2005-16 | ||||||||
5.50%, 09/25/2035 | 44,107 | 41,789 | ||||||
CHL Mortgage Pass-Through Trust 2005-22 | ||||||||
2.59%, 11/25/2035 | 488,882 | 398,730 | ||||||
Citicorp Mortgage Securities Trust Series 2006-1 | ||||||||
5.00%, 02/25/2021 | 52,675 | 54,875 | ||||||
Citicorp Mortgage Securities Trust Series 2006-4 | ||||||||
6.00%, 08/25/2036 | 219,206 | 221,850 | ||||||
Citigroup Commercial Mortgage Trust 2005-C3 | ||||||||
4.83%, 05/15/2043 | 743,000 | 773,563 | ||||||
Citigroup Commercial Mortgage Trust 2013-GC17 | ||||||||
2.96%, 11/10/2046 | 15,000,000 | 15,279,630 | ||||||
Citigroup Mortgage Loan Trust 2008-AR4 | ||||||||
2.89%, 11/25/2038 (Acquired 10/28/2013, Cost $1,538,167) (a) | 1,521,312 | 1,533,327 | ||||||
Citigroup Mortgage Loan Trust 2009-10 | ||||||||
2.42%, 09/25/2033 (Acquired 10/28/2013, Cost $914,705) (a) | 898,511 | 913,984 | ||||||
7.00%, 12/25/2035 (Acquired 10/28/2013, Cost $719,091) (a) | 693,160 | 718,615 | ||||||
Citigroup Mortgage Loan Trust 2009-11 | ||||||||
5.75%, 05/25/2037 (Acquired 10/28/2013, Cost $834,358) (a) | 809,149 | 834,477 | ||||||
Citigroup Mortgage Loan Trust 2009-5 | ||||||||
6.00%, 06/25/2036 (Acquired 10/28/2013, Cost $361,282) (a) | 353,755 | 361,235 | ||||||
Citigroup Mortgage Loan Trust 2009-8 | ||||||||
6.00%, 11/25/2036 (Acquired 10/28/2013, Cost $301,238) (a) | 290,367 | 301,310 | ||||||
Citigroup Mortgage Loan Trust 2010-10 | ||||||||
0.22%, 02/25/2036 (Acquired 10/28/2013, Cost $422,461) (a) | 419,149 | 423,265 | ||||||
Citigroup Mortgage Loan Trust 2010-3 | ||||||||
2.38%, 02/25/2036 (Acquired 10/28/2013, Cost $193,408) (a) | 192,693 | 193,202 | ||||||
Citigroup Mortgage Loan Trust 2010-7 | ||||||||
2.61%, 02/25/2035 (Acquired 10/28/2013, Cost $300,960) (a) | 296,415 | 300,252 | ||||||
Citigroup Mortgage Loan Trust 2010-8 | ||||||||
4.00%, 11/25/2036 (Acquired 10/28/2013, Cost $4,225,270) (a) | 4,188,308 | 4,223,645 | ||||||
4.50%, 12/25/2036 (Acquired 10/28/2013, Cost $4,482,137) (a) | 4,360,569 | 4,485,068 | ||||||
Citigroup Mortgage Loan Trust 2011-10 | ||||||||
0.36%, 02/25/2046 (Acquired 10/28/2013, Cost $363,534) (a) | 376,881 | 363,512 |
Citigroup Mortgage Loan Trust Inc | ||||||||
0.00%, 06/25/2016 | 62 | 62 | ||||||
0.00%, 12/25/2018 | 10,339 | 9,567 | ||||||
0.00%, 12/25/2018 | 8,973 | 8,375 | ||||||
5.50%, 12/25/2018 | 51,672 | 53,634 | ||||||
0.00%, 09/25/2033 | 18,217 | 15,137 | ||||||
7.00%, 09/25/2033 | 30,747 | 31,837 | ||||||
0.00%, 10/25/2033 | 18,959 | 16,859 | ||||||
5.25%, 10/25/2033 | 145,536 | 148,730 | ||||||
3.79%, 08/25/2034 | 79,647 | 79,179 | ||||||
2.65%, 04/25/2035 | 54,728 | 42,967 | ||||||
5.50%, 05/25/2035 | 308,314 | 310,321 | ||||||
3.64%, 08/25/2035 | 148,816 | 107,257 | ||||||
5.50%, 11/25/2035 | 47,558 | 47,158 | ||||||
COBALT CMBS Commercial Mortgage Trust 2006-C1 | ||||||||
0.80%, 08/15/2048 | 20,696,849 | 373,082 | ||||||
5.22%, 08/15/2048 | 620,000 | 668,975 | ||||||
5.25%, 08/15/2048 | 578,000 | 593,530 | ||||||
COMM 2005-C6 Mortgage Trust | ||||||||
5.12%, 06/10/2044 | 5,039,984 | 5,300,279 | ||||||
COMM 2005-LP5 Mortgage Trust | ||||||||
4.98%, 05/10/2043 | 650,000 | 677,433 | ||||||
COMM 2012-9W57 Mortgage Trust | ||||||||
2.36%, 02/10/2029 (Acquired 10/28/2013, Cost $1,058,606) (a) | 1,032,000 | 1,055,895 | ||||||
COMM 2012-CCRE1 Mortgage Trust | ||||||||
3.39%, 05/15/2045 | 940,538 | 926,602 | ||||||
COMM 2012-CCRE2 Mortgage Trust | ||||||||
1.94%, 08/15/2045 | 3,443,391 | 380,058 | ||||||
3.15%, 08/15/2045 | 8,044,464 | 7,768,772 | ||||||
COMM 2013-300P Mortgage Trust | ||||||||
4.35%, 08/10/2030 (Acquired 10/28/2013, Cost $537,618) (a) | 516,000 | 523,642 | ||||||
COMM 2013-CCRE12 Mortgage Trust | ||||||||
3.77%, 10/10/2046 | 7,700,000 | 7,579,510 | ||||||
COMM 2013-SFS Mortgage Trust | ||||||||
2.99%, 04/12/2035 (Acquired 10/28/2013, Cost $670,800) (a) | 708,000 | 652,084 | ||||||
Commercial Mortgage Asset Trust | ||||||||
7.09%, 01/17/2032 | 147,925 | 148,360 | ||||||
Commercial Mortgage Pass Through Certificates | ||||||||
2.11%, 11/17/2026 (Acquired 10/28/2013, Cost $577,883) (a) | 577,312 | 578,055 | ||||||
Commercial Mortgage Trust 2005-GG3 | ||||||||
4.86%, 08/10/2042 | 361,000 | 373,169 |
Commercial Mortgage Trust 2006-GG7 | ||||||||
5.82%, 07/10/2038 | 310,000 | 338,419 | ||||||
Credit Suisse Commercial Mortgage Trust Series 2006-C2 | ||||||||
5.68%, 03/15/2039 | 738,000 | 794,092 | ||||||
Credit Suisse Commercial Mortgage Trust Series 2007-C2 | ||||||||
0.10%, 01/15/2049 (Acquired 10/28/2013, Cost $88,095) (a) | 24,749,802 | 89,718 | ||||||
Credit Suisse First Boston Mortgage Securities Corp | ||||||||
4.50%, 10/25/2018 | 22,226 | 22,901 | ||||||
5.00%, 10/25/2018 | 93,403 | 94,469 | ||||||
0.00%, 08/25/2019 | 4,377 | 4,069 | ||||||
5.25%, 08/25/2019 | 165,209 | 169,942 | ||||||
6.69%, 02/25/2033 | 179,916 | 182,822 | ||||||
2.80%, 06/25/2033 | 100,645 | 98,698 | ||||||
5.25%, 09/25/2033 | 255,214 | 263,584 | ||||||
0.00%, 10/25/2033 | 158,232 | 127,111 | ||||||
5.25%, 11/25/2033 | 128,465 | 129,356 | ||||||
5.25%, 11/25/2033 | 369,345 | 373,350 | ||||||
5.50%, 09/25/2034 | 217,812 | 232,989 | ||||||
5.50%, 12/25/2034 | 361,063 | 382,420 | ||||||
0.00%, 10/25/2035 | 50,290 | 31,235 | ||||||
5.50%, 10/25/2035 | 594,709 | 109,049 | ||||||
0.00%, 11/25/2035 | 31,088 | 18,286 | ||||||
4.83%, 04/15/2037 | 10,500,000 | 10,894,716 | ||||||
4.73%, 07/15/2037 | 175,000 | 181,681 | ||||||
5.10%, 08/15/2038 | 11,185,064 | 11,741,700 | ||||||
Credit Suisse Mortgage Capital Certificates | ||||||||
6.00%, 01/27/2038 (Acquired 10/28/2013, Cost $577,981) (a) | 563,378 | 577,911 | ||||||
CSMC Series 2010-11R | ||||||||
1.16%, 06/28/2047 | 7,443,214 | 7,109,526 | ||||||
CSMC Series 2010-12R | ||||||||
3.00%, 04/26/2037 (Acquired 10/28/2013, Cost $206,957) (a) | 208,404 | 207,028 | ||||||
2.52%, 09/26/2046 (Acquired 10/28/2013, Cost $251,429) (a) | 251,972 | 251,345 | ||||||
CSMC Series 2010-17R | ||||||||
2.40%, 06/26/2036 (Acquired 10/28/2013, Cost $485,422) (a) | 470,769 | 484,953 | ||||||
3.50%, 07/26/2036 (Acquired 10/28/2013, Cost $97,498) (a) | 97,515 | 97,537 | ||||||
CSMC Series 2010-1R | ||||||||
4.95%, 01/27/2036 (Acquired 10/28/2013, Cost $269,429) (a) | 261,414 | 269,356 |
CSMC Series 2011-16R | ||||||||
3.50%, 12/27/2036 (Acquired 10/28/2013, Cost $1,471,600) (a) | 1,446,502 | 1,463,573 | ||||||
CSMC Series 2011-1R | ||||||||
1.16%, 02/27/2047 (Acquired 10/28/2013, Cost $1,422,122) (a) | 1,427,681 | 1,423,127 | ||||||
CSMC Series 2011-6R | ||||||||
3.60%, 07/28/2036 (Acquired 10/28/2013, Cost $460,750) (a) | 465,820 | 466,672 | ||||||
CSMC Series 2011-7R | ||||||||
1.41%, 08/28/2047 (Acquired 10/28/2013, Cost $730,188) (a) | 732,289 | 730,823 | ||||||
CSMC Series 2011-9R | ||||||||
2.16%, 03/27/2046 (Acquired 10/28/2013, Cost $2,486,447) (a) | 2,481,243 | 2,486,184 | ||||||
CSMC Series 2012-2R | ||||||||
2.59%, 03/27/2047 | 528,978 | 511,110 | ||||||
CSMC Series 2012-3R | ||||||||
3.25%, 07/27/2037 | 1,491,443 | 1,487,338 | ||||||
CSMC Trust 2010-16 | ||||||||
3.38%, 06/25/2050 (Acquired 10/28/2013, Cost $766,859) (a) | 774,000 | 766,694 | ||||||
3.38%, 06/25/2050 (Acquired 10/28/2013, Cost $314,705) (a) | 325,000 | 317,635 | ||||||
DBRR 2012- EZ1 Trust | ||||||||
0.95%, 09/25/2045 (Acquired 10/28/2013, Cost $293,274) (a) | 293,407 | 293,421 | ||||||
DBRR 2013-EZ2 Trust | ||||||||
0.85%, 02/25/2045 (Acquired 10/28/2013, Cost $1,076,590) (a) | 1,080,456 | 1,074,854 | ||||||
DBUBS 2011-LC2 Mortgage Trust | ||||||||
1.42%, 07/10/2044 (Acquired 10/28/2013, Cost $263,902) (a) | 4,494,692 | 255,654 | ||||||
Defeased Loan Trust 2010-1 | ||||||||
2.36%, 01/13/2014 | 533,251 | 533,411 | ||||||
Deutsche Alt-A Securities Inc Mortgage Loan Trust Series 2005-1 | ||||||||
5.69%, 02/25/2020 | 154,444 | 160,133 | ||||||
Deutsche Alt-A Securities Inc Mortgage Loan Trust Series 2005-3 | ||||||||
5.34%, 06/25/2020 | 184,042 | 187,163 | ||||||
Deutsche Alt-A Securities Mortgage Loan Trust Series 2006-AR5 | ||||||||
6.00%, 10/25/2021 | 170,089 | 146,993 | ||||||
Deutsche Mortgage Sec Inc Mort Loan Tr Ser 2004-1 | ||||||||
0.00%, 10/25/2018 | 8,929 | 8,615 | ||||||
Deutsche Mortgage Securities Inc Mortgage Loan Resecurit Trust Ser 2009-RS2 | ||||||||
0.60%, 04/26/2037 (Acquired 10/28/2013, Cost $128,369) (a) | 130,312 | 128,899 | ||||||
Deutsche Mortgage Securities Inc Mortgage Loan Trust 2004-4 | ||||||||
5.65%, 04/25/2034 | 8,563 | 8,566 |
Fannie Mae | ||||||||
3.00%, 01/15/2026 | 5,000,000 | 5,102,539 | ||||||
3.50%, 01/15/2026 | 25,000,000 | 26,143,555 | ||||||
4.00%, 01/15/2026 | 8,000,000 | 8,476,875 | ||||||
4.50%, 01/15/2029 | 2,000,000 | 2,128,047 | ||||||
4.00%, 01/15/2041 | 500,000 | 514,687 | ||||||
4.50%, 01/15/2041 | 41,500,000 | 43,972,167 | ||||||
5.50%, 01/15/2041 | 20,000,000 | 21,999,218 | ||||||
6.00%, 01/15/2041 | 6,000,000 | 6,654,844 | ||||||
3.00%, 01/15/2043 | 10,000,000 | 9,492,969 | ||||||
5.00%, 01/15/2044 | 23,000,000 | 24,906,484 | ||||||
Fannie Mae Grantor Trust 1999-T2 | ||||||||
7.50%, 01/19/2039 | 182,986 | 204,693 | ||||||
Fannie Mae Grantor Trust 2001-T10 | ||||||||
7.50%, 12/25/2041 | 208,994 | 239,622 | ||||||
Fannie Mae Grantor Trust 2001-T3 | ||||||||
7.50%, 11/25/2040 | 230,090 | 268,332 | ||||||
Fannie Mae Grantor Trust 2002-T16 | ||||||||
7.00%, 07/25/2042 | 244,110 | 280,827 | ||||||
Fannie Mae Grantor Trust 2004-T1 | ||||||||
6.50%, 01/25/2044 | 72,738 | 82,254 | ||||||
Fannie Mae Grantor Trust 2004-T2 | ||||||||
3.34%, 07/25/2043 | 319,246 | 331,520 | ||||||
7.50%, 11/25/2043 | 512,342 | 594,470 | ||||||
Fannie Mae Grantor Trust 2004-T3 | ||||||||
8.95%, 01/25/2044 | 69,878 | 77,440 | ||||||
6.50%, 02/25/2044 | 712,955 | 800,714 | ||||||
7.00%, 02/25/2044 | 280,300 | 314,080 | ||||||
Fannie Mae Interest Strip | ||||||||
10.00%, 09/01/2017 | 329 | 49 | ||||||
4.50%, 07/01/2018 | 115,715 | 7,795 | ||||||
5.50%, 07/01/2018 | 93,605 | 7,228 | ||||||
4.50%, 08/25/2018 | 160,158 | 10,933 | ||||||
10.50%, 03/01/2019 | 215 | 45 | ||||||
4.50%, 11/01/2020 | 22,933 | 1,791 | ||||||
7.50%, 04/01/2023 | 3,200 | 734 |
9.00%, 03/01/2024 | 2,213 | 2,656 | ||||||
0.00%, 09/01/2024 | 257,266 | 249,045 | ||||||
0.00%, 01/01/2033 | 34,350 | 31,026 | ||||||
5.00%, 12/01/2033 | 40,361 | 7,122 | ||||||
5.50%, 05/01/2036 | 197,577 | 36,776 | ||||||
5.50%, 08/01/2036 | 130,475 | 23,442 | ||||||
5.50%, 04/25/2037 | 49,497 | 9,018 | ||||||
6.00%, 01/01/2038 | 152,310 | 26,317 | ||||||
0.66%, 08/25/2042 | 1,430,019 | 1,425,218 | ||||||
0.71%, 08/25/2042 | 4,253,598 | 4,257,330 | ||||||
Fannie Mae Pool | ||||||||
8.00%, 11/01/2015 | 282 | 285 | ||||||
12.50%, 01/01/2016 | 425 | 431 | ||||||
6.00%, 06/01/2016 | 2,914 | 3,009 | ||||||
3.98%, 11/01/2016 | 1,032,000 | 1,056,720 | ||||||
1.94%, 01/01/2017 | 992,162 | 1,005,762 | ||||||
1.99%, 01/01/2017 | 1,032,000 | 1,031,910 | ||||||
5.50%, 03/01/2017 | 12,700 | 13,259 | ||||||
6.50%, 03/01/2017 | 7,016 | 7,330 | ||||||
7.00%, 03/01/2017 | 3,659 | 3,868 | ||||||
7.00%, 03/01/2017 | 6,833 | 7,191 | ||||||
7.50%, 03/01/2017 | 718 | 738 | ||||||
5.24%, 05/01/2017 | 910,916 | 994,393 | ||||||
7.00%, 05/01/2017 | 5,927 | 6,275 | ||||||
3.82%, 06/01/2017 | 1,462,837 | 1,566,640 | ||||||
7.00%, 06/01/2017 | 2,450 | 2,591 | ||||||
7.00%, 06/01/2017 | 3,634 | 3,849 | ||||||
3.39%, 08/01/2017 | 274,000 | 290,539 | ||||||
6.00%, 08/01/2017 | 3,176 | 3,313 | ||||||
6.50%, 08/01/2017 | 8,217 | 8,678 | ||||||
5.50%, 09/01/2017 | 17,602 | 18,432 | ||||||
7.00%, 09/01/2017 | 4,974 | 5,258 | ||||||
2.49%, 10/01/2017 | 475,963 | 493,349 | ||||||
2.62%, 10/01/2017 | 599,000 | 622,292 | ||||||
2.69%, 10/01/2017 | 404,718 | 421,431 | ||||||
6.50%, 10/01/2017 | 5,165 | 5,406 | ||||||
6.00%, 11/01/2017 | 80,898 | 85,278 |
6.00%, 11/01/2017 | 6,899 | 7,220 | ||||||
6.50%, 11/01/2017 | 5,873 | 6,205 | ||||||
7.00%, 11/01/2017 | 15,329 | 15,875 | ||||||
3.38%, 01/01/2018 | 1,032,000 | 1,096,444 | ||||||
3.52%, 01/01/2018 | 652,652 | 696,247 | ||||||
3.54%, 01/01/2018 | 987,441 | 1,052,687 | ||||||
3.63%, 01/01/2018 | 310,000 | 331,186 | ||||||
5.50%, 02/01/2018 | 90,069 | 96,291 | ||||||
5.50%, 02/01/2018 | 50,748 | 54,246 | ||||||
3.80%, 03/01/2018 | 594,487 | 639,379 | ||||||
6.00%, 03/01/2018 | 32,974 | 34,553 | ||||||
6.50%, 03/01/2018 | 2,342 | 2,348 | ||||||
5.00%, 04/01/2018 | 31,363 | 33,419 | ||||||
4.50%, 05/01/2018 | 16,253 | 17,308 | ||||||
5.00%, 05/01/2018 | 45,591 | 48,571 | ||||||
5.00%, 05/01/2018 | 96,836 | 103,152 | ||||||
6.00%, 05/01/2018 | 10,854 | 11,478 | ||||||
9.00%, 05/01/2018 | 1,699 | 1,829 | ||||||
3.64%, 06/01/2018 | 716,836 | 767,919 | ||||||
3.74%, 06/01/2018 | 1,984,821 | 2,149,689 | ||||||
4.50%, 06/01/2018 | 4,211 | 4,480 | ||||||
4.50%, 06/01/2018 | 20,486 | 21,801 | ||||||
5.00%, 06/01/2018 | 95,544 | 101,808 | ||||||
5.00%, 06/01/2018 | 19,341 | 20,610 | ||||||
5.00%, 06/01/2018 | 75,662 | 80,629 | ||||||
5.00%, 06/01/2018 | 28,561 | 30,397 | ||||||
4.00%, 07/01/2018 | 10,749 | 11,386 | ||||||
4.50%, 07/01/2018 | 18,940 | 20,158 | ||||||
4.50%, 07/01/2018 | 29,001 | 30,866 | ||||||
5.00%, 07/01/2018 | 109,631 | 116,808 | ||||||
4.50%, 08/01/2018 | 20,127 | 21,420 | ||||||
4.50%, 08/01/2018 | 39,586 | 42,129 | ||||||
5.00%, 08/01/2018 | 59,975 | 63,841 | ||||||
4.00%, 09/01/2018 | 3,383 | 3,584 | ||||||
5.00%, 09/01/2018 | 75,268 | 80,232 | ||||||
4.00%, 10/01/2018 | 17,274 | 18,311 | ||||||
4.50%, 10/01/2018 | 49,590 | 52,745 |
5.00%, 10/01/2018 | 45,553 | 48,543 | ||||||
5.00%, 10/01/2018 | 49,893 | 53,168 | ||||||
2.97%, 11/01/2018 | 1,466,582 | 1,520,285 | ||||||
4.50%, 11/01/2018 | 80,051 | 85,187 | ||||||
5.00%, 11/01/2018 | 97,289 | 103,687 | ||||||
5.00%, 11/01/2018 | 48,864 | 52,021 | ||||||
5.00%, 11/01/2018 | 10,693 | 11,395 | ||||||
6.07%, 11/01/2018 | 601,840 | 653,817 | ||||||
3.04%, 12/01/2018 | 1,238,000 | 1,285,581 | ||||||
4.50%, 12/01/2018 | 213,249 | 226,972 | ||||||
5.00%, 12/01/2018 | 254,124 | 270,725 | ||||||
5.00%, 12/01/2018 | 659 | 702 | ||||||
9.50%, 12/01/2018 | 2,512 | 2,754 | ||||||
2.25%, 01/01/2019 | 820 | 841 | ||||||
6.00%, 01/01/2019 | 39,679 | 41,709 | ||||||
1.90%, 03/01/2019 | 3,234 | 3,289 | ||||||
4.50%, 03/01/2019 | 54,807 | 58,354 | ||||||
6.00%, 03/01/2019 | 95,671 | 101,061 | ||||||
2.14%, 04/01/2019 | 2,064,000 | 2,069,210 | ||||||
3.50%, 04/01/2019 | 49,776 | 52,051 | ||||||
5.00%, 04/01/2019 | 4,125 | 4,390 | ||||||
5.00%, 04/01/2019 | 194,464 | 208,245 | ||||||
10.59%, 04/15/2019 | 10,430 | 11,378 | ||||||
2.19%, 05/01/2019 | 1,004,730 | 1,007,826 | ||||||
4.50%, 05/01/2019 | 15,557 | 16,918 | ||||||
2.10%, 06/01/2019 | 722,000 | 720,364 | ||||||
2.45%, 06/01/2019 | 1,651,000 | 1,674,056 | ||||||
2.48%, 06/01/2019 | 3,000,000 | 3,021,150 | ||||||
4.50%, 06/01/2019 | 120,446 | 128,239 | ||||||
1.94%, 07/01/2019 | 1,342,000 | 1,351,364 | ||||||
2.20%, 07/01/2019 | 756,769 | 757,104 | ||||||
2.37%, 07/01/2019 | 1,548,000 | 1,562,255 | ||||||
5.50%, 07/01/2019 | 152,620 | 165,255 | ||||||
6.00%, 07/01/2019 | 26,136 | 27,475 | ||||||
2.03%, 08/01/2019 | 4,923,000 | 4,845,353 | ||||||
2.38%, 08/01/2019 | 215 | 217 | ||||||
5.50%, 08/01/2019 | 133,973 | 145,063 |
5.00%, 09/01/2019 | 4,717 | 5,050 | ||||||
5.50%, 09/01/2019 | 94,054 | 101,846 | ||||||
9.00%, 09/01/2019 | 1,794 | 1,826 | ||||||
5.00%, 10/01/2019 | 37,983 | 40,675 | ||||||
6.00%, 10/01/2019 | 69,830 | 74,105 | ||||||
4.13%, 11/01/2019 | 877,000 | 941,540 | ||||||
4.24%, 11/01/2019 | 360,414 | 395,250 | ||||||
4.50%, 11/01/2019 | 104,304 | 111,031 | ||||||
4.50%, 11/01/2019 | 26,210 | 27,904 | ||||||
4.50%, 11/01/2019 | 54,006 | 57,488 | ||||||
1.47%, 12/01/2019 | 853,713 | 815,338 | ||||||
1.69%, 12/01/2019 | 1,032,000 | 985,557 | ||||||
1.80%, 12/01/2019 | 800,571 | 776,635 | ||||||
4.18%, 12/01/2019 | 486,109 | 524,139 | ||||||
4.26%, 12/01/2019 | 974,878 | 1,054,649 | ||||||
4.50%, 12/01/2019 | 80,733 | 85,972 | ||||||
4.53%, 12/01/2019 | 2,173,643 | 2,386,012 | ||||||
5.00%, 12/01/2019 | 55,569 | 59,208 | ||||||
1.50%, 01/01/2020 | 846,318 | 807,397 | ||||||
1.58%, 01/01/2020 | 1,518,151 | 1,454,638 | ||||||
4.28%, 01/01/2020 | 1,941,605 | 2,097,735 | ||||||
4.54%, 01/01/2020 | 342,579 | 376,200 | ||||||
5.50%, 01/01/2020 | 348,820 | 372,949 | ||||||
4.37%, 02/01/2020 | 1,181,850 | 1,286,401 | ||||||
4.40%, 02/01/2020 | 6,347,000 | 6,919,759 | ||||||
4.40%, 02/01/2020 | 289,000 | 314,321 | ||||||
4.36%, 03/01/2020 | 288,637 | 313,527 | ||||||
5.50%, 03/01/2020 | 70,438 | 75,289 | ||||||
6.00%, 03/01/2020 | 28,324 | 30,390 | ||||||
4.00%, 04/01/2020 | 49,145 | 51,190 | ||||||
4.35%, 04/01/2020 | 1,517,254 | 1,648,579 | ||||||
4.37%, 04/01/2020 | 2,344,876 | 2,550,670 | ||||||
2.01%, 06/01/2020 | 9,288,000 | 9,072,255 | ||||||
5.50%, 06/01/2020 | 497,408 | 531,724 | ||||||
5.50%, 06/01/2020 | 102,124 | 110,366 | ||||||
3.74%, 07/01/2020 | 588,362 | 622,239 | ||||||
3.93%, 07/01/2020 | 1,518,415 | 1,616,148 |
3.95%, 07/01/2020 | 826,000 | 875,658 | ||||||
3.95%, 07/01/2020 | 722,000 | 769,022 | ||||||
4.07%, 07/01/2020 | 3,236,239 | 3,473,126 | ||||||
4.13%, 07/01/2020 | 715,252 | 767,226 | ||||||
5.50%, 07/01/2020 | 124,329 | 132,890 | ||||||
3.74%, 08/01/2020 | 1,318,799 | 1,394,321 | ||||||
3.80%, 08/01/2020 | 1,032,000 | 1,075,354 | ||||||
3.89%, 08/01/2020 | 1,259,824 | 1,337,857 | ||||||
3.96%, 08/01/2020 | 1,013,506 | 1,079,068 | ||||||
4.30%, 08/01/2020 | 491,681 | 541,290 | ||||||
6.50%, 08/01/2020 | 14,466 | 15,539 | ||||||
3.43%, 09/01/2020 | 981,688 | 1,019,480 | ||||||
3.50%, 09/01/2020 | 834,004 | 869,640 | ||||||
3.51%, 09/01/2020 | 2,934,089 | 3,061,192 | ||||||
3.60%, 09/01/2020 | 196,885 | 206,272 | ||||||
3.68%, 09/01/2020 | 369,168 | 388,554 | ||||||
3.85%, 09/01/2020 | 1,767,160 | 1,873,239 | ||||||
3.29%, 10/01/2020 | 823,852 | 847,809 | ||||||
3.36%, 10/01/2020 | 826,000 | 853,637 | ||||||
3.50%, 10/01/2020 | 1,185,248 | 1,234,470 | ||||||
3.54%, 10/01/2020 | 991,000 | 1,021,295 | ||||||
3.54%, 10/01/2020 | 491,076 | 512,552 | ||||||
3.59%, 10/01/2020 | 1,559,135 | 1,632,166 | ||||||
3.92%, 10/01/2020 | 715,639 | 759,688 | ||||||
3.23%, 11/01/2020 | 608,187 | 623,081 | ||||||
3.27%, 11/01/2020 | 803,105 | 822,628 | ||||||
3.35%, 11/01/2020 | 665,285 | 686,145 | ||||||
0.79%, 12/01/2020 | 1,640,000 | 1,643,654 | ||||||
2.00%, 12/01/2020 | 1,548,000 | 1,457,667 | ||||||
3.48%, 12/01/2020 | 877,000 | 910,018 | ||||||
3.52%, 12/01/2020 | 1,015,635 | 1,057,802 | ||||||
3.70%, 12/01/2020 | 392,978 | 412,975 | ||||||
3.83%, 12/01/2020 | 935,410 | 988,431 | ||||||
4.00%, 12/01/2020 | 79,340 | 84,024 | ||||||
3.77%, 01/01/2021 | 1,230,515 | 1,295,858 | ||||||
3.87%, 01/01/2021 | 1,176,000 | 1,243,388 | ||||||
3.93%, 01/01/2021 | 413,000 | 437,707 |
4.05%, 01/01/2021 | 482,000 | 510,680 | ||||||
4.30%, 01/01/2021 | 895,053 | 971,889 | ||||||
4.38%, 01/01/2021 | 2,483,217 | 2,691,615 | ||||||
4.45%, 01/01/2021 | 437,206 | 475,900 | ||||||
4.64%, 01/01/2021 | 1,299,348 | 1,426,372 | ||||||
4.33%, 02/01/2021 | 510,503 | 551,400 | ||||||
4.16%, 03/01/2021 | 1,784,422 | 1,909,201 | ||||||
6.00%, 03/01/2021 | 100,770 | 109,172 | ||||||
8.00%, 03/01/2021 | 114 | 115 | ||||||
4.25%, 04/01/2021 | 784,000 | 839,058 | ||||||
4.25%, 04/01/2021 | 1,032,000 | 1,104,474 | ||||||
4.30%, 04/01/2021 | 307,389 | 331,013 | ||||||
4.33%, 04/01/2021 | 748,363 | 807,012 | ||||||
6.00%, 04/01/2021 | 86,604 | 92,103 | ||||||
6.00%, 04/01/2021 | 41,206 | 44,470 | ||||||
6.00%, 04/01/2021 | 478,938 | 505,051 | ||||||
4.36%, 05/01/2021 | 1,548,000 | 1,672,298 | ||||||
4.39%, 05/01/2021 | 783,134 | 847,501 | ||||||
3.97%, 06/01/2021 | 651,875 | 688,106 | ||||||
4.02%, 06/01/2021 | 691,000 | 728,999 | ||||||
4.10%, 06/01/2021 | 704,571 | 749,253 | ||||||
4.19%, 06/01/2021 | 564,236 | 603,265 | ||||||
4.24%, 06/01/2021 | 1,760,955 | 1,886,852 | ||||||
4.29%, 06/01/2021 | 1,006,090 | 1,082,030 | ||||||
4.34%, 06/01/2021 | 1,858,000 | 1,997,803 | ||||||
4.48%, 06/01/2021 | 929,000 | 1,008,008 | ||||||
3.86%, 07/01/2021 | 995,826 | 1,045,784 | ||||||
3.89%, 07/01/2021 | 913,000 | 960,372 | ||||||
3.94%, 07/01/2021 | 1,032,000 | 1,083,504 | ||||||
3.99%, 07/01/2021 | 556,157 | 587,988 | ||||||
4.06%, 07/01/2021 | 998,000 | 1,058,931 | ||||||
4.26%, 07/01/2021 | 2,252,000 | 2,415,286 | ||||||
4.32%, 07/01/2021 | 999,769 | 1,100,400 | ||||||
6.00%, 07/01/2021 | 19,509 | 21,284 | ||||||
4.05%, 08/01/2021 | 189,551 | 200,751 | ||||||
4.13%, 08/01/2021 | 809,770 | 861,490 | ||||||
4.50%, 08/01/2021 | 2,838,000 | 3,081,146 |
6.00%, 08/01/2021 | 365,691 | 390,554 | ||||||
3.77%, 09/01/2021 | 2,776,000 | 2,870,727 | ||||||
3.78%, 09/01/2021 | 757,999 | 791,794 | ||||||
3.85%, 09/01/2021 | 896,383 | 939,389 | ||||||
3.88%, 09/01/2021 | 1,795,441 | 1,889,182 | ||||||
3.89%, 09/01/2021 | 1,445,000 | 1,518,218 | ||||||
3.92%, 09/01/2021 | 680,096 | 715,276 | ||||||
3.31%, 10/01/2021 | 1,751,475 | 1,775,648 | ||||||
3.40%, 10/01/2021 | 364,346 | 371,477 | ||||||
3.59%, 10/01/2021 | 1,032,000 | 1,057,583 | ||||||
4.07%, 10/01/2021 | 1,853,820 | 1,965,020 | ||||||
0.55%, 11/01/2021 | 609,000 | 613,842 | ||||||
3.43%, 11/01/2021 | 1,030,641 | 1,051,979 | ||||||
5.00%, 11/01/2021 | 474,889 | 508,496 | ||||||
3.03%, 12/01/2021 | 997,845 | 993,995 | ||||||
3.31%, 12/01/2021 | 400,454 | 405,352 | ||||||
3.83%, 12/01/2021 | 1,548,000 | 1,595,496 | ||||||
6.00%, 12/01/2021 | 125,606 | 135,226 | ||||||
2.97%, 01/01/2022 | 799,237 | 792,039 | ||||||
3.03%, 01/01/2022 | 939,937 | 938,679 | ||||||
3.09%, 01/01/2022 | 1,395,881 | 1,393,620 | ||||||
3.12%, 01/01/2022 | 1,238,000 | 1,238,787 | ||||||
3.20%, 01/01/2022 | 826,000 | 830,004 | ||||||
2.99%, 02/01/2022 | 299,289 | 296,584 | ||||||
3.00%, 02/01/2022 | 516,000 | 511,677 | ||||||
3.06%, 02/01/2022 | 863,000 | 849,282 | ||||||
3.09%, 02/01/2022 | 1,149,164 | 1,146,439 | ||||||
3.14%, 02/01/2022 | 2,064,000 | 2,043,318 | ||||||
3.14%, 02/01/2022 | 500,129 | 500,427 | ||||||
0.77%, 03/01/2022 | 722,000 | 722,381 | ||||||
0.97%, 03/01/2022 | 995,945 | 993,884 | ||||||
2.75%, 03/01/2022 | 1,002,085 | 981,747 | ||||||
2.97%, 03/01/2022 | 552,000 | 545,615 | ||||||
2.97%, 03/01/2022 | 619,000 | 604,424 | ||||||
3.08%, 03/01/2022 | 440,107 | 438,343 | ||||||
3.14%, 03/01/2022 | 310,967 | 310,716 | ||||||
3.21%, 03/01/2022 | 310,000 | 307,832 |
0.78%, 04/01/2022 | 1,238,000 | 1,236,114 | ||||||
0.94%, 04/01/2022 | 940,000 | 940,744 | ||||||
0.94%, 04/01/2022 | 918,000 | 918,726 | ||||||
2.70%, 04/01/2022 | 1,732,290 | 1,690,771 | ||||||
3.08%, 04/01/2022 | 1,015,897 | 1,005,285 | ||||||
6.50%, 04/01/2022 | 79,990 | 87,812 | ||||||
2.74%, 05/01/2022 | 1,200,286 | 1,168,806 | ||||||
2.77%, 05/01/2022 | 1,651,000 | 1,610,353 | ||||||
2.86%, 05/01/2022 | 1,508,375 | 1,477,153 | ||||||
2.90%, 05/01/2022 | 1,005,857 | 987,805 | ||||||
2.94%, 05/01/2022 | 1,106,029 | 1,088,984 | ||||||
3.02%, 05/01/2022 | 695,426 | 687,347 | ||||||
3.10%, 05/01/2022 | 804,000 | 799,340 | ||||||
3.12%, 05/01/2022 | 1,006,424 | 1,002,239 | ||||||
6.50%, 05/01/2022 | 14,574 | 16,218 | ||||||
2.60%, 06/01/2022 | 901,182 | 868,495 | ||||||
2.76%, 06/01/2022 | 1,605,000 | 1,566,126 | ||||||
2.67%, 07/01/2022 | 624,000 | 592,007 | ||||||
2.67%, 07/01/2022 | 1,256,859 | 1,213,792 | ||||||
2.69%, 07/01/2022 | 1,032,000 | 997,648 | ||||||
2.82%, 07/01/2022 | 1,155,369 | 1,127,469 | ||||||
2.98%, 07/01/2022 | 2,270,000 | 2,236,021 | ||||||
0.72%, 08/01/2022 | 1,506,433 | 1,509,750 | ||||||
2.65%, 08/01/2022 | 1,032,000 | 975,623 | ||||||
0.61%, 09/01/2022 | 1,238,000 | 1,239,206 | ||||||
2.47%, 09/01/2022 | 403,337 | 382,984 | ||||||
0.56%, 10/01/2022 | 1,705,000 | 1,707,848 | ||||||
0.56%, 10/01/2022 | 929,000 | 930,552 | ||||||
0.60%, 10/01/2022 | 1,509,934 | 1,512,270 | ||||||
2.39%, 10/01/2022 | 687,170 | 647,824 | ||||||
2.52%, 10/01/2022 | 1,028,954 | 978,721 | ||||||
2.57%, 10/01/2022 | 619,000 | 590,536 | ||||||
2.64%, 10/01/2022 | 684,000 | 656,046 | ||||||
2.37%, 11/01/2022 | 505,959 | 475,265 | ||||||
2.37%, 11/01/2022 | 1,032,000 | 969,345 | ||||||
2.38%, 11/01/2022 | 912,772 | 856,591 | ||||||
2.41%, 11/01/2022 | 633,256 | 593,261 |
2.44%, 11/01/2022 | 871,435 | 818,610 | ||||||
2.45%, 11/01/2022 | 1,401,000 | 1,309,726 | ||||||
2.47%, 11/01/2022 | 516,000 | 477,851 | ||||||
2.55%, 11/01/2022 | 422,159 | 401,209 | ||||||
2.55%, 11/01/2022 | 1,321,585 | 1,256,000 | ||||||
7.50%, 11/01/2022 | 3,488 | 3,836 | ||||||
2.24%, 12/01/2022 | 671,000 | 623,286 | ||||||
2.28%, 12/01/2022 | 1,084,000 | 1,009,182 | ||||||
2.32%, 12/01/2022 | 405,177 | 378,900 | ||||||
2.34%, 12/01/2022 | 2,489,193 | 2,323,566 | ||||||
2.38%, 12/01/2022 | 516,000 | 484,327 | ||||||
2.39%, 12/01/2022 | 1,116,436 | 1,046,952 | ||||||
2.40%, 12/01/2022 | 1,632,000 | 1,533,230 | ||||||
2.42%, 12/01/2022 | 1,238,000 | 1,164,450 | ||||||
6.50%, 12/01/2022 | 70,100 | 77,926 | ||||||
0.51%, 01/01/2023 | 1,527,000 | 1,530,062 | ||||||
0.51%, 01/01/2023 | 2,580,000 | 2,585,723 | ||||||
0.52%, 01/01/2023 | 4,616,511 | 4,606,289 | ||||||
0.53%, 01/01/2023 | 2,441,519 | 2,446,009 | ||||||
0.56%, 01/01/2023 | 820,234 | 821,948 | ||||||
2.15%, 01/01/2023 | 516,000 | 475,388 | ||||||
2.33%, 01/01/2023 | 1,776,000 | 1,658,303 | ||||||
2.34%, 01/01/2023 | 1,445,000 | 1,349,240 | ||||||
2.37%, 01/01/2023 | 1,167,603 | 1,092,373 | ||||||
2.40%, 01/01/2023 | 1,566,022 | 1,468,052 | ||||||
2.44%, 01/01/2023 | 1,042,418 | 979,124 | ||||||
2.45%, 01/01/2023 | 771,020 | 724,235 | ||||||
2.51%, 01/01/2023 | 949,000 | 896,109 | ||||||
2.60%, 01/01/2023 | 813,973 | 773,559 | ||||||
5.50%, 01/01/2023 | 5,615,246 | 6,168,556 | ||||||
0.55%, 02/01/2023 | 1,135,000 | 1,133,868 | ||||||
2.40%, 02/01/2023 | 1,465,000 | 1,371,961 | ||||||
2.45%, 02/01/2023 | 1,290,000 | 1,184,654 | ||||||
6.00%, 02/01/2023 | 756,880 | 824,799 | ||||||
2.49%, 03/01/2023 | 826,000 | 776,957 | ||||||
2.50%, 04/01/2023 | 1,445,000 | 1,326,233 | ||||||
2.64%, 04/01/2023 | 370,611 | 350,860 |
2.70%, 04/01/2023 | 664,889 | 633,739 | ||||||
2.52%, 05/01/2023 | 3,302,000 | 3,028,731 | ||||||
2.54%, 05/01/2023 | 310,000 | 291,655 | ||||||
5.00%, 05/01/2023 | 67,768 | 72,990 | ||||||
2.42%, 06/01/2023 | 951,860 | 885,919 | ||||||
2.66%, 06/01/2023 | 710,000 | 665,268 | ||||||
2.77%, 06/01/2023 | 929,000 | 886,696 | ||||||
2.64%, 07/01/2023 | 413,000 | 380,992 | ||||||
3.67%, 07/01/2023 | 4,850,000 | 4,872,898 | ||||||
3.74%, 07/01/2023 | 568,000 | 580,888 | ||||||
5.50%, 07/01/2023 | 56,081 | 61,612 | ||||||
3.59%, 08/01/2023 | 1,135,000 | 1,130,518 | ||||||
4.18%, 09/01/2023 | 1,459,259 | 1,528,839 | ||||||
3.76%, 10/01/2023 | 1,000,000 | 1,020,858 | ||||||
5.00%, 11/01/2023 | 132,276 | 143,494 | ||||||
0.64%, 12/01/2023 | 3,000,000 | 3,005,571 | ||||||
6.00%, 01/01/2024 | 203,805 | 223,328 | ||||||
6.00%, 01/01/2024 | 552,470 | 607,766 | ||||||
7.00%, 01/01/2024 | 1,121 | 1,274 | ||||||
6.50%, 02/01/2024 | 312,807 | 345,591 | ||||||
10.00%, 02/01/2024 | 1,377 | 1,417 | ||||||
6.00%, 04/01/2024 | 37,203 | 41,200 | ||||||
8.00%, 05/01/2024 | 1,201 | 1,398 | ||||||
6.00%, 07/01/2024 | 134,041 | 147,000 | ||||||
6.50%, 07/01/2024 | 140,196 | 155,723 | ||||||
8.50%, 07/01/2024 | 2,861 | 3,452 | ||||||
5.00%, 08/01/2024 | 208,657 | 225,053 | ||||||
7.50%, 10/01/2024 | 1,373 | 1,557 | ||||||
3.64%, 01/01/2025 | 586,666 | 581,558 | ||||||
6.50%, 04/01/2025 | 21,691 | 24,098 | ||||||
8.50%, 05/01/2025 | 93 | 94 | ||||||
8.50%, 06/01/2025 | 310 | 312 | ||||||
5.50%, 07/01/2025 | 223,336 | 245,308 | ||||||
5.00%, 10/01/2025 | 59,866 | 64,940 | ||||||
9.00%, 12/01/2025 | 748 | 751 | ||||||
6.00%, 03/01/2026 | 52,624 | 58,515 | ||||||
7.00%, 04/01/2026 | 7,525 | 8,097 |
9.00%, 04/01/2026 | 249 | 250 | ||||||
6.00%, 05/01/2026 | 116,210 | 129,171 | ||||||
6.00%, 07/01/2026 | 125,082 | 138,999 | ||||||
4.55%, 08/01/2026 | 1,154,830 | 1,215,255 | ||||||
4.76%, 08/01/2026 | 1,100,407 | 1,180,145 | ||||||
4.77%, 08/01/2026 | 700,010 | 750,975 | ||||||
6.50%, 08/01/2026 | 193,557 | 215,183 | ||||||
4.67%, 12/01/2026 | 1,196,311 | 1,285,583 | ||||||
8.00%, 03/01/2027 | 9,274 | 10,617 | ||||||
3.00%, 04/01/2027 | 1,612,585 | 1,647,452 | ||||||
3.00%, 05/01/2027 | 9,598,206 | 9,805,663 | ||||||
8.00%, 06/01/2027 | 13,339 | 15,356 | ||||||
6.00%, 07/01/2027 | 163,431 | 181,500 | ||||||
2.50%, 09/01/2027 | 1,114,845 | 1,107,177 | ||||||
2.82%, 09/01/2027 | 17,760 | 18,902 | ||||||
6.00%, 09/01/2027 | 506,349 | 562,753 | ||||||
7.00%, 09/01/2027 | 2,135 | 2,437 | ||||||
6.00%, 11/01/2027 | 71,618 | 79,754 | ||||||
2.50%, 12/01/2027 | 2,737,733 | 2,718,855 | ||||||
6.00%, 12/01/2027 | 226,926 | 252,694 | ||||||
6.00%, 01/01/2028 | 343,980 | 386,420 | ||||||
2.50%, 03/01/2028 | 8,859,479 | 8,778,326 | ||||||
2.50%, 04/01/2028 | 10,351,192 | 10,256,375 | ||||||
5.00%, 05/01/2028 | 85,417 | 93,036 | ||||||
8.00%, 06/01/2028 | 7,869 | 8,967 | ||||||
9.50%, 07/01/2028 | 2,113 | 2,380 | ||||||
2.50%, 09/01/2028 | 0 | — | ||||||
3.00%, 09/01/2028 | 5,006,292 | 5,114,104 | ||||||
8.00%, 09/01/2028 | 20,660 | 24,016 | ||||||
2.50%, 10/01/2028 | 9,945,119 | 9,854,022 | ||||||
6.00%, 10/01/2028 | 286,628 | 318,680 | ||||||
3.00%, 11/01/2028 | 3,000,003 | 3,063,741 | ||||||
8.00%, 11/01/2028 | 67,167 | 80,598 | ||||||
3.00%, 12/01/2028 | 18,500,000 | 18,895,456 | ||||||
3.00%, 12/01/2028 | 4,000,000 | 4,085,512 | ||||||
3.00%, 12/01/2028 | 2,000,000 | 2,042,752 | ||||||
6.00%, 12/01/2028 | 5,472 | 6,061 |
6.00%, 01/01/2029 | 12,574 | 14,125 | ||||||
7.00%, 01/01/2029 | 10,654 | 11,912 | ||||||
3.78%, 03/01/2029 | 13,603 | 14,444 | ||||||
6.50%, 03/01/2029 | 35,637 | 40,558 | ||||||
4.50%, 08/01/2029 | 623,555 | 664,440 | ||||||
4.50%, 09/01/2029 | 667,505 | 711,282 | ||||||
6.00%, 09/01/2029 | 211,069 | 234,348 | ||||||
6.50%, 11/01/2029 | 1,579,257 | 1,785,806 | ||||||
8.50%, 02/01/2030 | 2,555 | 2,610 | ||||||
9.00%, 12/01/2030 | 2,748 | 2,813 | ||||||
5.00%, 04/01/2031 | 300,020 | 328,229 | ||||||
6.50%, 08/01/2031 | 32,668 | 37,102 | ||||||
6.50%, 02/01/2032 | 150,711 | 171,538 | ||||||
7.00%, 06/01/2032 | 11,027 | 12,064 | ||||||
3.50%, 07/01/2032 | 254,050 | 258,715 | ||||||
3.50%, 08/01/2032 | 2,085,662 | 2,123,952 | ||||||
7.00%, 08/01/2032 | 2,946 | 3,186 | ||||||
5.50%, 11/01/2032 | 95,518 | 105,335 | ||||||
3.50%, 12/01/2032 | 744,943 | 747,375 | ||||||
5.00%, 12/01/2032 | 17,759 | 18,839 | ||||||
6.00%, 12/01/2032 | 42,404 | 47,693 | ||||||
6.00%, 12/01/2032 | 444,568 | 498,728 | ||||||
3.50%, 02/01/2033 | 1,203,333 | 1,207,259 | ||||||
5.50%, 02/01/2033 | 8,037 | 8,852 | ||||||
7.00%, 02/01/2033 | 4,543 | 5,266 | ||||||
5.50%, 03/01/2033 | 229,666 | 256,133 | ||||||
6.00%, 03/01/2033 | 19,554 | 21,660 | ||||||
6.00%, 03/01/2033 | 16,380 | 18,383 | ||||||
6.00%, 03/01/2033 | 4,733 | 5,240 | ||||||
6.00%, 03/01/2033 | 11,920 | 13,281 | ||||||
6.00%, 03/01/2033 | 5,627 | 6,228 | ||||||
5.50%, 04/01/2033 | 175,157 | 192,901 | ||||||
6.00%, 05/01/2033 | 49,700 | 56,007 | ||||||
3.50%, 06/01/2033 | 404,767 | 406,114 | ||||||
5.00%, 06/01/2033 | 44,940 | 49,127 | ||||||
7.00%, 06/01/2033 | 270,053 | 308,933 | ||||||
5.00%, 07/01/2033 | 42,546 | 46,291 |
5.00%, 07/01/2033 | 61,413 | 67,179 | ||||||
5.50%, 07/01/2033 | 45,556 | 50,197 | ||||||
2.31%, 08/01/2033 | 86,924 | 92,035 | ||||||
6.00%, 08/01/2033 | 20,754 | 23,375 | ||||||
1.79%, 09/01/2033 | 103,904 | 109,440 | ||||||
2.56%, 09/01/2033 | 41,429 | 43,887 | ||||||
5.50%, 09/01/2033 | 772,515 | 851,161 | ||||||
6.00%, 09/01/2033 | 20,916 | 23,481 | ||||||
6.00%, 09/01/2033 | 37,533 | 41,883 | ||||||
2.13%, 11/01/2033 | 84,062 | 88,217 | ||||||
4.50%, 11/01/2033 | 61,954 | 65,861 | ||||||
5.00%, 11/01/2033 | 11,003,970 | 11,979,292 | ||||||
5.00%, 11/01/2033 | 147,344 | 160,517 | ||||||
5.00%, 11/01/2033 | 17,077 | 18,589 | ||||||
5.50%, 11/01/2033 | 9,343 | 10,346 | ||||||
4.00%, 12/01/2033 | 135,723 | 140,280 | ||||||
5.50%, 12/01/2033 | 212,506 | 237,840 | ||||||
2.32%, 01/01/2034 | 27,371 | 28,861 | ||||||
5.12%, 01/01/2034 | 29,608 | 31,501 | ||||||
5.50%, 01/01/2034 | 20,443 | 22,868 | ||||||
5.50%, 03/01/2034 | 21,464 | 24,011 | ||||||
2.39%, 04/01/2034 | 56,302 | 59,966 | ||||||
5.00%, 04/01/2034 | 281,494 | 310,469 | ||||||
5.50%, 04/01/2034 | 3,235,955 | 3,583,111 | ||||||
5.00%, 05/01/2034 | 87,757 | 96,234 | ||||||
2.42%, 06/01/2034 | 132,381 | 140,199 | ||||||
2.17%, 07/01/2034 | 12,791 | 13,573 | ||||||
1.57%, 08/01/2034 | 58,112 | 60,104 | ||||||
2.27%, 08/01/2034 | 45,997 | 49,337 | ||||||
2.43%, 08/01/2034 | 41,396 | 44,269 | ||||||
2.23%, 09/01/2034 | 15,829 | 16,761 | ||||||
4.50%, 09/01/2034 | 78,365 | �� | 83,420 | |||||
5.50%, 09/01/2034 | 65,801 | 72,404 | ||||||
2.11%, 10/01/2034 | 52,232 | 55,011 | ||||||
2.51%, 10/01/2034 | 103,120 | 109,991 | ||||||
5.50%, 10/01/2034 | 61,210 | 64,127 | ||||||
2.12%, 11/01/2034 | 34,964 | 37,075 |
2.23%, 11/01/2034 | 46,553 | 49,107 | ||||||
6.00%, 11/01/2034 | 17,179 | 19,277 | ||||||
5.00%, 12/01/2034 | 90,680 | 98,677 | ||||||
1.90%, 01/01/2035 | 859,586 | 909,540 | ||||||
2.33%, 01/01/2035 | 46,965 | 50,068 | ||||||
5.00%, 01/01/2035 | 79,938 | 88,036 | ||||||
7.50%, 01/01/2035 | 119,614 | 133,179 | ||||||
1.92%, 02/01/2035 | 56,834 | 60,447 | ||||||
5.50%, 02/01/2035 | 232,490 | 255,764 | ||||||
2.36%, 03/01/2035 | 111,727 | 118,323 | ||||||
7.50%, 03/01/2035 | 131,221 | 143,667 | ||||||
2.37%, 04/01/2035 | 145,708 | 155,001 | ||||||
6.00%, 04/01/2035 | 312,404 | 350,574 | ||||||
2.12%, 05/01/2035 | 91,157 | 96,457 | ||||||
2.41%, 05/01/2035 | 16,199 | 17,049 | ||||||
5.00%, 06/01/2035 | 1,933,568 | 2,100,458 | ||||||
2.20%, 07/01/2035 | 141,434 | 150,079 | ||||||
5.00%, 07/01/2035 | 66,807 | 72,496 | ||||||
2.10%, 08/01/2035 | 18,917 | 19,934 | ||||||
2.22%, 09/01/2035 | 71,913 | 76,330 | ||||||
5.00%, 09/01/2035 | 151,783 | 167,477 | ||||||
2.59%, 10/01/2035 | 176,046 | 187,404 | ||||||
5.00%, 10/01/2035 | 1,029,270 | 1,117,121 | ||||||
5.00%, 11/01/2035 | 426,375 | 462,627 | ||||||
5.50%, 12/01/2035 | 251,079 | 268,063 | ||||||
2.14%, 01/01/2036 | 325,319 | 343,606 | ||||||
2.38%, 01/01/2036 | 145,727 | 154,926 | ||||||
3.13%, 01/01/2036 | 7,610 | 7,999 | ||||||
5.00%, 01/01/2036 | 192,786 | 209,210 | ||||||
6.50%, 01/01/2036 | 871,425 | 981,778 | ||||||
2.84%, 02/01/2036 | 56,667 | 60,144 | ||||||
5.00%, 02/01/2036 | 151,111 | 164,003 | ||||||
6.00%, 02/01/2036 | 22,278 | 24,510 | ||||||
7.00%, 02/01/2036 | 71,584 | 82,187 | ||||||
2.88%, 03/01/2036 | 1,561,447 | 1,654,887 | ||||||
7.00%, 03/01/2036 | 9,951 | 11,300 | ||||||
5.50%, 04/01/2036 | 292,585 | 321,634 |
6.50%, 04/01/2036 | 10,063 | 11,181 | ||||||
2.60%, 05/01/2036 | 65,140 | 69,172 | ||||||
5.00%, 05/01/2036 | 122,527 | 132,976 | ||||||
5.50%, 05/01/2036 | 246,882 | 271,426 | ||||||
5.50%, 05/01/2036 | 343,465 | 377,571 | ||||||
2.52%, 06/01/2036 | 76,329 | 81,096 | ||||||
2.60%, 06/01/2036 | 423,775 | 453,137 | ||||||
2.70%, 06/01/2036 | 124,229 | 132,745 | ||||||
2.52%, 07/01/2036 | 164,936 | 175,245 | ||||||
6.50%, 07/01/2036 | 39,703 | 44,349 | ||||||
2.24%, 08/01/2036 | 113,252 | 122,025 | ||||||
2.42%, 08/01/2036 | 358,263 | 385,047 | ||||||
2.63%, 08/01/2036 | 41,652 | 44,594 | ||||||
6.26%, 08/01/2036 | 168,224 | 182,664 | ||||||
6.50%, 08/01/2036 | 496,884 | 554,566 | ||||||
1.80%, 09/01/2036 | 461,119 | 489,772 | ||||||
1.98%, 09/01/2036 | 100,906 | 106,593 | ||||||
2.26%, 09/01/2036 | 107,664 | 115,600 | ||||||
2.42%, 09/01/2036 | 304,773 | 330,303 | ||||||
2.57%, 09/01/2036 | 138,810 | 147,407 | ||||||
6.00%, 09/01/2036 | 1,399,972 | 1,571,093 | ||||||
2.30%, 10/01/2036 | 187,105 | 201,516 | ||||||
2.70%, 10/01/2036 | 509,566 | 543,877 | ||||||
2.70%, 10/01/2036 | 218,496 | 232,696 | ||||||
6.50%, 10/01/2036 | 179,347 | 199,165 | ||||||
2.52%, 11/01/2036 | 132,534 | 141,915 | ||||||
2.79%, 11/01/2036 | 154,491 | 164,143 | ||||||
5.50%, 11/01/2036 | 103,551 | 113,800 | ||||||
6.00%, 11/01/2036 | 174,319 | 193,848 | ||||||
2.44%, 12/01/2036 | 469,321 | 503,148 | ||||||
2.56%, 12/01/2036 | 211,081 | 224,740 | ||||||
7.00%, 12/01/2036 | 11,366 | 12,564 | ||||||
1.83%, 01/01/2037 | 138,850 | 147,182 | ||||||
2.59%, 01/01/2037 | 87,979 | 93,474 | ||||||
6.50%, 01/01/2037 | 364,657 | 414,970 | ||||||
7.50%, 01/01/2037 | 15,880 | 17,434 | ||||||
1.82%, 02/01/2037 | 199,965 | 208,272 |
2.41%, 02/01/2037 | 214,663 | 227,996 | ||||||
6.00%, 03/01/2037 | 456,610 | 499,340 | ||||||
7.00%, 03/01/2037 | 45,919 | 51,004 | ||||||
2.58%, 04/01/2037 | 389,830 | 416,766 | ||||||
5.50%, 04/01/2037 | 520,770 | 573,699 | ||||||
6.00%, 04/01/2037 | 41,338 | 45,551 | ||||||
7.00%, 04/01/2037 | 305,912 | 341,650 | ||||||
7.00%, 04/01/2037 | 75,616 | 83,694 | ||||||
6.50%, 05/01/2037 | 57,864 | 64,380 | ||||||
7.50%, 05/01/2037 | 128,739 | 150,224 | ||||||
1.70%, 07/01/2037 | 171,856 | 177,397 | ||||||
2.44%, 07/01/2037 | 633,934 | 671,826 | ||||||
2.48%, 07/01/2037 | 28,480 | 30,195 | ||||||
2.57%, 07/01/2037 | 161,858 | 172,153 | ||||||
3.11%, 08/01/2037 | 438,964 | 465,811 | ||||||
6.00%, 08/01/2037 | 21,409 | 23,105 | ||||||
6.50%, 08/01/2037 | 71,434 | 79,541 | ||||||
6.50%, 08/01/2037 | 119,579 | 133,432 | ||||||
2.46%, 09/01/2037 | 141,207 | 150,757 | ||||||
2.75%, 09/01/2037 | 14,670 | 15,637 | ||||||
5.81%, 09/01/2037 | 93,470 | 100,809 | ||||||
5.96%, 09/01/2037 | 76,133 | 80,280 | ||||||
6.00%, 09/01/2037 | 259,427 | 288,143 | ||||||
6.17%, 09/01/2037 | 17,044 | 18,153 | ||||||
7.00%, 09/01/2037 | 181,654 | 199,957 | ||||||
6.50%, 10/01/2037 | 331,985 | 368,825 | ||||||
7.50%, 10/01/2037 | 634,092 | 709,287 | ||||||
7.50%, 10/01/2037 | 19,675 | 22,475 | ||||||
2.17%, 11/01/2037 | 410,434 | 435,206 | ||||||
2.27%, 11/01/2037 | 134,187 | 142,649 | ||||||
7.50%, 11/01/2037 | 231,080 | 252,874 | ||||||
8.00%, 11/01/2037 | 67,626 | 77,568 | ||||||
2.37%, 12/01/2037 | 661,771 | 703,635 | ||||||
2.63%, 01/01/2038 | 138,763 | 147,625 | ||||||
5.50%, 01/01/2038 | 592,056 | 651,499 | ||||||
7.00%, 01/01/2038 | 30,949 | 34,207 | ||||||
8.00%, 01/01/2038 | 11,458 | 13,423 |
6.00%, 04/01/2038 | 103,521 | 114,653 | ||||||
5.50%, 05/01/2038 | 139,568 | 149,077 | ||||||
6.00%, 05/01/2038 | 1,173,836 | 1,299,564 | ||||||
7.00%, 09/01/2038 | 139,944 | 163,460 | ||||||
6.50%, 10/01/2038 | 1,485,029 | 1,658,839 | ||||||
6.50%, 10/01/2038 | 387,623 | 430,396 | ||||||
7.00%, 10/01/2038 | 285,223 | 323,040 | ||||||
6.00%, 11/01/2038 | 177,919 | 199,899 | ||||||
7.00%, 11/01/2038 | 232,240 | 250,578 | ||||||
7.50%, 11/01/2038 | 144,723 | 162,120 | ||||||
7.00%, 12/01/2038 | 668,757 | 741,514 | ||||||
7.00%, 01/01/2039 | 872,739 | 973,980 | ||||||
7.50%, 04/01/2039 | 453,282 | 532,386 | ||||||
5.50%, 06/01/2039 | 85,676 | 91,595 | ||||||
5.00%, 09/01/2039 | 509,565 | 555,457 | ||||||
5.50%, 09/01/2039 | 213,509 | 234,922 | ||||||
4.50%, 11/01/2039 | 89,650 | 94,979 | ||||||
5.50%, 12/01/2039 | 237,502 | 261,199 | ||||||
4.00%, 07/01/2040 | 14,321,252 | 14,744,229 | ||||||
4.00%, 08/01/2040 | 561,650 | 578,443 | ||||||
5.00%, 08/01/2040 | 2,326,128 | 2,535,467 | ||||||
5.00%, 08/01/2040 | 1,126,960 | 1,234,477 | ||||||
4.00%, 09/01/2040 | 4,000,000 | 4,119,810 | ||||||
6.00%, 10/01/2040 | 7,648,430 | 8,466,080 | ||||||
3.50%, 12/01/2040 | 273,252 | 271,744 | ||||||
4.00%, 12/01/2040 | 584,860 | 602,385 | ||||||
4.00%, 01/01/2041 | 1,376,752 | 1,418,067 | ||||||
3.50%, 02/01/2041 | 22,714,300 | 22,589,837 | ||||||
4.00%, 02/01/2041 | 178,945 | 184,259 | ||||||
4.00%, 02/01/2041 | 2,856,275 | 2,941,924 | ||||||
4.00%, 09/01/2041 | 895,053 | 922,018 | ||||||
4.00%, 10/01/2041 | 2,549,646 | 2,626,170 | ||||||
3.50%, 11/01/2041 | 947,721 | 942,433 | ||||||
4.00%, 12/01/2041 | 3,876,555 | 3,993,601 | ||||||
4.00%, 03/01/2042 | 431,373 | 439,464 | ||||||
3.50%, 04/01/2042 | 69,790 | 69,403 | ||||||
3.00%, 05/01/2042 | 1,111,314 | 1,056,322 |
3.50%, 06/01/2042 | 21,481 | 21,361 | ||||||
4.00%, 07/01/2042 | 1,668,847 | 1,702,575 | ||||||
4.00%, 07/01/2042 | 854,054 | 871,127 | ||||||
4.00%, 07/01/2042 | 742,538 | 757,438 | ||||||
4.00%, 07/01/2042 | 987,280 | 1,007,266 | ||||||
3.50%, 09/01/2042 | 1,896,764 | 1,861,430 | ||||||
3.50%, 10/01/2042 | 22,581 | 22,455 | ||||||
3.50%, 10/01/2042 | 955,938 | 950,582 | ||||||
3.00%, 11/01/2042 | 3,075,087 | 2,922,545 | ||||||
3.50%, 11/01/2042 | 14,899,292 | 14,815,789 | ||||||
3.50%, 11/01/2042 | 22,916 | 22,794 | ||||||
3.00%, 12/01/2042 | 2,344,768 | 2,228,350 | ||||||
3.00%, 01/01/2043 | 2,974,885 | 2,827,325 | ||||||
3.00%, 01/01/2043 | 2,692,654 | 2,520,871 | ||||||
3.50%, 01/01/2043 | 2,669,580 | 2,654,636 | ||||||
3.50%, 01/01/2043 | 1,450,722 | 1,423,715 | ||||||
3.50%, 01/01/2043 | 29,363 | 29,208 | ||||||
3.00%, 02/01/2043 | 1,510,487 | 1,413,995 | ||||||
3.50%, 02/01/2043 | 159,227 | 158,336 | ||||||
3.50%, 02/01/2043 | 155,775 | 154,904 | ||||||
3.50%, 03/01/2043 | 1,004,054 | 985,364 | ||||||
3.00%, 04/01/2043 | 4,477,117 | 4,255,231 | ||||||
3.50%, 04/01/2043 | 4,000,004 | 3,978,886 | ||||||
3.50%, 05/01/2043 | 1,420,506 | 1,394,000 | ||||||
3.50%, 05/01/2043 | 200,000 | 199,010 | ||||||
3.50%, 05/01/2043 | 3,627,939 | 3,560,358 | ||||||
3.00%, 06/01/2043 | 499,951 | 475,188 | ||||||
3.00%, 06/01/2043 | 499,950 | 475,250 | ||||||
3.50%, 06/01/2043 | 374,128 | 372,057 | ||||||
3.50%, 06/01/2043 | 3,251,246 | 3,191,142 | ||||||
3.00%, 07/01/2043 | 5,999,995 | 5,703,035 | ||||||
3.50%, 07/01/2043 | 999,786 | 994,209 | ||||||
3.50%, 08/01/2043 | 49,617 | 49,341 | ||||||
3.50%, 11/01/2043 | 4,005,280 | 3,982,924 | ||||||
4.00%, 11/01/2043 | 14,925,211 | 15,374,368 | ||||||
3.50%, 12/01/2043 | 1,200,215 | 1,193,502 | ||||||
3.50%, 12/01/2043 | 11,500,000 | 11,435,811 |
3.50%, 12/01/2043 | 121,879 | 121,199 | ||||||
3.50%, 12/01/2043 | 4,326,499 | 4,302,350 | ||||||
3.50%, 12/01/2043 | 10,705,709 | 10,645,952 | ||||||
3.50%, 12/01/2043 | 1,962,512 | 1,951,558 | ||||||
4.00%, 12/01/2043 | 27,236,184 | 28,055,799 | ||||||
4.00%, 12/01/2043 | 5,450,356 | 5,622,760 | ||||||
6.00%, 11/01/2048 | 146,475 | 157,555 | ||||||
Fannie Mae REMIC Trust 2003-W1 | ||||||||
5.96%, 12/25/2042 | 219,084 | 245,169 | ||||||
6.72%, 12/25/2042 | 53,710 | 61,951 | ||||||
Fannie Mae REMIC Trust 2003-W4 | ||||||||
6.41%, 10/25/2042 | 40,824 | 42,509 | ||||||
Fannie Mae REMIC Trust 2004-W10 | ||||||||
5.75%, 08/25/2034 | 702,000 | 701,406 | ||||||
Fannie Mae REMIC Trust 2004-W11 | ||||||||
6.00%, 05/25/2044 | 169,804 | 197,124 | ||||||
Fannie Mae REMIC Trust 2004-W6 | ||||||||
5.50%, 07/25/2034 | 53,978 | 55,020 | ||||||
5.50%, 07/25/2034 | 186,058 | 190,800 | ||||||
Fannie Mae REMIC Trust 2005-W1 | ||||||||
6.50%, 10/25/2044 | 326,556 | 381,503 | ||||||
Fannie Mae REMIC Trust 2006-W3 | ||||||||
6.00%, 09/25/2046 | 385,466 | 436,379 | ||||||
Fannie Mae REMIC Trust 2007-W1 | ||||||||
6.30%, 08/25/2047 | 57,773 | 65,086 | ||||||
Fannie Mae REMIC Trust 2007-W3 | ||||||||
6.75%, 04/25/2037 | 186,056 | 196,229 | ||||||
Fannie Mae REMIC Trust 2007-W5 | ||||||||
0.00%, 06/25/2037 | 135,124 | 111,787 | ||||||
Fannie Mae REMIC Trust 2007-W7 | ||||||||
38.19%, 07/25/2037 | 126,734 | 252,362 | ||||||
Fannie Mae REMIC Trust 2009-W1 | ||||||||
6.00%, 12/25/2049 | 2,019,778 | 2,300,337 | ||||||
Fannie Mae REMICS | ||||||||
4.50%, 01/25/2014 | 18 | 18 | ||||||
4.00%, 10/25/2014 | 971,052 | 23,420 | ||||||
6.50%, 11/25/2015 | 16,577 | 17,216 |
6.00%, 03/25/2016 | 3,936 | 3,964 | ||||||
6.00%, 04/25/2016 | 2,638 | 2,655 | ||||||
0.64%, 10/25/2016 | 1,083,627 | 12,625 | ||||||
6.00%, 12/25/2016 | 184,700 | 194,395 | ||||||
6.00%, 12/25/2016 | 52,802 | 55,411 | ||||||
6.00%, 12/25/2016 | 868 | 913 | ||||||
6.00%, 12/25/2016 | 33,042 | 34,792 | ||||||
6.00%, 02/25/2017 | 48,843 | 51,533 | ||||||
6.00%, 02/25/2017 | 118,047 | 123,808 | ||||||
0.66%, 03/25/2017 | 3,010 | 3,013 | ||||||
6.00%, 03/25/2017 | 20,889 | 21,927 | ||||||
6.00%, 03/25/2017 | 59,920 | 62,748 | ||||||
5.50%, 04/25/2017 | 1,386 | 1,389 | ||||||
6.00%, 04/25/2017 | 112,872 | 118,929 | ||||||
6.00%, 04/25/2017 | 19,470 | 20,416 | ||||||
6.00%, 04/25/2017 | 87,030 | 92,172 | ||||||
18.92%, 05/25/2017 | 44,894 | 54,283 | ||||||
6.00%, 06/25/2017 | 238,609 | 250,026 | ||||||
5.50%, 09/25/2017 | 105,317 | 111,203 | ||||||
5.00%, 10/25/2017 | 21,497 | 22,739 | ||||||
5.00%, 05/25/2018 | 64,974 | 68,725 | ||||||
4.75%, 09/25/2018 | 307,357 | 326,642 | ||||||
4.00%, 04/25/2019 | 68,303 | 71,870 | ||||||
8.00%, 07/25/2019 | 17,248 | 18,974 | ||||||
8.00%, 10/25/2019 | 4,522 | 5,021 | ||||||
4.00%, 11/25/2019 | 79,593 | 83,834 | ||||||
8.50%, 11/25/2019 | 2,500 | 2,820 | ||||||
9.00%, 11/25/2019 | 2,066 | 2,334 | ||||||
9.40%, 11/25/2019 | 1,928 | 2,183 | ||||||
7.50%, 12/25/2019 | 4,824 | 5,326 | ||||||
8.50%, 01/25/2020 | 497 | 561 | ||||||
8.80%, 01/25/2020 | 1,233 | 1,396 | ||||||
7.00%, 05/25/2020 | 767 | 850 | ||||||
5.50%, 06/25/2020 | 617 | 669 | ||||||
9.50%, 06/25/2020 | 1,079 | 1,230 | ||||||
7.00%, 07/25/2020 | 5,447 | 6,040 | ||||||
5.50%, 08/25/2020 | 689 | 708 |
6.50%, 08/25/2020 | 5,860 | 6,357 | ||||||
505.00%, 08/25/2020 | 12 | 115 | ||||||
1118.04%, 08/25/2020 | 13 | 272 | ||||||
6.50%, 09/25/2020 | 2,950 | 3,198 | ||||||
7.00%, 09/25/2020 | 990 | 1,102 | ||||||
9.00%, 10/25/2020 | 4,214 | 4,797 | ||||||
21.35%, 11/25/2020 | 662 | 1,002 | ||||||
652.15%, 12/25/2020 | 34 | 440 | ||||||
7.00%, 01/25/2021 | 1,416 | 1,580 | ||||||
908.50%, 02/25/2021 | 2 | 39 | ||||||
5.00%, 03/25/2021 | 1,266 | 1,334 | ||||||
7.00%, 03/25/2021 | 46,924 | 52,119 | ||||||
5.00%, 05/25/2021 | 224,292 | 235,248 | ||||||
17.39%, 05/25/2021 | 1,145 | 1,491 | ||||||
8.50%, 06/25/2021 | 1,113 | 1,289 | ||||||
8.75%, 06/25/2021 | 5,076 | 5,861 | ||||||
1063.94%, 06/25/2021 | 60 | 999 | ||||||
6.50%, 07/25/2021 | 2,148 | 2,351 | ||||||
6.50%, 09/25/2021 | 280,098 | 312,960 | ||||||
14.94%, 09/25/2021 | 3,563 | 4,465 | ||||||
8.75%, 10/25/2021 | 8,516 | 9,637 | ||||||
23.19%, 12/25/2021 | 1,552 | 2,234 | ||||||
6.00%, 02/25/2022 | 264,532 | 293,504 | ||||||
6.50%, 02/25/2022 | 37,547 | 41,531 | ||||||
0.00%, 03/25/2022 | 103,315 | 98,559 | ||||||
7.50%, 06/25/2022 | 190 | 216 | ||||||
7.00%, 07/25/2022 | 3,535 | 3,956 | ||||||
7.50%, 07/25/2022 | 39,324 | 43,906 | ||||||
8.00%, 07/25/2022 | 76,309 | 83,572 | ||||||
8.00%, 07/25/2022 | 38,239 | 43,505 | ||||||
1184.78%, 07/25/2022 | 14 | 341 | ||||||
6.00%, 08/25/2022 | 33,627 | 35,468 | ||||||
6.00%, 08/25/2022 | 6,940 | 7,546 | ||||||
6.50%, 08/25/2022 | 8,757 | 9,608 | ||||||
0.19%, 09/25/2022 | 3,595 | 3,566 | ||||||
5.50%, 09/25/2022 | 6,123 | 6,649 | ||||||
6.00%, 09/25/2022 | 307,696 | 340,651 |
7.50%, 09/25/2022 | 42,631 | 47,645 | ||||||
7.75%, 09/25/2022 | 16,222 | 18,461 | ||||||
8.00%, 09/25/2022 | 47,660 | 54,248 | ||||||
0.00%, 10/25/2022 | 4,484 | 4,157 | ||||||
1.48%, 10/25/2022 | 3,461 | 3,483 | ||||||
7.00%, 10/25/2022 | 6,824 | 7,938 | ||||||
7.50%, 10/25/2022 | 23,048 | 26,016 | ||||||
7.90%, 01/25/2023 | 23,999 | 27,369 | ||||||
6.50%, 02/25/2023 | 8,999 | 10,254 | ||||||
7.00%, 02/25/2023 | 96,626 | 109,224 | ||||||
15.50%, 02/25/2023 | 4,206 | 5,663 | ||||||
5.50%, 03/25/2023 | 516,000 | 565,762 | ||||||
6.50%, 03/25/2023 | 6,753 | 7,609 | ||||||
7.00%, 03/25/2023 | 62,768 | 70,804 | ||||||
7.50%, 03/25/2023 | 25,845 | 29,285 | ||||||
7.70%, 03/25/2023 | 10,757 | 12,272 | ||||||
0.00%, 04/25/2023 | 2,879 | 2,790 | ||||||
5.50%, 04/25/2023 | 826,000 | 913,065 | ||||||
5.50%, 04/25/2023 | 28,213 | 30,693 | ||||||
6.00%, 04/25/2023 | 16,174 | 18,141 | ||||||
7.00%, 04/25/2023 | 22,808 | 25,765 | ||||||
16.65%, 04/25/2023 | 18,398 | 6,010 | ||||||
18.71%, 04/25/2023 | 10,943 | 15,670 | ||||||
5.50%, 05/25/2023 | 202,000 | 222,957 | ||||||
7.00%, 05/25/2023 | 249,793 | 281,790 | ||||||
5.00%, 06/25/2023 | 291,691 | 311,010 | ||||||
6.34%, 06/25/2023 | 191,283 | 21,159 | ||||||
7.49%, 06/25/2023 | 219,648 | 20,525 | ||||||
4.50%, 07/25/2023 | 287,000 | 310,404 | ||||||
5.00%, 07/25/2023 | 390,000 | 430,179 | ||||||
6.50%, 07/25/2023 | 5,879 | 6,468 | ||||||
6.79%, 07/25/2023 | 121,009 | 135,341 | ||||||
7.00%, 07/25/2023 | 78,511 | 89,158 | ||||||
7.00%, 07/25/2023 | 119,609 | 133,195 | ||||||
1.04%, 08/25/2023 | 14,682 | 14,842 | ||||||
6.88%, 08/25/2023 | 105,010 | 118,442 | ||||||
7.00%, 08/25/2023 | 196,332 | 220,908 |
7.76%, 08/25/2023 | 95,359 | 15,153 | ||||||
7.89%, 08/25/2023 | 23,017 | 2,747 | ||||||
0.00%, 09/25/2023 | 3,654 | 3,394 | ||||||
0.00%, 09/25/2023 | 8,879 | 8,200 | ||||||
0.81%, 09/25/2023 | 284,124 | 285,788 | ||||||
6.50%, 09/25/2023 | 9,842 | 10,877 | ||||||
12.50%, 09/25/2023 | 6,791 | 7,698 | ||||||
13.20%, 09/25/2023 | 5,471 | 6,957 | ||||||
0.71%, 10/25/2023 | 8,203 | 8,216 | ||||||
6.50%, 10/25/2023 | 71,300 | 80,819 | ||||||
6.50%, 10/25/2023 | 166,039 | 183,512 | ||||||
10.50%, 10/25/2023 | 3,116 | 3,679 | ||||||
22.92%, 10/25/2023 | 8,686 | 13,293 | ||||||
26.32%, 10/25/2023 | 4,674 | 7,531 | ||||||
0.00%, 11/25/2023 | 1,043 | 965 | ||||||
6.50%, 11/25/2023 | 38,608 | 44,269 | ||||||
0.76%, 12/25/2023 | 4,063 | 4,085 | ||||||
1.16%, 12/25/2023 | 12,968 | 13,170 | ||||||
6.50%, 12/25/2023 | 13,832 | 15,650 | ||||||
7.00%, 12/25/2023 | 30,940 | 31,915 | ||||||
12.17%, 12/25/2023 | 6,034 | 7,787 | ||||||
23.92%, 12/25/2023 | 12,968 | 20,490 | ||||||
27.54%, 12/25/2023 | 15,940 | 26,346 | ||||||
5.00%, 02/25/2024 | 312,815 | 30,875 | ||||||
5.00%, 03/25/2024 | 152,960 | 13,258 | ||||||
5.00%, 03/25/2024 | 360,996 | 28,437 | ||||||
6.50%, 03/25/2024 | 50,527 | 56,021 | ||||||
6.50%, 03/25/2024 | 249,647 | 275,660 | ||||||
7.00%, 04/25/2024 | 181,479 | 205,710 | ||||||
7.00%, 04/25/2024 | 409,669 | 464,118 | ||||||
5.50%, 07/25/2024 | 56,518 | 62,377 | ||||||
5.50%, 08/25/2024 | 483,132 | 529,209 | ||||||
5.00%, 11/25/2024 | 791,120 | 870,497 | ||||||
8.50%, 01/25/2025 | 9,136 | 10,717 | ||||||
8.80%, 01/25/2025 | 12,282 | 14,214 | ||||||
0.46%, 07/25/2025 | 197,506 | 198,263 | ||||||
5.50%, 08/25/2025 | 449,825 | 497,134 |
5.50%, 01/25/2026 | 301,098 | 332,384 | ||||||
32.43%, 10/25/2026 | 61,247 | 106,414 | ||||||
7.00%, 11/25/2026 | 87,174 | 98,271 | ||||||
1.84%, 03/25/2027 | 74,127 | 3,337 | ||||||
1.84%, 03/25/2027 | 23,175 | 1,050 | ||||||
7.50%, 04/18/2027 | 14,537 | 16,114 | ||||||
7.50%, 04/20/2027 | 20,704 | 24,223 | ||||||
6.50%, 04/25/2027 | 51,991 | 57,985 | ||||||
7.50%, 05/20/2027 | 78,052 | 91,303 | ||||||
0.56%, 05/25/2027 | 7,712,615 | 7,728,372 | ||||||
6.50%, 07/18/2027 | 5,171 | 5,728 | ||||||
7.00%, 12/18/2027 | 23,388 | 4,795 | ||||||
6.00%, 07/18/2028 | 40,358 | 44,074 | ||||||
7.44%, 07/25/2028 | 1,008,784 | 151,128 | ||||||
3.00%, 12/25/2028 | 1,237,521 | 1,103,739 | ||||||
6.00%, 12/25/2028 | 17,666 | 19,206 | ||||||
7.99%, 12/25/2028 | 33,181 | 5,625 | ||||||
5.00%, 03/25/2029 | 826,000 | 906,543 | ||||||
5.50%, 03/25/2029 | 21,939 | 22,064 | ||||||
5.50%, 04/18/2029 | 94,505 | 103,000 | ||||||
6.35%, 04/25/2029 | 17,764 | 19,942 | ||||||
7.50%, 12/18/2029 | 24,553 | 28,283 | ||||||
7.50%, 02/25/2030 | 133,194 | 153,396 | ||||||
8.94%, 07/25/2030 | 44,953 | 9,928 | ||||||
8.50%, 01/25/2031 | 5,682 | 1,368 | ||||||
7.00%, 03/25/2031 | 15,816 | 18,171 | ||||||
3.50%, 04/25/2031 | 1,084,000 | 1,065,620 | ||||||
6.00%, 07/25/2031 | 93,384 | 20,226 | ||||||
7.00%, 07/25/2031 | 52,824 | 60,330 | ||||||
7.00%, 08/25/2031 | 100,142 | 114,985 | ||||||
6.50%, 09/25/2031 | 25,095 | 27,944 | ||||||
7.00%, 09/25/2031 | 118,192 | 135,759 | ||||||
7.00%, 09/25/2031 | 18,540 | 21,295 | ||||||
7.00%, 09/25/2031 | 28,820 | 32,622 | ||||||
13.87%, 09/25/2031 | 88,636 | 100,161 | ||||||
23.92%, 09/25/2031 | 68,671 | 115,954 | ||||||
6.50%, 10/25/2031 | 14,012 | 15,797 |
22.46%, 10/25/2031 | 50,393 | 84,261 | ||||||
6.00%, 11/25/2031 | 189,960 | 212,082 | ||||||
7.00%, 11/25/2031 | 170,248 | 192,757 | ||||||
15.19%, 11/25/2031 | 49,373 | 66,555 | ||||||
17.08%, 12/25/2031 | 7,866 | 10,849 | ||||||
0.00%, 01/25/2032 | 7,475 | 6,773 | ||||||
24.65%, 02/25/2032 | 28,705 | 48,722 | ||||||
1.60%, 03/25/2032 | 175,113 | 8,148 | ||||||
10.00%, 03/25/2032 | 2,741 | 3,191 | ||||||
0.00%, 04/25/2032 | 5,470 | 4,896 | ||||||
6.00%, 04/25/2032 | 433,931 | 481,711 | ||||||
6.50%, 04/25/2032 | 80,552 | 87,608 | ||||||
6.50%, 05/25/2032 | 163,859 | 184,579 | ||||||
6.50%, 06/25/2032 | 62,396 | 69,522 | ||||||
6.50%, 07/25/2032 | 332,009 | 59,352 | ||||||
6.50%, 08/25/2032 | 184,464 | 207,790 | ||||||
19.35%, 08/25/2032 | 207,549 | 268,441 | ||||||
0.96%, 11/25/2032 | 788,091 | 795,958 | ||||||
5.00%, 11/25/2032 | 40,669 | 44,375 | ||||||
6.00%, 11/25/2032 | 1,261,892 | 1,398,338 | ||||||
8.50%, 11/25/2032 | 51,455 | 56,296 | ||||||
0.00%, 12/25/2032 | 38,457 | 34,547 | ||||||
5.50%, 12/25/2032 | 529,658 | 575,190 | ||||||
14.18%, 12/25/2032 | 31,572 | 40,046 | ||||||
0.00%, 01/25/2033 | 137,518 | 135,434 | ||||||
6.50%, 02/25/2033 | 59,412 | 65,369 | ||||||
5.00%, 03/25/2033 | 87,277 | 14,032 | ||||||
6.00%, 03/25/2033 | 66,000 | 73,489 | ||||||
4.00%, 04/25/2033 | 470,000 | 489,281 | ||||||
0.00%, 05/25/2033 | 22,016 | 18,220 | ||||||
4.00%, 05/25/2033 | 48,815 | 51,738 | ||||||
5.50%, 05/25/2033 | 11,550 | 255 | ||||||
6.00%, 05/25/2033 | 124,000 | 138,196 | ||||||
6.00%, 05/25/2033 | 233,000 | 259,303 | ||||||
6.00%, 05/25/2033 | 29,575 | 5,652 | ||||||
6.00%, 05/25/2033 | 128,841 | 142,805 | ||||||
6.50%, 05/25/2033 | 291,229 | 67,373 |
7.00%, 05/25/2033 | 433,099 | 111,377 | ||||||
5.75%, 06/25/2033 | 190,639 | 208,169 | ||||||
6.94%, 06/25/2033 | 251,016 | 39,763 | ||||||
13.87%, 06/25/2033 | 186,721 | 229,231 | ||||||
5.50%, 07/25/2033 | 412,384 | 427,965 | ||||||
13.32%, 07/25/2033 | 74,470 | 86,873 | ||||||
13.87%, 07/25/2033 | 81,240 | 97,435 | ||||||
0.00%, 08/25/2033 | 25,022 | 23,930 | ||||||
5.50%, 08/25/2033 | 724,680 | 135,531 | ||||||
5.50%, 08/25/2033 | 371,125 | 404,688 | ||||||
5.50%, 08/25/2033 | 166,823 | 180,446 | ||||||
7.24%, 08/25/2033 | 144,466 | 141,843 | ||||||
9.87%, 08/25/2033 | 14,637 | 15,405 | ||||||
17.66%, 08/25/2033 | 125,172 | 169,096 | ||||||
3.50%, 09/25/2033 | 1,500,000 | 1,355,437 | ||||||
12.23%, 09/25/2033 | 59,034 | 70,494 | ||||||
3.00%, 10/25/2033 | 908,000 | 790,675 | ||||||
5.50%, 10/25/2033 | 2,172,675 | 2,351,984 | ||||||
7.44%, 11/25/2033 | 367,203 | 65,222 | ||||||
0.00%, 12/25/2033 | 287,332 | 259,093 | ||||||
13.77%, 12/25/2033 | 113,980 | 136,373 | ||||||
0.91%, 01/25/2034 | 453,996 | 459,150 | ||||||
11.27%, 01/25/2034 | 33,141 | 38,583 | ||||||
12.92%, 01/25/2034 | 21,794 | 23,786 | ||||||
15.87%, 01/25/2034 | 50,965 | 66,248 | ||||||
5.50%, 02/25/2034 | 160,398 | 171,800 | ||||||
27.94%, 02/25/2034 | 159,348 | 231,342 | ||||||
0.00%, 03/25/2034 | 408,790 | 387,372 | ||||||
0.56%, 03/25/2034 | 374,937 | 375,357 | ||||||
5.50%, 04/25/2034 | 457,442 | 493,275 | ||||||
6.00%, 04/25/2034 | 51,689 | 54,582 | ||||||
19.07%, 04/25/2034 | 236,689 | 326,887 | ||||||
0.56%, 05/25/2034 | 705,141 | 702,891 | ||||||
16.05%, 05/25/2034 | 54,835 | 69,094 | ||||||
19.07%, 05/25/2034 | 301,483 | 416,206 | ||||||
23.34%, 05/25/2034 | 68,376 | 103,970 | ||||||
5.50%, 07/25/2034 | 1,042,536 | 1,122,033 |
13.91%, 07/25/2034 | 51,936 | 65,112 | ||||||
0.41%, 08/25/2034 | 329,288 | 328,574 | ||||||
5.50%, 08/25/2034 | 1,401,535 | 1,483,186 | ||||||
19.35%, 11/25/2034 | 72,980 | 99,193 | ||||||
0.00%, 12/25/2034 | 1,310 | 1,309 | ||||||
6.00%, 12/25/2034 | 310,390 | 317,046 | ||||||
21.24%, 12/25/2034 | 14,781 | 18,515 | ||||||
6.00%, 01/25/2035 | 152,071 | 155,221 | ||||||
24.51%, 01/25/2035 | 63,813 | 89,376 | ||||||
0.00%, 04/25/2035 | 314,058 | 305,284 | ||||||
0.51%, 04/25/2035 | 321,203 | 321,688 | ||||||
16.59%, 05/25/2035 | 46,758 | 59,543 | ||||||
19.57%, 05/25/2035 | 437,442 | 606,564 | ||||||
19.68%, 05/25/2035 | 300,725 | 418,016 | ||||||
24.15%, 05/25/2035 | 100,418 | 153,737 | ||||||
5.00%, 06/25/2035 | 143,873 | 155,250 | ||||||
6.50%, 06/25/2035 | 11,385 | 12,227 | ||||||
24.68%, 06/25/2035 | 103,000 | 162,167 | ||||||
6.55%, 07/25/2035 | 246,927 | 45,693 | ||||||
16.96%, 07/25/2035 | 80,025 | 106,089 | ||||||
5.50%, 08/25/2035 | 377,951 | 412,421 | ||||||
5.50%, 08/25/2035 | 1,118,730 | 1,263,379 | ||||||
16.29%, 08/25/2035 | 118,276 | 151,528 | ||||||
16.46%, 08/25/2035 | 232,859 | 299,598 | ||||||
0.00%, 09/25/2035 | 70,973 | 69,425 | ||||||
23.54%, 09/25/2035 | 55,104 | 81,887 | ||||||
0.00%, 10/25/2035 | 83,153 | 74,955 | ||||||
5.75%, 10/25/2035 | 421,148 | 459,308 | ||||||
16.46%, 10/25/2035 | 148,831 | 190,457 | ||||||
5.50%, 11/25/2035 | 258,320 | 267,860 | ||||||
23.96%, 11/25/2035 | 784,034 | 1,212,348 | ||||||
5.50%, 12/25/2035 | 584,000 | 639,434 | ||||||
5.50%, 12/25/2035 | 191,024 | 210,790 | ||||||
6.00%, 12/25/2035 | 92,076 | 101,900 | ||||||
0.00%, 01/25/2036 | 68,349 | 66,599 | ||||||
0.00%, 01/25/2036 | 7,091 | 7,089 | ||||||
5.50%, 01/25/2036 | 163,940 | 178,232 |
0.00%, 03/25/2036 | 509,418 | 463,494 | ||||||
0.00%, 03/25/2036 | 61,366 | 56,367 | ||||||
5.50%, 03/25/2036 | 515,358 | 563,258 | ||||||
5.50%, 03/25/2036 | 793,105 | 858,735 | ||||||
5.50%, 03/25/2036 | 793,105 | 854,478 | ||||||
6.54%, 03/25/2036 | 1,867,867 | 347,972 | ||||||
23.96%, 03/25/2036 | 51,290 | 78,547 | ||||||
0.00%, 04/25/2036 | 108,545 | 102,751 | ||||||
0.00%, 04/25/2036 | 169,842 | 154,875 | ||||||
0.00%, 04/25/2036 | 273,384 | 264,198 | ||||||
0.41%, 04/25/2036 | 237,564 | 236,837 | ||||||
29.41%, 05/25/2036 | 60,054 | 107,429 | ||||||
0.00%, 06/25/2036 | 183,287 | 171,550 | ||||||
0.00%, 06/25/2036 | 58,884 | 53,423 | ||||||
0.00%, 06/25/2036 | 387,629 | 350,296 | ||||||
0.00%, 06/25/2036 | 475,754 | 431,384 | ||||||
0.00%, 06/25/2036 | 115,507 | 105,039 | ||||||
0.56%, 06/25/2036 | 140,634 | 140,726 | ||||||
0.56%, 06/25/2036 | 597,969 | 599,749 | ||||||
0.61%, 06/25/2036 | 83,193 | 83,610 | ||||||
6.00%, 06/25/2036 | 12,083 | 835 | ||||||
6.42%, 06/25/2036 | 476,637 | 77,824 | ||||||
23.60%, 06/25/2036 | 22,458 | 34,468 | ||||||
0.41%, 06/27/2036 | 3,609,331 | 3,551,545 | ||||||
0.00%, 07/25/2036 | 72,091 | 66,835 | ||||||
0.00%, 07/25/2036 | 133,230 | 121,075 | ||||||
0.00%, 07/25/2036 | 156,167 | 152,997 | ||||||
0.00%, 07/25/2036 | 42,389 | 39,587 | ||||||
0.45%, 07/25/2036 | 997,808 | 996,967 | ||||||
0.51%, 07/25/2036 | 354,281 | 355,035 | ||||||
0.62%, 07/25/2036 | 116,381 | 116,926 | ||||||
6.00%, 07/25/2036 | 1,734,619 | 1,922,052 | ||||||
6.36%, 07/25/2036 | 238,624 | 34,745 | ||||||
6.50%, 07/25/2036 | 1,169,178 | 1,297,854 | ||||||
6.50%, 07/25/2036 | 882,122 | 987,790 | ||||||
28.14%, 07/25/2036 | 59,869 | 102,965 | ||||||
38.91%, 07/25/2036 | 55,591 | 108,232 |
0.00%, 08/25/2036 | 61,015 | 56,763 | ||||||
0.00%, 08/25/2036 | 101,087 | 91,761 | ||||||
0.00%, 08/25/2036 | 239,937 | 215,070 | ||||||
0.00%, 08/25/2036 | 113,858 | 104,524 | ||||||
0.51%, 08/25/2036 | 426,475 | 426,789 | ||||||
0.51%, 08/25/2036 | 27,811 | 27,812 | ||||||
6.34%, 08/25/2036 | 94,726 | 17,363 | ||||||
6.50%, 08/25/2036 | 620,190 | 694,999 | ||||||
6.50%, 08/25/2036 | 195,345 | 213,509 | ||||||
0.00%, 09/25/2036 | 120,229 | 107,161 | ||||||
0.00%, 09/25/2036 | 101,961 | 98,138 | ||||||
0.00%, 09/25/2036 | 126,893 | 119,934 | ||||||
6.50%, 09/25/2036 | 124,889 | 139,905 | ||||||
4.50%, 10/25/2036 | 413,000 | 441,748 | ||||||
25.54%, 10/25/2036 | 87,622 | 136,011 | ||||||
0.00%, 11/25/2036 | 238,863 | 216,590 | ||||||
0.00%, 11/25/2036 | 85,331 | 78,561 | ||||||
0.00%, 11/25/2036 | 31,857 | 29,374 | ||||||
0.00%, 12/25/2036 | 103,743 | 95,035 | ||||||
0.00%, 12/25/2036 | 69,286 | 63,857 | ||||||
0.22%, 12/25/2036 | 279,687 | 272,354 | ||||||
0.23%, 12/25/2036 | 1,058,941 | 1,031,615 | ||||||
6.00%, 12/25/2036 | 218,841 | 231,642 | ||||||
6.49%, 12/25/2036 | 523,115 | 84,323 | ||||||
25.90%, 12/25/2036 | 29,326 | 45,551 | ||||||
0.00%, 01/25/2037 | 95,845 | 88,057 | ||||||
0.00%, 01/25/2037 | 345,068 | 317,531 | ||||||
5.50%, 01/25/2037 | 134,000 | 147,678 | ||||||
0.36%, 02/25/2037 | 4,517 | 4,502 | ||||||
0.41%, 02/25/2037 | 448,043 | 447,222 | ||||||
38.01%, 02/25/2037 | 12,260 | 21,094 | ||||||
0.00%, 03/25/2037 | 106,742 | 98,275 | ||||||
0.66%, 03/25/2037 | 278,377 | 279,022 | ||||||
0.91%, 03/25/2037 | 485,753 | 484,897 | ||||||
5.00%, 03/25/2037 | 34,775 | 37,640 | ||||||
5.92%, 03/25/2037 | 69,653 | 10,398 | ||||||
6.00%, 03/25/2037 | 310,088 | 334,844 |
6.28%, 03/25/2037 | 998,383 | 137,206 | ||||||
0.00%, 04/25/2037 | 273,045 | 250,876 | ||||||
5.94%, 04/25/2037 | 602,280 | 89,302 | ||||||
22.12%, 04/25/2037 | 213,743 | 308,288 | ||||||
0.00%, 05/25/2037 | 94,739 | 92,867 | ||||||
0.46%, 05/25/2037 | 209,402 | 209,082 | ||||||
6.00%, 05/25/2037 | 1,135,000 | 1,258,759 | ||||||
0.56%, 06/25/2037 | 1,240,209 | 1,242,090 | ||||||
0.61%, 06/25/2037 | 96,349 | 92,274 | ||||||
5.62%, 06/25/2037 | 223,565 | 31,240 | ||||||
5.94%, 06/25/2037 | 217,831 | 32,578 | ||||||
5.94%, 06/25/2037 | 889,581 | 131,064 | ||||||
6.50%, 06/25/2037 | 134,095 | 149,457 | ||||||
0.00%, 07/25/2037 | 262,417 | 237,873 | ||||||
0.53%, 07/25/2037 | 214,109 | 214,082 | ||||||
0.66%, 07/25/2037 | 147,846 | 148,515 | ||||||
5.50%, 07/25/2037 | 442,861 | 476,682 | ||||||
6.24%, 07/25/2037 | 1,645,630 | 220,067 | ||||||
6.46%, 07/25/2037 | 992,003 | 131,401 | ||||||
6.99%, 07/25/2037 | 2,191,738 | 344,284 | ||||||
16.09%, 07/25/2037 | 138,653 | 171,964 | ||||||
0.61%, 08/25/2037 | 903,747 | 906,725 | ||||||
5.50%, 08/25/2037 | 365,085 | 394,942 | ||||||
6.00%, 08/25/2037 | 475,000 | 516,845 | ||||||
6.00%, 08/25/2037 | 103,330 | 110,538 | ||||||
6.00%, 08/25/2037 | 413,000 | 455,659 | ||||||
6.00%, 08/25/2037 | 427,704 | 461,688 | ||||||
23.41%, 08/25/2037 | 193,658 | 290,405 | ||||||
0.61%, 09/25/2037 | 1,162,886 | 1,164,274 | ||||||
6.38%, 09/25/2037 | 659,005 | 91,641 | ||||||
15.74%, 09/25/2037 | 61,530 | 75,670 | ||||||
0.00%, 10/25/2037 | 1,781,270 | 1,604,012 | ||||||
6.03%, 10/25/2037 | 293,071 | 324,970 | ||||||
6.29%, 10/25/2037 | 782,900 | 106,733 | ||||||
6.30%, 10/25/2037 | 657,088 | 92,710 | ||||||
0.36%, 10/27/2037 | 4,541,000 | 4,506,139 | ||||||
8.34%, 11/25/2037 | 578,279 | 688,997 |
6.20%, 12/25/2037 | 88,711 | 11,761 | ||||||
6.24%, 12/25/2037 | 966,355 | 114,675 | ||||||
6.29%, 12/25/2037 | 660,421 | 93,157 | ||||||
6.50%, 12/25/2037 | 638,000 | 715,925 | ||||||
1.51%, 01/25/2038 | 1,329,713 | 103,687 | ||||||
5.75%, 02/25/2038 | 890,437 | 105,418 | ||||||
5.84%, 02/25/2038 | 1,304,144 | 153,000 | ||||||
1.06%, 03/25/2038 | 241,015 | 243,785 | ||||||
6.04%, 03/25/2038 | 312,815 | 45,533 | ||||||
6.07%, 03/25/2038 | 269,449 | 40,833 | ||||||
6.83%, 03/25/2038 | 378,826 | 61,509 | ||||||
13.67%, 03/25/2038 | 102,790 | 124,499 | ||||||
5.50%, 04/25/2038 | 3,332,969 | 3,591,224 | ||||||
6.50%, 04/25/2038 | 203,856 | 229,801 | ||||||
6.69%, 04/25/2038 | 360,628 | 58,196 | ||||||
6.74%, 04/25/2038 | 347,133 | 55,403 | ||||||
20.21%, 04/25/2038 | 125,742 | 176,532 | ||||||
0.00%, 05/25/2038 | 12,446 | 11,400 | ||||||
5.50%, 05/25/2038 | 3,130,463 | 3,401,899 | ||||||
1.73%, 06/25/2038 | 479,554 | 44,156 | ||||||
5.00%, 07/25/2038 | 155,000 | 169,409 | ||||||
5.00%, 07/25/2038 | 198,045 | 214,616 | ||||||
5.50%, 07/25/2038 | 1,189,172 | 1,287,939 | ||||||
7.04%, 07/25/2038 | 225,865 | 36,982 | ||||||
5.69%, 09/25/2038 | 818,533 | 102,579 | ||||||
5.69%, 09/25/2038 | 394,564 | 53,792 | ||||||
4.50%, 11/25/2038 | 173,108 | 181,257 | ||||||
0.56%, 12/25/2038 | 493,196 | 493,709 | ||||||
4.00%, 02/25/2039 | 891,265 | 908,150 | ||||||
4.50%, 02/25/2039 | 54,517 | 57,741 | ||||||
6.39%, 02/25/2039 | 531,776 | 85,740 | ||||||
6.49%, 03/25/2039 | 479,047 | 75,566 | ||||||
0.61%, 04/25/2039 | 844,171 | 845,681 | ||||||
5.00%, 07/25/2039 | 336,605 | 66,404 | ||||||
7.00%, 07/25/2039 | 31,951 | 34,832 | ||||||
5.00%, 08/25/2039 | 1,032,000 | 1,110,398 | ||||||
6.00%, 08/25/2039 | 1,428,778 | 1,606,053 |
5.00%, 09/25/2039 | 1,459,000 | 1,518,552 | ||||||
6.02%, 09/25/2039 | 528,185 | 581,288 | ||||||
5.50%, 10/25/2039 | 952,260 | 165,053 | ||||||
5.74%, 10/25/2039 | 490,784 | 60,897 | ||||||
2.53%, 12/25/2039 | 930,778 | 941,688 | ||||||
6.02%, 12/25/2039 | 558,314 | 67,903 | ||||||
6.30%, 12/25/2039 | 692,571 | 770,141 | ||||||
0.00%, 01/25/2040 | 168,380 | 152,258 | ||||||
6.09%, 01/25/2040 | 673,266 | 88,529 | ||||||
6.19%, 02/25/2040 | 196,478 | 214,206 | ||||||
0.76%, 03/25/2040 | 498,807 | 500,958 | ||||||
6.24%, 03/25/2040 | 512,866 | 594,512 | ||||||
6.43%, 03/25/2040 | 551,854 | 621,366 | ||||||
12.33%, 03/25/2040 | 1,137,092 | 1,332,710 | ||||||
0.76%, 04/25/2040 | 429,043 | 431,095 | ||||||
6.26%, 04/25/2040 | 615,915 | 88,940 | ||||||
17.12%, 04/25/2040 | 310,000 | 438,718 | ||||||
0.76%, 05/25/2040 | 359,154 | 362,399 | ||||||
6.24%, 05/25/2040 | 422,007 | 63,686 | ||||||
0.00%, 06/25/2040 | 292,389 | 265,893 | ||||||
5.00%, 06/25/2040 | 3,020,307 | 3,294,615 | ||||||
5.50%, 06/25/2040 | 1,007,000 | 1,100,353 | ||||||
5.50%, 07/25/2040 | 1,308,360 | 1,437,202 | ||||||
5.00%, 09/25/2040 | 206,000 | 222,065 | ||||||
5.50%, 10/25/2040 | 2,012,000 | 2,184,183 | ||||||
4.28%, 11/25/2040 | 2,797,078 | 270,002 | ||||||
0.71%, 01/25/2041 | 791,590 | 795,548 | ||||||
6.37%, 01/25/2041 | 1,738,554 | 347,800 | ||||||
0.56%, 02/25/2041 | 1,554,705 | 1,554,115 | ||||||
0.46%, 03/25/2041 | 910,176 | 903,230 | ||||||
2.65%, 04/25/2041 | 3,916,990 | 276,178 | ||||||
0.66%, 07/25/2041 | 244,691 | 245,780 | ||||||
0.46%, 08/25/2041 | 2,840,114 | 2,805,203 | ||||||
0.71%, 08/25/2041 | 739,472 | 742,824 | ||||||
0.66%, 11/25/2041 | 855,181 | 859,053 | ||||||
7.00%, 11/25/2041 | 4,744,554 | 5,451,232 | ||||||
7.00%, 11/25/2041 | 3,727,558 | 4,275,938 |
7.00%, 11/25/2041 | 5,107,082 | 5,885,820 | ||||||
3.50%, 03/25/2042 | 1,000,000 | 894,854 | ||||||
6.50%, 06/25/2042 | 114,402 | 131,535 | ||||||
0.66%, 09/25/2042 | 481,465 | 479,243 | ||||||
0.66%, 09/25/2042 | 1,388,494 | 1,385,376 | ||||||
0.66%, 10/25/2042 | 1,541,439 | 1,537,850 | ||||||
0.66%, 10/25/2042 | 3,576,346 | 3,570,563 | ||||||
3.00%, 02/25/2043 | 1,000,000 | 831,963 | ||||||
3.50%, 02/25/2043 | 879,124 | 881,760 | ||||||
0.00%, 09/25/2043 | 2,289,385 | 1,703,438 | ||||||
0.00%, 10/25/2043 | 1,773,062 | 1,262,287 | ||||||
5.94%, 11/25/2049 | 421,377 | 60,548 | ||||||
5.83%, 02/25/2051 | 506,679 | 539,401 | ||||||
5.41%, 07/25/2051 | 141,739 | 143,276 | ||||||
Fannie Mae Trust 2003-W2 | ||||||||
5.90%, 07/25/2042 | 112,144 | 123,701 | ||||||
6.50%, 07/25/2042 | 188,791 | 212,902 | ||||||
Fannie Mae Trust 2003-W6 | ||||||||
5.20%, 09/25/2042 | 788,952 | 831,303 | ||||||
6.50%, 09/25/2042 | 324,661 | 363,354 | ||||||
Fannie Mae Trust 2003-W8 | ||||||||
0.56%, 05/25/2042 | 76,179 | 75,331 | ||||||
7.00%, 10/25/2042 | 396,123 | 453,158 | ||||||
Fannie Mae Trust 2004-W1 | ||||||||
7.00%, 12/25/2033 | 532,421 | 605,185 | ||||||
5.04%, 11/25/2043 | 681,810 | 707,207 | ||||||
Fannie Mae Trust 2004-W15 | ||||||||
0.41%, 08/25/2044 | 488,373 | 483,565 | ||||||
Fannie Mae Trust 2004-W2 | ||||||||
7.00%, 02/25/2044 | 160,498 | 186,021 | ||||||
Fannie Mae Trust 2004-W8 | ||||||||
7.50%, 06/25/2044 | 160,258 | 186,429 | ||||||
Fannie Mae Trust 2005-W3 | ||||||||
0.38%, 03/25/2045 | 3,464,638 | 3,458,496 | ||||||
Fannie Mae Trust 2005-W4 | ||||||||
6.00%, 08/25/2035 | 203,697 | 227,613 |
Fannie Mae Trust 2006-W2 | ||||||||
2.21%, 11/25/2035 | 404,679 | 382,448 | ||||||
0.38%, 02/25/2036 | 1,681,416 | 1,663,575 | ||||||
Fannie Mae Whole Loan | ||||||||
0.42%, 11/25/2046 | 3,455,206 | 3,446,229 | ||||||
Fannie Mae-Aces | ||||||||
0.69%, 08/25/2019 | 2,481,083 | 2,484,735 | ||||||
4.45%, 09/25/2019 | 2,219,000 | 2,441,424 | ||||||
1.52%, 12/25/2019 | 782,000 | 779,417 | ||||||
1.80%, 12/25/2019 | 743,000 | 729,044 | ||||||
4.33%, 03/25/2020 | 826,000 | 900,691 | ||||||
3.66%, 11/25/2020 | 694,417 | 731,279 | ||||||
3.65%, 04/25/2021 | 894,000 | 937,241 | ||||||
3.76%, 04/25/2021 | 6,037,000 | 6,286,787 | ||||||
3.73%, 06/25/2021 | 3,323,000 | 3,466,078 | ||||||
3.76%, 06/25/2021 | 1,032,000 | 1,070,511 | ||||||
2.92%, 08/25/2021 | 706,000 | 696,335 | ||||||
2.28%, 12/27/2022 | 1,357,000 | 1,238,680 | ||||||
2.39%, 01/25/2023 | 1,342,000 | 1,233,854 | ||||||
FDIC Guaranteed Notes Trust 2010-C1 | ||||||||
2.98%, 12/06/2020 (Acquired 10/28/2013, Cost $1,926,335) (a) | 1,865,333 | 1,922,748 | ||||||
FHLMC Multifamily Structured Pass Through Certificates | ||||||||
2.87%, 12/25/2021 | 5,500,000 | 5,379,495 | ||||||
2.79%, 01/25/2022 | 4,400,000 | 4,270,376 | ||||||
2.27%, 03/25/2022 | 7,100,000 | 6,598,037 | ||||||
2.37%, 05/25/2022 | 6,905,000 | 6,442,303 | ||||||
2.40%, 06/25/2022 | 5,300,000 | 4,943,220 | ||||||
3.46%, 08/25/2023 | 10,000,000 | 9,937,300 | ||||||
FHLMC Structured Pass Through Securities | ||||||||
6.61%, 07/25/2032 | 108,088 | 122,017 | ||||||
5.85%, 07/25/2033 | 316,636 | 357,819 | ||||||
3.28%, 10/25/2037 | 2,730,377 | 2,675,612 | ||||||
7.50%, 02/25/2042 | 446,602 | 521,170 | ||||||
7.50%, 08/25/2042 | 66,930 | 79,529 | ||||||
6.50%, 02/25/2043 | 414,276 | 482,630 | ||||||
7.00%, 02/25/2043 | 143,303 | 163,953 | ||||||
5.23%, 05/25/2043 | 993,578 | 1,067,519 | ||||||
0.00%, 07/25/2043 | 41,237 | 35,821 |
7.50%, 07/25/2043 | 107,120 | 127,146 | ||||||
0.00%, 09/25/2043 | 50,799 | 40,624 | ||||||
7.50%, 09/25/2043 | 565,354 | 658,200 | ||||||
0.00%, 10/25/2043 | 55,181 | 44,300 | ||||||
7.00%, 10/25/2043 | 553,482 | 622,977 | ||||||
1.34%, 10/25/2044 | 822,043 | 833,041 | ||||||
FHLMC-GNMA | ||||||||
7.00%, 03/25/2023 | 34,538 | 38,771 | ||||||
6.25%, 11/25/2023 | 21,488 | 23,847 | ||||||
7.50%, 04/25/2024 | 157,862 | 180,489 | ||||||
First Boston Mortgage Securities Corp 1987 STRIPs | ||||||||
0.00%, 04/25/2017 | 1,051 | 1,040 | ||||||
10.97%, 04/25/2017 | 1,876 | 165 | ||||||
First Horizon Alternative Mortgage Securities Trust 2005-FA7 | ||||||||
5.00%, 09/25/2020 | 32,793 | 33,562 | ||||||
First Horizon Alternative Mortgage Securities Trust 2005-FA8 | ||||||||
5.50%, 11/25/2035 | 277,095 | 242,418 | ||||||
First Horizon Alternative Mortgage Securities Trust 2006-FA6 | ||||||||
5.75%, 11/25/2021 | 108,749 | 107,894 | ||||||
First Horizon Alternative Mortgage Securities Trust 2006-FA8 | ||||||||
5.75%, 02/25/2037 | 175,591 | 155,803 | ||||||
First Horizon Alternative Mortgage Securities Trust 2007-FA4 | ||||||||
5.49%, 08/25/2037 | 1,975,977 | 362,981 | ||||||
First Horizon Mortgage Pass-Through Trust 2003-7 | ||||||||
4.50%, 09/25/2018 | 7,394 | 7,583 | ||||||
First Horizon Mortgage Pass-Through Trust 2003-8 | ||||||||
4.50%, 09/25/2018 | 64,303 | 65,759 | ||||||
First Horizon Mortgage Pass-Through Trust 2003-9 | ||||||||
5.50%, 11/25/2033 | 256,810 | 266,229 | ||||||
First Horizon Mortgage Pass-Through Trust 2004-AR2 | ||||||||
2.63%, 05/25/2034 | 156,426 | 154,412 | ||||||
First Horizon Mortgage Pass-Through Trust 2004-AR7 | ||||||||
2.56%, 02/25/2035 | 65,767 | 66,042 | ||||||
First Horizon Mortgage Pass-Through Trust 2005-AR1 | ||||||||
2.65%, 04/25/2035 | 476,535 | 476,679 | ||||||
Fontainebleau Miami Beach Trust | ||||||||
2.89%, 05/05/2027 (Acquired 10/28/2013, Cost $2,130,268) (a) | 2,106,000 | 2,126,416 |
Freddie Mac | ||||||||
3.50%, 01/15/2026 | 3,000,000 | 3,127,500 | ||||||
3.00%, 01/15/2029 | 3,000,000 | 3,055,547 | ||||||
5.00%, 01/15/2040 | 13,000,000 | 14,019,687 | ||||||
4.00%, 01/15/2041 | 7,000,000 | 7,188,672 | ||||||
4.50%, 01/15/2041 | 20,000,000 | 21,161,718 | ||||||
Freddie Mac Gold Pool | ||||||||
6.50%, 07/01/2014 | 80 | 80 | ||||||
7.50%, 10/01/2014 | 11 | 11 | ||||||
8.50%, 11/01/2015 | 230 | 231 | ||||||
6.50%, 07/01/2016 | 11,248 | 11,625 | ||||||
6.50%, 08/01/2016 | 4,304 | 4,484 | ||||||
6.00%, 04/01/2017 | 447,265 | 471,337 | ||||||
6.00%, 04/01/2017 | 217,861 | 229,348 | ||||||
7.00%, 04/01/2017 | 1,607 | 1,679 | ||||||
6.50%, 05/01/2017 | 3,951 | 4,142 | ||||||
5.50%, 06/01/2017 | 7,262 | 7,717 | ||||||
5.00%, 10/01/2017 | 64,699 | 68,498 | ||||||
6.00%, 10/01/2017 | 6,297 | 6,399 | ||||||
6.50%, 11/01/2017 | 3,269 | 3,450 | ||||||
5.00%, 12/01/2017 | 226,920 | 240,232 | ||||||
5.00%, 12/01/2017 | 219,958 | 232,856 | ||||||
6.50%, 12/01/2017 | 6,480 | 6,850 | ||||||
5.50%, 01/01/2018 | 54,076 | 57,699 | ||||||
5.50%, 02/01/2018 | 57,110 | 60,903 | ||||||
5.50%, 04/01/2018 | 565,966 | 595,740 | ||||||
6.00%, 04/01/2018 | 15,049 | 15,983 | ||||||
6.50%, 04/01/2018 | 74,321 | 77,995 | ||||||
4.00%, 06/01/2018 | 8,419 | 8,902 | ||||||
4.50%, 08/01/2018 | 19,541 | 20,716 | ||||||
4.50%, 10/01/2018 | 13,654 | 14,475 | ||||||
4.50%, 10/01/2018 | 92,021 | 97,528 | ||||||
5.00%, 12/01/2018 | 29,303 | 31,035 | ||||||
5.50%, 01/01/2019 | 91,786 | 97,963 | ||||||
6.50%, 09/01/2019 | 64,493 | 68,058 | ||||||
5.50%, 12/01/2019 | 98,512 | 105,102 | ||||||
6.00%, 02/01/2020 | 22,627 | 23,752 |
5.50%, 04/01/2020 | 86,494 | 93,589 | ||||||
5.50%, 06/01/2020 | 70,351 | 75,071 | ||||||
6.00%, 06/01/2020 | 50,717 | 54,318 | ||||||
8.00%, 07/01/2020 | 268 | 270 | ||||||
6.00%, 08/01/2020 | 31,786 | 33,797 | ||||||
6.00%, 07/01/2021 | 150,575 | 160,744 | ||||||
6.00%, 07/01/2021 | 110,129 | 115,696 | ||||||
6.00%, 01/01/2022 | 48,728 | 50,924 | ||||||
6.00%, 02/01/2022 | 36,693 | 38,411 | ||||||
6.00%, 03/01/2022 | 120,306 | 126,896 | ||||||
6.50%, 03/01/2022 | 18,352 | 19,889 | ||||||
5.50%, 11/01/2022 | 13,890 | 15,155 | ||||||
6.50%, 11/01/2022 | 57,331 | 63,835 | ||||||
6.00%, 12/01/2022 | 19,708 | 21,765 | ||||||
5.50%, 01/01/2023 | 130,825 | 142,726 | ||||||
5.50%, 05/01/2023 | 71,237 | 77,775 | ||||||
5.00%, 06/01/2023 | 14,050 | 15,146 | ||||||
5.50%, 07/01/2023 | 15,915 | 17,377 | ||||||
5.50%, 11/01/2023 | 38,844 | 42,408 | ||||||
5.50%, 01/01/2024 | 2,207,052 | 2,395,475 | ||||||
5.50%, 02/01/2024 | 54,883 | 59,693 | ||||||
8.00%, 08/01/2024 | 1,531 | 1,809 | ||||||
8.00%, 11/01/2024 | 1,331 | 1,502 | ||||||
7.50%, 08/01/2025 | 2,574 | 3,032 | ||||||
3.50%, 11/01/2025 | 1,106,817 | 1,154,614 | ||||||
10.00%, 03/17/2026 | 113,396 | 128,289 | ||||||
7.00%, 04/01/2026 | 3,094 | 3,478 | ||||||
6.50%, 01/01/2028 | 104,668 | 116,475 | ||||||
2.50%, 04/01/2028 | 707,057 | 701,376 | ||||||
8.50%, 07/01/2028 | 8,461 | 9,969 | ||||||
7.00%, 12/01/2028 | 129,577 | 146,204 | ||||||
6.50%, 06/01/2029 | 45,384 | 50,845 | ||||||
7.00%, 07/01/2029 | 1,836 | 2,058 | ||||||
6.50%, 08/01/2029 | 165,379 | 188,211 | ||||||
6.00%, 10/01/2029 | 42,537 | 47,646 | ||||||
10.00%, 10/01/2030 | 582,351 | 678,076 | ||||||
7.00%, 01/01/2031 | 121,790 | 141,019 |
3.50%, 01/01/2032 | 1,460,175 | 1,488,177 | ||||||
7.50%, 01/01/2032 | 251,241 | 294,543 | ||||||
3.50%, 03/01/2032 | 586,742 | 597,997 | ||||||
7.00%, 07/01/2032 | 8,050 | 9,069 | ||||||
7.00%, 08/01/2032 | 14,319 | 16,579 | ||||||
5.50%, 01/01/2033 | 511,088 | 562,579 | ||||||
3.50%, 02/01/2033 | 381,984 | 383,902 | ||||||
6.00%, 02/01/2033 | 324,038 | 355,676 | ||||||
3.50%, 05/01/2033 | 470,951 | 473,319 | ||||||
3.50%, 05/01/2033 | 1,622,556 | 1,630,733 | ||||||
5.50%, 10/01/2033 | 103,514 | 114,006 | ||||||
6.00%, 12/01/2033 | 18,190 | 20,194 | ||||||
5.00%, 01/01/2034 | 96,426 | 104,398 | ||||||
6.00%, 01/01/2034 | 107,623 | 118,199 | ||||||
6.00%, 01/01/2034 | 69,461 | 78,264 | ||||||
5.00%, 06/01/2034 | 462,540 | 500,837 | ||||||
5.00%, 09/01/2034 | 165,783 | 180,829 | ||||||
6.50%, 11/01/2034 | 40,316 | 44,800 | ||||||
6.50%, 01/01/2035 | 289,943 | 325,339 | ||||||
5.00%, 03/01/2035 | 119,954 | 129,944 | ||||||
5.50%, 07/01/2035 | 228,362 | 251,781 | ||||||
6.50%, 12/01/2035 | 173,501 | 195,882 | ||||||
6.50%, 12/01/2035 | 131,895 | 146,798 | ||||||
5.50%, 01/01/2036 | 94,038 | 102,679 | ||||||
5.00%, 11/01/2036 | 277,677 | 299,889 | ||||||
6.00%, 11/01/2036 | 91,449 | 98,327 | ||||||
6.50%, 11/01/2036 | 77,048 | 86,902 | ||||||
6.50%, 11/01/2036 | 894,243 | 989,585 | ||||||
6.50%, 11/01/2036 | 331,257 | 368,687 | ||||||
5.50%, 12/01/2036 | 147,747 | 161,100 | ||||||
6.00%, 12/01/2036 | 44,879 | 49,561 | ||||||
6.00%, 12/01/2036 | 70,547 | 78,126 | ||||||
6.50%, 12/01/2036 | 250,730 | 279,217 | ||||||
6.50%, 12/01/2036 | 945,036 | 1,052,409 | ||||||
7.50%, 12/01/2036 | 910,162 | 1,026,127 | ||||||
6.50%, 01/01/2037 | 56,249 | 62,605 | ||||||
6.50%, 01/01/2037 | 34,424 | 36,648 |
6.50%, 02/01/2037 | 61,755 | 68,424 | ||||||
7.00%, 02/01/2037 | 29,753 | 33,670 | ||||||
6.50%, 06/01/2037 | 52,739 | 58,698 | ||||||
6.50%, 11/01/2037 | 129,066 | 144,100 | ||||||
7.50%, 01/01/2038 | 226,503 | 247,554 | ||||||
7.50%, 01/01/2038 | 142,727 | 159,503 | ||||||
5.00%, 03/01/2038 | 686,229 | 739,080 | ||||||
6.50%, 03/01/2038 | 192,961 | 216,725 | ||||||
5.50%, 05/01/2038 | 320,075 | 348,841 | ||||||
5.50%, 08/01/2038 | 391,023 | 426,165 | ||||||
7.50%, 09/01/2038 | 98,097 | 108,720 | ||||||
4.50%, 11/01/2039 | 485,375 | 514,057 | ||||||
4.50%, 11/01/2039 | 3,565,343 | 3,775,363 | ||||||
5.00%, 03/01/2040 | 9,894,689 | 10,669,474 | ||||||
5.50%, 03/01/2040 | 84,646 | 92,254 | ||||||
5.50%, 05/01/2040 | 8,669,705 | 9,449,549 | ||||||
5.00%, 08/01/2040 | 4,654,851 | 5,037,699 | ||||||
5.00%, 08/01/2040 | 1,297,097 | 1,404,370 | ||||||
5.50%, 08/01/2040 | 3,864,579 | 4,211,905 | ||||||
4.50%, 09/01/2040 | 1,158,611 | 1,227,588 | ||||||
4.50%, 09/01/2040 | 4,692,324 | 4,972,051 | ||||||
4.50%, 03/01/2041 | 860,633 | 911,357 | ||||||
4.50%, 05/01/2041 | 5,575,770 | 5,908,051 | ||||||
3.50%, 06/01/2042 | 1,057,927 | 1,050,888 | ||||||
3.50%, 06/01/2042 | 5,440,990 | 5,345,787 | ||||||
4.00%, 06/01/2042 | 4,573,865 | 4,662,041 | ||||||
3.50%, 07/01/2042 | 23,745,170 | 23,587,181 | ||||||
3.00%, 08/01/2042 | 3,810,120 | 3,614,282 | ||||||
3.50%, 09/01/2042 | 6,988,437 | 6,941,939 | ||||||
3.00%, 10/01/2042 | 9,244,771 | 8,769,223 | ||||||
4.00%, 10/01/2042 | 320,052 | 326,203 | ||||||
3.50%, 11/01/2042 | 259,454 | 254,901 | ||||||
4.00%, 01/01/2043 | 507,346 | 517,133 | ||||||
3.00%, 02/01/2043 | 771,415 | 731,734 | ||||||
3.00%, 03/01/2043 | 9,964,936 | 9,452,344 | ||||||
3.00%, 03/01/2043 | 4,900,042 | 4,647,986 | ||||||
3.50%, 03/01/2043 | 1,990,993 | 1,977,746 |
3.00%, 04/01/2043 | 193,842 | 183,870 | ||||||
3.50%, 05/01/2043 | 507,551 | 498,613 | ||||||
3.00%, 06/01/2043 | 70,103 | 66,497 | ||||||
3.00%, 06/01/2043 | 20,746,084 | 19,678,913 | ||||||
3.50%, 06/01/2043 | 1,766,415 | 1,735,440 | ||||||
3.00%, 07/01/2043 | 675,967 | 641,196 | ||||||
3.00%, 07/01/2043 | 51,307 | 48,668 | ||||||
3.00%, 08/01/2043 | 984,400 | 933,763 | ||||||
3.00%, 09/01/2043 | 924,553 | 876,994 | ||||||
4.00%, 09/01/2043 | 371,600 | 382,418 | ||||||
3.50%, 10/01/2043 | 5,431,941 | 5,395,800 | ||||||
3.00%, 11/01/2043 | 99,826 | 94,691 | ||||||
4.00%, 11/01/2043 | 240,002 | 246,723 | ||||||
4.00%, 11/01/2043 | 682,843 | 701,969 | ||||||
4.00%, 12/01/2043 | 6,000,000 | 6,168,055 | ||||||
4.00%, 12/01/2043 | 705,556 | 725,318 | ||||||
7.00%, 08/01/2047 | 23,027 | 24,780 | ||||||
Freddie Mac Non Gold Pool | ||||||||
12.00%, 08/01/2015 | 364 | 368 | ||||||
2.09%, 07/01/2019 | 5,368 | 5,678 | ||||||
12.00%, 07/01/2019 | 205 | 208 | ||||||
2.25%, 07/01/2026 | 5,625 | 5,663 | ||||||
2.26%, 01/01/2027 | 13,747 | 14,662 | ||||||
2.32%, 04/01/2030 | 5,718 | 6,112 | ||||||
2.50%, 09/01/2032 | 10,552 | 11,239 | ||||||
2.41%, 05/01/2033 | 365,622 | 387,422 | ||||||
2.36%, 12/01/2033 | 63,451 | 67,571 | ||||||
2.55%, 04/01/2034 | 120,923 | 128,302 | ||||||
2.50%, 09/01/2034 | 275,899 | 296,250 | ||||||
2.45%, 01/01/2035 | 130,432 | 136,856 | ||||||
5.05%, 01/01/2035 | 436,098 | 464,814 | ||||||
2.46%, 08/01/2035 | 50,633 | 53,966 | ||||||
2.51%, 12/01/2035 | 193,480 | 206,852 | ||||||
2.46%, 02/01/2036 | 63,674 | 67,624 | ||||||
4.01%, 02/01/2036 | 307,906 | 328,951 | ||||||
2.92%, 03/01/2036 | 321,917 | 342,628 | ||||||
3.21%, 03/01/2036 | 493,439 | 529,780 |
2.37%, 05/01/2036 | 322,869 | 344,850 | ||||||
2.38%, 05/01/2036 | 171,261 | 181,631 | ||||||
3.09%, 05/01/2036 | 74,449 | 78,950 | ||||||
2.71%, 06/01/2036 | 811,556 | 867,174 | ||||||
2.77%, 06/01/2036 | 195,507 | 210,244 | ||||||
2.09%, 07/01/2036 | 123,717 | 130,748 | ||||||
2.38%, 07/01/2036 | 105,398 | 112,018 | ||||||
4.76%, 07/01/2036 | 153,000 | 164,458 | ||||||
2.00%, 08/01/2036 | 66,322 | 70,464 | ||||||
2.09%, 08/01/2036 | 165,706 | 175,703 | ||||||
2.11%, 08/01/2036 | 901,992 | 954,742 | ||||||
2.52%, 09/01/2036 | 289,863 | 305,505 | ||||||
2.65%, 09/01/2036 | 348,260 | 372,689 | ||||||
2.10%, 10/01/2036 | 493,610 | 522,942 | ||||||
2.12%, 10/01/2036 | 280,774 | 297,757 | ||||||
2.19%, 10/01/2036 | 168,399 | 179,542 | ||||||
2.22%, 10/01/2036 | 144,317 | 152,974 | ||||||
2.41%, 10/01/2036 | 49,392 | 51,691 | ||||||
2.48%, 10/01/2036 | 222,815 | 237,694 | ||||||
2.79%, 10/01/2036 | 218,426 | 232,852 | ||||||
2.27%, 11/01/2036 | 252,265 | 268,313 | ||||||
2.32%, 11/01/2036 | 60,914 | 64,583 | ||||||
2.37%, 11/01/2036 | 141,553 | 150,347 | ||||||
2.38%, 11/01/2036 | 396,719 | 422,333 | ||||||
2.42%, 11/01/2036 | 111,565 | 116,509 | ||||||
2.22%, 12/01/2036 | 676,060 | 715,913 | ||||||
2.32%, 12/01/2036 | 20,089 | 21,099 | ||||||
2.35%, 12/01/2036 | 714,263 | 766,663 | ||||||
2.68%, 12/01/2036 | 333,308 | 353,871 | ||||||
2.86%, 12/01/2036 | 35,085 | 37,357 | ||||||
2.04%, 01/01/2037 | 54,885 | 57,802 | ||||||
2.77%, 01/01/2037 | 155,529 | 163,820 | ||||||
2.49%, 02/01/2037 | 431,754 | 459,609 | ||||||
2.71%, 02/01/2037 | 19,318 | 20,434 | ||||||
2.78%, 02/01/2037 | 253,912 | 268,985 | ||||||
3.06%, 02/01/2037 | 48,257 | 51,098 | ||||||
5.05%, 02/01/2037 | 26,901 | 28,173 |
2.32%, 03/01/2037 | 678,927 | 727,825 | ||||||
2.99%, 03/01/2037 | 122,971 | 129,665 | ||||||
3.08%, 03/01/2037 | 65,048 | 68,770 | ||||||
1.93%, 04/01/2037 | 70,209 | 74,660 | ||||||
2.92%, 04/01/2037 | 167,057 | 177,389 | ||||||
3.97%, 04/01/2037 | 13,514 | 14,303 | ||||||
1.96%, 05/01/2037 | 197,443 | 207,699 | ||||||
2.39%, 05/01/2037 | 311,006 | 333,194 | ||||||
2.39%, 05/01/2037 | 108,073 | 115,830 | ||||||
2.50%, 05/01/2037 | 62,383 | 65,717 | ||||||
2.88%, 05/01/2037 | 501,277 | 534,084 | ||||||
2.93%, 05/01/2037 | 260,550 | 277,146 | ||||||
5.58%, 06/01/2037 | 139,038 | 147,385 | ||||||
2.62%, 07/01/2037 | 117,136 | 125,029 | ||||||
6.27%, 11/01/2037 | 66,637 | 70,802 | ||||||
2.82%, 04/01/2038 | 277,914 | 297,272 | ||||||
2.70%, 05/01/2038 | 201,566 | 216,596 | ||||||
4.01%, 07/01/2040 | 342,108 | 361,427 | ||||||
Freddie Mac Reference REMIC | ||||||||
6.00%, 04/15/2036 | 1,294,373 | 1,410,559 | ||||||
6.00%, 05/15/2036 | 1,770,157 | 1,958,298 | ||||||
Freddie Mac REMICS | ||||||||
6.00%, 01/15/2014 | 483 | 483 | ||||||
6.50%, 03/15/2014 | 43 | 0 | ||||||
6.50%, 08/15/2016 | 30,828 | 32,505 | ||||||
6.00%, 09/15/2016 | 9,132 | 9,594 | ||||||
6.00%, 09/15/2016 | 85,424 | 90,178 | ||||||
6.00%, 09/15/2016 | 7,255 | 7,601 | ||||||
6.00%, 09/15/2016 | 42,445 | 44,693 | ||||||
6.00%, 09/15/2016 | 28,194 | 29,534 | ||||||
6.00%, 10/15/2016 | 22,050 | 23,162 | ||||||
5.50%, 12/15/2016 | 61,317 | 64,258 | ||||||
6.00%, 12/15/2016 | 19,356 | 20,374 | ||||||
6.00%, 03/15/2017 | 20,258 | 21,465 | ||||||
5.00%, 06/15/2017 | 77,873 | 81,026 | ||||||
5.50%, 06/15/2017 | 11,711 | 12,261 | ||||||
6.00%, 06/15/2017 | 64,023 | 67,367 |
16.37%, 08/15/2017 | 9,933 | 11,698 | ||||||
4.00%, 09/15/2017 | 21,912 | 22,211 | ||||||
5.50%, 10/15/2017 | 25,919 | 27,703 | ||||||
5.00%, 12/15/2017 | 63,542 | 67,369 | ||||||
5.50%, 12/15/2017 | 122,066 | 130,348 | ||||||
5.00%, 01/15/2018 | 81,346 | 83,958 | ||||||
0.00%, 02/15/2018 | 7,147 | 7,143 | ||||||
4.50%, 03/15/2018 | 46,773 | 1,574 | ||||||
4.50%, 05/15/2018 | 54,765 | 57,865 | ||||||
6.50%, 05/15/2018 | 10,079 | 10,856 | ||||||
4.50%, 06/15/2018 | 459,391 | 485,651 | ||||||
5.94%, 06/15/2018 | 71,710 | 6,314 | ||||||
4.50%, 07/15/2018 | 427,160 | 451,985 | ||||||
0.00%, 10/15/2018 | 5,641 | 5,631 | ||||||
0.00%, 03/15/2019 | 178,058 | 173,012 | ||||||
6.50%, 03/15/2019 | 4,625 | 552 | ||||||
4.50%, 04/15/2019 | 6,708 | 6,924 | ||||||
0.00%, 07/15/2019 | 3,990 | 3,982 | ||||||
9.50%, 07/15/2019 | 2,812 | 2,970 | ||||||
0.00%, 02/15/2020 | 668,663 | 647,601 | ||||||
5.00%, 02/15/2020 | 132,694 | 12,656 | ||||||
5.00%, 02/15/2020 | 199,220 | 19,473 | ||||||
6.50%, 03/15/2020 | 15,319 | 15,283 | ||||||
12.01%, 03/15/2020 | 67,532 | 77,434 | ||||||
9.50%, 04/15/2020 | 1,518 | 1,683 | ||||||
9.60%, 04/15/2020 | 2,362 | 2,678 | ||||||
84.00%, 05/15/2020 | 21 | 31 | ||||||
5.00%, 06/15/2020 | 516,000 | 563,848 | ||||||
10.00%, 06/15/2020 | 370 | 425 | ||||||
7.80%, 09/15/2020 | 733 | 794 | ||||||
9.00%, 10/15/2020 | 1,527 | 1,664 | ||||||
6.95%, 01/15/2021 | 4,584 | 5,056 | ||||||
8.60%, 01/15/2021 | 18 | 21 | ||||||
9.50%, 01/15/2021 | 1,340 | 1,526 | ||||||
1066.21%, 02/15/2021 | 2 | 41 | ||||||
9.00%, 04/15/2021 | 963 | 1,140 | ||||||
1.11%, 05/15/2021 | 959 | 968 |
5.00%, 05/15/2021 | 2,788 | 2,949 | ||||||
6.75%, 05/15/2021 | 2,614 | 2,842 | ||||||
7.00%, 05/15/2021 | 16,329 | 18,266 | ||||||
33.46%, 05/15/2021 | 461 | 835 | ||||||
44.51%, 05/15/2021 | 672 | 1,271 | ||||||
6.00%, 07/15/2021 | 2,478 | 2,718 | ||||||
5.50%, 08/15/2021 | 1,262 | 1,350 | ||||||
7.00%, 09/15/2021 | 5,941 | 6,595 | ||||||
8.50%, 09/15/2021 | 5,656 | 6,441 | ||||||
6.74%, 11/15/2021 | 453,421 | 486,507 | ||||||
1181.25%, 11/15/2021 | 6 | 93 | ||||||
0.00%, 12/15/2021 | 704,236 | 702,621 | ||||||
1179.20%, 01/15/2022 | 63 | 1,317 | ||||||
5.00%, 03/15/2022 | 568,000 | 628,971 | ||||||
7.00%, 03/15/2022 | 2,937 | 3,300 | ||||||
6.00%, 05/15/2022 | 2,056 | 2,222 | ||||||
7.00%, 05/15/2022 | 3,912 | 4,440 | ||||||
7.50%, 08/15/2022 | 4,022 | 4,746 | ||||||
8.00%, 08/15/2022 | 10,084 | 11,864 | ||||||
1.31%, 09/15/2022 | 6,641 | 6,620 | ||||||
5.50%, 10/15/2022 | 217,354 | 239,813 | ||||||
4.60%, 12/15/2022 | 6,925 | 7,095 | ||||||
5.50%, 12/15/2022 | 708,418 | 724,589 | ||||||
5.50%, 12/15/2022 | 74,387 | 82,290 | ||||||
5.00%, 01/15/2023 | 69,932 | 71,618 | ||||||
1.78%, 02/15/2023 | 885 | 898 | ||||||
7.50%, 02/15/2023 | 60,810 | 68,807 | ||||||
5.50%, 03/15/2023 | 146,000 | 159,004 | ||||||
1.31%, 04/15/2023 | 35,201 | 35,087 | ||||||
5.50%, 04/15/2023 | 147,000 | 160,762 | ||||||
7.00%, 04/15/2023 | 50,781 | 56,648 | ||||||
7.50%, 04/15/2023 | 10,802 | 12,244 | ||||||
5.00%, 05/15/2023 | 57,012 | 61,457 | ||||||
7.00%, 05/15/2023 | 6,204 | 6,866 | ||||||
8.84%, 05/15/2023 | 25,247 | 29,099 | ||||||
0.00%, 06/15/2023 | 12,483 | 12,457 | ||||||
0.00%, 06/15/2023 | 9,089 | 9,070 |
5.60%, 06/15/2023 | 117,941 | 127,208 | ||||||
6.39%, 06/15/2023 | 84,056 | 6,494 | ||||||
2.31%, 07/15/2023 | 22,529 | 23,438 | ||||||
8.44%, 07/15/2023 | 13,638 | 15,344 | ||||||
24.40%, 07/15/2023 | 4,732 | 7,705 | ||||||
2.28%, 08/15/2023 | 1,328 | 1,362 | ||||||
6.50%, 09/15/2023 | 154,098 | 169,703 | ||||||
7.00%, 09/15/2023 | 47,652 | 53,818 | ||||||
33.81%, 09/15/2023 | 19,943 | 37,099 | ||||||
0.00%, 10/15/2023 | 113,709 | 109,403 | ||||||
4.00%, 10/15/2023 | 774,000 | 830,724 | ||||||
6.25%, 10/15/2023 | 28,268 | 31,110 | ||||||
22.23%, 10/15/2023 | 5,255 | 9,035 | ||||||
5.00%, 11/15/2023 | 516,000 | 566,295 | ||||||
5.50%, 11/15/2023 | 188,422 | 208,114 | ||||||
6.00%, 11/15/2023 | 60,013 | 67,388 | ||||||
16.99%, 11/15/2023 | 26,045 | 29,053 | ||||||
5.00%, 12/15/2023 | 83,026 | 89,665 | ||||||
6.50%, 12/15/2023 | 103,371 | 114,394 | ||||||
6.50%, 12/15/2023 | 31,406 | 35,077 | ||||||
7.00%, 01/15/2024 | 24,142 | 27,577 | ||||||
0.00%, 02/15/2024 | 28,039 | 27,628 | ||||||
0.00%, 02/15/2024 | 5,959 | 5,026 | ||||||
7.00%, 02/15/2024 | 1,655 | 1,793 | ||||||
10.00%, 02/15/2024 | 2,165 | 2,835 | ||||||
18.88%, 02/15/2024 | 2,362 | 3,479 | ||||||
0.76%, 03/15/2024 | 4,034 | 4,055 | ||||||
2.04%, 03/15/2024 | 1,931 | 1,997 | ||||||
7.00%, 03/15/2024 | 20,365 | 23,236 | ||||||
7.00%, 03/15/2024 | 112,989 | 128,001 | ||||||
27.91%, 03/15/2024 | 13,347 | 7,999 | ||||||
7.50%, 04/15/2024 | 76,670 | 88,337 | ||||||
0.00%, 05/15/2024 | 15,080 | 14,485 | ||||||
7.71%, 05/15/2024 | 36,105 | 5,815 | ||||||
0.46%, 06/15/2024 | 206,575 | 207,218 | ||||||
6.00%, 06/15/2024 | 71,546 | 80,241 | ||||||
5.50%, 07/15/2024 | 8,877 | 266 |
7.50%, 08/15/2024 | 10,888 | 12,556 | ||||||
4.00%, 12/15/2024 | 206,000 | 211,725 | ||||||
5.00%, 12/15/2024 | 224,592 | 242,388 | ||||||
32.94%, 04/15/2025 | 60,434 | 100,706 | ||||||
4.50%, 06/15/2025 | 722,000 | 764,607 | ||||||
16.48%, 08/15/2025 | 38,468 | 49,485 | ||||||
27.32%, 10/15/2025 | 67,145 | 106,798 | ||||||
3.50%, 01/15/2026 | 2,000,000 | 1,990,022 | ||||||
5.00%, 03/15/2026 | 351,926 | 383,938 | ||||||
6.50%, 03/15/2026 | 12,018 | 13,386 | ||||||
6.50%, 07/15/2026 | 76,708 | 85,074 | ||||||
7.50%, 09/15/2026 | 9,138 | 10,560 | ||||||
8.00%, 09/15/2026 | 23,394 | 26,994 | ||||||
6.50%, 01/15/2027 | 47,885 | 53,420 | ||||||
7.50%, 01/15/2027 | 59,782 | 68,815 | ||||||
7.50%, 01/15/2027 | 18,965 | 21,919 | ||||||
0.86%, 02/15/2027 | 1,455 | 1,467 | ||||||
6.00%, 05/15/2027 | 50,971 | 57,068 | ||||||
7.25%, 07/15/2027 | 3,031 | 3,483 | ||||||
7.50%, 09/15/2027 | 20,485 | 22,718 | ||||||
5.50%, 10/15/2027 | 417,000 | 444,819 | ||||||
6.50%, 12/15/2027 | 32,149 | 36,418 | ||||||
7.00%, 03/15/2028 | 35,593 | 8,598 | ||||||
7.50%, 03/15/2028 | 102,172 | 117,733 | ||||||
7.50%, 05/15/2028 | 42,435 | 48,916 | ||||||
6.50%, 06/15/2028 | 56,789 | 63,672 | ||||||
7.00%, 06/15/2028 | 9,042 | 10,381 | ||||||
6.00%, 07/15/2028 | 29,086 | 30,893 | ||||||
6.25%, 08/15/2028 | 124,904 | 126,503 | ||||||
6.50%, 08/15/2028 | 116,676 | 131,347 | ||||||
6.00%, 09/15/2028 | 23,569 | 25,471 | ||||||
7.00%, 10/15/2028 | 44,631 | 9,313 | ||||||
6.00%, 11/15/2028 | 105,202 | 116,870 | ||||||
0.00%, 12/15/2028 | 87,677 | 87,597 | ||||||
6.00%, 12/15/2028 | 184,814 | 208,323 | ||||||
0.76%, 01/15/2029 | 49,202 | 49,532 | ||||||
6.00%, 01/15/2029 | 274,963 | 302,256 |
6.00%, 02/15/2029 | 59,233 | 65,151 | ||||||
6.25%, 02/15/2029 | 273,788 | 302,796 | ||||||
29.81%, 03/15/2029 | 7,534 | 13,871 | ||||||
7.00%, 04/15/2029 | 4,559 | 1,078 | ||||||
7.00%, 06/15/2029 | 239,779 | 275,783 | ||||||
7.50%, 06/15/2029 | 16,790 | 3,452 | ||||||
7.00%, 07/15/2029 | 95,112 | 107,619 | ||||||
7.00%, 08/15/2029 | 56,787 | 64,755 | ||||||
4.00%, 11/15/2029 | 660,928 | 83,445 | ||||||
7.50%, 11/15/2029 | 311 | 371 | ||||||
8.00%, 11/15/2029 | 49,428 | 57,881 | ||||||
7.00%, 01/15/2030 | 124,996 | 141,473 | ||||||
8.00%, 01/15/2030 | 91,809 | 106,438 | ||||||
8.00%, 01/15/2030 | 28,549 | 34,461 | ||||||
8.00%, 03/15/2030 | 27,086 | 31,826 | ||||||
5.00%, 04/15/2030 | 702,000 | 730,859 | ||||||
8.00%, 04/15/2030 | 29,881 | 35,099 | ||||||
7.50%, 05/15/2030 | 21,843 | 25,221 | ||||||
13.88%, 05/15/2030 | 12,330 | 12,563 | ||||||
7.50%, 08/15/2030 | 18,046 | 20,916 | ||||||
7.25%, 09/15/2030 | 49,989 | 57,507 | ||||||
7.00%, 10/15/2030 | 80,142 | 92,249 | ||||||
7.50%, 10/15/2030 | 6,133 | 7,109 | ||||||
7.50%, 10/15/2030 | 1,457 | 1,684 | ||||||
7.25%, 12/15/2030 | 86,280 | 99,296 | ||||||
7.00%, 03/15/2031 | 37,677 | 43,425 | ||||||
6.50%, 05/15/2031 | 24,093 | 27,143 | ||||||
7.00%, 06/15/2031 | 46,865 | 50,139 | ||||||
8.50%, 06/15/2031 | 99,829 | 119,666 | ||||||
6.00%, 07/15/2031 | 12,339 | 12,075 | ||||||
7.00%, 07/15/2031 | 100,152 | 114,526 | ||||||
6.50%, 08/15/2031 | 58,902 | 66,245 | ||||||
6.50%, 08/15/2031 | 47,175 | 53,074 | ||||||
6.50%, 08/15/2031 | 52,397 | 58,427 | ||||||
6.50%, 08/15/2031 | 523,876 | 562,828 | ||||||
6.50%, 10/15/2031 | 47,158 | 49,944 | ||||||
5.00%, 01/15/2032 | 3,002 | 6 |
6.50%, 01/15/2032 | 53,532 | 57,555 | ||||||
6.50%, 01/15/2032 | 92,742 | 99,625 | ||||||
1.06%, 02/15/2032 | 271,577 | 275,890 | ||||||
6.38%, 02/15/2032 | 63,438 | 68,559 | ||||||
6.50%, 02/15/2032 | 104,253 | 112,752 | ||||||
6.50%, 02/15/2032 | 104,967 | 112,432 | ||||||
7.84%, 02/15/2032 | 229,807 | 41,551 | ||||||
8.49%, 02/15/2032 | 42,036 | 9,244 | ||||||
15.78%, 02/15/2032 | 113,218 | 154,496 | ||||||
19.08%, 02/15/2032 | 116,539 | 173,942 | ||||||
6.50%, 03/15/2032 | 108,930 | 122,602 | ||||||
6.50%, 03/15/2032 | 143,111 | 161,400 | ||||||
7.00%, 03/15/2032 | 101,442 | 116,078 | ||||||
7.00%, 03/15/2032 | 76,034 | 87,497 | ||||||
7.79%, 03/15/2032 | 90,427 | 16,773 | ||||||
7.84%, 03/15/2032 | 58,991 | 11,021 | ||||||
6.50%, 04/15/2032 | 9,421 | 9,443 | ||||||
6.50%, 04/15/2032 | 352,663 | 395,370 | ||||||
6.50%, 04/15/2032 | 34,767 | 39,205 | ||||||
6.50%, 04/15/2032 | 185,000 | 200,770 | ||||||
7.00%, 04/15/2032 | 69,829 | 78,924 | ||||||
7.00%, 04/15/2032 | 184,162 | 205,974 | ||||||
5.50%, 05/15/2032 | 196,142 | 207,391 | ||||||
6.50%, 05/15/2032 | 128,544 | 144,761 | ||||||
7.00%, 05/15/2032 | 82,110 | 93,951 | ||||||
6.50%, 06/15/2032 | 74,401 | 83,778 | ||||||
6.50%, 06/15/2032 | 99,380 | 111,876 | ||||||
6.50%, 06/15/2032 | 144,000 | 156,103 | ||||||
6.50%, 07/15/2032 | 160,047 | 178,522 | ||||||
6.50%, 07/15/2032 | 106,309 | 119,755 | ||||||
0.00%, 09/15/2032 | 286,467 | 224,935 | ||||||
6.00%, 09/15/2032 | 212,901 | 234,178 | ||||||
0.00%, 12/15/2032 | 165,254 | 161,830 | ||||||
0.00%, 12/15/2032 | 31,892 | 30,981 | ||||||
0.00%, 12/15/2032 | 22,218 | 19,918 | ||||||
0.91%, 12/15/2032 | 139,679 | 140,100 | ||||||
6.00%, 12/15/2032 | 311,817 | 346,508 |
6.00%, 12/15/2032 | 179,303 | 199,301 | ||||||
18.22%, 12/15/2032 | 82,348 | 119,160 | ||||||
0.00%, 01/15/2033 | 461,936 | 461,024 | ||||||
6.00%, 01/15/2033 | 196,705 | 218,645 | ||||||
0.00%, 02/15/2033 | 99,015 | 98,875 | ||||||
0.00%, 02/15/2033 | 67,673 | 67,625 | ||||||
0.00%, 02/15/2033 | 116,043 | 115,982 | ||||||
0.00%, 02/15/2033 | 131,760 | 131,576 | ||||||
6.00%, 02/15/2033 | 152,227 | 165,128 | ||||||
6.00%, 02/15/2033 | 707,612 | 786,111 | ||||||
5.50%, 03/15/2033 | 13,348 | 13,372 | ||||||
6.00%, 03/15/2033 | 124,467 | 137,101 | ||||||
6.50%, 03/15/2033 | 75,935 | 15,816 | ||||||
0.51%, 05/15/2033 | 919,650 | 926,110 | ||||||
14.56%, 06/15/2033 | 264,000 | 336,204 | ||||||
5.00%, 07/15/2033 | 884,527 | 975,207 | ||||||
6.71%, 07/15/2033 | 462 | 460 | ||||||
12.97%, 07/15/2033 | 63,677 | 75,784 | ||||||
3.00%, 08/15/2033 | 495,000 | 446,069 | ||||||
14.46%, 09/15/2033 | 81,291 | 102,676 | ||||||
7.87%, 10/15/2033 | 1,084,000 | 1,163,647 | ||||||
16.15%, 11/15/2033 | 43,555 | 56,428 | ||||||
0.76%, 12/15/2033 | 516,000 | 516,994 | ||||||
5.50%, 12/15/2033 | 307,553 | 326,397 | ||||||
5.50%, 12/15/2033 | 32,120 | 32,562 | ||||||
5.00%, 01/15/2034 | 949,000 | 1,022,706 | ||||||
5.50%, 02/15/2034 | 95,745 | 102,248 | ||||||
6.00%, 05/15/2034 | 585,000 | 649,223 | ||||||
23.91%, 06/15/2034 | 245,736 | 359,961 | ||||||
0.00%, 07/15/2034 | 452,924 | 411,745 | ||||||
2.38%, 07/15/2034 | 162,215 | 155,462 | ||||||
0.53%, 10/15/2034 | 367,562 | 367,950 | ||||||
4.00%, 11/15/2034 | 1,318,271 | 135,869 | ||||||
0.00%, 01/15/2035 | 23,343 | 23,316 | ||||||
0.00%, 02/15/2035 | 109,957 | 92,766 | ||||||
27.46%, 02/15/2035 | 122,816 | 203,173 | ||||||
0.00%, 04/15/2035 | 208,903 | 194,193 |
0.54%, 04/15/2035 | 450,103 | 450,911 | ||||||
6.00%, 04/15/2035 | 1,057,000 | 1,180,769 | ||||||
0.56%, 05/15/2035 | 197,613 | 197,096 | ||||||
0.46%, 06/15/2035 | 188,446 | 188,282 | ||||||
16.62%, 06/15/2035 | 58,573 | 69,847 | ||||||
0.00%, 08/15/2035 | 10,885 | 8,244 | ||||||
0.96%, 08/15/2035 | 241,796 | 244,310 | ||||||
4.00%, 08/15/2035 | 729,633 | 29,000 | ||||||
6.00%, 08/15/2035 | 263,909 | 274,877 | ||||||
0.00%, 09/15/2035 | 117,136 | 107,640 | ||||||
6.00%, 09/15/2035 | 502,066 | 523,918 | ||||||
5.75%, 10/15/2035 | 52,281 | 54,421 | ||||||
19.47%, 11/15/2035 | 116,355 | 162,053 | ||||||
0.00%, 01/15/2036 | 178,004 | 176,861 | ||||||
6.00%, 01/15/2036 | 520,849 | 575,091 | ||||||
23.98%, 01/15/2036 | 44,083 | 66,948 | ||||||
0.00%, 02/15/2036 | 150,998 | 146,346 | ||||||
0.00%, 02/15/2036 | 81,778 | 72,882 | ||||||
0.00%, 02/15/2036 | 95,141 | 87,023 | ||||||
0.00%, 02/15/2036 | 470,518 | 450,357 | ||||||
0.00%, 03/15/2036 | 270,006 | 258,959 | ||||||
0.00%, 03/15/2036 | 28,979 | 26,509 | ||||||
0.00%, 03/15/2036 | 290,109 | 277,411 | ||||||
6.00%, 03/15/2036 | 1,778 | 1,721 | ||||||
0.00%, 04/15/2036 | 568,807 | 519,736 | ||||||
0.00%, 04/15/2036 | 310,021 | 283,275 | ||||||
0.00%, 04/15/2036 | 153,196 | 140,448 | ||||||
0.00%, 04/15/2036 | 547,348 | 520,634 | ||||||
6.00%, 04/15/2036 | 2,808,856 | 3,088,348 | ||||||
6.00%, 04/15/2036 | 282,311 | 311,970 | ||||||
6.00%, 04/15/2036 | 330,976 | 58,929 | ||||||
0.00%, 05/15/2036 | 14,467 | 10,322 | ||||||
0.00%, 05/15/2036 | 196,860 | 178,494 | ||||||
0.00%, 05/15/2036 | 45,746 | 40,674 | ||||||
0.00%, 05/15/2036 | 100,611 | 92,308 | ||||||
0.61%, 05/15/2036 | 1,729,331 | 1,733,561 | ||||||
0.66%, 05/15/2036 | 1,227,694 | 1,228,343 |
0.00%, 06/15/2036 | 442,167 | 403,125 | ||||||
6.00%, 06/15/2036 | 516,000 | 550,292 | ||||||
6.00%, 06/15/2036 | 67,218 | 73,987 | ||||||
19.22%, 06/15/2036 | 101,541 | 137,294 | ||||||
0.00%, 07/15/2036 | 101,892 | 93,581 | ||||||
6.50%, 07/15/2036 | 336,495 | 379,824 | ||||||
6.50%, 07/15/2036 | 440,836 | 507,025 | ||||||
6.94%, 07/15/2036 | 58,595 | 10,839 | ||||||
0.00%, 08/15/2036 | 136,736 | 125,794 | ||||||
5.50%, 08/15/2036 | 699,916 | 753,115 | ||||||
5.50%, 08/15/2036 | 249,560 | 270,484 | ||||||
6.49%, 08/15/2036 | 1,797,725 | 306,388 | ||||||
0.00%, 09/15/2036 | 84,316 | 78,921 | ||||||
0.00%, 09/15/2036 | 56,893 | 53,135 | ||||||
0.00%, 10/15/2036 | 158,136 | 145,449 | ||||||
6.54%, 10/15/2036 | 179,525 | 28,401 | ||||||
7.50%, 11/15/2036 | 2,580,518 | 2,955,983 | ||||||
0.00%, 12/15/2036 | 74,291 | 68,162 | ||||||
7.00%, 12/15/2036 | 6,080,354 | 7,253,620 | ||||||
7.50%, 12/15/2036 | 2,416,002 | 2,929,665 | ||||||
0.00%, 01/15/2037 | 65,248 | 59,910 | ||||||
5.98%, 01/15/2037 | 116,946 | 18,252 | ||||||
0.00%, 02/15/2037 | 170,446 | 157,263 | ||||||
0.00%, 02/15/2037 | 45,242 | 41,745 | ||||||
0.60%, 02/15/2037 | 194,047 | 194,054 | ||||||
4.50%, 02/15/2037 | 1,332,428 | 1,420,259 | ||||||
6.00%, 02/15/2037 | 350,931 | 378,904 | ||||||
0.00%, 03/15/2037 | 96,472 | 86,838 | ||||||
6.29%, 03/15/2037 | 227,286 | 29,630 | ||||||
9.00%, 03/15/2037 | 31,582 | 31,897 | ||||||
0.00%, 04/15/2037 | 94,880 | 87,249 | ||||||
6.00%, 04/15/2037 | 249,147 | 273,951 | ||||||
0.00%, 05/15/2037 | 724,828 | 671,443 | ||||||
0.00%, 05/15/2037 | 10,892 | 9,961 | ||||||
0.00%, 05/15/2037 | 163,132 | 149,883 | ||||||
6.00%, 05/15/2037 | 710,974 | 786,922 | ||||||
0.00%, 06/15/2037 | 90,073 | 83,586 |
0.00%, 06/15/2037 | 56,763 | 52,669 | ||||||
0.00%, 07/15/2037 | 493,514 | 456,448 | ||||||
0.57%, 07/15/2037 | 3,427,793 | 3,408,542 | ||||||
4.50%, 07/15/2037 | 3,343,643 | 390,088 | ||||||
5.50%, 07/15/2037 | 48,675 | 3,484 | ||||||
6.44%, 07/15/2037 | 178,993 | 27,052 | ||||||
4.00%, 08/15/2037 | 2,388,818 | 296,786 | ||||||
0.00%, 09/15/2037 | 99,218 | 91,285 | ||||||
0.76%, 09/15/2037 | 64,469 | 64,772 | ||||||
4.00%, 10/15/2037 | 1,597,305 | 190,301 | ||||||
4.00%, 10/15/2037 | 1,211,738 | 131,548 | ||||||
6.26%, 11/15/2037 | 992,934 | 130,787 | ||||||
6.29%, 11/15/2037 | 601,086 | 84,205 | ||||||
5.84%, 01/15/2038 | 1,131,928 | 122,276 | ||||||
17.05%, 02/15/2038 | 55,261 | 69,841 | ||||||
5.50%, 03/15/2038 | 568,000 | 617,421 | ||||||
6.64%, 04/15/2038 | 402,318 | 63,192 | ||||||
5.50%, 05/15/2038 | 542,888 | 591,419 | ||||||
6.00%, 06/15/2038 | 860,302 | 976,270 | ||||||
6.00%, 06/15/2038 | 97,020 | 106,903 | ||||||
6.04%, 06/15/2038 | 398,030 | 61,748 | ||||||
5.69%, 08/15/2038 | 792,455 | 102,046 | ||||||
5.72%, 10/15/2038 | 404,065 | 442,815 | ||||||
5.50%, 01/15/2039 | 660,470 | 720,649 | ||||||
5.84%, 01/15/2039 | 452,309 | 49,674 | ||||||
2.10%, 02/15/2039 | 215,921 | 221,446 | ||||||
5.84%, 02/15/2039 | 437,898 | 48,385 | ||||||
0.56%, 04/15/2039 | 1,133,515 | 1,129,364 | ||||||
0.61%, 05/15/2039 | 1,637,800 | 1,641,842 | ||||||
5.94%, 05/15/2039 | 351,965 | 50,718 | ||||||
6.14%, 05/15/2039 | 486,856 | 65,106 | ||||||
1.36%, 07/15/2039 | 367,941 | 372,968 | ||||||
4.50%, 07/15/2039 | 1,913,929 | 2,069,970 | ||||||
0.61%, 08/15/2039 | 547,919 | 549,344 | ||||||
3.50%, 08/15/2039 | 1,213,618 | 1,248,040 | ||||||
0.00%, 10/15/2039 | 335,161 | 309,023 | ||||||
5.00%, 10/15/2039 | 1,162,347 | 217,161 |
6.09%, 12/15/2039 | 624,360 | 82,958 | ||||||
0.00%, 01/15/2040 | 385,399 | 354,328 | ||||||
2.10%, 01/15/2040 | 3,714,241 | 221,869 | ||||||
16.97%, 02/15/2040 | 475,000 | 672,743 | ||||||
0.66%, 10/15/2040 | 582,998 | 586,316 | ||||||
5.84%, 10/15/2040 | 1,818,281 | 310,172 | ||||||
5.84%, 10/15/2040 | 1,666,366 | 266,608 | ||||||
5.00%, 05/15/2041 | 965,801 | 990,162 | ||||||
5.50%, 05/15/2041 | 2,059,261 | 2,162,086 | ||||||
5.50%, 05/15/2041 | 852,958 | 888,976 | ||||||
0.56%, 10/15/2041 | 2,100,672 | 2,104,250 | ||||||
4.00%, 11/15/2041 | 2,181,644 | 2,259,481 | ||||||
4.00%, 12/15/2041 | 918,369 | 928,014 | ||||||
0.66%, 03/15/2042 | 1,774,463 | 1,770,630 | ||||||
0.66%, 07/15/2042 | 940,961 | 938,023 | ||||||
3.00%, 06/15/2043 | 206,000 | 172,992 | ||||||
4.50%, 09/15/2043 | 1,000,000 | 988,538 | ||||||
7.19%, 11/15/2046 | 2,353,017 | 2,828,105 | ||||||
Freddie Mac Strips | ||||||||
4.50%, 11/15/2020 | 267,065 | 21,434 | ||||||
4.50%, 12/15/2020 | 172,159 | 13,991 | ||||||
9.00%, 04/01/2022 | 352 | 81 | ||||||
0.00%, 04/01/2028 | 225,306 | 206,904 | ||||||
5.00%, 09/15/2035 | 431,189 | 73,849 | ||||||
5.00%, 09/15/2035 | 825,164 | 159,020 | ||||||
5.00%, 09/15/2035 | 520,299 | 100,866 | ||||||
7.54%, 08/15/2036 | 1,861,619 | 355,162 | ||||||
0.71%, 07/15/2042 | 4,505,684 | 4,488,683 | ||||||
3.50%, 07/15/2042 | 11,234,206 | 11,241,329 | ||||||
0.66%, 08/15/2042 | 4,117,657 | 4,106,365 | ||||||
0.66%, 08/15/2042 | 1,461,221 | 1,443,266 | ||||||
0.66%, 08/15/2042 | 1,263,434 | 1,258,475 | ||||||
0.61%, 09/15/2042 | 3,275,204 | 3,250,529 | ||||||
0.66%, 10/15/2042 | 1,591,316 | 1,577,821 | ||||||
3.00%, 01/15/2043 | 980,982 | 955,185 | ||||||
0.00%, 09/15/2043 | 1,579,116 | 1,079,904 |
Freedom Trust 2011-4 | ||||||||
5.00%, 03/25/2037 | 444,869 | 448,387 | ||||||
GE Capital Commercial Mortgage Corp | ||||||||
5.31%, 11/10/2045 | 5,673,792 | 6,030,049 | ||||||
4.83%, 06/10/2048 | 1,187,000 | 1,231,710 | ||||||
4.85%, 06/10/2048 | 1,115,000 | 1,145,940 | ||||||
Ginnie Mae | ||||||||
4.00%, 01/15/2042 | 25,000,000 | 25,993,165 | ||||||
4.50%, 01/15/2042 | 25,000,000 | 26,728,515 | ||||||
3.00%, 01/15/2043 | 3,000,000 | 2,898,516 | ||||||
Ginnie Mae I pool | ||||||||
8.00%, 01/15/2016 | 8,731 | 8,973 | ||||||
9.00%, 08/15/2016 | 67 | 71 | ||||||
9.00%, 12/15/2016 | 247 | 258 | ||||||
9.00%, 03/15/2017 | 96 | 96 | ||||||
6.50%, 06/15/2017 | 9,320 | 9,809 | ||||||
6.00%, 10/15/2017 | 8,115 | 8,476 | ||||||
8.50%, 11/15/2017 | 1,592 | 1,681 | ||||||
12.00%, 11/15/2019 | 494 | 498 | ||||||
9.00%, 02/15/2020 | 113 | 113 | ||||||
9.50%, 09/15/2020 | 21 | 22 | ||||||
8.00%, 07/15/2022 | 166 | 167 | ||||||
8.00%, 09/15/2022 | 2,828 | 3,110 | ||||||
7.50%, 11/15/2022 | 1,712 | 1,891 | ||||||
7.50%, 03/15/2023 | 373 | 414 | ||||||
7.00%, 08/15/2023 | 862 | 948 | ||||||
7.00%, 09/15/2023 | 25,527 | 28,168 | ||||||
7.00%, 11/15/2023 | 2,040 | 2,359 | ||||||
6.50%, 01/15/2024 | 10,057 | 11,220 | ||||||
7.00%, 02/15/2024 | 20,960 | 22,982 | ||||||
9.50%, 10/15/2024 | 210,423 | 238,696 | ||||||
9.00%, 11/15/2024 | 3,132 | 3,411 | ||||||
9.50%, 12/15/2025 | 6,597 | 7,248 | ||||||
7.50%, 11/15/2026 | 1,491 | 1,562 | ||||||
7.50%, 07/15/2027 | 5,107 | 5,788 | ||||||
6.50%, 03/15/2028 | 12,777 | 14,257 | ||||||
7.50%, 07/15/2028 | 2,564 | 2,813 | ||||||
8.00%, 08/15/2028 | 2,113 | 2,149 |
6.50%, 09/15/2028 | 36,491 | 40,715 | ||||||
7.50%, 09/15/2028 | 8,152 | 9,245 | ||||||
6.50%, 10/15/2028 | 2,317 | 2,586 | ||||||
6.00%, 11/15/2028 | 20,465 | 22,884 | ||||||
7.00%, 09/15/2031 | 197,021 | 231,320 | ||||||
7.50%, 11/15/2031 | 4,187 | 4,370 | ||||||
6.50%, 01/15/2032 | 187,075 | 211,386 | ||||||
6.50%, 07/15/2032 | 4,215 | 4,704 | ||||||
6.50%, 02/15/2033 | 26,018 | 29,038 | ||||||
7.00%, 02/15/2033 | 9,489 | 10,698 | ||||||
5.50%, 04/15/2033 | 524,571 | 598,832 | ||||||
6.50%, 04/15/2033 | 18,324 | 20,451 | ||||||
5.50%, 06/15/2033 | 12,800 | 14,171 | ||||||
7.00%, 06/15/2033 | 39,789 | 46,375 | ||||||
5.50%, 12/15/2033 | 37,196 | 41,289 | ||||||
5.50%, 07/15/2034 | 12,031 | 13,339 | ||||||
5.50%, 09/15/2034 | 32,716 | 36,174 | ||||||
7.00%, 06/15/2035 | 566,640 | 665,320 | ||||||
6.50%, 12/15/2035 | 187,409 | 212,582 | ||||||
7.00%, 04/15/2037 | 48,550 | 55,149 | ||||||
7.50%, 10/15/2037 | 145,519 | 164,984 | ||||||
3.50%, 04/15/2043 | 8,612,111 | 8,694,794 | ||||||
3.50%, 06/15/2043 | 3,455,582 | 3,488,758 | ||||||
Ginnie Mae II pool | ||||||||
8.50%, 03/20/2025 | 608 | 694 | ||||||
8.50%, 04/20/2025 | 5,156 | 5,938 | ||||||
8.50%, 05/20/2025 | 8,290 | 9,527 | ||||||
8.00%, 12/20/2025 | 1,464 | 1,685 | ||||||
8.00%, 06/20/2026 | 3,141 | 3,765 | ||||||
8.00%, 08/20/2026 | 2,339 | 2,710 | ||||||
8.00%, 09/20/2026 | 3,036 | 3,616 | ||||||
8.00%, 11/20/2026 | 2,685 | 3,223 | ||||||
8.00%, 10/20/2027 | 5,477 | 6,458 | ||||||
8.00%, 11/20/2027 | 5,369 | 6,461 | ||||||
8.00%, 12/20/2027 | 2,370 | 2,740 | ||||||
7.50%, 02/20/2028 | 3,869 | 4,581 | ||||||
6.00%, 03/20/2028 | 18,108 | 20,166 |
8.00%, 06/20/2028 | 901 | 952 | ||||||
8.00%, 08/20/2028 | 293 | 336 | ||||||
7.50%, 09/20/2028 | 11,409 | 13,528 | ||||||
8.00%, 09/20/2028 | 2,085 | 2,385 | ||||||
6.50%, 07/20/2029 | 212,843 | 243,753 | ||||||
6.00%, 11/20/2033 | 14,326 | 16,254 | ||||||
7.00%, 08/20/2038 | 105,337 | 119,860 | ||||||
6.00%, 09/20/2038 | 2,143,374 | 2,413,417 | ||||||
6.00%, 11/20/2038 | 27,219 | 28,721 | ||||||
6.00%, 08/20/2039 | 952,863 | 1,073,075 | ||||||
5.50%, 09/20/2039 | 507,994 | 562,423 | ||||||
5.00%, 07/20/2040 | 821,219 | 899,411 | ||||||
4.00%, 10/20/2040 | 7,944,058 | 8,274,449 | ||||||
4.50%, 01/20/2041 | 11,636,583 | 12,492,277 | ||||||
4.50%, 06/20/2041 | 22,614,934 | 24,216,275 | ||||||
4.00%, 06/20/2042 | 2,184,071 | 2,274,893 | ||||||
3.00%, 08/20/2042 | 11,916,134 | 11,537,821 | ||||||
3.50%, 09/20/2042 | 1,392,835 | 1,407,303 | ||||||
3.50%, 10/20/2042 | 14,849,847 | 15,004,086 | ||||||
4.00%, 08/20/2043 | 9,875,452 | 10,282,282 | ||||||
4.46%, 05/20/2063 | 526,500 | 573,351 | ||||||
GMAC Commercial Mortgage Securities Inc Series 2006-C1 Trust | ||||||||
5.24%, 11/10/2045 | 1,445,000 | 1,518,238 | ||||||
GMACM Mortgage Loan Trust 2003-AR1 | ||||||||
2.97%, 10/19/2033 | 822,019 | 833,408 | ||||||
GMACM Mortgage Loan Trust 2003-AR2 | ||||||||
2.86%, 12/19/2033 | 575,301 | 572,427 | ||||||
GMACM Mortgage Loan Trust 2003-J7 | ||||||||
5.00%, 11/25/2033 | 550,319 | 559,926 | ||||||
5.50%, 11/25/2033 | 47,344 | 48,784 | ||||||
GMACM Mortgage Loan Trust 2003-J8 | ||||||||
5.25%, 12/25/2033 | 28,959 | 30,027 | ||||||
GMACM Mortgage Loan Trust 2004-J5 | ||||||||
6.50%, 01/25/2035 | 386,943 | 411,754 | ||||||
GMACM Mortgage Loan Trust 2004-J6 | ||||||||
5.00%, 01/25/2020 | 163,795 | 168,571 |
GMACM Mortgage Loan Trust 2005-AR3 | ||||||||
2.97%, 06/19/2035 | 479,011 | 459,029 | ||||||
Government National Mortgage Association | ||||||||
6.00%, 04/20/2020 | 864,887 | 922,531 | ||||||
5.50%, 05/16/2020 | 281,578 | 287,339 | ||||||
5.50%, 11/20/2020 | 504,927 | 557,503 | ||||||
11.05%, 12/16/2022 | 2,297 | 2,522 | ||||||
5.00%, 04/16/2023 | 619,000 | 690,597 | ||||||
6.50%, 10/16/2024 | 329,863 | 382,071 | ||||||
6.50%, 04/20/2028 | 97,136 | 110,704 | ||||||
6.00%, 02/20/2029 | 287,876 | 320,941 | ||||||
6.50%, 04/20/2029 | 291,068 | 328,160 | ||||||
8.44%, 08/16/2029 | 24,503 | 5,172 | ||||||
9.20%, 09/16/2029 | 2,375 | 2,721 | ||||||
8.00%, 11/16/2029 | 62,750 | 74,555 | ||||||
7.50%, 11/20/2029 | 33,175 | 38,737 | ||||||
8.50%, 12/16/2029 | 343,496 | 408,048 | ||||||
7.50%, 12/20/2029 | 29,211 | 34,146 | ||||||
8.00%, 12/20/2029 | 55,516 | 65,981 | ||||||
7.50%, 02/16/2030 | 22,891 | 23,326 | ||||||
8.50%, 02/16/2030 | 337,353 | 405,755 | ||||||
38.66%, 02/16/2030 | 38,234 | 70,938 | ||||||
9.00%, 03/16/2030 | 305,131 | 367,347 | ||||||
7.34%, 04/16/2030 | 301,902 | 54,205 | ||||||
8.00%, 06/20/2030 | 28,526 | 34,286 | ||||||
9.00%, 10/20/2030 | 44,624 | 51,647 | ||||||
9.00%, 11/16/2030 | 3,987 | 904 | ||||||
9.00%, 11/20/2030 | 25,636 | 27,291 | ||||||
8.54%, 01/16/2031 | 16,799 | 3,934 | ||||||
8.39%, 03/16/2031 | 19,144 | 4,331 | ||||||
20.60%, 03/17/2031 | 152,540 | 223,834 | ||||||
6.50%, 03/20/2031 | 67,680 | 76,383 | ||||||
31.82%, 04/20/2031 | 10,797 | 21,953 | ||||||
0.00%, 05/20/2031 | 34,187 | 34,104 | ||||||
7.89%, 08/16/2031 | 25,633 | 6,066 | ||||||
8.09%, 08/16/2031 | 32,068 | 7,139 | ||||||
7.04%, 09/20/2031 | 11,857 | 131 | ||||||
6.50%, 11/20/2031 | 464,000 | 538,736 |
6.50%, 12/20/2031 | 209,646 | 241,552 | ||||||
7.23%, 01/16/2032 | 34,235 | 7,624 | ||||||
6.50%, 01/20/2032 | 56,452 | 63,699 | ||||||
0.00%, 02/20/2032 | 25,648 | 25,607 | ||||||
0.51%, 03/20/2032 | 147,774 | 148,101 | ||||||
7.79%, 04/16/2032 | 136,311 | 29,581 | ||||||
11.69%, 04/16/2032 | 11,861 | 14,665 | ||||||
9.00%, 06/16/2032 | 4,767 | 5,429 | ||||||
6.50%, 06/20/2032 | 521,221 | 593,651 | ||||||
6.50%, 06/20/2032 | 133,034 | 151,595 | ||||||
6.50%, 07/16/2032 | 155,039 | 177,423 | ||||||
6.00%, 07/20/2032 | 57,681 | 65,144 | ||||||
6.50%, 07/20/2032 | 262,423 | 299,041 | ||||||
6.50%, 07/20/2032 | 179,185 | 199,509 | ||||||
7.54%, 08/20/2032 | 90,209 | 9,416 | ||||||
6.79%, 10/20/2032 | 865,276 | 74,090 | ||||||
14.41%, 11/17/2032 | 46,163 | 58,549 | ||||||
6.00%, 11/20/2032 | 146,000 | 166,124 | ||||||
0.00%, 12/20/2032 | 359,322 | 336,390 | ||||||
13.19%, 12/20/2032 | 39,739 | 42,330 | ||||||
19.23%, 12/20/2032 | 105,812 | 121,252 | ||||||
5.50%, 01/16/2033 | 660,519 | 722,531 | ||||||
0.00%, 01/17/2033 | 18,146 | 17,990 | ||||||
6.50%, 01/20/2033 | 303,489 | 344,456 | ||||||
7.54%, 02/16/2033 | 147,964 | 28,563 | ||||||
0.00%, 02/17/2033 | 134,298 | 123,648 | ||||||
7.54%, 02/20/2033 | 60,200 | 12,346 | ||||||
0.00%, 03/16/2033 | 22,502 | 18,808 | ||||||
7.49%, 03/17/2033 | 50,403 | 54,205 | ||||||
6.50%, 03/20/2033 | 166,317 | 188,453 | ||||||
6.50%, 03/20/2033 | 326,000 | 374,345 | ||||||
5.50%, 04/20/2033 | 639,022 | 707,034 | ||||||
6.50%, 05/20/2033 | 116,000 | 134,224 | ||||||
0.00%, 06/16/2033 | 1,569 | 1,568 | ||||||
0.00%, 06/16/2033 | 101,098 | 86,039 | ||||||
6.00%, 09/16/2033 | 374,619 | 416,387 | ||||||
0.00%, 10/20/2033 | 16,191 | 13,584 |
5.83%, 10/20/2033 | 375,485 | 423,304 | ||||||
6.39%, 11/16/2033 | 234,948 | 44,741 | ||||||
6.59%, 11/20/2033 | 362,359 | 59,270 | ||||||
6.39%, 12/16/2033 | 196,098 | 36,249 | ||||||
5.34%, 02/20/2034 | 568,106 | 75,189 | ||||||
6.34%, 03/16/2034 | 277,219 | 28,893 | ||||||
19.23%, 04/16/2034 | 81,785 | 113,517 | ||||||
16.37%, 05/18/2034 | 166,580 | 194,115 | ||||||
0.00%, 06/20/2034 | 203,532 | 176,802 | ||||||
6.00%, 06/20/2034 | 655,096 | 730,929 | ||||||
6.54%, 07/20/2034 | 868,199 | 168,215 | ||||||
14.53%, 08/17/2034 | 109,504 | 133,807 | ||||||
5.74%, 08/20/2034 | 201,556 | 222,786 | ||||||
6.39%, 09/16/2034 | 653,922 | 108,252 | ||||||
7.00%, 09/20/2034 | 97,553 | 106,348 | ||||||
28.69%, 09/20/2034 | 97,553 | 163,562 | ||||||
13.91%, 10/16/2034 | 44,683 | 52,520 | ||||||
23.80%, 10/16/2034 | 66,495 | 103,588 | ||||||
5.94%, 10/20/2034 | 1,191,416 | 173,285 | ||||||
11.89%, 10/20/2034 | 69,193 | 79,910 | ||||||
5.92%, 11/20/2034 | 573,177 | 82,227 | ||||||
5.94%, 01/20/2035 | 553,118 | 77,231 | ||||||
6.59%, 01/20/2035 | 835,250 | 164,115 | ||||||
16.05%, 06/17/2035 | 432,436 | 557,006 | ||||||
6.64%, 06/20/2035 | 464,162 | 474,982 | ||||||
5.50%, 07/20/2035 | 89,383 | 13,725 | ||||||
20.30%, 08/16/2035 | 37,601 | 54,360 | ||||||
0.00%, 08/20/2035 | 463,898 | 388,847 | ||||||
22.14%, 08/20/2035 | 3,093 | 4,432 | ||||||
5.50%, 09/20/2035 | 323,950 | 361,913 | ||||||
6.14%, 09/20/2035 | 1,823,045 | 287,006 | ||||||
0.00%, 10/20/2035 | 92,584 | 80,046 | ||||||
0.00%, 11/20/2035 | 154,223 | 133,679 | ||||||
6.00%, 12/20/2035 | 161,174 | 26,408 | ||||||
5.75%, 02/20/2036 | 168,246 | 186,798 | ||||||
0.00%, 03/20/2036 | 153,550 | 130,081 | ||||||
0.00%, 05/20/2036 | 213,456 | 184,357 |
6.34%, 06/20/2036 | 40,453 | 5,723 | ||||||
0.00%, 07/20/2036 | 32,388 | 27,930 | ||||||
6.50%, 07/20/2036 | 667,961 | 770,429 | ||||||
6.54%, 07/20/2036 | 365,268 | 42,815 | ||||||
6.50%, 08/20/2036 | 696,535 | 801,978 | ||||||
5.56%, 10/20/2036 | 230,745 | 256,006 | ||||||
6.54%, 10/20/2036 | 294,275 | 53,250 | ||||||
6.64%, 11/20/2036 | 517,228 | 96,500 | ||||||
5.96%, 02/20/2037 | 139,177 | 151,276 | ||||||
6.00%, 02/20/2037 | 36,455 | 2,004 | ||||||
0.00%, 03/20/2037 | 639,117 | 573,999 | ||||||
6.04%, 03/20/2037 | 448,111 | 67,354 | ||||||
6.35%, 03/20/2037 | 741,111 | 124,262 | ||||||
0.00%, 04/16/2037 | 254,583 | 214,516 | ||||||
0.36%, 04/16/2037 | 1,182,433 | 1,181,733 | ||||||
6.65%, 04/16/2037 | 656,105 | 105,605 | ||||||
6.04%, 04/20/2037 | 288,217 | 43,200 | ||||||
6.12%, 04/20/2037 | 286,208 | 319,405 | ||||||
0.46%, 05/16/2037 | 168,064 | 168,185 | ||||||
0.00%, 05/20/2037 | 50,772 | 43,699 | ||||||
6.04%, 05/20/2037 | 644,545 | 96,951 | ||||||
6.04%, 05/20/2037 | 522,331 | 80,860 | ||||||
6.04%, 05/20/2037 | 1,462,681 | 220,410 | ||||||
0.00%, 06/16/2037 | 708,910 | 596,399 | ||||||
0.00%, 06/16/2037 | 103,041 | 86,313 | ||||||
6.31%, 06/16/2037 | 441,848 | 73,167 | ||||||
6.09%, 06/20/2037 | 507,643 | 77,385 | ||||||
6.48%, 07/20/2037 | 640,371 | 107,871 | ||||||
6.52%, 07/20/2037 | 694,500 | 126,154 | ||||||
6.59%, 07/20/2037 | 450,266 | 83,210 | ||||||
6.59%, 07/20/2037 | 1,095,577 | 201,913 | ||||||
6.62%, 08/20/2037 | 189,562 | 35,477 | ||||||
0.00%, 09/20/2037 | 142,186 | 128,476 | ||||||
6.39%, 09/20/2037 | 408,709 | 69,190 | ||||||
19.73%, 09/20/2037 | 133,392 | 188,690 | ||||||
5.50%, 10/16/2037 | 840,236 | 108,604 | ||||||
6.34%, 10/20/2037 | 548,519 | 70,927 |
13.09%, 10/20/2037 | 78,091 | 93,383 | ||||||
0.00%, 11/16/2037 | 819,526 | 705,922 | ||||||
6.38%, 11/16/2037 | 410,348 | 65,857 | ||||||
5.50%, 11/20/2037 | 54,942 | 58,623 | ||||||
5.84%, 11/20/2037 | 522,678 | 76,616 | ||||||
6.34%, 11/20/2037 | 1,017,954 | 170,176 | ||||||
6.35%, 11/20/2037 | 559,552 | 83,857 | ||||||
6.39%, 11/20/2037 | 473,500 | 79,968 | ||||||
19.48%, 11/20/2037 | 56,334 | 78,534 | ||||||
6.37%, 12/20/2037 | 597,637 | 99,847 | ||||||
6.39%, 12/20/2037 | 770,713 | 129,218 | ||||||
0.00%, 01/20/2038 | 37,098 | 31,880 | ||||||
0.00%, 01/20/2038 | 128,732 | 123,450 | ||||||
5.50%, 02/20/2038 | 137,670 | 21,103 | ||||||
5.84%, 02/20/2038 | 4,063,557 | 610,754 | ||||||
6.74%, 03/20/2038 | 365,171 | 55,368 | ||||||
7.54%, 04/16/2038 | 221,931 | 37,463 | ||||||
6.14%, 04/20/2038 | 694,498 | 102,421 | ||||||
6.24%, 05/16/2038 | 1,761,876 | 304,801 | ||||||
6.18%, 05/20/2038 | 547,768 | 82,491 | ||||||
6.00%, 06/20/2038 | 361,000 | 402,921 | ||||||
6.04%, 06/20/2038 | 197,221 | 29,841 | ||||||
5.75%, 07/20/2038 | 845,072 | 932,345 | ||||||
5.99%, 07/20/2038 | 729,101 | 108,682 | ||||||
5.58%, 08/20/2038 | 864,886 | 928,079 | ||||||
5.84%, 08/20/2038 | 271,764 | 40,102 | ||||||
5.74%, 09/20/2038 | 808,495 | 101,745 | ||||||
6.04%, 09/20/2038 | 1,569,764 | 227,154 | ||||||
7.44%, 09/20/2038 | 354,971 | 59,602 | ||||||
6.09%, 11/20/2038 | 481,249 | 534,539 | ||||||
6.24%, 12/16/2038 | 424,010 | 56,517 | ||||||
5.54%, 12/20/2038 | 782,786 | 101,339 | ||||||
5.83%, 12/20/2038 | 1,592,375 | 1,727,641 | ||||||
5.84%, 12/20/2038 | 455,416 | 65,558 | ||||||
6.00%, 12/20/2038 | 280,208 | 40,881 | ||||||
7.14%, 12/20/2038 | 1,505,555 | 243,267 | ||||||
5.94%, 02/16/2039 | 495,904 | 68,373 |
5.99%, 02/16/2039 | 579,891 | 87,335 | ||||||
5.79%, 02/20/2039 | 721,365 | 103,638 | ||||||
5.88%, 02/20/2039 | 432,469 | 63,171 | ||||||
6.14%, 03/20/2039 | 524,844 | 65,747 | ||||||
6.14%, 03/20/2039 | 806,018 | 113,937 | ||||||
6.19%, 03/20/2039 | 669,646 | 77,519 | ||||||
6.50%, 03/20/2039 | 211,437 | 45,109 | ||||||
6.50%, 03/20/2039 | 442,880 | 96,517 | ||||||
6.11%, 04/20/2039 | 1,328,095 | 189,479 | ||||||
5.50%, 05/20/2039 | 168,680 | 25,636 | ||||||
6.00%, 05/20/2039 | 212,676 | 33,770 | ||||||
6.24%, 06/16/2039 | 2,121,105 | 281,629 | ||||||
5.79%, 06/20/2039 | 698,343 | 102,125 | ||||||
5.92%, 06/20/2039 | 1,017,119 | 139,056 | ||||||
5.94%, 07/16/2039 | 1,287,127 | 182,315 | ||||||
6.09%, 08/16/2039 | 978,408 | 154,288 | ||||||
7.00%, 08/16/2039 | 311,222 | 363,165 | ||||||
5.94%, 08/20/2039 | 623,784 | 84,028 | ||||||
5.50%, 09/20/2039 | 317,000 | 341,977 | ||||||
5.93%, 09/20/2039 | 1,552,599 | 209,044 | ||||||
6.24%, 11/16/2039 | 1,255,235 | 222,269 | ||||||
6.00%, 12/20/2039 | 1,333,185 | 1,418,005 | ||||||
5.24%, 06/20/2040 | 342,330 | 379,083 | ||||||
5.52%, 07/20/2040 | 690,756 | 748,220 | ||||||
7.00%, 10/16/2040 | 1,475,290 | 1,719,760 | ||||||
0.00%, 12/20/2040 | 1,811,074 | 1,441,784 | ||||||
6.44%, 05/20/2041 | 1,077,294 | 200,075 | ||||||
4.66%, 09/20/2041 | 910,916 | 952,370 | ||||||
4.54%, 11/16/2041 | 948,561 | 1,003,177 | ||||||
3.76%, 01/20/2042 | 902,135 | 915,241 | ||||||
3.97%, 09/16/2042 | 639,304 | 645,787 | ||||||
4.70%, 11/20/2042 | 474,505 | 498,839 | ||||||
4.51%, 04/20/2043 | 474,305 | 503,767 | ||||||
0.62%, 11/20/2059 | 2,561,063 | 2,565,655 | ||||||
0.65%, 01/20/2060 | 1,470,175 | 1,474,414 | ||||||
0.62%, 03/20/2060 | 1,878,458 | 1,881,894 | ||||||
0.60%, 04/20/2060 | 3,691,537 | 3,697,890 |
5.24%, 07/20/2060 | 2,764,616 | 3,108,341 | ||||||
0.47%, 08/20/2060 | 1,090,760 | 1,089,790 | ||||||
0.64%, 01/20/2061 | 4,523,853 | 4,506,233 | ||||||
0.82%, 05/20/2061 | 4,078,670 | 4,084,306 | ||||||
0.87%, 05/20/2061 | 3,999,131 | 4,010,348 | ||||||
0.72%, 10/20/2061 | 1,953,577 | 1,950,445 | ||||||
0.72%, 12/20/2061 | 9,361,551 | 9,340,413 | ||||||
0.72%, 04/20/2062 | 731,593 | 730,371 | ||||||
0.62%, 05/20/2062 | 1,883,472 | 1,887,069 | ||||||
2.00%, 06/20/2062 | 403,156 | 402,388 | ||||||
0.72%, 07/20/2062 | 2,923,161 | 2,918,805 | ||||||
0.75%, 09/20/2062 | 4,883,380 | 4,879,649 | ||||||
0.76%, 09/20/2062 | 1,298,099 | 1,297,687 | ||||||
0.67%, 10/20/2062 | 1,483,195 | 1,479,306 | ||||||
0.77%, 10/20/2062 | 571,579 | 571,520 | ||||||
0.47%, 11/20/2062 | 510,342 | 509,904 | ||||||
0.51%, 12/20/2062 | 3,987,063 | 3,941,180 | ||||||
0.49%, 01/20/2063 | 1,711,413 | 1,687,292 | ||||||
0.67%, 01/20/2063 | 1,566,685 | 1,562,216 | ||||||
1.65%, 01/20/2063 | 3,513,758 | 3,418,879 | ||||||
0.59%, 02/20/2063 | 447,288 | 442,619 | ||||||
0.62%, 02/20/2063 | 2,163,421 | 2,146,981 | ||||||
1.65%, 02/20/2063 | 4,595,219 | 4,465,620 | ||||||
0.58%, 03/20/2063 | 1,504,581 | 1,489,740 | ||||||
0.64%, 03/20/2063 | 501,362 | 498,057 | ||||||
1.75%, 03/20/2063 | 1,130,097 | 1,101,089 | ||||||
1.65%, 04/20/2063 | 1,451,202 | 1,408,654 | ||||||
GS Mortgage Securities Corp II | ||||||||
2.71%, 12/10/2027 (Acquired 10/28/2013, Cost $1,410,010) (a) | 1,413,632 | 1,389,839 | ||||||
2.77%, 11/10/2045 | 10,451,562 | 9,727,405 | ||||||
GS Mortgage Securities Corp II Series 2004-GG2 | ||||||||
5.40%, 08/10/2038 | 887,901 | 896,795 | ||||||
GS Mortgage Securities Corp Trust 2012-SHOP | ||||||||
1.30%, 06/05/2031 (Acquired 10/28/2013, Cost $516,108) (a) | 7,793,000 | 507,979 | ||||||
GS Mortgage Securities Corp Trust 2013-NYC5 | ||||||||
2.32%, 01/10/2030 (Acquired 10/28/2013, Cost $509,097) (a) | 505,000 | 505,207 |
GS Mortgage Securities Trust 2006-GG6 | ||||||||
5.55%, 04/10/2038 | 1,773,000 | 1,909,175 | ||||||
GS Mortgage Securities Trust 2006-GG8 | ||||||||
0.58%, 11/10/2039 (Acquired 10/28/2013, Cost $195,905) (a) | 13,951,830 | 188,657 | ||||||
GSMPS Mortgage Loan Trust 2004-4 | ||||||||
0.56%, 06/25/2034 (Acquired 10/28/2013, Cost $93,179) (a) | 106,351 | 92,905 | ||||||
GSMPS Mortgage Loan Trust 2005-RP2 | ||||||||
0.51%, 03/25/2035 (Acquired 10/28/2013, Cost $165,220) (a) | 194,254 | 164,667 | ||||||
GSMPS Mortgage Loan Trust 2005-RP3 | ||||||||
0.51%, 09/25/2035 (Acquired 10/28/2013, Cost $976,133) (a) | 1,171,628 | 972,215 | ||||||
4.89%, 09/25/2035 (Acquired 10/28/2013, Cost $125,303) (a) | 863,800 | 123,403 | ||||||
GSMS Trust 2009-RR1 | ||||||||
5.37%, 05/17/2045 (Acquired 10/28/2013, Cost $624,110) (a) | 568,000 | 620,222 | ||||||
GSR Mortgage Loan Trust 2003-3F | ||||||||
5.75%, 04/25/2033 | 79,095 | 82,362 | ||||||
GSR Mortgage Loan Trust 2003-6F | ||||||||
0.56%, 09/25/2032 | 41,421 | 39,203 | ||||||
GSR Mortgage Loan Trust 2004-13F | ||||||||
6.00%, 11/25/2034 | 119,043 | 117,615 | ||||||
GSR Mortgage Loan Trust 2004-6F | ||||||||
5.50%, 05/25/2034 | 315,093 | 330,162 | ||||||
6.50%, 05/25/2034 | 170,627 | 180,674 | ||||||
GSR Mortgage Loan Trust 2005-5F | ||||||||
0.66%, 06/25/2035 | 137,851 | 129,815 | ||||||
GSR Mortgage Loan Trust 2005-7F | ||||||||
6.00%, 09/25/2035 | 534,562 | 544,440 | ||||||
GSR Mortgage Loan Trust 2005-AR6 | ||||||||
2.66%, 09/25/2035 | 36,208 | 35,652 | ||||||
GSR Mortgage Loan Trust 2006-1F | ||||||||
5.50%, 02/25/2036 | 292,598 | 281,366 | ||||||
6.00%, 02/25/2036 | 954,581 | 864,292 | ||||||
GSR Mortgage Loan Trust 2007-1F | ||||||||
5.50%, 01/25/2037 | 938,489 | 915,144 | ||||||
Impac CMB Trust Series 2004-4 | ||||||||
4.62%, 09/25/2034 | 19,799 | 19,448 | ||||||
Impac CMB Trust Series 2005-4 | ||||||||
0.46%, 05/25/2035 | 311,095 | 311,354 |
Impac Secured Assets CMN Owner Trust | ||||||||
5.50%, 08/25/2033 | 160,371 | 168,796 | ||||||
0.96%, 11/25/2034 | 9,053 | 8,695 | ||||||
Impac Secured Assets Trust 2006-1 | ||||||||
0.51%, 05/25/2036 | 824,850 | 812,874 | ||||||
Impac Secured Assets Trust 2006-2 | ||||||||
0.51%, 08/25/2036 | 1,447,727 | 1,403,737 | ||||||
IndyMac INDX Mortgage Loan Trust 2005-AR11 | ||||||||
0.00%, 08/25/2035 | 2,186,064 | 2,733 | ||||||
Jefferies Resecuritization Trust 2011-R2 | ||||||||
4.50%, 10/26/2036 | 535,617 | 555,725 | ||||||
JP Morgan Alternative Loan Trust | ||||||||
2.62%, 03/25/2036 | 76,662 | 60,015 | ||||||
JP Morgan Chase Commercial Mortgage Securities Corp | ||||||||
4.40%, 01/12/2039 | 227,795 | 227,833 | ||||||
JP Morgan Chase Commercial Mortgage Securities Trust 2004-CIBC9 | ||||||||
5.58%, 06/12/2041 | 539,022 | 548,362 | ||||||
JP Morgan Chase Commercial Mortgage Securities Trust 2005-CIBC11 | ||||||||
0.13%, 08/12/2037 (Acquired 10/28/2013, Cost $106,037) (a) | 55,382,615 | 98,692 | ||||||
5.39%, 08/12/2037 | 531,000 | 555,853 | ||||||
JP Morgan Chase Commercial Mortgage Securities Trust 2005-CIBC12 | ||||||||
4.90%, 09/12/2037 | 5,265,736 | 5,514,610 | ||||||
JP Morgan Chase Commercial Mortgage Securities Trust 2005-LDP5 | ||||||||
0.13%, 12/15/2044 (Acquired 10/28/2013, Cost $126,196) (a) | 59,130,571 | 114,832 | ||||||
JP Morgan Chase Commercial Mortgage Securities Trust 2006-CIBC15 | ||||||||
0.25%, 06/12/2043 | 38,778,157 | 238,098 | ||||||
5.81%, 06/12/2043 | 194,137 | 209,448 | ||||||
JP Morgan Chase Commercial Mortgage Securities Trust 2006-CIBC16 | ||||||||
5.55%, 05/12/2045 | 220,881 | 239,927 | ||||||
JP Morgan Chase Commercial Mortgage Securities Trust 2006-LDP8 | �� | |||||||
5.40%, 05/15/2045 | 165,000 | 179,758 | ||||||
JP Morgan Chase Commercial Mortgage Securities Trust 2006-LDP9 | ||||||||
0.32%, 05/15/2047 | 372,459 | 372,337 | ||||||
5.34%, 05/15/2047 | 413,000 | 416,749 | ||||||
JP Morgan Chase Commercial Mortgage Securities Trust 2007-C1 | ||||||||
5.72%, 02/15/2051 | 155,000 | 170,103 | ||||||
JP Morgan Chase Commercial Mortgage Securities Trust 2007-LDP12 | ||||||||
0.07%, 02/15/2051 | 37,094,865 | 110,135 |
JP Morgan Chase Commercial Mortgage Securities Trust 2013-LC11 | ||||||||
2.96%, 04/15/2046 | 5,752,087 | 5,381,141 | ||||||
JP Morgan Mortgage Trust 2004-A3 | ||||||||
2.75%, 07/25/2034 | 108,501 | 110,425 | ||||||
JP Morgan Mortgage Trust 2004-A4 | ||||||||
2.77%, 09/25/2034 | 195,211 | 197,256 | ||||||
JP Morgan Mortgage Trust 2004-S1 | ||||||||
5.00%, 09/25/2034 | 102,995 | 106,033 | ||||||
JP Morgan Mortgage Trust 2005-A1 | ||||||||
3.71%, 02/25/2035 | 395,826 | 398,011 | ||||||
JP Morgan Mortgage Trust 2005-A4 | ||||||||
5.24%, 07/25/2035 | 597,787 | 609,883 | ||||||
JP Morgan Mortgage Trust 2006-A2 | ||||||||
2.55%, 11/25/2033 | 1,445,853 | 1,455,140 | ||||||
2.73%, 08/25/2034 | 2,480,746 | 2,474,673 | ||||||
JP Morgan Mortgage Trust 2006-A3 | ||||||||
2.72%, 08/25/2034 | 357,233 | 355,986 | ||||||
JP Morgan Mortgage Trust 2006-A7 | ||||||||
2.53%, 01/25/2037 | 80,502 | 70,967 | ||||||
2.53%, 01/25/2037 | 322,205 | 282,096 | ||||||
JP Morgan Mortgage Trust 2007-A1 | ||||||||
2.75%, 07/25/2035 | 257,097 | 257,838 | ||||||
2.75%, 07/25/2035 | 102,889 | 103,248 | ||||||
JP Morgan Mortgage Trust 2007-A2 | ||||||||
2.68%, 04/25/2037 | 659,782 | 559,505 | ||||||
JP Morgan Resecuritization Trust Series 2009-6 | ||||||||
2.70%, 09/26/2036 (Acquired 10/28/2013, Cost $352,469) (a) | 348,775 | 351,925 | ||||||
JP Morgan Resecuritization Trust Series 2010-4 | ||||||||
1.87%, 08/26/2035 (Acquired 10/28/2013, Cost $317,007) (a) | 317,551 | 317,028 | ||||||
JPMBB Commercial Mortgage Securities Trust | ||||||||
3.93%, 01/15/2047 | 15,000,000 | 14,997,428 | ||||||
KGS-Alpha SBA COOF Trust | ||||||||
0.60%, 05/25/2039 | 9,076,032 | 218,392 | ||||||
Ladder Capital Commercial Mortgage 2013-GCP Mortgage Trust | ||||||||
3.99%, 02/15/2036 (Acquired 10/28/2013, Cost $971,731) (a) | 1,027,000 | 936,515 | ||||||
LB-UBS Commercial Mortgage Trust 2004-C2 | ||||||||
4.37%, 03/15/2036 | 267,242 | 267,691 |
LB-UBS Commercial Mortgage Trust 2006-C1 | ||||||||
5.16%, 02/15/2031 | 516,000 | 551,107 | ||||||
LB-UBS Commercial Mortgage Trust 2006-C4 | ||||||||
5.84%, 06/15/2038 | 150,073 | 163,228 | ||||||
LB-UBS Commercial Mortgage Trust 2007-C1 | ||||||||
5.46%, 02/15/2040 | 490,000 | 539,176 | ||||||
LB-UBS Commercial Mortgage Trust 2007-C2 | ||||||||
0.54%, 02/15/2040 | 13,505,304 | 228,375 | ||||||
5.43%, 02/15/2040 | 633,304 | 697,651 | ||||||
Lehman Mortgage Trust 2006-2 | ||||||||
6.26%, 04/25/2036 | 151,467 | 143,563 | ||||||
Lehman Mortgage Trust 2007-6 | ||||||||
6.00%, 07/25/2037 | 142,141 | 121,097 | ||||||
Lehman Mortgage Trust 2008-2 | ||||||||
6.00%, 03/25/2038 | 739,678 | 676,241 | ||||||
LVII Resecuritization Trust 2009-2 | ||||||||
5.29%, 09/27/2037 (Acquired 10/28/2013, Cost $1,342,779) (a) | 1,296,000 | 1,335,198 | ||||||
LVII Resecuritization Trust 2009-3 | ||||||||
5.74%, 11/27/2037 (Acquired 10/28/2013, Cost $845,874) (a) | 826,000 | 843,773 | ||||||
5.74%, 11/27/2037 (Acquired 10/28/2013, Cost $1,063,021) (a) | 1,032,000 | 1,059,142 | ||||||
MASTR Adjustable Rate Mortgages Trust 2004-13 | ||||||||
2.65%, 04/21/2034 | 659,026 | 674,964 | ||||||
MASTR Adjustable Rate Mortgages Trust 2004-15 | ||||||||
2.89%, 12/25/2034 | 68,963 | 67,180 | ||||||
MASTR Adjustable Rate Mortgages Trust 2004-3 | ||||||||
2.35%, 04/25/2034 | 129,051 | 125,655 | ||||||
MASTR Alternative Loan Trust 2003-5 | ||||||||
6.00%, 08/25/2033 | 64,460 | 66,668 | ||||||
MASTR Alternative Loan Trust 2003-9 | ||||||||
6.00%, 12/25/2033 | 235,350 | 249,340 | ||||||
6.00%, 01/25/2034 | 41,712 | 42,834 | ||||||
MASTR Alternative Loan Trust 2004-1 | ||||||||
5.00%, 01/25/2019 | 81,514 | 83,245 | ||||||
MASTR Alternative Loan Trust 2004-10 | ||||||||
4.50%, 09/25/2019 | 44,864 | 45,774 | ||||||
MASTR Alternative Loan Trust 2004-2 | ||||||||
5.00%, 02/25/2019 | 5,030 | 5,191 |
MASTR Alternative Loan Trust 2004-3 | ||||||||
6.00%, 04/25/2034 | 401,425 | 415,888 | ||||||
6.25%, 04/25/2034 | 129,612 | 134,063 | ||||||
MASTR Alternative Loan Trust 2004-4 | ||||||||
5.00%, 04/25/2019 | 67,028 | 68,785 | ||||||
MASTR Alternative Loan Trust 2004-6 | ||||||||
0.00%, 07/25/2034 | 74,814 | 65,621 | ||||||
6.00%, 07/25/2034 | 42,920 | 44,045 | ||||||
MASTR Alternative Loan Trust 2004-7 | ||||||||
0.00%, 08/25/2034 | 66,935 | 51,676 | ||||||
MASTR Alternative Loan Trust 2004-8 | ||||||||
5.50%, 09/25/2019 | 177,511 | 184,793 | ||||||
MASTR Alternative Loan Trust 2005-6 | ||||||||
5.50%, 11/25/2020 | 168,882 | 165,540 | ||||||
MASTR Asset Securitization Trust | ||||||||
4.50%, 12/25/2018 | 16,313 | 16,652 | ||||||
MASTR Asset Securitization Trust 2003-12 | ||||||||
0.00%, 12/25/2033 | 18,943 | 16,475 | ||||||
5.00%, 12/25/2033 | 51,893 | 52,986 | ||||||
MASTR Asset Securitization Trust 2003-2 | ||||||||
4.50%, 03/25/2018 | 16,082 | 16,095 | ||||||
4.50%, 03/25/2018 | 51,053 | 51,094 | ||||||
5.00%, 03/25/2018 | 25,896 | 26,083 | ||||||
MASTR Asset Securitization Trust 2003-8 | ||||||||
5.50%, 09/25/2033 | 17,176 | 17,845 | ||||||
MASTR Asset Securitization Trust 2003-9 | ||||||||
0.00%, 10/25/2018 | 29,127 | 27,110 | ||||||
5.50%, 10/25/2033 | 31,277 | 31,867 | ||||||
MASTR Asset Securitization Trust 2004-1 | ||||||||
0.00%, 02/25/2034 | 15,217 | 12,905 | ||||||
MASTR Asset Securitization Trust 2004-4 | ||||||||
4.50%, 04/25/2019 | 3,260 | 3,344 | ||||||
5.25%, 12/26/2033 | 327,114 | 333,406 | ||||||
MASTR Asset Securitization Trust 2004-6 | ||||||||
0.00%, 07/25/2019 | 19,278 | 17,879 | ||||||
MASTR Asset Securitization Trust 2004-8 | ||||||||
0.00%, 08/25/2019 | 10,026 | 9,316 | ||||||
4.75%, 08/25/2019 | 45,922 | 47,132 |
MASTR Asset Securitization Trust 2004-9 | ||||||||
5.25%, 09/25/2019 | 61,998 | 63,961 | ||||||
MASTR Reperforming Loan Trust 2005-2 | ||||||||
0.51%, 05/25/2035 (Acquired 10/28/2013, Cost $1,343,067) (a) | 1,581,916 | 1,332,177 | ||||||
MASTR Reperforming Loan Trust 2006-2 | ||||||||
4.88%, 05/25/2036 (Acquired 10/28/2013, Cost $176,026) (a) | 189,471 | 180,496 | ||||||
Mastr Resecuritization Trust 2005-PO | ||||||||
0.00%, 05/28/2035 (Acquired 10/28/2013, Cost $196,564) (a) | 242,187 | 193,749 | ||||||
Merrill Lynch Mortgage Backed Securities Trust Series 2007-3 | ||||||||
1.29%, 06/25/2037 | 443,672 | 432,194 | ||||||
Merrill Lynch Mortgage Investors Trust Series 2003-A5 | ||||||||
2.36%, 08/25/2033 | 157,455 | 157,850 | ||||||
Merrill Lynch Mortgage Investors Trust Series MLCC 2003-E | ||||||||
0.78%, 10/25/2028 | 327,140 | 316,421 | ||||||
Merrill Lynch Mortgage Investors Trust Series MLCC 2003-F | ||||||||
0.80%, 10/25/2028 | 379,376 | 375,053 | ||||||
Merrill Lynch Mortgage Investors Trust Series MLCC 2004-1 | ||||||||
2.14%, 12/25/2034 | 307,865 | 306,403 | ||||||
Merrill Lynch Mortgage Investors Trust Series MLCC 2004-A | ||||||||
0.62%, 04/25/2029 | 147,844 | 138,575 | ||||||
Merrill Lynch Mortgage Investors Trust Series MLCC 2004-C | ||||||||
0.95%, 07/25/2029 | 338,542 | 333,849 | ||||||
Merrill Lynch Mortgage Investors Trust Series MLMI 2004-A4 | ||||||||
2.51%, 08/25/2034 | 268,092 | 272,433 | ||||||
Merrill Lynch Mortgage Investors Trust Series MLMI 2005-A2 | ||||||||
2.53%, 02/25/2035 | 516,548 | 507,820 | ||||||
Merrill Lynch Mortgage Trust 2005-CIP1 | ||||||||
5.05%, 07/12/2038 | 5,155,000 | 5,439,443 | ||||||
Merrill Lynch Mortgage Trust 2005-LC1 | ||||||||
5.29%, 01/12/2044 | 242,694 | 259,122 | ||||||
5.37%, 01/12/2044 | 343,000 | 367,590 | ||||||
Merrill Lynch Mortgage Trust 2005-MCP1 | ||||||||
4.67%, 06/12/2043 | 131,918 | 132,587 | ||||||
Merrill Lynch Mortgage Trust 2006-C1 | ||||||||
5.69%, 05/12/2039 | 227,000 | 246,563 |
ML Trust XLVII | ||||||||
8.99%, 10/20/2020 | 5,069 | 5,536 | ||||||
ML-CFC Commercial Mortgage Trust 2006-1 | ||||||||
5.47%, 02/12/2039 | 507,893 | 544,385 | ||||||
ML-CFC Commercial Mortgage Trust 2006-3 | ||||||||
5.41%, 07/12/2046 | 1,942,648 | 2,123,382 | ||||||
ML-CFC Commercial Mortgage Trust 2006-4 | ||||||||
0.21%, 12/12/2049 (Acquired 10/28/2013, Cost $482,394) (a) | 41,642,901 | 479,393 | ||||||
5.17%, 12/12/2049 | 5,275,000 | 5,718,928 | ||||||
ML-CFC Commercial Mortgage Trust 2007-9 | ||||||||
5.70%, 09/12/2049 | 639,000 | 709,994 | ||||||
Morgan Stanley Bank of America Merrill Lynch Trust 2012-C6 | ||||||||
2.86%, 11/15/2045 | 2,219,055 | 2,086,686 | ||||||
Morgan Stanley Bank of America Merrill Lynch Trust 2013-C13 | ||||||||
3.77%, 11/15/2046 | 10,000,000 | 9,890,360 | ||||||
Morgan Stanley Capital I Trust 2004-HQ4 | ||||||||
4.97%, 04/14/2040 | 317,123 | 320,999 | ||||||
Morgan Stanley Capital I Trust 2005-HQ7 | ||||||||
5.21%, 11/14/2042 | 8,125,000 | 8,545,501 | ||||||
Morgan Stanley Capital I Trust 2006-IQ12 | ||||||||
0.51%, 12/15/2043 (Acquired 10/28/2013, Cost $280,831) (a) | 21,093,908 | 272,660 | ||||||
Morgan Stanley Capital I Trust 2007-HQ11 | ||||||||
0.22%, 02/12/2044 (Acquired 10/28/2013, Cost $185,816) (a) | 38,462,322 | 197,311 | ||||||
5.42%, 02/12/2044 | 447,554 | 485,694 | ||||||
Morgan Stanley Capital I Trust 2007-HQ13 | ||||||||
0.41%, 12/15/2044 (Acquired 10/28/2013, Cost $140,585) (a) | 10,966,240 | 136,497 | ||||||
Morgan Stanley Capital I Trust 2007-IQ13 | ||||||||
0.42%, 03/15/2044 (Acquired 10/28/2013, Cost $387,378) (a) | 33,641,112 | 383,509 | ||||||
Morgan Stanley Capital I Trust 2011-C3 | ||||||||
4.05%, 07/15/2049 | 630,000 | 667,523 | ||||||
Morgan Stanley Capital I Trust 2012-C4 | ||||||||
2.99%, 03/15/2045 | 826,000 | 835,298 | ||||||
Morgan Stanley Mortgage Loan Trust 2004-3 | ||||||||
5.70%, 04/25/2034 | 574,219 | 597,852 | ||||||
Morgan Stanley Mortgage Loan Trust 2004-9 | ||||||||
5.31%, 10/25/2019 | 158,950 | 161,279 |
Morgan Stanley Reremic Trust | ||||||||
4.97%, 04/16/2040 (Acquired 10/28/2013, Cost $2,147,266) (a) | 2,112,760 | 2,127,463 | ||||||
0.25%, 07/27/2049 (Acquired 10/28/2013, Cost $979,748) (a) | 1,182,000 | 995,953 | ||||||
2.00%, 07/27/2049 (Acquired 10/28/2013, Cost $5,209,346) (a) | 5,173,751 | 5,215,141 | ||||||
1.00%, 03/27/2051 (Acquired 10/28/2013, Cost $2,086,003) (a) | 2,107,201 | 2,107,074 | ||||||
Morgan Stanley Re-REMIC Trust 2009-IO | ||||||||
0.00%, 07/17/2056 (Acquired 10/28/2013, Cost $976,576) (a) | 1,002,643 | 986,601 | ||||||
Morgan Stanley Re-REMIC Trust 2011-IO | ||||||||
2.50%, 03/23/2051 (Acquired 10/28/2013, Cost $720,340) (a) | 718,357 | 727,552 | ||||||
MortgageIT Trust 2005-1 | ||||||||
0.48%, 02/25/2035 | 201,574 | 192,096 | ||||||
MRFC Mortgage Pass-Through Trust Series 1999-TBC2 | ||||||||
0.64%, 06/15/2030 | 642,037 | 619,974 | ||||||
MRFC Mortgage Pass-Through Trust Series 2000-TBC3 | ||||||||
0.60%, 12/15/2030 | 135,016 | 131,800 | ||||||
Multi Security Asset Trust LP Commercial Mortgage-Backed Securities Pass-Through | ||||||||
5.00%, 11/28/2035 (Acquired 10/28/2013, Cost $70,697) (a) | 71,482 | 71,697 | ||||||
NACC Reperforming Loan REMIC Trust 2004-R2 | ||||||||
6.50%, 10/25/2034 (Acquired 10/28/2013, Cost $113,344) (a) | 110,826 | 113,268 | ||||||
NCUA Guaranteed Notes Trust 2010-C1 | ||||||||
2.65%, 10/29/2020 | 6,813,168 | 6,999,406 | ||||||
NCUA Guaranteed Notes Trust 2010-R3 | ||||||||
0.72%, 12/08/2020 | 2,644,170 | 2,660,035 | ||||||
2.40%, 12/08/2020 | 612,759 | 625,014 | ||||||
Nomura Asset Acceptance Corp Alternative Loan Trust Series 2003-A1 | ||||||||
5.00%, 04/25/2018 | 1,097 | 1,114 | ||||||
7.00%, 04/25/2033 | 14,365 | 14,888 | ||||||
5.50%, 05/25/2033 | 61,124 | 62,173 | ||||||
6.00%, 05/25/2033 | 27,822 | 28,356 | ||||||
Nomura Resecuritization Trust 2010-6R | ||||||||
2.56%, 03/26/2036 (Acquired 10/28/2013, Cost $213,658) (a) | 213,029 | 213,282 | ||||||
NorthStar 2012-1 Mortgage Trust | ||||||||
1.36%, 08/25/2029 (Acquired 10/28/2013, Cost $1,922,196) (a) | 1,922,508 | 1,923,228 | ||||||
NorthStar 2013-1 | ||||||||
2.01%, 08/25/2029 (Acquired 10/28/2013, Cost $1,818,551) (a) | 1,817,000 | 1,823,905 | ||||||
5.16%, 08/25/2029 (Acquired 10/28/2013 through 11/13/2013, Cost $1,079,003) (a) | 1,071,000 | 1,084,173 | ||||||
PaineWebber CMO Trust Series H | ||||||||
8.75%, 04/01/2018 | 242 | 243 |
PaineWebber CMO Trust Series P | ||||||||
8.50%, 08/01/2019 | 1,241 | 1,388 | ||||||
Prime Mortgage Trust 2004-CL1 | ||||||||
6.00%, 02/25/2034 | 253,516 | 267,016 | ||||||
Provident Funding Mortgage Loan Trust 2005-1 | ||||||||
2.66%, 05/25/2035 | 125,115 | 126,076 | ||||||
RALI Series 2001-QS19 Trust | ||||||||
6.00%, 12/25/2016 | 64,055 | 64,936 | ||||||
RALI Series 2002-QS16 Trust | ||||||||
16.28%, 10/25/2017 | 31,119 | 32,613 | ||||||
RALI Series 2002-QS8 Trust | ||||||||
6.25%, 06/25/2017 | 128,213 | 130,590 | ||||||
RALI Series 2003-QR19 Trust | ||||||||
5.75%, 10/25/2033 | 296,755 | 306,951 | ||||||
RALI Series 2003-QR24 Trust | ||||||||
4.00%, 07/25/2033 | 173,902 | 174,206 | ||||||
RALI Series 2003-QS1 Trust | ||||||||
4.25%, 01/25/2033 | 26,670 | 26,822 | ||||||
RALI Series 2003-QS13 Trust | ||||||||
4.00%, 07/25/2033 | 938,308 | 879,013 | ||||||
RALI Series 2003-QS14 Trust | ||||||||
5.00%, 07/25/2018 | 247,538 | 252,146 | ||||||
RALI Series 2003-QS15 Trust | ||||||||
5.50%, 08/25/2033 | 909,718 | 936,672 | ||||||
RALI Series 2003-QS18 Trust | ||||||||
5.00%, 09/25/2018 | 78,850 | 80,917 | ||||||
RALI Series 2003-QS19 Trust | ||||||||
5.75%, 10/25/2033 | 813,053 | 869,470 | ||||||
RALI Series 2003-QS3 Trust | ||||||||
16.14%, 02/25/2018 | 69,655 | 75,792 | ||||||
RALI Series 2003-QS9 Trust | ||||||||
7.39%, 05/25/2018 | 193,809 | 21,809 | ||||||
RALI Series 2004-QS6 Trust | ||||||||
5.00%, 05/25/2019 | 32,397 | 32,976 | ||||||
RALI Series 2004-QS7 Trust | ||||||||
5.50%, 05/25/2034 | 1,331,514 | 1,357,966 | ||||||
RALI Series 2005-QA6 Trust | ||||||||
3.72%, 05/25/2035 | 285,295 | 194,288 |
RALI Series 2007-QS1 Trust | ||||||||
6.00%, 01/25/2037 | 39,564 | 30,783 | ||||||
RBS Commercial Funding Inc 2013-SMV Trust | ||||||||
3.26%, 03/11/2031 (Acquired 10/28/2013, Cost $481,891) (a) | 512,000 | 469,020 | ||||||
RBSCF Trust 2010-RR3 | ||||||||
4.97%, 04/16/2040 (Acquired 10/28/2013, Cost $500,275) (a) | 492,230 | 497,542 | ||||||
RBSSP Resecuritization Trust 2009-1 | ||||||||
6.50%, 02/26/2036 (Acquired 10/28/2013, Cost $625,952) (a) | 594,644 | 626,525 | ||||||
RBSSP Resecuritization Trust 2009-12 | ||||||||
5.97%, 11/25/2033 (Acquired 10/28/2013, Cost $1,078,831) (a) | 1,034,630 | 1,080,035 | ||||||
RBSSP Resecuritization Trust 2009-2 | ||||||||
7.00%, 08/26/2037 (Acquired 10/28/2013, Cost $216,585) (a) | 207,916 | 216,378 | ||||||
RBSSP Resecuritization Trust 2009-6 | ||||||||
5.50%, 01/26/2021 (Acquired 10/28/2013, Cost $71,742) (a) | 71,290 | 71,572 | ||||||
RBSSP Resecuritization Trust 2009-9 | ||||||||
6.00%, 07/26/2037 (Acquired 10/28/2013, Cost $396,857) (a) | 392,262 | 396,868 | ||||||
RBSSP Resecuritization Trust 2010-12 | ||||||||
4.00%, 06/27/2021 (Acquired 10/28/2013, Cost $110,769) (a) | 109,697 | 110,675 | ||||||
RBSSP Resecuritization Trust 2010-9 | ||||||||
5.00%, 10/26/2034 (Acquired 10/28/2013, Cost $517,264) (a) | 490,032 | 516,272 | ||||||
4.00%, 05/26/2037 | 1,432,173 | 1,463,584 | ||||||
RBSSP Resecuritization Trust 2012-3 | ||||||||
0.31%, 09/26/2036 | 1,266,770 | 1,195,178 | ||||||
RCMC LLC | ||||||||
5.62%, 11/15/2044 (Acquired 10/28/2013, Cost $1,724,482) (a) | 1,721,754 | 1,723,328 | ||||||
Reperforming Loan REMIC Trust 2005-R1 | ||||||||
0.00%, 03/25/2035 (Acquired 10/28/2013, Cost $15,776) (a) | 17,776 | 15,570 | ||||||
Residential Asset Securitization Trust 2003-A13 | ||||||||
5.50%, 01/25/2034 | 64,515 | 66,431 | ||||||
Residential Asset Securitization Trust 2003-A14 | ||||||||
4.75%, 02/25/2019 | 5,773 | 5,912 | ||||||
Residential Asset Securitization Trust 2003-A8 | ||||||||
4.25%, 10/25/2018 | 112,165 | 114,606 | ||||||
Residential Asset Securitization Trust 2005-A2 | ||||||||
4.89%, 03/25/2035 | 1,657,978 | 263,930 | ||||||
Residential Asset Securitization Trust 2006-A4IP | ||||||||
6.00%, 05/25/2036 | 167,262 | 149,240 |
RFMSI Series 2003-S11 Trust | ||||||||
4.00%, 06/25/2018 | 3,730 | 3,762 | ||||||
RFMSI Series 2003-S13 Trust | ||||||||
5.50%, 06/25/2033 | 130,487 | 130,701 | ||||||
RFMSI Series 2003-S14 Trust | ||||||||
0.00%, 07/25/2018 | 19,844 | 18,509 | ||||||
RFMSI Series 2003-S16 Trust | ||||||||
5.00%, 09/25/2018 | 53,547 | 53,692 | ||||||
RFMSI Series 2003-S20 Trust | ||||||||
4.75%, 12/25/2018 | 93,082 | 94,877 | ||||||
RFMSI Series 2004-S6 Trust | ||||||||
0.00%, 06/25/2034 | 33,575 | 28,999 | ||||||
RFMSI Series 2005-S1 Trust | ||||||||
4.75%, 02/25/2020 | 58,128 | 59,638 | ||||||
RFMSI Series 2005-SA4 Trust | ||||||||
2.85%, 09/25/2035 | 167,072 | 138,223 | ||||||
RFSC Series 2003-RM2 Trust | ||||||||
0.00%, 05/25/2033 | 3,891 | 3,248 | ||||||
RMS Mortgage Asset Trust | ||||||||
4.70%, 10/25/2056 | 1,187,800 | 1,188,988 | ||||||
Salomon Brothers Mortgage Securities VII Inc | ||||||||
0.00%, 12/25/2018 | 9,753 | 8,762 | ||||||
7.00%, 06/25/2033 | 53,152 | 57,745 | ||||||
2.62%, 09/25/2033 | 459,812 | 462,563 | ||||||
Sequoia Mortgage Trust 2004-10 | ||||||||
0.47%, 11/20/2034 | 124,297 | 122,293 | ||||||
Sequoia Mortgage Trust 2004-11 | ||||||||
0.46%, 12/20/2034 | 417,298 | 404,489 | ||||||
Sequoia Mortgage Trust 2004-12 | ||||||||
0.67%, 01/20/2035 | 473,399 | 425,572 | ||||||
Sequoia Mortgage Trust 2004-8 | ||||||||
0.86%, 09/20/2034 | 2,207,474 | 2,062,273 | ||||||
1.13%, 09/20/2034 | 407,161 | 384,673 | ||||||
Springleaf Mortgage Loan Trust | ||||||||
1.27%, 06/25/2058 (Acquired 10/28/2013, Cost $2,141,438) (a) | 2,166,504 | 2,161,066 | ||||||
2.31%, 06/25/2058 (Acquired 10/28/2013, Cost $1,083,644) (a) | 1,121,000 | 1,084,479 | ||||||
3.14%, 06/25/2058 (Acquired 10/28/2013, Cost $794,168) (a) | 817,000 | 794,491 | ||||||
3.79%, 06/25/2058 (Acquired 10/28/2013, Cost $658,805) (a) | 688,000 | 653,887 |
Springleaf Mortgage Loan Trust 2011-1 | ||||||||
4.05%, 01/25/2058 (Acquired 10/28/2013, Cost $1,151,596) (a) | 1,104,742 | 1,148,104 | ||||||
5.45%, 01/25/2058 (Acquired 10/28/2013, Cost $1,533,883) (a) | 1,468,000 | 1,590,946 | ||||||
Springleaf Mortgage Loan Trust 2012-1 | ||||||||
2.67%, 09/25/2057 (Acquired 10/28/2013, Cost $628,850) (a) | 614,797 | 628,207 | ||||||
6.00%, 09/25/2057 (Acquired 10/28/2013, Cost $1,964,373) (a) | 1,873,000 | 1,963,439 | ||||||
Springleaf Mortgage Loan Trust 2012-2 | ||||||||
2.22%, 10/25/2057 (Acquired 10/28/2013, Cost $2,500,668) (a) | 2,457,556 | 2,503,573 | ||||||
6.00%, 10/25/2057 (Acquired 10/28/2013, Cost $1,787,878) (a) | 1,729,000 | 1,813,623 | ||||||
Springleaf Mortgage Loan Trust 2012-3 | ||||||||
1.57%, 12/25/2059 (Acquired 10/28/2013, Cost $3,055,483) (a) | 3,055,509 | 3,043,480 | ||||||
2.66%, 12/25/2059 (Acquired 10/28/2013, Cost $985,312) (a) | 996,000 | 985,533 | ||||||
3.56%, 12/25/2059 (Acquired 10/28/2013, Cost $571,602) (a) | 584,000 | 571,826 | ||||||
4.44%, 12/25/2059 (Acquired 10/28/2013, Cost $493,698) (a) | 496,000 | 495,913 | ||||||
5.30%, 12/25/2059 (Acquired 10/28/2013, Cost $223,178) (a) | 221,000 | 223,140 | ||||||
Springleaf Mortgage Loan Trust 2013-2 | ||||||||
1.78%, 12/25/2065 (Acquired 10/28/2013, Cost $2,221,960) (a) | 2,232,898 | 2,226,628 | ||||||
3.52%, 12/25/2065 (Acquired 10/28/2013, Cost $875,761) (a) | 899,000 | 884,078 | ||||||
Springleaf Mortgage Loan Trust 2013-3 | ||||||||
3.79%, 09/25/2057 (Acquired 10/28/2013, Cost $1,261,673) (a) | 1,262,000 | 1,261,778 | ||||||
Structured Adjustable Rate Mortgage Loan Trust | ||||||||
4.81%, 06/25/2034 | 277,863 | 276,600 | ||||||
Structured Asset Mortgage Investments II Trust 2004-AR5 | ||||||||
0.82%, 10/19/2034 | 328,113 | 312,093 | ||||||
Structured Asset Mortgage Investments II Trust 2005-AR5 | ||||||||
0.41%, 07/19/2035 | 1,422,880 | 1,392,740 | ||||||
Structured Asset Sec Corp Mort Pas Thr Certs Se 2003 29 | ||||||||
4.75%, 09/25/2018 | 161,101 | 164,772 | ||||||
Structured Asset Sec Corp Mort Pas Thr Certs Ser 2003 30 | ||||||||
5.50%, 10/25/2033 | 59,915 | 62,141 | ||||||
Structured Asset Sec Corp Mort Pas Thr Certs Ser 2003-16 | ||||||||
0.66%, 06/25/2033 | 147,894 | 144,656 | ||||||
Structured Asset Sec Corp Mort Pass Th Certs Ser 2003-32 | ||||||||
5.52%, 11/25/2033 | 48,422 | 49,430 | ||||||
Structured Asset Securities Corp | ||||||||
3.54%, 12/25/2033 | 443,940 | 441,240 | ||||||
5.49%, 02/25/2034 | 443,866 | 468,063 | ||||||
0.51%, 06/25/2035 (Acquired 10/28/2013, Cost $123,807) (a) | 152,836 | 123,212 |
Structured Asset Securities Corp Mort Pas Thr Ce Se 2002 17 | ||||||||
6.07%, 09/25/2032 | 47,553 | 47,388 | ||||||
Structured Asset Securities Corp Mort Pass Thru Ser 2004-5H | ||||||||
5.54%, 12/25/2033 | 1,033,926 | 1,063,413 | ||||||
Structured Asset Securities Corp Mortgage Pass-Through Ctfs Ser 2003-33H | ||||||||
5.50%, 10/25/2033 | 488,409 | 499,708 | ||||||
Structured Asset Securities Corp Mortgage Pass-Through Ctfs Ser 2003-34A | ||||||||
2.49%, 11/25/2033 | 141,920 | 140,772 | ||||||
Structured Asset Securities Corp Trust 2005-6 | ||||||||
5.00%, 05/25/2035 | 132,422 | 133,181 | ||||||
Thornburg Mortgage Securities Trust 2003-4 | ||||||||
0.80%, 09/25/2043 | 223,436 | 214,374 | ||||||
Thornburg Mortgage Securities Trust 2004-4 | ||||||||
1.98%, 12/25/2044 | 96,900 | 96,072 | ||||||
TIAA Seasoned Commercial Mortgage Trust 2007-C4 | ||||||||
5.55%, 08/15/2039 | 1,456,226 | 1,496,356 | ||||||
UBS Commercial Mortgage Trust 2012-C1 | ||||||||
2.33%, 05/10/2045 (Acquired 10/28/2013, Cost $268,442) (a) | 2,021,398 | 262,220 | ||||||
UBS-BAMLL Trust | ||||||||
3.66%, 06/10/2030 (Acquired 10/28/2013, Cost $1,756,511) (a) | 1,787,000 | 1,697,755 | ||||||
UBS-Barclays Commercial Mortgage Trust 2012-C2 | ||||||||
1.79%, 05/10/2063 (Acquired 10/28/2013, Cost $706,437) (a) | 7,737,515 | 687,633 | ||||||
3.53%, 05/10/2063 | 1,073,000 | 1,060,621 | ||||||
UBS-Barclays Commercial Mortgage Trust 2013-C6 | ||||||||
3.24%, 04/10/2046 | 271,000 | 259,224 | ||||||
Vendee Mortgage Trust 1993-1 | ||||||||
7.25%, 02/15/2023 | 867,295 | 1,004,978 | ||||||
Vendee Mortgage Trust 1994-1 | ||||||||
5.62%, 02/15/2024 | 184,515 | 202,789 | ||||||
6.50%, 02/15/2024 | 613,994 | 675,010 | ||||||
Vendee Mortgage Trust 1996-1 | ||||||||
6.75%, 02/15/2026 | 259,869 | 297,496 | ||||||
Vendee Mortgage Trust 1996-2 | ||||||||
6.75%, 06/15/2026 | 123,229 | 142,108 |
Vendee Mortgage Trust 1997-1 | ||||||||
7.50%, 02/15/2027 | 368,019 | 433,402 | ||||||
Vendee Mortgage Trust 1998-1 | ||||||||
7.00%, 03/15/2028 | 248,294 | 287,439 | ||||||
Vericrest Opportunity Loan Transferee | ||||||||
3.10%, 11/25/2050 (Acquired 10/28/2013, Cost $1,494,558) (a) | 1,484,227 | 1,494,910 | ||||||
VFC 2013-1 LLC | ||||||||
3.13%, 03/20/2026 (Acquired 10/28/2013, Cost $410,502) (a) | 408,465 | 410,882 | ||||||
VNDO 2012-6AVE Mortgage Trust | ||||||||
3.00%, 11/15/2030 (Acquired 10/28/2013, Cost $1,225,637) (a) | 1,283,000 | 1,196,346 | ||||||
VNDO 2013-PENN Mortgage Trust | ||||||||
3.81%, 12/13/2029 (Acquired 12/5/2013, Cost $2,574,595) (a) | 2,500,000 | 2,555,798 | ||||||
Wachovia Bank Commercial Mortgage Trust Series 2004-C11 | ||||||||
5.22%, 01/15/2041 | 652,677 | 653,023 | ||||||
Wachovia Bank Commercial Mortgage Trust Series 2005-C22 | ||||||||
5.29%, 12/15/2044 | 6,670,409 | 7,100,657 | ||||||
Wachovia Bank Commercial Mortgage Trust Series 2006-C24 | ||||||||
0.10%, 03/15/2045 (Acquired 10/28/2013, Cost $305,961) (a) | 96,718,004 | 305,435 | ||||||
Wachovia Bank Commercial Mortgage Trust Series 2007-C32 | ||||||||
5.75%, 06/15/2049 | 7,423,835 | 8,192,009 | ||||||
WaMu Mortgage Pass-Through Certificates Series 2003-AR11 Trust | ||||||||
2.45%, 10/25/2033 | 739,839 | 744,036 | ||||||
WaMu Mortgage Pass-Through Certificates Series 2003-AR7 Trust | ||||||||
2.30%, 08/25/2033 | 261,857 | 262,643 | ||||||
WaMu Mortgage Pass-Through Certificates Series 2003-AR9 Trust | ||||||||
2.42%, 09/25/2033 | 1,344,692 | 1,356,818 | ||||||
2.44%, 09/25/2033 | 281,822 | 282,520 | ||||||
WaMu Mortgage Pass-Through Certificates Series 2003-S1 Trust | ||||||||
5.50%, 04/25/2033 | 233,561 | 236,959 | ||||||
WaMu Mortgage Pass-Through Certificates Series 2003-S10 | ||||||||
5.00%, 10/25/2018 | 26,201 | 26,946 | ||||||
WaMu Mortgage Pass-Through Certificates Series 2003-S13 Trust | ||||||||
0.71%, 12/25/2018 | 70,768 | 69,133 | ||||||
WaMu Mortgage Pass-Through Certificates Series 2003-S4 | ||||||||
17.01%, 06/25/2033 | 74,617 | 89,211 | ||||||
WaMu Mortgage Pass-Through Certificates Series 2003-S8 Trust | ||||||||
4.50%, 09/25/2018 | 148,983 | 152,631 | ||||||
4.50%, 09/25/2018 | 47,985 | 49,195 |
WaMu Mortgage Pass-Through Certificates Series 2003-S9 Trust | ||||||||
0.00%, 10/25/2033 | 24,683 | 21,227 | ||||||
5.25%, 10/25/2033 | 1,020,260 | 1,056,605 | ||||||
WaMu Mortgage Pass-Through Certificates Series 2004-AR3 Trust | ||||||||
2.45%, 06/25/2034 | 354,150 | 355,922 | ||||||
2.45%, 06/25/2034 | 455,042 | 457,318 | ||||||
WaMu Mortgage Pass-Through Certificates Series 2004-CB1 Trust | ||||||||
5.00%, 06/25/2019 | 127,581 | 131,485 | ||||||
WaMu Mortgage Pass-Through Certificates Series 2004-CB2 Trust | ||||||||
5.00%, 07/25/2019 | 153,120 | 157,126 | ||||||
5.50%, 08/25/2019 | 322,945 | 334,649 | ||||||
6.00%, 08/25/2034 | 1,743,949 | 1,825,036 | ||||||
WaMu Mortgage Pass-Through Certificates Series 2004-CB3 Trust | ||||||||
5.50%, 10/25/2019 | 55,297 | 58,036 | ||||||
6.00%, 10/25/2019 | 46,840 | 49,127 | ||||||
6.50%, 10/25/2034 | 965,837 | 1,040,230 | ||||||
WaMu Mortgage Pass-Through Certificates Series 2004-CB4 Trust | ||||||||
5.50%, 12/25/2019 | 81,986 | 85,442 | ||||||
WaMu Mortgage Pass-Through Certificates Series 2004-RS2 | ||||||||
5.00%, 11/25/2033 | 146,641 | 146,690 | ||||||
WaMu Mortgage Pass-Through Certificates Series 2004-S1 Trust | ||||||||
0.56%, 03/25/2034 | 10,441 | 10,388 | ||||||
WaMu Mortgage Pass-Through Certificates Series 2004-S2 Trust | ||||||||
5.50%, 06/25/2034 | 916,501 | 954,913 | ||||||
WaMu Mortgage Pass-Through Certificates Series 2004-S3 Trust | ||||||||
5.00%, 07/25/2034 | 257,481 | 265,323 | ||||||
WaMu Mortgage Pass-Through Certificates Series 2006-AR10 Trust | ||||||||
2.38%, 09/25/2036 | 33,131 | 25,307 | ||||||
WaMu Mortgage Pass-Through Certificates Series 2006-AR8 Trust | ||||||||
2.40%, 08/25/2046 | 154,631 | 133,461 | ||||||
Washington Mutual Mortgage Pass-Through Certificates WMALT Series 2005-1 Trust | ||||||||
0.00%, 03/25/2035 | 31,722 | 20,276 | ||||||
5.50%, 03/25/2035 | 384,022 | 371,774 | ||||||
Washington Mutual Mortgage Pass-Through Certificates WMALT Series 2005-2 Trust | ||||||||
4.84%, 04/25/2035 | 414,047 | 51,258 | ||||||
4.89%, 04/25/2035 | 1,813,932 | 256,316 |
Washington Mutual Mortgage Pass-Through Certificates WMALT Series 2005-4 Trust | ||||||||
5.50%, 06/25/2035 | 633,076 | 583,938 | ||||||
5.50%, 06/25/2035 | 617,984 | 156,519 | ||||||
Washington Mutual Mortgage Pass-Through Certificates WMALT Series 2005-6 Trust | ||||||||
5.50%, 08/25/2035 | 136,071 | 124,664 | ||||||
Washington Mutual Mortgage Pass-Through Certificates WMALT Series 2006-1 Trust | ||||||||
5.75%, 02/25/2036 | 57,244 | 48,363 | ||||||
Washington Mutual MSC Mortgage Pass-Through Certificates Series 2003-MS5 Trust | ||||||||
0.66%, 03/25/2018 | 25,174 | 24,775 | ||||||
Washington Mutual MSC Mortgage Pass-Through Certificates Series 2003-MS7 Trust | ||||||||
0.00%, 03/25/2033 | 4,010 | 2,971 | ||||||
Wells Fargo Alternative Loan 2003-1 Trust | ||||||||
0.00%, 09/25/2033 | 23,986 | 22,181 | ||||||
Wells Fargo Alternative Loan 2007-PA3 Trust | ||||||||
5.75%, 07/25/2037 | 78,433 | 70,044 | ||||||
Wells Fargo Commercial Mortgage Trust 2013-120B | ||||||||
2.71%, 03/18/2028 (Acquired 10/28/2013, Cost $1,513,553) (a) | 1,548,000 | 1,495,442 | ||||||
Wells Fargo Mortgage Backed Securities 2003-K Trust | ||||||||
2.49%, 11/25/2033 | 534,333 | 540,789 | ||||||
2.49%, 11/25/2033 | 20,498 | 20,915 | ||||||
Wells Fargo Mortgage Backed Securities 2003-L Trust | ||||||||
2.53%, 11/25/2033 | 93,954 | 92,160 | ||||||
Wells Fargo Mortgage Backed Securities 2004-4 Trust | ||||||||
5.50%, 05/25/2034 | 121,756 | 126,695 | ||||||
Wells Fargo Mortgage Backed Securities 2004-B Trust | ||||||||
4.47%, 02/25/2034 | 161,988 | 161,540 | ||||||
Wells Fargo Mortgage Backed Securities 2004-BB Trust | ||||||||
2.62%, 01/25/2035 | 10,115 | 10,113 | ||||||
Wells Fargo Mortgage Backed Securities 2004-EE Trust | ||||||||
2.61%, 12/25/2034 | 476,090 | 479,689 | ||||||
2.61%, 12/25/2034 | 323,879 | 327,577 | ||||||
2.70%, 12/25/2034 | 476,239 | 478,005 | ||||||
2.70%, 12/25/2034 | 155,449 | 156,691 | ||||||
Wells Fargo Mortgage Backed Securities 2004-I Trust | ||||||||
2.65%, 07/25/2034 | 672,218 | 671,551 | ||||||
Wells Fargo Mortgage Backed Securities 2004-P Trust | ||||||||
2.61%, 09/25/2034 | 2,041,449 | 2,060,793 |
Wells Fargo Mortgage Backed Securities 2004-V Trust | ||||||||
2.63%, 10/25/2034 | 340,394 | 348,987 | ||||||
2.63%, 10/25/2034 | 436,588 | 443,810 | ||||||
Wells Fargo Mortgage Backed Securities 2005-1 Trust | ||||||||
5.00%, 01/25/2020 | 234,579 | 241,492 | ||||||
Wells Fargo Mortgage Backed Securities 2005-13 Trust | ||||||||
5.00%, 11/25/2020 | 136,069 | 139,638 | ||||||
Wells Fargo Mortgage Backed Securities 2005-14 Trust | ||||||||
0.00%, 12/25/2035 | 47,448 | 35,458 | ||||||
5.50%, 12/25/2035 | 227,547 | 235,991 | ||||||
Wells Fargo Mortgage Backed Securities 2005-AR8 Trust | ||||||||
2.66%, 06/25/2035 | 445,894 | 451,920 | ||||||
Wells Fargo Mortgage Backed Securities 2007-11 Trust | ||||||||
6.00%, 08/25/2037 | 584,956 | 551,782 | ||||||
Wells Fargo Mortgage Backed Securities 2007-7 Trust | ||||||||
6.00%, 06/25/2037 | 109,772 | 104,692 | ||||||
Wells Fargo Mortgage Backed Securities 2007-9 Trust | ||||||||
5.50%, 07/25/2037 | 543,457 | 553,489 | ||||||
Wells Fargo Mortgage Loan 2012-RR1 Trust | ||||||||
2.85%, 08/27/2037 (Acquired 10/28/2013, Cost $1,025,104) (a) | 1,019,792 | 1,024,794 | ||||||
Wells Fargo Resecuritization Trust 2012-IO | ||||||||
1.75%, 08/20/2021 (Acquired 10/28/2013, Cost $2,672,173) (a) | 2,678,869 | 2,662,796 | ||||||
WFRBS Commercial Mortgage Trust 2011-C3 | ||||||||
4.38%, 03/15/2044 (Acquired 10/28/2013, Cost $1,133,548) (a) | 1,059,000 | 1,114,267 | ||||||
WFRBS Commercial Mortgage Trust 2012-C6 | ||||||||
1.08%, 04/15/2045 | 224,528 | 224,965 | ||||||
3.44%, 04/15/2045 | 2,383,780 | 2,375,184 | ||||||
|
| |||||||
| Total Mortgage Backed Obligations (Cost $2,291,832,425) | $ | 2,273,449,377 | ||||||
|
| |||||||
| Total Bonds & Notes (Cost $5,576,596,886) | $ | 5,525,782,287 | ||||||
|
| |||||||
SHORT-TERM INVESTMENTS - 9.64% | ||||||||
Money Market Funds - 9.64% | ||||||||
Fidelity Institutional Money Market Fund, 0.01% (d) | $ | 282,949,260 | $ | 282,949,260 | ||||
Goldman Sachs Financial Square Fund, 0.01% (d) | 282,949,260 | 282,949,260 | ||||||
|
| |||||||
Total Short-Term Investments (Cost $565,898,520) | $ | 565,898,520 | ||||||
|
| |||||||
TOTAL INVESTMENTS IN SECURITIES - 103.71% | ||||||||
(Cost $6,142,495,406) | $ | 6,091,680,807 | ||||||
LIABILITIES IN EXCESS OF OTHER ASSETS - (3.71)% | (217,926,680 | ) | ||||||
|
| |||||||
TOTAL NET ASSETS - 100.00% | $ | 5,873,754,127 | ||||||
|
|
| (a) | Includes restricted securities as defined in Rule 144(A) under the Securities Act of 1933. The value of these securities total $534,455,098, which represents 9.10% of total net assets. |
| (b) | Includes restricted securities as defined in Rule 144(A) under the Securities Act of 1933 that are treated as illiquid by the Adviser. The value of these securities total $3,018,082, which represents 0.05% of total net assets. |
| (c) | Partially assigned as collateral for certain futures contracts. |
| (d) | Partially assigned as collateral for certain delayed delivery securities. |
Bridge Builder Bond Fund
Schedule of Open Futures Contracts
12/31/2013 (Unaudited)
| Number of Contracts Purchased (Sold) | Description | Settlement Month | Notional Amount | Value | Cumulative Appreciation (Depreciation) | |||||||||||||
| 393 | U.S. 5 Year Note Future | March 2014 | $ | 47,211,086 | $ | 46,889,813 | $ | (321,273 | ) | |||||||||
| 54 | U.S. 2 Year Note Future | March 2014 | 11,879,129 | 11,869,875 | (9,254 | ) | ||||||||||||
| (334 | ) | U.S. 10 Year Note Future | March 2014 | 41,709,769 | 41,097,656 | 612,113 | ||||||||||||
| 42 | U.S. Long Bond Future | March 2014 | 5,403,614 | 5,389,125 | (14,489 | ) | ||||||||||||
| (372 | ) | U.S. Ultra Bond Future | March 2014 | 51,162,225 | 50,685,000 | 477,225 | ||||||||||||
|
|
|
|
|
| |||||||||||||
| $ | 157,365,823 | $ | 155,931,469 | $ | 744,322 | |||||||||||||
|
|
|
|
|
| |||||||||||||
(b) Not Applicable
Item 7. Disclosure of Proxy Voting Policies and Procedures for Closed-End Management Investment Companies.
Not applicable to open-end investment companies.
Item 8. Portfolio Managers of Closed-End Management Investment Companies.
Not applicable to open-end investment companies.
Item 9. Purchases of Equity Securities by Closed-End Management Investment Company and Affiliated Purchasers.
Not applicable to open-end investment companies.
Item 10. Submission of Matters to a Vote of Security Holders.
There have been no material changes to the procedures by which shareholders may recommend nominees to the registrant’s board of trustees.
Item 11. Controls and Procedures.
| (a) | The Registrant’s President and Treasurer have reviewed the Registrant’s disclosure controls and procedures (as defined in Rule 30a-3(c) under the Investment Company Act of 1940 (the “Act”)) as of a date within 90 days of the filing of this report, as required by Rule 30a-3(b) under the Act and Rules 13a-15(b) or 15d-15(b) under the Securities Exchange Act of 1934. Based on their review, such officers have concluded that the disclosure controls and procedures are effective in ensuring that information required to be disclosed in this report is appropriately recorded, processed, summarized and reported and made known to them by others within the Registrant and by the Registrant’s service provider. |
| (b) | There were no changes in the Registrant’s internal control over financial reporting (as defined in Rule 30a-3(d) under the Act) that occurred during the second fiscal quarter of the period covered by this report that has materially affected, or is reasonably likely to materially affect, the Registrant’s internal control over financial reporting. |
Item 12. Exhibits.
| (a) | (1) Any code of ethics or amendment thereto, that is the subject of the disclosure required by Item 2, to the extent that the registrant intends to satisfy Item 2 requirements through filing an exhibit. Not Applicable. |
(2) A separate certification for each principal executive and principal financial officer pursuant to Section 302 of the Sarbanes-Oxley Act of 2002. Filed herewith.
(3) Any written solicitation to purchase securities under Rule 23c-1 under the Act sent or given during the period covered by the report by or on behalf of the registrant to 10 or more persons. Not applicable to open-end investment companies.
| (b) | Certifications pursuant to Section 906 of the Sarbanes-Oxley Act of 2002. Furnished herewith. |
SIGNATURES
Pursuant to the requirements of the Securities Exchange Act of 1934 and the Investment Company Act of 1940, the registrant has duly caused this report to be signed on its behalf by the undersigned, thereunto duly authorized.
| (Registrant) Bridge Builder Trust | ||
| By (Signature and Title)* | /s/ Joseph Neuberger | |
| Joseph Neuberger, President | ||
| Date 3/3/2014 | ||
Pursuant to the requirements of the Securities Exchange Act of 1934 and the Investment Company Act of 1940, this report has been signed below by the following persons on behalf of the registrant and in the capacities and on the dates indicated.
| By (Signature and Title)* | /s/ Joseph Neuberger | |
| Joseph Neuberger, President | ||
| Date 3/3/2014 | ||
| By (Signature and Title)* | /s/ Jason Hadler | |
| Jason Hadler, Treasurer | ||
| Date 3/3/2014 | ||
| * | Print the name and title of each signing officer under his or her signature. |