Exhibit 99.2

August 2024 Q2 s& H1/2024 Investors Call

FORWARD - LOOKING STATEMENT This presentation is not intended to provide investment or medical advice. It should be noted that some products under develo pme nt described herein have not been found safe or effective by any regulatory agency and are not approved for any use outside of clinical tr ial s. This presentation contains forward - looking statements, which express the current beliefs and expectations of Kamada’s management. Such statements include 2024 financial guidance; 5 - year growth strategy and plans for double digit growth; progression of inhaled AAT clinical study, its benefits and potential market size and potential FDA's feedback during H2/2024; success in being a pioneer in areas of li mit ed treatment alternatives; expansion to new markets, mainly MENA region; growth prospects, product introductions and revenue projections f or KedRAB , Cytogam , Israeli distribution business segment and U.S. plasma segment; success in identify and integrating M&A targets for growth. Th ese statements involve a number of known and unknown risks and uncertainties that could cause Kamada's future results, performance or achievements to differ significantly from the projected results, performances or achievements expressed or implied by such fo rwa rd - looking statements. Important factors that could cause or contribute to such differences include, but are not limited to, risks relat ing to Kamada's ability to successfully develop and commercialize its products and product candidates, progress and results of any clinical t ria ls, introduction of competing products, continued market acceptance of Kamada’s commercial products portfolio, impact of geo - political environment in the middle east, impact of any changes in regulation and legislation that could affect the pharmaceutical industry, difficulty in pr edicting, obtaining or maintaining U.S. Food and Drug Administration, European Medicines Agency and other regulatory authority approvals, restrai ns related to third parties’ IP rights and changes in the health policies and structures of various countries, success of M&A strategies, e nvi ronmental risks, changes in the worldwide pharmaceutical industry and other factors that are discussed under the heading “Risk Factors” of Kamada’s 2023 Annual Report on Form 20 - F (filed on March 6, 2024), as well as in Kamada’s recent Forms 6 - K filed with the U.S. Securities and Exchange Commission. This presentation includes certain non - IFRS financial information, which is not intended to be considered in isolation or as a s ubstitute for, or superior to, the financial information prepared and presented in accordance with IFRS. The non - IFRS financial measures may be ca lculated differently from, and therefore may not be comparable to, similarly titled measures used by other companies. In accordance wi th the requirement of the SEC regulations a reconciliation of these non - IFRS financial measures to the comparable IFRS measures is incl uded in an appendix to this presentation. Management uses these non - IFRS financial measures for financial and operational decision - making a nd as a means to evaluate period - to - period comparisons. Management believes that these non - IFRS financial measures provide meaningful supplemental information regarding Kamada’s performance and liquidity. Forward - looking statements speak only as of the date they are made, and Kamada undertakes no obligation to update any forward - lo oking statement to reflect the impact of circumstances or events that arise after the date the forward - looking statement was made, exc ept as required by applicable law. 2

KEDRAB® CYTOGAM® HEPGAM B® VARIZIG® WINRHO® GLASSIA® KAMADA - A GROWING GLOBAL COMMERCIAL - STAGE BIOPHARMACEUTICAL COMPANY 6 FDA - Approved Products 16 % CAGR (from 2021) $ 158 - 162M 2024 Revenues Guidance $ 28 - 32M 2024 Adj. EBIDTA Guidance 4 Pillars of Growth LEADER IN SPECIALTY PLASMA THERAPIES, FOCUSED ON DISEASES WITH LIMITED TREATMENT ALTERNATIVES $ 56.6 M Cash (Q 2 / 2024 ) 3 Organic Growth M&A Transactions Inhaled AAT Pivotal Study Plasma Collection Centers

DELIVERING ON OUR COMMITMENTS 4

KAMADA ’ S ROADMAP FOR ANNUAL DOUBLE - DIGIT GROWTH 5 Organic Growth Portfolio of 6 FDA - approved products; Over 30 territories M&A Transactions Support growth through M&A transactions Plasma Collection Centers Each new collection center contributes annual revenues of $8M - $10M Inhaled AAT Phase III pivotal clinical study, targeting a market of over $2B
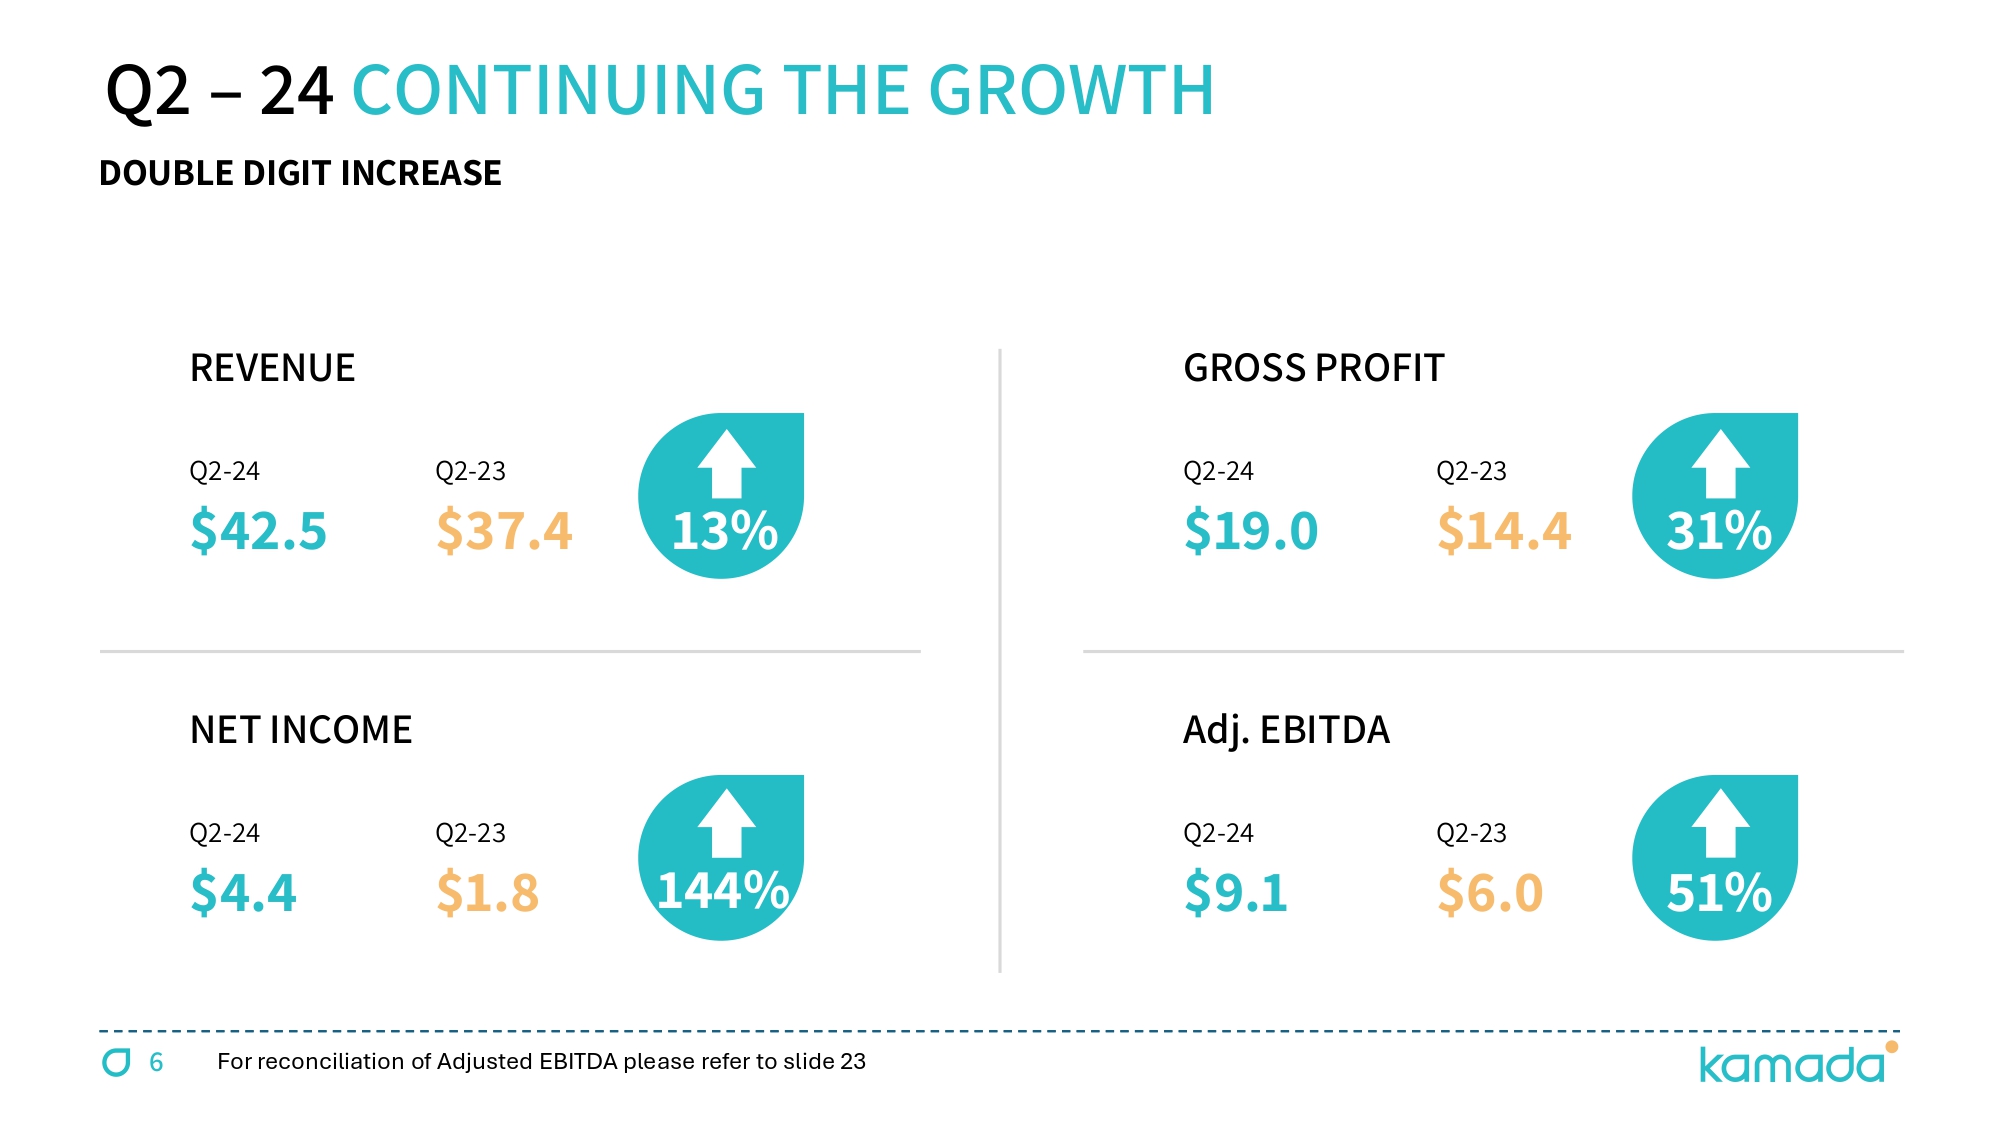
Q 2 – 24 CONTINUING THE GROWTH REVENUE Q 2 - 24 $42.5 Q 2 - 23 $ 37.4 13% NET INCOME Q 2 - 24 $ 4.4 Q 2 - 23 $1.8 144 % GROSS PROFIT Q 2 - 24 $19.0 Q 2 - 23 $ 14.4 31 % Adj. EBITDA Q 2 - 24 $ 9.1 Q 2 - 23 $6.0 51 % DOUBLE DIGIT INCREASE 6 For reconciliation of Adjusted EBITDA please refer to slide 23
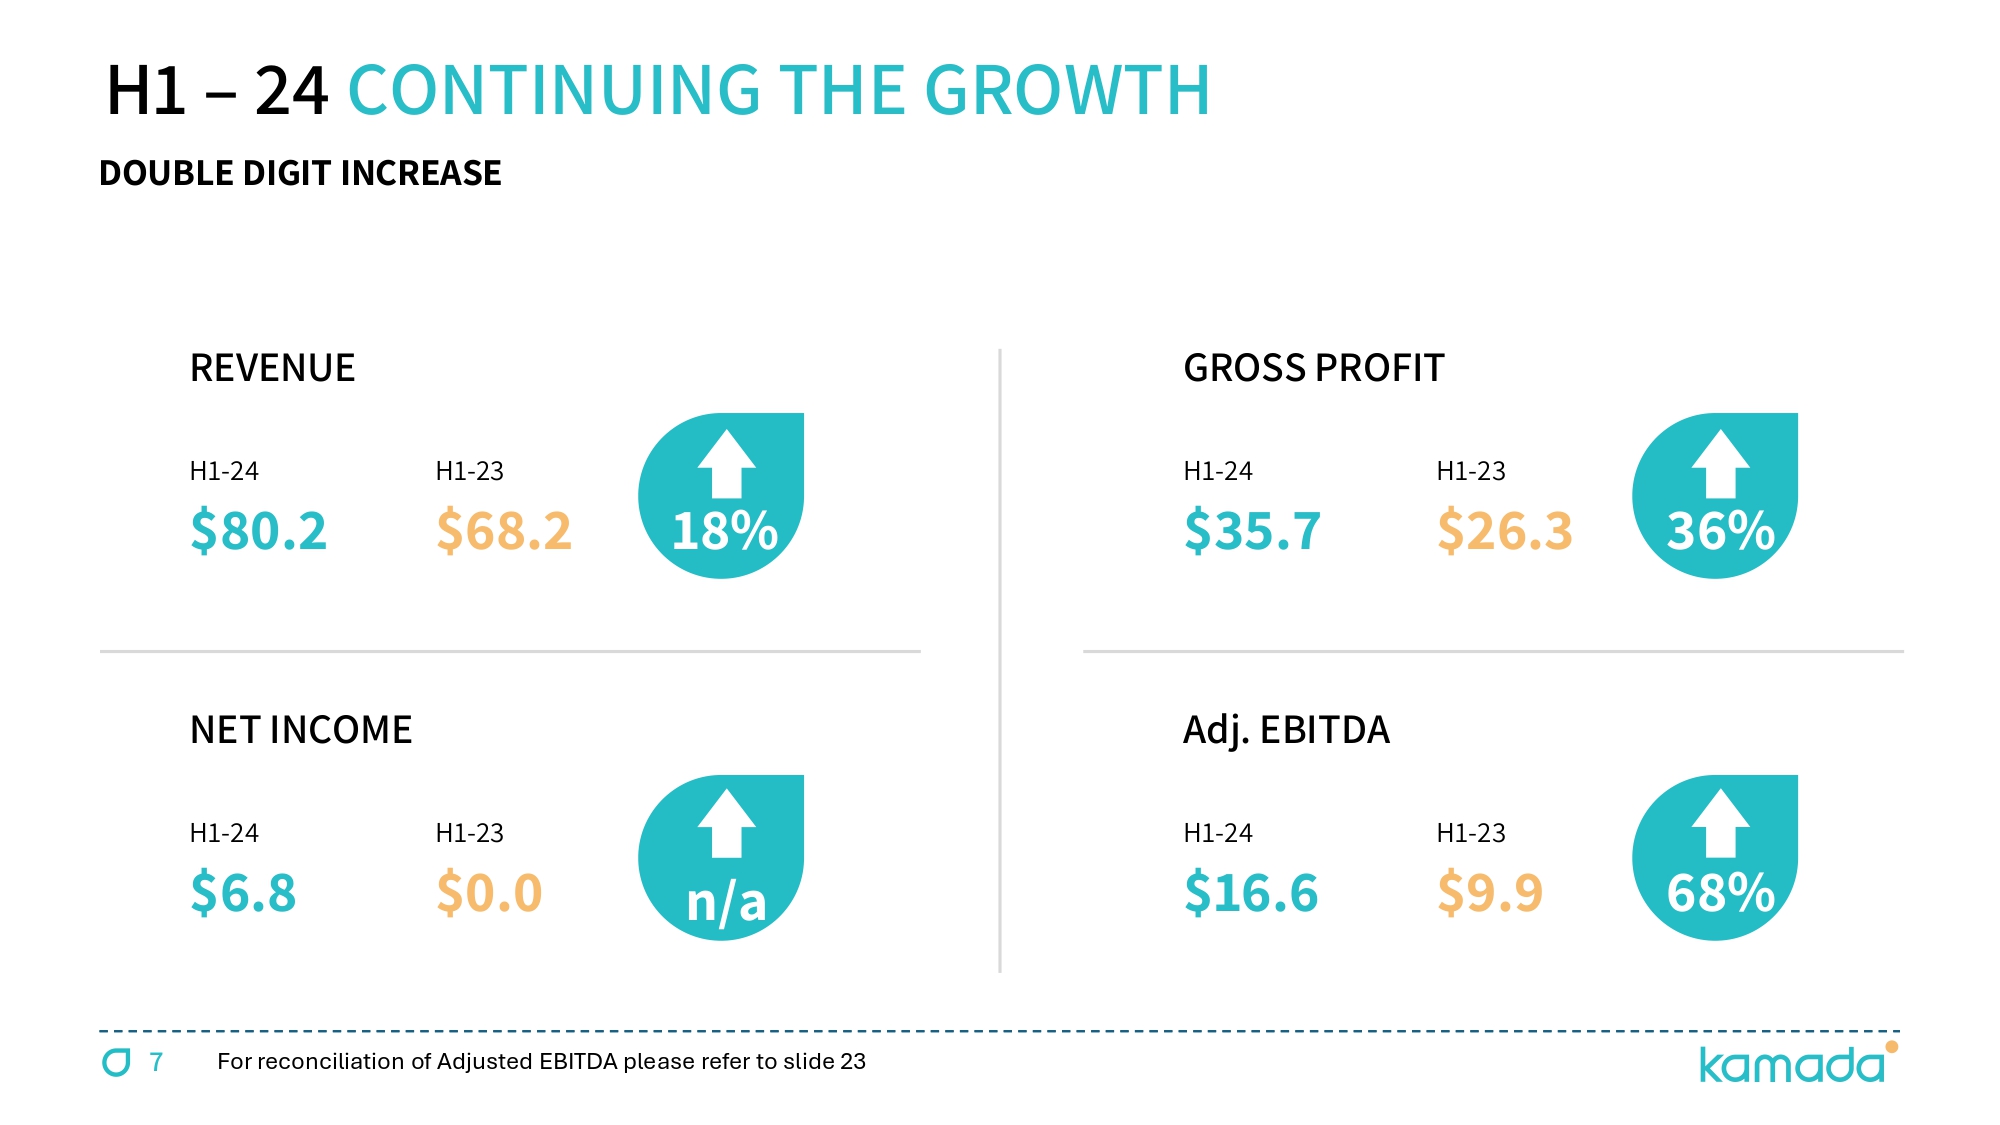
7 REVENUE H 1 - 24 $80.2 H 1 - 23 $ 68.2 18 % NET INCOME H 1 - 24 $ 6.8 H 1 - 23 $0.0 n/a GROSS PROFIT H 1 - 24 $35.7 H 1 - 23 $ 26.3 36 % Adj. EBITDA H 1 - 24 $ 16.6 H 1 - 23 $9.9 68 % DOUBLE DIGIT INCREASE H 1 – 24 CONTINUING THE GROWTH For reconciliation of Adjusted EBITDA please refer to slide 23
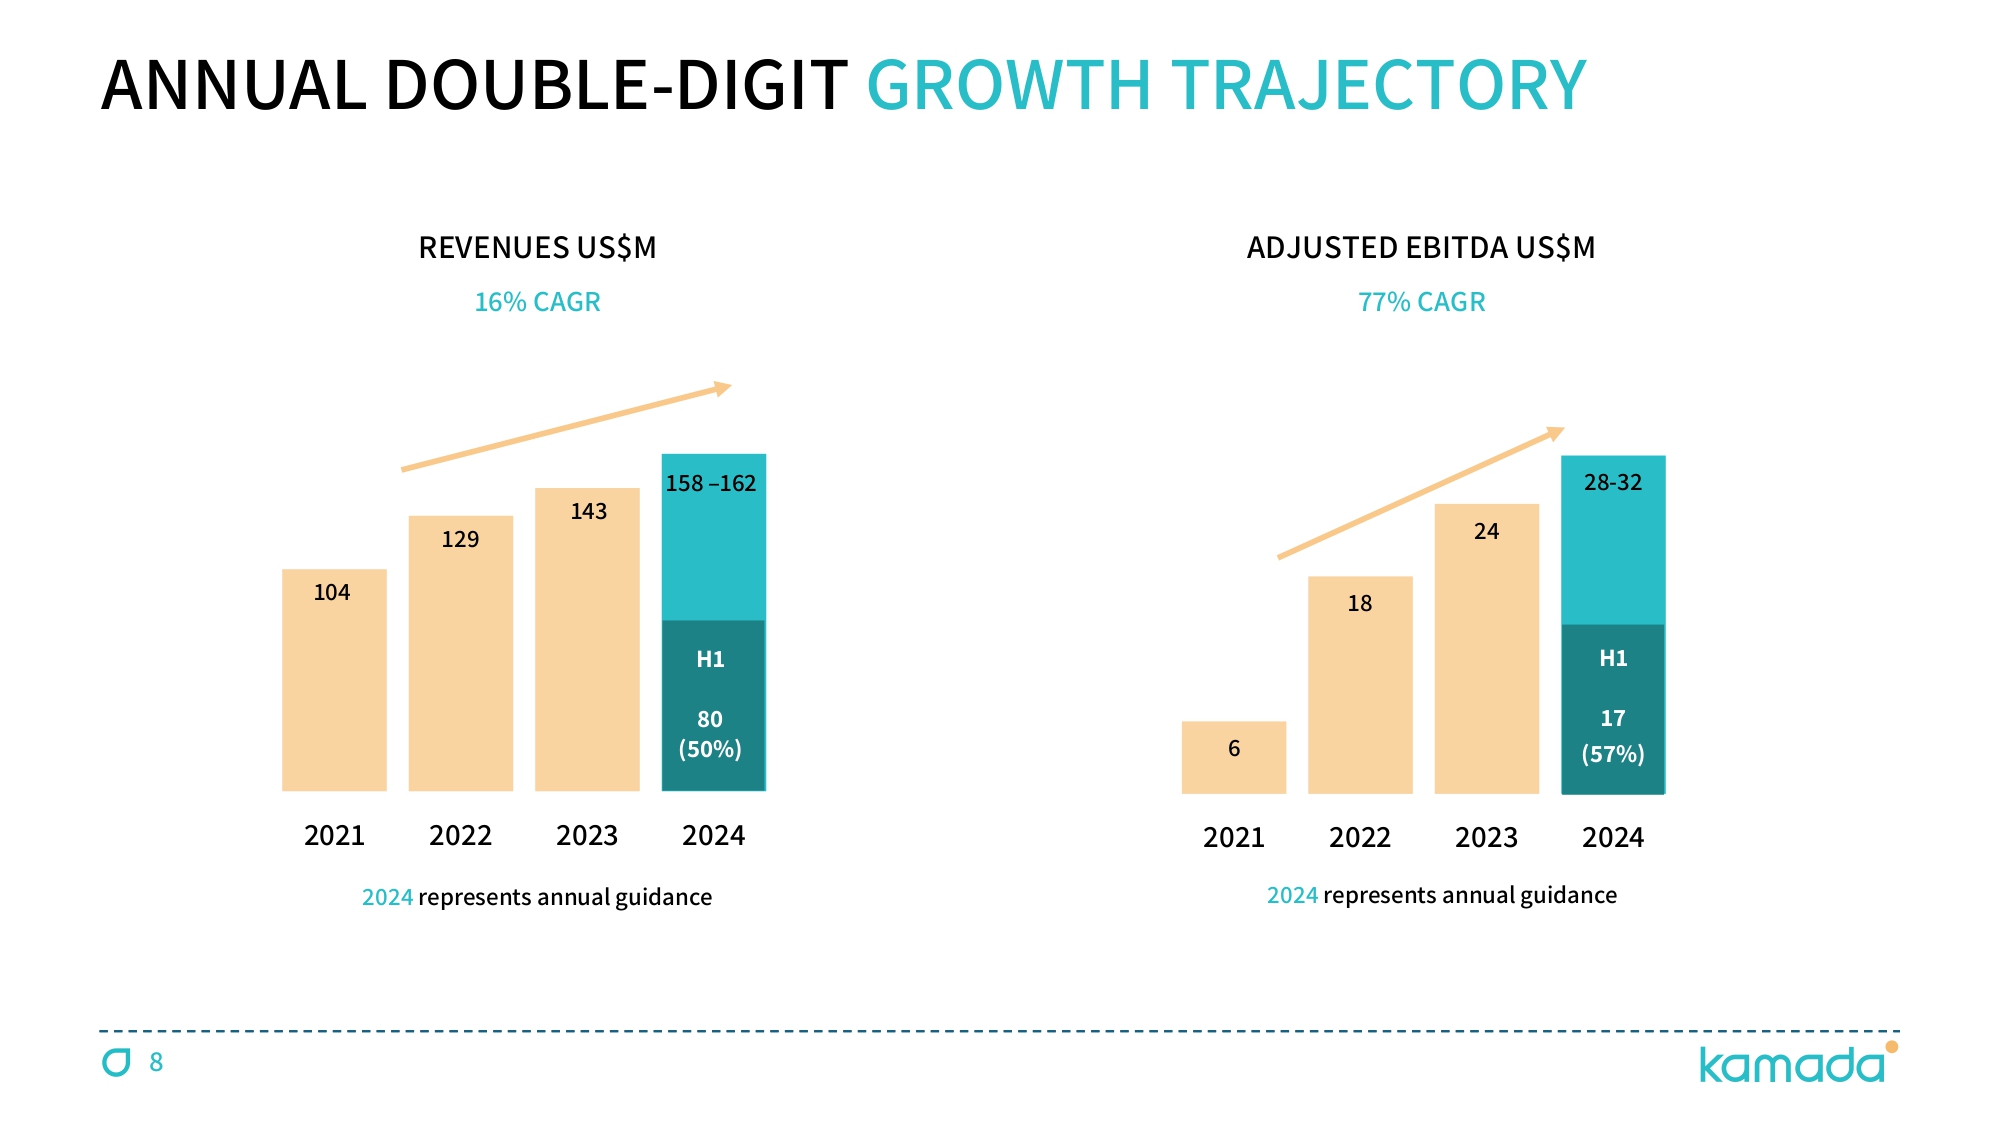
6 18 24 28 - 32 2021 2022 2023 2024 104 129 143 158 – 162 2021 2022 2023 2024 ADJUSTED EBITDA US$M 2024 represents annual guidance 2024 represents annual guidance ANNUAL DOUBLE - DIGIT GROWTH TRAJECTORY REVENUES US$M 16 % CAGR 77 % CAGR H 1 ĔČ Ţ đČƱ š H 1 čē Ţ đēƱ š 8

9 6 FDA - APPROVED SPECIALTY PLASMA PRODUCTS KEDRAB® [Rabies Immune Globulin (Human)] Post exposure prophylaxis of rabies infection CYTOGAM® [Cytomegalovirus Immune Globulin (Human)] Prophylaxis of CMV disease associated with transplants HEPGAM B® [Hepatitis B Immune Globulin (Human)] Prevention of HBV recurrence following liver transplants VARIZIG® [Varicella Zoster Immune Globulin (Human)] Post - exposure prophylaxis of varicella in high - risk patients WINRHO® [Rho(D) Immune Globulin (Human)] Treatment of ITP & suppression of Rh isoimmunization (HDN) KEY FOCUS ON TRANSPLANTS & RARE CONDITIONS For Important Safety Information, visit www.Kamada.com GLASSIA® [Alpha 1 - Proteinase Inhibitor (Human)] Augmentation therapy for Alpha - 1 Antitrypsin Deficiency (AATD)
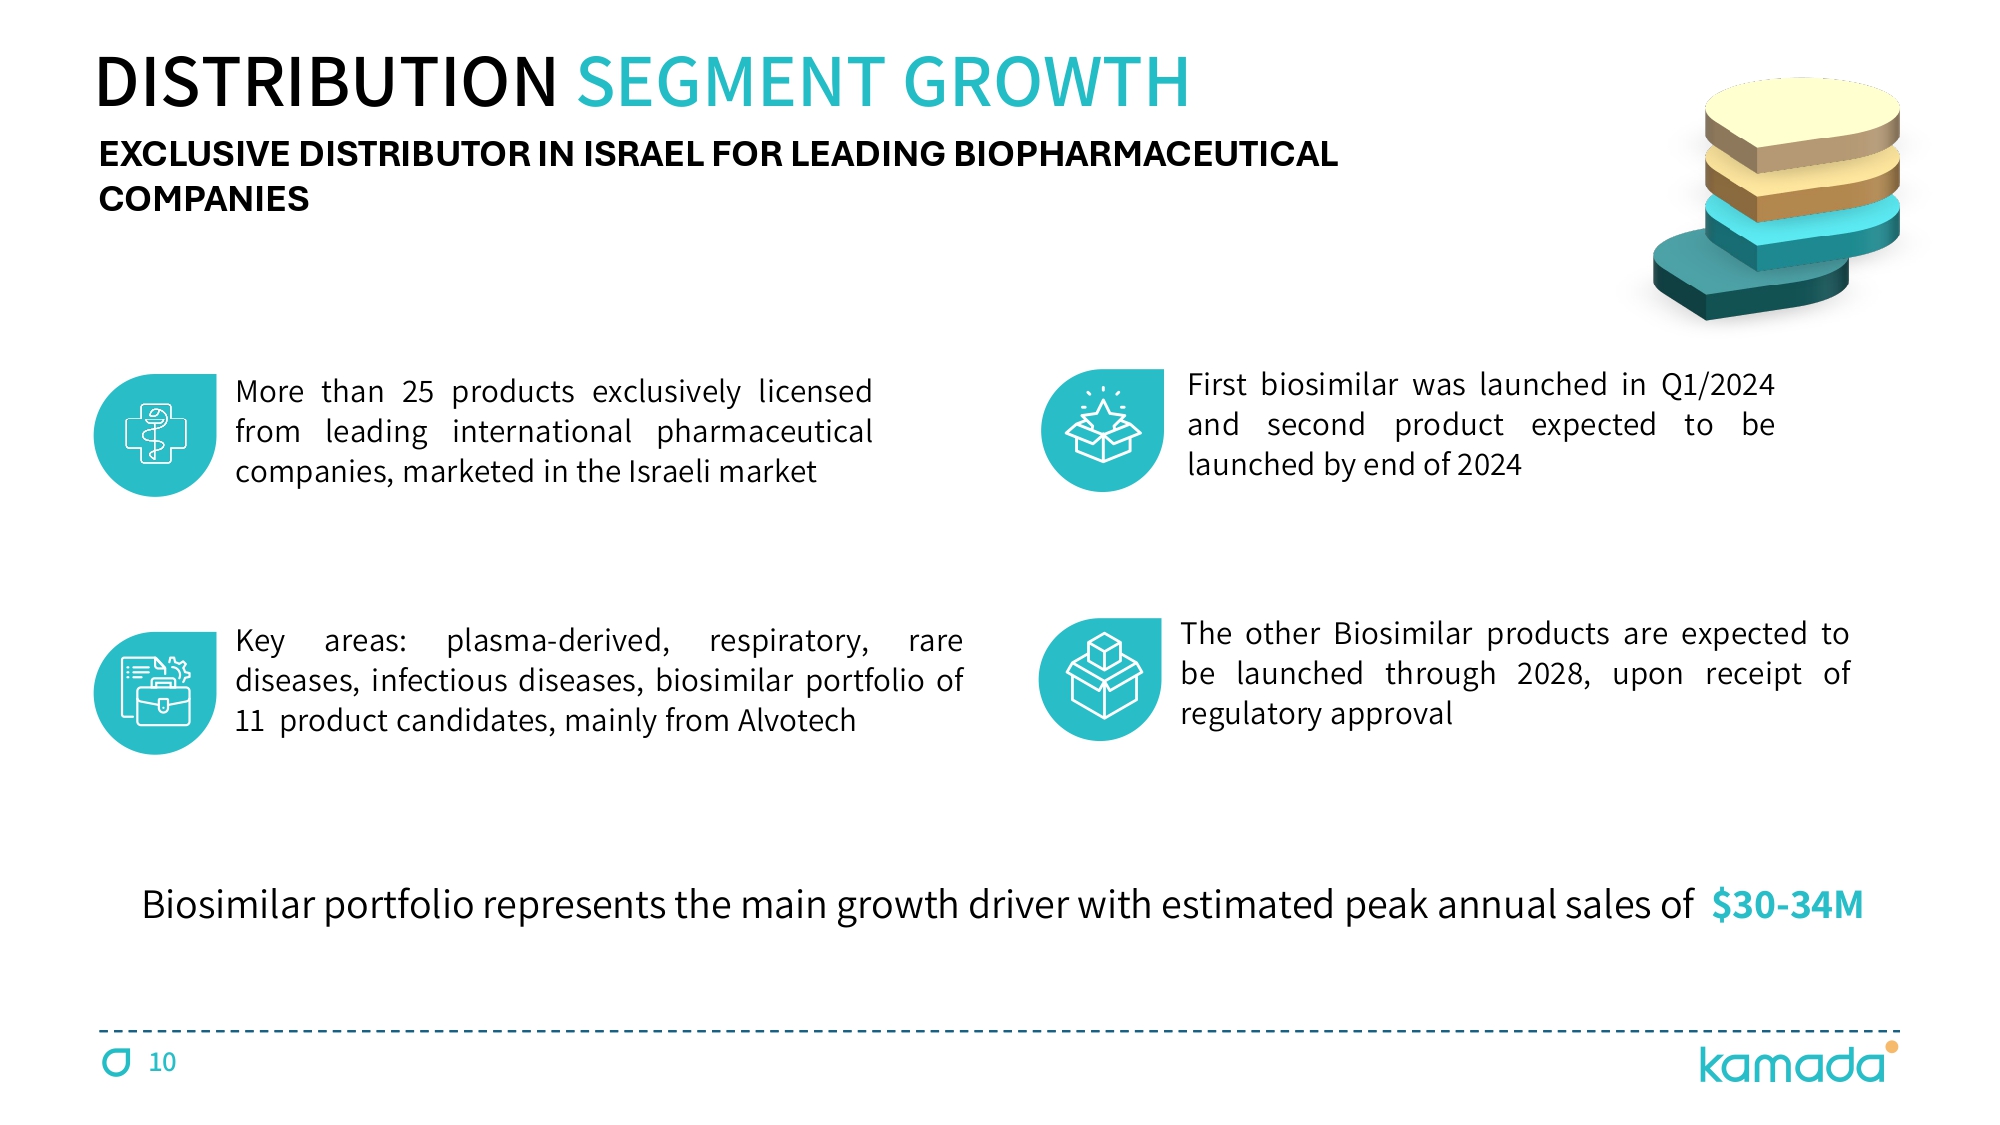
DISTRIBUTION SEGMENT GROWTH More than 25 products exclusively licensed from leading international pharmaceutical companies, marketed in the Israeli market EXCLUSIVE DISTRIBUTOR IN ISRAEL FOR LEADING BIOPHARMACEUTICAL COMPANIES Key areas : plasma - derived, respiratory, rare diseases, infectious diseases, biosimilar portfolio of 11 product candidates, mainly from Alvotech First biosimilar was launched in Q 1 / 2024 and second product expected to be launched by end of 2024 The other Biosimilar products are expected to be launched through 2028 , upon receipt of regulatory approval Biosimilar portfolio represents the main growth driver with estimated peak annual sales of $ 30 - 34 M 10

11 Exploring strategic business development opportunities to identify potential acquisition or in - licensing Focusing on products synergistic to our existing commercial and/or production activities Strong financial position and proven successful M&A capabilities M&A TRANSACTIONS SEEKING THE NEXT BREAKTHROUGH
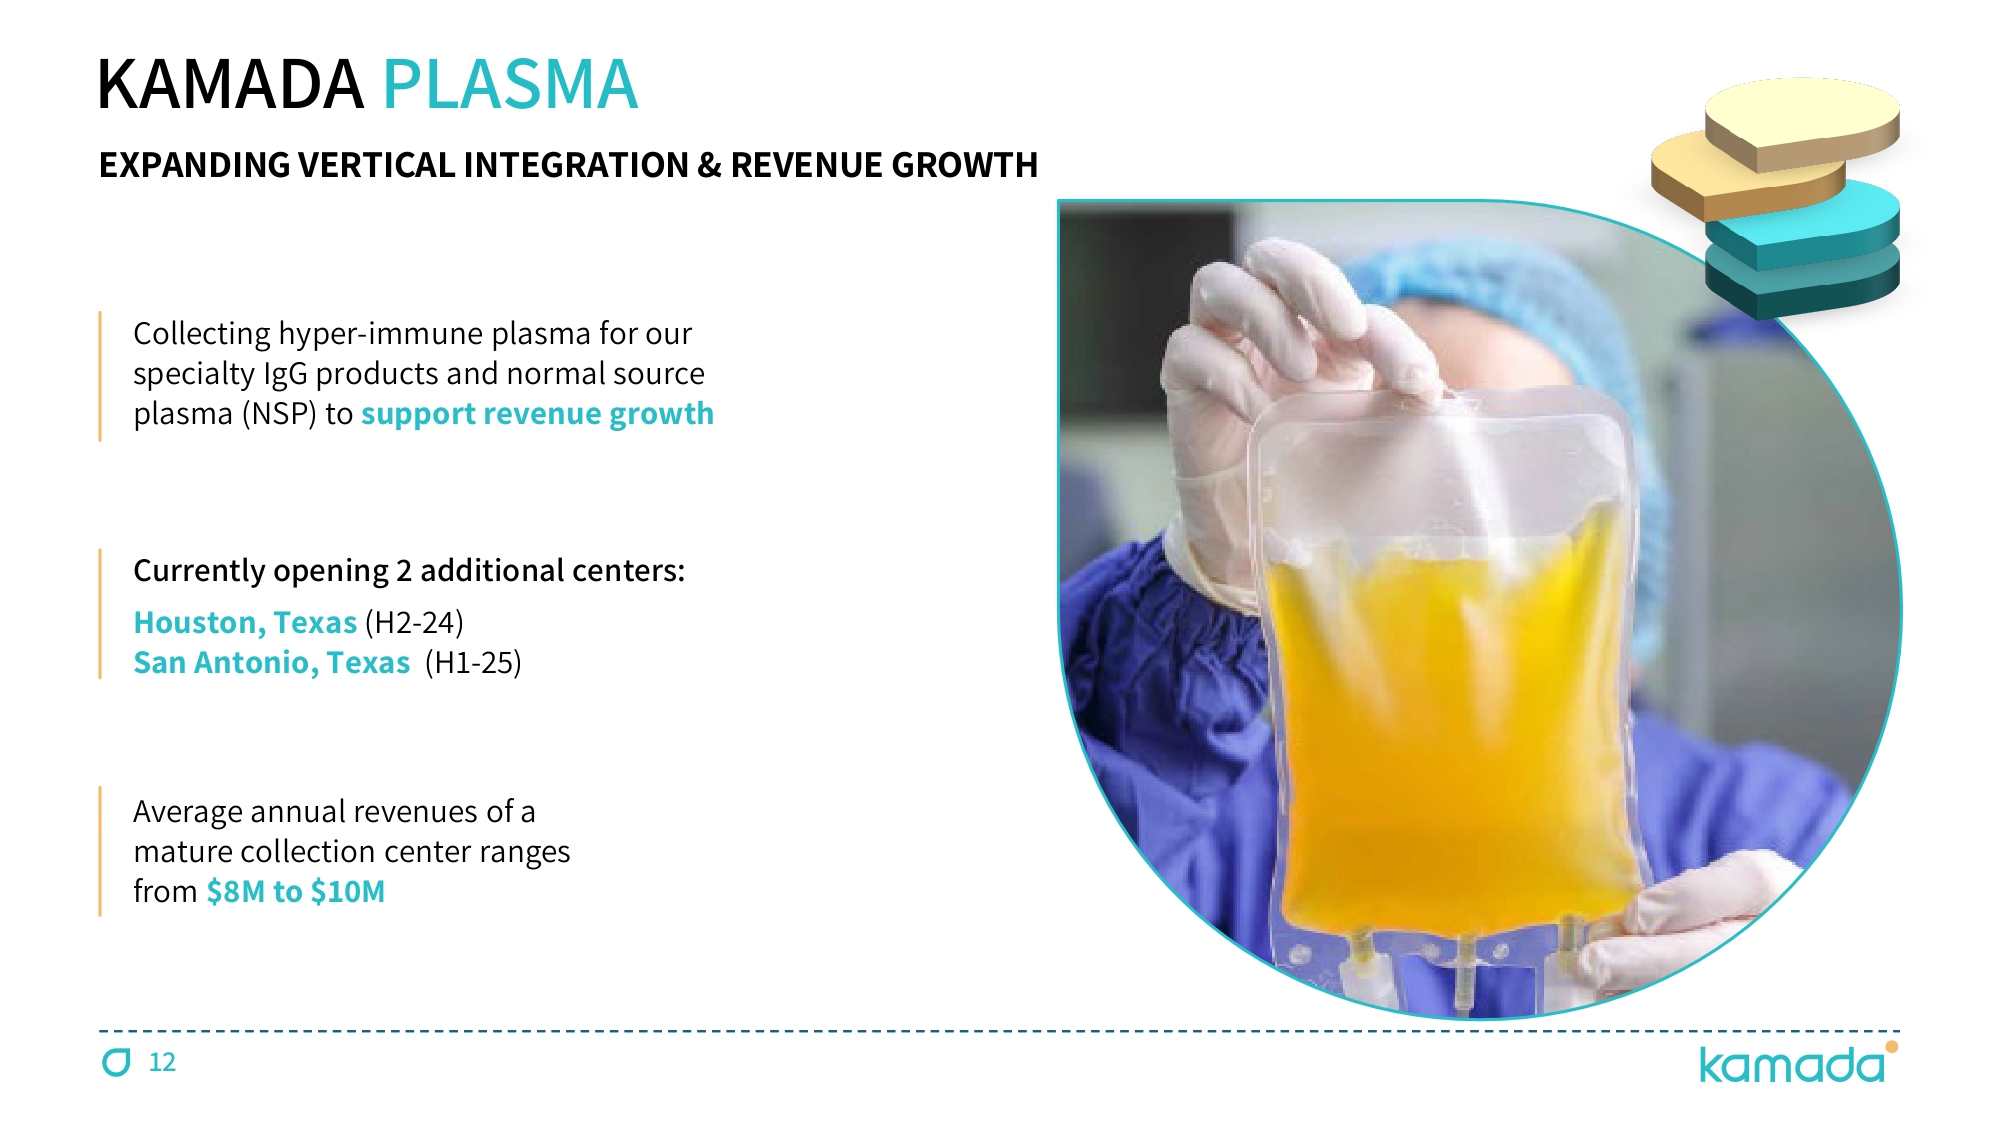
12 Currently opening 2 additional centers: Houston, Texas ( H 2 - 24 ) San Antonio, Texas (H 1 - 25 ) Collecting hyper - immune plasma for our specialty IgG products and normal source plasma (NSP) to support revenue growth Average annual revenues of a mature collection center ranges from $ 8 M to $ 10 M KAMADA PLASMA EXPANDING VERTICAL INTEGRATION & REVENUE GROWTH
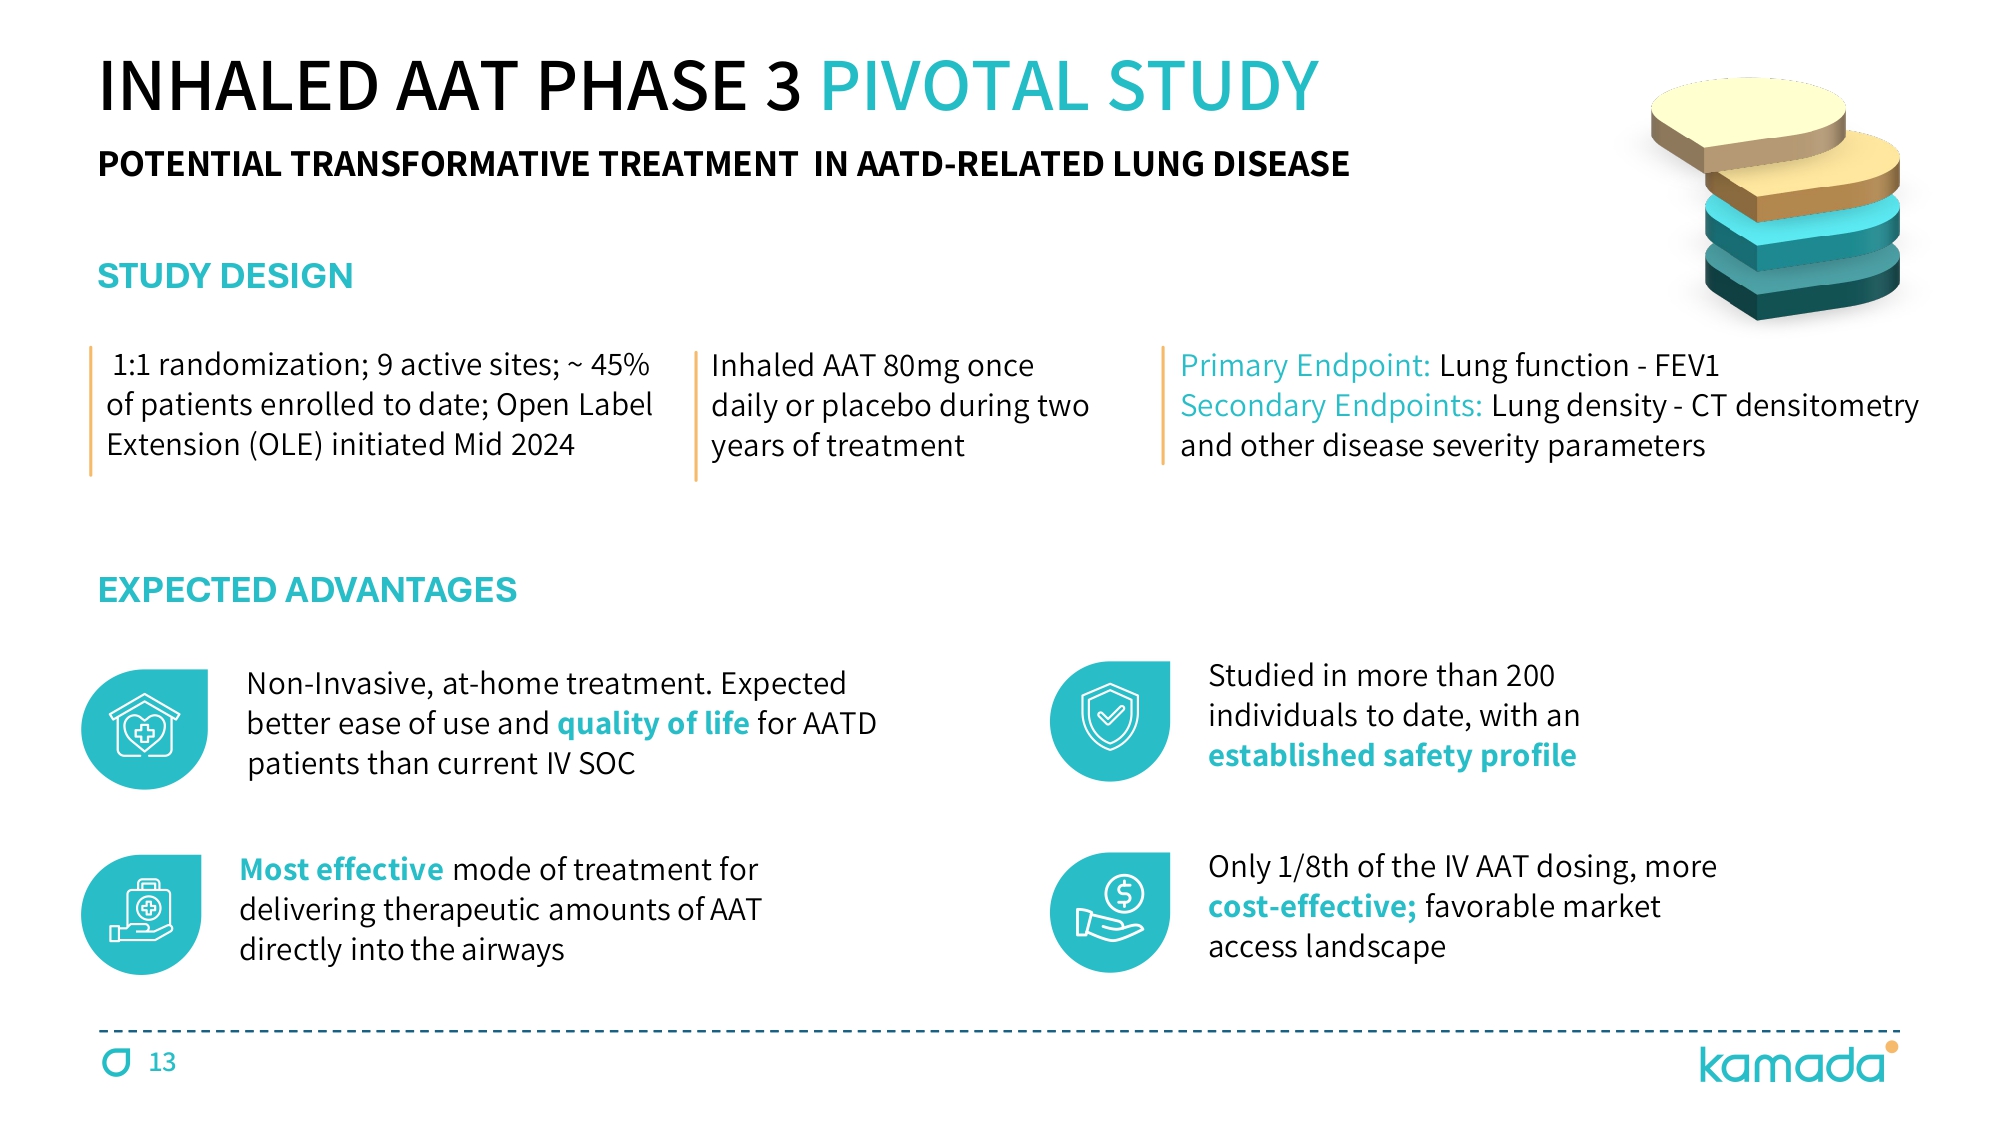
INHALED AAT PHASE 3 PIVOTAL STUDY Non - Invasive, at - home treatment. Expected better ease of use and quality of life for AATD patients than current IV SOC Most effective mode of treatment for delivering therapeutic amounts of AAT directly into the airways Studied in more than 200 individuals to date, with an established safety profile Only 1 / 8 th of the IV AAT dosing, more cost - effective; favorable market access landscape STUDY D ESIGN EXPECTED ADVANTAGES Ɗ čŃč Ɗ randomization; 9 active sites; ~ 45 % of patients enrolled to date; Open Label Extension (OLE) initiated Mid 2024 Inhaled AAT ĔČ mg Ɗ once Ɗ daily o r Ɗ placebo Ɗ during Ɗ two Ɗ years of Ɗ treatment Primary Ɗ Endpoint: Lung Ɗ function - FEV č Secondary Ɗ Endpoints Ń Lung Ɗ density - CT Ɗ densitometry Ɗ and Ɗ other Ɗ disease Ɗ severity Ɗ parameters 13 POTENTIAL TRANSFORMATIVE TREATMENT IN AATD - RELATED LUNG DISEASE
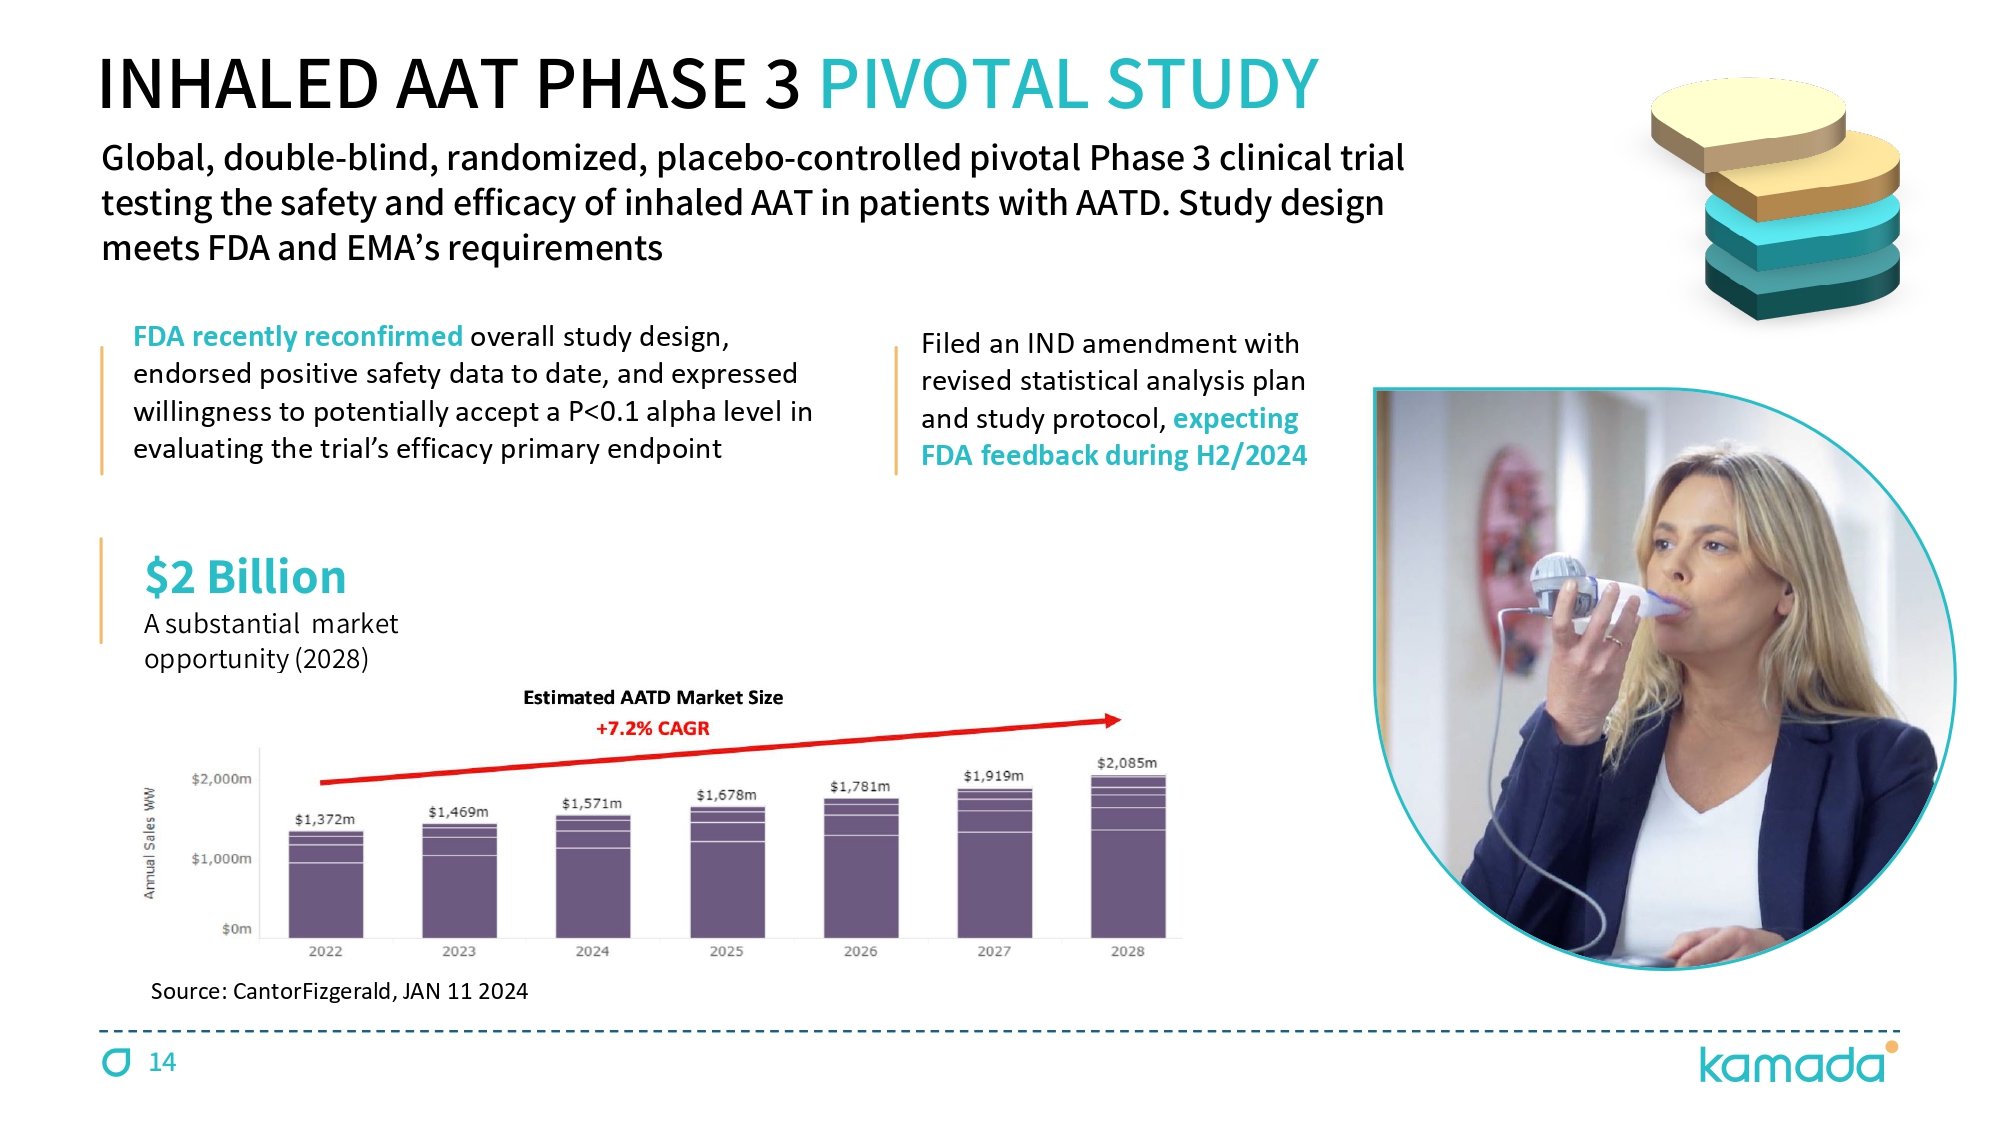
$ 2 Billion A substantial market opportunity ( 2028 ) Filed an IND amendment with revised statistical analysis plan and study protocol, expecting FDA feedback during H 2 / 2024 FDA recently reconfirmed overall study design, endorsed positive safety data to date, and expressed willingness to potentially accept a P< 0.1 alpha level in evaluating the trial ’ s efficacy primary endpoint INHALED AAT PHASE 3 PIVOTAL STUDY Global, double - blind, randomized, placebo - controlled pivotal Phase 3 clinical trial testing the safety and efficacy of inhaled AAT in patients with AATD. Study design meets FDA and EMA ’ s requirements Source: CantorFizgerald, JAN 11 2024 14
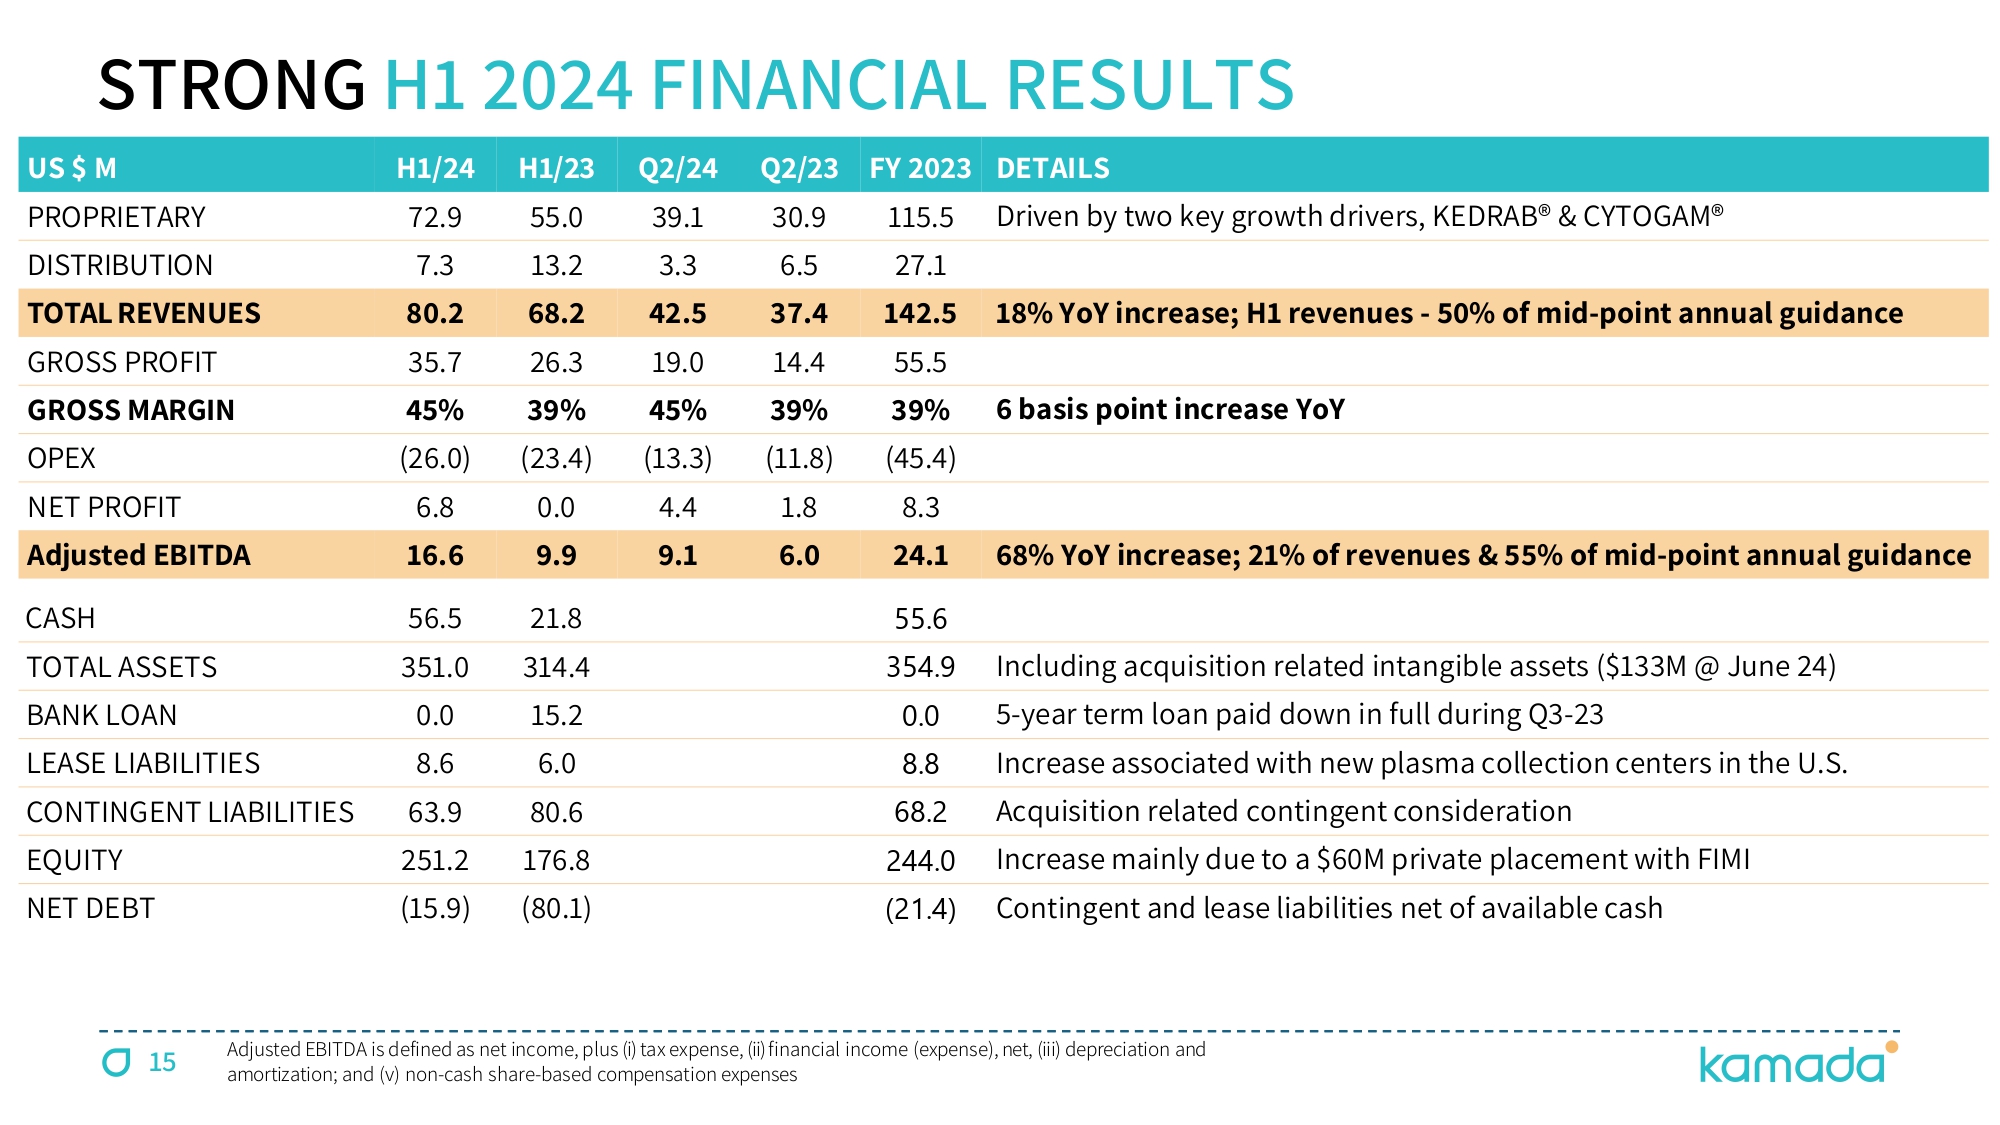
15 US $ M H1/24 H1/23 Q2/24 Q2/23 FY 2023 DETAILS PROPRIETARY 72.9 55.0 39.1 30.9 115.5 Driven by two key growth drivers, KEDRAB® & CYTOGAM® DISTRIBUTION 7.3 13.2 3.3 6.5 27.1 TOTAL REVENUES 80.2 68.2 42.5 37.4 142.5 18% YoY increase; H1 revenues - 50% of mid - point annual guidance GROSS PROFIT 35.7 26.3 19.0 14.4 55.5 GROSS MARGIN 45% 39% 45% 39% 39% 6 basis point increase YoY OPEX (26.0) (23.4) (13.3) (11.8) (45.4) NET PROFIT 6.8 0.0 4.4 1.8 8.3 Adjusted EBITDA 16.6 9.9 9.1 6.0 24.1 68% YoY increase; 21% of revenues & 55% of mid - point annual guidance CASH 56.5 21.8 55.6 TOTAL ASSETS 351.0 314.4 354.9 Including acquisition related intangible assets ($133M @ June 24) BANK LOAN 0.0 15.2 0.0 5 - year term loan paid down in full during Q3 - 23 LEASE LIABILITIES 8.6 6.0 8.8 Increase associated with new plasma collection centers in the U.S. CONTINGENT LIABILITIES 63.9 80.6 68.2 Acquisition related contingent consideration EQUITY 251.2 176.8 244.0 Increase mainly due to a $60M private placement with FIMI NET DEBT (15.9) (80.1) ( 21.4 ) Contingent and lease liabilities net of available cash Adjusted EBITDA is defined as net income, plus ( i ) tax expense, (ii) financial income (expense), net, (iii) depreciation and amortization ; and (v) non - cash share - based compensation expenses STRONG H 1 2024 FINANCIAL RESULTS
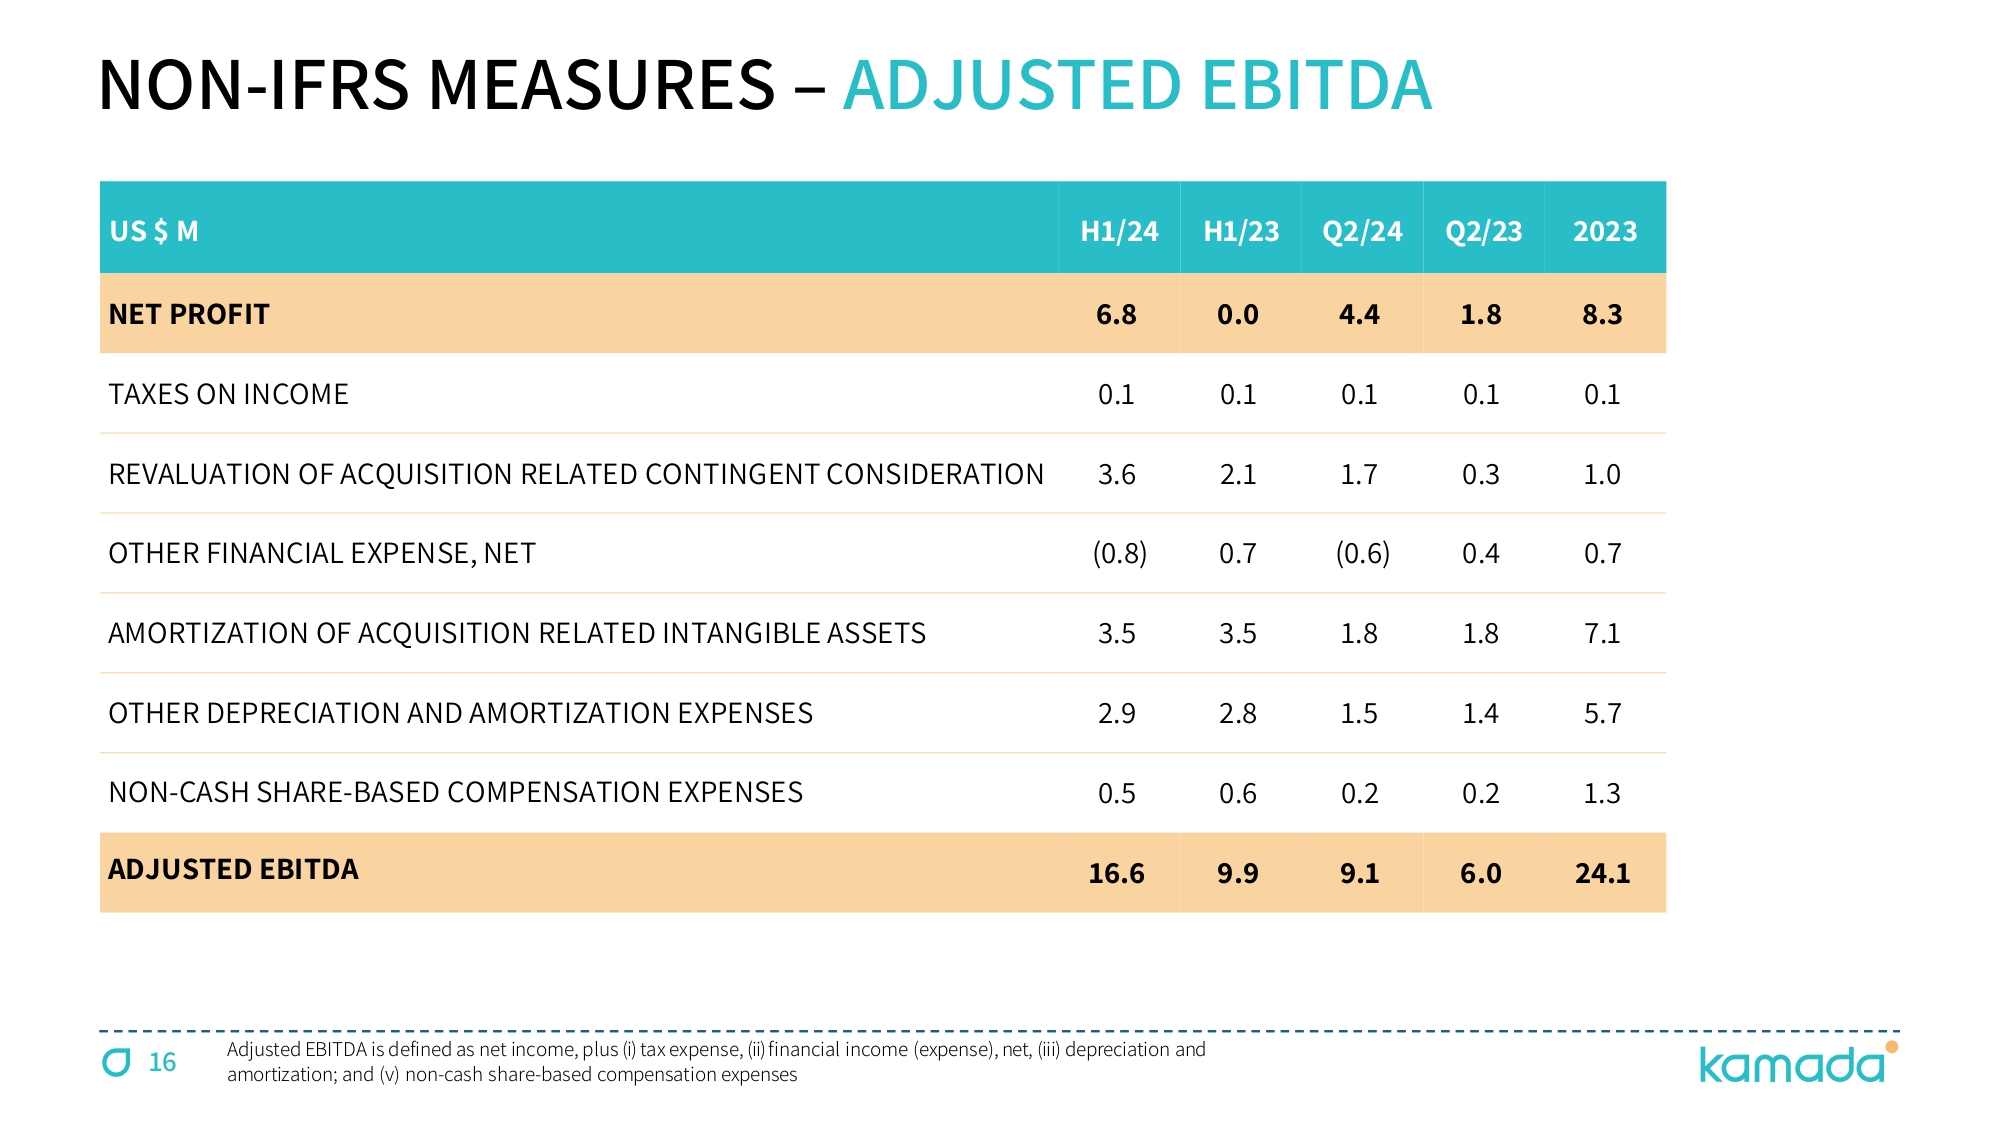
16 NON - IFRS MEASURES – ADJUSTED EBITDA US $ M H 1 / 24 H1/23 Q 2 / 24 Q2/23 2023 NET PROFIT 6.8 0.0 4.4 1.8 8.3 TAXES ON INCOME 0.1 0.1 0.1 0.1 0.1 REVALUATION OF ACQUISITION RELATED CONTINGENT CONSIDERATION 3.6 2.1 1.7 0.3 1.0 OTHER FINANCIAL EXPENSE, NET ( 0.8 ) 0.7 ( 0.6 ) 0.4 0.7 AMORTIZATION OF ACQUISITION RELATED INTANGIBLE ASSETS 3.5 3.5 1.8 1.8 7.1 OTHER DEPRECIATION AND AMORTIZATION EXPENSES 2.9 2.8 1.5 1.4 5.7 NON - CASH SHARE - BASED COMPENSATION EXPENSES 0.5 0.6 0.2 0.2 1.3 ADJUSTED EBITDA 16.6 9.9 9.1 6.0 24.1 Adjusted EBITDA is defined as net income, plus ( i ) tax expense, (ii) financial income (expense), net, (iii) depreciation and amortization ; and (v) non - cash share - based compensation expenses
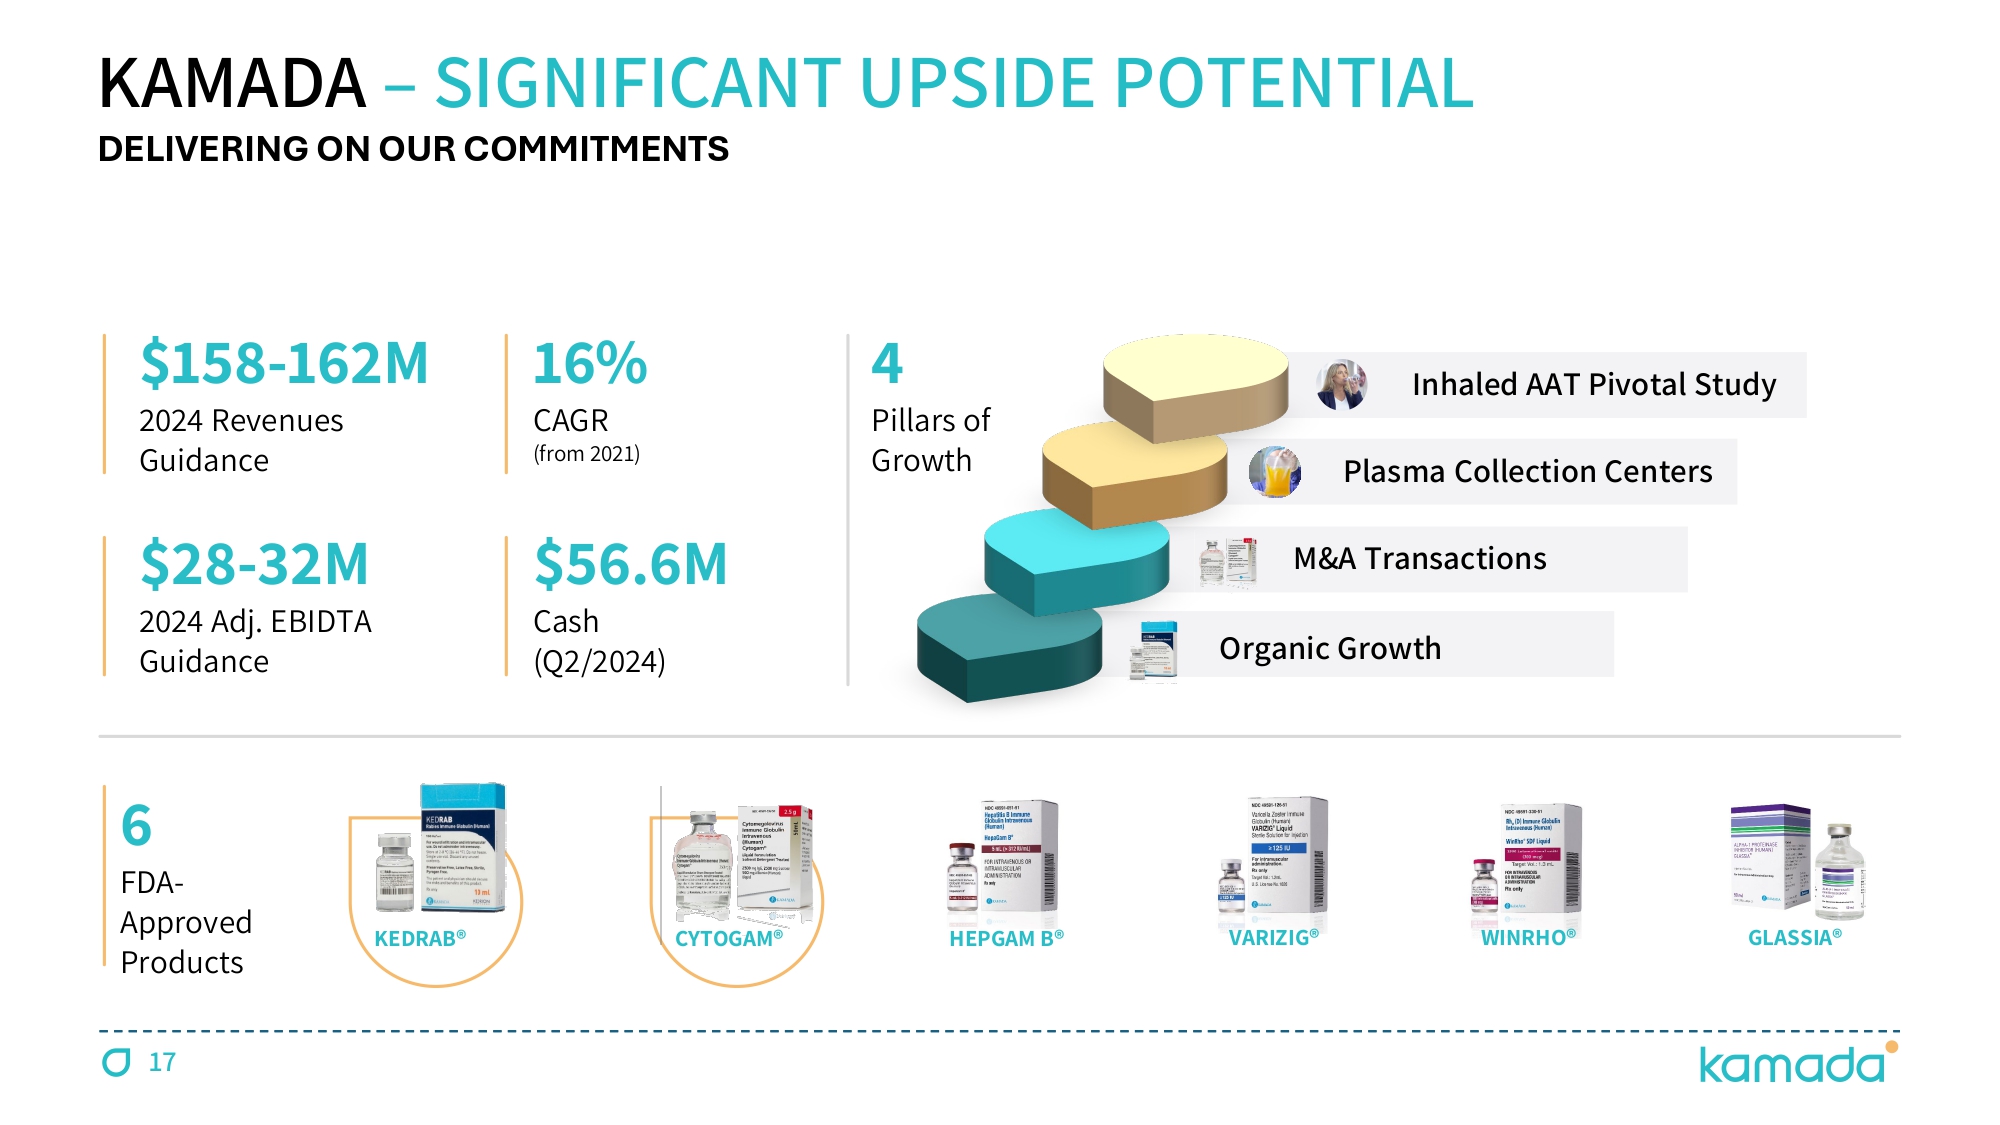
KEDRAB® CYTOGAM® HEPGAM B® VARIZIG® WINRHO® GLASSIA® KAMADA – SIGNIFICANT UPSIDE POTENTIAL 6 FDA - Approved Products 16 % CAGR (from 2021 ) $ 158 - 162 M 2024 Revenues Guidance $28 - 32M 2024 Adj. EBIDTA Guidance 4 Pillars of Growth $ 56.6 M Cash (Q 2 / 2024 ) DELIVERING ON OUR COMMITMENTS 17 Organic Growth M&A Transactions Inhaled AAT Pivotal Study Plasma Collection Centers

THANK YOU www.kamada.com


