Exhibit 99.9
ITEM 1 — FINANCIAL STATEMENTS
NRG YIELD, INC.
CONSOLIDATED STATEMENTS OF INCOME
(Unaudited)
|
| | | | | | | | | | | | | | | |
| | Three months ended June 30, | | Six months ended June 30, |
| (In millions, except per share amounts) | 2016 (a) | | 2015 (a) | | 2016 (a) | | 2015 (a) |
| Operating Revenues | | | | | | | |
| Total operating revenues | $ | 283 |
| | $ | 259 |
| | $ | 517 |
| | $ | 473 |
|
| Operating Costs and Expenses | | | | | | | |
| Cost of operations | 77 |
| | 78 |
| | 162 |
| | 164 |
|
| Depreciation and amortization | 75 |
| | 78 |
| | 149 |
| | 153 |
|
| General and administrative | 3 |
| | 3 |
| | 6 |
| | 6 |
|
| Acquisition-related transaction and integration costs | — |
| | 1 |
| | — |
| | 1 |
|
| Total operating costs and expenses | 155 |
| | 160 |
| | 317 |
| | 324 |
|
| Operating Income | 128 |
| | 99 |
| | 200 |
| | 149 |
|
| Other Income (Expense) | | | | | | | |
| Equity in earnings of unconsolidated affiliates | 13 |
| | 4 |
| | 16 |
| | 7 |
|
| Other income, net | 2 |
| | 1 |
| | 2 |
| | 2 |
|
| Loss on debt extinguishment | — |
| | (7 | ) | | — |
| | (7 | ) |
| Interest expense | (68 | ) | | (51 | ) | | (142 | ) | | (130 | ) |
| Total other expense, net | (53 | ) | | (53 | ) | | (124 | ) | | (128 | ) |
| Income Before Income Taxes | 75 |
| | 46 |
| | 76 |
| | 21 |
|
| Income tax expense | 12 |
| | 4 |
| | 12 |
| | — |
|
| Net Income | 63 |
| | 42 |
| | 64 |
| | 21 |
|
| Less: Pre-acquisition net income (loss) of Drop Down Assets | 5 |
| | 1 |
| | 4 |
| | (4 | ) |
| Net Income Excluding Pre-acquisition Net Income (Loss) of Drop Down Assets | 58 |
| | 41 |
| | 60 |
| | 25 |
|
| Less: Net income attributable to noncontrolling interests | 26 |
| | 31 |
| | 23 |
| | 20 |
|
| Net Income Attributable to NRG Yield, Inc. | $ | 32 |
| | $ | 10 |
| | $ | 37 |
| | $ | 5 |
|
| Earnings Per Share Attributable to NRG Yield, Inc. Class A and Class C Common Stockholders | | | | | | | |
| Weighted average number of Class A common shares outstanding - basic | 35 |
| | 35 |
| | 35 |
| | 35 |
|
| Weighted average number of Class A common shares outstanding - diluted | 49 |
| | 35 |
| | 35 |
| | 35 |
|
| Weighted average number of Class C common shares outstanding - basic | 63 |
| | 35 |
| | 63 |
| | 35 |
|
| Weighted average number of Class C common shares outstanding - diluted | 73 |
| | 35 |
| | 63 |
| | 35 |
|
| Earnings per Weighted Average Class A and Class C Common Share - Basic | $ | 0.33 |
| | $ | 0.15 |
| | $ | 0.38 |
| | $ | 0.07 |
|
| Earnings per Weighted Average Class A Common Share - Diluted | 0.29 |
| | 0.15 |
| | 0.38 |
| | 0.07 |
|
| Earnings per Weighted Average Class C Common Share - Diluted | 0.31 |
| | 0.15 |
| | 0.38 |
| | 0.07 |
|
| Dividends Per Class A Common Share | 0.23 |
| | 0.20 |
| | 0.455 |
| | 0.59 |
|
| Dividends Per Class C Common Share | $ | 0.23 |
| | $ | 0.20 |
| | $ | 0.455 |
| | $ | 0.20 |
|
(a) Retrospectively adjusted as discussed in Note 1, Nature of Business.
See accompanying notes to consolidated financial statements.
NRG YIELD, INC.
CONSOLIDATED STATEMENTS OF COMPREHENSIVE INCOME (LOSS)
(Unaudited)
|
| | | | | | | | | | | | | | | |
| | Three months ended June 30, | | Six months ended June 30, |
| (In millions) | 2016 (a) | | 2015 (a) | | 2016 (a) | | 2015 (a) |
| Net Income | $ | 63 |
| | $ | 42 |
| | $ | 64 |
| | $ | 21 |
|
| Other Comprehensive (Loss) Income, net of tax | | | | | | | |
| Unrealized (loss) gain on derivatives, net of income tax benefit (expense) of $3, ($4), $12 and $4 | (16 | ) | | 23 |
| | (57 | ) | | 3 |
|
| Other comprehensive (loss) income | (16 | ) | | 23 |
| | (57 | ) | | 3 |
|
| Comprehensive Income | 47 |
| | 65 |
| | 7 |
| | 24 |
|
| Less: Pre-acquisition net loss of Drop Down Assets | 5 |
| | 1 |
| | 4 |
| | (4 | ) |
| Less: Comprehensive income (loss) attributable to noncontrolling interests | 13 |
| | 48 |
| | (14 | ) | | 30 |
|
| Comprehensive Income (Loss) Attributable to NRG Yield, Inc. | $ | 29 |
| | $ | 16 |
| | $ | 17 |
| | $ | (2 | ) |
(a) Retrospectively adjusted as discussed in Note 1, Nature of Business.
See accompanying notes to consolidated financial statements.
NRG YIELD, INC.
CONSOLIDATED BALANCE SHEETS |
| | | | | | | |
| (In millions, except shares) | June 30, 2016 (a) | | December 31, 2015 (a) |
| ASSETS | (unaudited) | | |
| Current Assets | | | |
| Cash and cash equivalents | $ | 89 |
| | $ | 111 |
|
| Restricted cash | 123 |
| | 131 |
|
| Accounts receivable — trade | 121 |
| | 98 |
|
| Accounts receivable — affiliate | 1 |
| | — |
|
| Inventory | 36 |
| | 36 |
|
| Derivative instruments | 1 |
| | — |
|
| Notes receivable | 17 |
| | 17 |
|
| Prepayments and other current assets | 23 |
| | 23 |
|
| Total current assets | 411 |
| | 416 |
|
| Property, plant and equipment, net of accumulated depreciation of $928 and $782 | 5,761 |
| | 5,878 |
|
| Other Assets | | | |
| Equity investments in affiliates | 683 |
| | 697 |
|
| Notes receivable | 21 |
| | 30 |
|
| Intangible assets, net of accumulated amortization of $132 and $93 | 1,321 |
| | 1,362 |
|
| Deferred income taxes | 170 |
| | 170 |
|
| Other non-current assets | 141 |
| | 136 |
|
| Total other assets | 2,336 |
| | 2,395 |
|
| Total Assets | $ | 8,508 |
| | $ | 8,689 |
|
| LIABILITIES AND STOCKHOLDERS’ EQUITY | | | |
| Current Liabilities | |
| | |
|
| Current portion of long-term debt | $ | 274 |
| | $ | 264 |
|
| Accounts payable — trade | 22 |
| | 23 |
|
| Accounts payable — affiliate | 33 |
| | 86 |
|
| Derivative instruments | 37 |
| | 39 |
|
| Accrued expenses and other current liabilities | 48 |
| | 77 |
|
| Total current liabilities | 414 |
| | 489 |
|
| Other Liabilities | | | |
| Long-term debt | 5,218 |
| | 5,329 |
|
| Accounts payable — affiliate | 20 |
| | — |
|
| Derivative instruments | 122 |
| | 61 |
|
| Other non-current liabilities | 79 |
| | 72 |
|
| Total non-current liabilities | 5,439 |
| | 5,462 |
|
| Total Liabilities | 5,853 |
| | 5,951 |
|
| Commitments and Contingencies | | | |
| Stockholders' Equity | | | |
| Preferred stock, $0.01 par value; 10,000,000 shares authorized; none issued | — |
| | — |
|
| Class A, Class B, Class C and Class D common stock, $0.01 par value; 3,000,000,000 shares authorized (Class A 500,000,000, Class B 500,000,000, Class C 1,000,000,000, Class D 1,000,000,000); 182,848,000 shares issued and outstanding (Class A 34,586,250, Class B 42,738,750, Class C 62,784,250, Class D 42,738,750) at June 30, 2016, and December 31, 2015 | 1 |
| | 1 |
|
| Additional paid-in capital | 1,835 |
| | 1,855 |
|
| Retained earnings | 26 |
| | 12 |
|
| Accumulated other comprehensive loss | (47 | ) | | (27 | ) |
| Noncontrolling interest | 840 |
| | 897 |
|
| Total Stockholders' Equity | 2,655 |
| | 2,738 |
|
| Total Liabilities and Stockholders' Equity | $ | 8,508 |
| | $ | 8,689 |
|
(a) Retrospectively adjusted as discussed in Note 1, Nature of Business.
See accompanying notes to consolidated financial statements.
NRG YIELD, INC.
CONSOLIDATED STATEMENTS OF CASH FLOWS
(Unaudited)
|
| | | | | | | |
| | Six months ended June 30, |
| | 2016 (a) | | 2015 (a) |
| | (In millions) |
| Cash Flows from Operating Activities | | | |
| Net income | $ | 64 |
| | $ | 21 |
|
| Adjustments to reconcile net income to net cash provided by operating activities: | | | |
| Equity in earnings of unconsolidated affiliates | (16 | ) | | (7 | ) |
| Distributions from unconsolidated affiliates | 22 |
| | 21 |
|
| Depreciation, amortization and ARO accretion | 150 |
| | 154 |
|
| Amortization of financing costs and debt discounts | 10 |
| | 6 |
|
| Amortization of intangibles and out-of-market contracts | 40 |
| | 26 |
|
| Adjustment for debt extinguishment | — |
| | 7 |
|
| Changes in income taxes | 12 |
| | — |
|
| Changes in derivative instruments | (1 | ) | | (36 | ) |
| Disposal of asset components | 3 |
| | 1 |
|
| Changes in prepaid and accrued capacity payments | (65 | ) | | (66 | ) |
| Changes in other working capital | (4 | ) | | (29 | ) |
| Net Cash Provided by Operating Activities | 215 |
| | 98 |
|
| Cash Flows from Investing Activities | | | |
| Acquisition of businesses, net of cash acquired | — |
| | (37 | ) |
| Acquisition of Drop Down Assets, net of cash acquired | — |
| | (489 | ) |
| Capital expenditures | (11 | ) | | (9 | ) |
| Decrease in restricted cash | 7 |
| | 20 |
|
| Decrease in notes receivable | 9 |
| | 8 |
|
| Return of investment from unconsolidated affiliates | 18 |
| | 15 |
|
| Investments in unconsolidated affiliates | (59 | ) | | (328 | ) |
| Other | 2 |
| | — |
|
| Net Cash Used in Investing Activities | (34 | ) | | (820 | ) |
| Cash Flows from Financing Activities | | | |
| Net contributions from noncontrolling interests | 8 |
| | 123 |
|
| Distributions to NRG for NRG Wind TE Holdco | (6 | ) | | — |
|
| Distributions and return of capital to NRG prior to CVSR Drop Down | (12 | ) | | (12 | ) |
| Proceeds from the issuance of common stock | — |
| | 600 |
|
| Payment of dividends and distributions to shareholders | (83 | ) | | (61 | ) |
| Payment of debt issuance costs | — |
| | (11 | ) |
| Net borrowings from the revolving credit facility | 12 |
| | 267 |
|
| Proceeds from the issuance of long-term debt | — |
| | 293 |
|
| Payments of long-term debt | (122 | ) | | (599 | ) |
| Net Cash (Used in) Provided by Financing Activities | (203 | ) | | 600 |
|
| Net Decrease in Cash and Cash Equivalents | (22 | ) | | (122 | ) |
| Cash and Cash Equivalents at Beginning of Period | 111 |
| | 429 |
|
| Cash and Cash Equivalents at End of Period | $ | 89 |
| | $ | 307 |
|
(a) Retrospectively adjusted as discussed in Note 1, Nature of Business.
See accompanying notes to consolidated financial statements.
NRG YIELD, INC.
NOTES TO CONSOLIDATED FINANCIAL STATEMENTS
Note 1 — Nature of Business
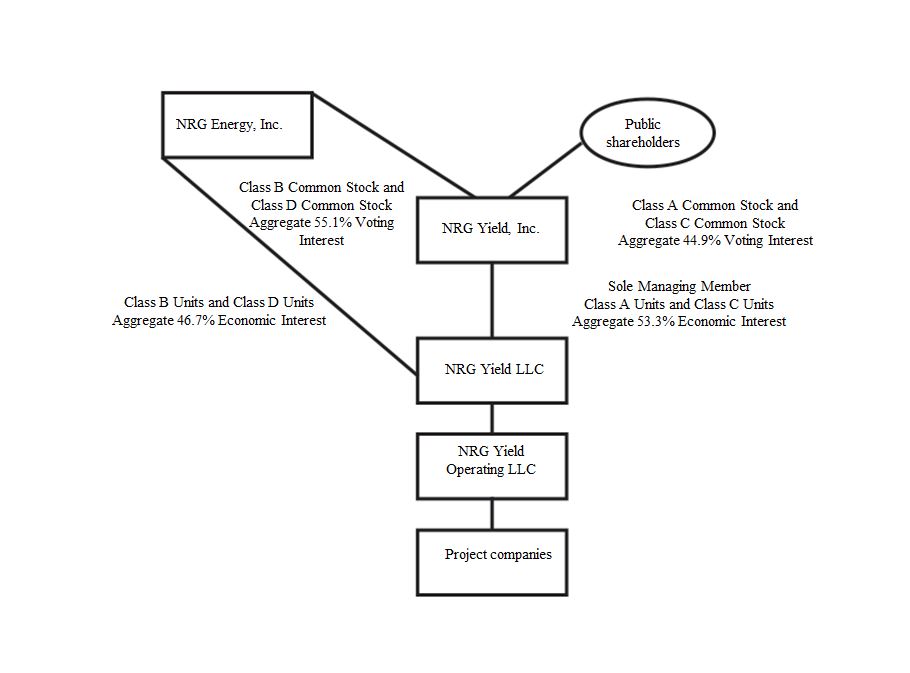
NRG Yield, Inc., together with its consolidated subsidiaries, or the Company, is a dividend growth-oriented company formed by NRG as a Delaware corporation on December 20, 2012, to serve as the primary vehicle through which NRG owns, operates and acquires contracted renewable and conventional generation and thermal infrastructure assets. NRG Yield, Inc. owns 100% of the Class A units and Class C units of NRG Yield LLC, including a controlling interest through its position as managing member. NRG Yield LLC, through its wholly owned subsidiary, NRG Yield Operating LLC, is the holder of a portfolio of renewable and conventional generation and thermal infrastructure assets, primarily located in the Northeast, Southwest and California regions of the U.S.
NRG Yield, Inc. consolidates the results of NRG Yield LLC through its controlling interest, with NRG's interest shown as noncontrolling interest in the financial statements. On May 14, 2015, NRG Yield, Inc. completed a stock split whereby each outstanding share of Class A common stock was split into one share of Class A common stock and one share of Class C common stock, and each outstanding share of Class B common stock was split into one share of Class B common stock and one share of Class D common stock. The stock split is referred to as the Recapitalization and all references to share or per share amounts in the accompanying consolidated financial statements and applicable disclosures have been retrospectively adjusted to reflect the Recapitalization. In addition, on June 29, 2015, NRG Yield, Inc. completed the issuance of 28,198,000 shares of Class C common stock for net proceeds of $599 million. The holders of NRG Yield, Inc.'s outstanding shares of Class A and Class C common stock are entitled to dividends as declared. NRG receives its distributions from NRG Yield LLC through its ownership of NRG Yield LLC Class B and Class D units.
The following table represents the structure of the Company as of June 30, 2016:
As of June 30, 2016, the Company's operating assets are comprised of the following projects:
|
| | | | | | | | | | |
| Projects | | Percentage Ownership | | Net Capacity (MW)(a) | | Offtake Counterparty | | Expiration |
| Conventional | | | | | | | | |
| El Segundo | | 100 | % | | 550 |
| | Southern California Edison | | 2023 |
| GenConn Devon | | 50 | % | | 95 |
| | Connecticut Light & Power | | 2040 |
| GenConn Middletown | | 50 | % | | 95 |
| | Connecticut Light & Power | | 2041 |
| Marsh Landing | | 100 | % | | 720 |
| | Pacific Gas and Electric | | 2023 |
| Walnut Creek | | 100 | % | | 485 |
| | Southern California Edison | | 2023 |
| | | | | 1,945 |
| | | | |
| Utility Scale Solar | | | | | | | | |
| Alpine | | 100 | % | | 66 |
| | Pacific Gas and Electric | | 2033 |
| Avenal | | 50 | % | | 23 |
| | Pacific Gas and Electric | | 2031 |
| Avra Valley | | 100 | % | | 26 |
| | Tucson Electric Power | | 2032 |
| Blythe | | 100 | % | | 21 |
| | Southern California Edison | | 2029 |
| Borrego | | 100 | % | | 26 |
| | San Diego Gas and Electric | | 2038 |
| CVSR | | 100 | % | | 250 |
| | Pacific Gas and Electric | | 2038 |
| Desert Sunlight 250 | | 25 | % | | 63 |
| | Southern California Edison | | 2035 |
| Desert Sunlight 300 | | 25 | % | | 75 |
| | Pacific Gas and Electric | | 2040 |
| Kansas South | | 100 | % | | 20 |
| | Pacific Gas and Electric | | 2033 |
| Roadrunner | | 100 | % | | 20 |
| | El Paso Electric | | 2031 |
| TA High Desert | | 100 | % | | 20 |
| | Southern California Edison | | 2033 |
| | | | | 610 |
| | | | |
| Distributed Solar | | | | | | | | |
| AZ DG Solar Projects | | 100 | % | | 5 |
| | Various | | 2025 - 2033 |
| PFMG DG Solar Projects | | 51 | % | | 4 |
| | Various | | 2032 |
| | | | | 9 |
| | | | |
| Wind | | | | | | | | |
| Alta I | | 100 | % | | 150 |
| | Southern California Edison | | 2035 |
| Alta II | | 100 | % | | 150 |
| | Southern California Edison | | 2035 |
| Alta III | | 100 | % | | 150 |
| | Southern California Edison | | 2035 |
| Alta IV | | 100 | % | | 102 |
| | Southern California Edison | | 2035 |
| Alta V | | 100 | % | | 168 |
| | Southern California Edison | | 2035 |
Alta X (b) | | 100 | % | | 137 |
| | Southern California Edison | | 2038 |
Alta XI (b) | | 100 | % | | 90 |
| | Southern California Edison | | 2038 |
| Buffalo Bear | | 100 | % | | 19 |
| | Western Farmers Electric Co-operative | | 2033 |
| Crosswinds | | 74.3 | % | | 16 |
| | Corn Belt Power Cooperative | | 2027 |
| Elbow Creek | | 75 | % | | 92 |
| | NRG Power Marketing LLC | | 2022 |
| Elkhorn Ridge | | 50.3 | % | | 41 |
| | Nebraska Public Power District | | 2029 |
| Forward | | 75 | % | | 22 |
| | Constellation NewEnergy, Inc. | | 2017 |
| Goat Wind | | 74.9 | % | | 113 |
| | Dow Pipeline Company | | 2025 |
| Hardin | | 74.3 | % | | 11 |
| | Interstate Power and Light Company | | 2027 |
| Laredo Ridge | | 100 | % | | 80 |
| | Nebraska Public Power District | | 2031 |
| Lookout | | 75 | % | | 29 |
| | Southern Maryland Electric Cooperative | | 2030 |
| Odin | | 74.9 | % | | 15 |
| | Missouri River Energy Services | | 2028 |
| Pinnacle | | 100 | % | | 55 |
| | Maryland Department of General Services and University System of Maryland | | 2031 |
| San Juan Mesa | | 56.3 | % | | 68 |
| | Southwestern Public Service Company | | 2025 |
| Sleeping Bear | | 75 | % | | 71 |
| | Public Service Company of Oklahoma | | 2032 |
| South Trent | | 100 | % | | 101 |
| | AEP Energy Partners | | 2029 |
| Spanish Fork | | 75 | % | | 14 |
| | PacifiCorp | | 2028 |
Spring Canyon II (b) | | 90.1 | % | | 29 |
| | Platte River Power Authority | | 2039 |
Spring Canyon III (b) | | 90.1 | % | | 25 |
| | Platte River Power Authority | | 2039 |
| Taloga | | 100 | % | | 130 |
| | Oklahoma Gas & Electric | | 2031 |
| Wildorado | | 74.9 | % | | 121 |
| | Southwestern Public Service Company | | 2027 |
| | | | | 1,999 |
| | | | |
| | | | | | | | | |
|
| | | | | | | | | | |
| Projects | | Percentage Ownership | | Net Capacity (MW)(a) | | Offtake Counterparty | | Expiration |
| Thermal | | | | | | | | |
Thermal equivalent MWt (c) | | 100 | % | | 1,315 |
| | Various | | Various |
| NRG Dover Energy Center LLC | | 100 | % | | 103 |
| | NRG Power Marketing LLC | | 2018 |
| Thermal generation | | 100 | % | | 20 |
| | Various | | Various |
Total net capacity (excluding equivalent MWt)(d) | | | | 4,686 |
| | | | |
(a) Net capacity represents the maximum, or rated, generating capacity of the facility multiplied by the Company's percentage ownership in the facility as of June 30, 2016.
(b) Projects are part of tax equity arrangements.
(c) For thermal energy, net capacity represents MWt for steam or chilled water and excludes 134 MWt available under the right-to-use provisions contained in agreements between two of the Company's thermal facilities and certain of its customers.
(d) Total net capacity excludes 55 MW for RPV Holdco and 45 MW for DGPV Holdco 1 and DGPV Holdco 2, which are consolidated by NRG, as further described in Note 4, Variable Interest Entities, or VIEs.
Substantially all of the Company's generation assets are under long-term contractual arrangements for the output or capacity from these assets. The thermal assets are comprised of district energy systems and combined heat and power plants that produce steam, hot water and/or chilled water and in some instances, electricity, at a central plant. Three out of the fourteen district energy systems are subject to rate regulation by state public utility commissions while the other district energy systems have rates determined by negotiated bilateral contracts.
As described in Note 11, Related Party Transactions, the Company has a management services agreement with NRG for various services, including human resources, accounting, tax, legal, information systems, treasury, and risk management.
Stockholders' equity represents the equity associated with the Class A and Class C common stockholders, with the equity associated with the Class B and Class D common stockholder, NRG, and the third-party interests under certain tax equity arrangements classified as noncontrolling interest.
As described in Note 3, Business Acquisitions, on November 3, 2015, the Company acquired 75% of the Class B interests of NRG Wind TE Holdco, or the November 2015 Drop Down Assets, from NRG for cash consideration of $209 million. In February 2016, NRG made a final working capital payment of $2 million, reducing total cash consideration to $207 million. Additionally, on January 2, 2015, the Company acquired the Laredo Ridge, Tapestry, and Walnut Creek projects, or the January 2015 Drop Down Assets, for total cash consideration of $489 million, including $9 million for working capital. In addition, as described in Note 3, Business Acquisitions, the Company acquired the remaining 51.05% of CVSR, or the CVSR Drop Down, on September 1, 2016, for cash consideration of $78.5 million. The acquisitions of the CVSR Drop Down, the November 2015 Drop Down Assets and the January 2015 Drop Down Assets, or collectively, the Drop Down Assets, were accounted for as transfers of entities under common control. The accounting guidance requires retrospective combination of the entities for all periods presented as if the combination has been in effect since the inception of common control. Accordingly, the Company prepared its consolidated financial statements to reflect the transfers as if they had taken place from the beginning of the financial statements period or from the date the entities were under common control (if later than the beginning of the financial statements period), which was April 1, 2014 for the January Drop Down Assets and the majority of the November 2015 Drop Down Assets. The recast did not affect net income attributable to NRG Yield, Inc., weighted average number of shares outstanding, earnings per share or dividends. With respect to the November 2015 Drop Down Assets, the Company has recorded all minority interests in NRG Wind TE Holdco as noncontrolling interest in the Consolidated Financial Statements for all periods presented.
With respect to the CVSR Drop Down, prior to the transaction, the Company recorded its 48.95% interest in CVSR as an equity method investment. In connection with the retrospective adjustment of prior periods, the Company has removed the equity method investment from all prior periods and adjusted its financial statements to reflect its results of operations, financial position and cash flows as if it had consolidated CVSR from the beginning of the financial statement period.
The accompanying unaudited interim consolidated financial statements have been prepared in accordance with the SEC’s regulations for interim financial information. Accordingly, they do not include all of the information and notes required by GAAP for complete financial statements. The following notes should be read in conjunction with the accounting policies and other disclosures as set forth in the notes to the Company’s audited consolidated financial statements for the year ended December 31, 2015. Interim results are not necessarily indicative of results for a full year.
In the opinion of management, the accompanying unaudited interim consolidated financial statements contain all material adjustments consisting of normal and recurring accruals necessary to present fairly the Company's consolidated financial position as of June 30, 2016, and the results of operations, comprehensive income and cash flows for the six months ended June 30, 2016, and 2015.
Note 2 — Summary of Significant Accounting Policies
Use of Estimates
The preparation of consolidated financial statements in accordance with GAAP requires management to make estimates and assumptions. These estimates and assumptions impact the reported amount of assets and liabilities and disclosures of contingent assets and liabilities as of the date of the consolidated financial statements. They also impact the reported amount of net earnings during the reporting period. Actual results could be different from these estimates.
Noncontrolling Interests
The following table reflects the changes in the Company's noncontrolling interest balance:
|
| | | |
| | (In millions) |
| Balance as of December 31, 2015 | $ | 897 |
|
| Capital contributions from tax equity investors, net of distributions | 8 |
|
| November 2015 Drop Down Assets working capital payment | 2 |
|
| Comprehensive loss | (14 | ) |
| Distributions to NRG | (57 | ) |
| Pre-acquisition net income of Drop Down assets | $ | 4 |
|
| Balance as of June 30, 2016 | $ | 840 |
|
Distributions to NRG
The following table lists the distributions paid on NRG Yield LLC's Class B and D units during the six months ended June 30, 2016:
|
| | | | | | | |
| | Second Quarter 2016 | | First Quarter 2016 |
| Distributions per Class B Unit | $ | 0.23 |
| | $ | 0.225 |
|
| Distributions per Class D Unit | $ | 0.23 |
| | $ | 0.225 |
|
On July 26, 2016, NRG Yield LLC declared a distribution on its units of $0.24 per unit payable on September 15, 2016 to unit holders of record as of September 1, 2016. The portion of the distributions paid by NRG Yield LLC to NRG is recorded as a reduction to the Company's noncontrolling interest balance.
Additionally, the Company paid $6 million to NRG relating to its noncontrolling interest in NRG Wind TE Holdco for the six months ended June 30, 2016.
NRG Indemnity Receivable
As of June 30, 2016, $75 million remains receivable as the balance is expected to be fully recovered from the current litigation with SunPower pursuant to the existing indemnity on the project. In addition, $7 million is payable to SunPower related to amounts that SunPower overpaid for liquidated damages pursuant to the project indemnities. The agreement between NRG and the Company for the CVSR Drop Down specified that all amounts related to the litigation with SunPower are excluded from the acquisition. Accordingly, prior to close of the transaction, the $75 million receivable and $7 million payable were transferred to NRG as a net reduction to its ownership interest in CVSR.
Recent Accounting Developments
ASU 2016-07 — In March 2016, the FASB issued ASU No. 2016-07, Investments - Equity Method and Joint Ventures (Topic 323), or ASU No. 2016-07. The amendments of ASU No. 2016-07 eliminate the requirement that when an investment qualifies for use of the equity method as a result of an increase in the level of ownership interest or degree of influence, an investor must adjust the investment, results of operations, and retained earnings retroactively on a step-by-step basis as if the equity method had been in effect during all previous periods that the investment had been held. The amendments require that the equity method investor add the cost of acquiring the additional interest in the investee to the current basis of the investor's previously held interest and adopt the equity method of accounting with no retroactive adjustment to the investment. In addition, ASU No. 2016-07 requires that an entity that has an available-for-sale equity security that becomes qualified for the equity method of accounting
recognize through earnings the unrealized holding gain or loss in accumulated other comprehensive income at the date the investment becomes qualified for use of the equity method. The guidance in ASU No. 2016-07 is effective for fiscal years beginning after December 15, 2016, and interim periods within those annual periods. The adoption of ASU No. 2016-07 is required to be applied prospectively and early adoption is permitted. The Company does not expect the standard to have a material impact on its results of operations, cash flows and financial position.
ASU 2016-02 — In February 2016, the FASB issued ASU No. 2016-02, Leases (Topic 842), or ASU No. 2016-02. The amendments of ASU No. 2016-02 complete the joint effort between the FASB and the International Accounting Standards Board, or IASB, to develop a common leasing standard for GAAP and International Financial Reporting Standards, or IFRS, with the objective to increase transparency and comparability among organizations by recognizing lease assets and lease liabilities on the balance sheet and to improve financial reporting. The guidance in ASU No. 2016-02 provides that a lessee that may have previously accounted for a lease as an operating lease under current GAAP should recognize the assets and liabilities that arise from a lease on the balance sheet. In addition, ASU No. 2016-02 expands the required quantitative and qualitative disclosures with regards to lease arrangements. The guidance in ASU No. 2016-02 is effective for fiscal years beginning after December 15, 2018, and interim periods within those annual periods. The adoption of ASU No. 2016-02 is required to be applied using a modified retrospective approach for the earliest period presented and early adoption is permitted. The Company is currently evaluating the impact of the standard on the Company's results of operations, cash flows and financial position.
ASU 2016-01 — In January 2016, the FASB issued ASU No. 2016-01, Financial Instruments - Overall (Subtopic 825-10): Recognition and Measurement of Financial Assets and Financial Liabilities, or ASU No. 2016-01. The amendments of ASU No. 2016-01 eliminate available-for-sale classification of equity investments and require that equity investments (except those accounted for under the equity method of accounting, or those that result in consolidation of the investee) to be generally measured at fair value with changes in fair value recognized in net income. Further, the amendments require financial assets and financial liabilities to be presented separately in the notes to the financial statements, grouped by measurement category and form of financial asset. The guidance in ASU No. 2016-01 is effective for financial statements issued for fiscal years beginning after December 15, 2017, and interim periods within those annual periods. The Company is currently evaluating the impact of the standard on the Company's results of operations, cash flows and financial position.
ASU 2015-16 — In September 2015, the FASB issued ASU No. 2015-16, Business Combinations (Topic 805): Simplifying the Accounting for Measurement-Period Adjustments, or ASU No. 2015-16. The amendments of ASU No. 2015-16 require that an acquirer recognize measurement period adjustments to the provisional amounts recognized in a business combination in the reporting period during which the adjustments are determined. Additionally, the amendments of ASU No. 2015-16 require the acquirer to record in the same period's financial statements the effect on earnings of changes in depreciation, amortization or other income effects, if any, as a result of the measurement period adjustment, calculated as if the accounting had been completed at the acquisition date as well as disclosing on either the face of the income statement or in the notes the portion of the amount recorded in current period earnings that would have been recorded in previous reporting periods. The guidance in ASU No. 2015-16 is effective for financial statements issued for fiscal years beginning after December 15, 2015, and interim periods within those fiscal years. The amendments should be applied prospectively. The Company adopted this standard on January 1, 2016, and the adoption of this standard did not impact the Company's results of operations, cash flows or financial position.
ASU 2014-09 — In May 2014, the FASB issued ASU No. 2014-09, Revenue from Contracts with Customers (Topic 606), or ASU No. 2014-09. The amendments of ASU No. 2014-09 complete the joint effort between the FASB and the International Accounting Standards Board, or IASB, to develop a common revenue standard for GAAP and International Financial Reporting Standards, or IFRS, and to improve financial reporting. The guidance in ASU No. 2014-09 provides that an entity should recognize revenue to depict the transfer of goods or services to customers in an amount that reflects the consideration to which the entity expects to be entitled to in exchange for the goods or services provided and establishes the following steps to be applied by an entity: (1) identify the contract with a customer; (2) identify the performance obligations in the contract; (3) determine the transaction price; (4) allocate the transaction price to the performance obligations in the contract; and (5) recognize revenue when (or as) the entity satisfies the performance obligation. In August 2015, the FASB issued ASU 2015-14, which formally deferred the effective date by one year to make the guidance of ASU No. 2014-09 effective for annual reporting periods beginning after December 15, 2017, including interim periods therein. Early adoption is permitted, but not prior to the original effective date, which was for annual reporting periods beginning after December 15, 2016.
In addition to ASU No. 2014-09, the FASB has issued additional guidance which provides further clarification on Topic 606. In March 2016, the FASB issued ASU No. 2016-08, Revenue from Contracts with Customers (Topic 606), or ASU No. 2016-08. The amendments of ASU No. 2016-08 clarify how to apply the implementation guidance on principal versus agent considerations related to the sale of goods or services to a customer as updated by ASU No. 2014-09. In April 2016, the FASB issued ASU No. 2016-10, Revenue from Contracts with Customers (Topic 606), or ASU No. 2016-10. The amendments of ASU No. 2016-10 provide further clarification on contract revenue recognition as updated by ASU No. 2014-09, specifically related to the identification of separately identifiable performance obligations and the implementation of licensing contracts. In May 2016, the
FASB issued ASU No. 2016-12, Revenue from Contracts with Customers (Topic 606), or ASU No. 2016-12. The amendments of ASU No. 2016-12 provide further clarification on contract revenue recognition as updated by ASU No. 2014-09, specifically related to collectability, the presentation of tax collected from customers, and non-cash consideration, as well as offering practical expedients. The Company is working through an adoption plan which includes the evaluation of revenue contracts compared to the new standard and evaluating the impact of Topic 606 on the Company's results of operations, cash flows and financial position.
Note 3 — Business Acquisitions
2016 Acquisitions
CVSR Drop Down from NRG — On September 1, 2016, the Company acquired from NRG the remaining 51.05% interest of CVSR Holdco LLC, which indirectly owns the CVSR solar facility, for total cash consideration of $78.5 million, subject to working capital adjustments and plus assumed non-recourse project debt. The acquisition was funded with cash on hand.
The assets and liabilities transferred to the Company relate to interests under common control by NRG and were recorded at historical cost in accordance with ASC 805-50, Business Combinations - Related Issues. The difference between the cash paid and historical value of the entities' equity was recorded as a contribution from NRG with the offset to noncontrolling interest. Because the transaction constituted a transfer of net assets under common control, the guidance requires retrospective combination of the entities for all periods presented as if the combination has been in effect since the inception of common control. Prior to the transaction, the Company recorded its 48.95% interest in CVSR as an equity method investment. In connection with the retrospective adjustment of prior periods, the Company has removed the equity method investment from all prior periods and adjusted its financial statements to reflect its results of operations, financial position and cash flows as if it had consolidated CVSR from the beginning of the financial statement period.
In connection with the acquisition and prior to close of the transaction, a $68 million net receivable resulting from the litigation with SunPower, as described in Note 2, Summary of Significant Accounting Policies, was transferred to NRG as a reduction to its ownership interest in the Company.
2015 Acquisitions
November 2015 Drop Down Assets from NRG — On November 3, 2015, the Company acquired the November 2015 Drop Down Assets, a portfolio of 12 wind facilities totaling 814 net MW, from NRG for cash consideration of $209 million, subject to working capital adjustments. In February 2016, NRG made a final working capital payment of $2 million, reducing total cash consideration to $207 million. The Company is responsible for its pro-rata share of non-recourse project debt of $193 million and noncontrolling interest associated with a tax equity structure of $159 million (as of the acquisition date).
The Company funded the acquisition with borrowings from its revolving credit facility. The assets and liabilities transferred to the Company relate to interests under common control by NRG and were recorded at historical cost. The difference between the cash paid and historical value of the entities' equity was recorded as a distribution from NRG with the offset to noncontrolling interest.
The Class A interests of NRG Wind TE Holdco are owned by a tax equity investor, or TE Investor, who receives 99% of allocations of taxable income and other items until the flip point, which occurs when the TE Investor obtains a specified return on its initial investment, at which time the allocations to the TE Investor change to 8.53%. The Company generally receives 75% of CAFD until the flip point, at which time the allocations to the Company of CAFD change to 68.60%. If the flip point has not occurred by a specified date, 100% of CAFD is allocated to the TE Investor until the flip point occurs. NRG Wind TE Holdco is a VIE and the Company is the primary beneficiary, through its position as managing member, and consolidates NRG Wind TE Holdco.
Desert Sunlight — On June 29, 2015, the Company acquired 25% of the membership interest in Desert Sunlight Investment Holdings, LLC, which owns two solar photovoltaic facilities that total 550 MW, located in Desert Center, California from EFS Desert Sun, LLC, an affiliate of GE Energy Financial Services for a purchase price of $285 million. Power generated by the facilities is sold to Southern California Edison and Pacific Gas and Electric under long-term PPAs with approximately 20 years and 25 years of remaining contract life, respectively. The Company accounts for its 25% investment as an equity method investment.
Spring Canyon — On May 7, 2015, the Company acquired a 90.1% interest in Spring Canyon II, a 32 MW wind facility, and Spring Canyon III, a 28 MW wind facility, each located in Logan County, Colorado, from Invenergy Wind Global LLC. The purchase price was funded with cash on hand. Power generated by Spring Canyon II and Spring Canyon III is sold to Platte River Power Authority under long-term PPAs with approximately 24 years of remaining contract life.
University of Bridgeport Fuel Cell — On April 30, 2015, the Company completed the acquisition of the University of Bridgeport Fuel Cell project in Bridgeport, Connecticut from FuelCell Energy, Inc. The project added an additional 1.4 MW of thermal capacity to the Company's portfolio, with a 12-year contract, with the option for a 7-year extension. The acquisition is reflected in the Company's Thermal segment.
January 2015 Drop Down Assets from NRG — On January 2, 2015, the Company acquired the following projects from NRG: (i) Laredo Ridge, an 80 MW wind facility located in Petersburg, Nebraska, (ii) Tapestry, which includes Buffalo Bear, a 19 MW wind facility in Buffalo, Oklahoma; Taloga, a 130 MW wind facility in Putnam, Oklahoma; and Pinnacle, a 55 MW wind facility in Keyser, West Virginia, and (iii) Walnut Creek, a 485 MW natural gas facility located in City of Industry, California, for total cash consideration of $489 million, including $9 million for working capital, plus assumed project-level debt of $737 million. The Company funded the acquisition with cash on hand and drawings under its revolving credit facility. The assets and liabilities transferred to the Company relate to interests under common control by NRG and were recorded at historical cost. The difference between the cash paid and the historical value of the entities' equity of $61 million, as well as $23 million of AOCL, was recorded as a distribution to NRG and reduced the balance of its noncontrolling interest.
Note 4 — Variable Interest Entities, or VIEs
Entities that are Consolidated
The Company has a controlling financial interest in certain entities which have been identified as VIEs under ASC 810, Consolidations, or ASC 810. These arrangements are primarily related to tax equity arrangements entered into with third parties in order to monetize certain tax credits associated with wind facilities, as further described in Note 5, Investments Accounted for by the Equity Method and Variable Interest Entities, to the Company's audited consolidated financial statements included in the 2015 Form 10-K.
Summarized financial information for the Company's consolidated VIEs consisted of the following as of June 30, 2016:
|
| | | | | | | | | | | |
| (In millions) | NRG Wind TE Holdco | | Alta Wind TE Holdco | | Spring Canyon |
| Other current and non-current assets | $ | 190 |
| | $ | 27 |
| | $ | 4 |
|
| Property, plant and equipment | 638 |
| | 472 |
| | 102 |
|
| Intangible assets | 2 |
| | 281 |
| | — |
|
| Total assets | 830 |
| | 780 |
| | 106 |
|
| Current and non-current liabilities | 215 |
| | 8 |
| | 6 |
|
| Total liabilities | 215 |
| | 8 |
| | 6 |
|
| Noncontrolling interest | 235 |
| | 121 |
| | 70 |
|
| Net assets less noncontrolling interests | $ | 380 |
| | $ | 651 |
| | $ | 30 |
|
Entities that are not Consolidated
The Company has interests in entities that are considered VIEs under ASC 810, but for which it is not considered the primary beneficiary. The Company accounts for its interests in these entities under the equity method of accounting, as further described in Note 5, Investments Accounted for by the Equity Method and Variable Interest Entities, to the Company's audited consolidated financial statements included in the 2015 Form 10-K.
NRG DGPV Holdco 1 LLC — The Company and NRG, maintain a partnership, NRG DGPV Holdco 1 LLC, or DGPV Holdco 1, the purpose of which is to own or purchase solar power generation projects and other ancillary related assets from NRG Renew LLC or its subsidiaries, via intermediate funds, including: (i) a tax equity-financed portfolio of 10 recently completed community solar projects representing approximately 8 MW with a weighted average remaining PPA term of 20 years; and (ii) a tax equity-financed portfolio of approximately 12 commercial photovoltaic systems representing approximately 37 MW with a weighted average remaining PPA term of 19 years. Both of these investments relate to the Company's $100 million commitment to distributed solar projects in partnership with NRG.
NRG DGPV Holdco 2 LLC — On February 29, 2016, the Company and NRG entered into an additional partnership by forming NRG DGPV Holdco 2 LLC, or DGPV Holdco 2, to own or purchase solar power generation projects and other ancillary related assets from NRG Renew LLC or its subsidiaries, via intermediate funds. Under this partnership, the Company committed to fund up to $50 million of capital.
The Company's maximum exposure to loss is limited to its equity investment in DGPV Holdco 1 and DGPV Holdco 2, which was $78 million on a combined basis as of June 30, 2016.
NRG RPV Holdco 1 LLC — The Company and NRG Residential Solar Solutions LLC, a subsidiary of NRG, maintain a partnership, NRG RPV Holdco 1 LLC, or RPV Holdco, that holds operating portfolios of residential solar assets developed by NRG Home Solar, a subsidiary of NRG, including: (i) an existing, unlevered portfolio of over 2,200 leases across nine states representing approximately 17 MW with a weighted average remaining lease term of approximately 17 years; and (ii) a tax equity-financed portfolio of approximately 5,500 leases representing approximately 38 MW, with an average lease term for the existing and new leases of approximately 17 to 20 years. Under this partnership, the Company had previously committed to fund up to $150 million of capital, which was reduced to $100 million in February 2016.
The Company's maximum exposure to loss is limited to its equity investment, which was $67 million as of June 30, 2016.
On August 5, 2016, the Company and NRG amended the RPV Holdco partnership to further reduce the aggregate commitment of $100 million to $60 million in connection with NRG’s change in business model approach in the residential solar business.
GenConn Energy LLC — The Company has a 50% interest in GCE Holding LLC, the owner of GenConn, which owns and operates two 190 MW peaking generation facilities in Connecticut at the Devon and Middletown sites. As of June 30, 2016, the Company's investment in GenConn was $108 million and its maximum exposure to loss is limited to its equity investment.
The following table presents summarized financial information for GCE Holding LLC:
|
| | | | | | | | | | | | | | | |
| | Three months ended June 30, | | Six months ended June 30, |
| (In millions) | 2016 | | 2015 | | 2016 | | 2015 |
| Income Statement Data: | | | |
| Operating revenues | $ | 18 |
| | $ | 18 |
| | $ | 36 |
| | $ | 40 |
|
| Operating income | 10 |
| | 11 |
| | 19 |
| | 20 |
|
| Net income | $ | 6 |
| | $ | 8 |
| | $ | 13 |
| | $ | 14 |
|
|
| | | | | | | |
| | June 30, 2016 | | December 31, 2015 |
| Balance Sheet Data: | (In millions) |
| Current assets | $ | 34 |
| | $ | 36 |
|
| Non-current assets | 408 |
| | 416 |
|
| Current liabilities | 14 |
| | 16 |
|
| Non-current liabilities | $ | 211 |
| | $ | 215 |
|
Note 5 — Fair Value of Financial Instruments
Fair Value Accounting under ASC 820
ASC 820 establishes a fair value hierarchy that prioritizes the inputs to valuation techniques used to measure fair value into three levels as follows:
| |
| • | Level 1—quoted prices (unadjusted) in active markets for identical assets or liabilities that the Company has the ability to access as of the measurement date. |
| |
| • | Level 2—inputs other than quoted prices included within Level 1 that are directly observable for the asset or liability or indirectly observable through corroboration with observable market data. |
| |
| • | Level 3—unobservable inputs for the asset or liability only used when there is little, if any, market activity for the asset or liability at the measurement date. |
In accordance with ASC 820, the Company determines the level in the fair value hierarchy within which each fair value measurement in its entirety falls, based on the lowest level input that is significant to the fair value measurement.
For cash and cash equivalents, restricted cash, accounts receivable, accounts receivable — affiliate, accounts payable, accounts payable — affiliate, accrued expenses and other liabilities, the carrying amounts approximate fair value because of the short-term maturity of those instruments and are classified as Level 1 within the fair value hierarchy.
The estimated carrying amounts and fair values of the Company’s recorded financial instruments not carried at fair market value are as follows:
|
| | | | | | | | | | | | | | | |
| | As of June 30, 2016 | | As of December 31, 2015 |
| | Carrying Amount | | Fair Value | | Carrying Amount | | Fair Value |
| (In millions) | |
| Assets: | | | | | | | |
| Notes receivable, including current portion | $ | 38 |
| | $ | 38 |
| | $ | 47 |
| | $ | 47 |
|
| Liabilities: | | | | | | | |
| Long-term debt, including current portion | $ | 5,552 |
| | $ | 5,552 |
| | $ | 5,656 |
| | $ | 5,538 |
|
The fair value of notes receivable and long-term debt are based on expected future cash flows discounted at market interest rates, or current interest rates for similar instruments, and are classified as Level 3 within the fair value hierarchy.
Recurring Fair Value Measurements
The Company records its derivative assets and liabilities at fair value on its consolidated balance sheet. There were no derivative asset positions on the Company's consolidated balance sheet as of December 31, 2015. The following table presents assets and liabilities measured and recorded at fair value on the Company's consolidated balance sheets on a recurring basis and their level within the fair value hierarchy:
|
| | | | | | | |
| | As of June 30, 2016 | | As of December 31, 2015 |
| | Fair Value (a) | | Fair Value (a) |
| (In millions) | Level 2 | | Level 2 |
| Derivative assets: | | | |
| Commodity contracts | $ | 1 |
| | $ | — |
|
| Total assets | 1 |
| | — |
|
| Derivative liabilities: | | | |
| Commodity contracts | — |
| | 2 |
|
| Interest rate contracts | 159 |
| | 98 |
|
| Total liabilities | $ | 159 |
| | $ | 100 |
|
(a) There were no assets or liabilities classified as Level 1 or Level 3 as of June 30, 2016, and December 31, 2015.
Derivative Fair Value Measurements
The Company's contracts are non-exchange-traded and valued using prices provided by external sources. For the Company’s energy markets, management receives quotes from multiple sources. To the extent that multiple quotes are received, the prices reflect the average of the bid-ask mid-point prices obtained from all sources believed to provide the most liquid market for the commodity.
The fair value of each contract is discounted using a risk free interest rate. In addition, a credit reserve is applied to reflect credit risk, which is, for interest rate swaps, calculated based on credit default swaps using the bilateral method. For commodities, to the extent that the net exposure under a specific master agreement is an asset, the Company uses the counterparty’s default swap rate. If the net exposure under a specific master agreement is a liability, the Company uses NRG's default swap rate. For interest rate swaps and commodities, the credit reserve is added to the discounted fair value to reflect the exit price that a market participant would be willing to receive to assume the liabilities or that a market participant would be willing to pay for the assets. As of June 30, 2016, the credit reserve resulted in a $5 million increase in fair value, which was composed of a $4 million gain in OCI and $1 million gain in interest expense. It is possible that future market prices could vary from those used in recording assets and liabilities and such variations could be material.
Concentration of Credit Risk
In addition to the credit risk discussion in Note 2, Summary of Significant Accounting Policies, to the Company's audited consolidated financial statements included in the Company's 2015 Form 10-K, the following is a discussion of the concentration of credit risk for the Company's financial instruments. Credit risk relates to the risk of loss resulting from non-performance or non-payment by counterparties pursuant to the terms of their contractual obligations. The Company monitors and manages credit risk through credit policies that include: (i) an established credit approval process; (ii) daily monitoring of counterparties' credit limits; (iii) the use of credit mitigation measures such as margin, collateral, prepayment arrangements, or volumetric limits; (iv) the use of payment netting agreements; and (v) the use of master netting agreements that allow for the netting of positive and negative exposures of various contracts associated with a single counterparty. Risks surrounding counterparty performance and credit could ultimately impact the amount and timing of expected cash flows. The Company seeks to mitigate counterparty risk by having a diversified portfolio of counterparties.
Counterparty credit exposure includes credit risk exposure under certain long-term agreements, including solar and other PPAs. As external sources or observable market quotes are not available to estimate such exposure, the Company estimates the exposure related to these contracts based on various techniques including, but not limited to, internal models based on a fundamental analysis of the market and extrapolation of observable market data with similar characteristics. Based on these valuation techniques, as of June 30, 2016, credit risk exposure to these counterparties attributable to the Company's ownership interests was approximately $2.6 billion for the next five years. The majority of these power contracts are with utilities with strong credit quality and public utility commission or other regulatory support, as further described in Note 12, Segment Reporting, to the Company's audited consolidated financial statements included in the Company's 2015 Form 10-K. However, such regulated utility counterparties can be impacted by changes in government regulations, which the Company is unable to predict.
Note 6 — Accounting for Derivative Instruments and Hedging Activities
This footnote should be read in conjunction with the complete description under Note 7, Accounting for Derivative Instruments and Hedging Activities, to the Company's audited consolidated financial statements included in the Company's 2015 Form 10-K.
Energy-Related Commodities
As of June 30, 2016, the Company had forward contracts for the purchase of fuel commodities relating to the forecasted usage of the Company’s district energy centers extending through 2018. At June 30, 2016, these contracts were not designated as cash flow or fair value hedges.
Interest Rate Swaps
As of June 30, 2016, the Company had interest rate derivative instruments on non-recourse debt extending through 2031, most of which are designated as cash flow hedges.
Volumetric Underlying Derivative Transactions
The following table summarizes the net notional volume buy/(sell) of the Company's open derivative transactions broken out by commodity as of June 30, 2016, and December 31, 2015.
|
| | | | | | | | | |
| | | | Total Volume |
| | | | June 30, 2016 | | December 31, 2015 |
| Commodity | Units | | (In millions) |
| Natural Gas | MMBtu | | 4 |
| | 4 |
|
| Interest | Dollars | | $ | 1,932 |
| | $ | 1,991 |
|
Fair Value of Derivative Instruments
There were no derivative asset positions on the balance sheet as of December 31, 2015. The following table summarizes the fair value within the derivative instrument valuation on the balance sheet:
|
| | | | | | | | | | | |
| | Fair Value |
| | Derivative Assets | | Derivative Liabilities |
| | June 30, 2016 | | June 30, 2016 | | December 31, 2015 |
| | (In millions) |
| Derivatives Designated as Cash Flow Hedges: | | | | | |
| Interest rate contracts current | $ | — |
| | $ | 34 |
| | $ | 34 |
|
| Interest rate contracts long-term | — |
| | 108 |
| | 56 |
|
| Total Derivatives Designated as Cash Flow Hedges | — |
| | 142 |
| | 90 |
|
| Derivatives Not Designated as Cash Flow Hedges: | | | | | |
| Interest rate contracts current | — |
| | 3 |
| | 3 |
|
| Interest rate contracts long-term | — |
| | 14 |
| | 5 |
|
| Commodity contracts current | 1 |
| | — |
| | 2 |
|
| Total Derivatives Not Designated as Cash Flow Hedges | 1 |
| | 17 |
| | 10 |
|
| Total Derivatives | $ | 1 |
| | $ | 159 |
| | $ | 100 |
|
The Company has elected to present derivative assets and liabilities on the balance sheet on a trade-by-trade basis and does not offset amounts at the counterparty master agreement level. As of June 30, 2016, and December 31, 2015, there were no offsetting amounts at the counterparty master agreement level or outstanding collateral paid or received. Accumulated Other Comprehensive Loss
The following table summarizes the effects on the Company’s accumulated OCL balance attributable to interest rate swaps designated as cash flow hedge derivatives, net of tax:
|
| | | | | | | | | | | | | | | |
| | Three months ended June 30, | | Six months ended June 30, |
| | 2016 | | 2015 | | 2016 | | 2015 |
| | (In millions) |
| Accumulated OCL beginning balance | $ | (124 | ) | | $ | (96 | ) | | $ | (83 | ) | | $ | (76 | ) |
| Reclassified from accumulated OCL to income due to realization of previously deferred amounts | 3 |
| | 4 |
| | 6 |
| | 7 |
|
| Mark-to-market of cash flow hedge accounting contracts | (19 | ) | | 19 |
| | (63 | ) | | (4 | ) |
| Accumulated OCL ending balance, net of income tax benefit of $28 and $10, respectively | $ | (140 | ) | | $ | (73 | ) | | $ | (140 | ) | | $ | (73 | ) |
| Accumulated OCL attributable to noncontrolling interests | (93 | ) | | (57 | ) | | (93 | ) | | (57 | ) |
| Accumulated OCL attributable to NRG Yield, Inc. | $ | (47 | ) | | $ | (16 | ) | | $ | (47 | ) | | $ | (16 | ) |
| Losses expected to be realized from OCL during the next 12 months, net of income tax benefit of $4 | $ | (19 | ) | | | | $ | (19 | ) | | |
Amounts reclassified from accumulated OCL into income and amounts recognized in income from the ineffective portion of cash flow hedges are recorded to interest expense. There was no ineffectiveness for the six months ended June 30, 2016, and 2015.
Impact of Derivative Instruments on the Statements of Income
The Company has interest rate derivative instruments that are not designated as cash flow hedges. The effect of interest rate hedges is recorded to interest expense. For the three months ended June 30, 2016, and 2015, the impact to the consolidated statements of income was a loss of $2 million and a gain of $31 million, respectively. For the six months ended June 30, 2016, and 2015, the impact to the consolidated statements of income was a loss of $9 million and a gain of $19 million, respectively.
A portion of the Company’s derivative commodity contracts relates to its Thermal Business for the purchase of fuel commodities based on the forecasted usage of the thermal district energy centers. Realized gains and losses on these contracts are reflected in the fuel costs that are permitted to be billed to customers through the related customer contracts or tariffs and, accordingly, no gains or losses are reflected in the consolidated statements of income for these contracts.
Commodity contracts also hedged the forecasted sale of power for Elbow Creek, Alta X and Alta XI in 2015 until the start of the PPAs. The effect of these commodity hedges was recorded to operating revenues. For the three and six months ended June 30, 2015, the impact to the consolidated statements of income was an unrealized loss of $4 million and an unrealized gain of $3 million, respectively.
See Note 5, Fair Value of Financial Instruments, for a discussion regarding concentration of credit risk.
Note 7 — Long-term Debt
This footnote should be read in conjunction with the complete description under Note 9, Long-term Debt, to the Company's audited consolidated financial statements included in the 2015 Form 10-K. Long-term debt consisted of the following: |
| | | | | | | | | | | | | | |
| | | June 30, 2016 | | December 31, 2015 | | June 30, 2016, interest rate % (a) | | Letters of Credit Outstanding at June 30, 2016 |
| | | (In millions, except rates) | | |
2019 Convertible Notes (b) | | $ | 333 |
| | $ | 330 |
| | 3.500 | | |
2020 Convertible Notes (c) | | 268 |
| | 266 |
| | 3.250 | | |
| 2024 Senior Notes | | 500 |
| | 500 |
| | 5.375 | | |
NRG Yield LLC and NRG Yield Operating LLC Revolving Credit Facility, due 2019 (d) | | 318 |
| | 306 |
| | L+2.75 | | $ | 67 |
|
| Project-level debt: | | | | | | | | |
| Alpine, due 2022 | | 151 |
| | 154 |
| | L+1.75 | | 37 |
|
| Alta Wind I, lease financing arrangement, due 2034 | | 245 |
| | 252 |
| | 7.015 | | 16 |
|
| Alta Wind II, lease financing arrangement, due 2034 | | 194 |
| | 198 |
| | 5.696 | | 23 |
|
| Alta Wind III, lease financing arrangement, due 2034 | | 201 |
| | 206 |
| | 6.067 | | 24 |
|
| Alta Wind IV, lease financing arrangement, due 2034 | | 130 |
| | 133 |
| | 5.938 | | 16 |
|
| Alta Wind V, lease financing arrangement, due 2035 | | 208 |
| | 213 |
| | 6.071 | | 27 |
|
| Alta Realty Investments, due 2031 | | 32 |
| | 33 |
| | 7.000 | | — |
|
| Alta Wind Asset Management, due 2031 | | 18 |
| | 19 |
| | L+2.375 | | — |
|
| Avra Valley, due 2031 | | 58 |
| | 60 |
| | L+1.75 | | 3 |
|
| Blythe, due 2028 | | 21 |
| | 21 |
| | L+1.625 | | 6 |
|
| Borrego, due 2025 and 2038 | | 71 |
| | 72 |
| | L+ 2.50/5.65 | | 5 |
|
| CVSR, due 2037 | | 780 |
| | 793 |
| | 2.339 - 3.775 | | — |
|
| El Segundo Energy Center, due 2023 | | 457 |
| | 485 |
| | L+1.625 - L+2.25 | | 82 |
|
| Energy Center Minneapolis, due 2017 and 2025 | | 100 |
| | 108 |
| | 5.95 -7.25 | | — |
|
| Kansas South, due 2031 | | 31 |
| | 33 |
| | L+2.00 | | 4 |
|
| Laredo Ridge, due 2028 | | 102 |
| | 104 |
| | L+1.875 | | 10 |
|
| Marsh Landing, due 2017 and 2023 | | 410 |
| | 418 |
| | L+1.75 - L+1.875 | | 45 |
|
| PFMG and related subsidiaries financing agreement, due 2030 | | 29 |
| | 29 |
| | 6.000 | | — |
|
| Roadrunner, due 2031 | | 38 |
| | 40 |
| | L+1.625 | | 5 |
|
| South Trent Wind, due 2020 | | 59 |
| | 62 |
| | L+1.625 | | 10 |
|
| TA High Desert, due 2020 and 2032 | | 51 |
| | 52 |
| | L+2.50/5.15 | | 8 |
|
| Tapestry, due 2021 | | 176 |
| | 181 |
| | L+1.625 | | 20 |
|
| Viento, due 2023 | | 183 |
| | 189 |
| | L+2.75 | | 27 |
|
| Walnut Creek, due 2023 | | 341 |
| | 351 |
| | L+1.625 | | 60 |
|
| WCEP Holdings, due 2023 | | 46 |
| | 46 |
| | L+3.00 | | — |
|
| Other | | 1 |
| | 2 |
| | various | | — |
|
| Subtotal project-level debt: | | 4,133 |
| | 4,254 |
| | | | |
| Total debt | | 5,552 |
| | 5,656 |
| | | | |
| Less current maturities | | 274 |
| | 264 |
| | | | |
| Less deferred financing costs | | 60 |
| | 63 |
| | | | |
| Total long-term debt | | $ | 5,218 |
| | $ | 5,329 |
| | | | |
(a) As of June 30, 2016, L+ equals 3 month LIBOR plus x%, except for the Marsh Landing term loan, Walnut Creek term loan, and NRG Yield LLC and NRG Yield Operating LLC Revolving Credit Facility, where L+ equals 1 month LIBOR plus x% and Kansas South, where L+ equals 6 month LIBOR plus x%.
(b) Net of discount of $12 million and $15 million as of June 30, 2016, and December 31, 2015, respectively.
(c) Net of discount of $19 million and $21 million as of June 30, 2016, and December 31, 2015, respectively.
(d) Applicable rate is determined by the Borrower Leverage Ratio, as defined in the credit agreement.
The financing arrangements listed above contain certain covenants, including financial covenants that the Company is required to be in compliance with during the term of the respective arrangement. As of June 30, 2016, the Company was in compliance with all of the required covenants.
The discussion below describes material changes to or additions of long-term debt for the six months ended June 30, 2016, as well as any other material financing transactions that took place subsequent to June 30, 2016.
CVSR Holdco Financing Arrangement
On July 15, 2016, CVSR Holdco, the indirect owner of the CVSR project, issued $200 million of senior secured notes that bear interest at 4.68% and mature on March 31, 2037. Net proceeds were distributed to the Company and NRG based on the ownership as of July 15, 2016, and accordingly, the Company received net proceeds of $97.5 million.
NRG Yield Operating LLC 2026 Senior Notes
On August 18, 2016, NRG Yield Operating LLC issued $350 million of senior unsecured notes, or the 2026 Senior Notes. The 2026 Senior Notes bear interest of 5.00% and mature on September 15, 2026. Interest on the notes is payable semi-annually on March 15 and September 15 of each year, and commence on March 15, 2017. The 2026 Senior Notes are senior unsecured obligations of NRG Yield Operating LLC and are guaranteed by NRG Yield LLC, and by certain of Yield Operating LLC’s wholly owned current and future subsidiaries. A portion of the proceeds of the 2026 Senior Notes were used to repay the revolving credit facility as described below.
NRG Yield LLC and NRG Yield Operating LLC Revolving Credit Facility
The Company borrowed $60 million from the revolving credit facility and repaid $366 million during the eight months ended August 31, 2016. The repayments included the Company's pro rata proceeds of $97.5 million from the CVSR Holdco Financing Arrangement, as described above, along with $28 million of cash on hand. Additionally, in August 2016, the Company used a portion of its proceeds from the 2026 Senior Notes to pay the remaining revolver balance of $193 million in full as described above.
Note 8 — Earnings Per Share
Basic and diluted earnings (loss) per common share are computed by dividing net income (loss) by the weighted average number of common shares outstanding. Shares issued during the year are weighted for the portion of the year that they were outstanding. The number of shares and per share amounts for the prior periods presented below have been retrospectively restated to reflect the Recapitalization.
The reconciliation of the Company's basic and diluted earnings per share is shown in the following tables:
|
| | | | | | | | | | | | | | | |
| | Three months ended June 30, |
| | 2016 | | 2015 |
(In millions, except per share data) (a) | Common Class A | | Common Class C | | Common Class A | | Common Class C |
| Basic earnings per share attributable to NRG Yield, Inc. common stockholders | | | | | | | |
| Net income attributable to NRG Yield, Inc. | $ | 11 |
| | $ | 21 |
| | $ | 5 |
| | $ | 5 |
|
| Weighted average number of common shares outstanding - basic | 35 |
| | 63 |
| | 35 |
| | 35 |
|
| Earnings per weighted average common share — basic | $ | 0.33 |
| | $ | 0.33 |
| | $ | 0.15 |
| | $ | 0.15 |
|
| Diluted earnings per share attributable to NRG Yield, Inc. common stockholders | | | | | | | |
| Net income attributable to NRG Yield, Inc. | $ | 14 |
| | $ | 23 |
| | $ | 5 |
| | $ | 5 |
|
| Weighted average number of common shares outstanding - diluted | 49 |
| | 73 |
| | 35 |
| | 35 |
|
| Earnings per weighted average common share — diluted | $ | 0.29 |
| | $ | 0.31 |
| | $ | 0.15 |
| | $ | 0.15 |
|
|
| | | | | | | | | | | | | | | |
| | Six months ended June 30, |
| | 2016 | | 2015 |
(In millions, except per share data) (a) | Common Class A | | Common Class C | | Common Class A | | Common Class C |
| Basic and diluted earnings per share attributable to NRG Yield, Inc. common stockholders | | | | | | | |
| Net income attributable to NRG Yield, Inc. | $ | 13 |
| | $ | 24 |
| | $ | 3 |
| | $ | 3 |
|
| Weighted average number of common shares outstanding | 35 |
| | 63 |
| | 35 |
| | 35 |
|
| Earnings per weighted average common share — basic and diluted | $ | 0.38 |
| | $ | 0.38 |
| | $ | 0.07 |
| | $ | 0.07 |
|
(a) Net income attributable to NRG Yield, Inc. and basic and diluted earnings per share might not recalculate due to presenting values in millions rather than whole dollars.
With respect to the Class A common stock, there were a total of 15 million anti-dilutive outstanding equity instruments for the six months ended June 30, 2016, and the three and six months ended June 30, 2015, related to the 2019 Convertible Notes. With respect to the Class C common stock, there were a total of 10 million anti-dilutive outstanding equity instruments for the six months ended June 30, 2016 related to the 2020 Convertible Notes.
Note 9 — Segment Reporting
The Company’s segment structure reflects how management currently operates and allocates resources. The Company's businesses are primarily segregated based on conventional power generation, renewable businesses which consist of solar and wind, and the thermal and chilled water business. The Corporate segment reflects the Company's corporate costs. The Company's chief operating decision maker, its Chief Executive Officer, evaluates the performance of its segments based on operational measures including adjusted earnings before interest, taxes, depreciation and amortization, or Adjusted EBITDA, and CAFD, as well as economic gross margin and net income (loss).
|
| | | | | | | | | | | | | | | | | | | |
| | Three months ended June 30, 2016 (a) |
| (In millions) | Conventional Generation | | Renewables | | Thermal | | Corporate | | Total |
| Operating revenues | $ | 85 |
| | $ | 159 |
| | $ | 39 |
| | $ | — |
| | $ | 283 |
|
| Cost of operations | 16 |
| | 34 |
| | 27 |
| | — |
| | 77 |
|
| Depreciation and amortization | 20 |
| | 50 |
| | 5 |
| | — |
| | 75 |
|
| General and administrative | — |
| | — |
| | — |
| | 3 |
| | 3 |
|
| Operating income (loss) | 49 |
| | 75 |
| | 7 |
| | (3 | ) | | 128 |
|
| Equity in earnings of unconsolidated affiliates | 4 |
| | 9 |
| | — |
| | — |
| | 13 |
|
| Other income, net | — |
| | 2 |
| | — |
| | — |
| | 2 |
|
| Interest expense | (12 | ) | | (36 | ) | | (1 | ) | | (19 | ) | | (68 | ) |
| Income (loss) before income taxes | 41 |
| | 50 |
| | 6 |
| | (22 | ) | | 75 |
|
| Income tax expense | — |
| | — |
| | — |
| | 12 |
| | 12 |
|
| Net Income (Loss) | $ | 41 |
| | $ | 50 |
| | $ | 6 |
| | $ | (34 | ) | | $ | 63 |
|
| Total Assets | $ | 2,037 |
| | $ | 5,862 |
| | $ | 423 |
| | $ | 186 |
| | $ | 8,508 |
|
(a) Retrospectively adjusted as discussed in Note 1, Nature of Business.
|
| | | | | | | | | | | | | | | | | | | |
| | Three months ended June 30, 2015 (a) |
| (In millions) | Conventional Generation | | Renewables | | Thermal | | Corporate | | Total |
| Operating revenues | $ | 85 |
| | $ | 132 |
| | $ | 42 |
| | $ | — |
| | $ | 259 |
|
| Cost of operations | 15 |
| | 32 |
| | 31 |
| | — |
| | 78 |
|
| Depreciation and amortization | 21 |
| | 53 |
| | 4 |
| | — |
| | 78 |
|
| General and administrative | — |
| | — |
| | — |
| | 3 |
| | 3 |
|
| Acquisition-related transaction and integration costs | — |
| | — |
| | — |
| | 1 |
| | 1 |
|
| Operating income (loss) | 49 |
| | 47 |
| | 7 |
| | (4 | ) | | 99 |
|
| Equity in earnings of unconsolidated affiliates | 4 |
| | — |
| | — |
| | — |
| | 4 |
|
| Other income, net | — |
| | 1 |
| | — |
| | — |
| | 1 |
|
| Loss on debt extinguishment | (7 | ) | | — |
| | — |
| | — |
| | (7 | ) |
| Interest expense | (13 | ) | | (23 | ) | | (2 | ) | | (13 | ) | | (51 | ) |
| Income (loss) before income taxes | 33 |
| | 25 |
| | 5 |
| | (17 | ) | | 46 |
|
| Income tax expense | — |
| | — |
| | — |
| | 4 |
| | 4 |
|
| Net Income (Loss) | $ | 33 |
|
| $ | 25 |
|
| $ | 5 |
|
| $ | (21 | ) |
| $ | 42 |
|
(a) Retrospectively adjusted as discussed in Note 1, Nature of Business.
|
| | | | | | | | | | | | | | | | | | | |
| Six months ended June 30, 2016 (a) |
| (In millions) | Conventional Generation |
| Renewables |
| Thermal |
| Corporate |
| Total |
| Operating revenues | $ | 164 |
| | $ | 270 |
| | $ | 83 |
| | $ | — |
|
| $ | 517 |
|
| Cost of operations | 39 |
| | 67 |
| | 56 |
| | — |
|
| 162 |
|
| Depreciation and amortization | 40 |
| | 99 |
| | 10 |
| | — |
|
| 149 |
|
| General and administrative | — |
| | — |
| | — |
| | 6 |
|
| 6 |
|
| Operating income (loss) | 85 |
| | 104 |
| | 17 |
| | (6 | ) | | 200 |
|
| Equity in earnings of unconsolidated affiliates | 7 |
| | 9 |
| | — |
| |
|
|
| 16 |
|
| Other income, net | — |
| | 2 |
| | — |
| | — |
| | 2 |
|
| Interest expense | (23 | ) | | (78 | ) | | (3 | ) | | (38 | ) |
| (142 | ) |
| Income (loss) before income taxes | 69 |
| | 37 |
| | 14 |
| | (44 | ) |
| 76 |
|
| Income tax expense | — |
| | — |
| | — |
| | 12 |
|
| 12 |
|
| Net Income (Loss) | $ | 69 |
|
| $ | 37 |
|
| $ | 14 |
|
| $ | (56 | ) |
| $ | 64 |
|
(a) Retrospectively adjusted as discussed in Note 1, Nature of Business.
|
| | | | | | | | | | | | | | | | | | | |
| | Six months ended June 30, 2015 (a) |
| (In millions) | Conventional Generation | | Renewables | | Thermal | | Corporate | | Total |
| Operating revenues | $ | 161 |
| | $ | 223 |
| | $ | 89 |
| | $ | — |
| | $ | 473 |
|
| Cost of operations | 36 |
| | 63 |
| | 65 |
| | — |
| | 164 |
|
| Depreciation and amortization | 42 |
| | 102 |
| | 9 |
| | — |
| | 153 |
|
| General and administrative | — |
| | — |
| | — |
| | 6 |
| | 6 |
|
| Acquisition-related transaction and integration costs | — |
| | — |
| | — |
| | 1 |
| | 1 |
|
| Operating income (loss) | 83 |
| | 58 |
| | 15 |
| | (7 | ) | | 149 |
|
| Equity in earnings of unconsolidated affiliates | 7 |
| | — |
| | — |
| | — |
| | 7 |
|
| Other income, net | 1 |
| | 1 |
| | — |
| | — |
| | 2 |
|
| Loss on debt extinguishment | (7 | ) | | — |
| | — |
| | — |
| | (7 | ) |
| Interest expense | (25 | ) | | (75 | ) | | (4 | ) | | (26 | ) | | (130 | ) |
| Income (loss) before income taxes | 59 |
| | (16 | ) | | 11 |
| | (33 | ) | | 21 |
|
| Net Income (Loss) | $ | 59 |
|
| $ | (16 | ) |
| $ | 11 |
|
| $ | (33 | ) |
| $ | 21 |
|
(a) Retrospectively adjusted as discussed in Note 1, Nature of Business.
Note 10 — Income Taxes
Effective Tax Rate
The income tax provision consisted of the following:
|
| | | | | | | | | | | | | | | |
| | Three months ended June 30, | | Six months ended June 30, |
| | 2016 | | 2015 | | 2016 | | 2015 |
| | (In millions, except percentages) |
| Income before income taxes | $ | 75 |
| | $ | 46 |
| | $ | 76 |
| | $ | 21 |
|
| Income tax expense | 12 |
| | 4 |
| | 12 |
| | — |
|
| Effective income tax rate | 16.0 | % | | 8.7 | % | | 15.8 | % | | — | % |
For the three and six months ended June 30, 2016, and 2015, the overall effective tax rate was different than the statutory rate of 35% primarily due to taxable earnings allocated to NRG resulting from its interest in NRG Yield LLC and production and investment tax credits generated from certain wind and solar assets, respectively.
For tax purposes, NRG Yield LLC is treated as a partnership; therefore, the Company and NRG each record their respective share of taxable income or loss.
Note 11 — Related Party Transactions
In addition to the transactions and relationships described elsewhere in these notes to the consolidated financial statements, NRG and certain subsidiaries of NRG provide services to the Company and its project entities. Amounts due to NRG subsidiaries are recorded as accounts payable - affiliate and amounts due to the Company from NRG or its subsidiaries are recorded as accounts receivable - affiliate in the Company's balance sheet.
Power Hedge Contracts by and between Renewables segment Entities and NRG
Certain NRG Wind TE Holdco entities, which are subsidiaries in the Renewables segment, entered into power hedge contracts with NRG Texas Power LLC and generated $12 million during the six months ended June 30, 2015. Effective October 2015, Elbow Creek, one of the NRG Wind TE Holdco entities, entered into a PPA with NRG Power Marketing LLC, or NRG Power Marketing, as further described below, and the hedge agreement between Elbow Creek and NRG Texas Power LLC was terminated.
Additionally, Alta X and Alta XI entered into a hedge agreement with NRG Power Marketing, as further described in Note 6, Accounting for Derivative Instruments and Hedging Activities, to hedge the forecasted sale of power until the start of the PPAs on January 1, 2016.
Power Purchase Agreement by and between Elbow Creek and NRG
In October 2015, Elbow Creek, the Company's subsidiary in the Renewables segment, entered into a PPA with NRG Power Marketing for the sale of energy and environmental attributes with the effective date of November 1, 2015, and expiring on October 31, 2022. Elbow Creek generated $4 million of revenue during the six months ended June 30, 2016.
Operation and Maintenance (O&M) Services Agreements by and between Thermal Entities and NRG
Certain wholly-owned subsidiaries of the Company are party to a Plant O&M Services Agreement with NRG, pursuant to which NRG provides necessary and appropriate services to operate and maintain the subsidiaries' plant operations, businesses and thermal facilities. NRG is reimbursed for the provided services, as well as for all reasonable and related expenses and expenditures, and payments to third parties for services and materials rendered to or on behalf of the parties to the agreements. NRG is not entitled to any management fee or mark-up under the agreements. Total fees incurred under the agreements were $15 million for the six months ended June 30, 2016, and 2015. There was a balance of $27 million and $29 million due to NRG in accounts payable — affiliate as of June 30, 2016, and December 31, 2015, respectively. As of June 30, 2016, $7 million of the balance was recorded in the current liabilities of the consolidated balance sheet and $20 million was recorded in long term liabilities of the consolidated balance sheet. Subsequent to June 30, 2016, $4 million of the outstanding balance has been paid.
Power Purchase Agreement by and between NRG Energy Center Dover LLC and NRG
In February 2016, NRG Energy Center Dover LLC, or NRG Dover, a subsidiary of the Company, entered into a PPA with NRG Power Marketing for the sale of energy and environmental attributes with an effective date of February 1, 2016 and expiration date of December 31, 2018. NRG Dover generated $2 million of revenue during the six months ended June 30, 2016. The agreement in place is additive to the existing Power Sales and Services Agreement as described further below.
Power Sales and Services Agreement by and between NRG Energy Center Dover LLC and NRG
NRG Energy Center Dover LLC, or NRG Dover, a subsidiary of the Company, is party to a Power Sales and Services Agreement with NRG Power Marketing. The agreement is automatically renewed on a month-to-month basis unless terminated by either party upon at least 30 days written notice. Under the agreement, NRG Power Marketing has the exclusive right to (i) manage, market and sell power, (ii) procure fuel and fuel transportation for operation of the Dover generating facility, to include for purposes other than generating power, (iii) procure transmission services required for the sale of power, and (iv) procure and market emissions credits for operation of the Dover generating facility.
In addition, NRG Power Marketing has the exclusive right and obligation to direct the output from the generating facility, in accordance with and to meet the terms of any power sales contracts executed against the power generation of the Dover facility. Under the agreement, NRG Power Marketing pays NRG Dover gross receipts generated through sales, less costs incurred by NRG Power Marketing related to providing such services as transmission and delivery costs, as well as fuel costs. In July 2013, the coal-fueled plant was converted to a natural gas facility. For the six months ended June 30, 2016, and 2015, NRG Dover purchased $1 million and $3 million, respectively, of natural gas from NRG Power Marketing.
Energy Marketing Services Agreement by and between NRG Energy Center Minneapolis LLC and NRG
NRG Energy Center Minneapolis LLC, or NRG Minneapolis, a subsidiary of the Company is party to an Energy Marketing Services Agreement with NRG Power Marketing, a wholly-owned subsidiary of NRG. Under the agreement, NRG Power Marketing procures fuel and fuel transportation for the operation of the Minneapolis generating facility. For the six months ended June 30, 2016, and 2015, NRG Minneapolis purchased $4 million and $5 million, respectively, of natural gas from NRG Power Marketing.
O&M Services Agreements by and between GenConn and NRG
GenConn incurs fees under two O&M services agreements with wholly-owned subsidiaries of NRG. The fees incurred under the agreements were $3 million and $2 million for the six months ended June 30, 2016, and 2015, respectively.
O&M Services Agreement by and between El Segundo and NRG
El Segundo incurs fees under an O&M services agreement with NRG El Segundo Operations, Inc., a wholly-owned subsidiary of NRG. Under the O&M services agreement, NRG El Segundo Operations, Inc. manages, operates and maintains the El Segundo facility for an initial term of ten years following the commercial operations date. For the six months ended June 30, 2016, and 2015, the costs incurred under the agreement were $2 million. There was a balance of $1 million due to NRG El Segundo in accounts payable — affiliate as of June 30, 2016, and December 31, 2015.
Administrative Services Agreement by and between Marsh Landing and NRG
Marsh Landing is a party to an administrative services agreement with GenOn Energy Services, LLC, a wholly-owned subsidiary of NRG, which provides invoice processing and payment on behalf of Marsh Landing. Marsh Landing reimburses GenOn Energy Services, LLC for the amounts paid by it. The Company reimbursed costs under this agreement of $5 million and $9 million for the six months ended June 30, 2016, and 2015, respectively. There was a balance of $6 million due to GenOn Energy Services, LLC in accounts payable — affiliate as of June 30, 2016, and December 31, 2015.
Administrative Services Agreement by and between CVSR and NRG
CVSR is a party to an administrative services agreement with NRG Renew Operation & Maintenance LLC, a wholly-owned subsidiary of NRG, which provides O&M services on behalf of CVSR. CVSR reimburses NRG Energy Services LLC for the amounts paid by it. CVSR reimbursed costs under this agreement of $2 million and $3 million for the six months ended June 30, 2016, and 2015, respectively.
Management Services Agreement by and between the Company and NRG
NRG provides the Company with various operation, management, and administrative services, which include human resources, accounting, tax, legal, information systems, treasury, and risk management, as set forth in the Management Services Agreement. As of June 30, 2016, the base management fee was approximately $7 million per year, subject to an inflation-based adjustment annually at an inflation factor based on the year-over-year U.S. consumer price index. The fee is also subject to adjustments following the consummation of future acquisitions and as a result of a change in the scope of services provided under the Management Services Agreement. During the year ended December 31, 2015, the fee was increased by $1 million per year primarily due to the acquisitions of the January 2015 Drop Down Assets and the November 2015 Drop Down Assets. Costs incurred under this agreement were $5 million for the six months ended June 30, 2016, and 2015, which included certain direct expenses incurred by NRG on behalf of the Company in addition to the base management fee. There was a balance of $4 million due to NRG in accounts payable — affiliate as of June 30, 2016. Subsequent to June 30, 2016, the balance has been paid in full.
Administrative Services Agreements by and between NRG Wind TE Holdco and NRG
Certain subsidiaries of NRG have entered into agreements with the Company's project entities to provide operation and maintenance services for the balance of the plants not covered by turbine supplier's maintenance and service agreements for the post-warranty period. The agreements have various terms with provisions for extension until terminated. For the six months ended June 30, 2016, and 2015, the costs incurred under the agreements were $3 million and $2 million, respectively.
Certain subsidiaries of NRG provide support services to the NRG Wind TE Holdco project entities pursuant to various support services agreements. The agreements provide for administrative and support services and reimbursements of certain insurance, consultant, and credit costs. For the six months ended June 30, 2016, and 2015, the costs incurred under the agreements were $1 million and $2 million, respectively.
Note 12 — Contingencies
The Company's material legal proceeding is described below. The Company believes that it has a valid defense to this legal proceeding and intends to defend it vigorously. The Company records reserves for estimated losses from contingencies when information available indicates that a loss is probable and the amount of the loss, or range of loss, can be reasonably estimated. In addition, legal costs are expensed as incurred. Management assesses such matters based on current information and makes a judgment concerning its potential outcome, considering the nature of the claim, the amount and nature of damages sought, and the probability of success. The Company is unable to predict the outcome of the legal proceeding below or reasonably estimate the scope or amount of any associated costs and potential liabilities. As additional information becomes available, management adjusts its assessment and estimates of such contingencies accordingly. Because litigation is subject to inherent uncertainties and unfavorable rulings or developments, it is possible that the ultimate resolution of the Company's liabilities and contingencies could be at amounts that are different from its currently recorded reserves and that such difference could be material.
In addition to the legal proceeding noted below, the Company and its subsidiaries are party to other litigation or legal proceedings arising in the ordinary course of business. In management's opinion, the disposition of these ordinary course matters will not materially adversely affect the Company's consolidated financial position, results of operations, or cash flows.
Braun v. NRG Yield, Inc. — On April 19, 2016, plaintiffs filed a purported class action lawsuit against NRG Yield, Inc. and against each current and former member of its board of directors individually in California Superior Court in Kern County, CA. Plaintiffs allege various violations of the Securities Act due to the defendants’ alleged failure to disclose material facts related to low wind production prior to the Company's June 22, 2015 Class C common stock offering. Plaintiffs seek compensatory damages, rescission, attorney’s fees and costs. On August 3, 2016, the court approved a stipulation entered into by the parties. The stipulation provided that the plaintiffs would file an amended complaint by August 19, 2016, which they did on August 18, 2016. The Defendants need to file a responsive pleading by October 18, 2016.