Filed Pursuant to Rule 424(b)(3)
Registration No. 333-191706
CARTER VALIDUS MISSION CRITICAL REIT II, INC.
SUPPLEMENT NO. 11 DATED NOVEMBER 21, 2016
TO THE PROSPECTUS DATED APRIL 27, 2016
This document supplements, and should be read in conjunction with, the prospectus of Carter Validus Mission Critical REIT II, Inc., dated April 27, 2016, and consolidates and replaces all previous supplements to the prospectus. Unless otherwise defined in this prospectus supplement, capitalized terms used in this prospectus supplement shall have the same meanings as set forth in the prospectus.
The purpose of this prospectus supplement is to describe the following:
| (1) | the status and extension of our public offering of shares of common stock; |
| (2) | the determination of an estimated per share net asset value of our Class A common stock and Class T common stock; |
| (3) | the revised primary offering prices per Class A share of common stock and Class T share of common stock, effective October 1, 2016; |
| (4) | the revised distribution reinvestment plan prices per Class A share of common stock and Class T share of common stock, |
effective October 1, 2016;
| (5) | the amendment and restatement of our share repurchase program, effective October 30, 2016; |
| (6) | an update regarding the distribution and servicing fee payable to our dealer manager; |
| (7) | the declaration of distributions to our stockholders and distributions made through November 21, 2016; |
| (8) | recent real property acquisitions; |
| (9) | updates regarding our credit facility; |
| (10) | the placement of debt on a real property investment; |
| (11) | updates to the "Risk Factors" section of our prospectus; |
| (12) | updates to the "Plan of Distribution" section of our prospectus; |
| (13) | our indemnification agreements with our executive officers and directors; |
| (14) | renewal of our advisory agreement; |
| (15) | renewal of our management agreement; |
| (16) | updates to our management; |
| (17) | the compensation, fees and reimbursements incurred to our advisor or its affiliates as of September 30, 2016; |
| (18) | an update to the "Selected Financial Data" section of our prospectus; |
| (19) | updates regarding volume discounts associated with our public offering of shares of common stock; |
| (20) | an update to the suitability standards for Kentucky and Nebraska residents; |
| (21) | Management's Discussion and Analysis of Financial Condition and Results of Operations section, substantially the same as that which was filed in our Quarterly Report on Form 10-Q on November 14, 2016; |
| (22) | our updated financial information, substantially the same as that which was filed in our Quarterly Report on Form 10-Q on November 14, 2016; and |
| (23) | revised forms of our subscription agreements. |
1
Status of Our Public Offering
We commenced our initial public offering of $2,350,000,000 of shares of our common stock, or the Offering, consisting of up to $2,250,000,000 of shares in our primary offering and up to $100,000,000 of shares pursuant to our distribution reinvestment plan, on May 29, 2014. We are publicly offering shares of Class A common stock and shares of Class T common stock, in any combination with a dollar value up to the maximum offering amount. As of November 21, 2016, we had accepted investors’ subscriptions for and issued approximately 68,226,000 shares of Class A common stock and 10,759,000 shares of Class T common stock in the Offering, resulting in receipt of gross proceeds of approximately $676,417,000 and $103,020,000 respectively. As of November 21, 2016, we had approximately $1,570,563,000 in Class A shares and Class T shares of common stock remaining in the Offering.
We previously disclosed that we would offer shares of our common stock pursuant to the Offering until the earlier of May 29, 2016, which is two years from the effective date of the Offering, or the date we sell $2,250,000,000 in shares, unless we elect to extend it to a date no later than November 25, 2017, which is 180 days following the third anniversary of the effective date of the Offering. On May 5, 2016, our board of directors approved the extension of the Offering until May 29, 2017, unless our board of directors terminates the Offering at an earlier date or all shares being offered have been sold, in which case the Offering will be terminated. If all of the shares we are offering have not been sold by May 29, 2017, our board of directors may further extend the Offering as permitted under applicable law. In addition, at the discretion of our board of directors, we may elect to extend the termination date of the offering of shares reserved for issuance pursuant to our distribution reinvestment plan until we have sold all shares allocated to such plan through the reinvestment of distributions, in which case participants in the plan will be notified. The Offering must be registered in every state in which we offer or sell shares. Generally, such registrations are for a period of one year. Therefore, we may have to stop selling shares in any state in which our registration is not renewed or otherwise extended annually. We reserve the right to terminate the Offering at any time prior to the stated termination date.
All references in the prospectus to the termination date of the Offering are hereby supplemented and revised accordingly.
Determination of the Estimated Per Share Net Asset Value
The following information supplements, and should be read in conjunction with, all discussions contained in our prospectus regarding our calculation of an estimated per share value:
We disclose in our prospectus that our board of directors will determine an estimated per share net asset value, or NAV, based on the input of our advisor, our audit committee, and one or more independent valuation firms.
On September 29, 2016, our board of directors, at the recommendation of the audit committee, which is comprised solely of independent directors, unanimously approved and established an estimated per share NAV of $9.07 per share of each of our Class A common stock and Class T common stock, or the Estimated Per Share NAV, as of June 30, 2016, or the Valuation Date. The Estimated Per Share NAV is based on the estimated value of our assets less the estimated value of our liabilities, divided by the approximate number of shares outstanding on a fully diluted basis, calculated as of the Valuation Date. We are providing this Estimated Per Share NAV to assist broker-dealers in connection with their obligations under National Association of Securities Dealers Conduct Rule 2340, as required by the Financial Industry Regulatory Authority, or FINRA, with respect to customer account statements. This valuation was performed in accordance with the provisions of Practice Guideline 2013-01, Valuations of Publicly Registered Non-Listed REITs, issued by the Investment Program Association, or the IPA, in April 2013, or the IPA Valuation Guidelines, in addition to guidance from the SEC. We believe that there were no material changes between the Valuation Date and the date of this supplement that would impact the Estimated Per Share NAV.
The audit committee, pursuant to authority delegated by our board of directors, was responsible for the oversight of the valuation process, including the review and approval of the valuation process and methodology used to determine the Estimated Per Share NAV, the consistency of the valuation and appraisal methodologies with real estate industry standards and practices, and the reasonableness of the assumptions used in the valuations and appraisals.
The Estimated Per Share NAV was determined by our board of directors after consultation with our advisor and Robert A. Stanger & Co, Inc., or Stanger, an independent third-party valuation firm. The engagement of Stanger was approved by the audit committee. Stanger prepared an appraisal report, or the Appraisal Report, summarizing key information and assumptions and providing a value on 40 of the 42 properties in our portfolio as of June 30, 2016, or the Appraised Properties. Stanger also prepared a net asset value report, or the NAV Report, and together with the Appraisal Report, the Reports, which estimates the NAV of our Class A common stock and Class T common stock as of June 30, 2016. The NAV Report relied upon the Appraisal Report for the Appraised Properties, the June 30, 2016 book value of the Vibra Rehabilitation Hospital and Post Acute Las Vegas Rehabilitation Hospital development properties, or the Development Properties, Stanger’s estimate of our advisor’s subordinated share of net sales proceeds due upon liquidation of our portfolio, and our advisor's estimate of the value of our operating partnership’s credit facility and our other assets and liabilities, to calculate an estimated per share NAV of our
2
common stock. The process for estimating the value of our assets and liabilities was performed in accordance with the provisions of the IPA Valuation Guidelines.
Upon the audit committee’s receipt and review of the Reports, the audit committee recommended $9.07 as the estimated per share NAV of each of our Class A common stock and Class T common stock as of June 30, 2016 to our board of directors. Upon our board of directors’ receipt and review of the Reports and recommendation of the audit committee, our board of directors approved $9.07 as the estimated per share NAV of each of our Class A common stock and Class T common stock as of June 30, 2016.
The table below sets forth the calculation of our Estimated Per Share NAV as of June 30, 2016. Certain amounts are reflected net of non-controlling interests, as applicable.
| Estimated Per Share NAV | ||||||||
| (In Thousands, Except Share and Per Share Data) | ||||||||
| Gross | Per Share | |||||||
| Assets | ||||||||
| Total Real Estate, Net | $ | 680,551 | $ | 10.01 | ||||
| Cash and Cash Equivalents | 35,648 | 0.52 | ||||||
| Other Assets | 8,402 | 0.12 | ||||||
| Total Assets | 724,601 | 10.65 | ||||||
| Liabilities & Stockholders' Equity | ||||||||
| Liabilities: | ||||||||
| Credit Facility | (95,000 | ) | (1.40 | ) | ||||
| Accounts Payable Due to Affiliates | (1,034 | ) | (0.02 | ) | ||||
| Accounts Payable and Other Liabilities | (11,153 | ) | (0.16 | ) | ||||
| Total Liabilities | (107,187 | ) | (1.58 | ) | ||||
| Stockholders' Equity | 617,414 | 9.07 | ||||||
| Less: Advisor Promote | — | — | ||||||
| Stockholders' Equity, Net of Promote | $ | 617,414 | $ | 9.07 | ||||
| Fully Diluted Shares Outstanding | 68,037,354 | |||||||
| Class A Shares | Class T Shares | |||||||
| Estimated Value Per Share | $ | 9.07 | $ | 9.07 | ||||
| Estimated Enterprise Value | None | None | ||||||
| Estimated Upfront Selling Commission and Dealer Manager fees | 1.008 | 0.579 | ||||||
| Revised Primary Offering Price Per Share | $ | 10.078 | $ | 9.649 | ||||
Methodology and Key Assumptions
In determining the Estimated Per Share NAV, our board of directors considered the recommendation of the audit committee, the Reports provided by Stanger and information provided by our advisor. Our goal in calculating the Estimated Per Share NAV is to arrive at a value that is reasonable and supportable using what the audit committee and our board of directors each deems to be appropriate valuation methodologies and assumptions.
FINRA’s current rules provide no guidance on the methodology an issuer must use to determine its estimated per share NAV. As with any valuation methodology, the methodologies used are based upon a number of estimates and assumptions that may not be accurate or complete. Different parties with different assumptions and estimates could derive a different Estimated Per Share NAV, and these differences could be significant. The Estimated Per Share NAV is not audited and does not represent the fair value of our assets less its liabilities according to U.S. generally accepted accounting principles, nor does it
3
represent a liquidation value of our assets and liabilities or the amount our shares of common stock would trade at on a national securities exchange. The estimated asset values may not represent current market value or book value. The estimated value of the Appraised Properties does not necessarily represent the value we would receive or accept if our assets were marketed for sale. The Estimated Per Share NAV does not reflect a discount for the fact that the Company is externally managed, nor does it reflect a real estate portfolio premium/discount compared to the sum of the individual property values. The Estimated Per Share NAV also does not take into account estimated disposition costs and fees for real estate properties that are not held for sale.
Real Estate Valuation
As described above, we engaged Stanger to provide an appraisal of the Appraised Properties, which consists of 40 of the 42 properties in our portfolio as of June 30, 2016. In preparing the Appraisal Report, Stanger, among other things:
| • | performed a site visit of each Appraised Property; |
| • | interviewed our officers or our advisor’s personnel to obtain information relating to the physical condition of each Appraised Property, including known environmental conditions, status of ongoing or planned property additions and reconfigurations, and other factors for such leased properties; |
| • | reviewed lease agreements for each Appraised Property and discussed with us or our advisor certain lease provisions and factors on each property; and |
| • | reviewed the acquisition criteria and parameters used by real estate investors for properties similar to the subject properties, including a search of real estate data sources and publications concerning real estate buyer’s criteria, discussions with sources deemed appropriate, and a review of transaction data for similar properties. |
Stanger employed the income approach to estimate the value of the Appraised Properties, which involves an economic analysis of the property based on its potential to provide future net annual income. As part of the valuation, a direct capitalization analysis and a discounted cash flow analysis were used to determine the value of our interest in the portfolio, by valuing the subject interest in each Appraised Property in the portfolio based upon the leases that encumber such property. The indicated value by the income approach represents the amount an investor would probably pay for the expectation of receiving the net cash flow from the property during the subject lease term and the proceeds from the ultimate sale of the property.
The Appraisal Report summarizes key inputs and assumptions and provides a value for each of the Appraised Properties that Stanger appraised using financial information we provided and our advisor provided. From such review, Stanger selected the appropriate cash flow discount rates, residual discount rates, and terminal capitalization rates in its discounted cash flow analysis and the appropriate direct capitalization rate in its direct capitalization analysis. In the NAV Report, the Development Properties were included at their June 30, 2016 book value.
As of June 30, 2016, the Company owned 42 properties. The total aggregate purchase price of these properties was approximately $625 million. The total aggregate purchase price of $625 million was determined in accordance with generally accepted accounting principles in the United States, or GAAP. In addition, through the Valuation Date, the Company had invested $4.2 million in capital improvements on these real estate assets since inception. As of the Valuation Date, the total value of the Appraised Properties at the Company’s respective ownership interest, as provided by Stanger, and the June 30, 2016 book value of the Development Properties was approximately $681 million. This represents an approximately 8.23% increase in the total value of the real estate assets over the aggregate purchase price and aggregate improvements. The following summarizes the key assumptions that were used in the discounted cash flow and direct capitalization models to arrive at the appraised value of the Appraised Properties:
| Range | Weighted Average | |||||
| Terminal Capitalization Rate | 6.25% | 10.00% | 7.32% | |||
| Cash Flow Discount Rate | 4.75% | 9.00% | 7.35% | |||
| Residual Discount Rate | 7.00% | 9.50% | 8.01% | |||
| Direct Capitalization Rate | 5.25% | 7.50% | 6.38% | |||
| Income and Expense Growth | 3.00% | 3.00% | ||||
While we believe that Stanger’s assumptions and inputs are reasonable, a change in these assumptions and inputs would significantly impact the calculation of the appraised value of the Appraised Properties and thus, the Estimated Per Share NAV. The table below illustrates the impact on the Estimated Per Share NAV if the terminal capitalization rates, discount rates and direct capitalization rates were adjusted by 25 basis points or 5.0%, assuming the value conclusion for each Appraised Property is based on the method being sensitized and all other factors remain unchanged:
4
| Estimated Per Share NAV due to: | ||||||||||||||||
| Increase | Decrease | Increase | Decrease | |||||||||||||
| 25 Basis Points | 25 Basis Points | 5.0% | 5.0% | |||||||||||||
| Terminal Capitalization Rate | $ | 8.84 | $ | 9.12 | $ | 8.79 | $ | 9.18 | ||||||||
| Cash Flow Discount Rate | $ | 8.88 | $ | 9.07 | $ | 8.81 | $ | 9.05 | ||||||||
| Residual Discount Rate | $ | 8.85 | $ | 9.10 | $ | 8.78 | $ | 9.18 | ||||||||
| Direct Capitalization Rate | $ | 8.80 | $ | 9.58 | $ | 8.71 | $ | 9.70 | ||||||||
Cash, Other Assets, Other Liabilities and Credit Facility
The fair value of our cash, other assets, other liabilities and our operating partnership’s credit facility were estimated by our advisor to approximate carrying value as of the Valuation Date.
The carrying value of a majority of our other assets and liabilities are considered to equal their fair value due to their short maturities or liquid nature. Certain balances, such as straight-line rent receivables, lease intangible assets and liabilities, estimated liability for distribution and servicing fees and deferred financing costs, have been eliminated for the purpose of the valuation due to the fact that the value of those balances were already considered in the valuation of the respective investments.
Different parties using different assumptions and estimates could derive a different estimated per share NAV, and these differences could be significant. The value of our shares will fluctuate over time in response to developments related to individual assets in our portfolio and the management of those assets and in response to the real estate and finance markets.
Advisor Promote
The Estimated Per Share NAV was calculated net of our advisor’s subordinated participation in net sale proceeds in the event of a liquidation of the portfolio, or the Advisor Promote, which we advised Stanger was equal to 15.0% of net sale proceeds after stockholders are paid return of capital plus a 6.0% cumulative, non-compounded return. Stanger estimated the value of the Advisor Promote at $0 as of the Valuation Date.
The Board’s Determination of the Estimated Per Share NAV
Based upon a review of the Reports provided by Stanger, upon the recommendation of the audit committee, our board of directors estimated the per share NAV of each of the Class A common stock and Class T common stock to be $9.07.
Limitations of the Estimated Per Share NAV
The various factors considered by our board of directors in determining the Estimated Per Share NAV were based on a number of assumptions and estimates that may not be accurate or complete. As disclosed above, we are providing the Estimated Per Share NAV to assist broker-dealers that participate, or participated, in our offering in meeting their customer account statement reporting obligations. As with any valuation methodology, the methodologies used are based upon a number of estimates and assumptions that may not be accurate or complete. Different parties with different assumptions and estimates could derive a different Estimated Per Share NAV. The Estimated Per Share NAV is not audited and does not represent the fair value of our assets or liabilities according to GAAP.
Accordingly, with respect to the Estimated Per Share NAV, we can give no assurance that:
| • | a stockholder would be able to resell his or her Class A shares of common stock or Class T shares of common stock at the Estimated Per Share NAV; |
| • | a stockholder would ultimately realize distributions per share equal to our Estimated Per Share NAV upon liquidation of our assets and settlement of our liabilities or a sale of our company; |
| • | our shares of Class A common stock and Class T common stock would trade at the Estimated Per Share NAV on a national securities exchange; |
| • | a different independent third-party appraiser or other third-party valuation firm would agree with our Estimated Per Share NAV; or |
| • | the Estimated Per Share NAV, or the methodology used to estimate the Estimated Per Share NAV, will be found by any regulatory authority to comply with ERISA, the Internal Revenue Code of 1986, as amended, or other regulatory requirements. |
Similarly, the amount a stockholder may receive upon repurchase of his or her shares, if he or she participates in
5
our share repurchase program, may be greater than or less than the amount a stockholder paid for the shares, regardless of any underlying value of any assets we own.
The Estimated Per Share NAV is based on the estimated value of our assets less the estimated value of our liabilities divided by the number of shares outstanding on an adjusted fully diluted basis, calculated as of June 30, 2016. The Estimated Per Share NAV was based upon 68,037,354 shares of equity interest outstanding as of June 30, 2016, which was comprised of(i) 68,020,354 outstanding shares of our common stock, plus (ii) 17,000 shares of unvested restricted Class A common stock issued to our independent directors, which shares vest ratably over time.
Further, the value of our shares will fluctuate over time as a result of, among other things, developments related to individual assets and responses to the real estate and capital markets. As discussed above, the Estimated Per Share NAV does not reflect a discount for the fact that we are externally managed, nor does it reflect a real estate portfolio premium/discount versus the sum of the individual property values. The Estimated Per Share NAV also does not take into account estimated disposition costs and fees for real estate properties that are not held for sale. We currently expect to utilize an independent valuation firm to update the Estimated Per Share NAV in the second half of 2017, in accordance with IPA Valuation Guidelines, but we are not required to update the Estimated Per Share NAV more frequently than annually.
Revised Primary Offering Prices
Commencing on October 1, 2016, the offering price for shares of our Class A common stock pursuant to our primary offering is $10.078 per share, which reflects the $9.07 estimated per share NAV, a 7.0% selling commission and a 3.0% dealer manager fee, and the offering price for shares of our Class T common stock pursuant to our primary offering is $9.649 per share, which reflects the $9.07 estimated per share NAV, a 3.0% selling commission and a 3.0% dealer manager fee. Accordingly, all references to a $10.00 per Class A share primary offering price and $9.574 per Class T share primary offering price throughout the prospectus are hereby superseded and replaced with $10.078 per Class A share and $9.649 per Class T share. All subscriptions for primary offering shares that were received in good order and fully funded by the close of business on September 30, 2016 were processed using the $10.00 per Class A share primary offering price and $9.574 per Class T share primary offering price; all subscriptions for primary offering shares received and/or funded after the close of business on September 30, 2016 were processed using a $10.078 per Class A share primary offering price and $9.649 per Class T share primary offering price.
Revised Distribution Reinvestment Plan Prices
The following information supplements, and should be read in conjunction with, the sections of our prospectus captioned “Prospectus Summary - Distribution Reinvestment Plan” on page 30 of the prospectus and “Distribution Reinvestment Plan” on page 191 of the prospectus and elsewhere where the context requires:
Commencing on October 1, 2016, shares of our Class A common stock issued pursuant to our Second Amended and Restated Distribution Reinvestment Plan, or the DRIP, were issued for $9.574 per share, which is 95% of the purchase price per Class A share in our primary offering, and shares of our Class T common stock issued pursuant to the DRIP were issued for $9.167 per share, which is 95% of the purchase price per Class T share in our primary offering.
A participant may terminate or modify his or her participation in the DRIP at any time by delivering a written notice to the administrator. To be effective for any distribution, such termination notice must be received by the administrator at least 10 days prior to the last day of the month to which the distribution relates. Any written notice of termination should be sent by mail to DST Systems, Inc., P.O. Box 219312, Kansas City, MO 64121-9312.
6
The table on the cover page of our prospectus and all similar discussions appearing throughout our prospectus are superseded and replaced in their entirety as follows:
Aggregate Price to Public(1) | Selling Commissions(2) | Dealer Manager Fee(2) | Proceeds Before Expenses to Us(1)(3) | ||||||||||||
| Primary Offering | |||||||||||||||
| Per Class A Share | $ | 10.078 | $ | 0.705 | $ | 0.303 | $ | 9.07 | |||||||
| Per Class T Share | $ | 9.649 | $ | 0.289 | $ | 0.289 | $ | 9.07 | |||||||
| Maximum Offering | $ | 2,250,000,000 | $ | 157,500,000 | $ | 67,500,000 | $ | 2,025,000,000 | |||||||
| Distribution Reinvestment Plan | |||||||||||||||
| Per Class A Share | $ | 9.574 | $ | — | $ | — | $ | 9.574 | |||||||
| Per Class T Share | $ | 9.167 | $ | — | $ | — | $ | 9.167 | |||||||
| Maximum Offering | $ | 100,000,000 | $ | — | $ | — | $ | 100,000,000 | |||||||
| Total Maximum Offering (Primary and Distribution Reinvestment Plan) | $ | 2,350,000,000 | $ | 157,500,000 | $ | 67,500,000 | $ | 2,125,000,000 | |||||||
| (1) | The table assumes that all of the primary offering gross proceeds come from sales of Class A shares. We reserve the right to reallocate shares being offered between Class A and Class T shares and between the primary offering and the distribution reinvestment plan. |
| (2) | The table excludes the distribution and servicing fees for Class T shares, which will be paid over time and may be paid from offering proceeds or other sources. With respect to Class T shares sold in the primary offering, we will pay our dealer manager a distribution and servicing fee that accrues daily equal to 1/365th of 1.0% of the most recent offering price per Class T share on a continuous basis from year to year, payable out of amounts that otherwise would be distributed to holders of Class T shares; provided, however, that upon the termination of our primary offering, the distribution and servicing fee shall be an amount that accrues daily equal to 1/365th of up to 1.0% of the most recent estimated NAV per Class T share on a continuous basis from year to year. We will cease paying distribution and servicing fees with respect to all Class T shares sold in the primary offering on the earliest to occur of the following: (i) a listing of the Class T shares on a national securities exchange, (ii) following the completion of this Offering, total underwriting compensation in this Offering equaling 10% of the gross proceeds from our primary offering, (iii) there are no longer any Class T shares outstanding; or (iv) the fourth anniversary of the last day of the fiscal quarter in which our primary offering terminates. We cannot predict when this will occur. No selling commissions, dealer manager fees or distribution and servicing fees will be paid on shares under the distribution reinvestment plan. |
| (3) | Proceeds are calculated before deducting issuer costs other than upfront selling commissions and the dealer manager fee. These issuer costs are expected to consist of, among others, expenses of our organization and offering. See "Plan Distribution" section of the prospectus. |
Amended and Restated Share Repurchase Program
On September 29, 2016, the Board approved and adopted the Amended and Restated Share Repurchase Program, or the Amended and Restated SRP, which became effective on October 30, 2016. The following information supersedes and replaces the section captioned "Prospectus Summary - Share Repurchase Program" beginning on page 30 of the prospectus:
Amended and Restated Share Repurchase Program
Our shares of Class A common stock and Class T common stock are currently not listed on a national securities exchange and we will not seek to list our stock unless and until such time as our independent directors believe that the listing of our stock would be in the best interests of our stockholders. In order to provide stockholders with the benefit of some interim liquidity, our board of directors has adopted a share repurchase program that enables our stockholders to sell their shares back to us after they have held them for at least one year, subject to the significant conditions and limitations in our share repurchase program. The terms of our share repurchase program are more flexible in cases involving the death or disability of a stockholder.
Repurchases of shares of our common stock, when requested, are at our sole discretion and generally will be made monthly. We will limit the number of shares repurchased during any calendar year to 5.0% of the number of shares of our
7
common stock outstanding on December 31st of the previous calendar year. In addition, we are only authorized to repurchase shares using the proceeds received from the sale of shares under our distribution reinvestment plan during the prior calendar year and other operating funds, if any, as our board of directors, in its sole discretion may reserve for this purpose. Due to these limitations, we cannot guarantee that we will be able to accommodate all repurchase requests.
A stockholder must have beneficially held its Class A shares or Class T shares, as applicable for at least one year prior to offering them for sale to us through our share repurchase program, unless the Class A shares or Class T shares, as applicable, are being repurchased in connection with a stockholder’s death, Qualifying Disability, or certain other exigent circumstances. The purchase price for shares repurchased under our share repurchase program will be 100.0% of the most recent estimated value of the Class A common stock or Class T common stock, as applicable (in each case, as adjusted for any stock dividends, combinations, splits, recapitalizations and the like with respect to our common stock). Our board of directors reserves the right, in its sole discretion, at any time and from time to time, to waive the one-year holding period requirement in the event of the death or Qualifying Disability of a stockholder, other involuntary exigent circumstances such as bankruptcy, or a mandatory distribution requirement under a stockholder’s IRA.
The share repurchase program will immediately terminate if our shares are listed on any national securities exchange. In addition, our board of directors may suspend (in whole or in part) the share repurchase program at any time and from time to time upon notice to our stockholders and amend or terminate the share repurchase program at any time upon 30 days’ prior written notice to our stockholders. We will notify our stockholders of such developments (1) in a Current Report on Form 8- K, in an annual or quarterly report, or (2) by means of a separate mailing to you. Further, our board of directors reserves the right, in its sole discretion, to reject any requests for repurchases. For additional information on our share repurchase program and the shares, if any, purchased thereunder, refer to the section of this prospectus captioned “Share Repurchase Program."
Effective October 30, 2016, the following information supersedes and replaces in its entirety the section captioned "Share Repurchase Program" beginning on page 192 of the prospectus.
AMENDED AND RESTATED SHARE REPURCHASE PROGRAM
Prior to the time, if any, that our shares are listed on a national securities exchange, our share repurchase program, as described below, may provide eligible stockholders with limited, interim liquidity by enabling them to sell shares back to us, subject to restrictions and applicable law. A stockholder must have beneficially held its Class A shares or Class T shares, as applicable, for at least one year prior to offering them for sale to us through our share repurchase program, unless the Class A shares or Class T shares, as applicable, are being repurchased in connection with a stockholder’s death, Qualifying Disability, or certain other exigent circumstances. The purchase price for shares repurchased under our share repurchase program will be 100.0% of the most recent estimated value of the Class A common stock or Class T common stock, as applicable (in each case, as adjusted for any stock dividends, combinations, splits, recapitalizations and the like with respect to our common stock). Our board of directors reserves the right, in its sole discretion, at any time and from time to time, to waive the one-year holding period requirement in the event of the death or Qualifying Disability of a stockholder, other involuntary exigent circumstances such as bankruptcy, or a mandatory distribution requirement under a stockholder’s IRA.
At any time the repurchase price is determined by any method other than the net asset value of the Class A shares or Class T shares, as applicable, if we have sold property and have made one or more special distributions to our stockholders of all or a portion of the net proceeds from such sales, the per share repurchase price will be reduced by the net sale proceeds per share distributed to investors prior to the repurchase date. Our board of directors will, in its sole discretion, determine which distributions, if any, constitute a special distribution. While our board of directors does not have specific criteria for determining special distributions, we expect that special distributions will only occur upon the sale of a property and the subsequent distribution of the net sale proceeds. Upon receipt of a request for repurchase, we will conduct a Uniform Commercial Code search to ensure that no liens are held against the shares. We will not repurchase any shares subject to a lien. Any costs in conducting the Uniform Commercial Code search will be borne by us.
Repurchases of shares of our common stock, when requested, are at our sole discretion and generally will be made monthly. Each stockholder whose repurchase request is granted will receive the repurchase amount within ten days after the end of the month in which we grant its repurchase request. Subject to certain limitations described in this prospectus, we will also repurchase shares upon the request of the estate, heir or beneficiary of a deceased stockholder. We will limit the number of shares repurchased pursuant to our share repurchase program as follows: during any calendar year, we will not repurchase in excess of 5.0% of the number of shares of common stock outstanding on December 31st of the previous calendar year. As a result, some or all of a stockholders’ shares may not be repurchased.
Our sponsor, advisor, directors and their respective affiliates are prohibited from receiving a fee in connection with the share repurchase program. Affiliates of our advisors are eligible to have their shares repurchased on the same terms as other stockholders.
8
Funding for the share repurchase program will come exclusively from proceeds we receive from the sale of shares under our distribution reinvestment plan during the prior calendar year and other operating funds, if any, as our board of directors, in its sole discretion, may reserve for this purpose. We cannot guarantee that the funds set aside for the share repurchase program will be sufficient to accommodate all requests made each month. However, a stockholder may withdraw its request at any time or ask that we honor the request when funds are available.
If funds available for our share repurchase program are not sufficient to accommodate all requests, shares will be repurchased as follows: (i) first, pro rata as to repurchases upon the death or Qualifying Disability of a stockholder; (ii) next, pro rata as to repurchases to stockholders who demonstrate, in the discretion of our board of directors, another involuntary exigent circumstance, such as bankruptcy; (iii) next, pro rata as to repurchases to stockholders subject to a mandatory distribution requirement under such stockholder’s IRA; and (iv) finally, pro rata as to all other repurchase requests.
A stockholder or his or her estate, heir or beneficiary may present to us fewer than all of the shares then-owned for repurchase. Repurchase requests made (i) on behalf of a deceased stockholder or a stockholder with a Qualifying Disability; (ii) by a stockholder due to another involuntary exigent circumstance, such as bankruptcy, or (iii) by a stockholder, due to a mandatory distribution under such stockholder’s IRA, shall be made within 360 days of such event.
A stockholder who wishes to have shares repurchased must mail or deliver to us a written request on a form provided by us and executed by the stockholder, its trustee or authorized agent, which we must receive at least five business days prior to the end of the month in which the stockholder is requesting a repurchase of his or her shares. An estate, heir or beneficiary that wishes to have shares repurchased following the death of a stockholder must mail or deliver to us a written request on a form provided by us, including evidence acceptable to our board of directors of the death of the stockholder, and executed by the executor or executrix of the estate, the heir or beneficiary, or their trustee or authorized agent.
Unrepurchased shares may be passed to an estate, heir or beneficiary following the death of a stockholder. If the shares are to be repurchased under any conditions outlined herein, we will forward the documents necessary to effect the repurchase, including any signature guaranty we may require. Our share repurchase program provides stockholders only a limited ability to repurchase shares for cash until a secondary market develops for our shares, at which time the program would terminate. No such market presently exists, and we cannot assure you that any market for your shares will ever develop.
In order for a disability to entitle a stockholder to the special repurchase terms described above, (a Qualifying Disability),(1) the stockholder would have to receive a determination of disability based upon a physical or mental condition or impairment arising after the date the stockholder acquired the shares to be repurchased, and (2) such determination of disability would have to be made by the governmental agency responsible for reviewing the disability retirement benefits that the stockholder could be eligible to receive (the applicable governmental agency). The applicable governmental agencies would be limited to the following: (i) if the stockholder paid Social Security taxes and, therefore, could be eligible to receive Social Security disability benefits, then the applicable governmental agency would be the Social Security Administration or the agency charged with responsibility for administering Social Security disability benefits at that time if other than the Social Security Administration; (ii) if the stockholder did not pay Social Security benefits and, therefore, could not be eligible to receive Social Security disability benefits, but the stockholder could be eligible to receive disability benefits under the Civil Service Retirement System (“CSRS”), then the applicable governmental agency would be the U.S. Office of Personnel Management or the agency charged with responsibility for administering CSRS benefits at that time if other than the Office of Personnel Management; or (iii) if the stockholder did not pay Social Security taxes and, therefore, could not be eligible to receive Social Security benefits but suffered a disability that resulted in the stockholder’s discharge from military service under conditions that were other than dishonorable and, therefore, could be eligible to receive military disability benefits, then the applicable governmental agency would be the Department of Veterans Affairs or the agency charged with the responsibility for administering military disability benefits at that time if other than the Department of Veterans Affairs. Disability determinations by governmental agencies for purposes other than those listed above, including but not limited to worker’s compensation insurance, administration or enforcement of the Rehabilitation Act or Americans with Disabilities Act, or waiver of insurance premiums would not entitle a stockholder to the special repurchase terms described above. Repurchase requests following an award by the applicable governmental agency of disability benefits would have to be accompanied by: (1) the investor’s initial application for disability benefits and (2) a Social Security Administration Notice of Award, a U.S. Office of Personnel Management determination of disability under CSRS, a Veteran’s Administration record of disability-related discharge or such other documentation issued by the applicable governmental agency that we would deem acceptable and would demonstrate an award of the disability benefits.
We understand that the following disabilities do not entitle a worker to Social Security disability benefits:
| • | disabilities occurring after the legal retirement age; and |
| • | disabilities that do not render a worker incapable of performing substantial gainful activity. |
Therefore, such disabilities would not qualify for the special repurchase terms, except in the limited circumstances
9
when the investor would be awarded disability benefits by the other applicable governmental agencies described above.
Shares we purchase under our share repurchase program will have the status of authorized but unissued shares. Shares we acquire through the share repurchase program will not be reissued unless they are first registered with the SEC under the Securities Act and under appropriate state securities laws or otherwise issued in compliance with such laws.
Our board of directors, in its sole discretion, may amend, suspend, reduce, terminate or otherwise change our share repurchase program upon 30 days’ prior notice to our stockholders for any reason it deems appropriate. Because we only repurchase shares on a monthly basis, depending upon when during the month our board of directors makes this determination, it is possible that you would not have any additional opportunities to have your shares repurchased under the prior terms of the program, or at all, upon receipt of the notice. Additionally, we will be required to discontinue sales of shares under our distribution reinvestment plan on May 29, 2017, unless our distribution reinvestment plan offering is extended pursuant to applicable law, or the date we sell all of the shares registered for sale under our distribution reinvestment plan, unless we file a new registration statement with the SEC and applicable states. Because share repurchases will be funded with the net proceeds we receive from the sale of shares under our distribution reinvestment plan, the discontinuance or termination of our distribution reinvestment plan will adversely affect our ability to repurchase shares under the share repurchase program. We will notify our stockholders of such developments (1) in a Current Report on Form 8- K, in an annual or quarterly report, or (2) by means of a separate mailing to you. During this Offering, we would also include this information in a prospectus supplement to the registration statement, as then required under federal securities laws.
Revised Distribution and Servicing Fee
On September 30, 2016, we entered into an amendment to our dealer manager agreement to, among other things, revise certain terms of the distribution and servicing fee payable to our dealer manager in connection with Class T shares sold in our primary offering. The following information supersedes and replaces all similar information regarding the distribution and servicing fee in the prospectus. The other terms of the distribution and servicing fee are consistent with the terms disclosed of the prospectus:
With respect to Class T shares sold in the primary offering, we pay our dealer manager a distribution and servicing fee that accrues daily equal to 1/365th of 1.0% of the most recent offering price per Class T share on a continuous basis from year to year, payable out of amounts that otherwise would be distributed to holders of Class T shares; provided, however, that upon the termination of our primary offering, the distribution and servicing fee shall be an amount that accrues daily equal to 1/365th of up to 1.0% of the most recent estimated NAV per Class T share on a continuous basis from year to year.
Distribution Policy and Distributions
The following information supplements, and should be read in conjunction with, the discussion contained in the “Prospectus Summary — Distribution Policy” section on page 20 of the prospectus and the “Description of Securities — Distribution Policy and Distributions” section beginning on page 182 of the prospectus:
As of November 21, 2016, we had paid aggregate distributions, since inception, of approximately $52,939,000 ($22,363,000 in cash and $30,576,000 reinvested in shares of common stock pursuant to the DRIP). Our board of directors intends to continue to pay distributions monthly in arrears for so long as it decides this policy is in the best interest of our stockholders.
On August 12, 2016, our board of directors approved and authorized a daily distribution to our Class A stockholders of record as of the close of business on each day of the period commencing on September 1, 2016 and ending on November 30, 2016. The distributions will be calculated based on 366 days in the calendar year and will be equal to $0.001748634 per share of Class A common stock, which will be equal to an annualized distribution rate of 6.4%, assuming a purchase price of $10.00 per share of Class A common stock. The distributions authorized for each record date in September 2016, October 2016 and November 2016 will be paid in October 2016, November 2016 and December 2016, respectively. The distributions will be payable to stockholders from legally available funds therefor.
On August 12, 2016, our board of directors approved and authorized a daily distribution to our Class T stockholders of record as of the close of business on each day of the period commencing on September 1, 2016 and ending November 30, 2016. The distributions will be calculated based on 366 days in the calendar year and will be equal to $0.001488487 per share of Class T common stock, which will be equal to an annualized distribution rate of 5.69%, assuming a purchase price of $9.574 per share of Class T common stock. The distributions authorized for each record date in September 2016, October 2016 and November 2016 will be paid in October 2016, November 2016 and December 2016, respectively. The distributions will be payable to stockholders from legally available funds therefor.
10
On September 29, 2016, our board of directors approved and authorized an additional daily distribution to our Class A stockholders of record as of the close of business on each day of the period commencing on October 1, 2016 and ending November 30, 2016 in the amount of $0.000013600 per share. This additional distribution amount and the daily distribution of $0.001748634 previously authorized and declared by the board of directors will equal an annualized rate of 6.40%, based on the revised primary offering purchase price of $10.078 per Class A share. The distributions for each record date in October 2016 and November 2016 will be paid in November 2016 and December 2016, respectively. The distributions will be payable to stockholders from legally available funds therefor.
On September 29, 2016, our board of directors approved and authorized an additional daily distribution to our Class T stockholders of record as of the close of business on each day of the period commencing on October 1, 2016 and ending November 30, 2016 in the amount of $0.000008944 per share. This additional distribution amount and the daily distribution of $0.001488487 previously authorized and declared by the board of directors will equal an annualized rate of 5.68%, based on the revised primary offering purchase price of $9.649 per Class T share. The distributions for each record date in October 2016 and November 2016 will be paid in November 2016 and December 2016, respectively. The distributions will be payable to stockholders from legally available funds therefor.
On November 3, 2016, our board of directors approved and authorized a daily distribution to our Class A stockholders of record as of the close of business on each day of the period commencing on December 1, 2016 and ending on February 28, 2017. The distributions for December 2016 will be calculated based on 366 days in the calendar year and will be equal to $0.001762273 per share of Class A common stock, which will be equal to an annualized distribution rate of 6.4%, assuming a purchase price of $10.078 per share of Class A common stock. The distributions for January 2017 and February 2017 will be calculated based on 365 days in the calendar year and will be equal to $0.001767101 per share of Class A common stock, which will be equal to an annualized distribution rate of 6.4%, assuming a purchase price of $10.078 per share of Class A common stock. The distributions authorized for each record date in December 2016, January 2017 and February 2017 will be paid in January 2017, February 2017 and March 2017, respectively. The distributions will be payable to stockholders from legally available funds therefor.
On November 3, 2016, our board of directors approved and authorized a distribution to our Class T stockholders of record as of the close of business on each day of the period commencing on December 1, 2016 and ending on February 28, 2017. The distributions for December 2016 will be calculated based on 366 days in the calendar year and will be equal to $0.001497440 per share of Class T common stock, which will be equal to an annualized distribution rate of 5.68%, assuming a purchase price of $9.649 per share of Class T common stock. The distributions for January 2017 and February 2017 will be calculated based on 365 days in the calendar year and will be equal to $0.001501543 per share of Class T common stock, which will be equal to an annualized distribution rate of 5.68%, assuming a purchase price of $9.649 per share of Class T common stock. The distributions authorized for each record date in December 2016, January 2017 and February 2017 will be paid in January 2017, February 2017 and March 2017, respectively. The distributions will be payable to stockholders from legally available funds therefor.
11
We have paid the following distributions to our Class A stockholders:
| Period Ended | Date Paid | Distribution | ||||
| July 31, 2014 | August 1, 2014 | $ | 439 | |||
| August 31, 2014 | September 2, 2014 | $ | 24,635 | |||
| September 30, 2014 | October 1, 2014 | $ | 66,751 | |||
| October 31, 2014 | November 3, 2014 | $ | 131,229 | |||
| November 30, 2014 | December 1, 2014 | $ | 207,526 | |||
| December 31, 2014 | January 2, 2015 | $ | 324,704 | |||
| January 31, 2015 | February 2, 2015 | $ | 446,359 | |||
| February 28, 2015 | March 2, 2015 | $ | 537,939 | |||
| March 31, 2015 | April 1, 2015 | $ | 823,200 | |||
| April 30, 2015 | May 1, 2015 | $ | 1,039,171 | |||
| May 31, 2015 | June 1, 2015 | $ | 1,299,964 | |||
| June 30, 2015 | July 1, 2015 | $ | 1,471,336 | |||
| July 31, 2015 | August 3, 2015 | $ | 1,715,689 | |||
| August 31, 2015 | September 1, 2015 | $ | 1,894,852 | |||
| September 30, 2015 | October 1, 2015 | $ | 1,982,158 | |||
| October 30, 2015 | November 2, 2015 | $ | 2,200,851 | |||
| November 30, 2015 | December 1, 2015 | $ | 2,285,962 | |||
| December 31, 2015 | January 4, 2016 | $ | 2,547,214 | |||
| January 31, 2016 | February 1, 2016 | $ | 2,719,623 | |||
| February 29, 2016 | March 1, 2016 | $ | 2,676,459 | |||
| March 31, 2016 | April 1, 2016 | $ | 2,979,045 | |||
| April 30, 2016 | May 2, 2016 | $ | 3,006,480 | |||
| May 31, 2016 | June 1, 2016 | $ | 3,210,172 | |||
| June 30, 2016 | July 1, 2016 | $ | 3,202,527 | |||
| July 31, 2016 | August 1, 2016 | $ | 3,397,713 | |||
| August 31, 2016 | September 1, 2016 | $ | 3,485,007 | |||
| September 30, 2016 | October 3, 2016 | $ | 3,441,197 | |||
| October 31, 2016 | November 1, 2016 | $ | 3,645,779 | |||
We have paid the following distributions to our Class T stockholders:
| Period Ended | Date Paid | Distribution | ||||
| January 21, 2016 to January 31, 2016 | February 1, 2016 | $ | 5,101 | |||
| February 29, 2016 | March 1, 2016 | $ | 36,989 | |||
| March 31, 2016 | April 1, 2016 | $ | 81,312 | |||
| April 30, 2016 | May 2, 2016 | $ | 131,960 | |||
| May 31, 2016 | June 1, 2016 | $ | 196,058 | |||
| June 30, 2016 | July 1, 2016 | $ | 241,283 | |||
| July 31, 2016 | August 1, 2016 | $ | 303,461 | |||
| August 31, 2016 | September 1, 2016 | $ | 350,322 | |||
| September 30, 2016 | October 3, 2016 | $ | 384,775 | |||
| October 31, 2016 | November 1, 2016 | $ | 444,087 | |||
For the nine months ended September 30, 2016, we paid distributions of approximately $28,570,000 of which $12,285,000 was cash and $16,285,000 was reinvested in shares of our common stock pursuant to the DRIP. For the nine months ended September 30, 2016, we paid and declared distributions of approximately $28,570,000 including shares issued pursuant to the DRIP, as compared to FFO (as defined below) for the nine months ended September 30, 2016 of approximately
12
$18,899,000. The payment of distributions from sources other than FFO may reduce the amount of proceeds available for investment and operations or cause us to incur additional interest expense as a result of borrowed funds and may cause subsequent investors to experience dilution. We define FFO, a non-GAAP (defined below) measure, consistent with the standards established by the White Paper on FFO approved by the Board of Governors of National Association of Real Estate Investment Trusts, as revised in February 2004, or the White Paper. The White Paper defines FFO as net income or loss computed in accordance with generally accepted accounting principles in the United States, or GAAP, excluding gains or losses from sales of property and asset impairment writedowns, plus depreciation or amortization, and after adjustments for unconsolidated partnerships and joint ventures. Adjustments for unconsolidated partnerships and joint ventures are calculated to reflect FFO on the same basis. See “Management’s Discussion and Analysis of Financial Condition and Results of Operations—Funds from Operations and Modified Funds from Operations” for the nine months ended September 30, 2016 included in this prospectus supplement, for information regarding why we present funds from operations and for reconciliations of this non-GAAP financial measure to net income.
The following table presents distributions and sources of distributions for the nine months ended September 30, 2016 (amounts are rounded and in thousands):
| Nine Months Ended September 30, | |||||
| 2016 | |||||
| Distributions paid in cash - common stockholders | $ | 12,285 | |||
| Distributions reinvested (shares issued) | 16,285 | ||||
| Total distributions | $ | 28,570 | |||
| Source of distributions: | |||||
Cash flows provided by operations (1) | $ | 12,285 | 43% | ||
Offering proceeds from issuance of common stock pursuant to the DRIP (1) | 16,285 | 57% | |||
| Total sources | $ | 28,570 | 100% | ||
| (1) | Percentages were calculated by dividing the respective source amount by the total sources of distributions. |
Recent Real Property Acquisitions
The following information replaces in its entirety the first sentence of the second full paragraph on page 16 of the “Prospectus Summary—Description of Real Estate Investments” section of the prospectus and the first sentence of the second full paragraph on page 135 of the “Investment Objectives, Strategy and Policies—Description of Real Estate Investments” section of the prospectus:
As of November 21, 2016, on a portfolio level, we, through wholly-owned subsidiaries of our operating partnership, Carter Validus Operating Partnership II, LP, or CVOP II, owned 100% of the fee simple interest in 47 properties located in various states, consisting of approximately 2,672,000 gross rentable square feet of commercial space with a consolidated weighted average yield of 7.97% and average annual rent escalations of 2.21%.
The following information supplements, and should be read in conjunction with, the table on page 17 contained in the “Prospectus Summary—Description of Real Estate Investments” section of the prospectus and the table beginning on page 135 contained in the “Investment Objectives, Strategy and Policies—Description of Real Estate Investments” section of the prospectus:
| Property Description* | Date Acquired | Year Constructed | Purchase Price | Property Taxes | Fees Paid to Sponsor(1) | Initial Yield(2) | Average Yield(3) | Physical Occupancy | Location | MSA(4) | ||||||||||||||||
| HPI Portfolio | (5) | (5) | $ | 116,499,921 | $ | 346,563 | (6) | $ | 2,329,998 | 6.41% | 7.19% | 100.00% | (5) | (5) | ||||||||||||
| AT&T Hawthorne Data Center | 09/27/2016 | 1963(8) | $ | 79,500,000 | $ | 637,724 | (6) | $ | 1,590,000 | 6.22% | 7.16% | 100.00% | Hawthorne, CA | Los Angeles-Long Beach-Anaheim, CA | ||||||||||||
| McLean Data Center Portfolio | 10/17/2016 | (9) | $ | 85,000,000 | $ | 810,953 | (7) | $ | 1,700,000 | 7.30% | 7.82% | 97.31% | McLean, VA | Washington-Arlington-Alexandria, DC-VA-MD-WV | ||||||||||||
13
| (1) | Fees paid to the sponsor include payments made to an affiliate of our advisor for acquisition fees in connection with the property acquisition. It does not include fees paid to any property manager, including our affiliated property manager. For more detailed information on fees paid to our advisor or its affiliates, see the section captioned “Management Compensation” beginning on page 103 of the prospectus. |
| (2) | Initial yield is calculated as the current annualized rental income for the in-place lease at the property divided by the property purchase price adjusted for certain seller credits, exclusive of acquisition costs and fees paid to our advisor or its affiliates. The property is subject to a long-term net lease. Accordingly, our management believes that current annualized rental income is a more appropriate figure from which to calculate initial yield than net operating income. |
| (3) | Average yield is calculated as the average annual rental income, adjusted for any rent incentives, for the in-place lease over the non-cancellable lease term at the property divided by the property purchase price adjusted for certain seller credits, exclusive of acquisition costs and fees paid to our advisor or its affiliates. The properties are subject to a long-term net leases. Accordingly, our management believes that average annual rental income is a more appropriate figure from which to calculate average yield than net operating income. |
| (4) | Our properties are located in the metropolitan statistical areas, or MSAs, or micropolitan statistical areas, or µSAs, of their respective cities and as such may compete with other facilities for tenants if the current leases are not renewed. |
| (5) | The HPI Portfolio consists of the following nine healthcare properties: |
| Property Description | Date Acquired | Year Constructed | Year Renovated | Location | MSA | |||||
| HPI - Oklahoma City I | 12/29/2015 | 1985 | 1998 & 2003 | Oklahoma City, OK | Oklahoma City, OK | |||||
| HPI - Oklahoma City II | 12/29/2015 | 1994 | 1999 | Oklahoma City, OK | Oklahoma City, OK | |||||
| HPI - Edmond | 01/20/2016 | 2002 | N/A | Edmond, OK | Oklahoma City, OK | |||||
| HPI - Oklahoma City III | 01/27/2016 | 2007 | N/A | Oklahoma City, OK | Oklahoma City, OK | |||||
| HPI - Oklahoma City IV | 01/27/2016 | 2006 | N/A | Oklahoma City, OK | Oklahoma City, OK | |||||
| HPI - Newcastle | 02/03/2016 | 1995 | 1999 | Newcastle, OK | Oklahoma City, OK | |||||
| HPI - Oklahoma City V | 02/11/2016 | 2008 | N/A | Oklahoma City, OK | Oklahoma City, OK | |||||
| HPI - Oklahoma City VI | 03/07/2016 | 2007 | N/A | Oklahoma City, OK | Oklahoma City, OK | |||||
| HPI - Oklahoma City VII | 06/22/2016 | 2016 | N/A | Oklahoma City, OK | Oklahoma City, OK | |||||
| (6) | Represents the real estate taxes on the property for 2015. |
| (7) | Represents the real estate taxes on the properties for 2016. |
| (8) | The AT&T Hawthorne Data Center was renovated in 1983 and 2001. |
| (9) | The McLean Data Center Portfolio consists of two properties. McLean I was built in 1966 and renovated in 1998. McLean II was built in 1991 and renovated in 1998. |
| * | We believe all of our properties are suitable for their present and intended purposes, and adequately covered by insurance. |
Tenant Lease Terms
The following information supplements, and should be read in conjunction with, the table beginning on page 141 contained in the “Investment Objectives, Strategy and Policies–Tenant Lease Terms” section of the prospectus:
| Portfolio Description | Property Description | Major Tenants(1) | Total Square Feet Leased | % of Total Square Feet Leased | Renewal Options(4) | Annual Base Rent at Acquisition | Annual Base Rent Per Square Foot at Acquisition | Lease Expiration | ||||||||
HPI Portfolio(2) | HPI - Oklahoma City VII | Community Hospital, LLC(5)(11) | 102,978 | 100.00% | 4/5 yr. | $2,602,959 | (7) | $25.28 | 06/30/2031 | |||||||
| – | AT&T Hawthorne Data Center(3) | AT&T Corporation(5)(12) | 288,000 | 100.00% | 3/5 yr. | $4,944,000 | (8) | $17.17 | 05/31/2026 | |||||||
McLean Data Center Portfolio(3) | McLean I | Level 3 Communications, LLC(6)(13) | 65,794 | 94.90% | None | $2,928,144 | (9) | $44.50 | 04/30/2033 | |||||||
| McLean II | PAETEC Communications, LLC(6)(14) | 62,002 | 100.00% | 1/5 yr. | $3,272,950 | (10) | $52.79 | 03/31/2024 | ||||||||
| (1) | Major tenants include those tenants that occupy greater than 10% of the rentable square feet of their respective property. We believe each of these tenants is creditworthy. |
| (2) | All of the operations and the principal nature of the business of the tenants are healthcare related. |
14
| (3) | All of the operations and the principal nature of the business of the tenants are data center related. |
| (4) | Represents option renewal period/term of each option. |
| (5) | The tenant entered into a net lease pursuant to which the tenant is required to pay all operating expenses and capital expenditures of the building. |
| (6) | The tenant entered into a net lease pursuant to which the tenant is required to pay all operating expenses. We are responsible for the roof, foundation and structural components of the building. |
| (7) | The annual base rent under the lease increases every five years by 8.0% of then-current annual base rent. |
| (8) | The annual base rent under the lease increases each year by 3.0% of the then-current annual base rent. |
| (9) | The portion of the annual base rent for 62,094 square feet of the leased area increases each year by 2.50% of the then-current annual base rent and by 2.75% beginning on May 1, 2018. The portion of the annual base rent for 3,700 square feet of the leased area increases each year by 2.75% of the then-current base rent. |
| (10) | The annual base rent under the lease increases every year by 2.75% of the then-current base rent. |
| (11) | This tenant is not a credit rated entity. |
| (12) | AT&T Corporation is a wholly-owned subsidiary of AT&T Inc., which has a credit rating of Baa1 by Moody's Investors Service, or Moody's and BBB+ by Standard and Poor's Rating Services, or S&P. |
| (13) | Level 3 Communications, LLC is a wholly owned subsidiary of Level 3 Communications, Inc., which is rated Ba3 by Moody's and BB by S&P. |
| (14) | The lease is guaranteed by PAETEC Holding, LLC, a subsidiary of Windstream Services, LLC. Windstream Services, LLC is rated B1 by Moody's. |
The following information supplements, and should be read in conjunction with, the table on page 142 contained in the “Investment Objectives, Strategy and Policies—Depreciable Tax Basis” section of the prospectus:
| Property Description | Depreciable Tax Basis | |
| HPI Portfolio | $106,909,921 | |
| AT&T Hawthorne Data Center | $71,550,000 | |
| McLean Data Center Portfolio | $76,500,000 | |
Other Real Property Acquisitions
The following information replaces in its entirety the first sentence of the first full paragraph on page 18 of the “Prospectus Summary—Description of Real Estate Investments” section of the prospectus and the first sentence of the first full paragraph on page 137 of the “Investment Objectives, Strategy and Policies—Description of Real Estate Investments” section of the prospectus:
As of November 21, 2016, we purchased, since inception, 30 other properties for an aggregate purchase price of approximately $529,859,000, plus closing costs, and consolidated annual base rent at acquisition of approximately $37,566,000.
15
The following information supplements, and should be read in conjunction with, the table beginning on page 18 contained in the “Prospectus Summary—Description of Real Estate Investments” section of the prospectus and the table beginning on page 137 contained in the “Investment Objectives, Strategy and Policies—Description of Real Estate Investments” section of the prospectus:
The following table summarizes the five other properties acquired since April 27, 2016 in order of acquisition date:
| Property Description* | Location | MSA(3) | Date Acquired | Purchase Price | Property Taxes | Fees Paid to Sponsor (1) | Major Tenant (2) | Total Rentable Square Feet | % of Total Rentable Square Feet Leased to Major Tenants | % of Total Rentable Square Feet Leased | Lease Expiration for Major Tenants | |||||||||||||||||
| Post Acute Las Vegas Rehabilitation Hospital | Las Vegas, NV | Las Vegas-Henderson-Paradise, NV | 06/24/2016 | $ | 3,251,611 | (10) | $ | 31,792 | (5) | $ | 481,052 | (10) | PAM Squared at Las Vegas, LLC(6) | 56,220 | (9) | (11) | (11) | (11) | ||||||||||
| Somerset Data Center | Somerset, NJ | New York-Newark-Jersey City, NY-NJ-PA | 06/29/2016 | $ | 12,375,000 | $ | 179,094 | (4) | $ | 247,500 | Datapipe, Inc.(7) | 36,114 | 100.00% | 100.00% | 07/05/2028 | |||||||||||||
| Integris Lakeside Women's Hospital | Oklahoma City, OK | Oklahoma City, OK | 06/30/2016 | $ | 19,840,000 | $ | 128,862 | (4) | $ | 396,800 | Lakeside Women's Hospital, LLC (6) | 62,857 | 100.00% | 100.00% | 12/31/2027 | |||||||||||||
| Select Medical Rehabilitation Facility | Marlton, NJ | Philadelphia-Camden-Wilmington, PA-NJ-DE-MD | 11/01/2016 | $ | 63,580,000 | $ | 264,847 | (5) | $ | 1,271,600 | Kessler Institute for Rehabilitation, Inc.(8) | 89,000 | 100.00% | 100.00% | 10/31/2031 | |||||||||||||
| Andover Data Center II | Andover, MA | Boston-Cambridge-Newton, MA-NH | 11/08/2016 | $ | 37,000,000 | $ | 390,627 | (5) | $ | 740,000 | NaviSite, LLC(12) | 153,000 | 64.89% | 100.00% | 01/31/2029 | |||||||||||||
WSI Corporation(13) | 35.11% | 11/30/2018 | ||||||||||||||||||||||||||
| (1) | Fees paid to the sponsor include payments made to an affiliate of our advisor for acquisition fees in connection with the property acquisition. It does not include fees paid to any property manager, including our affiliated property manager. For more detailed information on fees paid to our advisor or its affiliates, see the section captioned "Management Compensation" beginning on page 103 of the prospectus. |
| (2) | Major tenants include those tenants who occupy greater than 10% of the rentable square feet of their respective property. We believe each of these tenants is creditworthy. |
| (3) | Our properties are located in the MSAs of their respective cities and as such may compete with other facilities for tenants if the current leases are not renewed. |
| (4) | Represents real estate taxes for 2015. |
| (5) | Represents the real estate taxes for 2016. |
| (6) | These tenants are not credit rated entities. |
| (7) | Datapipe, Inc. has a credit rating of B3 by Moody's and a credit rating of B by S&P. |
| (8) | The tenant is a subsidiary of Select Medical Holdings Corporation, which is rated B1 by Moody's. |
| (9) | Represents the total estimated square feet of the Post Acute Las Vegas Rehabilitation Hospital after construction is completed. |
| (10) | Future construction costs for the Post Acute Las Vegas Rehabilitation Hospital are budgeted at $18.5 million. The fees paid to the sponsor were based on the total estimated cost of the property, including budgeted future construction costs. |
16
| (11) | The lease with PAM Squared at Las Vegas, LLC was entered into on June 24, 2016, and occupancy will commence upon the completion of construction in accordance with the terms of the lease agreement. The lease expiration date is 20 years from the lease commencement date. |
| (12) | The tenant is a subsidiary of Charter Communications, Inc., which is rated Ba2 by Moody's, BB+ by S&P, and BB- by Fitch Ratings, or Fitch. Charter Communications, Inc. guarantees the lease. |
| (13) | The tenant is a subsidiary of TWCC Holding Corp., which guarantees the lease. TWCC Holding Corp. is a subsidiary of International Business Machines Corp. (IBM), which is rated Aa3 by Moody's, AA- by S&P, and A+ by Fitch. |
| * | We believe all of our properties are suitable for their present and intended purposes, and adequately covered by insurance. |
Property Statistics
The following table replaces in its entirety the table beginning on page 139 of the “Investment Objectives, Strategy and Policies–Property Statistics” section of the prospectus:
The following table shows the property diversification of our real estate portfolio as of November 21, 2016:
| Property | MSA/µSA | Segment | Date Acquired | Year Constructed | Physical Occupancy | Gross Leased Area (Sq Ft) | Encumbrances | ||||||||||
| Cy Fair Surgical Center | Houston-The Woodlands-Sugar Land, TX | Healthcare | 07/31/2014 | 1993 | 100.00% | 13,645 | (1) | ||||||||||
| Mercy Healthcare Facility | Cincinnati, OH-KY-IN | Healthcare | 10/29/2014 | 2001 | 100.00% | 14,868 | (1) | ||||||||||
| Winston-Salem, NC IMF | Winston-Salem, NC | Healthcare | 12/17/2014 | 2004 | 100.00% | 22,200 | (1) | ||||||||||
New England Sinai Medical Center(2) | Boston-Cambridge- Newton, MA-NH | Healthcare | 12/23/2014 | 1967/1973(3) | 100.00% | 180,744 | (1) | ||||||||||
| Baylor Surgical Hospital at Fort Worth | Dallas-Fort Worth-Arlington, TX | Healthcare | 12/31/2014 | 2014 | 100.00% | 83,464 | (1) | ||||||||||
| Baylor Surgical Hospital Integrated Medical Facility | Dallas-Fort Worth-Arlington, TX | Healthcare | 12/31/2014 | 2014 | 87.31% | 7,219 | (1) | ||||||||||
| Winter Haven Healthcare Facility | Lakeland-Winter Haven, FL | Healthcare | 01/27/2015 | 2009 | 100.00% | 7,560 | — | ||||||||||
| Heartland Rehabilitation Hospital | Kansas City, MO-KS | Healthcare | 02/17/2015 | 2014 | 100.00% | 54,568 | (1) | ||||||||||
| Indianapolis Data Center | Indianapolis-Carmel-Anderson, IN | Data Center | 04/01/2015 | 2000(4) | 100.00% | 43,724 | (1) | ||||||||||
| Clarion IMF | Pittsburgh, PA | Healthcare | 06/01/2015 | 2012 | 100.00% | 33,000 | (1) | ||||||||||
| Post Acute Webster Rehabilitation Hospital | Houston-The Woodlands-Sugarland, TX | Healthcare | 06/05/2015 | 2015 | 100.00% | 53,514 | (1) | ||||||||||
| Eagan Data Center | St. Cloud, MN | Data Center | 06/29/2015 | 1998(5) | 100.00% | 87,402 | (1) | ||||||||||
| Houston Surgical Hospital and LTACH | Houston-The Woodlands-Sugarland, TX | Healthcare | 06/30/2015 | 1950(6) | 100.00% | 102,369 | (1) | ||||||||||
| Kentucky Maine Ohio IMF Portfolio | (7) | Healthcare | 07/22/2015 | (7) | 100.00% | 293,628 | (1) | ||||||||||
| Reading Surgical Hospital | Philadelphia-Camden-Wilmington, PA-NJ-DE-MD | Healthcare | 07/24/2015 | 2007 | 100.00% | 33,217 | (1) | ||||||||||
| Post Acute Warm Springs Specialty Hospital of Luling | Austin-Round Rock, TX | Healthcare | 07/30/2015 | 2002 | 100.00% | 40,901 | (1) | ||||||||||
| Minnetonka Data Center | Minneapolis-St. Paul-Bloomington, MN-WI | Data Center | 08/28/2015 | 1985 | 100.00% | 135,240 | (1) | ||||||||||
| Nebraska Healthcare Facility | Omaha-Council Bluffs, NE-IA | Healthcare | 10/14/2015 | 2014 | 100.00% | 40,402 | (1) | ||||||||||
| Heritage Park Portfolio | Sherman-Denison, TX | Healthcare | 11/20/2015 | (8) | 100.00% | 65,631 | (1) | ||||||||||
| Baylor Surgery Center at Fort Worth | Dallas-Fort Worth-Arlington, TX | Healthcare | 12/23/2015 | 1998(9) | 100.00% | 36,800 | (1) | ||||||||||
| HPI Portfolio | Oklahoma City, OK | Healthcare | (10) | (10) | 100.00% | 335,686 | (10) | ||||||||||
| Waco Data Center | Waco, TX | Data Center | 12/30/2015 | 1956(11) | 100.00% | 43,596 | (1) | ||||||||||
| Alpharetta Data Center III | Atlanta-Sandy Springs-Roswell, GA | Data Center | 02/02/2016 | 1999 | 100.00% | 77,322 | — | ||||||||||
| Flint Data Center | Flint, MI | Data Center | 02/02/2016 | 1987 | 100.00% | 32,500 | (1) | ||||||||||
| Vibra Rehabilitation Hospital | Riverside-San Bernardino-Ontario, CA | Healthcare | 03/01/2016 | (12) | — | — | — | ||||||||||
| Tennessee Data Center | Nashville-Davidson-Murfreesboro-Franklin, TN | Data Center | 03/31/2016 | 2015 | 100.00% | 71,726 | — | ||||||||||
| Post Acute Las Vegas Rehabilitation Hospital | Las Vegas-Henderson-Paradise, NV | Healthcare | 06/24/2016 | (13) | — | — | — | ||||||||||
| Somerset Data Center | New York-Newark-Jersey City, NY-NJ-PA | Data Center | 06/29/2016 | 1973(14) | 100.00% | 36,114 | (1) | ||||||||||
| Integris Lakeside Women's Hospital | Oklahoma City, OK | Healthcare | 06/30/2016 | 1997(15) | 100.00% | 62,857 | (1) | ||||||||||
| AT&T Hawthorne Data Center | Los Angeles-Long Beach-Anaheim, CA | Data Center | 09/27/2016 | 1963(16) | 100.00% | 288,000 | 39,750 | ||||||||||
| McLean Data Center Portfolio | Washington-Arlington-Alexandria, DC-VA-MD-WV | Data Center | 10/17/2016 | (17) | 97.31% | 127,796 | — | ||||||||||
| Select Medical Rehabilitation Facility | Philadelphia-Camden-Wilmington, PA-NJ-DE-MD | Healthcare | 11/01/2016 | 1995 | 100.00% | 89,000 | — | ||||||||||
| Andover Data Center II | Boston-Cambridge-Newton, MA-NH | Data Center | 11/08/2016 | 2000 | 100.00% | 153,000 | (1) | ||||||||||
| 2,667,693 | $ | 39,750 | |||||||||||||||
17
| (1) | Property collateralized under the KeyBank Credit Facility. As of November 21, 2016, 37 commercial real estate properties were collateralized under the KeyBank Credit Facility and we had an outstanding principal balance of $260,000,000. |
| (2) | The New England Sinai Medical Center consists of two buildings. |
| (3) | The New England Sinai Medical Center was renovated beginning in 1997. |
| (4) | The Indianapolis Data Center was renovated in 2014. |
| (5) | The Eagan Data Center was renovated in 2015. |
| (6) | The Houston Surgical Hospital and LTACH was renovated in 2005 and 2008. |
| (7) | The Kentucky Maine Ohio IMF Portfolio consists of the following five properties: |
| Property Description | MSA/µSA | Year Constructed | Year Renovated | |||
| KMO IMF - Cincinnati I | Cincinnati, OH-KY-IN | 1959 | 1970 & 2013 | |||
| KMO IMF - Cincinnati II | Cincinnati, OH-KY-IN | 2014 | N/A | |||
| KMO IMF - Florence | Cincinnati, OH-KY-IN | 2014 | N/A | |||
| KMO IMF - Augusta | Augusta-Waterville, ME (µSA) | 2010 | N/A | |||
| KMO IMF - Oakland | Augusta-Waterville, ME (µSA) | 2003 | N/A | |||
| (8) | The Heritage Park Portfolio consists of the following two properties: |
| Property Description | Year Constructed | Year Renovated | ||
| Heritage Park - Sherman I | 2005 | 2010 | ||
| Heritage Park - Sherman II | 2005 | N/A | ||
| (9) | The Baylor Surgery Center at Fort Worth was renovated in 2007 and 2015. |
| (10) | The HPI Portfolio consists of the following nine properties: |
| Property Description | Date Acquired | Year Constructed | Year Renovated | Encumbrances | ||||
| HPI - Oklahoma City I | 12/29/2015 | 1985 | 1998 & 2003 | (1) | ||||
| HPI - Oklahoma City II | 12/29/2015 | 1994 | 1999 | (1) | ||||
| HPI - Edmond | 01/20/2016 | 2002 | N/A | (1) | ||||
| HPI - Oklahoma City III | 01/27/2016 | 2007 | N/A | (1) | ||||
| HPI - Oklahoma City IV | 01/27/2016 | 2006 | N/A | (1) | ||||
| HPI - Newcastle | 02/03/2016 | 1995 | 1999 | (1) | ||||
| HPI - Oklahoma City V | 02/11/2016 | 2008 | N/A | (1) | ||||
| HPI - Oklahoma City VI | 03/07/2016 | 2007 | N/A | (1) | ||||
| HPI - Oklahoma City VII | 06/22/2016 | 2016 | N/A | — | ||||
| (11) | The Waco Data Center was renovated in 2009. |
| (12) | As of November 21, 2016, the Vibra Rehabilitation Hospital was under construction. |
| (13) | As of November 21, 2016, the Post Acute Las Vegas Rehabilitation Hospital was under construction. |
| (14) | The Somerset Data Center was renovated in 2006. |
| (15) | The Integris Lakeside Women's Hospital was renovated in 2008. |
| (16) | The AT&T Hawthorne Data Center was renovated in 1983 and 2001. |
| (17) | The McLean Data Center Portfolio consists of the following two properties: |
| Property Description | Year Constructed | Year Renovated | ||
| McLean I | 1966 | 1998 | ||
| McLean II | 1991 | 1998 | ||
Credit Facility
The following information supplements, and should be read in conjunction with, the discussion on page 142 contained in the "Investment Objectives, Strategy and Policies — Entry into a Credit Facility" section of the prospectus:
On September 30, 2016, CVOP II and certain of our subsidiaries amended certain agreements related to the KeyBank
18
Credit Facility to increase the maximum commitments available under the KeyBank Credit Facility from $265,000,000 to an aggregate of up to $315,000,000, consisting of a $265,000,000 revolving line of credit, with a maturity date of December 22, 2018, subject to CVOP II’s right for two, 12-month extension periods, and a $50,000,000 term loan, with a maturity date of December 22, 2019, subject to CVOP II’s right for one, 12-month extension period. Subject to certain conditions, the KeyBank Credit Facility can be increased to $550,000,000.
In connection with these amendments, the annual interest rate payable under the KeyBank Credit Facility was increased to, at CVOP II’s option, either (a) the London Interbank Offered Rate, plus an applicable margin ranging from 2.00% to 2.65% (the margin rate was previously set at a range from 1.75% to 2.65%), which is determined based on the overall leverage of CVOP II; or (b) a base rate, which means, for any day, a fluctuating rate per annum equal to the prime rate for such day, plus an applicable margin ranging from 1.00% to 1.65% (the margin rate was previously set at a range from 0.75% to 1.65%), which is determined based on the overall leverage of CVOP II.
In addition to interest, CVOP II is required to pay a fee on the unused portion of the lenders’ commitments under the KeyBank Credit Facility agreement, or the Unused Fee, at a per annum rate equal to 0.30% if the average daily amount outstanding under the KeyBank Credit Facility is less than 50% of the lenders’ commitments or 0.20% if the average daily amount outstanding under the KeyBank Credit Facility is greater than 50% of the lenders’ commitments. The Unused Fee is payable quarterly in arrears.
The actual amount of credit available under the KeyBank Credit Facility is a function of certain loan-to-cost, loan-to- value and debt service coverage ratios contained in the KeyBank Credit Facility agreement.
The following information supplements, and should be read in conjunction with, the table on page 143 contained in the "Investment Objectives, Strategy and Policies — Entry into a Credit Facility" section of the prospectus:
The following table summarizes information on the properties in which CVOP II has pledged a security interest that serve as collateral for the credit facility since April 27, 2016:
| Property | Date Added | Pool Availability | ||
| HPI — Oklahoma City VI | 06/01/2016 | $2,777,500 | ||
| Flint Data Center | 06/01/2016 | $4,675,000 | ||
| Eagan Data Center | 06/01/2016 | $3,190,000 | ||
| Somerset Data Center | 09/23/2016 | $6,806,250 | ||
| Integris Lakeside Women's Hospital | 09/23/2016 | $10,912,000 | ||
| Andover Data Center II | 11/08/2016 | $20,350,000 | ||
As of November 21, 2016, we had a total pool availability under the KeyBank Credit Facility of $279,358,000 and an aggregate outstanding principal balance of $260,000,000. As of November 21, 2016, $19,358,000 remained to be drawn on the KeyBank Credit Facility.
Placement of Debt on Certain Real Property Investments
The following table is inserted in the “Investment Objectives, Strategy and Policies — Description of Real Estate Investments” section beginning on page 135 of the prospectus.
| Property Description | Lender | Loan Balance* | Interest Rate | Loan Date | |||||||
| AT&T Hawthorne Data Center | SunTrust Bank | $ | 19,875,000 | 30-day LIBOR plus 250 basis points | 10/28/2016 | 10/28/2021 | |||||
| Compass Bank | 19,875,000 | ||||||||||
| $ | 39,750,000 | (1) | (2) | ||||||||
| * | Principal balance outstanding on the loan is as of the respective loan origination date. |
| (1) | The loan is secured by the AT&T Hawthorne Data Center. The material terms of the loan provide for the following: (i) a variable interest rate at the 30-day LIBOR plus 250 basis points and (ii) a default annual interest rate equal to the lesser of (a) the interest rate otherwise applicable to the loan plus an additional 4% per annum, or (b) the maximum legal rate (as defined in the loan agreement). The loan agreement also contains various affirmative and |
19
negative covenants that are customary for loan agreements of this type, including, among others, mandatory prepayment upon the occurrence of certain events.
| (2) | Represents the interest rate as of October 28, 2016. On November 3, 2016, we entered into an interest rate swap to effectively fix LIBOR at a rate of 1.201%, through the maturity date of October 28, 2021. |
Tenant Lease Expirations
The following table supersedes and replaces in its entirety the table on page 144 contained in the "Investment Objectives, Strategy and Policies—Tenant Lease Expirations" section of the prospectus:
The following is a schedule of lease expiration of the properties by year:
| Year | Number of Tenants Whose Leases Expire | Total Square Footage Expiring | Minimum Annual Base Rentals at Acquisition (in thousands) | % of Annual Base Rentals | |||||||||
| 2016 | 1 | 13,394 | $ | 147 | 0.2 | % | |||||||
| 2017 | — | — | — | — | % | ||||||||
| 2018 | 2 | 64,639 | 1,012 | 1.7 | % | ||||||||
| 2019 | 3 | 99,714 | 1,507 | 2.5 | % | ||||||||
| 2020 | 1 | 8,229 | 504 | 0.8 | % | ||||||||
| 2021 | — | — | — | — | % | ||||||||
| 2022 | 2 | 40,365 | 698 | 1.1 | % | ||||||||
| 2023 | 1 | 3,142 | 66 | 0.1 | % | ||||||||
| 2024 | 4 | 205,136 | 5,285 | 8.7 | % | ||||||||
| 2025 | 3 | 173,337 | 2,973 | 4.9 | % | ||||||||
| Thereafter | 35 | 2,059,737 | 48,756 | 80.0 | % | ||||||||
| 52 | 2,667,693 | $ | 60,948 | 100.0 | % | ||||||||
Risk Factors
The following information supersedes and replaces the risk factor entitled “We will be required to disclose an estimated net asset value, or NAV, per share of our common stock prior to the conclusion of this Offering or shortly after the conclusion of this Offering, and the purchase price you pay for shares of our common stock in this Offering may be higher than such estimated NAV per share. The estimated NAV per share may not be an accurate reflection of the fair value of our assets and liabilities and likely will not represent the amount of net proceeds that would result if we were liquidated or dissolved” in the section entitled “Risk Factors - Risks Related to an Investment in Carter Validus Mission Critical REIT II, Inc.” beginning on page 35 of the prospectus:
Our estimated value per share of our Class A common stock and Class T common stock are estimates as of a given point in time and likely will not represent the amount of net proceeds that would result if we were liquidated or dissolved or completed a merger or other sale of the company.
The offering prices per Class A share and Class T share are based on our estimated per share NAV of each of our Class A common stock and Class T common stock as of June 30, 2016, as determined by our board of directors on September 29, 2016, which we refer to collectively as our Estimated Per Share NAV, and any applicable per share upfront selling commissions and dealer manager fees.
The price at which stockholders purchase shares and any subsequent values are likely to differ from the price at which a stockholder could resell such shares because: (1) there is no public trading market for our shares at this time; (2) the price does not reflect, and will not reflect, the fair value of our assets as we acquire them, nor does it represent the amount of net proceeds that would result from an immediate liquidation of our assets or sale of the company, because the amount of proceeds available for investment from this offering is net of selling commissions, dealer manager fees, other organization and offering expense reimbursements and acquisition fees and expenses; (3) the estimated value does not take into account how market fluctuations affect the value of our investments, including how the current conditions in the financial and real estate markets may affect the value of our investments; (4) the estimated value does not take into account how developments related to individual assets may increase or decrease the value of our portfolio; and (5) the estimated value does not take into account any portfolio premium or premiums to value that may be achieved in a liquidation of our assets or sale of our
20
portfolio.
Further, the value of our shares will fluctuate over time as a result of, among other things, developments related to individual assets and responses to the real estate and capital markets. The Estimated Per Share NAV does not reflect a discount for the fact that we are externally managed, nor does it reflect a real estate portfolio premium/discount versus the sum of the individual property values. The Estimated Per Share NAV also does not take into account estimated disposition costs and fees for real estate properties that are not held for sale.
There are currently no SEC, federal and state rules that establish requirements specifying the methodology to employ in determining an estimated value per share; provided, however, that pursuant to FINRA rules the determination of the estimated value per share must be conducted by, or with the material assistance or confirmation of, a third-party valuation expert and must be derived from a methodology that conforms to standard industry practice. Subsequent estimates of our Estimated Per Share NAV will be done at least annually. Our Estimated Per Share NAV is an estimate as of a given point in time and likely does not represent the amount of net proceeds that would result from an immediate sale of our assets.
The following risk factors supplement, and should be read in conjunction with, the section of our prospectus entitled “Risk Factors - Risks Related to an Investment in Carter Validus Mission Critical REIT II, Inc.” beginning on page 34 of the prospectus:
The purchase prices you pay for shares of our Class A common stock and Class T common stock are based on the Estimated Per Share NAV at a given point in time, and any applicable per share upfront selling commissions and dealer manager fees. Our Estimated Per Share NAV is based upon a number of estimates, assumptions, judgments and opinions that may not be, or may later prove not to be, accurate or complete, which could make the estimated valuations incorrect. As a result, our Estimated Per Share NAV may not reflect the amount that you might receive for your shares in a market transaction, and the purchase price you pay may be higher than the value of our assets per share of common stock at the time of your purchase.
The per share price for Class A shares and Class T shares in our primary offering and pursuant to our DRIP are based on our most recent Estimated Per Share NAV and applicable upfront commissions and fees. Currently, there are no SEC, federal or state rules that establish requirements specifying the methodology to employ in determining an estimated per share NAV. The audit committee of our board of directors, pursuant to authority delegated by our board of directors, was responsible for the oversight of the valuation process, including the review and approval of the valuation process and methodology used to determine our Estimated Per Share NAV, the consistency of the valuation and appraisal methodologies with real estate industry standards and practices and the reasonableness of the assumptions used in the valuations and appraisals.
Pursuant to the prior approval of the audit committee of our board of directors, which is solely comprised of our independent directors, in accordance with the valuation policies previously adopted by our board of directors, we engaged Robert A. Stanger & Co., Inc., or Stanger, an independent third-party valuation firm, to assist with determining the Estimated Per Share NAV. Our Estimated Per Share NAV was determined after consultation with our advisor and Stanger. Stanger prepared an appraisal report summarizing key information and assumptions and providing a value on 40 of our 42 properties in our portfolio as of June 30, 2016. Stanger also prepared a net asset value report, which estimates the Per Share NAV of each of our Class A and Class T common stock as of June 30, 2016. The valuation was based upon the estimated value of our assets less the estimated value of our liabilities divided by the number of shares outstanding on an adjusted fully diluted basis, calculated as of June 30, 2016, and was performed in accordance with the valuation guidelines established by the Investment Program Association Practice Guideline 2013-01, Valuations of Publicly Registered Non-Listed REITs. The Estimated Per Share NAV was determined by our board of directors. Subsequent estimates of our per share NAV for each of our Class A common stock and Class T common stock will be prepared at least annually.
Our Estimated Per Share NAV is an estimate as of a given point in time and likely does not represent the amount of net proceeds that would result from an immediate sale of our assets. The Estimated Per Share NAV is not intended to be related to any values at which individual assets may be carried on financial statements under applicable accounting standards. While the determination of our most recent Estimated Per Share NAV was conducted with the material assistance of a third-party valuation expert, with respect to asset valuations, we are not required to obtain asset-by-asset appraisals prepared by certified independent appraisers, nor must any appraisals conform to formats or standards promulgated by any trade organization. Other than the information included in our Current Report on Form 8-K filed on September 30, 2016 regarding the Estimated Per Share NAV, we do not intend to release individual property value estimates or any of the data supporting the Estimated Per Share NAV. See the section of our prospectus captioned “Investment Objectives, Strategy and Policies - Dilution of the Net Tangible Book Value of Our Shares” for further discussion.
It may be difficult to accurately reflect material events that may impact our estimated per share NAV between valuations, and accordingly we may be selling and repurchasing shares at too high or too low a price.
Our independent third-party valuation expert will calculate estimates of the market value of our principal real estate and
21
real estate-related assets, and our board of directors will determine the net value of our real estate and real estate-related assets and liabilities taking into consideration such estimates provided by the independent third-party valuation expert. Our board of directors is ultimately responsible for determining the estimated per share NAV. Since our board of directors will determine our estimated per share NAV at least annually, there may be changes in the value of our properties that are not fully reflected in the most recent estimated per share NAV. As a result, the published estimated per share NAV may not fully reflect changes in value that may have occurred since the prior valuation. Furthermore, our advisor will monitor our portfolio, but it may be difficult to reflect changing market conditions or material events that may impact the value of our portfolio between valuations, or to obtain timely or complete information regarding any such events. Therefore, the estimated per share NAV published before the announcement of an extraordinary event may differ significantly from our actual per share NAV until such time as sufficient information is available and analyzed, the financial impact is fully evaluated, and the appropriate adjustment is made to our estimated per share NAV, as determined by our board of directors. Any resulting disparity may be to the detriment of a purchaser of our shares or a stockholder selling shares pursuant to our share repurchase program.
The following risk factor supersedes and replaces in its entirety the eighth risk factor contained in the "Risk Factors—Risks Related to an Investment in Carter Validus Mission Critical REIT II, Inc." section beginning on page 37 of the prospectus:
Distributions paid from sources other than our cash flows from operations, including from the proceeds of this Offering, will result in us having fewer funds available for the acquisition of properties and other real estate-related investments, which may adversely affect our ability to fund future distributions with cash flow from operations and may adversely affect your overall return.
We have paid, and may continue to pay, distributions from sources other than from our cash flows from operations. For the nine months ended September 30, 2016, our cash flows provided by operations of approximately $15.5 million was a shortfall of approximately $13.1 million, or 45.8%, of our distributions (total distributions were approximately $28.6 million, of which $12.3 million was cash and $16.3 million was reinvested in shares of our common stock pursuant to our DRIP) during such period and such shortfall was paid from proceeds from our DRIP Offering. For the year ended December 31, 2015, our cash flows provided by operations of approximately $3.3 million was a shortfall of approximately $12.7 million, or 79.5%, of our distributions (total distributions were approximately $16.0 million, of which $6.4 million was cash and $9.6 million was reinvested in shares of our common stock pursuant to our DRIP) during such period and such shortfall was paid from proceeds from our Offering. Until we acquire additional properties or other real estate-related investments, we may not generate sufficient cash flows from operations to pay distributions. Our inability to acquire additional properties or other real estate-related investments may result in a lower return on your investment than you expect.
We may pay, and have no limits on the amounts we may pay, distributions from any source, such as from borrowings, the sale of assets, the sale of additional securities, advances from our Advisor, our Advisor’s deferral, suspension and/or waiver of its fees and expense reimbursements and Offering proceeds. Funding distributions from borrowings could restrict the amount we can borrow for investments, which may affect our profitability. Funding distributions with the sale of assets may affect our ability to generate cash flows. Funding distributions from the sale of additional securities could dilute your interest in us if we sell shares of our common stock to third party investors. Funding distributions from the proceeds of our Offering will result in us having less funds available for acquiring properties or real estate-related investments. Our inability to acquire additional properties or real estate-related investments may have a negative effect on our ability to generate sufficient cash flow from operations from which to pay distributions. As a result, the return investors may realize on their investment may be reduced and investors who invest in us before we generate significant cash flow may realize a lower rate of return than later investors. Payment of distributions from any of the aforementioned sources could restrict our ability to generate sufficient cash flow from operations, affect our profitability and/or affect the distributions payable upon a liquidity event, any or all of which may have an adverse effect on an investment in us.
The following risk factor supersedes and replaces in its entirety the tenth risk factor contained in the "Risk Factors—Risks Related to an Investment in Carter Validus Mission Critical REIT II, Inc." section on page 38 of the prospectus:
A high concentration of our properties in a particular geographic area, or of tenants in a similar industry, would magnify the effects of downturns in that geographic area or industry.
As of September 30, 2016, we owned 30 real estate investments, located in 24 metropolitan statistical areas, or MSAs, and one micropolitan statistical area, of which three MSAs accounted for 10.0% or more of our contractual rental revenue. Real estate investments located in the Oklahoma City, Oklahoma MSA, the Houston-The Woodlands-Sugar Land, Texas MSA, and the Dallas-Fort Worth-Arlington, Texas MSA accounted for 15.9%, 14.5%, and 11.9%, respectively, of our contractual rental revenue for the nine months ended September 30, 2016. In the event that we have a concentration of properties in any particular geographic area, any adverse situation that disproportionately effects that geographic area would have a magnified adverse effect on our portfolio. Similarly, if tenants of our properties become concentrated in a certain industry or industries, any adverse effect to that industry generally would have a disproportionately adverse effect on our portfolio.
22
As of September 30, 2016, the Company had two exposures to tenant concentration that accounted for 10.0% or more of contractual rental revenue. The leases with tenants under common control of the guarantor Post Acute Medical, LLC and the leases with Healthcare Partners Investments, LLC accounted for 12.6% and 11.4%, respectively, of contractual rental revenue for the nine months ended September 30, 2016.
The following risk factor supersedes and replaces in its entirety the fifth risk factor contained in the "Risk Factors—Risks Associated with Debt Financing and Investments" section on page 62 of the prospectus:
Increases in interest rates could increase the amount of our debt payments and adversely affect our ability to pay distributions to our stockholders.
As of September 30, 2016, we had $25.0 million of fixed interest rate principal outstanding fixed through interest rate swap and $110.0 million of variable rate principal outstanding. As of September 30, 2016, our weighted average interest rate was 2.59%. Increases in interest rates would increase our interest costs, if we obtain additional variable rate debt, which could reduce our cash flows and our ability to pay distributions to you. In addition, if we need to repay existing debt during periods of rising interest rates, we could be required to liquidate one or more of our investments in properties at times that may not permit realization of the maximum return on such investments.
Plan of Distribution
The following information supersedes and replaces the section entitled “Plan of Distribution - Special Discounts - Friends and Family” on page 209 of the prospectus:
Friends and Family
Our executive officers and managers and their immediate family members, as well as officers and persons associated with our advisor and its members and their affiliates and their immediate family members (including spouses, parents, grandparents, children and siblings) and other individuals designated by our management, and, if approved by our board of directors, joint venture partners, consultants and other service providers, may purchase Class A shares in this Offering at a discount. The purchase price for such shares will be $9.373 per share, reflecting the fact that selling commissions in the amount of $0.705 per share will be waived and not payable in connection with such shares. There is no limit on the number of Class A shares that may be sold to such persons.
Indemnification Agreements
On September 30, 2016, we entered into an indemnification agreement with each of our current directors and executive officers, each referred to herein as an Indemnitee. Each indemnification agreement obligates us to indemnify the respective Indemnitee to the maximum extent permitted by Maryland law against all judgments, penalties, fines and amounts paid in settlement and all expenses actually and reasonably incurred by the Indemnitee or on his or her respective behalf in connection with a proceeding. Each Indemnitee is not entitled to indemnification if it is established that one of the exceptions to indemnification under Maryland law, as set forth in each indemnification agreement, exists.
In addition, each indemnification agreement requires us to advance reasonable expenses incurred by or on behalf of the respective Indemnitee within ten days of our receipt of a statement from the Indemnitee requesting the advance. Each indemnification agreement also provides for procedures for the determination of entitlement to indemnification.
Renewal of Our Advisory Agreement
The following information supersedes and replaces in its entirety the first and second sentences of the first full paragraph on page 98 of the “Management—The Advisory Agreement” section of the prospectus:
On May 5, 2016, our board of directors, including our independent directors, after review of our advisor’s performance during the last year, authorized us to execute a mutual consent to renew the advisory agreement with our operating partnership and our advisor, dated June 10, 2014, as amended and renewed. The renewal is for a one-year term and became effective as of June 10, 2016.
Renewal of Our Management Agreement
The following information supersedes and replaces in its entirety the second and third sentences of the fifth full paragraph on page 100 of the “Management—Affiliated Companies—Property Manager” section of the prospectus:
On May 5, 2016, our board of directors, including our independent directors, after review of the property manager’s performance during the last year, authorized us to execute a mutual consent to renew the management agreement with the property manager and the operating partnership, dated May 19, 2014, as amended and renewed. The renewal is for a one-year
23
term and became effective as of May 19, 2016.
Updates to Our Management
On July 25, 2016, in accordance with our bylaws and charter, the remaining directors of our board of directors elected Robert M. Winslow as a director to fill a vacancy on the board of directors created by David Brightwell's resignation, to serve in accordance with our bylaws for the remainder of the full term of the directorship and until his successor is duly elected and qualifies or until his earlier resignation or removal in accordance with our organizational documents and applicable law.
The table on page 86 of the “Management — Executive Officers and Directors” section of the prospectus is hereby deleted in its entirety and replaced with the following:
| Name | Age | Position(s) | ||
| John E. Carter | 56 | Chairman of the Board and Chief Executive Officer | ||
| Robert M. Winslow | 67 | Director | ||
| Jonathan Kuchin | 65 | Independent Director | ||
| Randall Greene | 67 | Independent Director | ||
| Ronald Rayevich | 73 | Independent Director | ||
| Lisa A. Drummond | 52 | Chief Operating Officer and Secretary | ||
| Todd M. Sakow | 44 | Chief Financial Officer and Treasurer | ||
| Michael A. Seton | 44 | President | ||
The table on page 94 of the "Management — The Advisor" section of the prospectus is hereby deleted in its entirety and replaced with the following:
| Name | Age | Position(s) | ||
| John E. Carter | 56 | Co-Chief Executive Officer and Member of Investment Committee | ||
| Michael A. Seton | 44 | Co-Chief Executive Officer, President and Member of Investment Committee | ||
| Lisa A. Drummond | 52 | Chief Operating Officer and Secretary | ||
| Todd M. Sakow | 44 | Chief Financial Officer and Treasurer | ||
| Christof Hammerli | 43 | Chief Acquisitions Officer | ||
| Alex Stacy | 40 | Chief Acquisitions Officer, Healthcare | ||
| Robert M. Winslow | 67 | Executive Vice President of Construction, Development and Special Projects and Member of Investment Committee | ||
| Jimmy Yu, Sr. | 49 | Senior Vice President of Asset Management | ||
| Jamie Yoakum | 45 | Senior Vice President of Accounting | ||
| Mario Garcia, Jr. | 46 | Member of Investment Committee | ||
| Robert Peterson | 64 | Member of Investment Committee | ||
| Mark Levey | 54 | Member of Investment Committee | ||
The following biographical information of Mr. Winslow is hereby inserted in the “Management — Executive Officers and Directors” section of the prospectus beginning on page 86 and deleted from the “Management — The Advisor” section beginning on page 94 of the prospectus:
Robert M. Winslow has been a director since July 2016. Mr. Winslow has served as the Executive Vice President of Construction, Development and Special Projects since May 2015 and a member of the Investment Committee of Carter Validus Advisors II, LLC since January 2013. Mr. Winslow also served as the Executive Vice President of Asset Management of Carter Validus Advisors II, LLC from January 2013 to May 2015. He has also served as Executive Vice President of Construction, Development and Special Projects since May 2015 and a member of the Management Committee and Investment Committee of Carter/Validus Advisors, LLC since December 2009. Mr. Winslow also served as the Executive Vice President of Asset Management of Carter/Validus Advisors, LLC from December 2009 to May 2015. He has more than 35 years of real estate experience throughout the United States. Mr. Winslow has packaged and managed more than 50 commercial investments in hotels, offices, shopping centers and industrial properties with a value exceeding $300 million. He has served as President and Chief Executive Officer of Global Building and Consulting Corporation, a multi-service residential and commercial investment company specializing in performance-oriented management of real estate assets since 1996. From 1987 to 1989, Mr. Winslow structured a joint venture with Prentiss Properties to serve as the Florida Development Manager for proposed office projects for tenants including, among
24
others, AT&T and Loral Federal Systems. In July 1980, Mr. Winslow founded and served as managing General Partner of Global Properties, LTD through 1985. Global Properties, LTD was a full service real estate brokerage firm that grew to 120 sales associates, and was the first firm with whom Merrill Lynch Realty signed a Letter of Intent to purchase when it entered the Orlando market. Prior to founding Global Properties, LTD in 1980, Mr. Winslow served as Vice President of Winter Park Land Company, an old line private real estate holding company where he reversed two unprofitable divisions and created compatible new construction and real estate brokerage strategies. Mr. Winslow obtained a Bachelor of Arts from Rollins College in Business Administration/Economics in 1971 and an MBA in International Finance from the Roy E. Crummer Graduate School of Business at Rollins College in Winter Park, Florida in 1973.
The following information replaces in its entirety the first sentence immediately following the first table on page 94 of the “Management — The Advisor” section of the prospectus:
The backgrounds of John E. Carter, Michael A. Seton, Todd M. Sakow, Lisa A. Drummond and Robert M. Winslow are described in the “Management - Executive Officers and Directors” section of this prospectus.
The “Principal Stockholders” section on page 112 of the prospectus is hereby deleted in its entirety and replaced with the following:
PRINCIPAL STOCKHOLDERS
The following table provides, as of the date of this prospectus, information regarding the number and percentage of shares of our common stock beneficially owned by each director, each executive officer, all directors and executive officers as a group and any person known to us to be the beneficial owner of more than 5.0% of our outstanding shares. As of November 21, 2016, we had 18,340 stockholders of record and 67,890,000 and 10,759,000 shares of Class A and Class T common stock outstanding, respectively. Beneficial ownership includes outstanding shares and shares which are not outstanding, but that any person has the right to acquire within 60 days after the date of this prospectus. However, any such shares which are not outstanding are not deemed to be outstanding for the purpose of computing the percentage of outstanding shares beneficially owned by any other person. Except as otherwise provided, the person named in the table has sole voting and investing power with respect to all shares beneficially owned by it.
Beneficial Owner (1) | Number of Class A Shares Beneficially Owned | Percent of Class | |||
| Carter Validus REIT Management Company II, LLC | 20,000 | * | |||
| Directors | |||||
John E. Carter (2) | 20,000 | * | |||
Robert M. Winslow (3) | 20,000 | * | |||
| Jonathan Kuchin | 9,817 | * | |||
| Randall Greene | 9,876 | * | |||
| Ronald Rayevich | 9,000 | * | |||
| Executive Officers | |||||
Lisa A. Drummond (4) | 20,000 | * | |||
Todd M. Sakow (5) | 20,000 | * | |||
Michael A. Seton (6) | 20,000 | * | |||
| All executive officers and directors as a group (8 persons) | 48,693 | * | |||
| * | Represents less than 1.0% of the outstanding common stock. |
| (1) | The business address of the beneficial owner is 4890 W. Kennedy Blvd., Suite 650, Tampa, FL 33609. |
| (2) | Mr. Carter is the Co-Chief Executive Officer of Carter Validus REIT Management Company II, LLC, which directly owns 20,000 shares of Class A common stock in our company. Mr. Carter disclaims beneficial ownership of the shares held by Carter Validus REIT Management Company II, LLC, except to the extent of his pecuniary interest. |
| (3) | Mr. Winslow directly or indirectly controls Carter Validus REIT Management Company II, LLC, which directly owns 20,000 shares of Class A common stock in our company. Mr. Winslow disclaims beneficial ownership of the shares held by Carter Validus REIT Management Company II, LLC, except to the extent of his pecuniary interest. |
| (4) | Ms. Drummond is the Chief Operating Officer of Carter Validus REIT Management Company II, LLC, which directly owns 20,000 shares of Class A common stock in our company. Ms. Drummond disclaims beneficial ownership of the shares held by Carter Validus REIT Management Company II, LLC, except to the extent of her pecuniary interest. |
25
| (5) | Mr. Sakow is the Chief Financial Officer of Carter Validus REIT Management Company II, LLC, which directly owns 20,000 shares of Class A common stock in our company. Mr. Sakow disclaims beneficial ownership of the shares held by Carter Validus REIT Management Company II, LLC, except to the extent of his pecuniary interest. |
| (6) | Mr. Seton is the Co-Chief Executive Officer of Carter Validus REIT Management Company II, LLC, which directly owns 20,000 shares of Class A common stock in our company. Mr. Seton disclaims beneficial ownership of the shares held by Carter Validus REIT Management Company II, LLC except to the extent of his pecuniary interest. |
Compensation, Fees and Reimbursements Incurred to our Advisor and its Affiliates
The following data supplements, and should be read in conjunction with, the discussion contained in the “Management Compensation” section beginning on page 103 of the prospectus:
The following table summarizes the cumulative compensation, fees and reimbursements incurred by us, our advisor and its affiliates related to the offering stage during the period reflected below and amounts outstanding during the period reflected below (amounts are rounded):
| Incurred | Outstanding | |||||||
| As of September 30, 2016 | As of September 30, 2016 | |||||||
| Offering Stage: | ||||||||
Selling commissions (1) | $ | 43,034,000 | $ | 53,000 | ||||
Dealer manager fees (2) | 21,543,000 | 30,000 | ||||||
Distribution and servicing fees (3) | 4,462,000 | 4,226,000 | ||||||
Other organization and offering expenses (4) | 11,732,000 | 549,000 | ||||||
| $ | 80,771,000 | $ | 4,858,000 | |||||
| (1) | Our dealer manager re-allowed approximately $43,034,000 of the selling commissions incurred as of September 30, 2016. |
| (2) | Our dealer manager re-allowed approximately $6,615,000 of the dealer manager fees incurred as of September 30, 2016. |
| (3) | Our dealer manager re-allowed approximately $236,000 of the distribution and servicing fees incurred as of September 30, 2016. As of September 30, 2016, the Company accrued approximately $4,226,000 of distribution and servicing fees, which the Company may pay in future on the Class T shares issued in the Offering. |
| (4) | We reimbursed our advisor and its affiliates approximately $10,751,000 in other organization and offering costs as of September 30, 2016. |
The following table summarizes the cumulative compensation, fees and reimbursements incurred by us, our advisor and its affiliates related to the operational stage as of the period reflected below and amounts outstanding as of the period reflected below (amounts are rounded):
| Incurred | Outstanding | |||||||
| As of September 30, 2016 | As of September 30, 2016 | |||||||
| Acquisitions and Operations Stage: | ||||||||
| Acquisition fees and expenses | $ | 15,079,000 | $ | 3,000 | ||||
| Asset management fees | 5,207,000 | 443,000 | ||||||
| Property management and leasing fees and expenses | 1,511,000 | 140,000 | ||||||
| Construction management fees | 265,000 | 265,000 | ||||||
| Operating expenses | 2,053,000 | 134,000 | ||||||
| $ | 24,115,000 | $ | 985,000 | |||||
Selected Financial Data
The following information supplements, and should be read in conjunction with, the discussion contained in the “Selected Financial Data” section on page 146 of the prospectus:
The following selected financial data should be read in conjunction with “Management’s Discussion and Analysis of Financial Condition and Results of Operations” and our consolidated financial statements and the notes thereto for the period
26
ended September 30, 2016, which is included in this prospectus supplement.
The selected financial data presented below as of September 30, 2016 and for the nine months ended September 30, 2016, has been derived from our unaudited condensed consolidated financial statements. Amounts are rounded, in thousands, except share and per share amounts:
| Selected Financial Data | As of September 30, 2016 | |||
| Balance Sheet Data: | ||||
| Total real estate, net | $ | 631,360 | ||
| Cash and cash equivalents | $ | 49,090 | ||
| Acquired intangible assets, net | $ | 67,621 | ||
| Total assets | $ | 770,886 | ||
| Credit facility | $ | 134,706 | ||
| Total liabilities | $ | 160,452 | ||
| Total equity | $ | 610,434 | ||
| For the Nine Months Ended September 30, 2016 | ||||
| Operating Data: | ||||
| Total revenue | $ | 37,221 | ||
| Rental expenses | $ | 5,055 | ||
| Acquisition related expenses | $ | 5,432 | ||
| Depreciation and amortization | $ | 12,948 | ||
| Income from operations | $ | 8,188 | ||
| Net income attributable to common stockholders | $ | 5,951 | ||
Fund from operations attributable to common stockholders (1) | $ | 18,899 | ||
Modified funds from operations attributable to common stockholders (1) | $ | 19,563 | ||
| Per Share Data: | ||||
| Net income per common share attributable to common stockholders: | ||||
| Basic | $ | 0.09 | ||
| Diluted | $ | 0.09 | ||
| Distributions declared for common stock | $ | 29,849 | ||
| Distributions declared per common share | $ | 0.47 | ||
| Weighted average number of common shares: | ||||
| Basic | 63,044,148 | |||
| Diluted | 63,060,086 | |||
| Cash Flow Data: | ||||
| Net cash provided by operating activities | $ | 15,537 | ||
| Net cash used in investing activities | $ | (251,886 | ) | |
| Net cash provided by financing activities | $ | 254,177 | ||
| (1) | See “Management’s Discussion and Analysis of Financial Condition and Results of Operations – Funds From Operations and Modified Funds From Operations” for the nine months ended September 30, 2016, included in this prospectus, for information regarding why we present funds from operations and modified funds from operations and for a reconciliation of this non-GAAP financial measure to net income. |
Volume Discounts
The following information replaces in its entirety the first two paragraphs, the table and the paragraph following the table in “Plan of Distribution - Volume Discounts” section beginning on page 209 of the prospectus.
In connection with sales of $500,000 and over in Class A shares or Class T shares to a qualifying purchaser (as defined below), a participating broker-dealer may offer such qualifying purchaser a volume discount by reducing or eliminating the selling commissions, where applicable, and/or reducing dealer manager fees. Such reduction would be credited to the qualifying
27
purchaser by reducing the total purchase price payable by the qualifying purchaser for the shares purchased by the qualifying purchaser. The net proceeds to us from sales of shares eligible for a volume discount will be the same as from other sales of the shares. For subscriptions of Class T shares of $2,000,000 or more, our advisor has agreed to fund a portion of the discounted dealer manager fee. Accordingly, the effective purchase price for such purchasers will be reduced further.
The following table illustrates the various discount levels that will be offered to qualifying purchasers by participating broker-dealers for Class A shares purchased in the primary offering:
| Dollar Amount of Shares Purchased | Selling Commission Percentage | Dealer Manager Fee | Effective Purchase Price per Share to Investor(1) | |||
| $499,999 or less | 7.00% | 3.00% | $10.078 | |||
| $500,000 - $999,999 | 6.00% | 3.00% | $9.967 | |||
| $1,000,000 - $1,999,999 | 5.00% | 3.00% | $9.859 | |||
| $2,000,000 - $2,999,999 | 4.00% | 3.00% | $9.753 | |||
| $3,000,00 - $4,999,999 | 3.00% | 2.60% | $9.608 | |||
| $5,000,000 - $9,999,999 | 2.00% | 2.60% | $9.507 | |||
| $10,000,000 and above | 1.00% | 2.40% | $9.389 | |||
| (1) | Assumes a $10.078 per Class A share offering price. Discounts will be adjusted appropriately for changes in the offering price. |
The following table illustrates the various discount levels that will be offered to qualifying purchasers by participating broker-dealers for Class T shares purchased in the primary offering:
| Dollar Amount of Shares Purchased | Selling Commission Percentage | Dealer Manager Fee | Effective Purchase Price per Share to Investor(1) | |||
| $499,999 or less | 3.00% | 3.00% | $9.649 | |||
| $500,000 - $999,999 | 2.50% | 3.00% | $9.598 | |||
| $1,000,000 - $1,999,999 | 2.50% | 3.00% | $9.598 | |||
| $2,000,000 - $2,999,999 | 1.00% | 1.50% | (2) | $9.303 | ||
| $3,000,000 - $4,999,999 | 0.00% | 1.00% | (2) | $9.162 | ||
| $5,000,000 and above | 0.00% | 0.00% | (3) | $9.070 | ||
| (1) | Assumes a $9.649 per Class T share offering price. Discounts will be adjusted appropriately for changes in the offering price. We will also pay the dealer manager a distribution and servicing fee with respect to the Class T shares sold in the primary offering, which will accrue daily in an amount equal to 1/365th of 1.0% of the most recent offering price per Class T share on a continuous basis from year to year, subject to the termination of the distribution and servicing fee as described in the "Management Compensation" table beginning on page 103 of the prospectus; provided, however, that upon the termination of the primary offering, the distribution and servicing fee shall be an amount that accrues daily equal to 1/365th of up to 1.0% of the most recent NAV per Class T share on a continuous basis from year to year, subject to the termination of the distribution and servicing fee as described in the "Management Compensation" table beginning on page 103 of the prospectus. |
| (2) | In addition to the dealer manager fee payable by the Company to the dealer manager, our advisor will pay a 1.0% dealer manager fee to the dealer manager for purchases by an investor of $2,000,000 or more of Class T shares. |
| (3) | Our advisor will pay a 2.0% dealer manager fee to the dealer manager for purchases by an investor of $5,000,000 or more of Class T shares. |
We will apply the reduced per share purchase price, selling commission, if applicable, and dealer manager fee, set forth in the tables above to the entire purchase of shares, not just the portion of the purchase which exceeds the $499,999 share purchase threshold, provided the purchase of all such shares is made at one time. For example, a purchase of $3,000,000 in Class A shares, which would result in the issuance of 312,240 Class A shares, in a single transaction would result in a purchase price of $9.608 per share, selling commissions of $90,000 and dealer manager fees of $78,000. You may not combine amounts purchased for Class A shares with amounts purchased for Class T shares for purposes of obtaining a volume discount.
28
Investor Suitability Standards
The following information supersedes and replaces in its entirety the investor suitability standard for Kentucky located on page ii of the prospectus:
Kentucky. In addition to the general suitability standards listed above, no Kentucky resident can invest, in aggregate, more than 10% of their liquid net worth (cash, cash equivalents and readily marketable securities) in us or our affiliates’ non-publicly traded real estate investment trusts.
The following information supersedes and replaces in its entirety the investor suitability standard for Nebraska located on page ii of the prospectus:
Nebraska. In addition to the general suitability standards listed above, Nebraska investors must limit their aggregate investment in us and in the securities of other non-publicly traded real estate investment trusts to 10% of such investor’s net worth. Accredited investors in Nebraska, as defined in 17 C.F.R. § 230.501, are not subject to this limitation.
Management's Discussion and Analysis of Financial Condition and Results of Operations
The following discussion and analysis of our financial condition and results of operations should be read in conjunction with our condensed consolidated financial statements and the notes thereto, and the other unaudited financial information appearing elsewhere in this prospectus supplement.
The terms “we,” “our,” and the “Company” refer to Carter Validus Mission Critical REIT II, Inc., Carter Validus Operating Partnership II, LP, or our Operating Partnership, and all wholly-owned subsidiaries.
Overview
We were formed on January 11, 2013 under the laws of Maryland to acquire and operate a diversified portfolio of income-producing commercial real estate with a focus on data centers and healthcare properties, preferably with long-term net leases to investment grade and other creditworthy tenants, as well as to make other real estate-related investments that relate to such property types. We are offering shares of Class A common stock and shares of Class T common stock, in any combination, with a dollar value up to $2,350,000,000 in shares of common stock, consisting of up to $2,250,000,000 in the primary offering and $100,000,000 in shares of common stock pursuant to our distribution reinvestment plan, or the DRIP, on a "best efforts" basis, or the Offering. Through September 30, 2016, the initial offering price for the shares in our primary offering was $10.00 per Class A share and $9.574 per Class T share.
On September 29, 2016, our board of directors, at the recommendation of the audit committee, which is comprised solely of independent directors, unanimously approved and established an estimated per share net asset value, or NAV, of $9.07 of each of our Class A common stock and Class T common stock, or the Estimated Per Share NAV, as of June 30, 2016, for purposes of assisting broker-dealers participating in the Offering in meeting their customer account statement reporting obligations under National Association of Securities Dealers Conduct Rule 2340. In connection with the Estimated Per Share NAV, our board of directors unanimously approved the increased primary offering price of $10.078 per Class A share, which reflects the $9.07 Estimated Per Share NAV, a 7.0% selling commission and a 3.0% dealer manager fee, and the increased primary offering price of $9.649 per Class T share, which reflects the $9.07 Estimated Per Share NAV, a 3.0% selling commission and a 3.0% dealer manager fee, effective October 1, 2016. Further, the Board approved $9.574 as the per share purchase price of Class A shares pursuant to the DRIP and $9.167 as the per share purchase price of Class T shares pursuant to the DRIP, effective October 1, 2016. The Estimated Per Share NAV is not subject to audit by our independent registered public accounting firm. Going forward, we intend to publish an updated estimated NAV per share on at least an annual basis.
As of September 30, 2016, we had accepted investors’ subscriptions for and issued approximately 75,573,000 shares of Class A and Class T common stock (including shares of common stock issued pursuant to the DRIP) in our Offering, resulting in receipt of gross proceeds of approximately $746,094,000, before selling commissions and dealer manager fees of approximately $64,577,000, distribution and servicing fees of approximately $4,462,000 and other offering costs of approximately $14,383,000. As of September 30, 2016, we had approximately $1,603,906,000 in Class A shares and Class T shares of common stock remaining in our Offering. We will not pay distribution and servicing fees with respect to shares of Class A common stock or shares of Class T common stock issued pursuant to the DRIP.
Substantially all of our operations are conducted through Carter Validus Operating Partnership II, LP, or our Operating Partnership. We are externally advised by Carter Validus Advisors II, LLC, which is our affiliate, or our Advisor, pursuant to an advisory agreement between us and our Advisor. Our Advisor supervises and manages our day-to-day operations and selects the properties and real estate-related investments we acquire, subject to the oversight and approval of our board of directors. Our Advisor also provides marketing, sales and client services on our behalf. Our Advisor engages affiliated entities to provide various services to us. Our Advisor is managed by, and is a subsidiary of, our sponsor, Carter Validus REIT Management
29
Company II, LLC, or our Sponsor. We have no paid employees and we rely on our Advisor to provide substantially all of our services.
Carter Validus Real Estate Management Services II, LLC, or our Property Manager, a wholly-owned subsidiary of our Sponsor, serves as our property manager. Our Advisor and our Property Manager received, and will continue to receive, fees during the acquisition and operational stages and our Advisor may be eligible to receive fees during the liquidation stage of the Company. SC Distributors, LLC, an affiliate of the Advisor, or the Dealer Manager, serves as the dealer manager of the Offering. The Dealer Manager has received, and will continue to receive, fees for services related to our Offering.
We currently operate through two reportable segments – commercial real estate investments in data centers and healthcare. As of September 30, 2016, we had purchased 30 real estate investments, consisting of 43 properties, comprising approximately 2,299,000 of gross rentable square feet for an aggregate purchase price of approximately $704,364,000.
Critical Accounting Policies
Our critical accounting policies were disclosed in our 2015 Annual Report on Form 10-K. There have been no material changes to our critical accounting policies as disclosed therein.
Interim Unaudited Financial Data
Our accompanying condensed consolidated financial statements have been prepared by us in accordance with GAAP in conjunction with the rules and regulations of the SEC. Certain information and footnote disclosures required for annual financial statements have been condensed or excluded pursuant to SEC rules and regulations. Accordingly, our accompanying condensed consolidated financial statements do not include all of the information and footnotes required by GAAP for complete financial statements. Our accompanying condensed consolidated financial statements reflect all adjustments, which are, in our view, of a normal recurring nature and necessary for a fair presentation of our financial position, results of operations and cash flows for the interim period. Interim results of operations are not necessarily indicative of the results to be expected for the full year; such full year results may be less favorable. Our accompanying condensed consolidated financial statements should be read in conjunction with the audited consolidated financial statements and the notes thereto included in our 2015 Annual Report on Form 10-K.
Qualification as a REIT
We qualified and elected to be taxed as a REIT for federal income tax purposes and we intend to continue to be taxed as a REIT. To maintain our qualification as a REIT, we must continue to meet certain organizational and operational requirements, including a requirement to currently distribute at least 90.0% of our REIT taxable income to our stockholders. As a REIT, we generally will not be subject to federal income tax on taxable income that we distribute to our stockholders.
If we fail to maintain our qualification as a REIT in any taxable year, we would then be subject to federal income taxes on our taxable income at regular corporate rates and would not be permitted to qualify for treatment as a REIT for federal income tax purposes for four years following the year during which qualification is lost unless the Internal Revenue Service grants us relief under certain statutory provisions. Such an event could have a material adverse effect on our net income and net cash available for distribution to our stockholders.
Recently Issued Accounting Pronouncements
For a discussion of recently issued accounting pronouncements, see Note 2—“Summary of Significant Accounting Policies—Recently Issued Accounting Pronouncements” to our condensed consolidated financial statements that are a part of this prospectus supplement.
Segment Reporting
We report our financial performance based on two reporting segments—commercial real estate investments in data centers and healthcare. See Note 12—"Segment Reporting," to our condensed consolidated financial statements that are part of this prospectus supplement for additional information on our two reporting segments.
30
Results of Operations
Our results of operations are influenced by the timing of acquisitions and the operating performance of our real estate properties. The following table shows the property statistics of our real estate properties as of September 30, 2016 and 2015:
| September 30, | |||||
| 2016 | 2015 | ||||
| Number of commercial operating real estate properties | 41 | (1) | 21 | ||
| Leased rentable square feet | 2,298,000 | 1,207,000 | |||
| Weighted average percentage of rentable square feet leased | 99.9 | % | 100.0 | % | |
| (1) | As of September 30, 2016, we owned 43 real estate properties, two of which were under construction. |
The following table summarizes our real estate properties' activity for the three and nine months ended September 30, 2016 and 2015:
| Three Months Ended September 30, | Nine Months Ended September 30, | ||||||||||||||
| 2016 | 2015 | 2016 | 2015 | ||||||||||||
| Commercial operating real estate properties acquired | 1 | 8 | 13 | (1) | 15 | ||||||||||
| Approximate aggregate purchase price of acquired real estate properties | $ | 79,500,000 | $ | 133,331,000 | $ | 227,364,000 | (1) | $ | 257,138,000 | ||||||
| Leased rentable square feet | 288,000 | 503,000 | 769,000 | 885,000 | |||||||||||
| (1) | During the nine months ended September 30, 2016, we acquired 15 real estate properties, two of which were under construction. The properties under construction were purchased for $13,601,000. |
The following discussion is based on our condensed consolidated financial statements for the three and nine months ended September 30, 2016 and 2015.
This section describes and compares our results of operations for the three and nine months ended September 30, 2016 and 2015. We generate almost all of our net operating income from property operations. In order to evaluate our overall portfolio, management analyzes the net operating income of same store properties. We define "same store properties" as operating properties that were owned and operated for the entirety of both calendar periods being compared and exclude properties under development.
By evaluating the property net operating income of our same store properties, management is able to monitor the operations of our existing properties for comparable periods to measure the performance of our current portfolio and determine the effects of our new acquisitions on net income (loss).
We are not aware of any material trends and uncertainties, other than national economic conditions affecting real estate generally, that may be reasonably expected to have a material impact, favorable or unfavorable, on revenues or incomes from the acquisition, management and operation of properties other than those set forth in our Annual Report on Form 10-K for the year ended December 31, 2015 and in Part II, Item 1A. "Risk Factors" of the Quarterly Report on Form 10-Q for the nine months ended September 30, 2016 filed on November 14, 2016.
Three Months Ended September 30, 2016 Compared to the Three Months Ended September 30, 2015
Changes in our revenues are summarized in the following table (amounts in thousands):
| Three Months Ended September 30, | |||||||||||
| 2016 | 2015 | Change | |||||||||
| Same store rental revenue | $ | 4,489 | $ | 4,489 | $ | — | |||||
| Non-same store rental revenue | 7,693 | 1,740 | 5,953 | ||||||||
| Same store tenant reimbursement revenue | 586 | 496 | 90 | ||||||||
| Non-same store tenant reimbursement revenue | 825 | 158 | 667 | ||||||||
| Other operating income | 1 | 1 | — | ||||||||
| Total revenue | $ | 13,594 | $ | 6,884 | $ | 6,710 | |||||
31
| • | Same store rental revenue was unchanged. Adjustments to straight-line rental revenue offset the increase in contractual rental revenue resulting from average annual rent escalations of 1.94% at our same store properties. |
| • | Non-same store rental revenue increased $6.0 million due to the acquisition of 28 operating properties since July 1, 2015. |
| • | Non-same store tenant reimbursement revenue increased $0.7 million due to the acquisition of 28 operating properties since July 1, 2015. |
Changes in our expenses are summarized in the following table (amounts in thousands):
| Three Months Ended September 30, | |||||||||||
| 2016 | 2015 | Change | |||||||||
| Same store rental expenses | $ | 717 | $ | 621 | $ | 96 | |||||
| Non-same store rental expenses | 1,077 | 206 | 871 | ||||||||
| General and administrative expenses | 836 | 439 | 397 | ||||||||
| Acquisition related expenses | 1,821 | 3,760 | (1,939 | ) | |||||||
| Asset management fees | 1,227 | 639 | 588 | ||||||||
| Depreciation and amortization | 4,782 | 2,438 | 2,344 | ||||||||
| Total expenses | $ | 10,460 | $ | 8,103 | $ | 2,357 | |||||
| • | Non-same store rental expenses, certain of which are subject to reimbursement by our tenants, increased primarily due to the acquisition of 28 operating properties since July 1, 2015. |
| • | General and administrative expenses increased primarily due to an increase in professional and legal fees of $0.2 million, an increase in personnel costs of $0.1 million and an increase in other administrative costs of $0.1 million, in connection with our Company's growth. |
| • | Acquisition related expenses decreased due to a decrease in real estate properties determined to be business combinations. Acquisition fees and expenses associated with transactions determined to be business combinations are expensed as incurred. During the three months ended September 30, 2016, we acquired one real estate property for an aggregate purchase price of $79.5 million as compared to eight real estate properties for an aggregate purchase price of $133.3 million during the three months ended September 30, 2015. |
| • | Asset management fees increased due to an increase in the weighted average operating assets held to $516.2 million as of September 30, 2016, as compared to $138.6 million as of September 30, 2015. |
| • | Depreciation and amortization increased due to an increase in the weighted average depreciable basis of operating real estate investments to $450.8 million as of September 30, 2016, as compared to $121.8 million as of September 30, 2015. |
Changes in interest expense, net are summarized in the following table (amounts in thousands):
| Three Months Ended September 30, | |||||||||||
| 2016 | 2015 | Change | |||||||||
| Interest expense, net: | |||||||||||
| Interest on secured credit facility | $ | (590 | ) | $ | (378 | ) | $ | (212 | ) | ||
| Amortization of deferred financing costs | (256 | ) | (190 | ) | (66 | ) | |||||
| Cash deposits interest | 28 | 26 | 2 | ||||||||
| Capitalized interest | 192 | — | 192 | ||||||||
| Total interest expense, net | (626 | ) | (542 | ) | (84 | ) | |||||
| Net income (loss) attributable to common stockholders | $ | 2,508 | $ | (1,761 | ) | $ | 4,269 | ||||
| • | Interest on secured credit facility increased due to an increase in the average outstanding principal balance on the secured credit facility. The outstanding principal balance of the secured credit facility was $135.0 million as of September 30, 2016, and $70.0 million as of September 30, 2015. |
32
| • | Capitalized interest increased due to an increase in the average accumulated expenditures on development properties to $15.2 million for the three months ended September 30, 2016, as compared to having no development properties during the three months ended September 30, 2015. |
Nine Months Ended September 30, 2016 Compared to the Nine Months Ended September 30, 2015
Changes in our revenues are summarized in the following table (amounts in thousands):
| Nine Months Ended September 30, | |||||||||||
| 2016 | 2015 | Change | |||||||||
| Same store rental revenue | $ | 5,649 | $ | 5,647 | $ | 2 | |||||
| Non-same store rental revenue | 27,440 | 5,765 | 21,675 | ||||||||
| Same store tenant reimbursement revenue | 232 | 230 | 2 | ||||||||
| Non-same store tenant reimbursement revenue | 3,897 | 612 | 3,285 | ||||||||
| Other operating income | 3 | 7 | (4 | ) | |||||||
| Total revenue | $ | 37,221 | $ | 12,261 | $ | 24,960 | |||||
| • | An insignificant increase in same store rental revenue relates to the consumer price index base rent escalation at certain same store properties. In addition, adjustments to straight-line rental revenue were offset by the increase in contractual rental revenue resulting from average annual rent escalations of 2.17% at our same store properties. |
| • | Non-same store rental revenue increased $21.7 million due to the acquisition of 35 operating properties since January 1, 2015. |
| • | Non-same store tenant reimbursement revenue increased $3.3 million due to the acquisition of 35 operating properties since January 1, 2015. |
Changes in our expenses are summarized in the following table (amounts in thousands):
| Nine Months Ended September 30, | |||||||||||
| 2016 | 2015 | Change | |||||||||
| Same store rental expenses | $ | 351 | $ | 367 | $ | (16 | ) | ||||
| Non-same store rental expenses | 4,704 | 782 | 3,922 | ||||||||
| General and administrative expenses | 2,358 | 1,366 | 992 | ||||||||
| Acquisition related expenses | 5,432 | 7,287 | (1,855 | ) | |||||||
| Asset management fees | 3,240 | 1,133 | 2,107 | ||||||||
| Depreciation and amortization | 12,948 | 4,048 | 8,900 | ||||||||
| Total expenses | $ | 29,033 | $ | 14,983 | $ | 14,050 | |||||
| • | Non-same store rental expenses, certain of which are subject to reimbursement by our tenants, increased primarily due to the acquisition of 35 operating properties since January 1, 2015. |
| • | General and administrative expenses increased primarily due to an increase in professional and legal fees of $0.4 million, an increase in other administrative costs of $0.4 million and an increase in personnel costs of $0.2 million, in connection with our Company's growth. |
| • | Acquisition related expenses decreased due to a decrease in real estate properties determined to be business combinations. Acquisition fees and expenses associated with transactions determined to be business combinations are expensed as incurred. During the nine months ended September 30, 2016, we acquired 12 real estate properties for an aggregate purchase price of $207.4 million as compared to ten real estate properties for an aggregate purchase price of $249.4 million during the nine months ended September 30, 2015. |
| • | Asset management fees increased due to an increase in the weighted average assets held to $516.2 million as of September 30, 2016, as compared to $138.6 million as of September 30, 2015. |
| • | Depreciation and amortization increased due to an increase in the weighted average depreciable basis of real estate |
33
investments to $450.8 million as of September 30, 2016, as compared to $121.8 million as of September 30, 2015.
Changes in interest expense, net are summarized in the following table (amounts in thousands):
| Nine Months Ended September 30, | |||||||||||
| 2016 | 2015 | Change | |||||||||
| Interest expense, net: | |||||||||||
| Interest on secured credit facility | $ | (1,907 | ) | $ | (765 | ) | $ | (1,142 | ) | ||
| Amortization of deferred financing costs | (703 | ) | (481 | ) | (222 | ) | |||||
| Cash deposits interest | 80 | 43 | 37 | ||||||||
| Capitalized interest | 293 | — | 293 | ||||||||
| Total interest expense, net | (2,237 | ) | (1,203 | ) | (1,034 | ) | |||||
| Net income (loss) attributable to common stockholders | $ | 5,951 | $ | (3,925 | ) | $ | 9,876 | ||||
| • | Interest on secured credit facility increased due to an increase in the average outstanding principal balance on the secured credit facility. The outstanding principal balance of the secured credit facility was $135.0 million as of September 30, 2016, and $70.0 million as of September 30, 2015. |
| • | Capitalized interest increased due to an increase in the average accumulated expenditures on development properties to $8.0 million for the nine months ended September 30, 2016, as compared to having no development properties during the nine months ended September 30, 2015. |
Organization and Offering Costs
We reimburse our Advisor or its affiliates for organization and offering costs it incurs on our behalf, but only to the extent the reimbursement would not cause the selling commissions, dealer manager fees, distribution and servicing fees and other organization and offering costs incurred by us to exceed 15% of gross offering proceeds as of the date of the reimbursement. We expect that other organization and offering costs (other than selling commissions, dealer manager fees and distribution and servicing fees) will be approximately 1.25% of the gross offering proceeds. Since inception, our Advisor and its affiliates incurred other organization and offering costs on our behalf of approximately $11,732,000 as of September 30, 2016. As of September 30, 2016, we reimbursed our Advisor or its affiliates approximately $10,751,000 in other offering costs, we paid our Advisor or its affiliates $432,000 in other offering costs related to subscription agreements and accrued approximately $549,000 of other offering costs. As of September 30, 2016, we incurred approximately $69,039,000 in selling commissions, dealer manager fees and distribution and servicing fees to our Dealer Manager. As of September 30, 2016, we incurred other offering costs (other than selling commissions, dealer manager fees and distribution and servicing fees) of approximately $14,383,000.
When incurred, organization costs are expensed and offering costs, including selling commissions, dealer manager fees, distribution and servicing fees and other offering costs are charged to stockholders’ equity. For a further discussion of other organization and offering costs, see Note 11—"Related-Party Transactions and Arrangements" to the condensed consolidated financial statements that are a part of this prospectus supplement.
Inflation
We are exposed to inflation risk as income from long-term leases is the primary source of our cash flows from operations. There are provisions in certain of our leases, with tenants, that are intended to protect us from, and mitigate the risk of, the impact of inflation. These provisions include scheduled increases in contractual base rent receipts, reimbursement billings for operating expenses, pass-through charges and real estate tax and insurance reimbursements. However, due to the long-term nature of our leases, among other factors, the leases may not reset frequently enough to adequately offset the effects of inflation.
Liquidity and Capital Resources
Our principal demands for funds are for acquisitions of real estate and real estate-related investments, to pay operating expenses and interest on our current and future indebtedness and to pay distributions to our stockholders. Our sources of funds are primarily the net proceeds of our Offering, funds equal to amounts reinvested in the DRIP, operating cash flows, the secured credit facility and other borrowings. In addition, we require resources to make certain payments to our Advisor and our Dealer Manager, which, during our Offering, include payments to our Advisor and its affiliates for reimbursement of other organization and offering expenses and other costs incurred on our behalf, and payments to our Dealer Manager and its affiliates for selling commissions, dealer manager fees, distribution and servicing fees, and offering expenses.
34
Generally, cash needs for items other than acquisitions of real estate and real estate-related investments are met from operations, borrowings, and the net proceeds of our Offering. However, there may be a delay between the sale of shares of our common stock and our investments in real estate, which could result in a delay in the benefits to our stockholders, if any, of returns generated from our investment operations.
Our Advisor evaluates potential additional investments and engages in negotiations with real estate sellers, developers, brokers, investment managers, lenders and others on our behalf. Until we invest all of the proceeds of our Offering in properties and real estate-related investments, we may invest in short-term, highly liquid or other authorized investments. Such short-term investments will not earn significant returns, and we cannot predict how long it will take to fully invest the proceeds in properties and real estate-related investments. The number of properties we acquire and other investments we make will depend upon the number of shares sold in our Offering and the resulting amount of net proceeds available for investment.
When we acquire a property, our Advisor prepares a capital plan that contemplates the estimated capital needs of that investment. In addition to operating expenses, capital needs may also include costs of refurbishment, tenant improvements or other major capital expenditures. The capital plan also sets forth the anticipated sources of the necessary capital, which may include a line of credit or other loans established with respect to the investment, operating cash generated by the investment, additional equity investments from us or joint venture partners or, when necessary, capital reserves. Any capital reserves would be established from the net proceeds of our Offering, proceeds from sales of other investments, operating cash generated by other investments or other cash on hand. In some cases, a lender may require us to establish capital reserves for a particular investment. The capital plan for each investment will be adjusted through ongoing, regular reviews of our portfolio or as necessary to respond to unanticipated additional capital needs.
Short-term Liquidity and Capital Resources
On a short-term basis, our principal demands for funds will be for the acquisition of real estate and real estate-related notes and investments and payments of tenant improvements, acquisition related costs, operating expenses, distributions, and interest and principal payments on current and future debt financings. We expect to meet our short-term liquidity requirements through net cash flows provided by operations, net proceeds from our Offering, borrowings on the secured credit facility, as well as secured and unsecured borrowings from banks and other lenders to finance our expected future acquisitions.
Long-term Liquidity and Capital Resources
On a long-term basis, our principal demands for funds will be for the acquisition of real estate and real estate-related investments and payments of tenant improvements, acquisition related costs, operating expenses, distributions and repurchases to stockholders, and interest and principal payments on current and future indebtedness. We expect to meet our long-term liquidity requirements through proceeds from cash flow from operations, borrowings on the secured credit facility, proceeds from secured or unsecured borrowings from banks or other lenders, proceeds from our Offering and funds equal to amounts reinvested in the DRIP.
We expect that substantially all cash flows from operations will be used to pay distributions to our stockholders after certain capital expenditures; however, we have used, and may continue to use other sources to fund distributions, as necessary, such as proceeds from our Offering, borrowings on the secured credit facility and/or future borrowings on unencumbered assets. To the extent cash flows from operations are lower due to fewer properties being acquired or lower-than-expected returns on the properties held, distributions paid to stockholders may be lower. We expect that substantially all net cash flows from our Offering or debt financings will be used to fund acquisitions, certain capital expenditures identified at acquisition, repayments of outstanding debt or distributions to our stockholders in excess of cash flows from operations.
Capital Expenditures
We estimate that we will require approximately $41.0 million in expenditures for capital improvements over the next 12 months. We cannot provide assurances, however, that actual expenditures will not exceed these estimated expenditure levels. As of September 30, 2016, we had $4.4 million of restricted cash in escrow reserve accounts for such capital expenditures. In addition, as of September 30, 2016, we had approximately $49.1 million in cash and cash equivalents. For the nine months ended September 30, 2016, we had capital expenditures of $4.4 million that primarily related to three healthcare real estate investments.
Credit Facility
On September 30, 2016, the Operating Partnership and certain of our subsidiaries amended certain agreements related to the secured credit facility to increase the maximum commitments available under the secured credit facility from $265,000,000 to an aggregate of up to $315,000,000, consisting of a $265,000,000 revolving line of credit, with a maturity date of December 22, 2018, subject to our Operating Partnership's right to two, 12-month extension periods, and a $50,000,000 term loan, with a maturity date of December 22, 2019, subject to our Operating Partnership's right to one, 12-month extension. The proceeds of loans made under the secured credit facility may be used to finance the acquisition of real estate investments, for tenant
35
improvements and leasing commissions with respect to real estate, for repayment of indebtedness, for capital expenditures with respect to real estate and for general corporate and working capital purposes. The secured credit facility can be increased to $550,000,000, subject to certain conditions. See Note 8—"Credit Facility" to the condensed consolidated financial statements that are part of this prospectus supplement.
As of September 30, 2016, we had a total pool availability under the secured credit facility of $252,479,000 and an aggregate outstanding principal balance of $135,000,000. As of September 30, 2016, $117,479,000 remained available to be drawn on the secured credit facility.
Cash Flows
| Nine Months Ended September 30, | ||||||||||||
| (in thousands) | 2016 | 2015 | Change | |||||||||
| Net cash provided by operating activities | $ | 15,537 | $ | 900 | $ | 14,637 | ||||||
| Net cash used in investing activities | $ | (251,886 | ) | $ | (257,581 | ) | $ | 5,695 | ||||
| Net cash provided by financing activities | $ | 254,177 | $ | 303,342 | $ | (49,165 | ) | |||||
Operating Activities
| • | Net cash provided by operating activities increased due to annual rental increases at our same store properties and the acquisition of our new operating properties, partially offset by increased operating expenses. |
Investing Activities
| • | Net cash used in investing activities decreased primarily due to a decrease in investments in real estate of $17.4 million, offset by an increase in real estate deposits, net, of $5.0 million, an increase in escrow funds, net, of $3.0 million, and an increase in capital expenditures of $3.7 million. |
Financing Activities
| • | Net cash provided by financing activities decreased primarily due to a decrease in proceeds from the issuance of common stock of $63.7 million, an increase in payments on the secured credit facility of $30.5 million, an increase in distributions to our stockholders of $8.5 million, an increase in repurchases of our common stock of $1.9 million and an increase in payments of deferred financing costs of $0.2 million, offset by an increase in proceeds from the secured credit facility of $43.0 million and a decrease in offering costs related to the issuance of common stock of $12.6 million. |
Distributions
The amount of distributions payable to our stockholders is determined by our board of directors and is dependent on a number of factors, including our funds available for distribution, financial condition, capital expenditure requirements and the annual distribution requirements needed to maintain our status as a REIT under the Code. Our board of directors must authorize each distribution and may, in the future, authorize lower amounts of distributions or not authorize additional distributions and, therefore, distribution payments are not guaranteed. Our Advisor may also defer, suspend and/or waive fees and expense reimbursements if we have not generated sufficient cash flow from our operations and other sources to fund distributions. Additionally, our organizational documents permit us to pay distributions from unlimited amounts of any source, and we may use sources other than operating cash flows to fund distributions, including proceeds from our Offering, which may reduce the amount of capital we ultimately invest in properties or other permitted investments.
36
We have funded distributions with operating cash flows from our properties, proceeds raised in our Offering and reinvestments pursuant to the DRIP. To the extent that we do not have taxable income, distributions paid will be considered a return of capital to stockholders. The following table shows distributions paid during the nine months ended September 30, 2016 and 2015 (amounts in thousands):
| Nine Months Ended September 30, | |||||||||||
| 2016 | 2015 | ||||||||||
| Distributions paid in cash - common stockholders | $ | 12,285 | $ | 3,759 | |||||||
| Distributions reinvested (shares issued) | 16,285 | 5,795 | |||||||||
| Total distributions | $ | 28,570 | $ | 9,554 | |||||||
| Source of distributions: | |||||||||||
Cash flows provided by operations (1) | $ | 12,285 | 43% | $ | 900 | 9% | |||||
Offering proceeds from issuance of common stock (1) | — | —% | 2,859 | 30% | |||||||
Offering proceeds from issuance of common stock pursuant to the DRIP (1) | 16,285 | 57% | 5,795 | 61% | |||||||
| Total sources | $ | 28,570 | 100% | $ | 9,554 | 100% | |||||
| (1) | Percentages were calculated by dividing the respective source amount by the total sources of distributions. |
Total distributions declared but not paid on Class A shares and Class T shares as of September 30, 2016 were approximately $3,826,000 for common stockholders. These distributions were paid on October 3, 2016.
For the nine months ended September 30, 2016, we declared and paid distributions of approximately $28,570,000 to Class A stockholders and Class T stockholders, including shares issued pursuant to the DRIP, as compared to FFO (as defined below) for the nine months ended September 30, 2016 of approximately $18,899,000. The payment of distributions from sources other than FFO may reduce the amount of proceeds available for investment and operations or cause us to incur additional interest expense as a result of borrowed funds.
For a discussion of distributions paid subsequent to September 30, 2016, see Note 17—"Subsequent Events" to the condensed consolidated financial statements included in this prospectus supplement.
Contractual Obligations
Our contractual obligations as of September 30, 2016 were as follows (amounts in thousands):
| Less than 1 Year | 1-3 Years | 3-5 Years | More than 5 Years | Total | |||||||||||||||
Principal payments—variable rate debt fixed through interest rate swap (1) | $ | — | $ | — | $ | 25,000 | $ | — | $ | 25,000 | |||||||||
Interest payments—variable rate debt fixed through interest rate swap (2) | 666 | 1,513 | 182 | — | 2,361 | ||||||||||||||
| Principal payments—variable rate debt | — | 85,000 | 25,000 | — | 110,000 | ||||||||||||||
| Interest payments—variable rate debt | 2,546 | 4,176 | 158 | — | 6,880 | ||||||||||||||
| Capital expenditures | 41,002 | 8,234 | — | — | 49,236 | ||||||||||||||
| Total | $ | 44,214 | $ | 98,923 | $ | 50,340 | $ | — | $ | 193,477 | |||||||||
| (1) | As of September 30, 2016, we had $25.0 million outstanding principal under the secured credit facility that was fixed through the use of an interest rate swap agreement. |
| (2) | We used the fixed rate under our interest rate swap agreement as of September 30, 2016 to calculate the debt payment obligations in future periods. |
Off-Balance Sheet Arrangements
As of September 30, 2016, we had no off-balance sheet arrangements.
37
Related-Party Transactions and Arrangements
We have entered into agreements with our Advisor and its affiliates, whereby we agree to pay certain fees to, or reimburse certain expenses of, our Advisor or its affiliates for acquisition fees and expenses, organization and offering expenses, asset and property management fees and reimbursement of operating costs. Refer to Note 11—"Related-Party Transactions and Arrangements" to our condensed consolidated financial statements that are a part of this prospectus supplement for a detailed discussion of the various related-party transactions and agreements. On October 17, 2016, we entered into the fourth amendment to the dealer manager agreement with our Advisor and Dealer Manager to, among other things, obligate our Advisor to pay certain amounts to our Dealer Manager in connection with volume discount purchases. More specifically, with respect to sales of Class T shares of $2,000,000 or above to a qualifying purchaser (as defined in our prospectus), our Advisor will pay our Dealer Manager an amount equal to 1.0% of the gross offering proceeds of each purchase, in addition to the applicable dealer manager fee payable by us to our Dealer Manager. Further, with respect to sales of Class T shares of $5,000,000 or above to a qualifying purchaser (as defined in our prospectus), our Advisor will pay our Dealer Manager an additional amount equal to 1.0% of the gross offering proceeds of each purchase.
Funds from Operations and Modified Funds from Operations
One of our objectives is to provide cash distributions to our stockholders from cash generated by our operations. The purchase of real estate assets and real estate-related investments, and the corresponding expenses associated with that process, is a key operational feature of our business plan in order to generate cash from operations. Due to certain unique operating characteristics of real estate companies, the National Association of Real Estate Investment Trusts, or NAREIT, an industry trade group, has promulgated a measure known as funds from operations, or FFO, which we believe is an appropriate supplemental measure to reflect the operating performance of a REIT. The use of FFO is recommended by the REIT industry as a supplemental performance measure. FFO is not equivalent to our net income (loss) as determined under GAAP.
We define FFO, consistent with NAREIT’s definition, as net income (loss) (computed in accordance with GAAP), excluding gains (or losses) from sales of property and asset impairment write-downs, plus depreciation and amortization of real estate assets, and after adjustments for unconsolidated partnership and joint ventures. Adjustments for unconsolidated partnerships and joint ventures will be calculated to reflect FFO on the same basis.
We, along with others in the real estate industry, consider FFO to be an appropriate supplemental measure of a REIT’s operating performance because it is based on a net income (loss) analysis of property portfolio performance that excludes non-cash items such as depreciation and amortization and asset impairment write-downs, which we believe provides a more complete understanding of our performance to investors and to our management, and when compared year over year, reflects the impact on our operations from trends in occupancy.
Historical accounting convention (in accordance with GAAP) for real estate assets requires companies to report its investment in real estate at its carrying value, which consists of capitalizing the cost of acquisitions, development, construction, improvements and significant replacements, less depreciation and amortization and asset impairment write-downs, if any, which is not necessarily equivalent to the fair market value of its investment in real estate assets.
The historical accounting convention requires straight-line depreciation of buildings and improvements, which implies that the value of real estate assets diminishes predictably over time, which could be the case if such assets are not adequately maintained or repaired and renovated as required by relevant circumstances and/or as requested or required by lessees for operational purposes in order to maintain the value disclosed. We believe that, since the fair value of real estate assets historically rises and falls with market conditions including, but not limited to, inflation, interest rates, the business cycle, unemployment and consumer spending, presentations of operating results for a REIT using historical accounting for depreciation could be less informative.
In addition, we believe it is appropriate to disregard asset impairment write-downs as they are a non-cash adjustment to recognize losses on prospective sales of real estate assets. Since losses from sales of real estate assets are excluded from FFO, we believe it is appropriate that asset impairment write-downs in advancement of realization of losses should be excluded. Impairment write-downs are based on negative market fluctuations and underlying assessments of general market conditions, which are independent of our operating performance, including, but not limited to, a significant adverse change in the financial condition of our tenants, changes in supply and demand for similar or competing properties, changes in tax, real estate, environmental and zoning law, which can change over time. When indicators of potential impairment suggest that the carrying value of real estate and related assets may not be recoverable, we assess the recoverability by estimating whether we will recover the carrying value of the asset through undiscounted future cash flows and eventual disposition (including, but not limited to, net rental and lease revenues, net proceeds on the sale of property and any other ancillary cash flows at a property or group level under GAAP). If based on this analysis, we do not believe that we will be able to recover the carrying value of the real estate asset, we will record an impairment write-down to the extent that the carrying value exceeds the estimated fair value of the real estate asset. Testing for indicators of impairment is a continuous process and is analyzed on a quarterly basis.
38
Investors should note, however, that determinations of whether impairment charges have been incurred are based partly on anticipated operating performance, because estimated undiscounted future cash flows from a property, including estimated future net rental and lease revenues, net proceeds on the sale of the property, and certain other ancillary cash flows, are taken into account in determining whether an impairment charge has been incurred. While impairment charges are excluded from the calculation of FFO as described above, investors are cautioned that due to the fact that impairments are based on estimated future undiscounted cash flows and that we intend to have a relatively limited term of our operations, it could be difficult to recover any impairment charges through the eventual sale of the property. No impairment losses have been recorded to date.
In developing estimates of expected future cash flow, we make certain assumptions regarding future market rental income amounts subsequent to the expiration of current lease arrangements, property operating expenses, terminal capitalization and discount rates, the expected number of months it takes to re-lease the property, required tenant improvements and the number of years the property will be held for investment. The use of alternative assumptions in the future cash flow analysis could result in a different determination of the property’s future cash flows and a different conclusion regarding the existence of an asset impairment, the extent of such loss, if any, as well as the carrying value of the real estate asset.
Publicly registered, non-listed REITs, such as us, typically have a significant amount of acquisition activity and are substantially more dynamic during their initial years of investment and operations. While other start up entities may also experience significant acquisition activity during their initial years, we believe that publicly registered, non-listed REITs are unique in that they have a limited life with targeted exit strategies within a relatively limited time frame after the acquisition activity ceases. We will use the proceeds raised in our offering to acquire real estate assets and real estate-related investments, and we intend to begin the process of achieving a liquidity event (i.e., listing of our shares of common stock on a national securities exchange, a merger or sale, the sale of all or substantially all of our assets, or another similar transaction) within five to seven years after the completion of our offering stage, which is generally comparable to other publicly registered, non-listed REITs. Thus, we do not intend to continuously purchase real estate assets and intend to have a limited life. Due to these factors and other unique features of publicly registered, non-listed REITS, the Investment Program Association, or the IPA, an industry trade group, has standardized a measure known as modified funds from operations, or MFFO, which we believe to be another appropriate supplemental measure to reflect the operating performance of a publicly registered, non-listed REIT. MFFO is a metric used by management to evaluate sustainable performance and dividend policy. MFFO is not equivalent to our net income (loss) as determined under GAAP.
We define MFFO, a non-GAAP measure, consistent with the IPA’s definition: FFO further adjusted for the following items included in the determination of GAAP net income (loss); acquisition fees and expenses; amounts related to straight-line rental income and amortization of above and below intangible lease assets and liabilities; accretion of discounts and amortization of premiums on debt investments; mark-to-market adjustments included in net income (loss); nonrecurring gains or losses included in net income (loss) from the extinguishment or sale of debt, hedges, foreign exchange, derivatives or securities holdings where trading of such holdings is not a fundamental attribute of the business plan, unrealized gains or losses resulting from consolidation from, or deconsolidation to, equity accounting, adjustments related to contingent purchase price obligations where such adjustments have been included in the derivation of GAAP net income (loss), and after adjustments for a consolidated and unconsolidated partnership and joint ventures, with such adjustments calculated to reflect MFFO on the same basis. Our MFFO calculation complies with the IPA’s Practice Guideline, described above. In calculating MFFO, we exclude paid and accrued acquisition fees and expenses that are reported in our condensed consolidated statements of comprehensive income (loss), amortization of above and below-market leases, amounts related to straight-line rents (which are adjusted in order to reflect such payments from a GAAP accrual basis to closer to an expected to be received cash basis of disclosing the rent and lease payments) and ineffectiveness of interest rate swap. The other adjustments included in the IPA’s guidelines are not applicable to us.
Since MFFO excludes acquisition fees and expenses, it should not be construed as a historic performance measure. Acquisition fees and expenses are paid in cash by us, and we have not set aside or put into escrow any specific amount of proceeds from our offerings to be used to fund acquisition fees and expenses. Acquisition fees and expenses include payments to our Advisor or its affiliates and third parties. Such fees and expenses will not be reimbursed by our Advisor or its affiliates and third parties, and therefore if there are no further proceeds from the sale of shares of our common stock to fund future acquisition fees and expenses, such fees and expenses will need to be paid from either additional debt, operational earnings or cash flows, net proceeds from the sale of properties, or from ancillary cash flows. As a result, the amount of proceeds available for investment and operations would be reduced, or we may incur additional interest expense as a result of borrowed funds. Nevertheless, our Advisor or its affiliates will not accrue any claim on our assets if acquisition fees and expenses are not paid from the proceeds of our offerings. Under GAAP, acquisition fees and expenses related to the acquisition of properties determined to be business combinations are expensed as incurred, including investment transactions that are no longer under consideration, and are included in acquisition related expenses in the accompanying condensed consolidated statements of comprehensive income (loss) and acquisition fees and expenses associated with transactions determined to be an asset purchase are capitalized.
39
All paid and accrued acquisition fees and expenses have negative effects on returns to investors, the potential for future distributions, and cash flows generated by us, unless earnings from operations or net sales proceeds from the disposition of other properties are generated to cover the purchase price of the real estate asset, these fees and expenses and other costs related to such property. In addition, MFFO may not be an indicator of our operating performance, especially during periods in which properties are being acquired.
In addition, certain contemplated non-cash fair value and other non-cash adjustments are considered operating non-cash adjustments to net income (loss) in determining cash flows from operations in accordance with GAAP.
We use MFFO and the adjustments used to calculate it in order to evaluate our performance against other publicly registered, non-listed REITs, which intend to have limited lives with short and defined acquisition periods and targeted exit strategies shortly thereafter. As noted above, MFFO may not be a useful measure of the impact of long-term operating performance if we do not continue to operate in this manner. We believe that our use of MFFO and the adjustments used to calculate it allow us to present our performance in a manner that reflects certain characteristics that are unique to publicly registered, non-listed REITs, such as their limited life, limited and defined acquisition period and targeted exit strategy, and hence the use of such measures may be useful to investors. For example, acquisition fees and expenses are intended to be funded from the proceeds of our offering and other financing sources and not from operations. By excluding acquisition fees and expenses, the use of MFFO provides information consistent with management’s analysis of the operating performance of its real estate assets. Additionally, fair value adjustments, which are based on the impact of current market fluctuations and underlying assessments of general market conditions, but can also result from operational factors such as rental and occupancy rates, may not be directly related or attributable to our current operating performance. By excluding such charges that may reflect anticipated and unrealized gains or losses, we believe MFFO provides useful supplemental information.
Presentation of this information is intended to assist management and investors in comparing the operating performance of different REITs, although it should be noted that not all REITs calculate FFO and MFFO the same way, so comparisons with other REITs may not be meaningful. Furthermore, FFO and MFFO are not necessarily indicative of cash flow available to fund cash needs and should not be considered as an alternative to net income (loss) as an indication of our performance, as an indication of our liquidity, or indicative of funds available for our cash needs, including our ability to make distributions to our stockholders. FFO and MFFO should be reviewed in conjunction with other measurements as an indication of our performance. MFFO has limitations as a performance measure. However, it may be useful in assisting management and investors in assessing the sustainability of operating performance in future operating periods, and in particular, after the offering and acquisition stages are complete and net asset value is disclosed. MFFO is not a useful measure in evaluating net asset value since impairment write-downs are taken into account in determining net asset value but not in determining MFFO.
FFO and MFFO, as described above, should not be construed to be more relevant or accurate than the current GAAP methodology in calculating net income (loss) or in its applicability in evaluating our operational performance. The method used to evaluate the value and performance of real estate under GAAP should be construed as a more relevant measure of operation performance and considered more prominently than the non-GAAP FFO and MFFO measures and the adjustments to GAAP in calculating FFO and MFFO. MFFO has not been scrutinized to the level of other similar non-GAAP performance measures by the SEC or any other regulatory body.
40
The following is a reconciliation of net income (loss) attributable to common stockholders, which is the most directly comparable GAAP financial measure, to FFO and MFFO for the three and nine months ended September 30, 2016 and 2015 (amounts in thousands, except share data and per share amounts):
| Three Months Ended September 30, | Nine Months Ended September 30, | ||||||||||||||
| 2016 | 2015 | 2016 | 2015 | ||||||||||||
| Net income (loss) attributable to common stockholders | $ | 2,508 | $ | (1,761 | ) | $ | 5,951 | $ | (3,925 | ) | |||||
| Adjustments: | |||||||||||||||
| Depreciation and amortization | 4,782 | 2,438 | 12,948 | 4,048 | |||||||||||
| FFO attributable to common stockholders | $ | 7,290 | $ | 677 | $ | 18,899 | $ | 123 | |||||||
| Adjustments: | |||||||||||||||
Acquisition related expenses (1) | $ | 1,821 | $ | 3,760 | $ | 5,432 | $ | 7,287 | |||||||
Amortization of intangible assets and liabilities (2) | (126 | ) | (30 | ) | (375 | ) | (24 | ) | |||||||
Straight-line rents (3) | (1,645 | ) | (802 | ) | (4,344 | ) | (1,549 | ) | |||||||
| Ineffectiveness of interest rate swap | (71 | ) | — | (49 | ) | — | |||||||||
| MFFO attributable to common stockholders | $ | 7,269 | $ | 3,605 | $ | 19,563 | $ | 5,837 | |||||||
| Weighted average common shares outstanding - basic | 71,852,230 | 34,794,832 | 63,044,148 | 23,573,522 | |||||||||||
| Weighted average common shares outstanding - diluted | 71,866,949 | 34,794,832 | 63,060,086 | 23,573,522 | |||||||||||
| Net income (loss) per common share - basic | $ | 0.03 | $ | (0.05 | ) | $ | 0.09 | $ | (0.17 | ) | |||||
| Net income (loss) per common share - diluted | $ | 0.03 | $ | (0.05 | ) | $ | 0.09 | $ | (0.17 | ) | |||||
| FFO per common share - basic | $ | 0.10 | $ | 0.02 | $ | 0.30 | $ | 0.01 | |||||||
| FFO per common share - diluted | $ | 0.10 | $ | 0.02 | $ | 0.30 | $ | 0.01 | |||||||
| (1) | In evaluating investments in real estate assets, management differentiates the costs to acquire the investment from the operations derived from the investment. Such information would be comparable only for publicly registered, non-listed REITs that have completed their acquisitions activities and have other similar operating characteristics. By excluding expensed acquisition related expenses, management believes MFFO provides useful supplemental information that is comparable for each type of real estate investment and is consistent with management’s analysis of the investing and operating performance of our properties. Acquisition fees and expenses include payments in cash to our Advisor and third parties. Acquisition fees and expenses incurred in a business combination, under GAAP, are considered operating expenses and as expenses are included in the determination of net income (loss), which is a performance measure under GAAP. All paid and accrued acquisition fees and expenses will have negative effects on returns to investors, the potential for future distributions, and cash flows generated by us, unless earnings from operations or net sales proceeds from the disposition of properties are generated to cover the purchase price of the property, these fees and expenses and other costs related to the property. |
| (2) | Under GAAP, certain intangibles are accounted for at cost and reviewed at least annually for impairment, and certain intangibles are assumed to diminish predictably in value over time and are amortized, similar to depreciation and amortization of real estate-related assets that are excluded from FFO. However, because real estate values and market lease rates historically rise or fall with market conditions, management believes that by excluding charges related to amortization of these intangibles, MFFO provides useful supplemental information on the performance of the real estate. |
| (3) | Under GAAP, rental revenue is recognized on a straight-line basis over the terms of the related lease (including rent holidays, if applicable). This may result in income recognition that is significantly different than the underlying contract terms. By adjusting for the change in deferred rent receivables, MFFO may provide useful supplemental information on the realized economic impact of lease terms, providing insight on the expected contractual cash flows of such lease terms, and aligns with our analysis of operating performance. |
Company's Updated Financial Information
The following financial pages should be read in conjunction with the financial pages of our Annual Report on Form 10-K, which was filed with the SEC on March 28, 2016 and incorporated by reference into the prospectus.
41
CARTER VALIDUS MISSION CRITICAL REIT II, INC.
(A Maryland Corporation)
TABLE OF CONTENTS
| Page | |
Item 1. Financial Statements.
CARTER VALIDUS MISSION CRITICAL REIT II, INC.
CONDENSED CONSOLIDATED BALANCE SHEETS
(in thousands, except share data)
| (Unaudited) September 30, 2016 | December 31, 2015 | ||||||
| ASSETS | |||||||
| Real estate: | |||||||
| Land | $ | 89,857 | $ | 48,882 | |||
| Buildings and improvements, less accumulated depreciation of $14,240 and $5,262, respectively | 527,802 | 361,632 | |||||
| Construction in progress | 13,701 | — | |||||
| Total real estate, net | 631,360 | 410,514 | |||||
| Cash and cash equivalents | 49,090 | 31,262 | |||||
| Acquired intangible assets, less accumulated amortization of $6,003 and $2,007, respectively | 67,621 | 54,633 | |||||
| Other assets | 22,815 | 10,218 | |||||
| Total assets | $ | 770,886 | $ | 506,627 | |||
| LIABILITIES AND STOCKHOLDERS’ EQUITY | |||||||
| Liabilities: | |||||||
| Credit facility, net of deferred financing costs of $294 and $103, respectively | $ | 134,706 | $ | 89,897 | |||
| Accounts payable due to affiliates | 5,760 | 741 | |||||
| Accounts payable and other liabilities | 12,979 | 8,244 | |||||
| Intangible lease liabilities, less accumulated amortization of $500 and $98, respectively | 7,007 | 7,409 | |||||
| Total liabilities | 160,452 | 106,291 | |||||
| Stockholders’ equity: | |||||||
| Preferred stock, $0.01 par value per share, 100,000,000 shares authorized; none issued and outstanding | — | — | |||||
| Common stock, $0.01 par value per share, 500,000,000 shares authorized; 75,580,055 and 48,488,734 shares issued, respectively; 75,333,847 and 48,457,191 shares outstanding, respectively | 753 | 485 | |||||
| Additional paid-in capital | 659,651 | 425,910 | |||||
| Accumulated distributions in excess of earnings | (49,959 | ) | (26,061 | ) | |||
| Accumulated other comprehensive loss | (13 | ) | — | ||||
| Total stockholders’ equity | 610,432 | 400,334 | |||||
| Noncontrolling interests | 2 | 2 | |||||
| Total equity | 610,434 | 400,336 | |||||
| Total liabilities and stockholders’ equity | $ | 770,886 | $ | 506,627 | |||
The accompanying notes are an integral part of these condensed consolidated financial statements.
CARTER VALIDUS MISSION CRITICAL REIT II, INC.
CONDENSED CONSOLIDATED STATEMENTS OF COMPREHENSIVE INCOME (LOSS)
(in thousands, except share data and per share amounts)
(Unaudited)
| Three Months Ended September 30, | Nine Months Ended September 30, | ||||||||||||||
| 2016 | 2015 | 2016 | 2015 | ||||||||||||
| Revenue: | |||||||||||||||
| Rental revenue | $ | 12,183 | $ | 6,230 | $ | 33,092 | $ | 11,419 | |||||||
| Tenant reimbursement revenue | 1,411 | 654 | 4,129 | 842 | |||||||||||
| Total revenue | 13,594 | 6,884 | 37,221 | 12,261 | |||||||||||
| Expenses: | |||||||||||||||
| Rental expenses | 1,794 | 827 | 5,055 | 1,149 | |||||||||||
| General and administrative expenses | 836 | 439 | 2,358 | 1,366 | |||||||||||
| Acquisition related expenses | 1,821 | 3,760 | 5,432 | 7,287 | |||||||||||
| Asset management fees | 1,227 | 639 | 3,240 | 1,133 | |||||||||||
| Depreciation and amortization | 4,782 | 2,438 | 12,948 | 4,048 | |||||||||||
| Total expenses | 10,460 | 8,103 | 29,033 | 14,983 | |||||||||||
| Income (loss) from operations | 3,134 | (1,219 | ) | 8,188 | (2,722 | ) | |||||||||
| Interest expense, net | 626 | 542 | 2,237 | 1,203 | |||||||||||
| Net income (loss) attributable to common stockholders | $ | 2,508 | $ | (1,761 | ) | $ | 5,951 | $ | (3,925 | ) | |||||
| Other comprehensive income (loss): | |||||||||||||||
| Unrealized income (loss) on interest rate swaps, net | $ | 88 | $ | — | $ | (13 | ) | $ | — | ||||||
| Other comprehensive income (loss) attributable to common stockholders | 88 | — | (13 | ) | — | ||||||||||
| Comprehensive income (loss) attributable to common stockholders | $ | 2,596 | $ | (1,761 | ) | $ | 5,938 | $ | (3,925 | ) | |||||
| Weighted average number of common shares outstanding: | |||||||||||||||
| Basic | 71,852,230 | 34,794,832 | 63,044,148 | 23,573,522 | |||||||||||
| Diluted | 71,866,949 | 34,794,832 | 63,060,086 | 23,573,522 | |||||||||||
| Net income (loss) per common share attributable to common stockholders: | |||||||||||||||
| Basic | $ | 0.03 | $ | (0.05 | ) | $ | 0.09 | $ | (0.17 | ) | |||||
| Diluted | $ | 0.03 | $ | (0.05 | ) | $ | 0.09 | $ | (0.17 | ) | |||||
| Distributions declared per common share | $ | 0.16 | $ | 0.16 | $ | 0.47 | $ | 0.48 | |||||||
The accompanying notes are an integral part of these condensed consolidated financial statements.
F-2
CARTER VALIDUS MISSION CRITICAL REIT II, INC.
CONDENSED CONSOLIDATED STATEMENT OF STOCKHOLDERS' EQUITY
(in thousands, except for share data)
(Unaudited)
| Common Stock | Additional Paid-in Capital | Accumulated Distributions in Excess of Earnings | Accumulated Other Comprehensive Loss | Total Stockholders’ Equity | Noncontrolling Interests | Total Equity | ||||||||||||||||||||||||
| No. of Shares | Par Value | |||||||||||||||||||||||||||||
| Balance, December 31, 2015 | 48,457,191 | $ | 485 | $ | 425,910 | $ | (26,061 | ) | $ | — | $ | 400,334 | $ | 2 | $ | 400,336 | ||||||||||||||
| Issuance of common stock | 25,368,284 | 253 | 247,998 | — | — | 248,251 | — | 248,251 | ||||||||||||||||||||||
| Issuance of common stock under the distribution reinvestment plan | 1,718,538 | 17 | 16,268 | — | — | 16,285 | — | 16,285 | ||||||||||||||||||||||
| Vesting of restricted common stock | 4,500 | — | 41 | — | — | 41 | — | 41 | ||||||||||||||||||||||
| Commissions on sale of common stock and related dealer manager fees | — | — | (19,938 | ) | — | — | (19,938 | ) | — | (19,938 | ) | |||||||||||||||||||
| Distribution and servicing fees | — | — | (4,462 | ) | — | — | (4,462 | ) | — | (4,462 | ) | |||||||||||||||||||
| Other offering costs | — | — | (4,125 | ) | — | — | (4,125 | ) | — | (4,125 | ) | |||||||||||||||||||
| Repurchase of common stock | (214,666 | ) | (2 | ) | (2,041 | ) | — | — | (2,043 | ) | — | (2,043 | ) | |||||||||||||||||
| Distributions declared to common stockholders | — | — | — | (29,849 | ) | — | (29,849 | ) | — | (29,849 | ) | |||||||||||||||||||
| Other comprehensive loss | — | — | — | — | (13 | ) | (13 | ) | — | (13 | ) | |||||||||||||||||||
| Net income | — | — | — | 5,951 | — | 5,951 | — | 5,951 | ||||||||||||||||||||||
| Balance, September 30, 2016 | 75,333,847 | $ | 753 | $ | 659,651 | $ | (49,959 | ) | $ | (13 | ) | $ | 610,432 | $ | 2 | $ | 610,434 | |||||||||||||
The accompanying notes are an integral part of these condensed consolidated financial statements.
F-3
CARTER VALIDUS MISSION CRITICAL REIT II, INC.
CONDENSED CONSOLIDATED STATEMENTS OF CASH FLOWS
(in thousands)
(Unaudited)
| Nine Months Ended September 30, | |||||||
| 2016 | 2015 | ||||||
| Cash flows from operating activities: | |||||||
| Net income (loss) | $ | 5,951 | $ | (3,925 | ) | ||
| Adjustments to reconcile net income (loss) to net cash provided by operating activities: | |||||||
| Depreciation and amortization | 12,948 | 4,048 | |||||
| Amortization of deferred financing costs | 703 | 481 | |||||
| Amortization of above-market leases | 27 | 20 | |||||
| Amortization of intangible lease liabilities | (402 | ) | (44 | ) | |||
| Straight-line rent | (4,344 | ) | (1,549 | ) | |||
| Stock-based compensation | 41 | 23 | |||||
| Ineffectiveness of interest rate swap | (49 | ) | — | ||||
| Changes in operating assets and liabilities: | |||||||
| Accounts payable and other liabilities | 1,042 | 3,380 | |||||
| Accounts payable due to affiliates | 230 | 266 | |||||
| Other assets | (610 | ) | (1,800 | ) | |||
| Net cash provided by operating activities | 15,537 | 900 | |||||
| Cash flows from investing activities: | |||||||
| Investment in real estate | (239,729 | ) | (257,138 | ) | |||
| Capital expenditures | (4,380 | ) | (640 | ) | |||
| Escrow funds, net | (2,490 | ) | 478 | ||||
| Real estate deposits, net | (5,287 | ) | (281 | ) | |||
| Net cash used in investing activities | (251,886 | ) | (257,581 | ) | |||
| Cash flows from financing activities: | |||||||
| Proceeds from issuance of common stock | 248,251 | 311,955 | |||||
| Proceeds from credit facility | 115,000 | 72,000 | |||||
| Payments on credit facility | (70,000 | ) | (39,500 | ) | |||
| Payments of deferred financing costs | (767 | ) | (581 | ) | |||
| Repurchases of common stock | (2,043 | ) | (155 | ) | |||
| Offering costs on issuance of common stock | (23,979 | ) | (36,618 | ) | |||
| Distributions to stockholders | (12,285 | ) | (3,759 | ) | |||
| Net cash provided by financing activities | 254,177 | 303,342 | |||||
| Net change in cash and cash equivalents | 17,828 | 46,661 | |||||
| Cash and cash equivalents - Beginning of period | 31,262 | 3,694 | |||||
| Cash and cash equivalents - End of period | $ | 49,090 | $ | 50,355 | |||
| Supplemental cash flow disclosure: | |||||||
| Interest paid, net of interest capitalized of $293 and $0, respectively | $ | 1,887 | $ | 600 | |||
| Supplemental disclosure of non-cash transactions: | |||||||
| Common stock issued through distribution reinvestment plan | $ | 16,285 | $ | 5,795 | |||
| Distribution and servicing fees accrued | $ | 4,226 | $ | — | |||
| Liability assumed at acquisition | $ | 1,236 | $ | — | |||
| Accrued capital expenditures | $ | 1,469 | $ | — | |||
| Net unrealized loss on interest rate swap | $ | (13 | ) | $ | — | ||
The accompanying notes are an integral part of these condensed consolidated financial statements.
F-4
F-5
CARTER VALIDUS MISSION CRITICAL REIT II, INC.
NOTES TO CONDENSED CONSOLIDATED FINANCIAL STATEMENTS
(Unaudited)
September 30, 2016
Note 1—Organization and Business Operations
Carter Validus Mission Critical REIT II, Inc., or the Company, is a Maryland corporation that was formed on January 11, 2013, which elected to be taxed as a real estate investment trust, or a REIT, under the Internal Revenue Code of 1986, as amended, for federal income tax purposes commencing with its taxable year ended December 31, 2014. The Company commenced principal operations on July 3, 2014 when it satisfied the minimum offering requirement and issued approximately 213,333 shares of Class A common stock for gross proceeds of $2,000,000. Substantially all of the Company’s business is conducted through Carter Validus Operating Partnership II, LP, a Delaware limited partnership, or the Operating Partnership, formed on January 10, 2013. The Company is the sole general partner of the Operating Partnership and Carter Validus Advisors II, LLC, or the Advisor, is the initial limited partner of the Operating Partnership.
The Company is offering for sale a maximum of $2,350,000,000 in shares of common stock, consisting of up to $2,250,000,000 in shares in its primary offering and up to $100,000,000 in shares of common stock to be made available pursuant to the Company’s distribution reinvestment plan, or the DRIP, on a “best efforts” basis, or the Offering, pursuant to a registration statement on Form S-11, or the Registration Statement, filed with the Securities and Exchange Commission, or the SEC, under the Securities Act of 1933, as amended, or the Securities Act, which was declared effective on May 29, 2014. The Company has registered for offering shares of Class A common stock and shares of Class T common stock, in any combination with a dollar value up to the maximum primary offering amount.
As of September 30, 2016, the Company had issued approximately 75,573,000 shares of Class A and Class T common stock (including shares of common stock issued pursuant to the DRIP) in the Offering, resulting in receipt of gross proceeds of approximately $746,094,000, before selling commissions and dealer manager fees of approximately $64,577,000, distribution and servicing fees of approximately $4,462,000 and other offering costs of approximately $14,383,000. As of September 30, 2016, the Company had approximately $1,603,906,000 in Class A shares and Class T shares of common stock remaining in the Offering.
Substantially all of the Company’s business is managed by the Advisor. Carter Validus Real Estate Management Services II, LLC, or the Property Manager, an affiliate of the Advisor, serves as the Company’s property manager. The Advisor and the Property Manager have received, and will continue to receive, fees for services related to the acquisition and operational stages. The Advisor will also be eligible to receive fees during the liquidation stage. SC Distributors, LLC, an affiliate of the Advisor, or the Dealer Manager, serves as the dealer manager of the Offering. The Dealer Manager has received, and will continue to receive, fees for services related to the Offering.
The Company was formed to invest primarily in quality income-producing commercial real estate, with a focus on data centers and healthcare properties, preferably with long-term net leases to investment grade and other creditworthy tenants, as well as to make other real estate-related investments that relate to such property types. Real estate-related investments may include equity or debt interests, including securities, in other real estate entities. The Company also may originate or invest in real estate-related notes receivable. The Company expects real estate-related notes receivable originations and investments to be focused on first mortgage loans, but also may include real estate-related bridge loans, mezzanine loans and securitized notes receivable. As of September 30, 2016, the Company owned 30 real estate investments, consisting of 43 properties, located in 24 metropolitan statistical areas, or MSAs, and one micropolitan statistical area, or µSA.
Except as the context otherwise requires, “we,” “our,” “us,” and the “Company” refer to Carter Validus Mission Critical REIT II, Inc., the Operating Partnership and all wholly-owned subsidiaries.
F-6
Note 2—Summary of Significant Accounting Policies
The summary of significant accounting policies presented below is designed to assist in understanding the Company’s condensed consolidated financial statements. Such condensed consolidated financial statements and the accompanying notes thereto are the representation of management. These accounting policies conform to accounting principles generally accepted in the United States of America, or GAAP, for interim financial information and with the instructions to Form 10-Q and Article 10 of Regulation S-X. Accordingly, they do not include all of the information and notes required by GAAP for complete financial statements. In the opinion of management, all adjustments, consisting of normal and recurring nature considered for a fair presentation, have been included. Operating results for the three and nine months ended September 30, 2016 are not necessarily indicative of the results that may be expected for the year ending December 31, 2016.
The condensed consolidated balance sheet at December 31, 2015 has been derived from the audited consolidated financial statements at that date but does not include all the information and notes required by GAAP for complete financial statements. The information included in this prospectus supplement should be read in conjunction with the Company's audited consolidated financial statements as of and for the year ended December 31, 2015 and related notes thereto set forth in the Company's Annual Report on Form 10-K, filed with the SEC on March 28, 2016.
Principles of Consolidation and Basis of Presentation
The accompanying condensed consolidated financial statements include the accounts of the Company, the Operating Partnership, and all wholly-owned subsidiaries. All intercompany accounts and transactions have been eliminated in consolidation.
On January 1, 2016, the Company adopted Accounting Standards Update, or ASU, ASU 2015-02, Amendments to the Consolidation Analysis, which amends the current consolidation guidance affecting both the variable interest entity, or VIE, and voting interest entity, or VOE, consolidation models. The standard does not add or remove any of the characteristics in determining if an entity is a VIE or VOE, but rather enhances the way the Company assesses some of these characteristics. The Operating Partnership meets the criteria as a VIE, the Company is the primary beneficiary and, accordingly, the Company continues to consolidate the Operating Partnership. The Company’s sole asset is its investment in the Operating Partnership, and consequently, all of the Company’s assets and liabilities represent those assets and liabilities of the Operating Partnership. All of the Company’s debt is an obligation of the Operating Partnership.
Use of Estimates
The preparation of the condensed consolidated financial statements and accompanying notes in conformity with GAAP requires the Company to make estimates and assumptions that affect the amounts reported in the financial statements and accompanying notes. These estimates are made and evaluated on an ongoing basis using information that is currently available as well as various other assumptions believed to be reasonable under the circumstances. Actual results could differ from those estimates.
Concentration of Credit Risk and Significant Leases
As of September 30, 2016, the Company had cash on deposit, including restricted cash, in certain financial institutions that had deposits in excess of current federally insured levels; however, the Company has not experienced any losses in such accounts. The Company limits its cash investments to financial institutions with high credit standings; therefore, the Company believes it is not exposed to any significant credit risk on its cash deposits. To date, the Company has experienced no loss of or lack of access to cash in its accounts. Concentration of credit risk with respect to accounts receivable from tenants is limited.
As of September 30, 2016, the Company owned real estate investments in 24 MSAs and one µSA, three MSAs of which accounted for 10.0% or more of contractual rental revenue. Real estate investments located in the Oklahoma City, Oklahoma MSA, the Houston-The Woodlands-Sugar Land, Texas MSA, and the Dallas-Fort Worth-Arlington, Texas MSA accounted for 15.9%, 14.5%, and 11.9%, respectively, of contractual rental revenue for the nine months ended September 30, 2016.
As of September 30, 2016, the Company had two exposures to tenant concentration that accounted for 10.0% or more of contractual rental revenue. The leases with tenants under common control of the guarantor Post Acute Medical, LLC and the leases with Healthcare Partners Investments, LLC accounted for 12.6% and 11.4%, respectively, of contractual rental revenue for the nine months ended September 30, 2016.
Deferred Financing Costs
Deferred financing costs are loan fees, legal fees and other third-party costs associated with obtaining financing. These costs are amortized over the terms of the respective financing agreements using the effective interest method. Unamortized deferred financing costs are generally expensed when the associated debt is refinanced or repaid before maturity unless specific rules are met that would allow for the carryover of such costs to the refinanced debt. Costs incurred in seeking financing transactions that do not close are expensed in the period in which it is determined that the financing will not close.
F-7
On January 1, 2016, the Company adopted ASU 2015-03, Interest—Imputation of Interest (Subtopic 835-30): Simplifying the Presentation of Debt Issuance Costs, and ASU 2015-15, Interest—Imputation of Interest (Subtopic 835-30): Presentation and Subsequent Measurement of Debt Issuance Costs Associated With Line-of-Credit Arrangements, or ASUs 2015-03 and 2015-15. According to ASUs 2015-03 and 2015-15, deferred financing costs related to a recognized debt liability in connection with term loans, including the term loan portion of the Company's credit facility, are presented in the balance sheet as a direct deduction from the carrying amount of that debt liability. Deferred financing costs related to the revolving line of credit portion of the Company's secured credit facility are presented in the balance sheet as an asset, which is included in other assets on the condensed consolidated balance sheet. As required, the Company retrospectively applied the guidance in ASUs 2015-03 and 2015-15 to the prior period presented, which resulted in a decrease of $103,000 in other assets and credit facility on the condensed consolidated balance sheet as of December 31, 2015.
Share Repurchase Program
The Company’s share repurchase program allows for repurchases of shares of the Company’s common stock when certain criteria are met. Repurchases of shares of the Company’s common stock are at the sole discretion of the Company’s board of directors. In addition, the Company’s board of directors, in its sole discretion, may amend, suspend, reduce, terminate or otherwise change the share repurchase program upon 30 days' prior notice to the Company’s stockholders for any reason it deems appropriate. The share repurchase program provides that the Company will limit the number of shares repurchased during any calendar year to 5.0% of the number of shares of common stock outstanding on December 31st of the previous calendar year. In addition, the share repurchase program provides that all repurchases of shares of common stock during any calendar year, including those upon death or a qualifying disability of a stockholder, are limited to those that can be funded with equivalent proceeds raised from the DRIP Offering during the prior calendar year and other operating funds, if any, as the board of directors, in its sole discretion, may reserve for this purpose. During the nine months ended September 30, 2016, the Company received valid repurchase requests related to 214,666 Class A shares of common stock, all of which were repurchased in full for an aggregate purchase price of approximately $2,043,000 (an average of $9.52 per share). During the nine months ended September 30, 2015, the Company received valid repurchase requests related to 15,511 Class A shares of common stock, all of which were repurchased in full for an aggregate purchase price of approximately $155,000 (an average of $9.99 per share). During the nine months ended September 30, 2016 and 2015, the Company did not receive repurchase requests related to Class T shares.
Fair Value
Accounting Standards Codification, or ASC, 820, Fair Value Measurements and Disclosures, or ASC 820, defines fair value, establishes a framework for measuring fair value in accordance with GAAP and expands disclosures about fair value measurements. ASC 820 emphasizes that fair value is intended to be a market-based measurement, as opposed to a transaction-specific measurement.
Fair value is defined by ASC 820 as the price that would be received to sell an asset or paid to transfer a liability in an orderly transaction between market participants at the measurement date. Depending on the nature of the asset or liability, various techniques and assumptions can be used to estimate the fair value. Assets and liabilities are measured using inputs from three levels of the fair value hierarchy, as follows:
Level 1—Inputs are quoted prices (unadjusted) in active markets for identical assets or liabilities that the Company has the ability to access at the measurement date. An active market is defined as a market in which transactions for the assets or liabilities occur with sufficient frequency and volume to provide pricing information on an ongoing basis.
Level 2—Inputs include quoted prices for similar assets and liabilities in active markets, quoted prices for identical or similar assets or liabilities in markets that are not active (markets with few transactions), inputs other than quoted prices that are observable for the asset or liability (i.e., interest rates, yield curves, etc.), and inputs that are derived principally from or corroborated by observable market data correlation or other means (market corroborated inputs).
Level 3—Unobservable inputs, only used to the extent that observable inputs are not available, reflect the Company’s assumptions about the pricing of an asset or liability.
The following describes the methods the Company used to estimate the fair value of the Company’s financial assets and liabilities:
Cash and cash equivalents, other assets, accounts payable due to affiliates and accounts payable and other liabilities—The Company considers the carrying values of these financial instruments, assets and liabilities to approximate fair value because of the short period of time between origination of the instruments and their expected realization.
Secured credit facility—The outstanding principal of the secured credit facility – variable was $110,000,000 and $90,000,000, which approximated its fair value as of September 30, 2016 and December 31, 2015, respectively. The interest on the secured credit facility – variable is calculated at the London Interbank Offered Rate, or LIBOR, plus an applicable margin.
F-8
The interest rate resets to market on a monthly basis. The fair value of the Company's secured credit facility – variable is estimated based on the interest rates currently offered to the Company by financial institutions. The estimated fair value of the secured credit facility – variable rate fixed through an interest rate swap agreement (Level 2) was approximately $24,777,000 as of September 30, 2016 as compared to the outstanding principal of $25,000,000 as of September 30, 2016.
Derivative instruments—Considerable judgment is necessary to develop estimated fair values of financial instruments. Accordingly, the estimates presented herein are not necessarily indicative of the amount the Company could realize, or be liable for, on disposition of the financial instruments. The Company has determined that the majority of the inputs used to value its interest rate swaps fall within Level 2 of the fair value hierarchy. The credit valuation adjustments associated with these instruments utilize Level 3 inputs, such as estimates of current credit spreads, to evaluate the likelihood of default by the Company and the respective counterparty. However, as of September 30, 2016, the Company has assessed the significance of the impact of the credit valuation adjustments on the overall valuation of its derivative positions, and has determined that the credit valuation adjustments are not significant to the overall valuation of its interest rate swaps. As a result, the Company determined that its interest rate swaps valuation in its entirety is classified in Level 2 of the fair value hierarchy.
In accordance with the fair value hierarchy described above, the following table shows the fair value of the Company’s financial assets and liabilities that are required to be measured at fair value on a recurring basis as of September 30, 2016 (amounts in thousands):
| September 30, 2016 | |||||||||||||||
| Fair Value Hierarchy | |||||||||||||||
| Quoted Prices in Active Markets for Identical Assets (Level 1) | Significant Other Observable Inputs (Level 2) | Significant Unobservable Inputs (Level 3) | Total Fair Value | ||||||||||||
| Assets: | |||||||||||||||
| Derivative assets | $ | — | $ | 36 | $ | — | $ | 36 | |||||||
| Total assets at fair value | $ | — | $ | 36 | $ | — | $ | 36 | |||||||
| Liabilities: | |||||||||||||||
| Derivative liabilities | $ | — | $ | — | $ | — | $ | — | |||||||
| Total liabilities at fair value | $ | — | $ | — | $ | — | $ | — | |||||||
The Company did not have financial assets and liabilities required to be measured at fair value as of December 31, 2015.
Derivative Instruments and Hedging Activities
As required by ASC 815, Derivatives and Hedging, or ASC 815, the Company records all derivative instruments as assets and liabilities in the statement of financial position at fair value. The accounting for changes in the fair value of a derivative instrument depends on whether it has been designated and qualifies as part of a hedging relationship and further, on the type of hedging relationship. For those derivative instruments that are designated and qualify as hedging instruments, a company must designate the hedging instrument, based upon the exposure being hedged, as a fair value hedge, cash flow hedge or a hedge of a net investment in a foreign operation. For derivative instruments not designated as hedging instruments, the income or loss is recognized in the condensed consolidated statements of comprehensive income (loss) during the current period.
The Company is exposed to variability in expected future cash flows that are attributable to interest rate changes in the normal course of business. The Company’s primary strategy in entering into derivative contracts is to add stability to future cash flows by managing its exposure to interest rate movements. The Company utilizes derivative instruments, including interest rate swaps, to effectively convert some its variable rate debt to fixed rate debt. The Company does not enter into derivative instruments for speculative purposes.
In accordance with ASC 815, the Company designates interest rate swap contracts as cash flow hedges of floating-rate borrowings. For derivative instruments that are designated and qualify as cash flow hedges, the effective portion of the income or loss on the derivative instrument is reported as a component of other comprehensive income (loss) in the condensed consolidated statements of comprehensive income (loss) and reclassified into earnings in the same line item associated with the forecasted transaction and the same period during which the hedged transaction affects earnings. The ineffective portion of the income or loss on the derivative instrument is recognized in the condensed consolidated statements of comprehensive income (loss) during the current period.
In accordance with the fair value measurement guidance ASU 2011-04, Fair Value Measurement, the Company made an accounting policy election to measure the credit risk of its derivative financial instruments that are subject to master netting agreements on a net basis by counterparty portfolio.
F-9
Earnings Per Share
The Company calculates basic earnings per share by dividing net income (loss) attributable to common stockholders for the period by the weighted average shares of its common stock outstanding for that period. Diluted earnings per share are computed based on the weighted average number of shares outstanding and all potentially dilutive securities. Shares of non-vested restricted common stock give rise to potentially dilutive shares of common stock. For the three and nine months ended September 30, 2016, diluted earnings per share reflected the effect of approximately 15,000 and 16,000, respectively, of non-vested shares of restricted Class A common stock that were outstanding as of such period. For the three and nine months ended September 30, 2015, there were 15,750 shares of non-vested restricted Class A common stock outstanding, but such shares were excluded from the computation of diluted earnings per share because such shares were anti-dilutive during this period.
Recently Issued Accounting Pronouncements
On May 28, 2014, the Financial Accounting Standards Board, or the FASB, issued ASU 2014-09, Revenue from Contracts with Customers, or ASU 2014-09. The objective of ASU 2014-09 is to clarify the principles for recognizing revenue and to develop a common revenue standard for GAAP. The core principle of the guidance is that an entity should recognize revenue to depict the transfer of promised goods and services to customers in an amount that reflects the consideration to which the entity expects to be entitled in exchange for those goods or services. ASU 2014-09 defines a five-step process to achieve this core principle, which may require more judgment and estimates within the revenue recognition process than are required under existing GAAP. In August 2015, the FASB issued ASU 2015-14, Revenue from Contracts with Customers (Topic 606) Deferral of the Effective Date, or ASU 2015-14. ASU 2015-14 defers the effective date of ASU 2014-09 by one year to fiscal years and interim periods beginning after December 15, 2017. Early adoption is permitted as of the original effective date, which was annual reporting periods beginning after December 15, 2016, and the interim periods within that year. On March 17, 2016, the FASB issued ASU 2016-08, Revenue from Contracts with Customers (Principal versus Agent Considerations), or ASU 2016-08, which improves the implementation guidance on principal versus agent considerations. ASU 2016-08 clarifies that an entity is a principal when it controls the specified good or service before that good or service is transferred to the customer, and is an agent when it does not control the specified good or service before it is transferred to the customer. The effective date of this update is the same as the effective date of ASU 2015-14. The Company is in the process of evaluating the impact ASUs 2014-09 and 2016-08 will have on the Company’s condensed consolidated financial statements.
On June 16, 2016, the FASB issued ASU 2016-13, Financial Instruments-Credit Losses, or ASU 2016-13. ASU 2016-13 requires more timely recording of credit losses on loans and other financial instruments that are not accounted for at fair value through net income, including loans held for investment, held-to-maturity debt securities, trade and other receivables, net investment in leases and other such commitments. ASU 2016-13 requires that financial assets measured at amortized cost be presented at the net amount expected to be collected, through an allowance for credit losses that is deducted from the amortized cost basis. The amendments in ASU 2016-13 require the Company to measure all expected credit losses based upon historical experience, current conditions, and reasonable and supportable forecasts that affect the collectability of the financial assets and eliminates the “incurred loss” methodology in current GAAP. ASU 2016-13 is effective for fiscal years beginning after, and interim periods within, December 15, 2019. Early adoption is permitted for fiscal years beginning after, and interim periods within, December 15, 2018. The Company is in the process of evaluating the impact ASU 2016-13 will have on the Company’s condensed consolidated financial statements.
On August 26, 2016, the FASB issued ASU 2016-15, Statement of Cash Flows, or ASU 2016-15. ASU 2016-15 is intended to reduce diversity in practice in how certain transactions are classified in the statement of cash flows. ASU 2016-15 addresses eight classification issues related to the statement of cash flows: 1) debt prepayment or debt extinguishment costs; 2) settlement of zero-coupon bonds; 3) contingent consideration payments made after a business combination; 4) proceeds from the settlement of insurance claims; 5) proceeds from the settlement of corporate-owned life insurance policies, including bank-owned life insurance policies; 6) distributions received from equity method investees; 7) beneficial interests in securitization transactions; and 8) separately identifiable cash flows and application of the predominance principle. ASU 2016-15 is effective for public business entities for annual and interim periods in fiscal years beginning after December 15, 2017. Entities should apply this ASU using a retrospective transition method to each period presented. The Company is in the process of evaluating the impact ASU 2016-15 will have on the Company’s condensed consolidated financial statements.
Reclassifications
Certain prior period amounts have been reclassified to conform to the current financial statement presentation, with no effect on the Company’s condensed consolidated financial position or results of operations.
Note 3—Real Estate Investments
During the nine months ended September 30, 2016, the Company purchased 15 real estate properties, of which 12 were determined to be business combinations and three were determined to be asset acquisitions. See Note 4—"Business
F-10
Combinations" for further discussion of business combinations. The following table summarizes the consideration transferred for all real estate properties acquired during the nine months ended September 30, 2016 (amounts in thousands):
| Nine Months Ended September 30, 2016 | |||
| Investments in real estate: | |||
Purchase price of business combinations (1) | $ | 207,447 | |
| Purchase price of asset acquisitions | 33,518 | ||
| Total purchase price of real estate investments acquired | $ | 240,965 | |
| (1) | In connection with one business combination, the Company assumed a $1,236,000 contractual liability during the nine months ended September 30, 2016. |
Acquisition fees and expenses in connection with the acquisition of properties determined to be business combinations are expensed as incurred, including investment transactions that are no longer under consideration, and are included in acquisition related expenses in the accompanying condensed consolidated statements of comprehensive income (loss). Acquisition fees and expenses associated with transactions determined to be asset acquisitions are capitalized. The Company expensed acquisition fees and expenses of approximately $1,684,000 and $3,760,000 for the three months ended September 30, 2016 and 2015, respectively, and $5,052,000 and $7,287,000 for the nine months ended September 30, 2016 and 2015, respectively. The Company capitalized acquisition fees and expenses of approximately $2,037,000 and $234,000 for the nine months ended September 30, 2016 and 2015, respectively. The Company did not capitalize any acquisition fees and expenses for the three months ended September 30, 2016 and 2015. The total amount of all acquisition fees and costs is limited to 6.0% of the contract purchase price of a property. The contract purchase price is the amount actually paid or allocated in respect of the purchase, development, construction or improvement of a property exclusive of acquisition fees and costs. For the nine months ended September 30, 2016 and 2015, acquisition fees and costs did not exceed 6.0% of the contract purchase price of the Company's acquisitions during such periods.
Note 4—Business Combinations
During the nine months ended September 30, 2016, the Company completed the acquisition of 100% of the interests in 12 real estate properties (four data centers and eight healthcare properties) that were determined to be business combinations. The aggregate purchase price of the acquisitions determined to be business combinations was $207,447,000, plus closing costs.
The following table summarizes the acquisitions determined to be business combinations during the nine months ended September 30, 2016:
| Property Description | Date Acquired | Ownership Percentage | |
| HPI — Edmond | 01/20/2016 | 100% | |
| HPI — Oklahoma City III | 01/27/2016 | 100% | |
| HPI — Oklahoma City IV | 01/27/2016 | 100% | |
| Alpharetta Data Center III | 02/02/2016 | 100% | |
| Flint Data Center | 02/02/2016 | 100% | |
| HPI — Newcastle | 02/03/2016 | 100% | |
| HPI — Oklahoma City V | 02/11/2016 | 100% | |
| HPI — Oklahoma City VI | 03/07/2016 | 100% | |
| HPI — Oklahoma City VII | 06/22/2016 | 100% | |
| Somerset Data Center | 06/29/2016 | 100% | |
| Integris Lakeside Women's Hospital | 06/30/2016 | 100% | |
| AT&T Hawthorne Data Center | 09/27/2016 | 100% | |
Results of operations for the acquisitions determined to be business combinations are reflected in the accompanying condensed consolidated statements of comprehensive income (loss) for three and nine months ended September 30, 2016 for the period subsequent to the acquisition date of each property. For the period from the first acquisition date through September 30, 2016, the Company recorded $4,588,000 in revenues and a net loss of $3,286,000 for its business combination acquisitions.
F-11
The following table summarizes management’s preliminary allocation of the fair value of the acquisitions determined to be business combinations during the nine months ended September 30, 2016 (amounts in thousands):
| Total | |||
| Land | $ | 29,012 | |
| Buildings and improvements | 162,340 | ||
| In-place leases | 14,664 | ||
| Tenant improvements | 1,431 | ||
| Total assets acquired | $ | 207,447 | |
Assuming the business combinations described above had occurred on January 1, 2015, pro forma revenues and net income attributable to common stockholders would have been as follows for the periods listed below (amounts in thousands, except per share amounts, unaudited):
| Three Months Ended September 30, | Nine Months Ended September 30, | ||||||||||||||
| 2016 | 2015 | 2016 | 2015 | ||||||||||||
| Pro forma basis: | |||||||||||||||
| Revenues | $ | 15,017 | $ | 13,050 | $ | 43,538 | $ | 37,081 | |||||||
| Net income attributable to common stockholders | $ | 4,471 | $ | 4,929 | $ | 13,383 | $ | 1,792 | |||||||
| Net income per common share attributable to common stockholders: | |||||||||||||||
| Basic | $ | 0.06 | $ | 0.07 | $ | 0.18 | $ | 0.03 | |||||||
| Diluted | $ | 0.06 | $ | 0.07 | $ | 0.18 | $ | 0.03 | |||||||
The condensed pro forma consolidated financial statements for the three and nine months ended September 30, 2016 and 2015 include pro forma adjustments related to the acquisitions during 2016 and 2015. The pro forma information for the three and nine months ended September 30, 2016 was adjusted to exclude approximately $1,684,000 and $5,052,000, respectively, of acquisition fees and costs recorded related to the Company's real estate investments. The pro forma information may not be indicative of what actual results of operations would have been had the transactions occurred at the beginning of 2015, nor is it necessarily indicative of future operating results.
Note 5—Acquired Intangible Assets, Net
Acquired intangible assets, net, consisted of the following as of September 30, 2016 and December 31, 2015 (amounts in thousands, except weighted average life amounts):
| September 30, 2016 | December 31, 2015 | ||||||
| In-place leases, net of accumulated amortization of $5,935 and $1,967, respectively (with a weighted average remaining life of 13.1 years and 14.5 years, respectively) | $ | 66,791 | $ | 53,776 | |||
| Above-market leases, net of accumulated amortization of $52 and $32, respectively (with a weighted average remaining life of 7.7 years and 8.4 years, respectively) | 202 | 222 | |||||
| Ground lease interest, net of accumulated amortization of $16 and $9, respectively (with a weighted average remaining life of 67.0 years and 67.8 years, respectively) | 628 | 635 | |||||
| $ | 67,621 | $ | 54,633 | ||||
The aggregate weighted average remaining life of the acquired intangible assets was 13.6 years and 15.1 years as of September 30, 2016 and December 31, 2015, respectively.
F-12
Note 6—Other Assets
Other assets consisted of the following as of September 30, 2016 and December 31, 2015 (amounts in thousands):
| September 30, 2016 | December 31, 2015 | ||||||
| Deferred financing costs, related to the revolver portion of the secured credit facility, net of accumulated amortization of $1,488 and $802, respectively | $ | 2,590 | $ | 2,717 | |||
| Real estate escrow deposits | 5,730 | 443 | |||||
| Restricted cash held in escrow | 4,417 | 1,927 | |||||
| Tenant receivables | 2,107 | 2,065 | |||||
| Straight-line rent receivable | 6,806 | 2,462 | |||||
| Prepaid and other assets | 1,129 | 604 | |||||
| Derivative assets | 36 | — | |||||
| $ | 22,815 | $ | 10,218 | ||||
Note 7—Future Minimum Rent
The Company’s real estate assets are leased to tenants under operating leases with varying terms. The leases frequently have provisions to extend the terms of the lease agreements. The Company retains substantially all of the risks and benefits of ownership of the real estate assets leased to tenants.
The future minimum rent to be received from the Company’s investments in real estate assets under non-cancelable operating leases for the three months ending December 31, 2016 and for each of the next four years ending December 31 and thereafter, are as follows (amounts in thousands):
| Year | Amount | |||
| Three months ending December 31, 2016 | $ | 12,009 | ||
| 2017 | 48,533 | |||
| 2018 | 49,396 | |||
| 2019 | 50,013 | |||
| 2020 | 49,153 | |||
| Thereafter | 494,425 | |||
| $ | 703,529 | |||
F-13
Note 8—Credit Facility
The Company's debt outstanding as of September 30, 2016 and December 31, 2015 consisted of the following (amounts in thousands):
| September 30, 2016 | December 31, 2015 | |||||||
| Secured credit facility: | ||||||||
| Revolving line of credit | $ | 85,000 | $ | 65,000 | ||||
| Term loan | 50,000 | 25,000 | ||||||
| Total secured credit facility, principal amount outstanding | 135,000 | 90,000 | ||||||
| Unamortized deferred financing costs related to the term loan secured credit facility | (294 | ) | (103 | ) | ||||
| Total secured credit facility, net of deferred financing costs | $ | 134,706 | $ | 89,897 | ||||
Significant activities regarding the secured credit facility since December 31, 2015 include:
| • | During the nine months ended September 30, 2016, the Company drew $115,000,000 and repaid $70,000,000 on the secured credit facility. |
| • | During the nine months ended September 30, 2016, the Company increased the borrowing base availability under the secured credit facility by $81,120,000 by adding 14 properties to the aggregate pool availability. |
| • | During the nine months ended September 30, 2016, the Company entered into an interest rate swap agreement to effectively fix LIBOR on $25,000,000 of the term loan of the secured credit facility. |
| • | On September 30, 2016, the Operating Partnership and certain of the Company's subsidiaries amended certain agreements related to the secured credit facility to increase the maximum commitments available under the secured credit facility from $265,000,000 to an aggregate of up to $315,000,000, consisting of a $265,000,000 revolving line of credit, with a maturity date of December 22, 2018, subject to the Operating Partnership’s right for two 12-month extension periods, and a $50,000,000 term loan, with a maturity date of December 22, 2019, subject to the Operating Partnership’s right for one 12-month extension period. Subject to certain conditions, the secured credit facility can be increased to $550,000,000. |
| • | As of September 30, 2016, the Company had a total pool availability under the secured credit facility of $252,479,000 and an aggregate outstanding principal balance of $135,000,000. As of September 30, 2016, $117,479,000 remained to be drawn on the secured credit facility. |
The principal payments due on the secured credit facility for the three months ending December 31, 2016 and for each of the next four years ending December 31 and thereafter, are as follows (amounts in thousands):
| Year | Amount | |||
| Three months ending December 31, 2016 | $ | — | ||
| 2017 | — | |||
| 2018 | 85,000 | |||
| 2019 | 50,000 | |||
| 2020 | — | |||
| Thereafter | — | |||
| $ | 135,000 | |||
F-14
Note 9—Intangible Lease Liabilities, Net
Intangible lease liabilities, net, consisted of the following as of September 30, 2016 and December 31, 2015 (amounts in thousands, except weighted average life amounts):
| September 30, 2016 | December 31, 2015 | ||||||
| Below-market leases, net of accumulated amortization of $500 and $98, respectively (with a weighted average remaining life of 13.8 years and 14.5 years, respectively) | $ | 7,007 | $ | 7,409 | |||
| $ | 7,007 | $ | 7,409 | ||||
Note 10—Commitments and Contingencies
Litigation
In the ordinary course of business, the Company may become subject to litigation or claims. As of September 30, 2016, there were, and currently there are, no material pending legal proceedings to which the Company is a party.
Note 11—Related-Party Transactions and Arrangements
The Company reimburses the Advisor and its affiliates for organization and offering expenses it incurs on the Company’s behalf, but only to the extent the reimbursement would not cause the selling commissions, dealer manager fees, distribution and servicing fees and other organization and offering expenses to exceed 15% of the gross proceeds of the Offering. The Company expects that organization and offering expenses (other than selling commissions, dealer manager fees and distribution and servicing fees) will be approximately 1.25% of the gross proceeds. As of September 30, 2016, the Advisor and its affiliates incurred approximately $11,732,000 on the Company’s behalf in offering costs. The Company accrued approximately $549,000 of other organization and offering expenses as of September 30, 2016. Other organization expenses are expensed as incurred and offering expenses are charged to stockholders’ equity as incurred or as such amounts are reimbursed to the Advisor.
The Company pays to the Advisor 2.0% of the contract purchase price of each property or asset acquired and 2.0% of the amount advanced with respect to a mortgage loan. For the three months ended September 30, 2016 and 2015, the Company incurred approximately $1,590,000 and $2,673,000, respectively, and for the nine months ended September 30, 2016 and 2015, the Company incurred approximately $5,760,000 and $5,144,000, respectively, in acquisition fees to the Advisor or its affiliates. In addition, the Company reimburses the Advisor for acquisition expenses incurred in connection with the selection and acquisition of properties or other real estate-related investments (including expenses relating to potential investments that the Company does not close), such as legal fees and expenses, costs of real estate due diligence, appraisals, non-refundable option payments on properties not acquired, travel and communications expenses, accounting fees and expenses and title insurance premiums, whether or not the property was acquired. The Company expects these expenses will be approximately 0.75% of the purchase price of each property or real estate-related investment.
The Company pays to the Advisor an asset management fee calculated on a monthly basis in an amount equal to 1/12th of 0.75% of gross assets (including amounts borrowed), which is payable monthly in arrears. The Advisor may, in its sole discretion, choose to take any monthly asset management fee in the form of subordinated restricted Class B Units of the Operating Partnership. In the event the Advisor chooses to be compensated in Class B Units, then the Operating Partnership will, within 30 days after the end of the applicable month (subject to the approval of the board of directors), issue a number of restricted Class B Units to the Advisor equal to: (i) the cost of assets multiplied by 0.0625% (or the lower of the cost of assets and the applicable net asset value, or NAV, multiplied by 0.0625%, once the Company begins calculating NAV) divided by (ii) the value of one share of common stock as of the last day of such calendar month, which will be the offering price, less selling commissions and dealer manager fees, until such time as the Company calculates NAV, when it will then be the per share NAV for common shares. The Advisor will be entitled to receive certain distributions of net sales proceeds on the vested and unvested Class B Units it receives in connection with its assets management services at the same rate as distributions received on the Company’s common stock. Such distributions will be in addition to the incentive fees the Advisor and its affiliates may receive from the Company, including, without limitation the subordinated participation in net sales proceeds, the subordinated incentive listing distribution or the subordinated distribution upon termination of the advisory agreement, as applicable.
Class B Units are subject to forfeiture until such time as: (a) the value of the Operating Partnership’s assets plus all distributions made equals or exceeds the total amount of capital contributed by investors plus a 6.0% cumulative, pretax, non-compounded annual return thereon, or the economic hurdle; (b) any one of the following events occurs concurrently with or subsequently to the achievement of the economic hurdle described above: (i) a listing of the Company’s common stock on a national securities exchange; (ii) a transaction to which the Company or the Operating Partnership shall be a party, as a result of which operating partnership units or common stock shall be exchanged for or converted into the right, or the holders of such
F-15
securities shall otherwise be entitled, to receive cash, securities or other property or any combination thereof; or (iii) the termination of the advisory agreement without cause; and (c) the Advisor pursuant to the advisory agreement is providing services to the Company immediately prior to the occurrence of an event of the type described in clause (b) above, unless the failure to provide such services is attributable to the termination without cause of the advisory agreement by an affirmative vote of a majority of the Company’s independent directors after the economic hurdle described above has been met. Any outstanding Class B Units will be forfeited immediately if the advisory agreement is terminated for any reason other than a termination without cause. Any outstanding Class B Units will be forfeited immediately if the advisory agreement is terminated without cause by an affirmative vote of a majority of the Company’s board of directors before the economic hurdle described above has been met. For the three months ended September 30, 2016 and 2015, the Company incurred approximately $1,227,000 and $639,000, respectively, and for the nine months ended September 30, 2016 and 2015, the Company incurred approximately $3,240,000 and $1,133,000, respectively, in asset management fees. As of September 30, 2016, the Company did not issue any Class B Units.
In connection with the rental, leasing, operation and management of the Company’s properties, the Company pays the Property Manager and its affiliates aggregate fees equal to 3.0% of monthly gross revenues from the properties managed, or property management fees. The Company will reimburse the Property Manager and its affiliates for property-level expenses that any of them pay or incur on the Company’s behalf, including salaries, bonuses and benefits of persons employed by the Property Manager and its affiliates except for the salaries, bonuses and benefits of persons who also serve as one of its executive officers. The Property Manager and its affiliates may subcontract the performance of their duties to third parties and pay all or a portion of the property management fee to the third parties with whom they contract for these services. If the Company contracts directly with third parties for such services, it will pay them customary market fees and may pay the Property Manager an oversight fee equal to 1.0% of the gross revenues of the properties managed. In no event will the Company pay the Property Manager or any affiliate both a property management fee and an oversight fee with respect to any particular property. For the three months ended September 30, 2016 and 2015, the Company incurred approximately $353,000 and $174,000, respectively, and for the nine months ended September 30, 2016 and 2015, the Company incurred approximately $964,000 and $314,000, respectively, in property management fees to the Property Manager, which are recorded in rental expenses in the accompanying condensed consolidated statements of comprehensive income (loss). The Company also will pay the Property Manager a separate fee for the one-time initial rent-up, leasing-up of newly constructed properties or re-leasing to existing tenants. As of September 30, 2016, the Company has not incurred any leasing commissions to the Property Manager.
For acting as general contractor and/or construction manager to supervise or coordinate projects or to provide major repairs or rehabilitation on our properties, the Company may pay the Property Manager up to 5.0% of the cost of the projects, repairs and/or rehabilitation, as applicable, or construction management fees. For the three and nine months ended September 30, 2016, the Company incurred $265,000 in construction management fees to the Property Manager. For the three and nine months ended September 30, 2015, the Company did not incur construction management fees to the Property Manager. Construction management fees are capitalized in real estate, net in the accompanying condensed consolidated balance sheets.
The Company reimburses the Advisor for all expenses it paid or incurred in connection with the services provided to the Company, subject to certain limitations. Expenses in excess of the operating expenses in the four immediately preceding quarters that exceeds the greater of (a) 2.0% of average invested assets or (b) 25% of net income, subject to certain adjustments, will not be reimbursed unless the independent directors determine such excess expenses are justified. The Company will not reimburse the Advisor for personnel costs in connection with services for which the Advisor receives an acquisition fee or a disposition fee. For the three months ended September 30, 2016 and 2015, the Advisor allocated approximately $337,000 and $223,000, respectively, and for the nine months ended September 30, 2016 and 2015, the Advisor allocated approximately $935,000 and $586,000, respectively, in operating expenses to the Company, which are included as part of general and administrative expenses in the accompanying condensed consolidated statements of comprehensive income (loss).
The Company will pay its Advisor, or its affiliates, if it provides a substantial amount of services (as determined by a majority of the Company’s independent directors) in connection with the sale of properties, a disposition fee, up to the lesser of 1.0% of the contract sales price and one-half of the total brokerage commission paid if a third party broker is also involved, without exceeding the lesser of 6.0% of the contract sales price or a reasonable, customary and competitive real estate commission. As of September 30, 2016, the Company has not incurred any disposition fees to the Advisor or its affiliates.
The Advisor will receive 15% of the remaining net sale proceeds after return of capital contributions plus payment to investors of a 6.0% annual cumulative, non-compounded return on the capital contributed by investors. As of September 30, 2016, the Company has not incurred any subordinated participation in net sale proceeds to the Advisor or its affiliates.
Upon the listing of the Company’s shares on a national securities exchange, the Advisor will receive 15.0% of the amount by which the sum of the Company’s adjusted market value plus distributions exceeds the sum of the aggregate capital contributed by investors plus an amount equal to a 6.0% annual cumulative, non-compounded return to investors, or the
F-16
subordinated incentive listing fee. As of September 30, 2016, the Company has not incurred any subordinated incentive listing fees to the Advisor or its affiliates.
Upon termination or non-renewal of the advisory agreement, with or without cause, the Advisor will be entitled to receive distributions from the Operating Partnership equal to 15% of the amount by which the sum of the Company’s adjusted market value plus distributions exceeds the sum of the aggregate capital contributed by investors plus an amount equal to an annual 6.0% cumulative, non-compounded return to investors. In addition, the Advisor may elect to defer its right to receive a subordinated distribution upon termination until either shares of the Company’s common stock are listed and traded on a national securities exchange or another liquidity event occurs. As of September 30, 2016, the Company has not incurred any subordinated termination fees to the Advisor or its affiliates.
Certain affiliates of the Company receive fees in connection with the Offering and will continue to receive fees during the acquisition, management and sale of assets of the Company.
The Company pays the Dealer Manager selling commissions of up to 7.0% of the gross offering proceeds per Class A share and up to 3.0% of gross offering proceeds per Class T share. All selling commissions are expected to be re-allowed to participating broker-dealers. The Company will not pay selling commissions with respect to shares of any class sold pursuant to the DRIP. In addition, the Company pays the Dealer Manager a dealer manager fee of up to 3.0% of gross offering proceeds from the sale of Class A and Class T shares.The dealer manager fee may be partially re-allowed to participating broker-dealers. No dealer manager fees will be paid in connection with purchases of shares made pursuant to the DRIP. For the three months ended September 30, 2016 and 2015, the Company incurred approximately $4,994,000 and $8,285,000, respectively, and for the nine months ended September 30, 2016 and 2015, the Company incurred approximately $19,938,000 and $29,606,000, respectively, in selling commissions and dealer manager fees in connection with the Offering to the Dealer Manager.
The Company pays the Dealer Manager a distribution and servicing fee with respect to its Class T shares that are sold in the primary offering that accrues daily in an amount equal to 1/365th of 1.0% of the most recent offering price per Class T share sold in the primary offering on a continuous basis from year to year; provided, however, that upon the termination of the primary offering, the distribution and servicing fee will accrue daily in an amount equal to 1/365th of 1.0% of the most recent estimated NAV per Class T share on a continuous basis from year to year. Termination of such payment will commence on the earliest to occur of the following: (i) a listing of the Class T shares on a national securities exchange, (ii) following the completion of the Offering, total underwriting compensation in the Offering equaling 10% of the gross proceeds from the primary portion of the Offering, (iii) there are no longer any Class T shares outstanding, or (iv) the fourth anniversary of the last day of the fiscal quarter in which the primary offering terminates. The Dealer Manager may re-allow the distribution and servicing fee to participating broker-dealers and servicing broker-dealers. The distribution and servicing fee will be paid monthly in arrears. The distribution and servicing fee will not be payable with respect to Class T shares issued under the DRIP. The Company will not pay a distribution and servicing fee with respect to Class A shares. For the three and nine months ended September 30, 2016, the Company incurred approximately $1,420,000 and $4,462,000, respectively, in distribution and servicing fees to the Dealer Manager. For the three and nine months ended September 30, 2015, the Company did not incur distribution and servicing fees to the Dealer Manager because it had not sold any Class T shares.
Accounts Payable Due to Affiliates
The following amounts were outstanding due to affiliates as of September 30, 2016 and December 31, 2015 (amounts in thousands):
| Entity | Fee | September 30, 2016 | December 31, 2015 | |||||||
| Carter Validus Advisors II, LLC and its affiliates | Asset management fees | $ | 443 | $ | 290 | |||||
| Carter Validus Real Estate Management Services II, LLC | Property management fees | 140 | 101 | |||||||
| Carter Validus Real Estate Management Services II, LLC | Construction management fees | 265 | — | |||||||
| Carter Validus Advisors II, LLC and its affiliates | General and administrative costs | 134 | 96 | |||||||
| Carter Validus Advisors II, LLC and its affiliates | Offering costs | 549 | 250 | |||||||
| SC Distributors, LLC | Distribution and servicing fees | 4,226 | — | |||||||
| Carter Validus Advisors II, LLC and its affiliates | Acquisition expenses and fees | 3 | 4 | |||||||
| $ | 5,760 | $ | 741 | |||||||
F-17
Note 12—Segment Reporting
Management reviews the performance of individual properties and aggregates individual properties based on operating criteria into two reportable segments—commercial real estate investments in data centers and healthcare, and makes operating decisions based on these two reportable segments. The Company’s commercial real estate investments in data centers and healthcare are based on certain underwriting assumptions and operating criteria, which are different for data centers and healthcare. There were no intersegment sales or transfers during the nine months ended September 30, 2016 and 2015.
The Company evaluates performance based on net operating income of the individual properties in each segment. Net operating income, a non-GAAP financial measure, is defined as total revenues, less rental expenses, which excludes depreciation and amortization, general and administrative expenses, acquisition related expenses, asset management fees and interest expense, net. The Company believes that segment net operating income serves as a useful supplement to net income (loss) because it allows investors and management to measure unlevered property-level operating results and to compare operating results to the operating results of other real estate companies between periods on a consistent basis. Segment net operating income should not be considered as an alternative to net income (loss) determined in accordance with GAAP as an indicator of financial performance, and accordingly, the Company believes that in order to facilitate a clear understanding of the consolidated historical operating results, segment net operating income should be examined in conjunction with net income (loss) as presented in the accompanying condensed consolidated financial statements and data included elsewhere in this prospectus supplement.
General and administrative expenses, acquisition related expenses, asset management fees, depreciation and amortization and interest expense, net are not allocated to individual segments for purposes of assessing segment performance.
Non-segment assets primarily consist of corporate assets, including cash and cash equivalents, real estate and escrow deposits, deferred financing costs attributable to the revolving line of credit portion of the Company's secured credit facility and other assets not attributable to individual properties.
Summary information for the reportable segments during the three and nine months ended September 30, 2016 and 2015, is as follows (amounts in thousands):
| Data Centers | Healthcare | Three Months Ended September 30, 2016 | |||||||||
| Revenue: | |||||||||||
| Rental and tenant reimbursement revenue | $ | 2,497 | $ | 11,097 | $ | 13,594 | |||||
| Expenses: | |||||||||||
| Rental expenses | (440 | ) | (1,354 | ) | (1,794 | ) | |||||
| Segment net operating income | $ | 2,057 | $ | 9,743 | 11,800 | ||||||
| Expenses: | |||||||||||
| General and administrative expenses | (836 | ) | |||||||||
| Acquisition related expenses | (1,821 | ) | |||||||||
| Asset management fees | (1,227 | ) | |||||||||
| Depreciation and amortization | (4,782 | ) | |||||||||
| Income from operations | 3,134 | ||||||||||
| Interest expense, net | (626 | ) | |||||||||
| Net income attributable to common stockholders | $ | 2,508 | |||||||||
F-18
| Data Centers | Healthcare | Three Months Ended September 30, 2015 | |||||||||
| Revenue: | |||||||||||
| Rental and tenant reimbursement revenue | $ | 543 | $ | 6,341 | $ | 6,884 | |||||
| Expenses: | |||||||||||
| Rental expenses | (90 | ) | (737 | ) | (827 | ) | |||||
| Segment net operating income | $ | 453 | $ | 5,604 | 6,057 | ||||||
| Expenses: | |||||||||||
| General and administrative expenses | (439 | ) | |||||||||
| Acquisition related expenses | (3,760 | ) | |||||||||
| Asset management fees | (639 | ) | |||||||||
| Depreciation and amortization | (2,438 | ) | |||||||||
| Loss from operations | (1,219 | ) | |||||||||
| Interest expense, net | (542 | ) | |||||||||
| Net loss attributable to common stockholders | $ | (1,761 | ) | ||||||||
| Data Centers | Healthcare | Nine Months Ended September 30, 2016 | |||||||||
| Revenue: | |||||||||||
| Rental and tenant reimbursement revenue | $ | 6,211 | $ | 31,010 | $ | 37,221 | |||||
| Expenses: | |||||||||||
| Rental expenses | (1,011 | ) | (4,044 | ) | (5,055 | ) | |||||
| Segment net operating income | $ | 5,200 | $ | 26,966 | 32,166 | ||||||
| Expenses: | |||||||||||
| General and administrative expenses | (2,358 | ) | |||||||||
| Acquisition related expenses | (5,432 | ) | |||||||||
| Asset management fees | (3,240 | ) | |||||||||
| Depreciation and amortization | (12,948 | ) | |||||||||
| Income from operations | 8,188 | ||||||||||
| Interest expense, net | (2,237 | ) | |||||||||
| Net income attributable to common stockholders | $ | 5,951 | |||||||||
F-19
| Data Centers | Healthcare | Nine Months Ended September 30, 2015 | |||||||||
| Revenue: | |||||||||||
| Rental and tenant reimbursement revenue | $ | 724 | $ | 11,537 | $ | 12,261 | |||||
| Expenses: | |||||||||||
| Rental expenses | (98 | ) | (1,051 | ) | (1,149 | ) | |||||
| Segment net operating income | $ | 626 | $ | 10,486 | 11,112 | ||||||
| Expenses: | |||||||||||
| General and administrative expenses | (1,366 | ) | |||||||||
| Acquisition related expenses | (7,287 | ) | |||||||||
| Asset management fees | (1,133 | ) | |||||||||
| Depreciation and amortization | (4,048 | ) | |||||||||
| Loss from operations | (2,722 | ) | |||||||||
| Interest expense, net | (1,203 | ) | |||||||||
| Net loss attributable to common stockholders | $ | (3,925 | ) | ||||||||
Assets by each reportable segment as of September 30, 2016 and December 31, 2015 are as follows (amounts in thousands):
| September 30, 2016 | December 31, 2015 | ||||||
| Assets by segment: | |||||||
| Data centers | $ | 179,629 | $ | 44,207 | |||
| Healthcare | 533,786 | 427,878 | |||||
| All other | 57,471 | 34,542 | |||||
| Total assets | $ | 770,886 | $ | 506,627 | |||
Capital additions and acquisitions by reportable segments for the nine months ended September 30, 2016 and 2015 are as follows (amounts in thousands):
| Nine Months Ended September 30, | |||||||
| 2016 | 2015 | ||||||
| Capital additions and acquisitions by segment: | |||||||
| Data centers | $ | 134,831 | $ | 33,114 | |||
| Healthcare | 109,278 | 224,664 | |||||
| Total capital additions and acquisitions | $ | 244,109 | $ | 257,778 | |||
F-20
Note 13—Accounts Payable and Other Liabilities
Accounts payable and other liabilities, as of September 30, 2016 and December 31, 2015, were comprised of the following (amounts in thousands):
| September 30, 2016 | December 31, 2015 | ||||||
| Accounts payable and accrued expenses | $ | 4,245 | $ | 2,283 | |||
| Accrued interest expense | 290 | 221 | |||||
| Accrued property taxes | 1,456 | 505 | |||||
| Distributions payable to stockholders | 3,826 | 2,548 | |||||
| Tenant deposits | 1,765 | 1,848 | |||||
| Deferred rental income | 1,397 | 839 | |||||
| $ | 12,979 | $ | 8,244 | ||||
Note 14—Derivative Instruments and Hedging Activities
Cash Flow Hedges of Interest Rate Risk
The Company’s objectives in using interest rate derivatives are to add stability to interest expense and to manage its exposure to interest rate movements. To accomplish these objectives, the Company primarily uses interest rate swaps as part of its interest rate risk management strategy. Interest rate swaps designated as cash flow hedges involve the receipt of variable rate amounts from a counterparty in exchange for the Company making fixed rate payments over the life of the agreements without exchange of the underlying notional amount.
The effective portion of changes in the fair value of derivatives designated, and that qualify, as cash flow hedges is recorded in accumulated other comprehensive loss in the accompanying condensed consolidated statement of stockholders' equity and is subsequently reclassified into earnings in the period that the hedged forecasted transaction affects earnings.
During the nine months ended September 30, 2016, the Company's derivative instrument was used to hedge the variable cash flows associated with variable rate debt. The ineffective portion of changes in fair value of the derivative is recognized directly in earnings. During the three and nine months ended September 30, 2016, the Company recognized income of $71,000 and $49,000, respectively, due to ineffectiveness of its hedge of interest rate risk, which was recorded in interest expense, net in the accompanying condensed consolidated statements of comprehensive income (loss).
Amounts reported in accumulated other comprehensive loss related to the derivative will be reclassified to interest expense as interest payments are made on the Company’s variable rate debt. During the next twelve months, the Company estimates that an additional $56,000 will be reclassified from accumulated other comprehensive loss as an increase to interest expense.
See Note 2—"Summary of Significant Accounting Policies" for a further discussion of the fair value of the Company’s derivative instruments.
The following table summarizes the notional amount and fair value of the Company’s derivative instrument (amounts in thousands):
| Derivative Designated as Hedging Instrument | Balance Sheet Location | Effective Dates | Maturity Dates | September 30, 2016 | December 31, 2015 | |||||||||||||||||||||||||
| Outstanding Notional Amount | Fair Value of | Outstanding Notional Amount | Fair Value of | |||||||||||||||||||||||||||
| Asset | (Liability) | Asset | (Liability) | |||||||||||||||||||||||||||
| Interest rate swap | Other assets | 07/01/2016 | 12/22/2020 | $ | 25,000 | $ | 36 | $ | — | $ | — | $ | — | $ | — | |||||||||||||||
The notional amount under the agreement is an indication of the extent of the Company’s involvement in the instrument at the time, but does not represent exposure to credit, interest rate or market risks.
Accounting for changes in the fair value of a derivative instrument depends on the intended use and designation of the derivative instrument. The Company designated the interest rate swap as a cash flow hedge to hedge the variability of the anticipated cash flows on its variable rate secured credit facility. The change in fair value of the effective portion of the derivative instrument that is designated as a hedge is recorded in other comprehensive income (loss), or OCI, in the
F-21
accompanying condensed consolidated statements of comprehensive income (loss).
The table below summarizes the amount of income and loss recognized on the interest rate derivative designated as a cash flow hedge for the three and nine months ended September 30, 2016 and 2015 (amounts in thousands):
| Derivative in Cash Flow Hedging Relationship | Amount of (Loss) Income Recognized in OCI on Derivative (Effective Portion) | Location of (Loss) Income Reclassified From Accumulated Other Comprehensive Loss to Net Income (Effective Portion) | Amount of (Loss) Income Reclassified From Accumulated Other Comprehensive Loss to Net Income (Effective Portion) | |||||||
| Three Months Ended September 30, 2016 | ||||||||||
| Interest rate swap | $ | 62 | Interest expense, net | $ | (26 | ) | ||||
| Total | $ | 62 | $ | (26 | ) | |||||
| Three Months Ended September 30, 2015 | ||||||||||
| Interest rate swap | $ | — | Interest expense, net | $ | — | |||||
| Total | $ | — | $ | — | ||||||
| Nine Months Ended September 30, 2016 | ||||||||||
| Interest rate swap | $ | (39 | ) | Interest expense, net | $ | (26 | ) | |||
| Total | $ | (39 | ) | $ | (26 | ) | ||||
| Nine Months Ended September 30, 2015 | ||||||||||
| Interest rate swap | $ | — | Interest expense, net | $ | — | |||||
| Total | $ | — | $ | — | ||||||
Credit Risk-Related Contingent Features
The Company has an agreement with its derivative counterparty that contains cross-default provisions, whereby if the Company defaults on certain of its indebtedness, then the Company could also be declared in default on its derivative obligation, resulting in an acceleration of payment thereunder.
In addition, the Company is exposed to credit risk in the event of non-performance by its derivative counterparty. The Company believes it mitigates its credit risk by entering into agreements with creditworthy counterparties. The Company records credit risk valuation adjustments on its interest rate swaps based on the respective credit quality of the Company and the counterparty. As of September 30, 2016, the fair value of the derivative in a net asset position, including accrued interest but excluding any adjustment for nonperformance risk related to the agreement, was $23,000. As of September 30, 2016, there were no termination events or events of default related to the interest rate swap.
Tabular Disclosure Offsetting Derivatives
The Company has elected not to offset its derivative asset position in its condensed consolidated financial statements. The following table presents the effect on the Company’s financial position had the Company made the election to offset its derivative asset position as of September 30, 2016 (amounts in thousands):
| Offsetting of Derivative Assets | ||||||||||||||||||||||||
| Gross Amounts Not Offset in the Balance Sheet | ||||||||||||||||||||||||
| Gross Amounts of Recognized Assets | Gross Amounts Offset in the Balance Sheet | Net Amounts of Assets Presented in the Balance Sheet | Financial Instruments Collateral | Cash Collateral | Net Amount | |||||||||||||||||||
| September 30, 2016 | $ | 36 | $ | — | $ | 36 | $ | — | $ | — | $ | 36 | ||||||||||||
The Company did not have any financial instruments hedged through interest rate swaps as of December 31, 2015.
The Company reports the derivative in the accompanying condensed consolidated balance sheets as other assets.
F-22
Note 15—Accumulated Other Comprehensive Loss
The following table presents a rollforward of amounts recognized in accumulated other comprehensive loss by component for the nine months ended September 30, 2016 (amounts in thousands):
| Unrealized Loss on Derivative Instruments | Accumulated Other Comprehensive Loss | ||||||
| Balance as of December 31, 2015 | $ | — | $ | — | |||
| Other comprehensive loss before reclassification | (39 | ) | (39 | ) | |||
| Amount of loss reclassified from accumulated other comprehensive loss to net income (effective portion) | 26 | 26 | |||||
| Other comprehensive loss | (13 | ) | (13 | ) | |||
| Balance as of September 30, 2016 | $ | (13 | ) | $ | (13 | ) | |
The following table presents reclassifications out of accumulated other comprehensive loss for the nine months ended September 30, 2016 and 2015 (amounts in thousands):
| Details about Accumulated Other Comprehensive Loss Components | Amounts Reclassified from Accumulated Other Comprehensive Loss to Net Income | Affected Line Items in the Consolidated Statements of Comprehensive Income (Loss) | |||||||
| Nine Months Ended September 30, | |||||||||
| 2016 | 2015 | ||||||||
| Interest rate swap contracts | $ | 26 | — | Interest expense, net | |||||
Note 16—Economic Dependency
The Company is dependent on the Advisor and its affiliates for certain services that are essential to the Company, including the sale of the Company’s shares of common and preferred stock available for issuance; the identification, evaluation, negotiation, purchase and disposition of real estate investments and other investments; the management of the daily operations of the Company’s real estate portfolio; and other general and administrative responsibilities. In the event that the Advisor and its affiliates are unable to provide the respective services, the Company will be required to obtain such services from other sources.
Note 17—Subsequent Events
Distributions to Stockholders Paid
On October 3, 2016, the Company paid aggregate distributions of approximately $3,441,000 to Class A stockholders ($1,569,000 in cash and $1,872,000 in shares of the Company’s Class A common stock pursuant to the DRIP), which related to distributions declared for each day in the period from September 1, 2016 through September 30, 2016. On November 1, 2016, the Company paid aggregate distributions of approximately $3,646,000 to Class A stockholders ($1,676,000 in cash and $1,970,000 in shares of the Company’s Class A common stock issued pursuant to the DRIP), which related to distributions declared for each day in the period from October 1, 2016 through October 31, 2016.
On October 3, 2016, the Company paid aggregate distributions of approximately $385,000 to Class T stockholders ($136,000 in cash and $249,000 in shares of the Company's Class T common stock pursuant to the DRIP), which related to distributions declared for each day in the period from September 1, 2016 through September 30, 2016. On November 1, 2016, the Company paid aggregate distributions of approximately $444,000 to Class T stockholders ($159,000 in cash and $285,000 in shares of the Company’s Class T common stock issued pursuant to the DRIP), which related to distributions declared for each day in the period from October 1, 2016 through October 31, 2016.
F-23
Distributions Declared
Class A Shares
On November 3, 2016, the board of directors of the Company approved and declared a distribution to the Company’s Class A stockholders of record as of the close of business on each day of the period commencing on December 1, 2016 and ending on February 28, 2017. The distributions for December 2016 will be calculated based on 366 days in the calendar year and will be equal to $0.001762273 per share of Class A common stock, which will be equal to an annualized distribution rate of 6.4%, assuming a purchase price of $10.078 per share of Class A common stock. The distributions for January 2017 and February 2017 will be calculated based on 365 days in the calendar year and will be equal to $0.001767101 per share of Class A common stock, which will be equal to an annualized distribution rate of 6.4%, assuming a purchase price of $10.078. The distributions declared for each record date in December 2016, January 2017 and February 2017 will be paid in January 2017, February 2017 and March 2017, respectively. The distributions will be payable to stockholders from legally available funds therefor.
Class T Shares
On November 3, 2016, the board of directors of the Company approved and declared a daily distribution to the Company’s Class T stockholders of record as of the close of business on each day of the period commencing on December 1, 2016 and ending February 28, 2017. The distributions for December 2016 will be calculated based on 366 days in the calendar year and will be equal to $0.001497440 per share of Class T common stock, which will be equal to an annualized distribution rate of 5.68%, assuming a purchase price of $9.649 per share. The distributions for January 2017 and February 2017 will be calculated based on 365 days in the calendar year and will be equal to $0.001501543, which will be equal to an annualized distribution rate of 5.68%, assuming a purchase price of $9.649 per share. The distributions declared for each record date in December 2016, January 2017 and February 2017 will be paid in January 2017, February 2017 and March 2017, respectively. The distributions will be payable to stockholders from legally available funds therefor.
Status of the Offering
As of November 10, 2016, the Company had accepted investors’ subscriptions for and issued approximately 78,401,000 shares of Class A and Class T common stock in the Offering, resulting in receipt of gross proceeds of approximately $773,692,000 including shares of its common stock issued pursuant to the DRIP. As of November 10, 2016, the Company had approximately $1,576,308,000 in Class A shares and Class T shares of common stock remaining in the Offering.
Acquisition of the McLean Data Center Portfolio
On October 17, 2016, the Company acquired 100% of the interest in a data center portfolio consisting of two properties, or the McLean Data Center Portfolio, for an aggregate purchase price of $85,000,000, plus closing costs. The Company financed the purchase of the McLean Data Center using net proceeds from the Offering and proceeds from the secured credit facility. The McLean Data Center Portfolio is leased to multiple tenants.
Acquisition of the Select Medical Rehabilitation Facility
On November 1, 2016, the Company acquired 100% of the interest in a healthcare facility, or the Select Medical Rehabilitation Facility, for an aggregate purchase price of $63,580,000, plus closing costs. The Company financed the purchase of the Select Medical Rehabilitation Facility using net proceeds from the Offering and proceeds from the secured credit facility. The Select Medical Rehabilitation Facility is leased to a single tenant.
Acquisition of the Andover Data Center II
On November 8, 2016, the Company acquired 100% of the interest in a data center property, or the Andover Data Center II, for an aggregate purchase price of $37,000,000, plus closing costs. The Company financed the purchase of the Andover Data Center II using net proceeds from the Offering and proceeds from the secured credit facility. The Andover Data Center II is leased to multiple tenants.
F-24
Revised Forms of Subscription Agreements
Revised forms of our Subscription Agreement, Additional Subscription Agreement and Multi-Product Subscription Agreement are attached as Appendices B, C and F, respectively, and supersede and replace Appendices B, C and F in the prospectus.
B-1

B-2
B-3
B-4
B-5
B-6

B-7
B-8
B-9
B-10
C-1
C-2
C-3
C-4
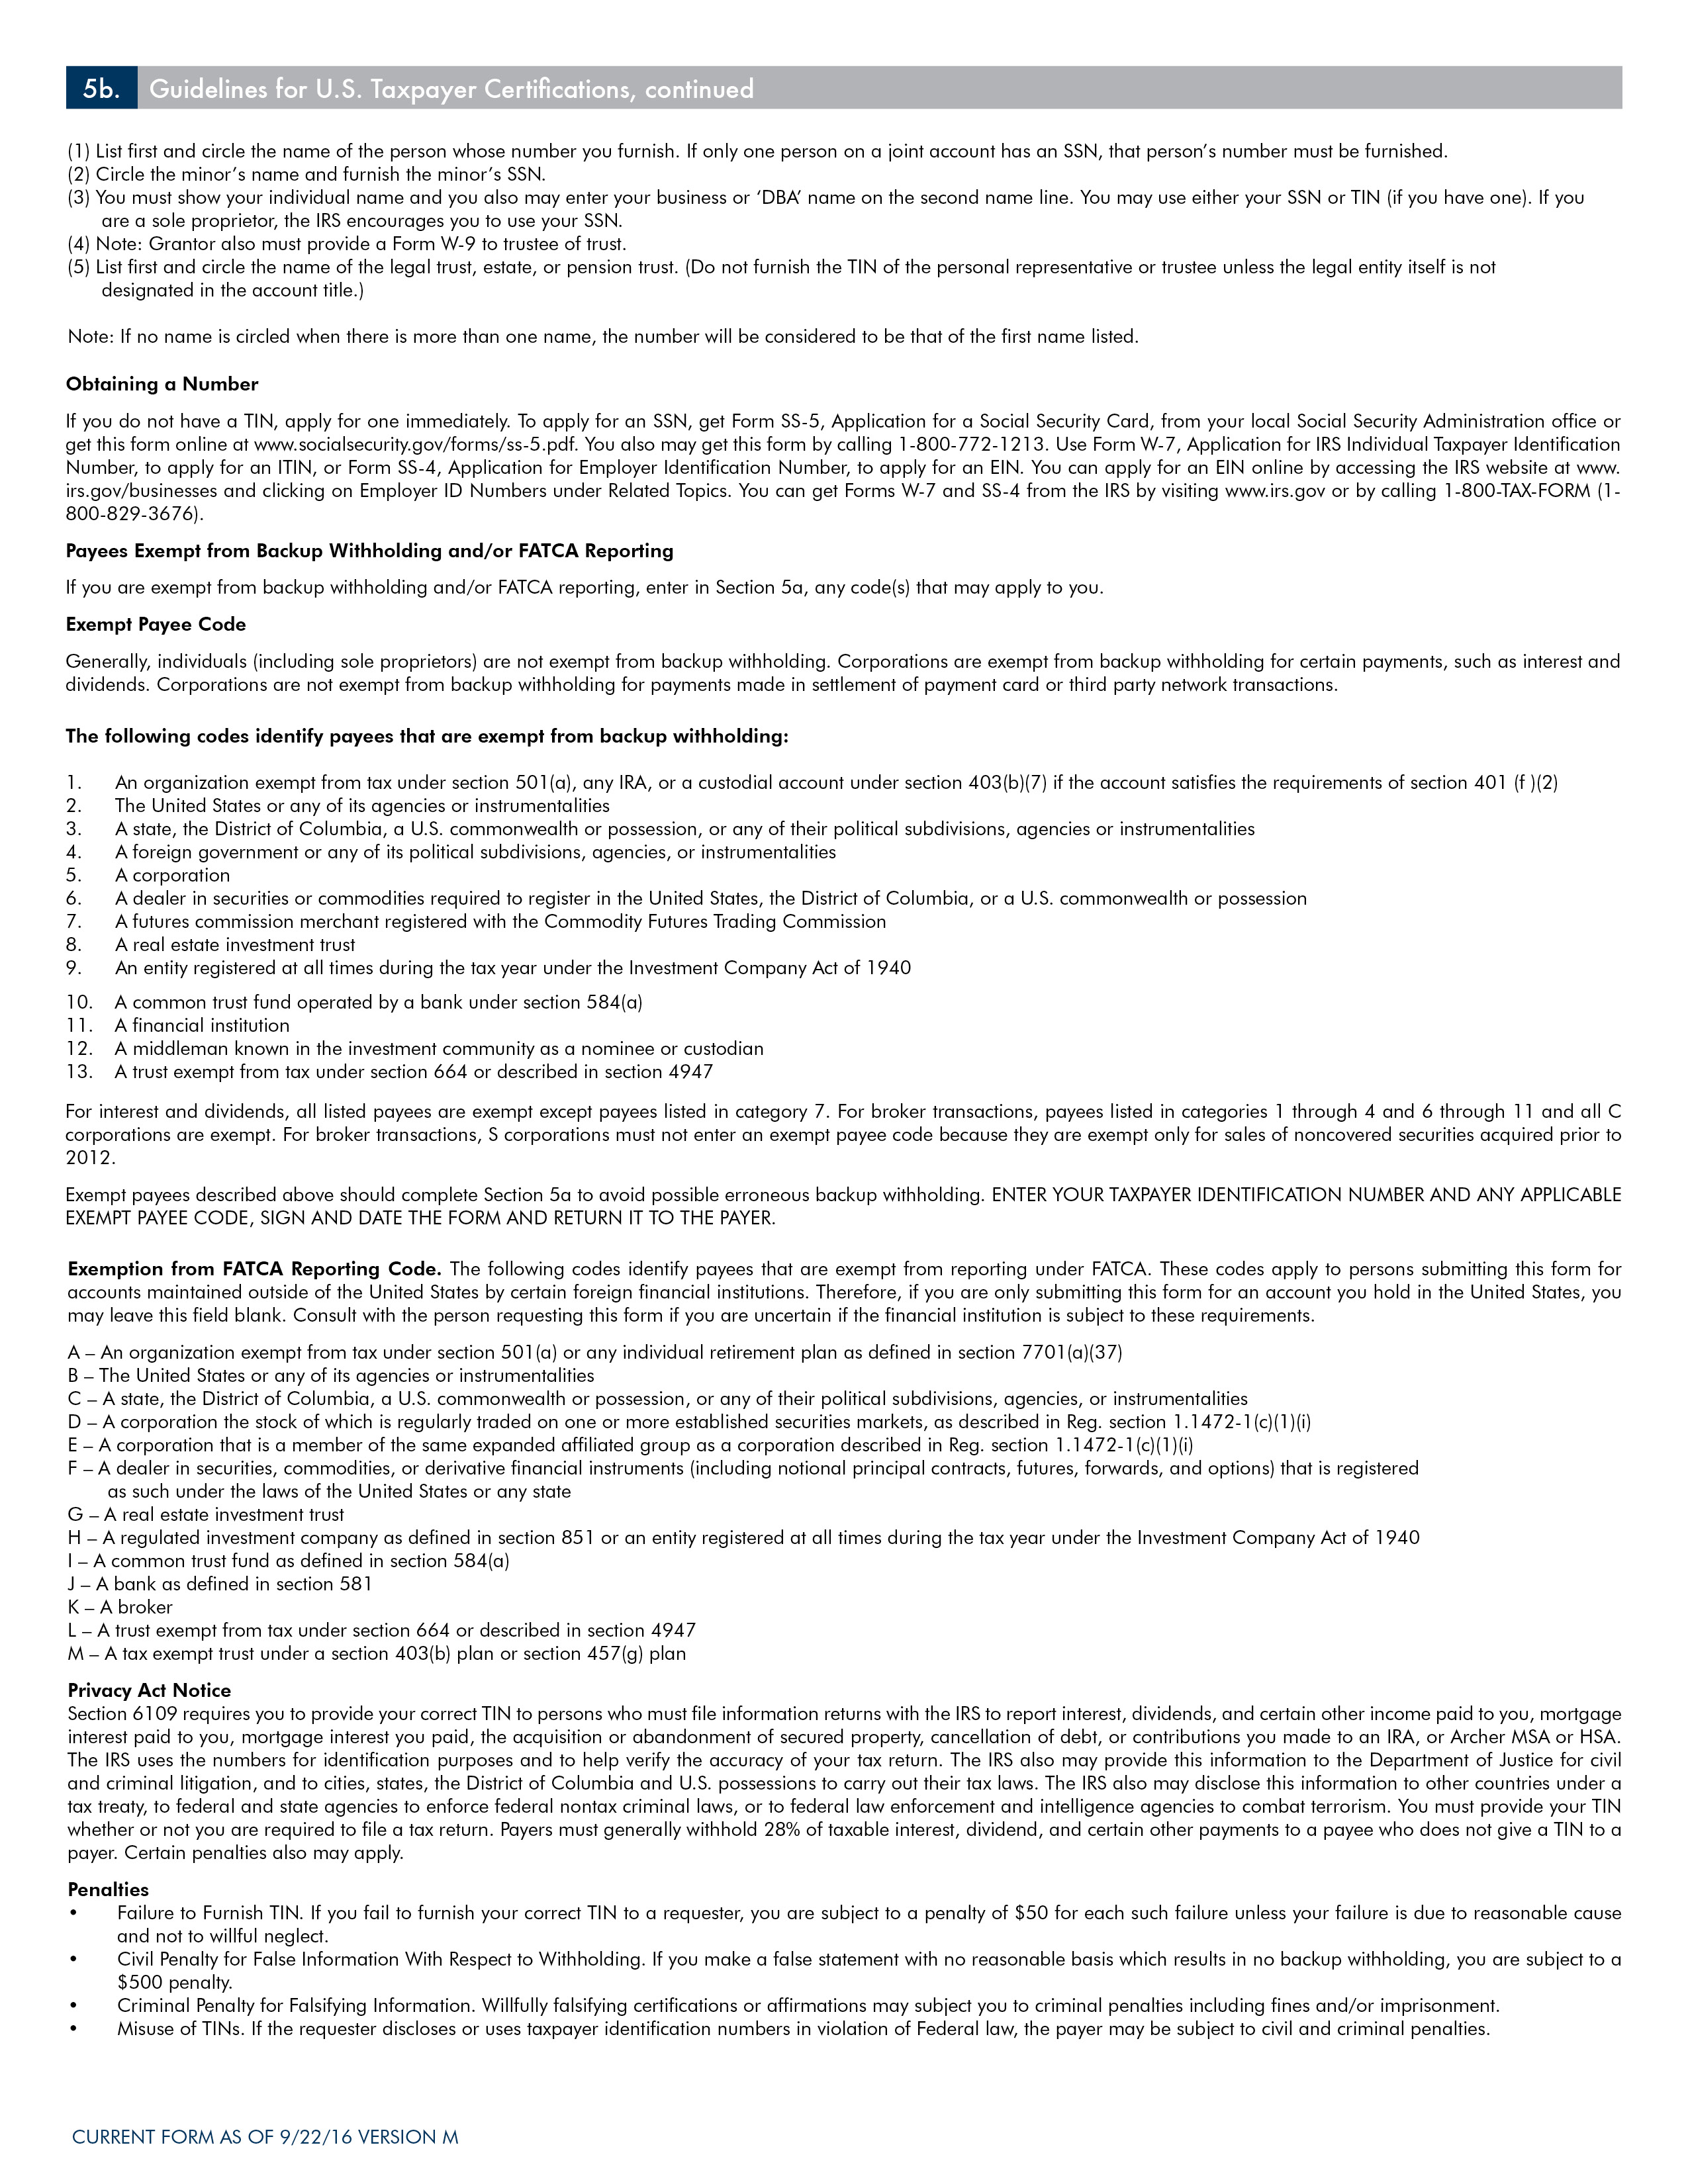
C-5
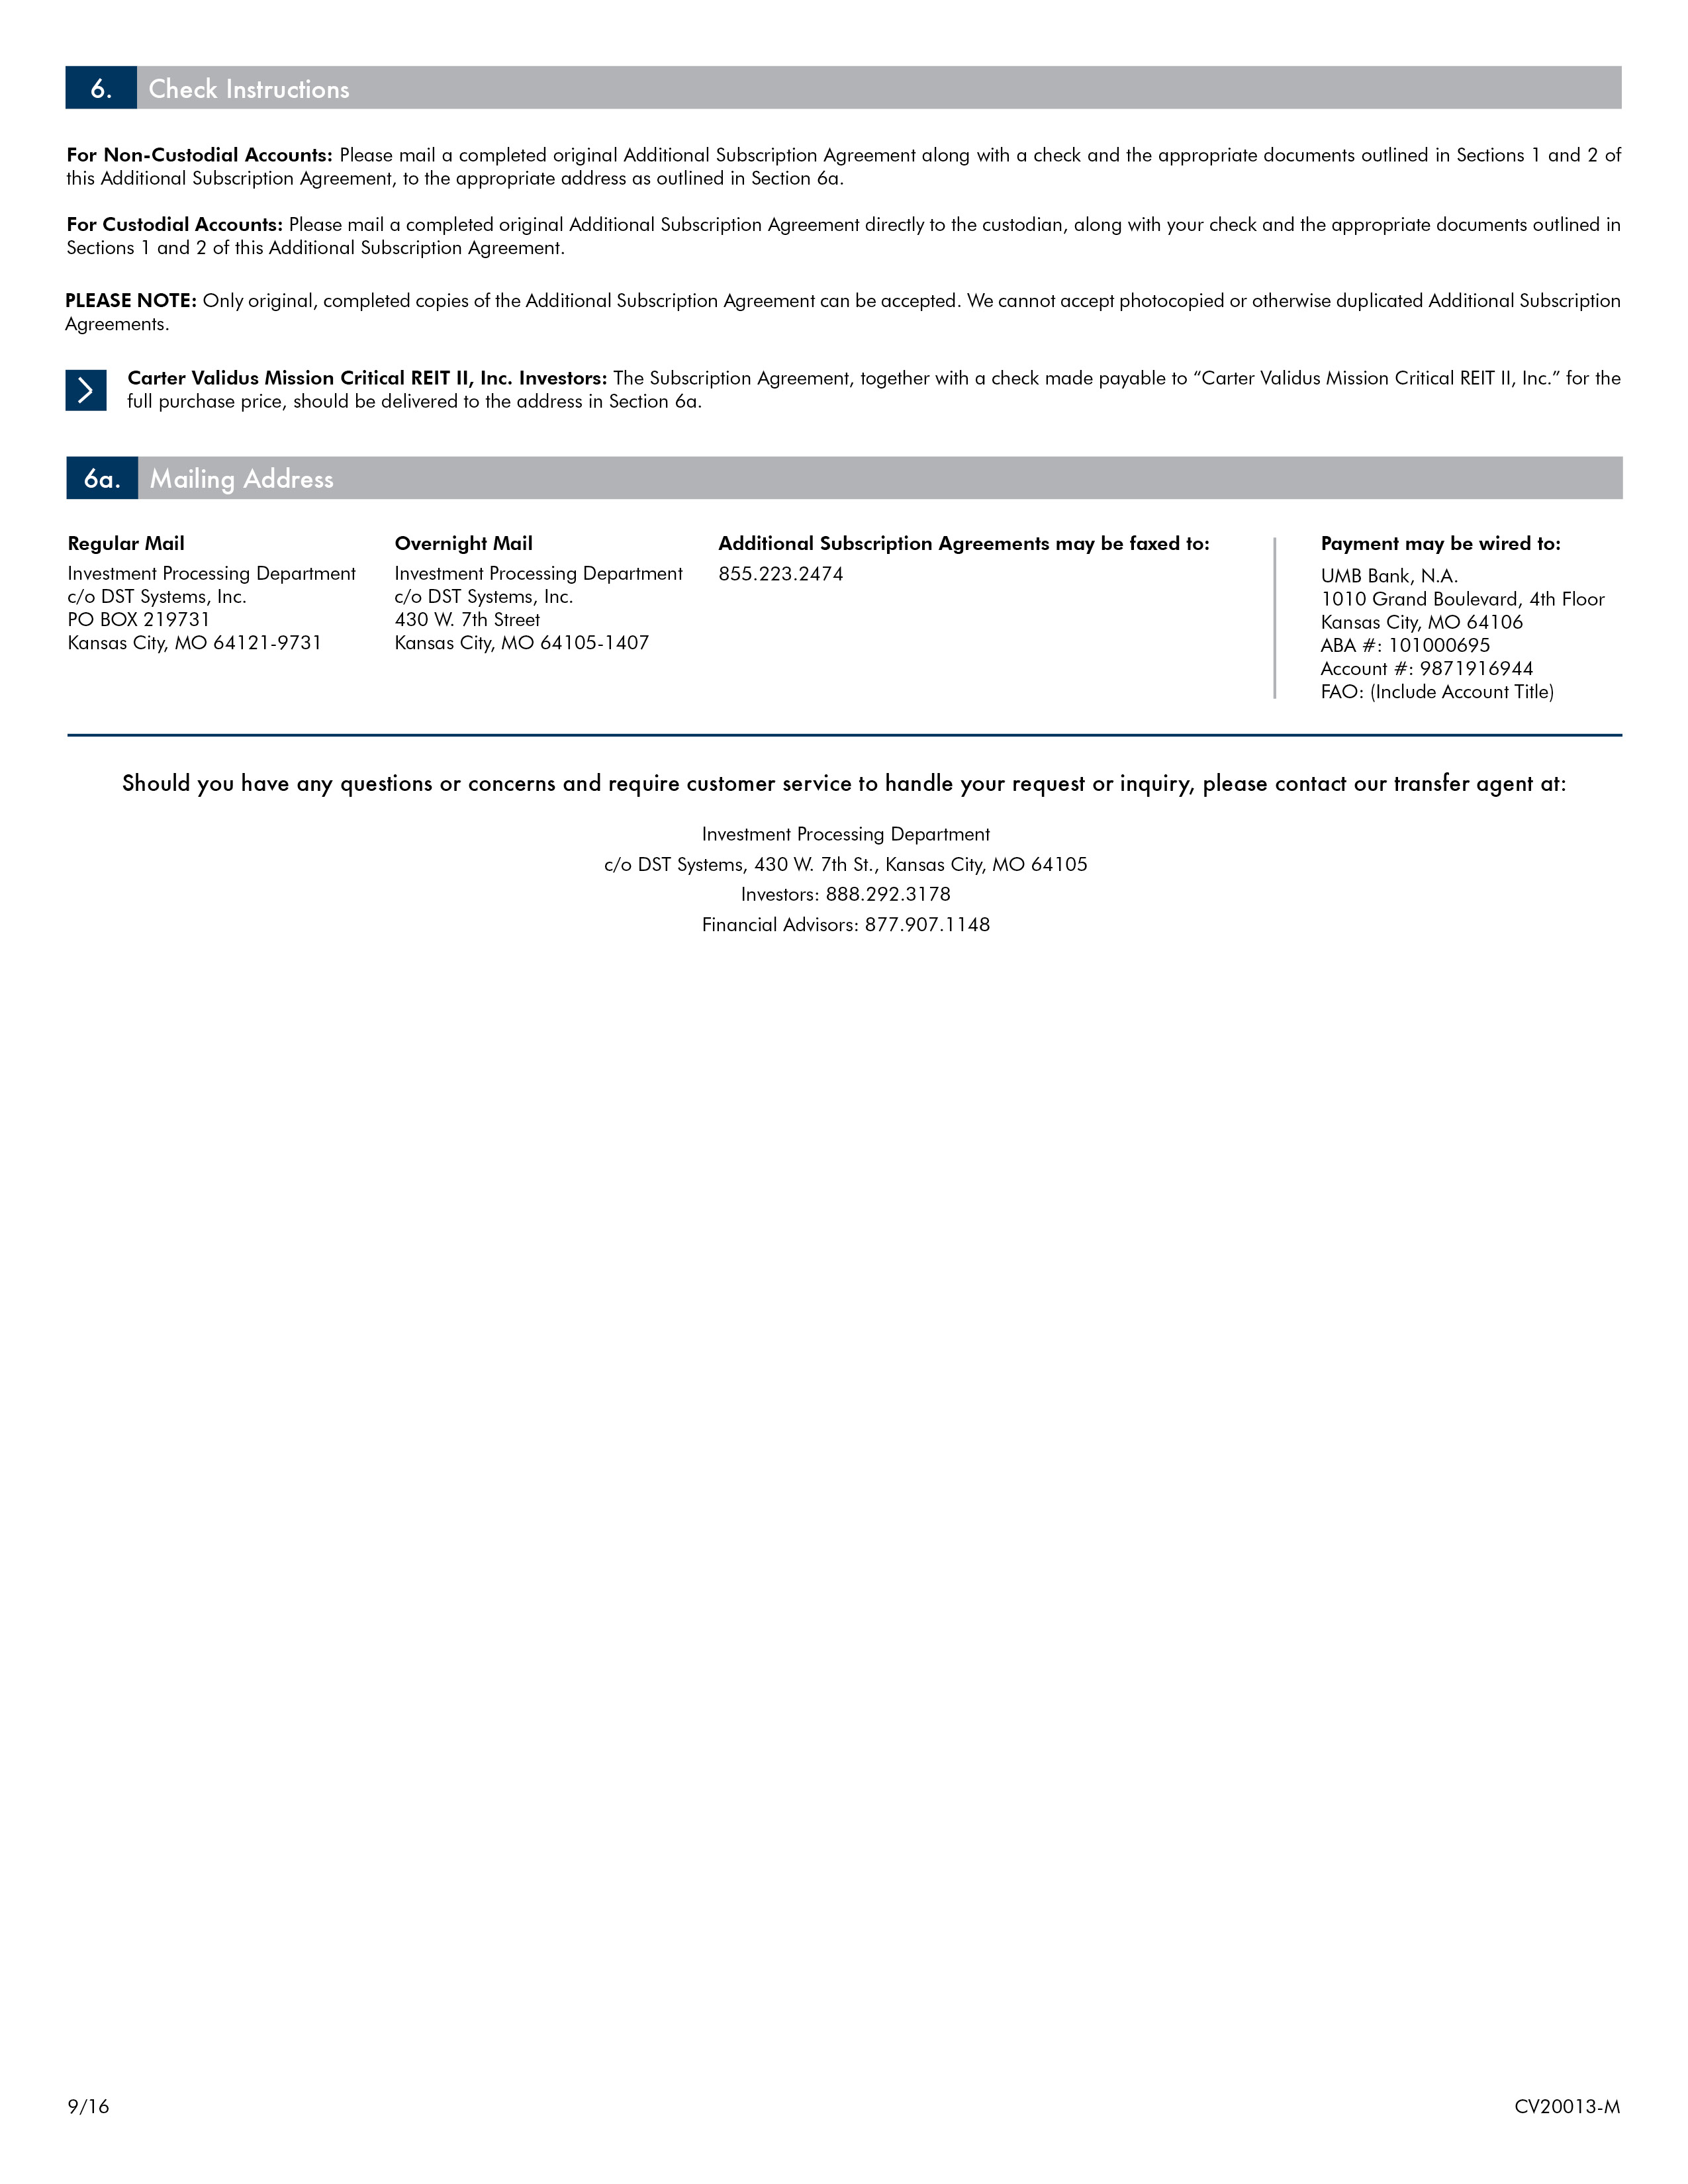
C-6

F-1
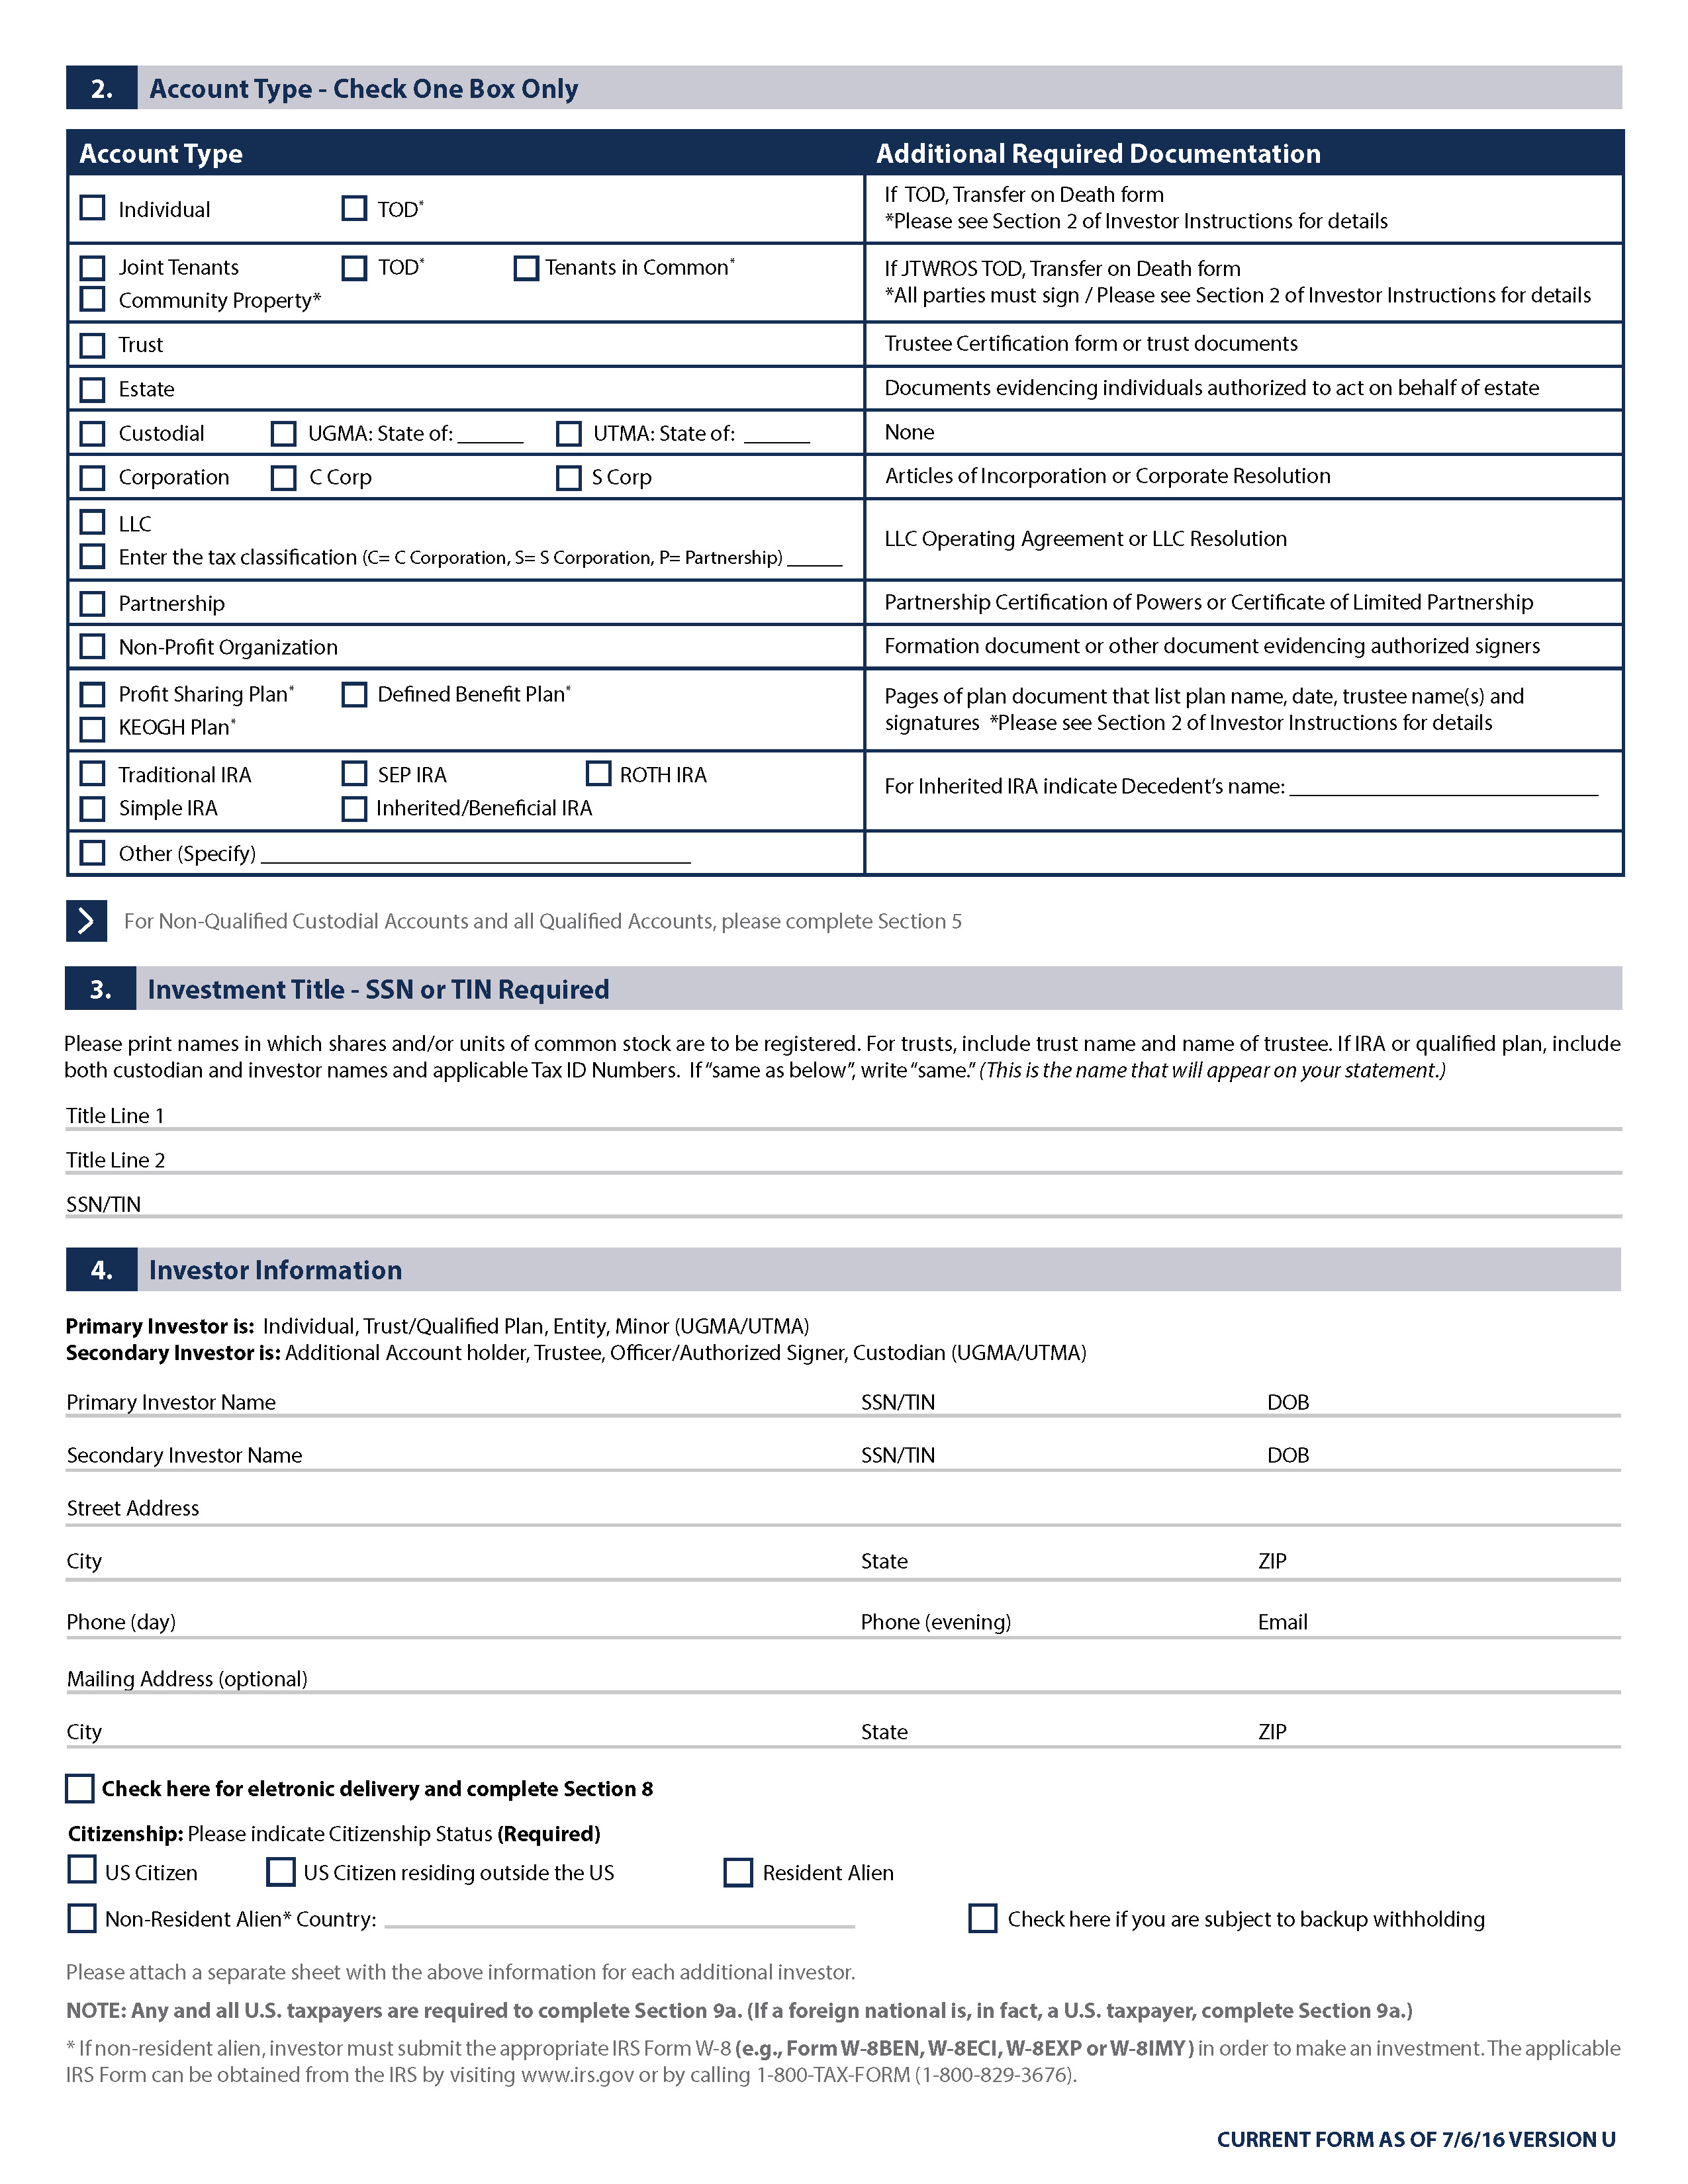
F-2

F-3
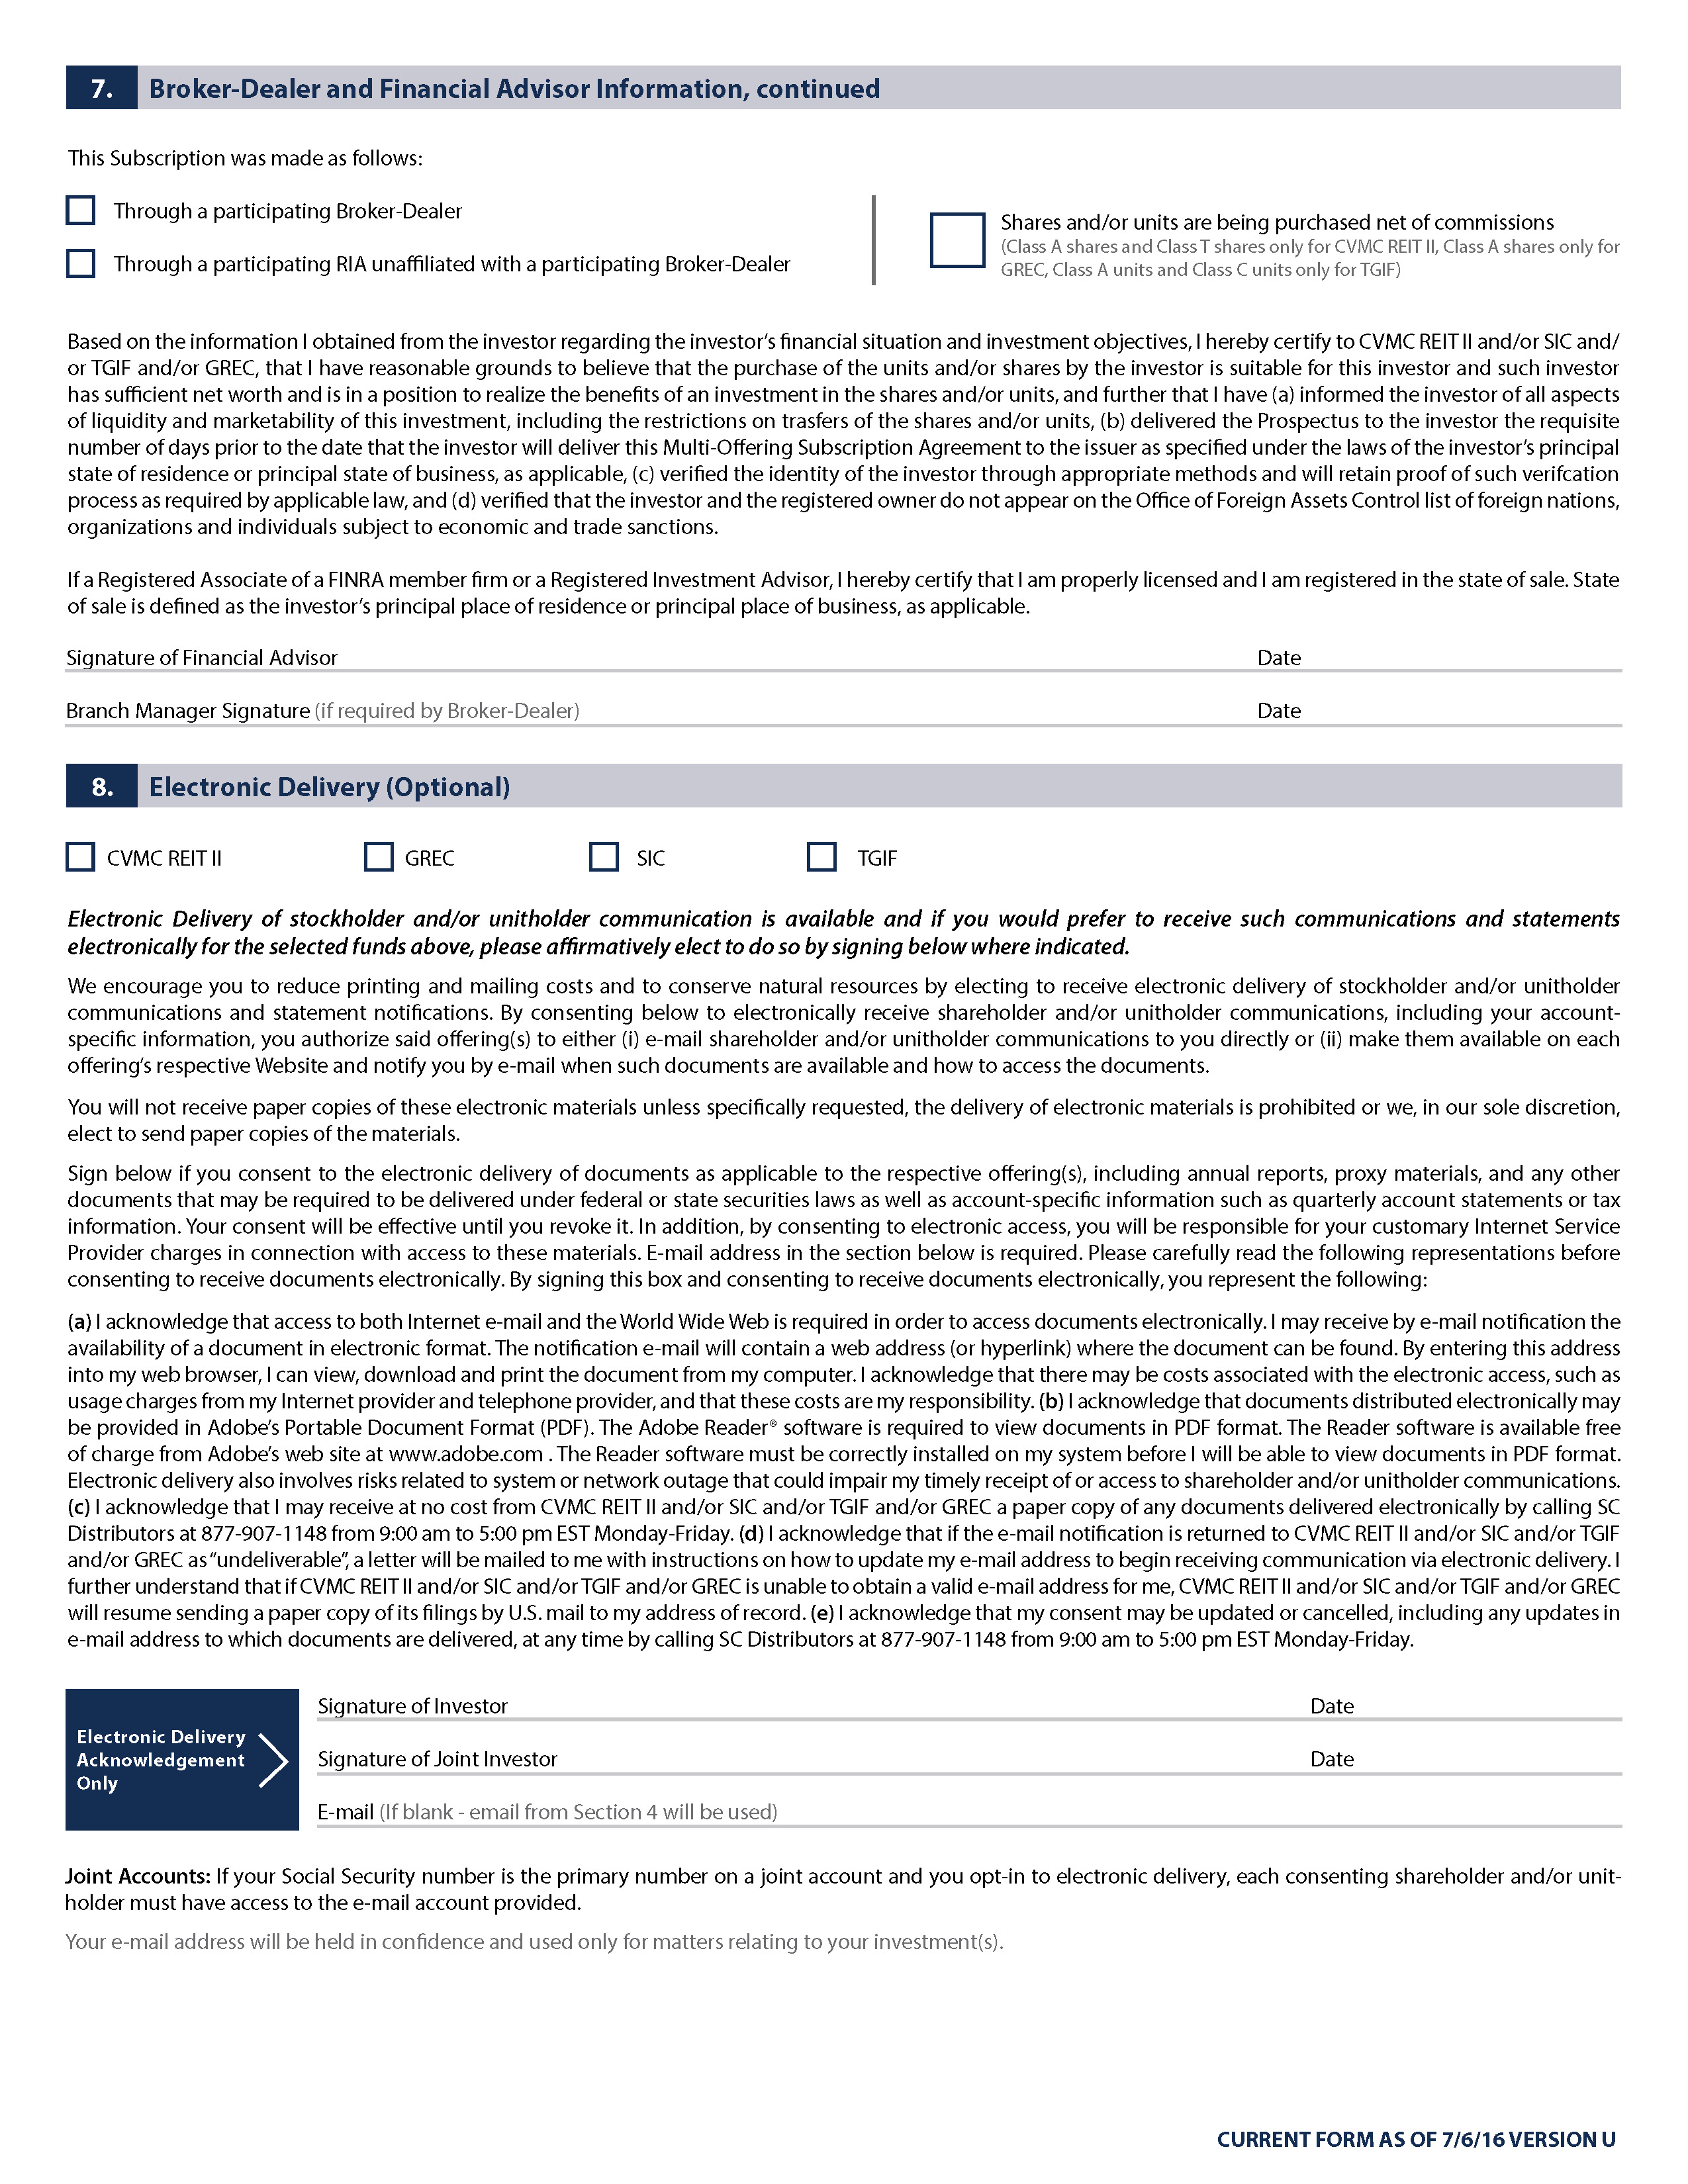
F-4
F-5
F-6
F-7
F-8
F-9
F-10

F-11
F-12
F-13
F-14