
Nareit REITweek Company Presentation June 2023 Tampa Healthcare Facility II, Florida
Disclosures Forward Looking Statements Certain statements contained herein, other than historical fact, may be considered “forward-looking statements” within the meaning of Section 27A of the Securities Act of 1933, as amended, and Section 21E of the Securities Exchange Act of 1934, as amended, and are intended to be covered by the safe harbor provided by the same. These statements are based on management’s current expectations and beliefs and are subject to a number of trends and uncertainties. No forward-looking statement is intended to, nor shall it, serve as a guarantee of future performance. You can identify the forward-looking statements by the use of words such as “anticipate,” “believe,” “continue,” “could,” “estimate,” “expect,” “intend,” “may,” “outlook,” “plan,” “potential,” “predict,” “project,” “seek,” “should,” “will” and other similar terms and phrases. Forward- looking statements are subject to various risks and uncertainties and factors that could cause actual results to differ materially from the company’s expectations, and investors should not rely on forward-looking statements since they involve known and unknown risks, uncertainties and other factors, which are, in some cases, beyond the company’s control and could materially affect the company’s results of operations, financial condition, cash flows, performance or future achievements or events, including those described under the section entitled Part I, Item 1A. “Risk Factors” of the company's 2022 Annual Report on Form 10-K. The company undertakes no obligation to publicly update or revise any forward-looking statement, whether as a result of new information, future events, or otherwise, except as required by law. Non-GAAP Measures This presentation contains certain financial information not derived in accordance with the United States generally accepted accounting principles (GAAP). These items include, but are not limited to, earnings before interest, income taxes, depreciation and amortization (EBITDA), EBITDA for real estate (EBITDAre), funds from operations (FFO), core funds from operations (Core FFO), adjusted funds from operations (AFFO), liquidity, net debt, net operating income (NOI), and cash NOI, as well as ratios derived from the foregoing. These measures (and the methodologies used to derive them) may not be comparable to those used by other companies. Refer to the Appendix for a detailed explanation of these terms and reconciliations to the most directly comparable GAAP measures. Management considers each item an important supplemental measure of operating and financial performance and believes they are frequently used by interested parties in the evaluation of real estate investment trusts. These measures should not be considered as alternatives, or superior measures, to net income or loss as an indicator of the Company's performance and should be considered only as a supplement to net income or loss and cash flows from operating, investing or financing activities as measures of profitability and/or liquidity, computed in accordance with GAAP. Unaudited Financial Information All quarterly information presented in this presentation is unaudited and should be read in conjunction with the Company’s audited consolidated financial statements (and the notes thereto) included in the Annual Report on Form 10-K for the year ended December 31, 2022, as filed with the SEC on March 16, 2023. 2

Introductions Michael A. Seton President & Chief Executive Officer Founder & Board Member Over 13 years at Sila Kay C. Neely Executive Vice President & Chief Financial Officer Over 7 years at Sila Miles F. Callahan Senior Vice President, Capital Markets & Investor Relations Over 9 years at Sila 3

Company Overview Tucson Healthcare Facility IV, Arizona
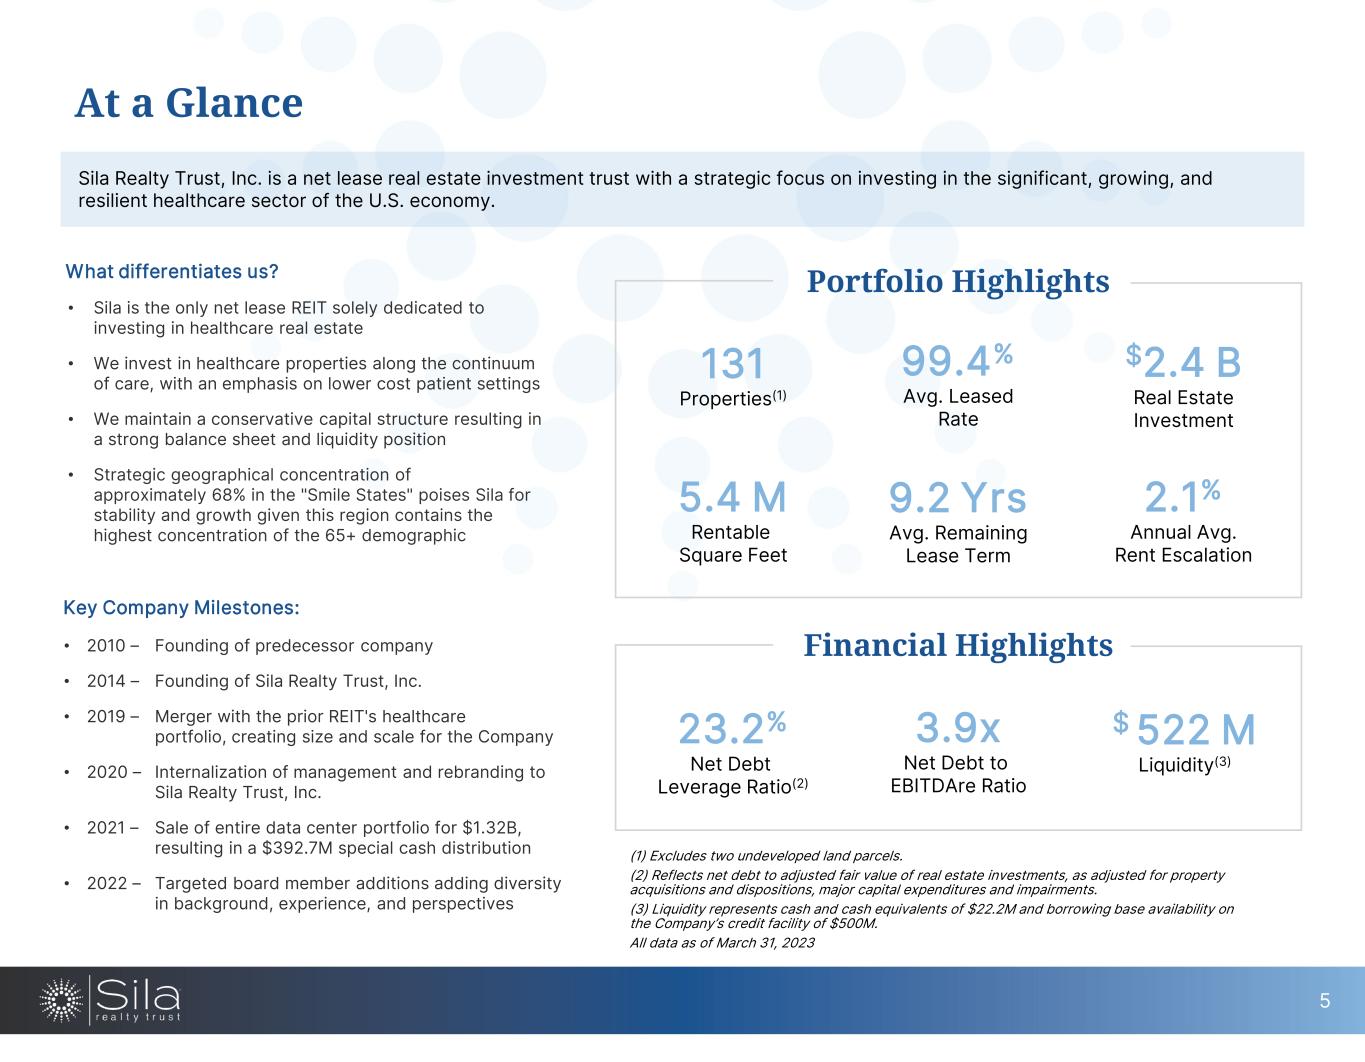
• Sila is the only net lease REIT solely dedicated to investing in healthcare real estate • We invest in healthcare properties along the continuum of care, with an emphasis on lower cost patient settings • We maintain a conservative capital structure resulting in a strong balance sheet and liquidity position • Strategic geographical concentration of approximately 68% in the "Smile States" poises Sila for stability and growth given this region contains the highest concentration of the 65+ demographic Portfolio Highlights Financial Highlights 5.4 M Rentable Square Feet 9.2 Yrs Avg. Remaining Lease Term 2.1% Annual Avg. Rent Escalation 131 Properties(1) 99.4% Avg. Leased Rate $2.4 B Real Estate Investment 23.2% Net Debt Leverage Ratio(2) 3.9x Net Debt to EBITDAre Ratio $ 522 M Liquidity(3) At a Glance Sila Realty Trust, Inc. is a net lease real estate investment trust with a strategic focus on investing in the significant, growing, and resilient healthcare sector of the U.S. economy. (1) Excludes two undeveloped land parcels. (2) Reflects net debt to adjusted fair value of real estate investments, as adjusted for property acquisitions and dispositions, major capital expenditures and impairments. (3) Liquidity represents cash and cash equivalents of $22.2M and borrowing base availability on the Company’s credit facility of $500M. All data as of March 31, 2023 What differentiates us? Key Company Milestones: • 2010 – Founding of predecessor company • 2014 – Founding of Sila Realty Trust, Inc. • 2019 – Merger with the prior REIT's healthcare portfolio, creating size and scale for the Company • 2020 – Internalization of management and rebranding to Sila Realty Trust, Inc. • 2021 – Sale of entire data center portfolio for $1.32B, resulting in a $392.7M special cash distribution • 2022 – Targeted board member additions adding diversity in background, experience, and perspectives 5
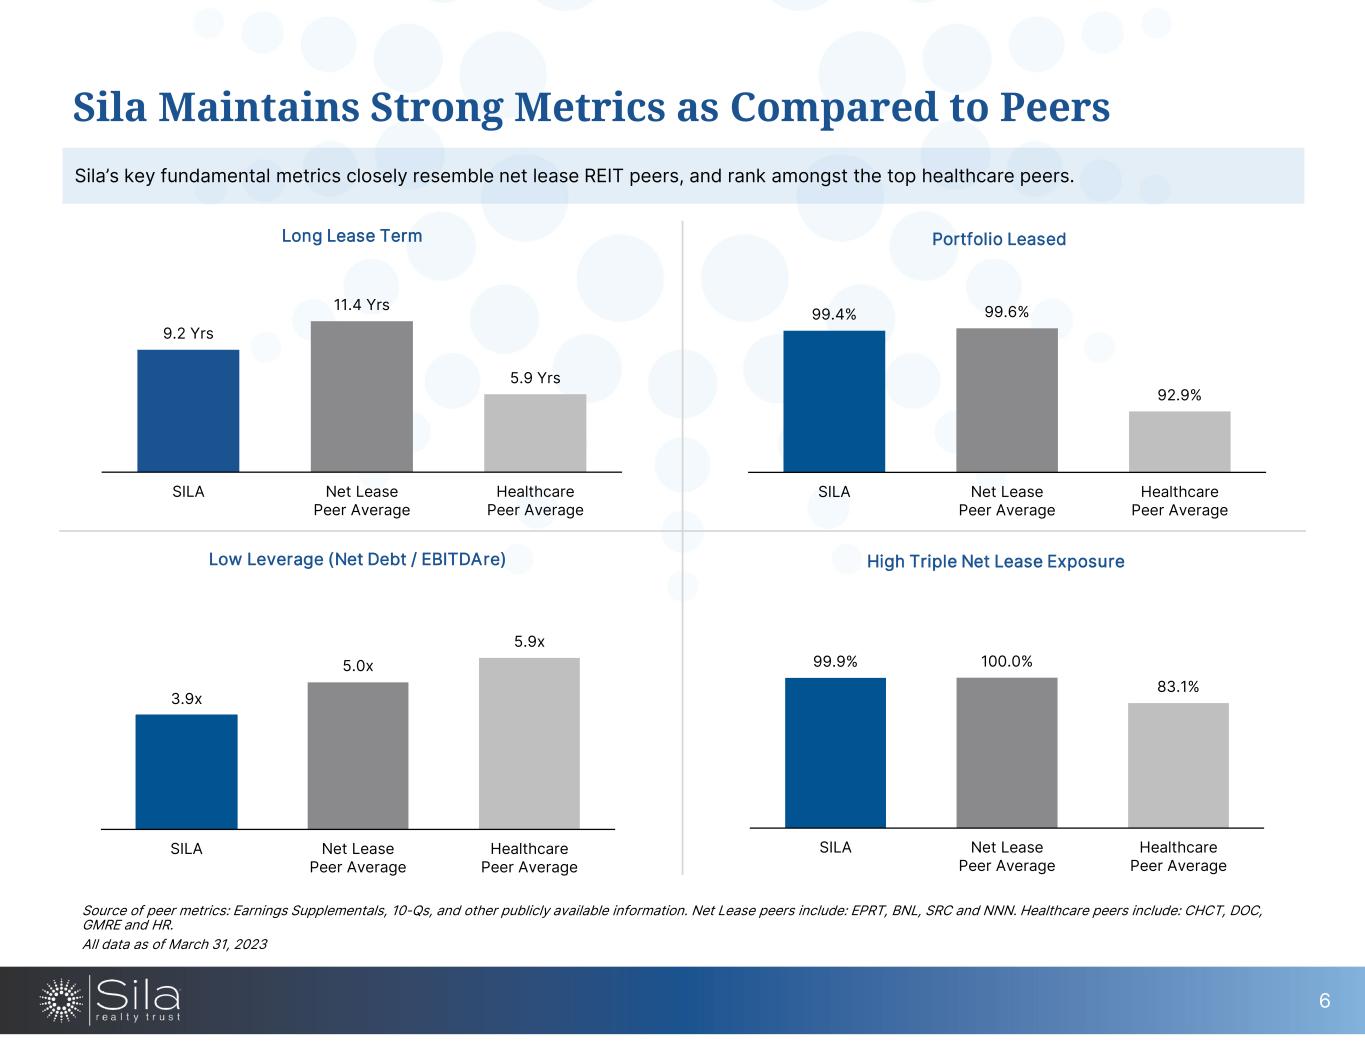
9.2 Yrs 11.4 Yrs 5.9 Yrs SILA Net Lease Peer Average Healthcare Peer Average Long Lease Term 99.4% 99.6% 92.9% SILA Net Lease Peer Average Healthcare Peer Average Portfolio Leased 3.9x 5.0x 5.9x SILA Net Lease Peer Average Healthcare Peer Average Low Leverage (Net Debt / EBITDAre) 99.9% 100.0% 83.1% SILA Net Lease Peer Average Healthcare Peer Average High Triple Net Lease Exposure Sila Maintains Strong Metrics as Compared to Peers Sila’s key fundamental metrics closely resemble net lease REIT peers, and rank amongst the top healthcare peers. Source of peer metrics: Earnings Supplementals, 10-Qs, and other publicly available information. Net Lease peers include: EPRT, BNL, SRC and NNN. Healthcare peers include: CHCT, DOC, GMRE and HR. All data as of March 31, 2023 6
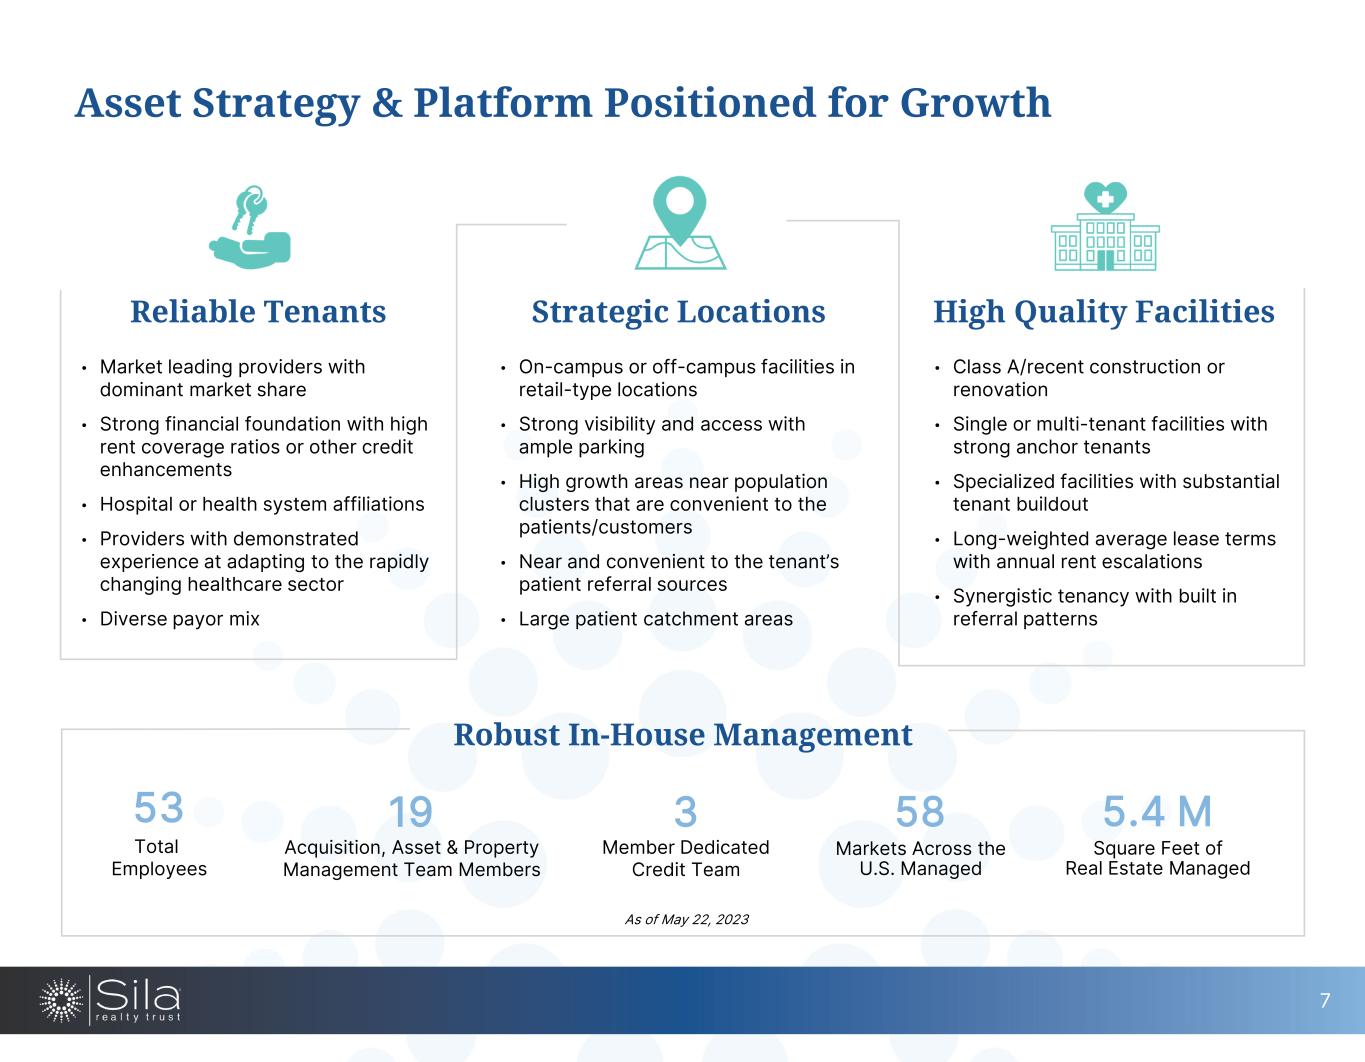
• On-campus or off-campus facilities in retail-type locations • Strong visibility and access with ample parking • High growth areas near population clusters that are convenient to the patients/customers • Near and convenient to the tenant’s patient referral sources • Large patient catchment areas • Class A/recent construction or renovation • Single or multi-tenant facilities with strong anchor tenants • Specialized facilities with substantial tenant buildout • Long-weighted average lease terms with annual rent escalations • Synergistic tenancy with built in referral patterns Asset Strategy & Platform Positioned for Growth • Market leading providers with dominant market share • Strong financial foundation with high rent coverage ratios or other credit enhancements • Hospital or health system affiliations • Providers with demonstrated experience at adapting to the rapidly changing healthcare sector • Diverse payor mix Robust In-House Management 19 Acquisition, Asset & Property Management Team Members 53 Total Employees 5.4 M Square Feet of Real Estate Managed Reliable Tenants Strategic Locations High Quality Facilities 58 Markets Across the U.S. Managed As of May 22, 2023 7 3 Member Dedicated Credit Team
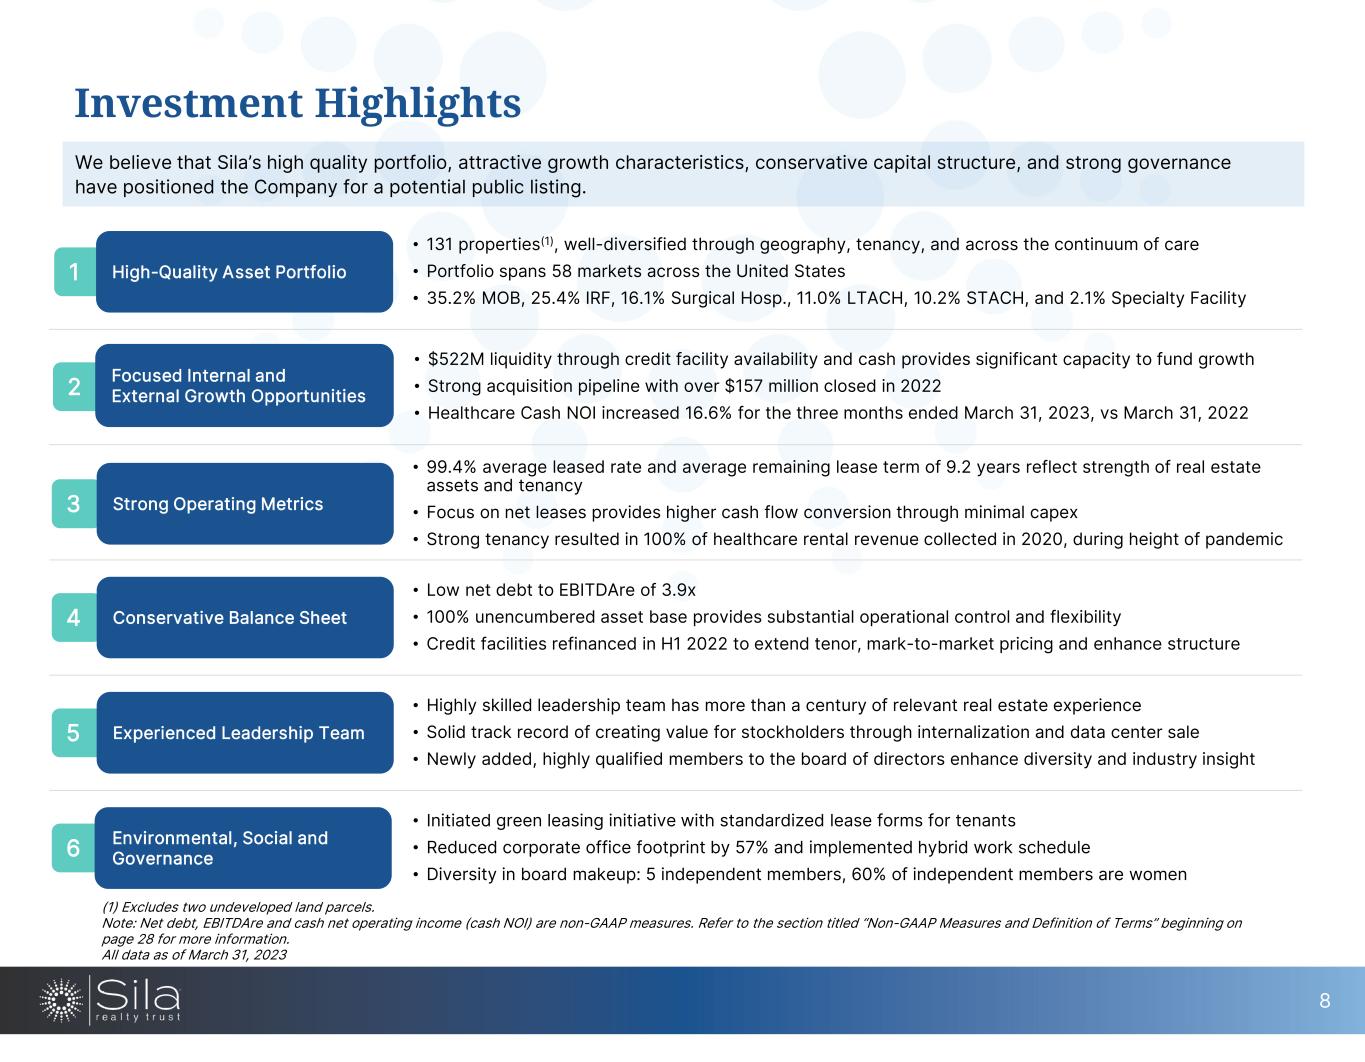
Investment Highlights We believe that Sila’s high quality portfolio, attractive growth characteristics, conservative capital structure, and strong governance have positioned the Company for a potential public listing. 1 High-Quality Asset Portfolio • 131 properties(1), well-diversified through geography, tenancy, and across the continuum of care • Portfolio spans 58 markets across the United States • 35.2% MOB, 25.4% IRF, 16.1% Surgical Hosp., 11.0% LTACH, 10.2% STACH, and 2.1% Specialty Facility 3 Strong Operating Metrics • 99.4% average leased rate and average remaining lease term of 9.2 years reflect strength of real estate assets and tenancy • Focus on net leases provides higher cash flow conversion through minimal capex • Strong tenancy resulted in 100% of healthcare rental revenue collected in 2020, during height of pandemic 2 Focused Internal and External Growth Opportunities • $522M liquidity through credit facility availability and cash provides significant capacity to fund growth • Strong acquisition pipeline with over $157 million closed in 2022 • Healthcare Cash NOI increased 16.6% for the three months ended March 31, 2023, vs March 31, 2022 4 Conservative Balance Sheet • Low net debt to EBITDAre of 3.9x • 100% unencumbered asset base provides substantial operational control and flexibility • Credit facilities refinanced in H1 2022 to extend tenor, mark-to-market pricing and enhance structure 5 Experienced Leadership Team • Highly skilled leadership team has more than a century of relevant real estate experience • Solid track record of creating value for stockholders through internalization and data center sale • Newly added, highly qualified members to the board of directors enhance diversity and industry insight 6 Environmental, Social and Governance • Initiated green leasing initiative with standardized lease forms for tenants • Reduced corporate office footprint by 57% and implemented hybrid work schedule • Diversity in board makeup: 5 independent members, 60% of independent members are women (1) Excludes two undeveloped land parcels. Note: Net debt, EBITDAre and cash net operating income (cash NOI) are non-GAAP measures. Refer to the section titled “Non-GAAP Measures and Definition of Terms” beginning on page 28 for more information. All data as of March 31, 2023 8

Portfolio Escondido Healthcare Facility, California 1
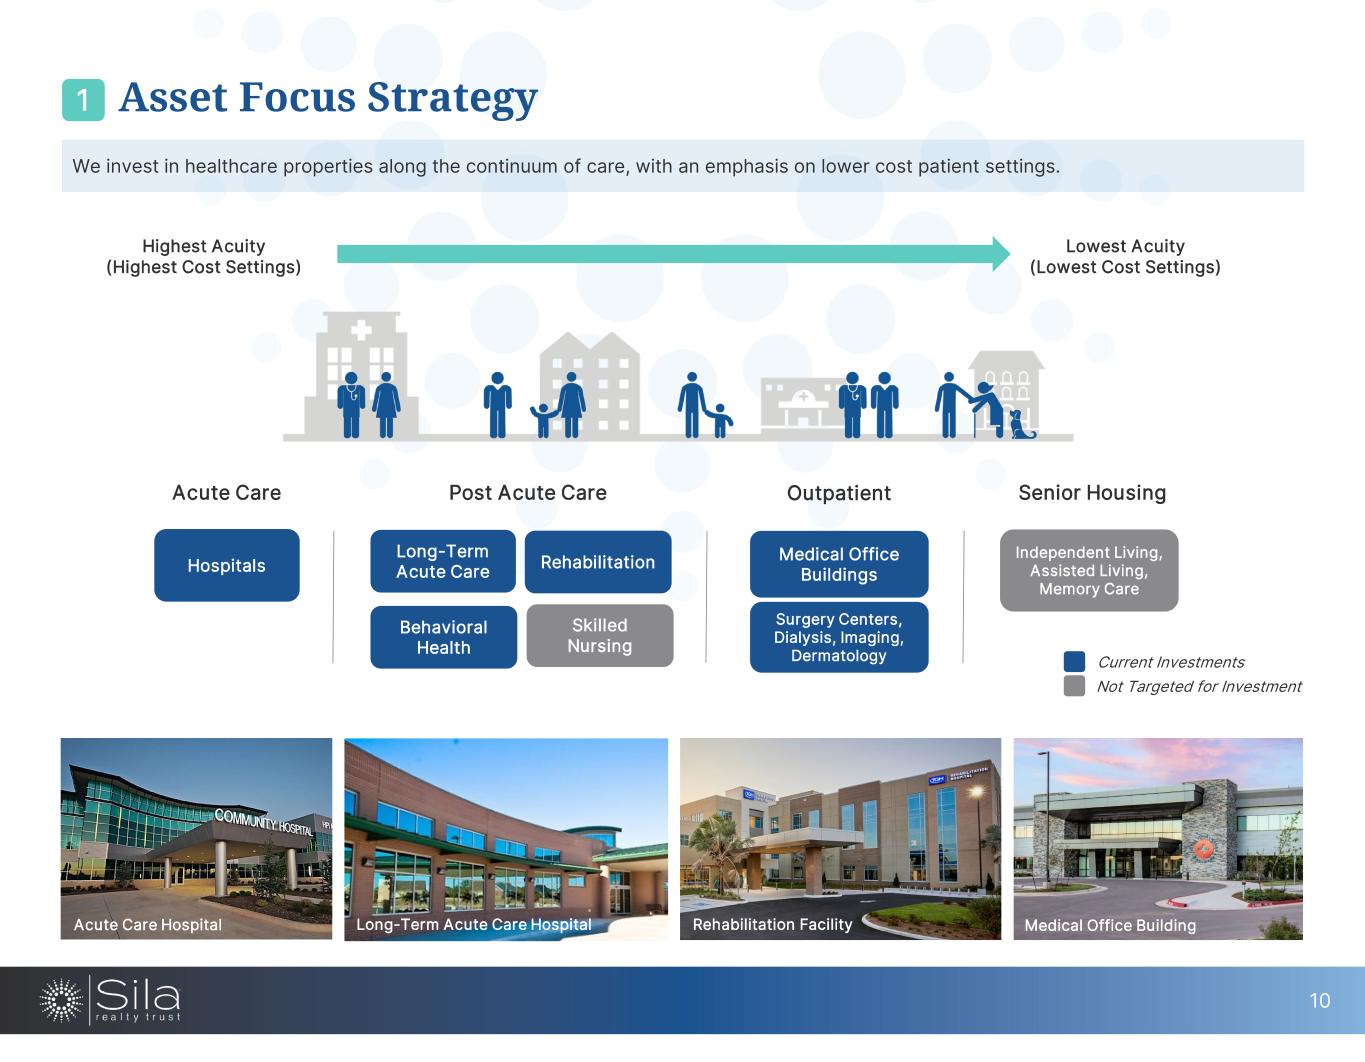
10 We invest in healthcare properties along the continuum of care, with an emphasis on lower cost patient settings. Highest Acuity (Highest Cost Settings) Lowest Acuity (Lowest Cost Settings) Hospitals Acute Care Post Acute Care Outpatient Senior Housing Long-Term Acute Care Rehabilitation Behavioral Health Skilled Nursing Medical Office Buildings Surgery Centers, Dialysis, Imaging, Dermatology Independent Living, Assisted Living, Memory Care Current Investments Not Targeted for Investment Acute Care Hospital Long-Term Acute Care Hospital Medical Office BuildingRehabilitation Facility Asset Focus Strategy1
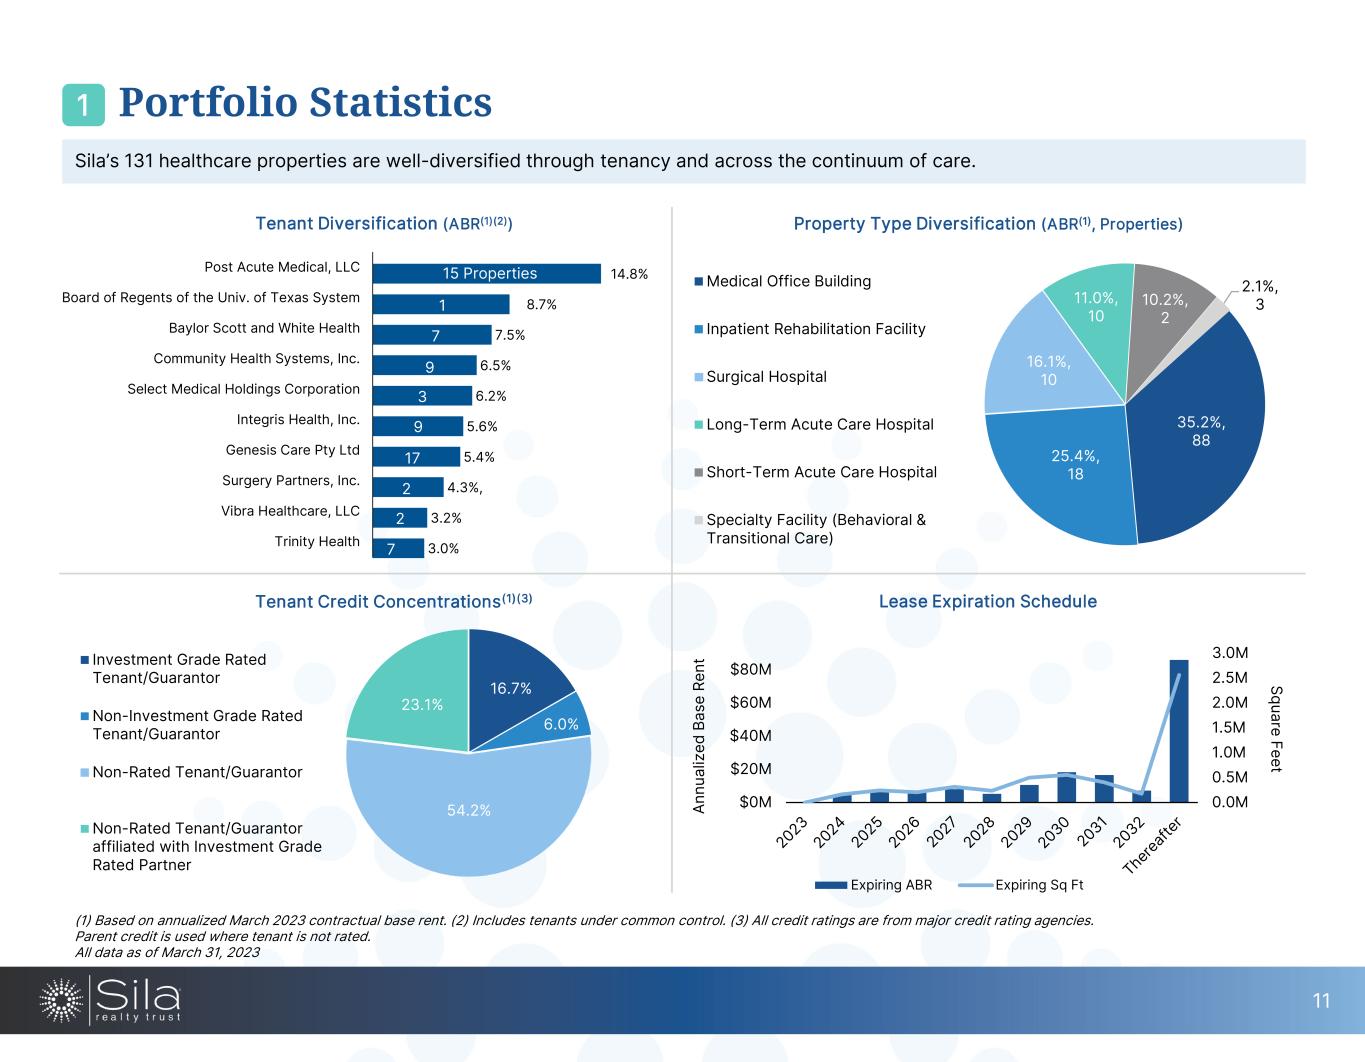
11 Property Type Diversification (ABR(1), Properties) 35.2%, 88 25.4%, 18 16.1%, 10 11.0%, 10 10.2%, 2 2.1%, 3 Medical Office Building Inpatient Rehabilitation Facility Surgical Hospital Long-Term Acute Care Hospital Short-Term Acute Care Hospital Specialty Facility (Behavioral & Transitional Care) Tenant Diversification (ABR(1)(2)) Lease Expiration Schedule 0.0M 0.5M 1.0M 1.5M 2.0M 2.5M 3.0M $0M $20M $40M $60M $80M Square Feet An nu al iz ed B as e Re nt Expiring ABR Expiring Sq Ft 16.7% 6.0% 54.2% 23.1% Investment Grade Rated Tenant/Guarantor Non-Investment Grade Rated Tenant/Guarantor Non-Rated Tenant/Guarantor Non-Rated Tenant/Guarantor affiliated with Investment Grade Rated Partner Tenant Credit Concentrations(1)(3) (1) Based on annualized March 2023 contractual base rent. (2) Includes tenants under common control. (3) All credit ratings are from major credit rating agencies. Parent credit is used where tenant is not rated. All data as of March 31, 2023 3.0% 3.2% 4.3%, 5.4% 5.6% 6.2% 6.5% 7.5% 8.7% 14.8% Trinity Health Vibra Healthcare, LLC Surgery Partners, Inc. Genesis Care Pty Ltd Integris Health, Inc. Select Medical Holdings Corporation Community Health Systems, Inc. Baylor Scott and White Health Board of Regents of the Univ. of Texas System Post Acute Medical, LLC 15 Properties 1 7 9 3 9 17 2 2 7 11 1 Portfolio Statistics Sila’s 131 healthcare properties are well-diversified through tenancy and across the continuum of care.
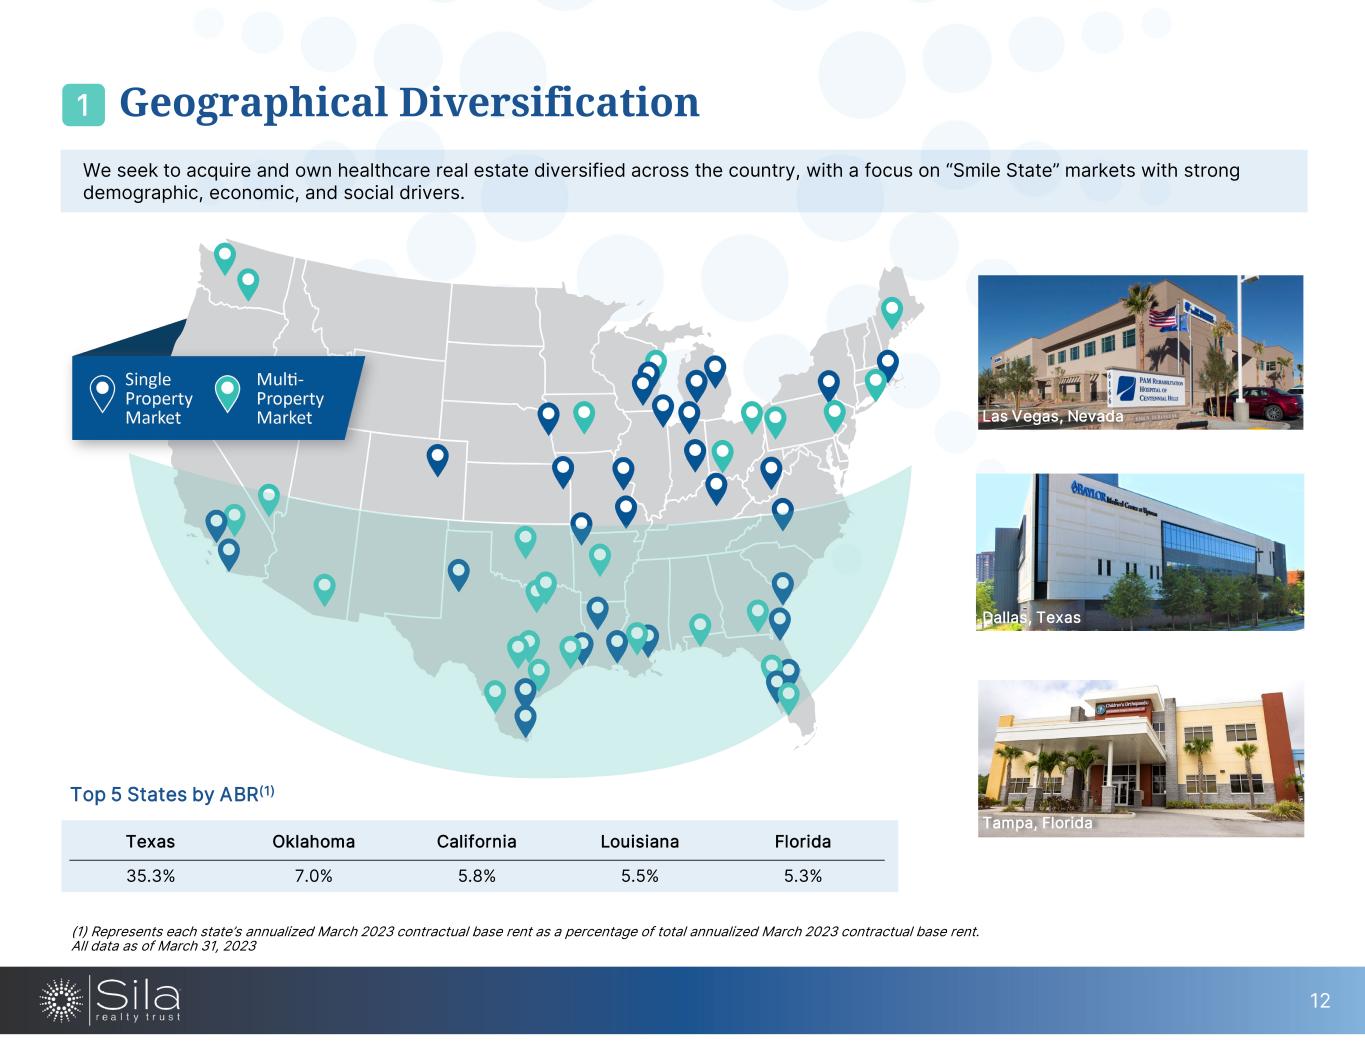
12 We seek to acquire and own healthcare real estate diversified across the country, with a focus on “Smile State” markets with strong demographic, economic, and social drivers. 1 (1) Represents each state’s annualized March 2023 contractual base rent as a percentage of total annualized March 2023 contractual base rent. All data as of March 31, 2023 Geographical Diversification Texas Oklahoma California Louisiana Florida 35.3% 7.0% 5.8% 5.5% 5.3% Las Vegas, Nevada Dallas, Texas Tampa, Florida Top 5 States by ABR(1)

Growth Opportunities Webster Healthcare Facility II, Texas 2
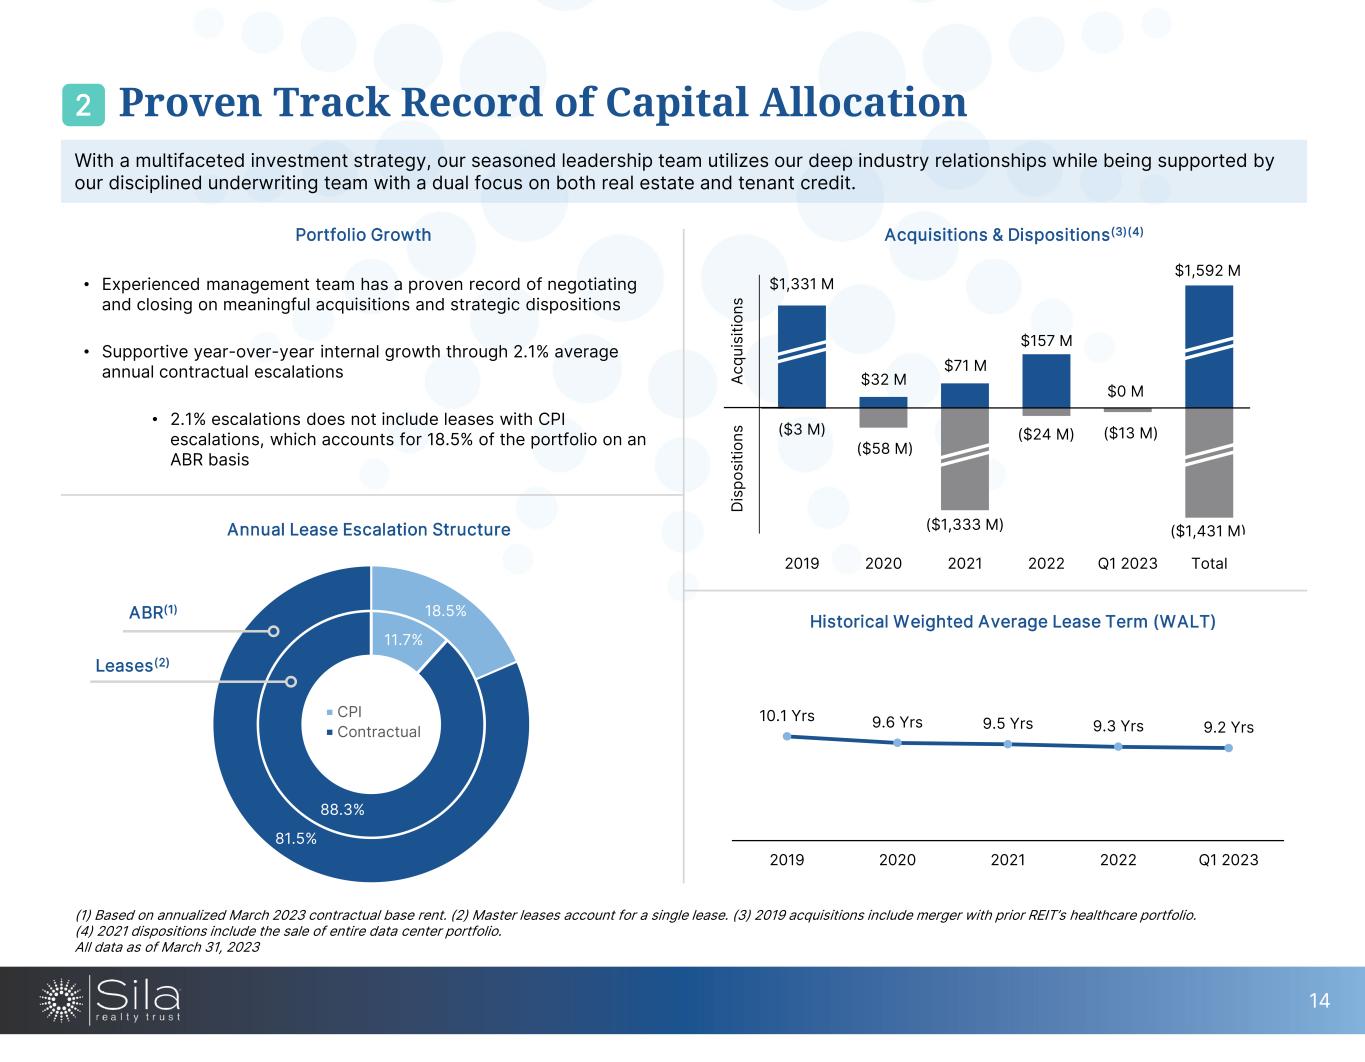
Annual Lease Escalation Structure Historical Weighted Average Lease Term (WALT) 11.7% 88.3% 18.5% 81.5% CPI Contractual ABR(1) Leases(2) 10.1 Yrs 9.6 Yrs 9.5 Yrs 9.3 Yrs 9.2 Yrs 2019 2020 2021 2022 Q1 2023 • Experienced management team has a proven record of negotiating and closing on meaningful acquisitions and strategic dispositions • Supportive year-over-year internal growth through 2.1% average annual contractual escalations • 2.1% escalations does not include leases with CPI escalations, which accounts for 18.5% of the portfolio on an ABR basis Portfolio Growth With a multifaceted investment strategy, our seasoned leadership team utilizes our deep industry relationships while being supported by our disciplined underwriting team with a dual focus on both real estate and tenant credit. $1,331 M $32 M $71 M $157 M $0 M $1,592 M ($3 M) ($58 M) ($1,333 M) ($24 M) ($13 M) ($1,431 M) 2019 2020 2021 2022 Q1 2023 Total Acquisitions & Dispositions(3)(4) (1) Based on annualized March 2023 contractual base rent. (2) Master leases account for a single lease. (3) 2019 acquisitions include merger with prior REIT’s healthcare portfolio. (4) 2021 dispositions include the sale of entire data center portfolio. All data as of March 31, 2023 14 2 Proven Track Record of Capital Allocation Ac qu is iti on s D is po si tio ns
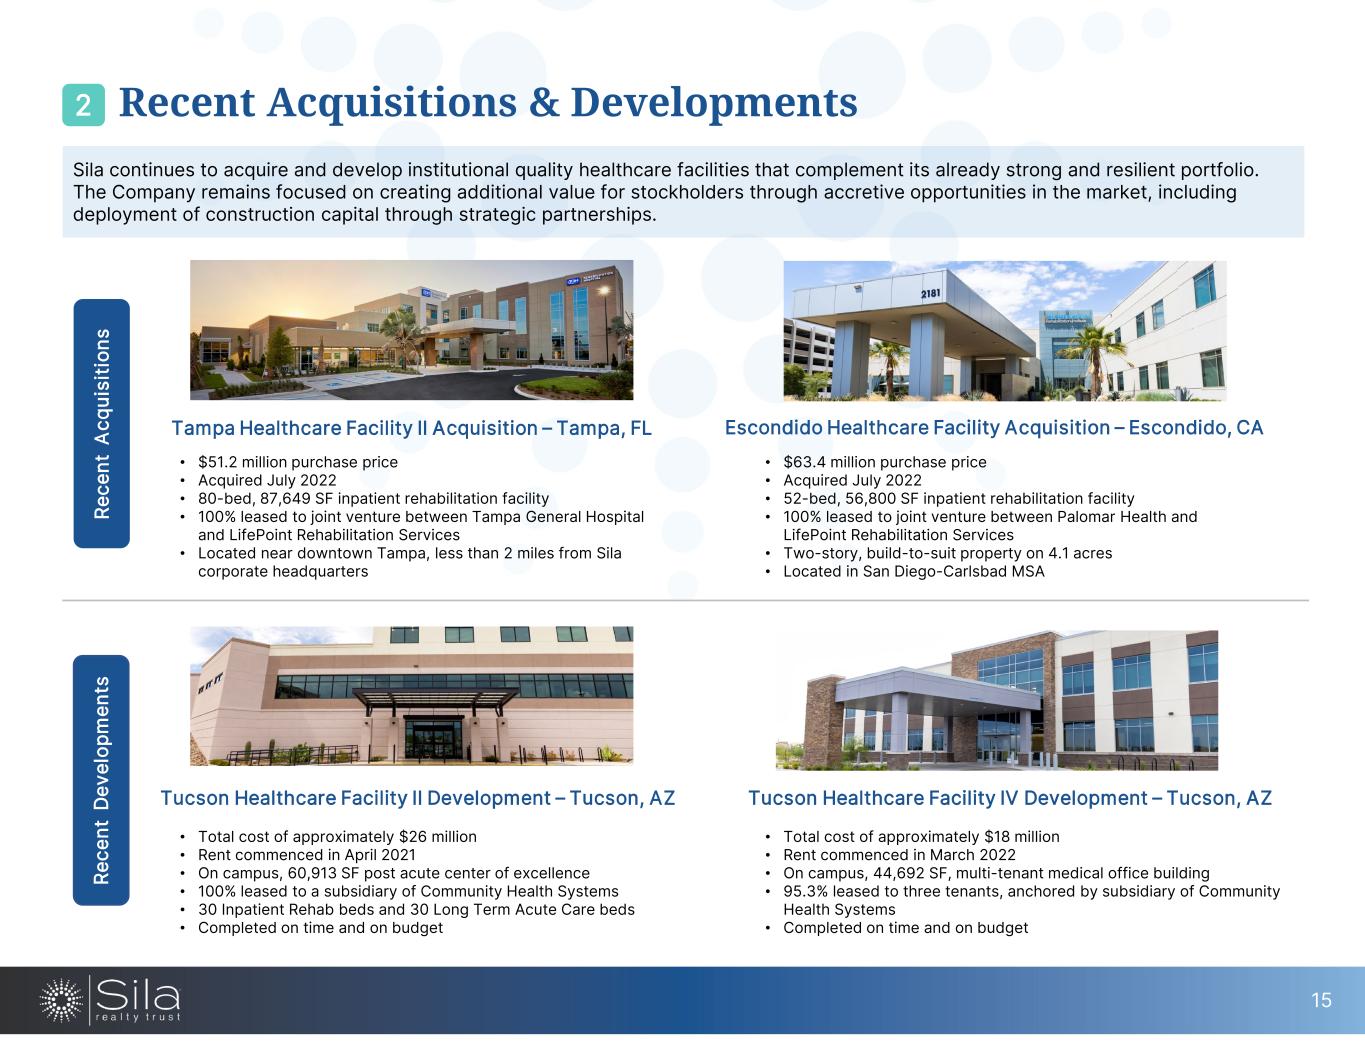
Sila continues to acquire and develop institutional quality healthcare facilities that complement its already strong and resilient portfolio. The Company remains focused on creating additional value for stockholders through accretive opportunities in the market, including deployment of construction capital through strategic partnerships. Tampa Healthcare Facility II Acquisition – Tampa, FL • $51.2 million purchase price • Acquired July 2022 • 80-bed, 87,649 SF inpatient rehabilitation facility • 100% leased to joint venture between Tampa General Hospital and LifePoint Rehabilitation Services • Located near downtown Tampa, less than 2 miles from Sila corporate headquarters Escondido Healthcare Facility Acquisition – Escondido, CA • $63.4 million purchase price • Acquired July 2022 • 52-bed, 56,800 SF inpatient rehabilitation facility • 100% leased to joint venture between Palomar Health and LifePoint Rehabilitation Services • Two-story, build-to-suit property on 4.1 acres • Located in San Diego-Carlsbad MSA Tucson Healthcare Facility II Development – Tucson, AZ • Total cost of approximately $26 million • Rent commenced in April 2021 • On campus, 60,913 SF post acute center of excellence • 100% leased to a subsidiary of Community Health Systems • 30 Inpatient Rehab beds and 30 Long Term Acute Care beds • Completed on time and on budget Tucson Healthcare Facility IV Development – Tucson, AZ • Total cost of approximately $18 million • Rent commenced in March 2022 • On campus, 44,692 SF, multi-tenant medical office building • 95.3% leased to three tenants, anchored by subsidiary of Community Health Systems • Completed on time and on budget 15 2 Recent Acquisitions & Developments Re ce nt A cq ui si tio ns Re ce nt D ev el op m en ts
Operating Metrics Tampa Healthcare Facility, Florida 3
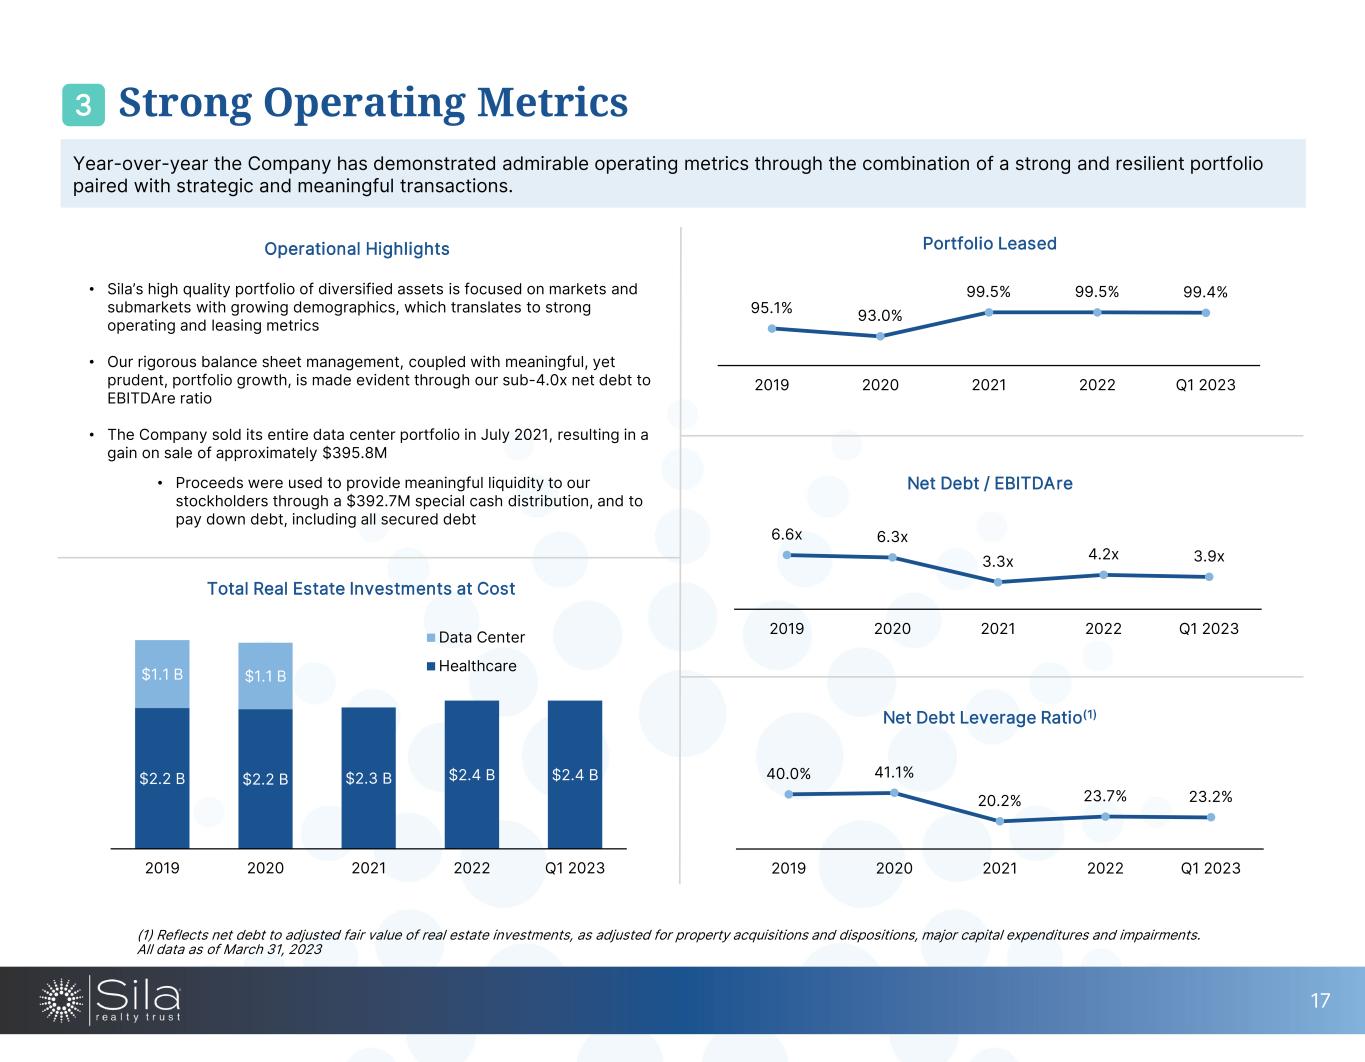
$2.2 B $2.2 B $2.3 B $2.4 B $2.4 B $1.1 B $1.1 B 2019 2020 2021 2022 Q1 2023 Data Center Healthcare Year-over-year the Company has demonstrated admirable operating metrics through the combination of a strong and resilient portfolio paired with strategic and meaningful transactions. Total Real Estate Investments at Cost 6.6x 6.3x 3.3x 4.2x 3.9x 2019 2020 2021 2022 Q1 2023 Net Debt / EBITDAre • Sila’s high quality portfolio of diversified assets is focused on markets and submarkets with growing demographics, which translates to strong operating and leasing metrics • Our rigorous balance sheet management, coupled with meaningful, yet prudent, portfolio growth, is made evident through our sub-4.0x net debt to EBITDAre ratio • The Company sold its entire data center portfolio in July 2021, resulting in a gain on sale of approximately $395.8M • Proceeds were used to provide meaningful liquidity to our stockholders through a $392.7M special cash distribution, and to pay down debt, including all secured debt 95.1% 93.0% 99.5% 99.5% 99.4% 2019 2020 2021 2022 Q1 2023 Portfolio LeasedOperational Highlights 40.0% 41.1% 20.2% 23.7% 23.2% 2019 2020 2021 2022 Q1 2023 Net Debt Leverage Ratio(1) (1) Reflects net debt to adjusted fair value of real estate investments, as adjusted for property acquisitions and dispositions, major capital expenditures and impairments. All data as of March 31, 2023 17 3 Strong Operating Metrics
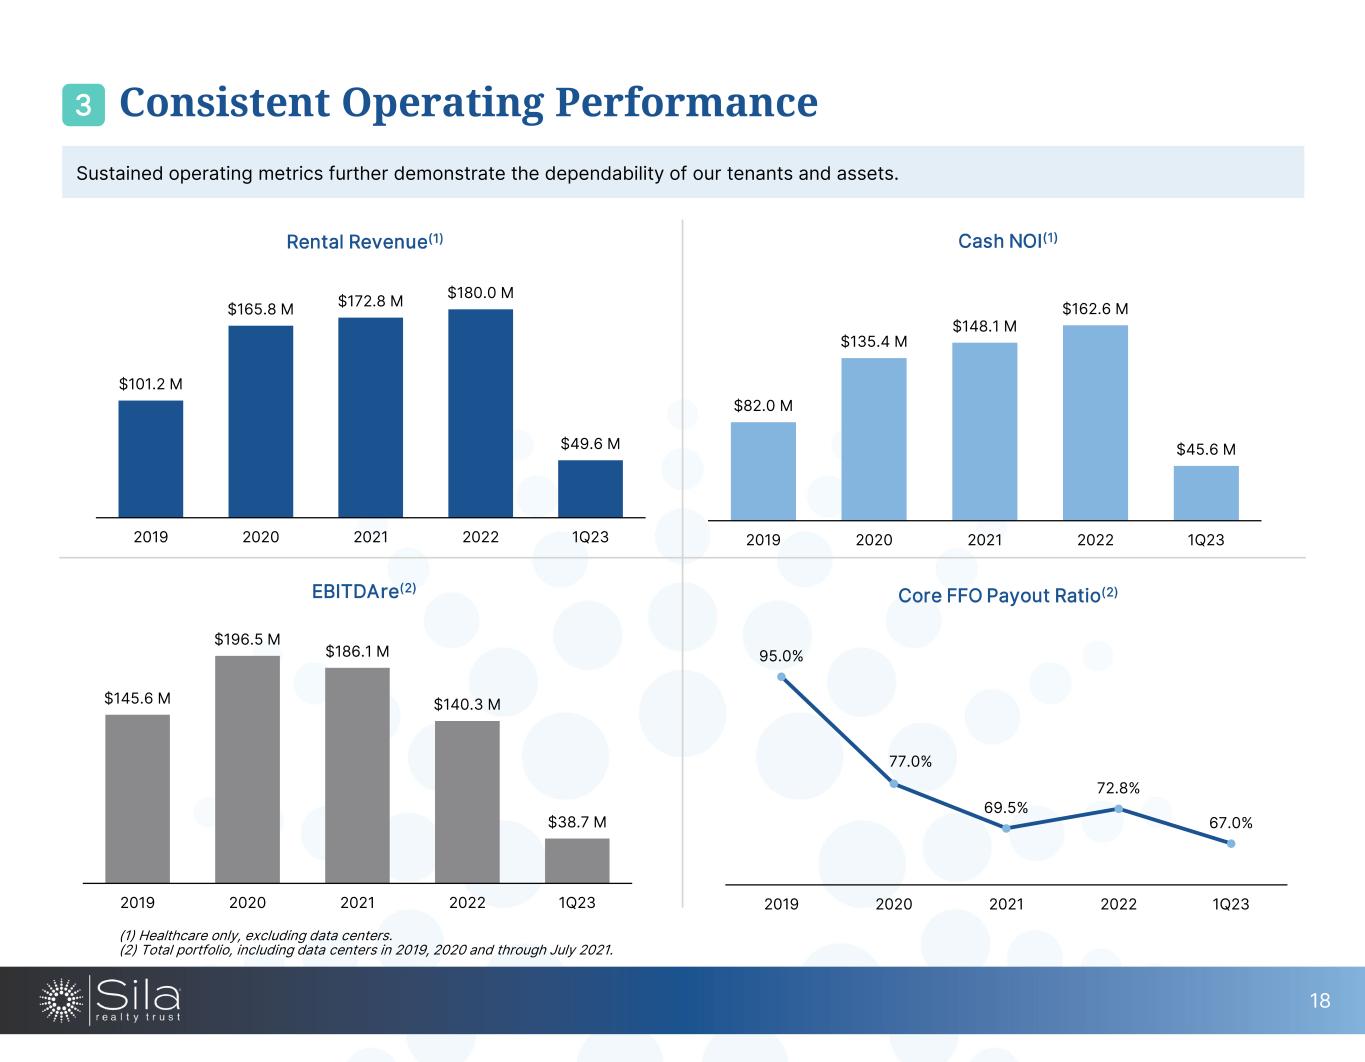
Sustained operating metrics further demonstrate the dependability of our tenants and assets. Cash NOI(1) Core FFO Payout Ratio(2) $82.0 M $135.4 M $148.1 M $162.6 M $45.6 M 2019 2020 2021 2022 1Q23 95.0% 77.0% 69.5% 72.8% 67.0% 2019 2020 2021 2022 1Q23 $101.2 M $165.8 M $172.8 M $180.0 M $49.6 M 2019 2020 2021 2022 1Q23 Rental Revenue(1) 18 3 Consistent Operating Performance (1) Healthcare only, excluding data centers. (2) Total portfolio, including data centers in 2019, 2020 and through July 2021. EBITDAre(2) $145.6 M $196.5 M $186.1 M $140.3 M $38.7 M 2019 2020 2021 2022 1Q23

Balance Sheet Allen Healthcare Facility, Texas 4
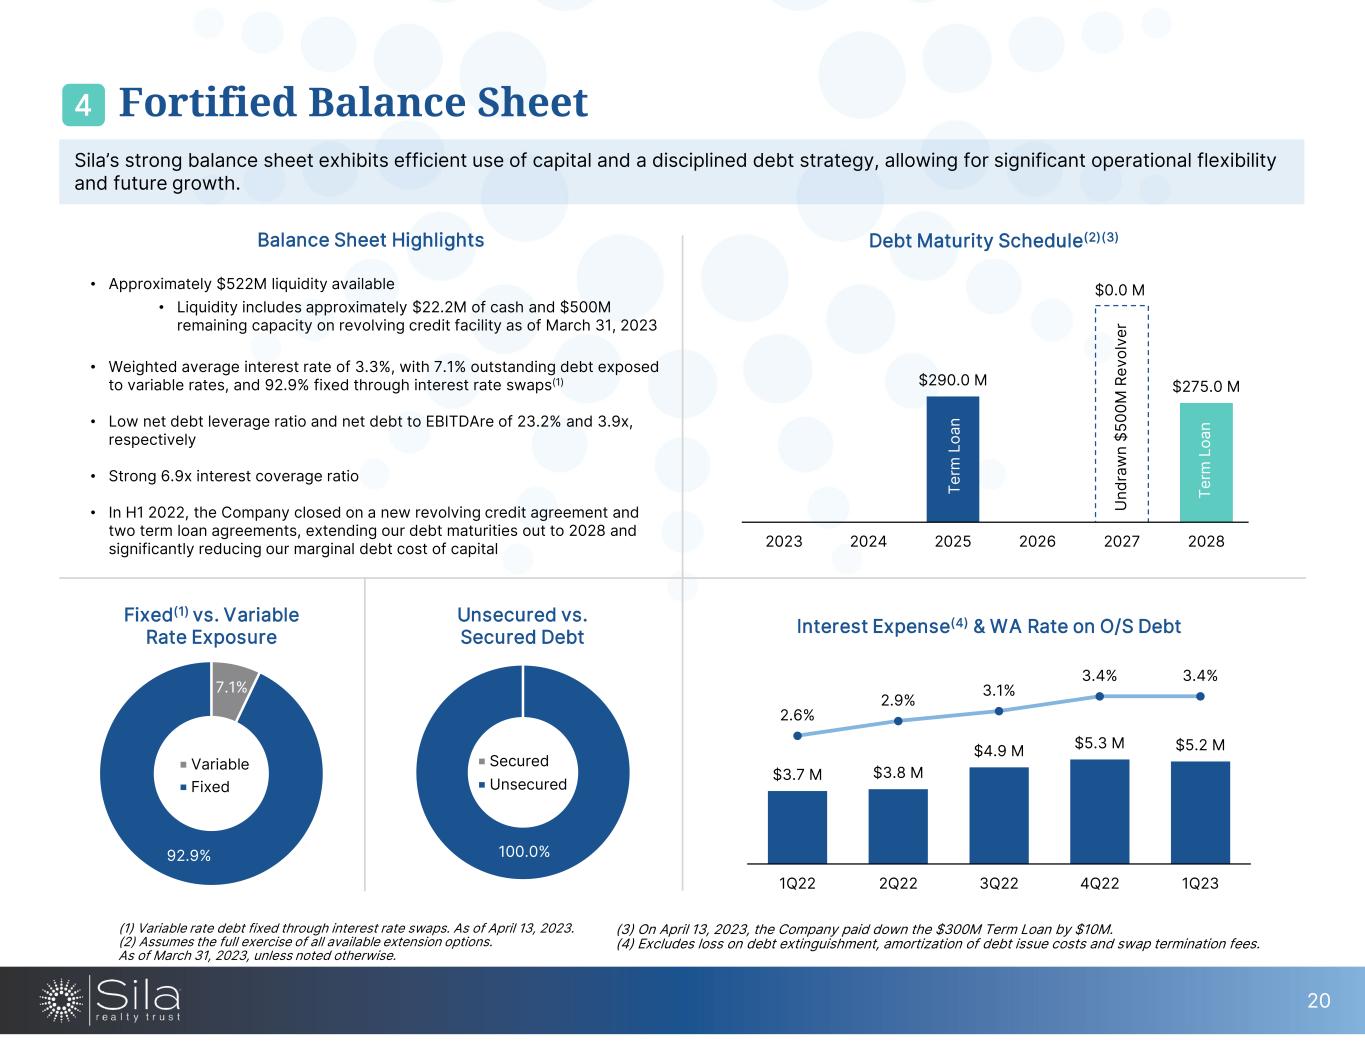
Sila’s strong balance sheet exhibits efficient use of capital and a disciplined debt strategy, allowing for significant operational flexibility and future growth. Interest Expense(4) & WA Rate on O/S DebtFixed(1) vs. Variable Rate Exposure Debt Maturity Schedule(2)(3) • Approximately $522M liquidity available • Liquidity includes approximately $22.2M of cash and $500M remaining capacity on revolving credit facility as of March 31, 2023 • Weighted average interest rate of 3.3%, with 7.1% outstanding debt exposed to variable rates, and 92.9% fixed through interest rate swaps(1) • Low net debt leverage ratio and net debt to EBITDAre of 23.2% and 3.9x, respectively • Strong 6.9x interest coverage ratio • In H1 2022, the Company closed on a new revolving credit agreement and two term loan agreements, extending our debt maturities out to 2028 and significantly reducing our marginal debt cost of capital $290.0 M $0.0 M $275.0 M 2023 2024 2025 2026 2027 2028 Te rm L oa n Te rm L oa n U nd ra w n $5 00 M R ev ol ve r Unsecured vs. Secured Debt 7.1% 92.9% Variable Fixed 100.0% Secured Unsecured Balance Sheet Highlights $3.7 M $3.8 M $4.9 M $5.3 M $5.2 M 2.6% 2.9% 3.1% 3.4% 3.4% 1Q22 2Q22 3Q22 4Q22 1Q23 (1) Variable rate debt fixed through interest rate swaps. As of April 13, 2023. (2) Assumes the full exercise of all available extension options. As of March 31, 2023, unless noted otherwise. 20 4 Fortified Balance Sheet (3) On April 13, 2023, the Company paid down the $300M Term Loan by $10M. (4) Excludes loss on debt extinguishment, amortization of debt issue costs and swap termination fees.

Leadership Silverdale Healthcare Facility, Washington 5
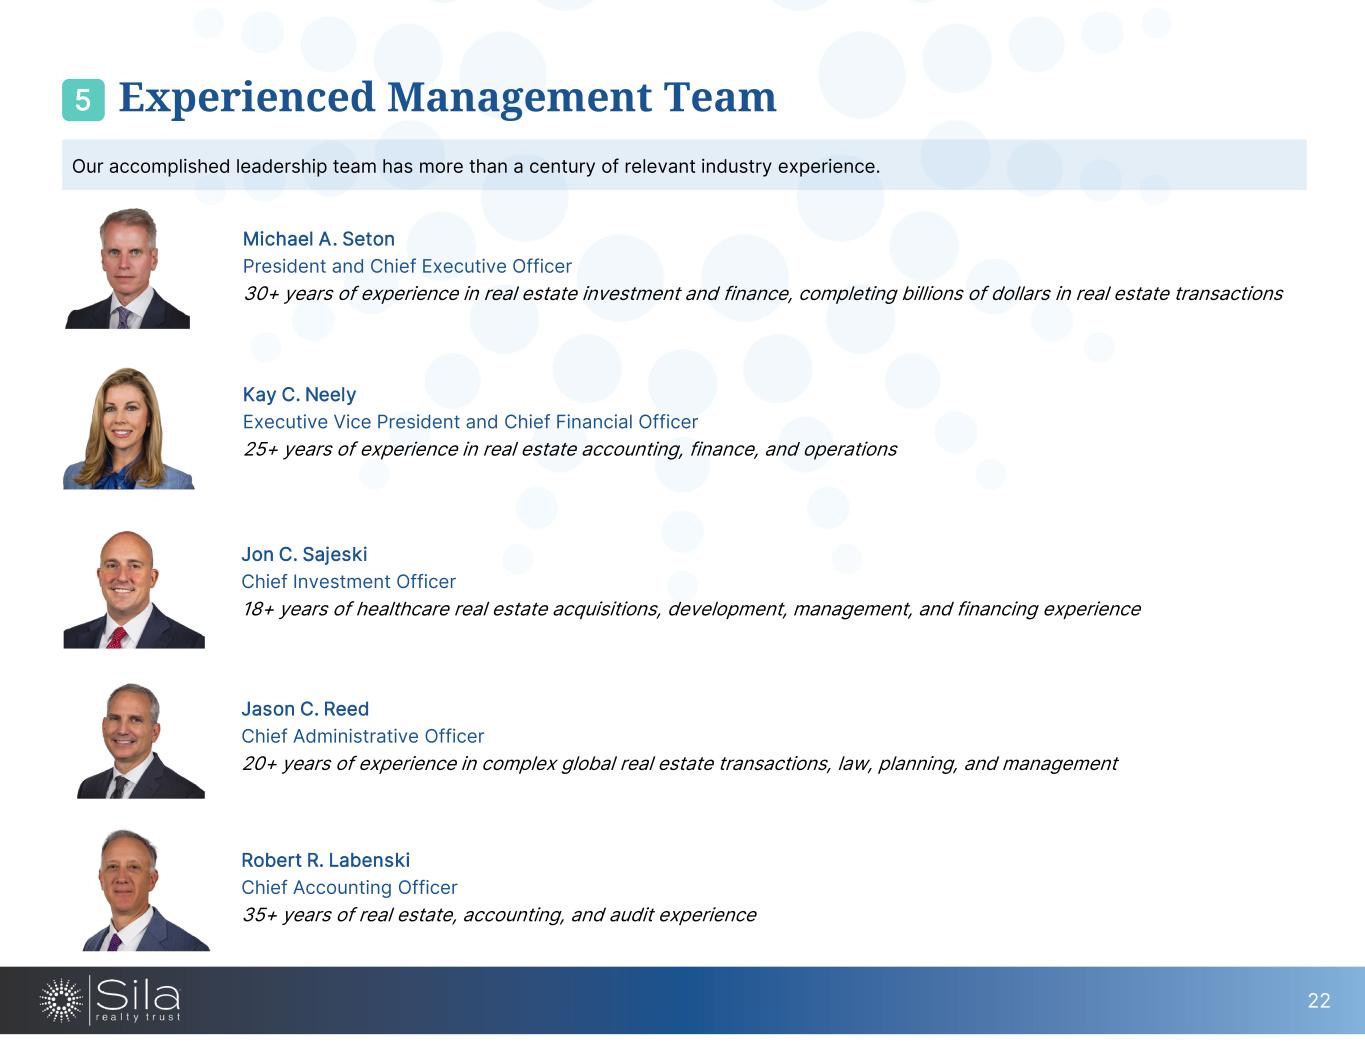
22 Our accomplished leadership team has more than a century of relevant industry experience. Michael A. Seton President and Chief Executive Officer 30+ years of experience in real estate investment and finance, completing billions of dollars in real estate transactions Kay C. Neely Executive Vice President and Chief Financial Officer 25+ years of experience in real estate accounting, finance, and operations Jon C. Sajeski Chief Investment Officer 18+ years of healthcare real estate acquisitions, development, management, and financing experience Jason C. Reed Chief Administrative Officer 20+ years of experience in complex global real estate transactions, law, planning, and management Robert R. Labenski Chief Accounting Officer 35+ years of real estate, accounting, and audit experience Experienced Management Team5
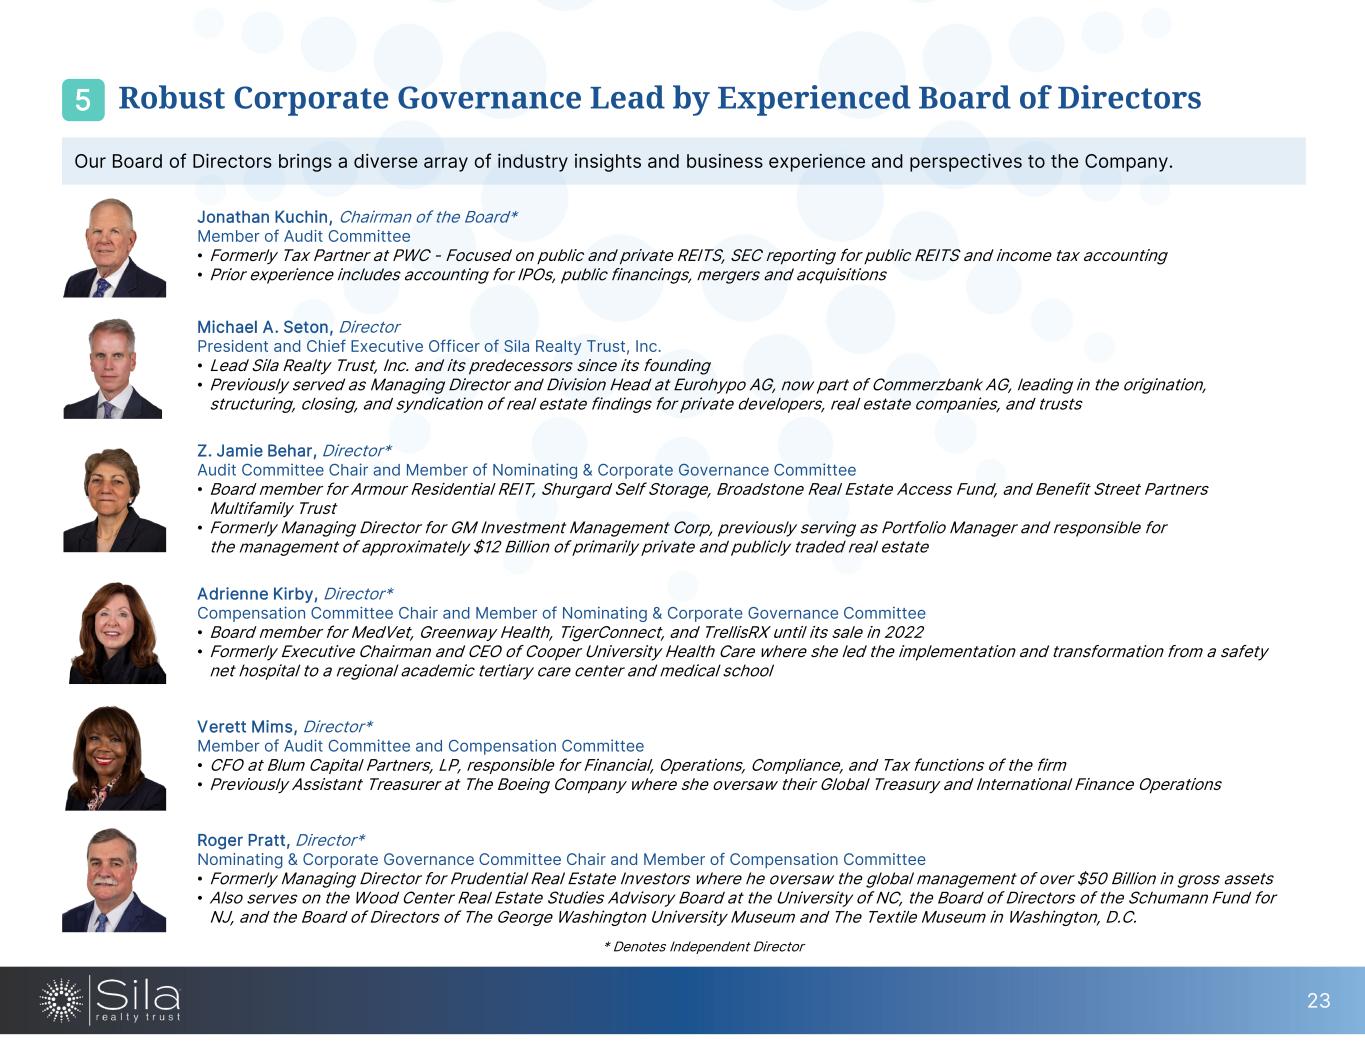
Our Board of Directors brings a diverse array of industry insights and business experience and perspectives to the Company. * Denotes Independent Director 23 Robust Corporate Governance Lead by Experienced Board of Directors 5 Jonathan Kuchin, Chairman of the Board* Member of Audit Committee • Formerly Tax Partner at PWC - Focused on public and private REITS, SEC reporting for public REITS and income tax accounting • Prior experience includes accounting for IPOs, public financings, mergers and acquisitions Michael A. Seton, Director President and Chief Executive Officer of Sila Realty Trust, Inc. • Lead Sila Realty Trust, Inc. and its predecessors since its founding • Previously served as Managing Director and Division Head at Eurohypo AG, now part of Commerzbank AG, leading in the origination, structuring, closing, and syndication of real estate findings for private developers, real estate companies, and trusts Z. Jamie Behar, Director* Audit Committee Chair and Member of Nominating & Corporate Governance Committee • Board member for Armour Residential REIT, Shurgard Self Storage, Broadstone Real Estate Access Fund, and Benefit Street Partners Multifamily Trust • Formerly Managing Director for GM Investment Management Corp, previously serving as Portfolio Manager and responsible for the management of approximately $12 Billion of primarily private and publicly traded real estate Adrienne Kirby, Director* Compensation Committee Chair and Member of Nominating & Corporate Governance Committee • Board member for MedVet, Greenway Health, TigerConnect, and TrellisRX until its sale in 2022 • Formerly Executive Chairman and CEO of Cooper University Health Care where she led the implementation and transformation from a safety net hospital to a regional academic tertiary care center and medical school Verett Mims, Director* Member of Audit Committee and Compensation Committee • CFO at Blum Capital Partners, LP, responsible for Financial, Operations, Compliance, and Tax functions of the firm • Previously Assistant Treasurer at The Boeing Company where she oversaw their Global Treasury and International Finance Operations Roger Pratt, Director* Nominating & Corporate Governance Committee Chair and Member of Compensation Committee • Formerly Managing Director for Prudential Real Estate Investors where he oversaw the global management of over $50 Billion in gross assets • Also serves on the Wood Center Real Estate Studies Advisory Board at the University of NC, the Board of Directors of the Schumann Fund for NJ, and the Board of Directors of The George Washington University Museum and The Textile Museum in Washington, D.C.
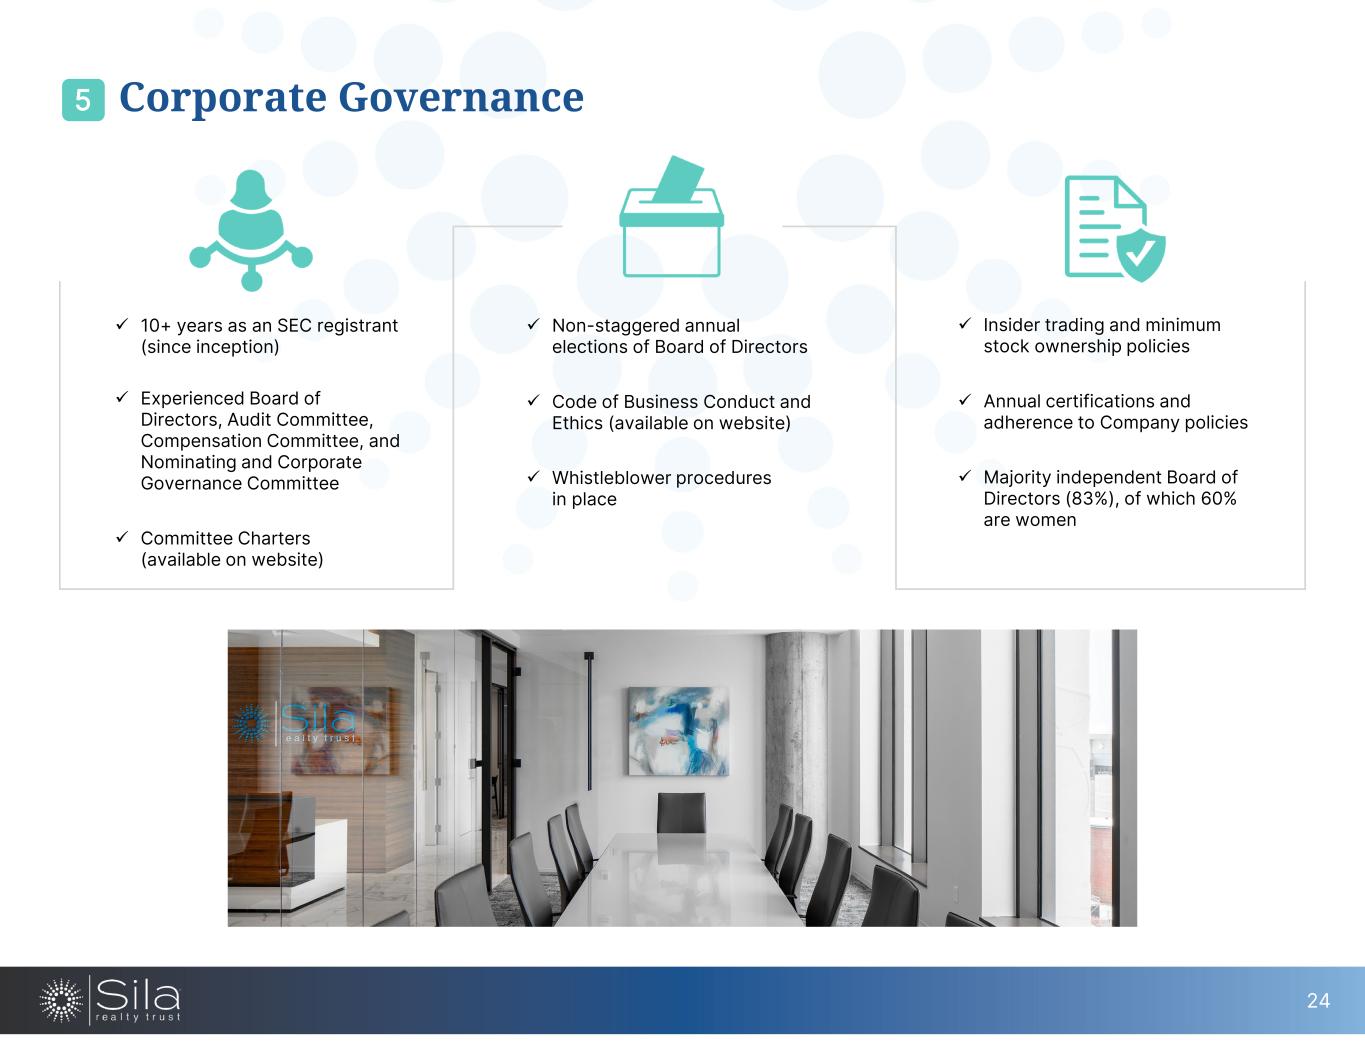
24 Corporate Governance5 10+ years as an SEC registrant (since inception) Experienced Board of Directors, Audit Committee, Compensation Committee, and Nominating and Corporate Governance Committee Committee Charters (available on website) Non-staggered annual elections of Board of Directors Code of Business Conduct and Ethics (available on website) Whistleblower procedures in place Insider trading and minimum stock ownership policies Annual certifications and adherence to Company policies Majority independent Board of Directors (83%), of which 60% are women

Environmental, Social & Governance Katy Healthcare Facility, Texas 6
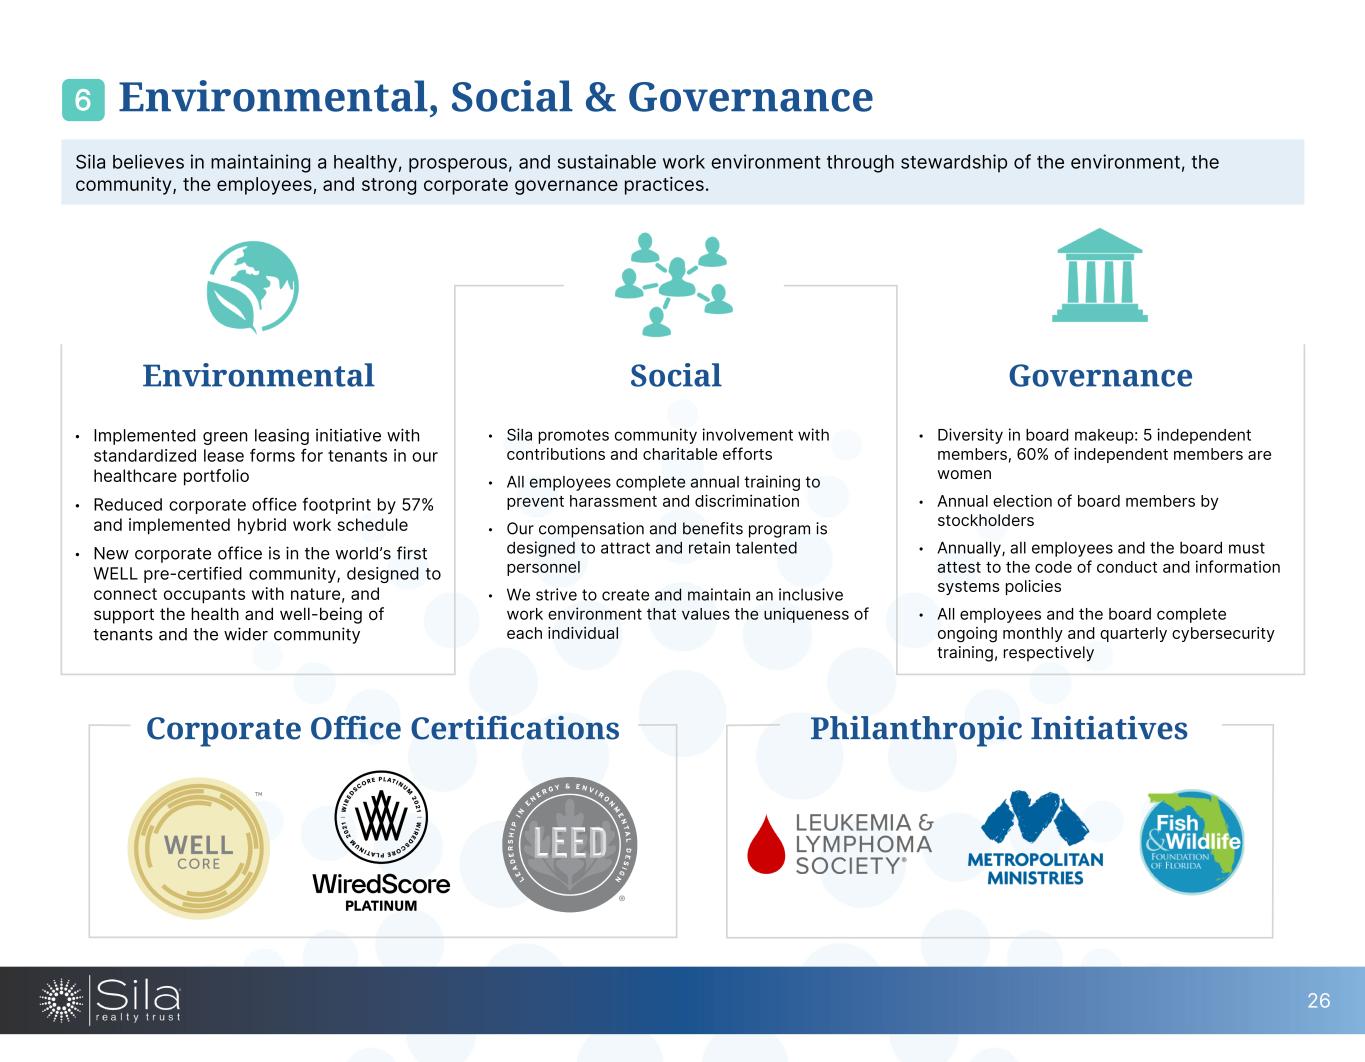
Sila believes in maintaining a healthy, prosperous, and sustainable work environment through stewardship of the environment, the community, the employees, and strong corporate governance practices. • Sila promotes community involvement with contributions and charitable efforts • All employees complete annual training to prevent harassment and discrimination • Our compensation and benefits program is designed to attract and retain talented personnel • We strive to create and maintain an inclusive work environment that values the uniqueness of each individual • Diversity in board makeup: 5 independent members, 60% of independent members are women • Annual election of board members by stockholders • Annually, all employees and the board must attest to the code of conduct and information systems policies • All employees and the board complete ongoing monthly and quarterly cybersecurity training, respectively • Implemented green leasing initiative with standardized lease forms for tenants in our healthcare portfolio • Reduced corporate office footprint by 57% and implemented hybrid work schedule • New corporate office is in the world’s first WELL pre-certified community, designed to connect occupants with nature, and support the health and well-being of tenants and the wider community Environmental Social Governance Corporate Office Certifications 26 Environmental, Social & Governance6 Philanthropic Initiatives
Appendix Akron Healthcare Facility, Ohio
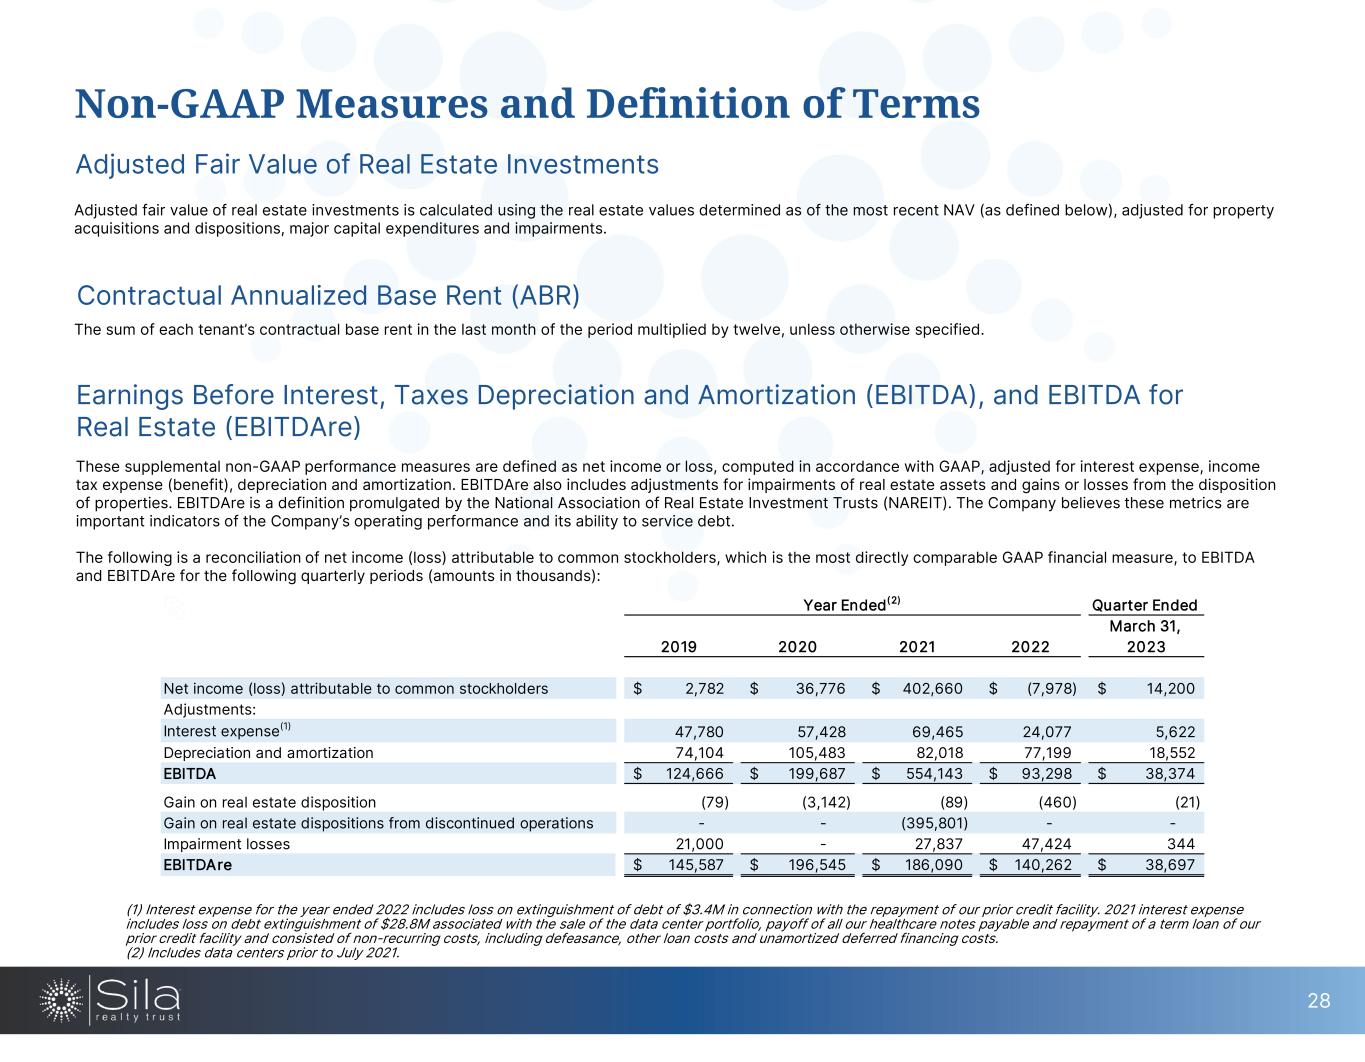
Non-GAAP Measures and Definition of Terms Adjusted Fair Value of Real Estate Investments Adjusted fair value of real estate investments is calculated using the real estate values determined as of the most recent NAV (as defined below), adjusted for property acquisitions and dispositions, major capital expenditures and impairments. Earnings Before Interest, Taxes Depreciation and Amortization (EBITDA), and EBITDA for Real Estate (EBITDAre) These supplemental non-GAAP performance measures are defined as net income or loss, computed in accordance with GAAP, adjusted for interest expense, income tax expense (benefit), depreciation and amortization. EBITDAre also includes adjustments for impairments of real estate assets and gains or losses from the disposition of properties. EBITDAre is a definition promulgated by the National Association of Real Estate Investment Trusts (NAREIT). The Company believes these metrics are important indicators of the Company’s operating performance and its ability to service debt. The following is a reconciliation of net income (loss) attributable to common stockholders, which is the most directly comparable GAAP financial measure, to EBITDA and EBITDAre for the following quarterly periods (amounts in thousands): (1) Interest expense for the year ended 2022 includes loss on extinguishment of debt of $3.4M in connection with the repayment of our prior credit facility. 2021 interest expense includes loss on debt extinguishment of $28.8M associated with the sale of the data center portfolio, payoff of all our healthcare notes payable and repayment of a term loan of our prior credit facility and consisted of non-recurring costs, including defeasance, other loan costs and unamortized deferred financing costs. (2) Includes data centers prior to July 2021. Contractual Annualized Base Rent (ABR) The sum of each tenant’s contractual base rent in the last month of the period multiplied by twelve, unless otherwise specified. 28 Quarter Ended March 31, 2023 Net income (loss) attributable to common stockholders 2,782$ 36,776$ 402,660$ (7,978)$ 14,200$ Adjustments: Interest expense(1) 47,780 57,428 69,465 24,077 5,622 Depreciation and amortization 74,104 105,483 82,018 77,199 18,552 EBITDA 124,666$ 199,687$ 554,143$ 93,298$ 38,374$ Gain on real estate disposition (79) (3,142) (89) (460) (21) Gain on real estate dispositions from discontinued operations - - (395,801) - - Impairment losses 21,000 - 27,837 47,424 344 EBITDAre 145,587$ 196,545$ 186,090$ 140,262$ 38,697$ Year Ended(2) 2020 2021 20222019
Non-GAAP Measures and Definition of Terms Funds from Operations (FFO), Core FFO, and Adjusted FFO (AFFO) FFO, a non-GAAP financial measure, is calculated consistent with NAREIT’s definition, as net income (loss) (calculated in accordance with GAAP), excluding gains (or losses) from sales of real estate assets and impairments of real estate assets, plus depreciation and amortization of real estate assets, and after adjustments for unconsolidated partnerships and joint ventures. It should be noted, however, that other REITs may not define FFO in accordance with the current NAREIT definition or may interpret the current NAREIT definition differently than the Company does, making comparisons less meaningful. In addition to FFO, the Company uses Core FFO as a supplemental non-GAAP financial performance measure because the Company believes it provides investors with additional information to understand the Company's sustainable performance. The Company calculates Core FFO by adjusting FFO to remove the effect of items that are not expected to impact its operating performance on an ongoing basis and consider it to be a useful supplemental measure because it provides investors with additional information to understand our sustainable performance. These include severance arrangements, internalization transaction expenses, write-off of straight-line rent receivables related to prior periods, amortization of above- and below-market leases (including ground leases), and loss on extinguishment of debt. Other REITs may use different methodologies for calculating Core FFO and, accordingly, the Company’s Core FFO may not be comparable to other REITs. In addition to FFO and Core FFO, the Company uses AFFO as a non-GAAP supplemental financial performance measure because the Company believes it provides to investors appropriate supplemental information to evaluate the ongoing operations of the Company. AFFO is a metric used by management to evaluate the Company's dividend policy. The Company calculates AFFO by further adjusting Core FFO for the following items: deferred rent, current period straight-line rent adjustments, amortization of deferred financing costs and stock-based compensation. Other REITs may use different methodologies for calculating AFFO and, accordingly, the Company’s AFFO may not be comparable to other REITs. FFO, Core FFO and AFFO should not be considered to be more relevant or accurate than the GAAP methodology in calculating net income (loss) or in its applicability in evaluating our operational performance. The method used to evaluate the value and performance of real estate under GAAP should be considered as a more relevant measure of operating performance and considered more prominent than the non-GAAP FFO, Core FFO and AFFO measures and the adjustments to GAAP in calculating FFO, Core FFO and AFFO. The following is a reconciliation of net income (loss) attributable to common stockholders, which is the most directly comparable GAAP financial measure, to FFO, Core FFO and AFFO for the following quarterly periods (amounts in thousands): 29
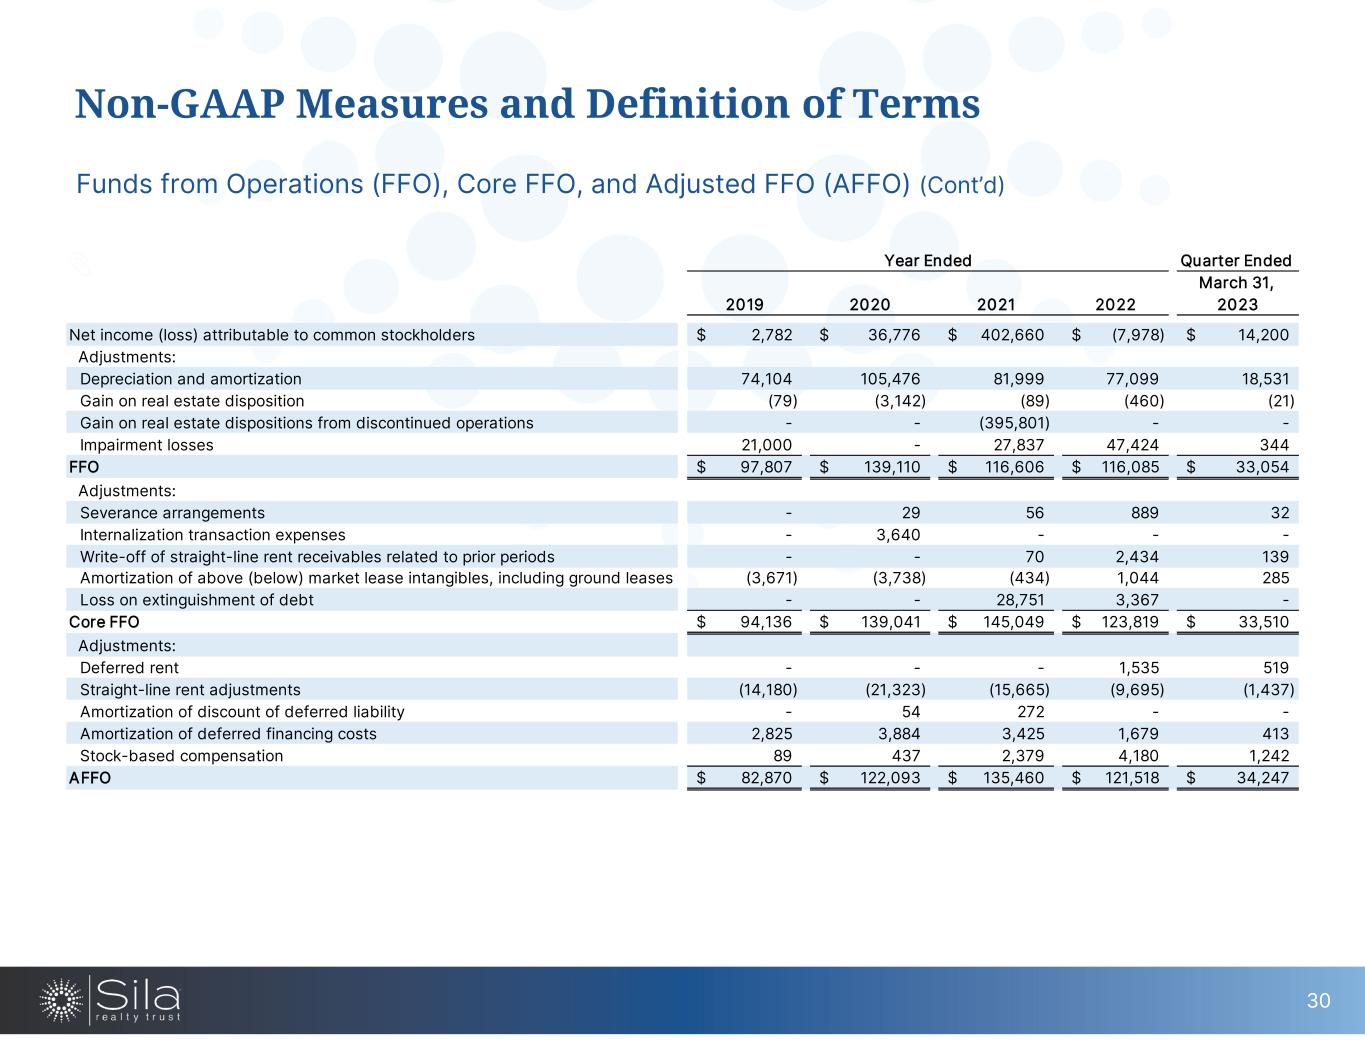
Non-GAAP Measures and Definition of Terms Funds from Operations (FFO), Core FFO, and Adjusted FFO (AFFO) (Cont’d) 30 Quarter Ended March 31, 2023 Net income (loss) attributable to common stockholders 2,782$ 36,776$ 402,660$ (7,978)$ 14,200$ Adjustments: Depreciation and amortization 74,104 105,476 81,999 77,099 18,531 Gain on real estate disposition (79) (3,142) (89) (460) (21) Gain on real estate dispositions from discontinued operations - - (395,801) - - Impairment losses 21,000 - 27,837 47,424 344 FFO 97,807$ 139,110$ 116,606$ 116,085$ 33,054$ Adjustments: Severance arrangements - 29 56 889 32 Internalization transaction expenses - 3,640 - - - Write-off of straight-line rent receivables related to prior periods - - 70 2,434 139 Amortization of above (below) market lease intangibles, including ground leases (3,671) (3,738) (434) 1,044 285 Loss on extinguishment of debt - - 28,751 3,367 - Core FFO 94,136$ 139,041$ 145,049$ 123,819$ 33,510$ Adjustments: Deferred rent - - - 1,535 519 Straight-line rent adjustments (14,180) (21,323) (15,665) (9,695) (1,437) Amortization of discount of deferred liability - 54 272 - - Amortization of deferred financing costs 2,825 3,884 3,425 1,679 413 Stock-based compensation 89 437 2,379 4,180 1,242 AFFO 82,870$ 122,093$ 135,460$ 121,518$ 34,247$ Year Ended 2019 2020 2021 2022
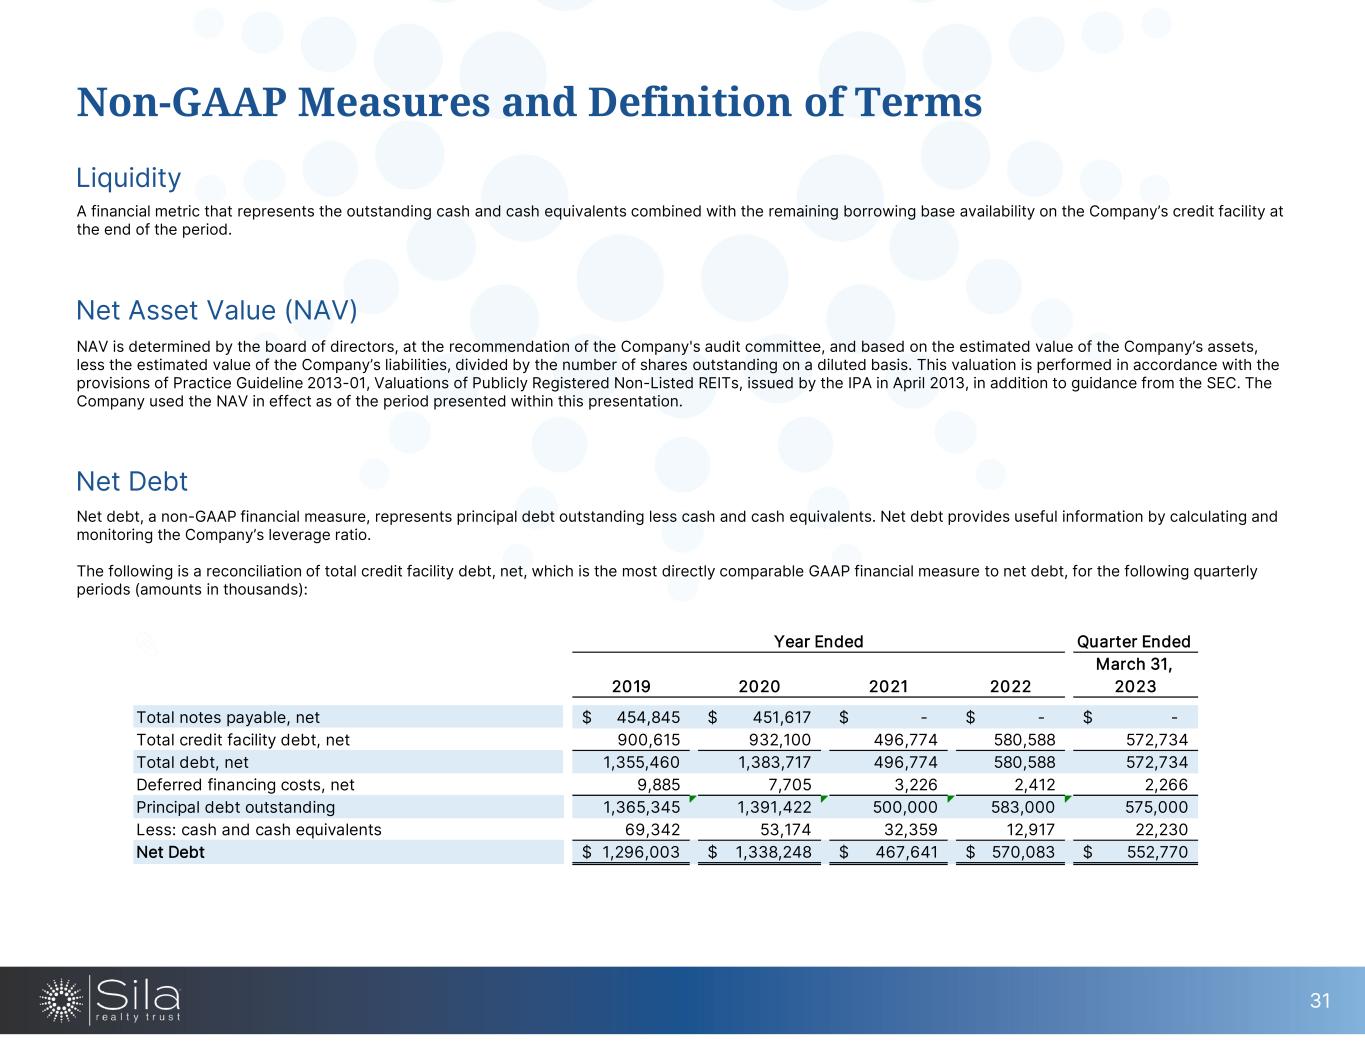
Liquidity A financial metric that represents the outstanding cash and cash equivalents combined with the remaining borrowing base availability on the Company’s credit facility at the end of the period. Net Debt Net debt, a non-GAAP financial measure, represents principal debt outstanding less cash and cash equivalents. Net debt provides useful information by calculating and monitoring the Company’s leverage ratio. The following is a reconciliation of total credit facility debt, net, which is the most directly comparable GAAP financial measure to net debt, for the following quarterly periods (amounts in thousands): Non-GAAP Measures and Definition of Terms Net Asset Value (NAV) NAV is determined by the board of directors, at the recommendation of the Company's audit committee, and based on the estimated value of the Company’s assets, less the estimated value of the Company’s liabilities, divided by the number of shares outstanding on a diluted basis. This valuation is performed in accordance with the provisions of Practice Guideline 2013-01, Valuations of Publicly Registered Non-Listed REITs, issued by the IPA in April 2013, in addition to guidance from the SEC. The Company used the NAV in effect as of the period presented within this presentation. 31 Quarter Ended March 31, 2023 Total notes payable, net 454,845$ 451,617$ -$ -$ -$ Total credit facility debt, net 900,615 932,100 496,774 580,588 572,734 Total debt, net 1,355,460 1,383,717 496,774 580,588 572,734 Deferred financing costs, net 9,885 7,705 3,226 2,412 2,266 Principal debt outstanding 1,365,345 1,391,422 500,000 583,000 575,000 Less: cash and cash equivalents 69,342 53,174 32,359 12,917 22,230 Net Debt 1,296,003$ 1,338,248$ 467,641$ 570,083$ 552,770$ 2022 Year Ended 2019 2020 2021
Net Operating Income (NOI) and Cash NOI NOI, a non-GAAP financial measure, is defined as rental revenue, less rental expenses, on an accrual basis, excluding general and administrative expenses, depreciation and amortization, impairment losses, gain on real estate disposition, and interest and other expenses, net. Cash NOI is calculated to exclude the impact of GAAP adjustments to rental revenue and rental expense, consisting of straight-line rent adjustments, net of write-offs, amortization of lease related intangibles and ground leases, and intercompany property management fees, then including deferred rent received in cash, and is used to evaluate the cash-based performance of the Company’s real estate portfolio. The Company believes that NOI and Cash NOI both serve as useful supplements to net income (loss) because they allow investors and management to measure unlevered property-level operating results and to compare these results to the comparable results of other real estate companies on a consistent basis. The Company uses both NOI and Cash NOI to make decisions about resource allocations and to assess the property-level performance of the real estate portfolio. As an indicator of financial performance, neither metric should be considered as an alternative to net income (loss), determined in accordance with GAAP. The Company believes that in order to facilitate a clear understanding of the consolidated historical operating results, both metrics should be evaluated in conjunction with net income (loss) as presented in the consolidated financial statements included on the Company’s Annual Report on Form 10-K filed with the SEC on March 16, 2023. The following is a reconciliation from net income (loss) attributable to common stockholders, which is the most directly comparable GAAP financial measure, to NOI and Cash NOI, for the following periods (amounts in thousands): Non-GAAP Measures and Definition of Terms 32
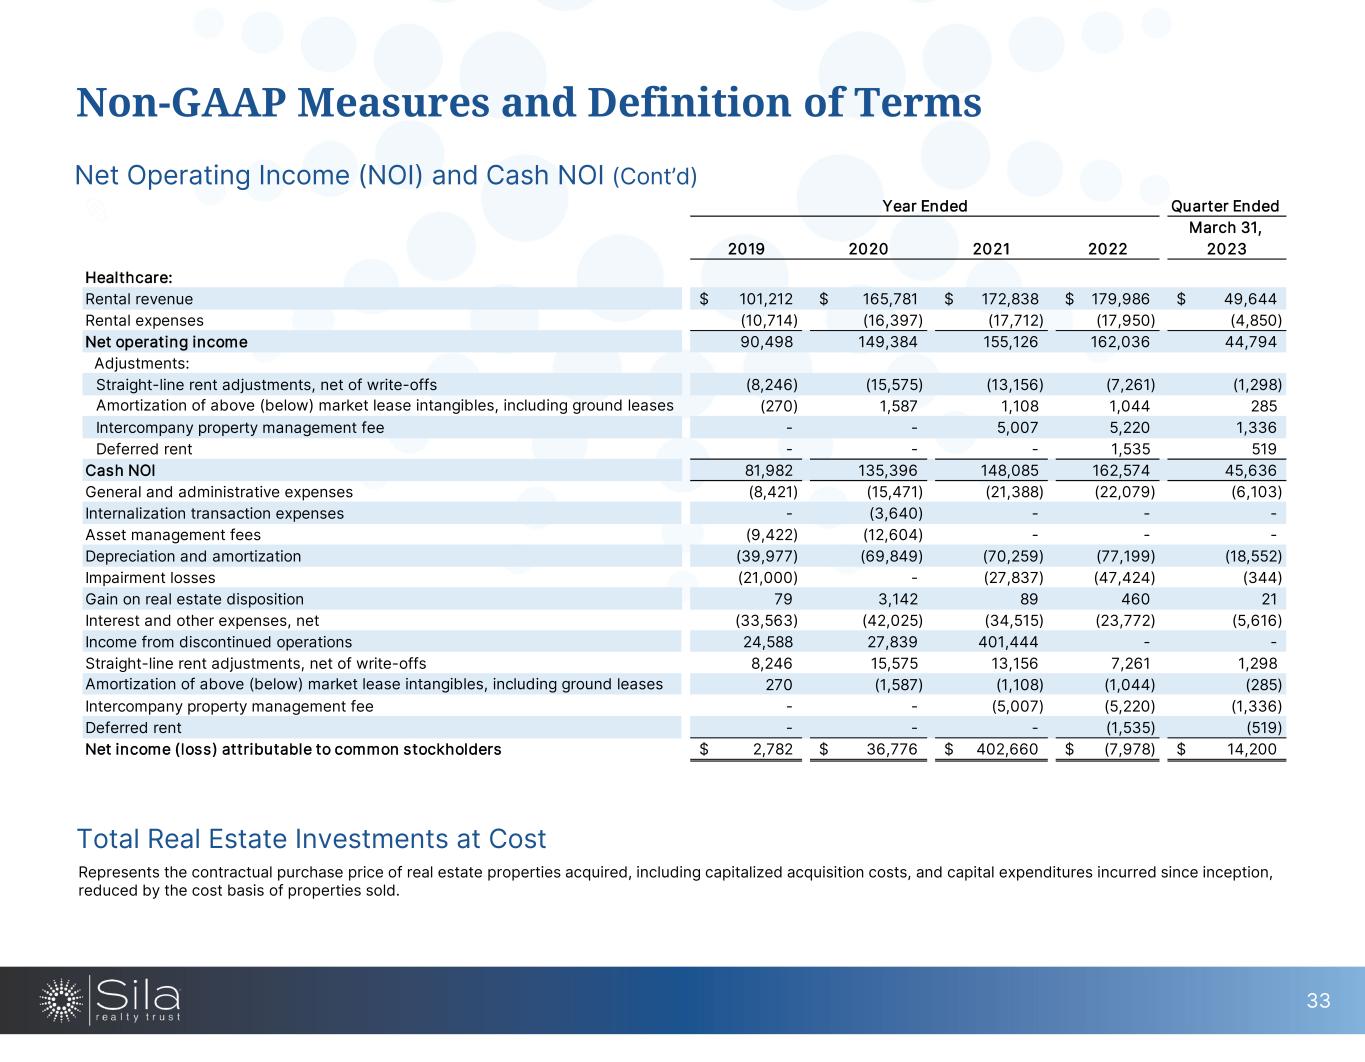
Net Operating Income (NOI) and Cash NOI (Cont’d) Non-GAAP Measures and Definition of Terms 33 Quarter Ended March 31, 2023 Healthcare: Rental revenue 101,212$ 165,781$ 172,838$ 179,986$ 49,644$ Rental expenses (10,714) (16,397) (17,712) (17,950) (4,850) Net operating income 90,498 149,384 155,126 162,036 44,794 Adjustments: Straight-line rent adjustments, net of write-offs (8,246) (15,575) (13,156) (7,261) (1,298) Amortization of above (below) market lease intangibles, including ground leases (270) 1,587 1,108 1,044 285 Intercompany property management fee - - 5,007 5,220 1,336 Deferred rent - - - 1,535 519 Cash NOI 81,982 135,396 148,085 162,574 45,636 General and administrative expenses (8,421) (15,471) (21,388) (22,079) (6,103) Internalization transaction expenses - (3,640) - - - Asset management fees (9,422) (12,604) - - - Depreciation and amortization (39,977) (69,849) (70,259) (77,199) (18,552) Impairment losses (21,000) - (27,837) (47,424) (344) Gain on real estate disposition 79 3,142 89 460 21 Interest and other expenses, net (33,563) (42,025) (34,515) (23,772) (5,616) Income from discontinued operations 24,588 27,839 401,444 - - Straight-line rent adjustments, net of write-offs 8,246 15,575 13,156 7,261 1,298 Amortization of above (below) market lease intangibles, including ground leases 270 (1,587) (1,108) (1,044) (285) Intercompany property management fee - - (5,007) (5,220) (1,336) Deferred rent - - - (1,535) (519) Net income (loss) attributable to common stockholders 2,782$ 36,776$ 402,660$ (7,978)$ 14,200$ Year Ended 2019 2020 2021 2022 Total Real Estate Investments at Cost Represents the contractual purchase price of real estate properties acquired, including capitalized acquisition costs, and capital expenditures incurred since inception, reduced by the cost basis of properties sold.

Contact Information Corporate Address www.SilaRealtyTrust.com 1001 Water Street Suite 800 Tampa, FL 33602 Miles Callahan Senior Vice President, Capital Markets & Investor Relations 813.316.4259 mcallahan@silarealtytrust.com


