Exhibit 99.1

November 2019 Third Quarter 2019 Investor Presentation (NASDAQ: AFIN)
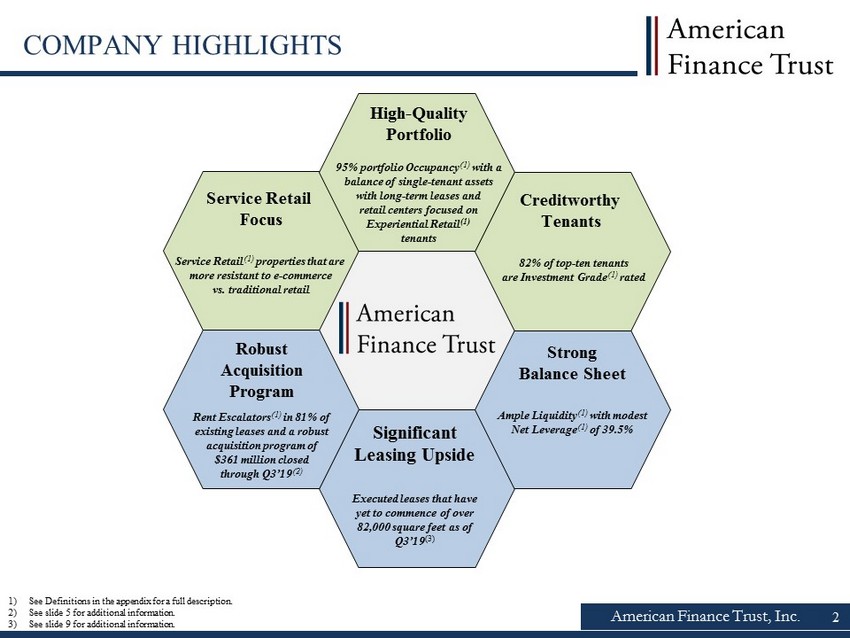
American Finance Trust, Inc. COMPANY HIGHLIGHTS Service Retail Focus Service Retail ( 1) properties that are more resistant to e - commerce vs. traditional retail High - Quality Portfolio 95% p ortfolio Occupancy (1) with a balance of single - tenant assets with long - term leases and retail centers focused on Experiential Retail (1) tenants Creditworthy Tenants 82 % of top - ten tenants are Investment Grade (1) rated Strong Balance Sheet Ample Liquidity (1) with modest Net Leverage (1) of 39.5% Robust Acquisition Program Rent Escalators ( 1) in 81% of existing leases and a robust acquisition program of $361 million closed t hrough Q3’19 (2) Significant Leasing Upside Executed leases that have yet to commence of over 82,000 square feet as of Q3’19 (3) 1) See Definitions in the appendix for a full description. 2) See slide 5 for additional information. 3) See slide 9 for additional information. 2
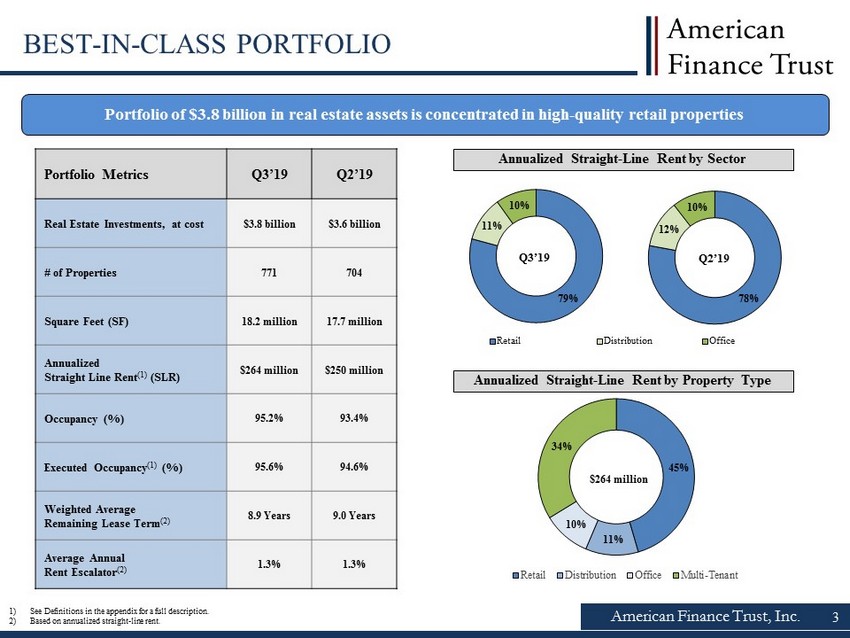
American Finance Trust, Inc. Portfolio of $3.8 billion in real estate assets is concentrated in high - quality retail properties 1) See Definitions in the appendix for a full description. 2) Based on annualized straight - line rent. Portfolio Metrics Q3’19 Q2’19 Real Estate Investments, at cost $3.8 billion $3.6 billion # of Properties 771 704 Square Feet (SF) 18.2 million 17.7 million Annualized Straight Line Rent (1) (SLR) $264 million $250 million Occupancy (%) 95.2% 93.4% Executed Occupancy (1) (%) 95.6% 94.6% Weighted Average Remaining Lease Term (2) 8.9 Years 9.0 Years Average Annual Rent Escalator (2) 1.3% 1.3% Annualized Straight - Line Rent by Property Type BEST - IN - CLASS PORTFOLIO Annualized Straight - Line Rent by Sector Q3’19 Retail Distribution Office Q2’19 3 78% 12% 10% 79% 11% 10% 45% 11% 10% 34% Retail Distribution Office Multi-Tenant $264 million
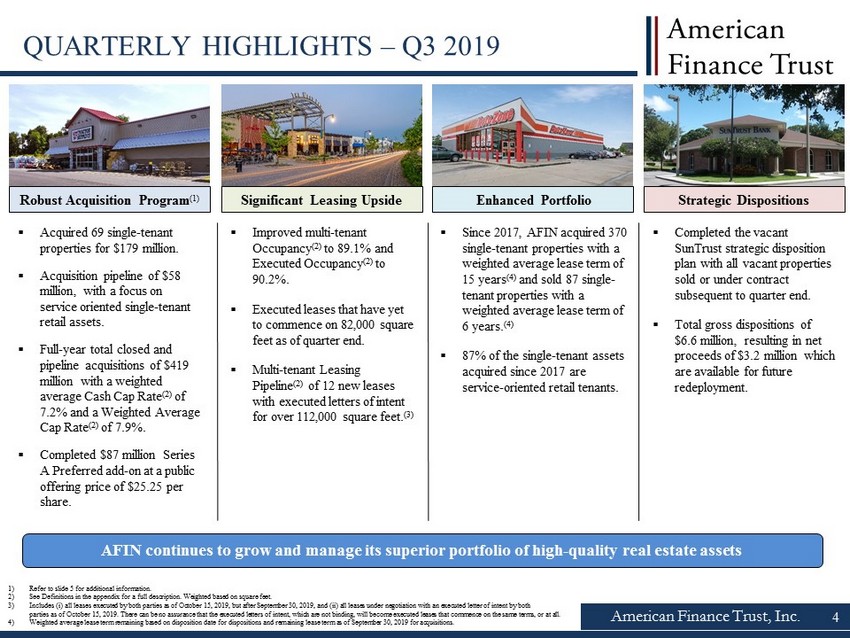
American Finance Trust, Inc. 4 QUARTERLY HIGHLIGHTS – Q3 2019 Significant Leasing Upside Robust Acquisition Program (1) Strategic Dispositions ▪ Acquired 69 single - tenant properties for $179 million. ▪ Acquisition pipeline of $58 million, with a focus on service oriented single - tenant retail assets. ▪ Full - year total closed and pipeline acquisitions of $419 million with a weighted average Cash Cap Rate (2) of 7.2% and a Weighted Average Cap Rate (2) of 7.9%. ▪ Completed $87 million Series A Preferred add - on at a public offering price of $25.25 per share. AFIN continues to grow and manage its superior portfolio of high - quality real estate assets ▪ Completed the vacant SunTrust strategic disposition plan with all vacant properties sold or under contract subsequent to quarter end. ▪ Total gross dispositions of $6.6 million, resulting in net proceeds of $3.2 million which are available for future redeployment. ▪ Improved multi - tenant Occupancy (2) to 89.1% and Executed Occupancy (2) to 90.2%. ▪ Executed leases that have yet to commence on 82,000 square feet as of quarter end. ▪ Multi - tenant Leasing Pipeline (2) of 12 new leases with executed letters of intent for over 112,000 square feet. (3) ▪ Since 2017, AFIN acquired 370 single - tenant properties with a weighted average lease term of 15 years (4) and sold 87 single - tenant properties with a weighted average lease term of 6 years. (4) ▪ 87% of the single - tenant assets acquired since 2017 are service - oriented retail tenants. 1) Refer to slide 5 for additional information. 2) See Definitions in the appendix for a full description. Weighted based on square feet. 3) Includes (i) all leases executed by both parties as of October 15, 2019, but after September 30, 2019, and (ii) all leases un der negotiation with an executed letter of intent by both parties as of October 15, 2019. There can be no assurance that the executed letters of intent, which are not binding, will be com e executed leases that commence on the same terms, or at all. 4) Weighted average lease term remaining based on disposition date for dispositions and remaining lease term as of September 30, 2019 for acquisitions. Enhanced Portfolio
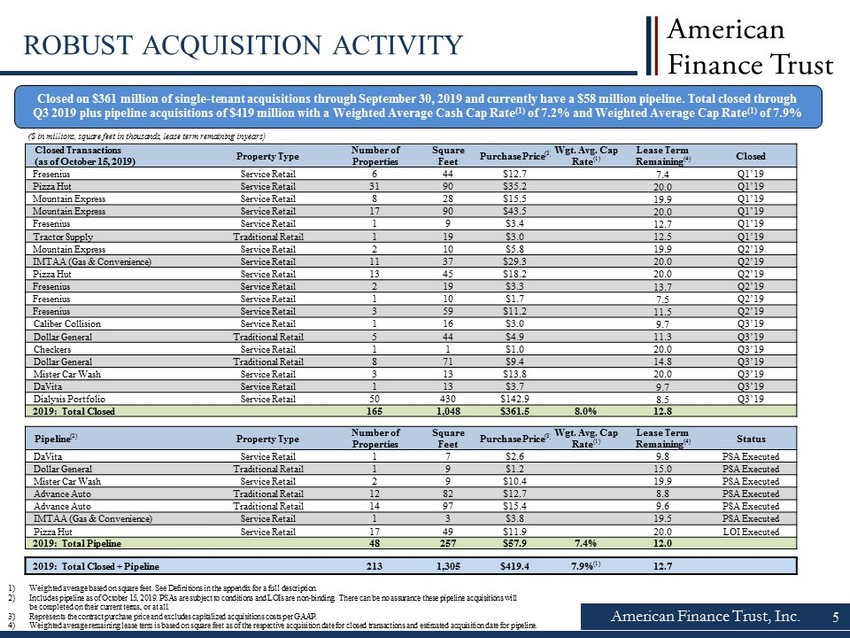
American Finance Trust, Inc. ROBUST ACQUISITION ACTIVITY Closed on $361 million of single - tenant acquisitions through September 30, 2019 and currently have a $58 million pipeline. Total closed through Q3 2019 plus pipeline acquisitions of $419 million with a Weighted Average Cash Cap Rate (1) of 7.2% and Weighted Average Cap Rate (1) of 7.9% ($ in millions, square feet in thousands, lease term remaining in years) 1) Weighted average based on square feet. See Definitions in the appendix for a full description. 2) Includes pipeline as of October 15, 2019. PSAs are subject to conditions and LOIs are non - binding. There can be no assurance these pipeline acquisitions will be completed on their current terms, or at all. 3) Represents the contract purchase price and excludes capitalized acquisitions costs per GAAP. 4) Weighted average remaining lease term is based on square feet as of the respective acquisition date for closed transactions a nd estimated acquisition date for pipeline. Closed Transactions ( as of October 15 , 2019) Property Type Number of Properties Square Feet Purchase Price (3) Wgt. Avg. Cap Rate (1) Lease Term Remaining (4) Closed Fresenius Service Retail 6 44 $12.7 7.4 Q1’19 Pizza Hut Service Retail 31 90 $35.2 20.0 Q1’19 Mountain Express Service Retail 8 28 $15.5 19.9 Q1’19 Mountain Express Service Retail 17 90 $43.5 20.0 Q1’19 Fresenius Service Retail 1 9 $3.4 12.7 Q1’19 Tractor Supply Traditional Retail 1 19 $3.0 12.5 Q1’19 Mountain Express Service Retail 2 10 $5.8 19.9 Q2’19 IMTAA (Gas & Convenience) Service Retail 11 37 $29.3 20.0 Q2’19 Pizza Hut Service Retail 13 45 $18.2 20.0 Q2’19 Fresenius Service Retail 2 19 $3.3 13.7 Q2’19 Fresenius Service Retail 1 10 $1.7 7.5 Q2’19 Fresenius Service Retail 3 59 $11.2 11.5 Q2’19 Caliber Collision Service Retail 1 16 $3.0 9.7 Q3’19 Dollar General Traditional Retail 5 44 $4.9 11.3 Q3’19 Checkers Service Retail 1 1 $1.0 20.0 Q3’19 Dollar General Traditional Retail 8 71 $9.4 14.8 Q3’19 Mister Car Wash Service Retail 3 13 $13.8 20.0 Q3’19 DaVita Service Retail 1 13 $3.7 9.7 Q3’19 Dialysis Portfolio Service Retail 50 430 $142.9 8.5 Q3’19 2019: Total Closed 165 1,048 $361.5 8.0% 12.8 Pipeline (2) Property Type Number of Properties Square Feet Purchase Price (3) Wgt . Avg. Cap Rate (1) Lease Term Remaining (4) Status DaVita Service Retail 1 7 $2.6 9.8 PSA Executed Dollar General Traditional Retail 1 9 $1.2 15.0 PSA Executed Mister Car Wash Service Retail 2 9 $10.4 19.9 PSA Executed Advance Auto Traditional Retail 12 82 $12.7 8.8 PSA Executed Advance Auto Traditional Retail 14 97 $15.4 9.6 PSA Executed IMTAA (Gas & Convenience) Service Retail 1 3 $3.8 19.5 PSA Executed Pizza Hut Service Retail 17 49 $11.9 20.0 LOI Executed 2019: Total Pipeline 48 257 $57.9 7.4% 12.0 2019: Total Closed + Pipeline 213 1,305 $419.4 7.9% (1) 12.7 5

American Finance Trust, Inc. ACQUISITION & STRATEGIC DISPOSITION PROGRAM We continue to improve the portfolio by opportunistically acquiring service - oriented retail properties with long term leases Note: Data reflects 2017 through Q3 2019 closed dispositions and acquisitions as of September 30, 2019 . All data weighted by annualized straight - line rent as of September 30, 2019 . 1) Weighted average lease term remaining based on disposition date for dispositions and remaining lease term as of September 30, 2019 for acquisitions. 6 Metrics Dispositions Acquisitions # of Properties 87 370 Wgt . Average Lease Term Remaining (1) 6 Years 15 Years Service Retail 18% 87% Traditional Retail 2% 8% Distribution 34% 4% Office 46% 1% 2017 Through Q3 2019 Transaction Summary Wgt. Average Lease Term Remaining (1) Service Retail Acquisition Focus Recently Acquired Properties Increasing Service Retail Concentration Increasing Lease Duration 13% 87% Non-Service Retail Service Retail 7 Years 17 Years 2017 Through Q3 2019 Dispositions 2017 Through Q3 2019 Acquisitions
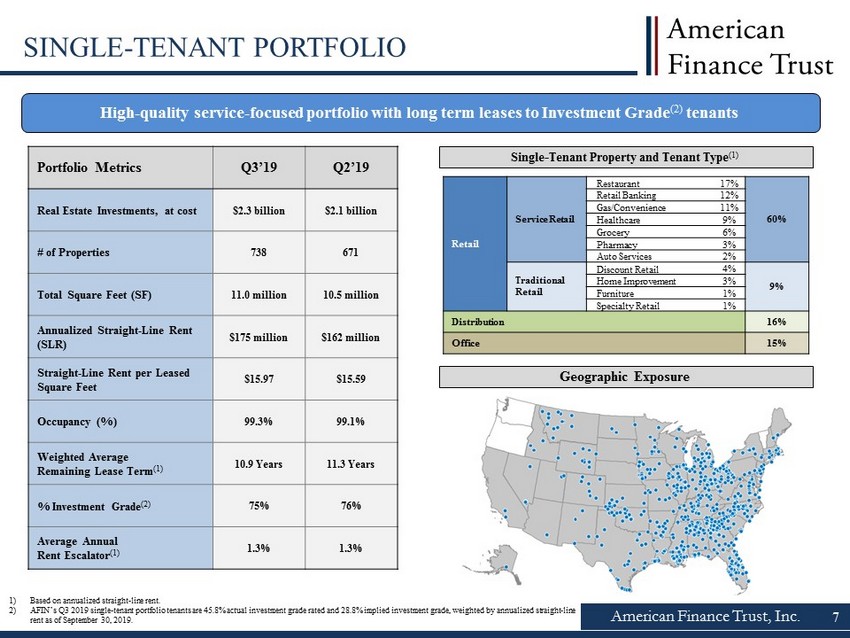
High - quality service - focused portfolio with long term leases to Investment Grade (2) tenants Portfolio Metrics Q3’19 Q2’19 Real Estate Investments, at cost $2.3 billion $2.1 billion # of Properties 738 671 Total Square Feet (SF) 11.0 million 10.5 million Annualized Straight - Line Rent (SLR) $175 million $162 million Straight - Line Rent per Leased Square Feet $15.97 $15.59 Occupancy (%) 99.3% 99.1% Weighted Average Remaining Lease Term (1) 10.9 Years 11.3 Years % Investment Grade (2) 75% 76% Average Annual Rent Escalator (1) 1.3% 1.3% American Finance Trust, Inc. 7 SINGLE - TENANT PORTFOLIO 1) Based on annualized straight - line rent. 2) AFIN’s Q3 2019 single - tenant portfolio tenants are 45.8% actual investment grade rated and 28.8% implied investment grade, weigh ted by annualized straight - line rent as of September 30, 2019. Single - Tenant Property and Tenant Type (1) Retail Service Retail Restaurant 17% 60% Retail Banking 12% Gas/Convenience 11% Healthcare 9% Grocery 6% Pharmacy 3% Auto Services 2% Traditional Retail Discount Retail 4% 9% Home Improvement 3% Furniture 1% Specialty Retail 1% Distribution 16% Office 15% Geographic Exposure
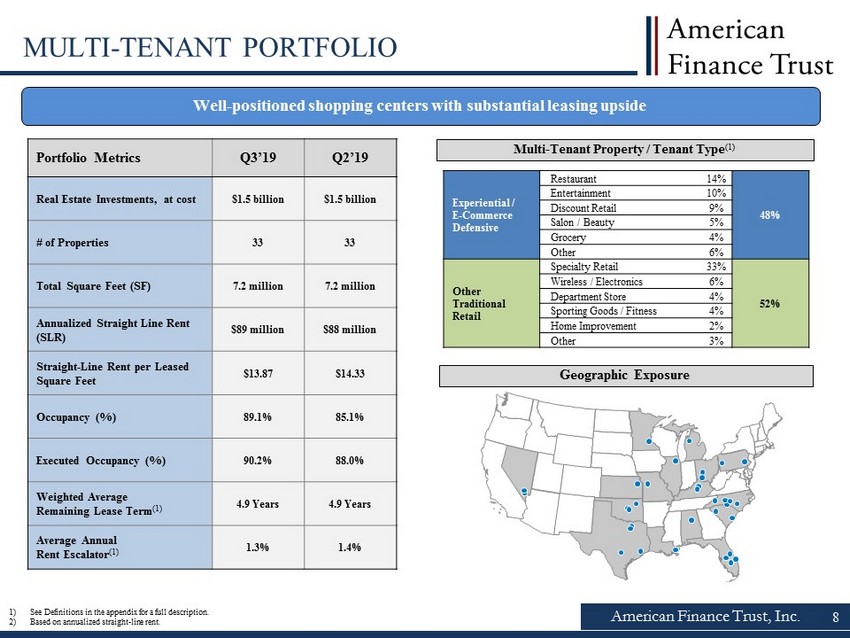
American Finance Trust, Inc. MULTI - TENANT PORTFOLIO Well - positioned shopping centers with substantial leasing upside Portfolio Metrics Q3’19 Q2’19 Real Estate Investments, at cost $1.5 billion $1.5 billion # of Properties 33 33 Total Square Feet (SF) 7.2 million 7.2 million Annualized Straight Line Rent (SLR) $89 million $88 million Straight - Line Rent per Leased Square Feet $13.87 $14.33 Occupancy (%) 89.1% 85.1% Executed Occupancy (%) 90.2% 88.0% Weighted Average Remaining Lease Term (1) 4.9 Years 4.9 Years Average Annual Rent Escalator (1) 1.3% 1.4% Multi - Tenant Property / Tenant Type (1) 1) See Definitions in the appendix for a full description. 2) Based on annualized straight - line rent. Experiential / E - Commerce Defensive Restaurant 14% 48% Entertainment 10% Discount Retail 9% Salon / Beauty 5% Grocery 4% Other 6% Other Traditional Retail Specialty Retail 33% 52% Wireless / Electronics 6% Department Store 4% Sporting Goods / Fitness 4% Home Improvement 2% Other 3% Geographic Exposure 8
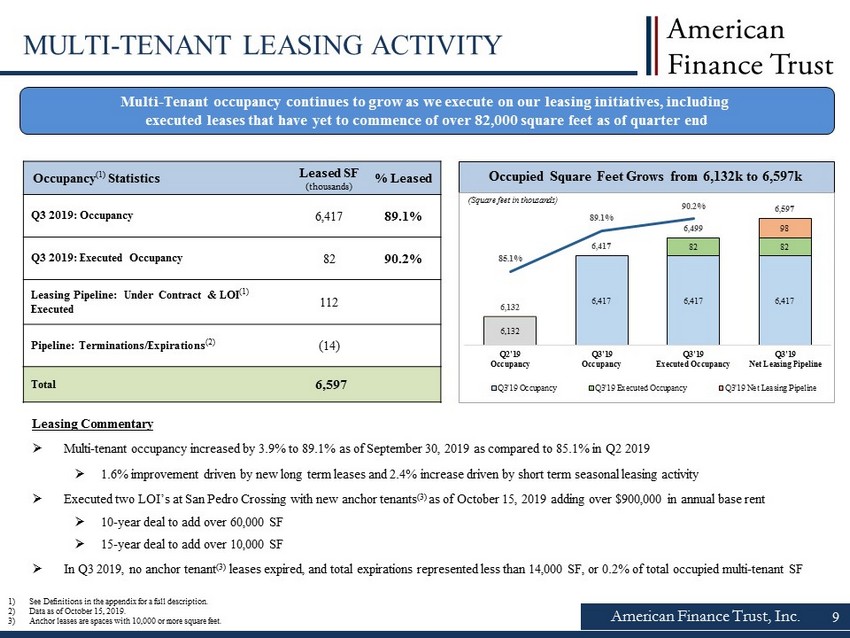
American Finance Trust, Inc. 9 MULTI - TENANT LEASING ACTIVITY Leasing Commentary » Multi - tenant occupancy increased by 3.9% to 89.1% as of September 30, 2019 as compared to 85.1% in Q2 2019 » 1.6% improvement driven by new long term leases and 2.4% increase driven by short term seasonal leasing activity » Executed two LOI’s at San Pedro Crossing with new anchor tenants (3) as of October 15, 2019 adding over $900,000 in annual base rent » 10 - year deal to add over 60,000 SF » 15 - year deal to add over 10,000 SF » In Q3 2019, no anchor tenant (3) leases expired, and total expirations represented less than 14,000 SF, or 0.2% of total occupied multi - tenant SF 1) See Definitions in the appendix for a full description. 2) Data as of October 15, 2019. 3) Anchor leases are spaces with 10,000 or more square feet. Occupancy (1) Statistics Leased SF (thousands) % Leased Q3 2019: Occupancy 6,417 89.1% Q3 2019: Executed Occupancy 82 90.2% Leasing Pipeline: Under Contract & LOI (1) Executed 112 Pipeline: Terminations/Expirations (2) (14) Total 6,597 Occupied Square Feet Grows from 6,132k to 6,597k (Square feet in thousands) Multi - Tenant occupancy continues to grow as we execute on our leasing initiatives, including executed leases that have yet to commence of over 82,000 square feet as of quarter end 6,132 6,417 6,417 6,417 82 82 98 6,132 6,417 6,499 6,597 85.1% 89.1% 90.2% 6,000 6,002 6,004 6,006 6,008 6,010 6,012 6,014 6,016 6,018 6,020 6,022 6,024 6,026 6,028 6,030 6,032 6,034 6,036 6,038 6,040 6,042 6,044 6,046 6,048 6,050 6,052 6,054 6,056 6,058 6,060 6,062 6,064 6,066 6,068 6,070 6,072 6,074 6,076 6,078 6,080 6,082 6,084 6,086 6,088 6,090 6,092 6,094 6,096 6,098 6,100 6,102 6,104 6,106 6,108 6,110 6,112 6,114 6,116 6,118 6,120 6,122 6,124 6,126 6,128 6,130 6,132 6,134 6,136 6,138 6,140 6,142 6,144 6,146 6,148 6,150 6,152 6,154 6,156 6,158 6,160 6,162 6,164 6,166 6,168 6,170 6,172 6,174 6,176 6,178 6,180 6,182 6,184 6,186 6,188 6,190 6,192 6,194 6,196 6,198 6,200 6,202 6,204 6,206 6,208 6,210 6,212 6,214 6,216 6,218 6,220 6,222 6,224 6,226 6,228 6,230 6,232 6,234 6,236 6,238 6,240 6,242 6,244 6,246 6,248 6,250 6,252 6,254 6,256 6,258 6,260 6,262 6,264 6,266 6,268 6,270 6,272 6,274 6,276 6,278 6,280 6,282 6,284 6,286 6,288 6,290 6,292 6,294 6,296 6,298 6,300 6,302 6,304 6,306 6,308 6,310 6,312 6,314 6,316 6,318 6,320 6,322 6,324 6,326 6,328 6,330 6,332 6,334 6,336 6,338 6,340 6,342 6,344 6,346 6,348 6,350 6,352 6,354 6,356 6,358 6,360 6,362 6,364 6,366 6,368 6,370 6,372 6,374 6,376 6,378 6,380 6,382 6,384 6,386 6,388 6,390 6,392 6,394 6,396 6,398 6,400 6,402 6,404 6,406 6,408 6,410 6,412 6,414 6,416 6,418 6,420 6,422 6,424 6,426 6,428 6,430 6,432 6,434 6,436 6,438 6,440 6,442 6,444 6,446 6,448 6,450 6,452 6,454 6,456 6,458 6,460 6,462 6,464 6,466 6,468 6,470 6,472 6,474 6,476 6,478 6,480 6,482 6,484 6,486 6,488 6,490 6,492 6,494 6,496 6,498 6,500 6,502 6,504 6,506 6,508 6,510 6,512 6,514 6,516 6,518 6,520 6,522 6,524 6,526 6,528 6,530 6,532 6,534 6,536 6,538 6,540 6,542 6,544 6,546 6,548 6,550 6,552 6,554 6,556 6,558 6,560 6,562 6,564 6,566 6,568 6,570 6,572 6,574 6,576 6,578 6,580 6,582 6,584 6,586 6,588 6,590 6,592 6,594 6,596 6,598 6,600 Q2'19 Occupancy Q3'19 Occupancy Q3'19 Executed Occupancy Q3'19 Net Leasing Pipeline Q3'19 Occupancy Q3'19 Executed Occupancy Q3'19 Net Leasing Pipeline
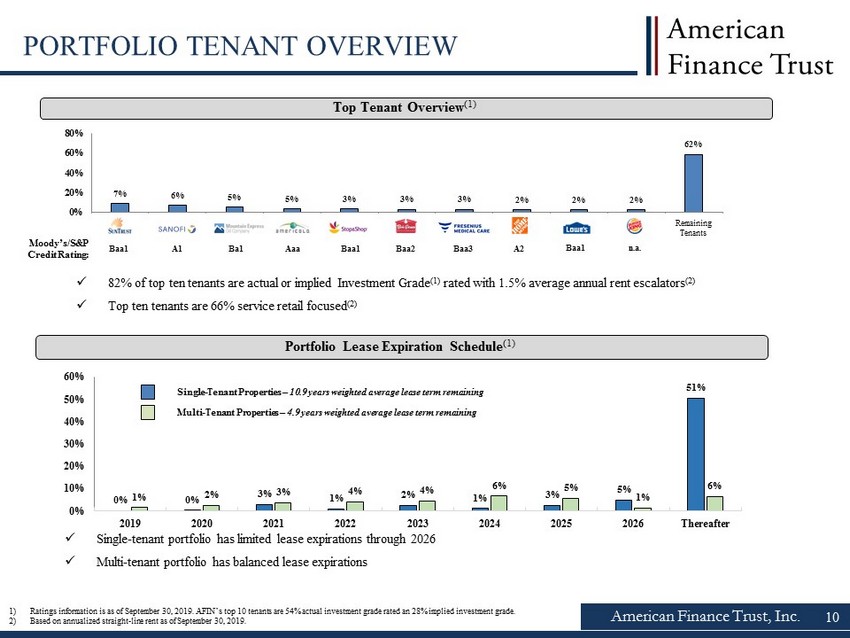
7% 6% 5% 5% 3% 3% 3% 2% 2% 2% 62% 0% 20% 40% 60% 80% SunTrust Bank Sanofi US AmeriCold Stop & Shop Bob Evans Lowe's Home Depot Mountain Express C&S Grocer Burger King Remaining Tenants American Finance Trust, Inc. PORTFOLIO TENANT OVERVIEW 1) Ratings information is as of September 30, 2019. AFIN’s top 10 tenants are 54% actual investment grade rated an 28% implied i nve stment grade. 2) Based on annualized straight - line rent as of September 30, 2019 . Top Tenant Overview (1) Remaining Tenants Moody’s/S&P Credit Rating: 10 Baa1 Portfolio Lease Expiration Schedule (1) x Single - tenant portfolio has limited lease expirations through 2026 x Multi - tenant portfolio has balanced lease expirations Multi - Tenant Properties – 4.9 years weighted average lease term remaining Single - Tenant Properties – 10.9 years weighted average lease term remaining 0% 0% 3% 1% 2% 1% 3% 5% 51% 1% 2% 3% 4% 4% 6% 5% 1% 6% 0% 10% 20% 30% 40% 50% 60% 2019 2020 2021 2022 2023 2024 2025 2026 Thereafter A1 Ba1 Aaa Baa1 Baa2 A2 Baa1 n.a. x 82 % of top ten tenants are actual or implied Investment Grade (1) rated with 1.5% average annual rent escalators (2) x Top ten tenants are 66 % service retail focused (2) Baa3
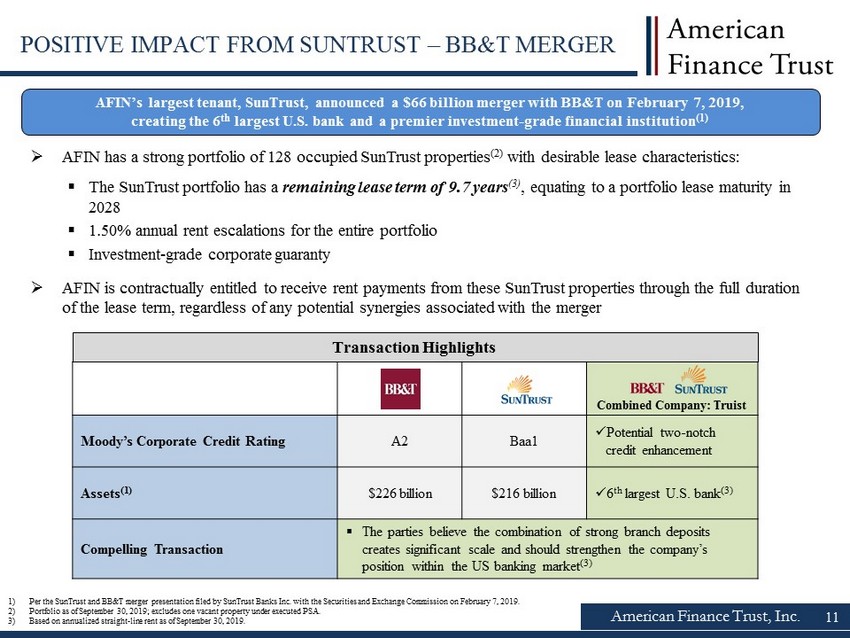
American Finance Trust, Inc. POSITIVE IMPACT FROM SUNTRUST – BB&T MERGER 11 1) Per the SunTrust and BB&T merger presentation filed by SunTrust Banks Inc. with the Securities and Exchange Commission on Feb rua ry 7, 2019. 2) Portfolio as of September 30, 2019 ; excludes one vacant property under executed PSA. 3) Based on annualized straight - line rent as of September 30, 2019 . Moody’s Corporate Credit Rating A2 Baa1 x Potential two - notch credit enhancement Assets (1) $226 billion $216 billion x 6 th largest U.S. bank (3) Compelling Transaction ▪ The parties believe the c ombination of strong branch deposits creates significant scale and should strengthen the company’s position within the US banking market (3) Transaction Highlights AFIN’s largest tenant, SunTrust, announced a $66 billion merger with BB&T on February 7, 2019, creating the 6 th largest U.S. bank and a premier investment - grade financial institution (1) » AFIN has a strong portfolio of 128 occupied SunTrust properties (2) with desirable lease characteristics: ▪ The SunTrust portfolio has a remaining lease term of 9.7 years (3) , equating to a portfolio lease maturity in 2028 ▪ 1.50% annual rent escalations for the entire portfolio ▪ Investment - grade corporate guaranty » AFIN is contractually entitled to receive rent payments from these SunTrust properties through the full duration of the lease term, regardless of any potential synergies associated with the merger Combined Company: Truist

American Finance Trust, Inc. Reducing SunTrust Exposure (2) Redeploying proceeds from occupied SunTrust dispositions into accretive acquisitions with improved portfolio metrics x Year - to - date, AFIN has sold 11 occupied SunTrust properties at a weighted average cash cap rate of 5.4% (1) , generating $31.6 million of gross proceeds (2) ($7.6 million premium above original purchase price) x In Q3’19 and as of October 15, 2019, AFIN completed the sale of 4 occupied SunTrust with a lease term remaining of 10 years a t a 5.4% weighted average cash cap rate (1) , generating $17.3 million of gross proceeds (2) ($4.2 million premium above original purchase price) x AFIN is under contract (4) to sell 4 occupied SunTrust assets with a weighted average lease term of 8 years at a 5.7% weighted average cash cap rate (1) , generating $10.9 million of gross proceeds (2) ($2.2 million premium above original purchase price) x AFIN’s acquisition pipeline has a weighted average cash cap rate of 7.4% (3) with a 12 year remaining lease term (3) , allowing the company to benefit from attractive spreads compared to the SunTrust dispositions x This initiative also allows AFIN to selectively reduce its SunTrust exposure, extend lease duration and further diversify its po rtfolio SUNTRUST REDEPLOYMENT INITIATIVE Key Benefits 12 Note: The analysis above excludes data related to any vacant SunTrust properties. As of September 30, 2019 , AFIN owned 129 SunTrust properties which included 1 vacant property and 128 occupied properties . There can be no assurance that these dispositions will be completed on their current terms, or at all. 1) See Definitions in the appendix for a full description. Weighted average based on annualized cash rent as of September 30, 2019. 2) Gross proceeds represents contract sale price exclusive of closing costs and associated mortgage payoffs. Total year to date mor tgage payoffs of $11.8 million. Mortgage payoff related to Q3 2019 and as of October 15, 2019 disposition of $5.7 million. Estimated mortgage payoffs related to SunTrust dispositions under con tra ct are $4.2 million. 3) Weighted average based on square feet. See Definitions in the appendix for a full description. 4) Based on 2019 pipeline as of October 15, 2019. See slide 5 for details. 11.2% 7.5% 6.9% 183 Occupied Properties 128 Occupied Properties 121 Occupied Properties 12/31/2017 9/30/2019 Post Sale of SunTrust Dispositions Under Contract
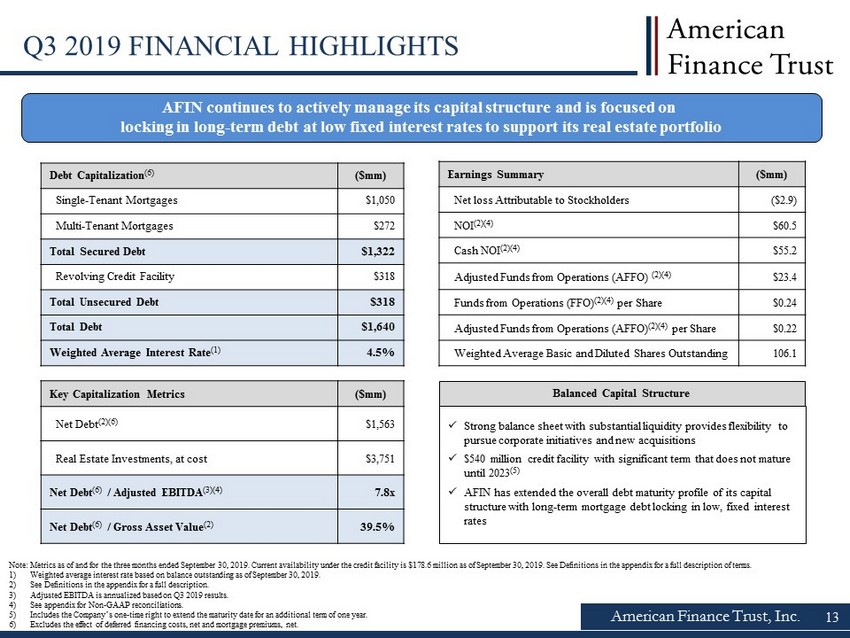
American Finance Trust, Inc. Q3 2019 FINANCIAL HIGHLIGHTS Debt Capitalization (6) ($mm) Single - Tenant Mortgages $1,050 Multi - Tenant Mortgages $272 Total Secured Debt $1,322 Revolving Credit Facility $318 Total Unsecured Debt $318 Total Debt $1,640 Weighted Average Interest Rate (1) 4.5% Key Capitalization Metrics ($mm) Net Debt (2)(6) $1,563 Real Estate Investments, at cost $3,751 Net Debt (6) / Adjusted EBITDA (3)(4) 7.8x Net Debt (6) / Gross Asset Value (2) 39.5% Note: Metrics as of and for the three months ended September 30, 2019 . Current availability under the credit facility is $178.6 million as of September 30, 2019 . See Definitions in the appendix for a full description of terms. 1) Weighted average interest rate based on balance outstanding as of September 30, 2019 . 2) See Definitions in the appendix for a full description. 3) Adjusted EBITDA is annualized based on Q3 2019 results. 4) See appendix for Non - GAAP reconciliations. 5) Includes the Company’s one - time right to extend the maturity date for an additional term of one year. 6) Excludes the effect of deferred financing costs, net and mortgage premiums, net. Balanced Capital Structure AFIN continues to actively manage its capital structure and is focused on locking in long - term debt at low fixed interest rates to support its real estate portfolio Earnings Summary ($mm) Net loss Attributable to Stockholders ($2.9) NOI (2)(4) $60.5 Cash NOI (2)(4) $55.2 Adjusted Funds from Operations (AFFO) (2)(4) $23.4 Funds from Operations (FFO) (2)(4) per Share $0.24 Adjusted Funds from Operations (AFFO) (2)(4) per Share $0.22 Weighted Average Basic and Diluted Shares Outstanding 106.1 x Strong balance sheet with substantial liquidity provides flexibility to pursue corporate initiatives and new acquisitions x $540 million credit facility with significant term that does not mature until 2023 ( 5 ) x AFIN has extended the overall debt maturity profile of its capital structure with long - term mortgage debt locking in low, fixed interest rates 13
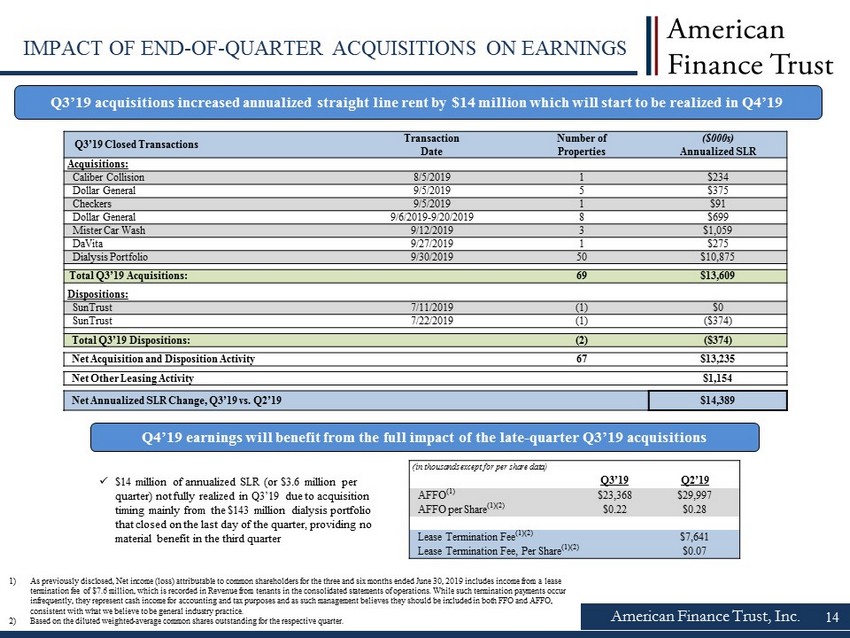
American Finance Trust, Inc. IMPACT OF END - OF - QUARTER ACQUISITIONS ON EARNINGS Q3’19 acquisitions increased annualized straight line rent by $14 million which will start to be realized in Q4’19 Q3’19 Closed Transactions Transaction Date Number of Properties ($000s) Annualized SLR Acquisitions: Caliber Collision 8/5/2019 1 $234 Dollar General 9/5/2019 5 $375 Checkers 9/5/2019 1 $91 Dollar General 9/6/2019 - 9/20/2019 8 $699 Mister Car Wash 9/12/2019 3 $1,059 DaVita 9/27/2019 1 $275 Dialysis Portfolio 9/30/2019 50 $10,875 Total Q3’19 Acquisitions: 69 $13,609 Dispositions: SunTrust 7/11/2019 (1) $0 SunTrust 7/22/2019 (1) ($374) Total Q3’19 Dispositions: (2) ($374) Net Acquisition and Disposition Activity 67 $13,235 Net Other Leasing Activity $1,154 Net Annualized SLR Change, Q3’19 vs. Q2’19 $14,389 14 x $14 million of annualized SLR (or $3.6 million per quarter) not fully realized in Q3’19 due to acquisition timing mainly from the $143 million dialysis portfolio that closed on the last day of the quarter, providing no material benefit in the third quarter (in thousands except for per share data) Q3’19 Q2’19 AFFO (1) $ 23,368 $ 29,997 AFFO per Share (1)(2) $0.22 $0.28 Lease Termination Fee (1)(2) $7,641 Lease Termination Fee, Per Share (1)(2) $0.07 1) As previously disclosed, Net income (loss) attributable to common shareholders for the three and six months ended June 30, 20 19 includes income from a lease termination fee of $7.6 million, which is recorded in Revenue from tenants in the consolidated statements of operations. Whil e s uch termination payments occur infrequently, they represent cash income for accounting and tax purposes and as such management believes they should be inclu ded in both FFO and AFFO, consistent with what we believe to be general industry practice. 2) Based on the diluted weighted - average common shares outstanding for the respective quarter. Q4’19 earnings will benefit from the full impact of the late - quarter Q3’19 acquisitions
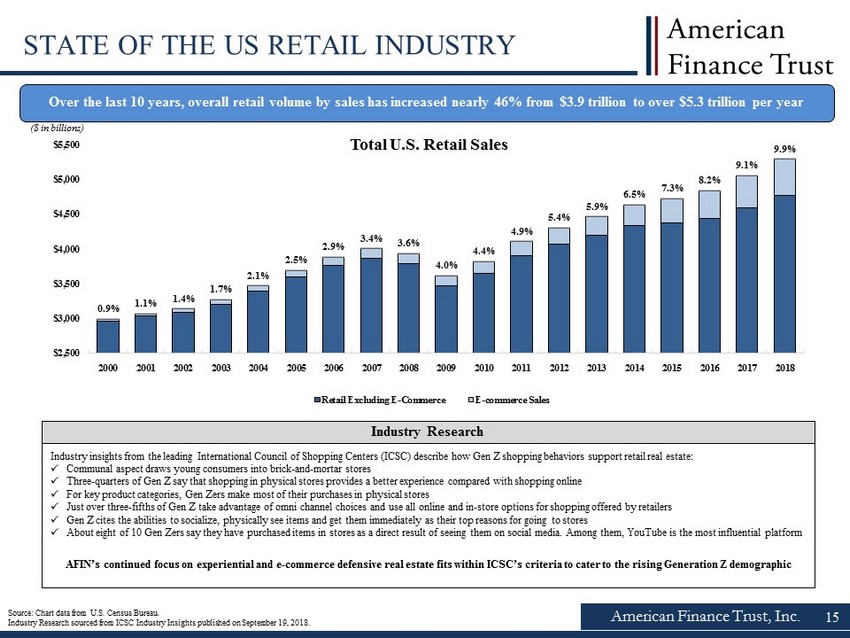
American Finance Trust, Inc. STATE OF TH E US RETAIL INDUSTRY Over the last 10 years, overall retail volume by sales has increased nearly 46% from $3.9 trillion to over $5.3 trillion per year Source: Chart data from U.S. Census Bureau. Industry Research sourced from ICSC Industry Insights published on September 19, 2018. Industry Research Industry insights from the leading International Council of Shopping Centers (ICSC) describe how Gen Z shopping behaviors sup por t retail real estate: x Communal aspect draws young consumers into brick - and - mortar stores x Three - quarters of Gen Z say that shopping in physical stores provides a better experience compared with shopping online x For key product categories, Gen Zers make most of their purchases in physical stores x Just over three - fifths of Gen Z take advantage of omni channel choices and use all online and in - store options for shopping offe red by retailers x Gen Z cites the abilities to socialize, physically see items and get them immediately as their top reasons for going to store s x About eight of 10 Gen Zers say they have purchased items in stores as a direct result of seeing them on social media. Among them, YouTube is the most in fl uential platform AFIN’s continued focus on experiential and e - commerce defensive real estate fits within ICSC’s criteria to cater to the rising G eneration Z demographic 15 0.9% 1.1% 1.4% 1.7% 2.1% 2.5% 2.9% 3.4% 3.6% 4.0% 4.4% 4.9% 5.4% 5.9% 6.5% 7.3% 8.2% 9.1% 9.9% $2,500 $3,000 $3,500 $4,000 $4,500 $5,000 $5,500 2000 2001 2002 2003 2004 2005 2006 2007 2008 2009 2010 2011 2012 2013 2014 2015 2016 2017 2018 Total U.S. Retail Sales Retail Excluding E-Commerce E-commerce Sales ($ in billions)
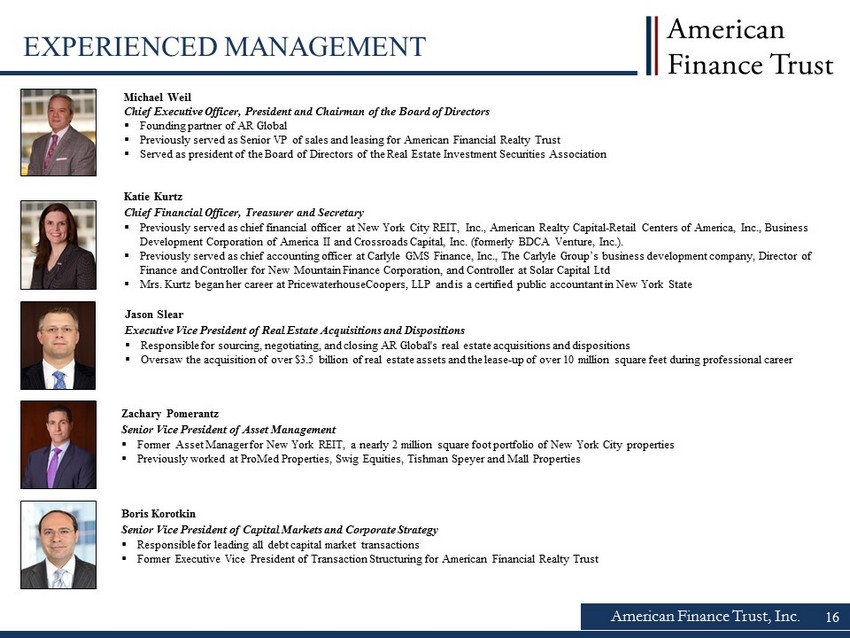
American Finance Trust, Inc. 16 EXPERIENCED MANAGEMENT Jason Slear Executive Vice President of Real Estate Acquisitions and Dispositions ▪ Responsible for sourcing, negotiating, and closing AR Global's real estate acquisitions and dispositions ▪ Oversaw the acquisition of over $3.5 billion of real estate assets and the lease - up of over 10 million square feet during professional career Michael Weil Chief Executive Officer, President and Chairman of the Board of Directors ▪ Founding partner of AR Global ▪ Previously served as Senior VP of sales and leasing for American Financial Realty Trust ▪ Served as president of the Board of Directors of the Real Estate Investment Securities Association Katie Kurtz Chief Financial Officer, Treasurer and Secretary ▪ Previously served as chief financial officer at New York City REIT, Inc ., American Realty Capital - Retail Centers of America, Inc., Business Development Corporation of America II and Crossroads Capital, Inc. (formerly BDCA Venture, Inc.). ▪ Previously served as chief accounting officer at Carlyle GMS Finance, Inc., The Carlyle Group’s business development company, Di rector of Finance and Controller for New Mountain Finance Corporation, and Controller at Solar Capital Ltd ▪ Mrs. Kurtz began her career at PricewaterhouseCoopers, LLP and is a certified public accountant in New York State Zachary Pomerantz Senior Vice President of Asset Management ▪ Former Asset Manager for New York REIT, a nearly 2 million square foot portfolio of New York City properties ▪ Previously worked at ProMed Properties, Swig Equities, Tishman Speyer and Mall Properties Boris Korotkin Senior Vice President of Capital Markets and Corporate Strategy ▪ Responsible for leading all debt capital market transactions ▪ Former Executive Vice President of Transaction Structuring for American Financial Realty Trust

Confidential – Not for Distribution 17 17 Legal Notices
American Finance Trust, Inc. 18 PROJECTIONS This presentation includes estimated projections of future operating results. These projections were not prepared in accordan ce with published guidelines of the SEC or the guidelines established by the American Institute of Certified Public Accountants for p rep aration and presentation of financial projections. This information is not fact and should not be relied upon as being necessarily in dic ative of future results; the projections were prepared in good faith by management and are based on numerous assumptions that may prov e t o be wrong. Important factors that may affect actual results and cause the projections to not be achieved include, but are not lim ite d to, risks and uncertainties relating to the company and other factors described in the “Risk Factors” section of the Company's Annual R epo rt on Form 10 - K for the year ended December 31, 2018, the Company's subsequent Quarterly Reports on Form 10 - Q and in future filings wi th the SEC. The projections also reflect assumptions as to certain business decisions that are subject to change. As a result, a ctu al results may differ materially from those contained in the estimates. Accordingly, there can be no assurance that the estimates will b e r ealized. This presentation also contains estimates and information concerning our industry, including market position, market size, an d g rowth rates of the markets in which we participate, that are based on industry publications and reports. This information involves a n umber of assumptions and limitations, and you are cautioned not to give undue weight to these estimates. We have not independently ver ifi ed the accuracy or completeness of the data contained in these industry publications and reports. The industry in which we operate i s s ubject to a high degree of uncertainty and risk due to variety of factors, including those described in the “Risk Factors” and "Managem ent 's Discussion and Analysis of Financial Condition and Results of Operations" sections of the Company's Annual Report on Form 10 - K f or the year ended December 31, 2018, filed with the SEC on March 7, 2019, and the Company's subsequent Quarterly Reports on Form 10 - Q filed with the SEC. These and other factors could cause results to differ materially from those expressed in these publicat ion s and reports.

American Finance Trust, Inc. 19 FORWARD - LOOKING STATEMENTS Certain statements made in this presentation are “forward - looking statements” (as defined in Section 21E of the Exchange Act), w hich reflect the expectations of the Company regarding future events. The forward - looking statements involve a number of risks, uncertainties and other factors that could ca use actual results to differ materially from those contained in the forward - looking statements. Such forward - looking statements include, but are not limited to, market and other e xpectations, objectives, and intentions, as well as any other statements that are not historical facts. Our potential risks and uncertainties are presented in the section titled “Item 1A - Risk Factors” disclosed in our Annual Report on Form 10 - K for the year ended December 31, 2018 filed with the SEC on March 7, 2019, and the Company's subsequent Quarterly Reports on Form 10 - Q filed with the SEC. We di sclaim any obligation to update and revise statements contained in these materials to reflect changed assumptions, the occurrence of unanticipated events or changes to fut ure operating results over time, unless required by law. The following are some of the risks and uncertainties relating to us, although not all risks and uncertainties, that cou ld cause our actual results to differ materially from those presented in our forward - looking statements: ▪ All of our executive officers are also officers, managers, employees or holders of a direct or indirect controlling interest in American Finance Advisors, LLC (the “Advisor”) or other entities under common control with AR Global Investments, LLC (the successor business to AR Capital, LLC, “AR Global”). As a result, our executive officers, the Advisor and its affiliates face conflicts of interest, including significant conflicts created by the Advisor’s compensation arr angements with us and other investment programs advised by affiliates of AR Global and conflicts in allocating time among these entities and us, which could negatively impac t o ur operating results. ▪ The trading price of our Class A common stock and 7.50% Series A Cumulative Redeemable Perpetual Preferred Stock, $0.01 par v alu e per share (the “Series A Preferred Stock”), may fluctuate significantly. ▪ Lincoln Retail REIT Services, LLC (“Lincoln”) and its affiliates, which provide services to the Advisor in connection with ou r r etail portfolio, faces conflicts of interest in allocating its employees’ time between providing real estate - related services to the Advisor and other programs and activities i n which they are presently involved or may be involved in the future. ▪ The performance of our retail portfolio is linked to the market for retail space generally and factors that may impact our re tai l tenants, such as the increasing use of the Internet by retailers and consumers. ▪ Our rental revenue is dependent upon the success and economic viability of our tenants. ▪ We may be unable to enter into and consummate property acquisitions on advantageous terms or our property acquisitions may no t p erform as we expect. ▪ Provisions in our revolving unsecured corporate credit facility may limit our ability to pay dividends on our Class A common sto ck, our Series A Preferred Stock or any other equity interests we may issue. ▪ We have not generated, and in the future may not generate, operating cash flows sufficient to fund all of the dividends we pa y o ur stockholders, and, as such, we may be forced to fund dividends from other sources, including borrowings, which may not be available on favorable terms, or at all. ▪ We may be unable to pay or maintain cash dividends at the current rate or increase dividends over time. ▪ We are obligated to pay fees, which may be substantial, to the Advisor and its affiliates. ▪ Our operating results are affected by economic and regulatory changes that have an adverse impact on the real estate market i n g eneral, and we are subject to risks associated with any dislocation or liquidity disruptions that may exist or occur in global financial markets, including the credit marke ts of the United States of America. ▪ We may fail to continue to qualify to be treated as a real estate investment trust (“REIT”) for U.S. federal income tax purpo ses , which would result in higher taxes, may adversely affect our operations and would reduce the value of an investment in our Class A common stock, our Series A Preferr ed Stock and our cash available for dividends.

Confidential – Not for Distribution 20 20 Appendix

American Finance Trust, Inc. 21 DEFINITIONS AFFO : In calculating AFFO, we start with FFO, then we exclude certain income or expense items from AFFO that we consider to be more reflective of investing activities, such as fees related to the listing of our Class A common stock on the Nasdaq Global Select Market, non - cash income and expense items and the income and expense effects of other activities that are not a fundamental attribute of our day to day operating business plan, such as amounts related to the litigation arising out of AFIN's 2017 merger with American Realty Capital - Retail Centers of America, Inc . (the “Merger”) . These amounts include legal costs incurred as a result of the litigation, portions of which have been and may in the future be reimbursed under insurance policies maintained by us . Insurance reimbursements are deducted from AFFO in the period of reimbursement . We believe that excluding the litigation costs and subsequent insurance reimbursements litigation arising out of the Merger helps to provide a better understanding of the operating performance of our business . Other income and expense items also include early extinguishment of debt and unrealized gains and losses, which may not ultimately be realized, such as gains or losses on derivative instruments and gains and losses on investments . In addition, by excluding non - cash income and expense items such as amortization of above - market and below - market leases intangibles, amortization of deferred financing costs, straight - line rent, vesting and conversion of the Class B Units and share - based compensation related to restricted shares and the 2018 outperformance agreement with the Advisor from AFFO, we believe we provide useful information regarding those income and expense items which have a direct impact on our ongoing operating performance . By providing AFFO, we believe we are presenting useful information that can be used to better assess the sustainability of our ongoing operating performance without the impact of transactions or other items that are not related to the ongoing performance of our portfolio of properties . AFFO presented by us may not be comparable to AFFO reported by other REITs that define AFFO differently . Annualized Straight - Line Rent : Straight line rent which is annualized and calculated using most recent available lease terms as of September 30 , 2019 . Cash Cap Rate : For acquisitions, cash cap rate is a rate of return on a real estate investment property based on the expected, annualized cash rental income during the first year of ownership that the property will generate under its existing lease . For dispositions, cash cap rate is a rate of return based on the annualized cash rental income of the property to be sold . For acquisitions, cash cap rate is calculated by dividing the annualized cash rental income the property will generate (before debt service and depreciation and after fixed costs and variable costs) and the purchase price of the property . For dispositions, cash cap rate is calculated by dividing the annualized cash rental income by the contract sales price for the property . Cash NOI : We define Cash NOI as NOI excluding amortization of above/below market lease intangibles and straight - line adjustments that are included in GAAP lease revenues . Executed Occupancy : Includes Occupancy as of September 30 , 2019 as defined below as well as all leases executed by both parties as of September 30 , 2019 where the tenant has yet to take possession as of such date . Experiential Retail : We define Experiential Retail as multi - tenant properties leased to tenants in the restaurant, discount retail, entertainment, salon/beauty, and grocery sectors, among others . FFO : We define FFO, a non - GAAP measure, consistent with the standards established over time by the Board of Governors of NAREIT, as restated in a White Paper and approved by the Board of Governors of NAREIT effective in December 2018 (the "White Paper") . The White Paper defines FFO as net income or loss computed in accordance with GAAP excluding depreciation and amortization related to real estate, gains and losses from sales of certain real estate assets, gain and losses from change in control and impairment write - downs of certain real estate assets and investments in entities when the impairment is directly attributable to decreases in the value of depreciable real estate held by the entity . Adjustments for unconsolidated partnerships and joint ventures are calculated to exclude the proportionate share of the non - controlling interest to arrive at FFO attributable to stockholders . Our FFO calculation complies with NAREIT's definition . Gross Asset Value : Total assets plus accumulated depreciation and amortization .
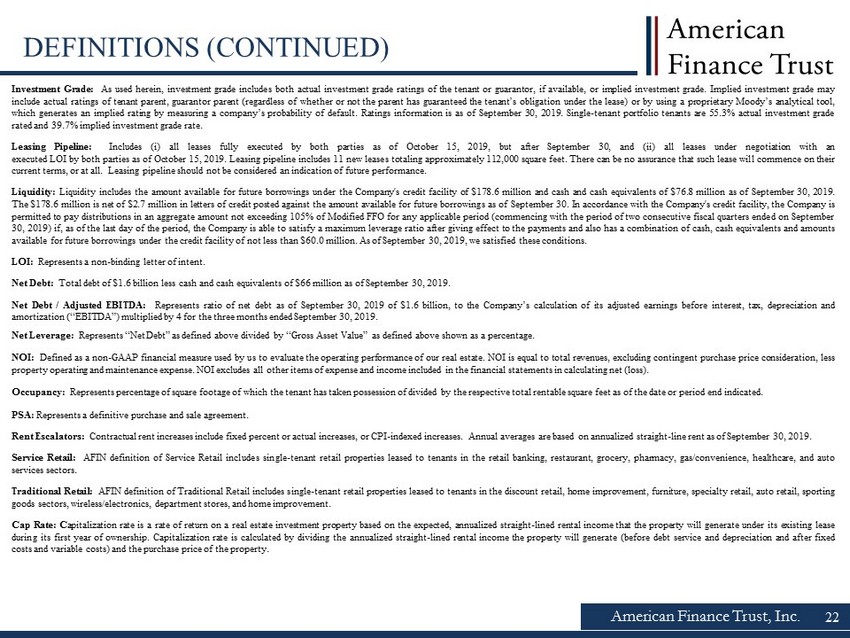
American Finance Trust, Inc. 22 DEFINITIONS (CONTINUED) Investment Grade : As used herein, investment grade includes both actual investment grade ratings of the tenant or guarantor, if available, or implied investment grade . Implied investment grade may include actual ratings of tenant parent, guarantor parent (regardless of whether or not the parent has guaranteed the tenant’s obligation under the lease) or by using a proprietary Moody’s analytical tool, which generates an implied rating by measuring a company’s probability of default . Ratings information is as of September 30 , 2019 . Single - tenant portfolio tenants are 55 . 3 % actual investment grade rated and 39 . 7 % implied investment grade rate . Leasing Pipeline : Includes ( i ) all leases fully executed by both parties as of October 15 , 2019 , but after September 30 , and (ii) all leases under negotiation with an executed LOI by both parties as of October 15 , 2019 . Leasing pipeline includes 11 new leases totaling approximately 112 , 000 square feet . There can be no assurance that such lease will commence on their current terms, or at all . Leasing pipeline should not be considered an indication of future performance . Liquidity : Liquidity includes the amount available for future borrowings under the Company's credit facility of $ 178 . 6 million and cash and cash equivalents of $ 76 . 8 million as of September 30 , 2019 . The $ 178 . 6 million is net of $ 2 . 7 million in letters of credit posted against the amount available for future borrowings as of September 30 . In accordance with the Company's credit facility, the Company is permitted to pay distributions in an aggregate amount not exceeding 105 % of Modified FFO for any applicable period (commencing with the period of two consecutive fiscal quarters ended on September 30 , 2019 ) if, as of the last day of the period, the Company is able to satisfy a maximum leverage ratio after giving effect to the payments and also has a combination of cash, cash equivalents and amounts available for future borrowings under the credit facility of not less than $ 60 . 0 million . As of September 30 , 2019 , we satisfied these conditions . LOI : Represents a non - binding letter of intent . Net Debt : Total debt of $ 1 . 6 billion less cash and cash equivalents of $ 66 million as of September 30 , 2019 . Net Debt / Adjusted EBITDA : Represents ratio of net debt as of September 30 , 2019 of $ 1 . 6 billion, to the Company’s calculation of its adjusted earnings before interest, tax, depreciation and amortization (“EBITDA”) multiplied by 4 for the three months ended September 30 , 2019 . Net Leverage : Represents “Net Debt” as defined above divided by “Gross Asset Value” as defined above shown as a percentage . NOI : Defined as a non - GAAP financial measure used by us to evaluate the operating performance of our real estate . NOI is equal to total revenues, excluding contingent purchase price consideration, less property operating and maintenance expense . NOI excludes all other items of expense and income included in the financial statements in calculating net (loss) . Occupancy : Represents percentage of square footage of which the tenant has taken possession of divided by the respective total rentable square feet as of the date or period end indicated . PSA : Represents a definitive purchase and sale agreement . Rent Escalators : Contractual rent increases include fixed percent or actual increases, or CPI - indexed increases . Annual averages are based on annualized straight - line rent as of September 30 , 2019 . Service Retail : AFIN definition of Service Retail includes single - tenant retail properties leased to tenants in the retail banking, restaurant, grocery, pharmacy, gas/convenience, healthcare, and auto services sectors . Traditional Retail : AFIN definition of Traditional Retail includes single - tenant retail properties leased to tenants in the discount retail, home improvement, furniture, specialty retail, auto retail, sporting goods sectors, wireless/electronics, department stores, and home improvement . Cap Rate : C apitalization rate is a rate of return on a real estate investment property based on the expected, annualized straight - lined rental income that the property will generate under its existing lease during its first year of ownership . Capitalization rate is calculated by dividing the annualized straight - lined rental income the property will generate (before debt service and depreciation and after fixed costs and variable costs) and the purchase price of the property .
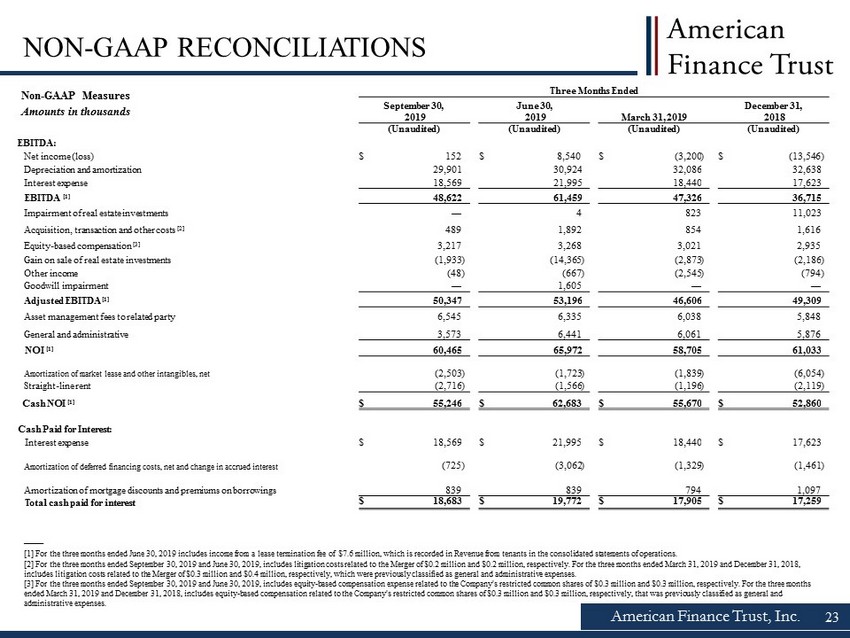
American Finance Trust, Inc. 23 NON - GAAP RECONCILIATIONS —— [1] For the three months ended June 30, 2019 includes income from a lease termination fee of $7.6 million, which is recorded in Revenue from tenants in the consolidated statements of operations. [2] For the three months ended September 30, 2019 and June 30, 2019, includes litigation costs related to the Merger of $0.2 mil lion and $0.2 million, respectively. For the three months ended March 31, 2019 and December 31, 2018, includes litigation costs related to the Merger of $0.3 million and $0.4 million, respectively, which were previously classif ied as general and administrative expenses. [3] For the three months ended September 30, 2019 and June 30, 2019, includes equity - based compensation expense related to the C ompany's restricted common shares of $0.3 million and $0.3 million, respectively. For the three months ended March 31, 2019 and December 31, 2018, includes equity - based compensation related to the Company's restricted common shares of $0.3 million and $0.3 million, respectively, that was previously classified as general and administrative expenses. Non - GAAP Measures Amounts in thousands Three Months Ended September 30, 2019 June 30, 2019 March 31, 2019 December 31, 2018 (Unaudited) (Unaudited) (Unaudited) (Unaudited) EBITDA: Net income (loss) $ 152 $ 8,540 $ (3,200 ) $ (13,546 ) Depreciation and amortization 29,901 30,924 32,086 32,638 Interest expense 18,569 21,995 18,440 17,623 EBITDA [1] 48,622 61,459 47,326 36,715 Impairment of real estate investments — 4 823 11,023 Acquisition, transaction and other costs [2] 489 1,892 854 1,616 Equity - based compensation [3] 3,217 3,268 3,021 2,935 Gain on sale of real estate investments (1,933 ) (14,365 ) (2,873 ) (2,186 ) Other income (48 ) (667 ) (2,545 ) (794 ) Goodwill impairment — 1,605 — — Adjusted EBITDA [1] 50,347 53,196 46,606 49,309 Asset management fees to related party 6,545 6,335 6,038 5,848 General and administrative 3,573 6,441 6,061 5,876 NOI [1] 60,465 65,972 58,705 61,033 Amortization of market lease and other intangibles, net (2,503 ) (1,723 ) (1,839 ) (6,054 ) Straight - line rent (2,716 ) (1,566 ) (1,196 ) (2,119 ) Cash NOI [1] $ 55,246 $ 62,683 $ 55,670 $ 52,860 Cash Paid for Interest: Interest expense $ 18,569 $ 21,995 $ 18,440 $ 17,623 Amortization of deferred financing costs, net and change in accrued interest (725 ) (3,062 ) (1,329 ) (1,461 ) Amortization of mortgage discounts and premiums on borrowings 839 839 794 1,097 Total cash paid for interest $ 18,683 $ 19,772 $ 17,905 $ 17,259

American Finance Trust, Inc. 24 NON - GAAP RECONCILIATIONS Non - GAAP Measures Amounts in thousands, except per share data —— [1] FFO and AFFO for the three months ended June 30, 2019 includes income from a lease termination fee of $7.6 million, whi ch is recorded in Revenue from tenants in the consolidated statements of operations. While such termination payments occur infrequently, they represent cash income for accounting and tax purposes and as such management believes they should be inclu ded in both FFO and AFFO, consistent with what the Company believes to be general industry practice. [2] Includes litigation costs related to the Merger which were included as an adjustment in the calculation above beginning in the fourth quarter of 2018, and were not presented as an adjustment in our Quarterly Reports on Form 10 - Q for the quarters ende d March 31, 2018, June 30, 2018 and September 30, 2018. [3] Included in "Other income" in the Company's consolidated statement of operations. [4] Includes expense related to the amortization of the Company's restricted common shares and LTIP Units related to its mu lti - year outperformance agreement, which were previously presented in separate lines within the table above. [5] This is a non - cash item and is added back as it is not considered a part of operating performance. [6] Represents dividends declared to common stockholders. In January 2019, the Company declared a dividend for December 201 8, January 2019 and February 2019 resulting in only 11 months of declared dividends during the year ended December 31, 2018. Notwithstanding the changes to the de claration dates, the Company paid 12 months of dividends during the year ended December 31, 2018. Three Months Ended September 30, 2019 June 30, 2019 March 31, 2019 December 31, 2018 (Unaudited) (Unaudited) (Unaudited) (Unaudited) Funds from operations (FFO): Net income (loss) attributable to common stockholders (in accordance with GAAP) $ (2,931 ) $ 7,884 $ (3,227 ) $ (13,524 ) Impairment of real estate investments — 4 823 11,023 Depreciation and amortization 29,901 30,924 32,086 32,638 Gain on sale of real estate investments (1,933 ) (14,365 ) (2,873 ) (2,186 ) Proportionate share of adjustments for non - controlling interest to arrive at FFO (45 ) (27 ) (49 ) (67 ) FFO attributable to common stockholders [1] 24,992 24,420 26,760 27,884 Acquisition, transaction and other costs [2] 489 1,892 854 1,616 Litigation cost reimbursements related to the Merger [3] — (115 ) (1,833 ) — Amortization of market lease and other intangibles, net (2,503 ) (1,723 ) (1,839 ) (6,054 ) Straight - line rent (2,716 ) (1,566 ) (1,196 ) (2,119 ) Amortization of mortgage premiums on borrowings (839 ) (839 ) (794 ) (1,097 ) Equity - based compensation [4] 3,217 3,268 3,021 2,935 Amortization of deferred financing costs, net and change in accrued interest 725 3,062 1,329 1,461 Goodwill impairment [5] — 1,605 — — Proportionate share of adjustments for non - controlling interest to arrive at AFFO 3 (7 ) 1 6 AFFO attributable to common stockholders [1] $ 23,368 $ 29,997 $ 26,303 $ 24,632 Weighted - average common shares outstanding 106,140 106,394 106,077 106,096 Net income (loss) per share attributable to common stockholders — Basic and Diluted $ (0.03 ) $ 0.07 $ (0.03 ) $ (0.13 ) FFO per common share $ 0.24 $ 0.23 $ 0.25 $ 0.26 AFFO per common share $ 0.22 $ 0.28 $ 0.25 $ 0.23 Dividends declared [6] $ 29,212 $ 29,213 $ 29,207 $ 19,487