Exhibit 99.1

May 2021 First Quarter 2021 Investor Presentation (NASDAQ: AFIN)

American Finance Trust, Inc. Q1 2021 COMPANY HIGHLIGHTS Service - Oriented Retail Focus AFIN’s portfolio consists of 71% Service Retail or Experiential Retail tenants that are more resistant to e - commerce vs. Traditional Retail (1) High Portfolio Occupancy 95% portfolio Occupancy (1) supported by a balance of long - term net lease Service Retail (1) single - tenant assets and retail centers focused on Experiential Retail (1) tenants High - Quality Portfolio 70 % of AFIN’s top 20 tenants are actual or implied Investment Grade (1) rated Strong Balance Sheet Liquidity (1) of $218 million, Net Leverage (1) of 40.4% and weighted average debt maturity of 4.5 years Robust Acquisition Program Total year - to - date closed and pipeline acquisitions of $72 million with a Cash Cap Rate of 7.2% and a weighted average Cap Rate of 8.2% ( 1)(2) Substantial Rent Collection AFIN received over 99% of first quarter original Cash Rent (1) , including 100% of the original Cash Rent from AFIN’s top 20 tenants (3) 1) See Definitions in the appendix for a full description. 2) See slide 8 for additional information. 3) See slides 5 and 7 for additional information. 2
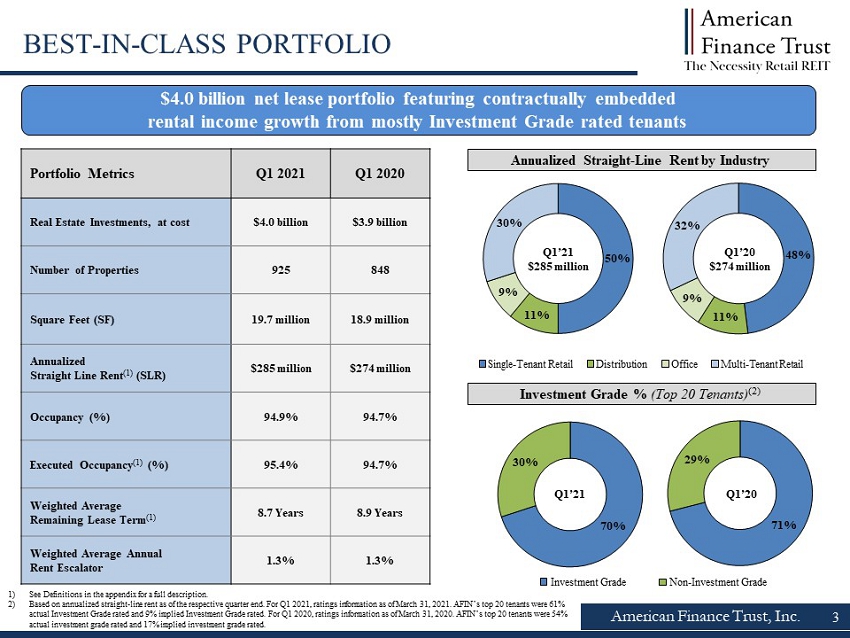
70% 30% 48% 11% 9% 32% 71% 29% 50% 11% 9% 30% American Finance Trust, Inc. $4.0 billion net lease portfolio featuring contractually embedded rental income growth from mostly Investment Grade rated tenants tenants 1) See Definitions in the appendix for a full description. 2) Based on annualized straight - line rent as of the respective quarter end. For Q1 2021, ratings information as of March 31, 2021. AFIN’s top 20 tenants were 61% actual Investment Grade rated and 9% implied Investment Grade rated. For Q1 2020, ratings information as of March 31, 2020. A FIN ’s top 20 tenants were 54% actual investment grade rated and 17% implied investment grade rated. Portfolio Metrics Q1 2021 Q1 2020 Real Estate Investments, at cost $4.0 billion $3.9 billion Number of Properties 925 848 Square Feet (SF) 19.7 million 18.9 million Annualized Straight Line Rent (1) (SLR) $285 million $274 million Occupancy (%) 94.9% 94.7% Executed Occupancy (1) (%) 95.4% 94.7% Weighted Average Remaining Lease Term (1) 8.7 Years 8.9 Years Weighted Average Annual Rent Escalator 1.3% 1.3% BEST - IN - CLASS PORTFOLIO Annualized Straight - Line Rent by Industry 3 Q1’20 $274 million Q1’21 $285 million Single - Tenant Retail Distribution Office Multi - Tenant Retail Investment Grade % (Top 20 Tenants) (2) Investment Grade Non - Investment Grade Q1’21 Q1’20

American Finance Trust, Inc. 4 QUARTERLY HIGHLIGHTS – Q1 2021 Substantial Rent Collection (1) Robust Acquisition Program (4) ▪ In the first quarter, AFIN acquired seven single - tenant properties for $37 million at a 7.3% Cash Cap Rate (2) . ▪ Acquisition pipeline of $35 million to be acquired at a 7.2% Cash Cap Rate. ▪ Total closed and pipeline acquisitions of $72 million with a weighted average Cash Cap Rate of 7.2% and a weighted average Cap Rate (2) of 8.2%. AFIN’s portfolio of mostly Investment Grade rated tenants supported substantial quarterly Cash Rent collection of over 99% while continuing to focus on growing our portfolio of high - quality Necessity - Based (4) real estate assets ▪ AFIN’s portfolio of mostly Investment Grade rated and Necessity - Based Retail tenants continues to result in substantial quarterly rent collection with over 99% of first quarter Cash Rent collected. ▪ Collected 100% of first quarter Cash Rent due from our top 20 tenants. ▪ Collected nearly 100% of first quarter Cash Rent due from our single - tenant portfolio. ▪ Multi - tenant Executed Occupancy and Leasing Pipeline is expected to increase multi - tenant Occupancy from 86.8% to 88.5% as rent commences over time and if signed letters of intent lead to definitive agreements, which is not assured. ▪ As compared to Q1’20, AFIN’s multi - tenant Executed Occupancy of 88.2% is expected to exceed the pre - pandemic level of 87.3% as rent commences over time. ▪ AFIN executed eight new long - term leases for 96,000 SF that will add nearly $1.4 million of annual rent as rent commences over time between Q2’21 and Q3’21. 1) As of April 30, 2021. Total rent collected during the period includes both original Cash Rent due and payments made by tenant s p ursuant to rent deferral agreements. Refer to slides 5 and 7 for additional information. 2) See Definitions in the appendix for a full description. 3) Refer to slide 15 for additional information. 4) Refer to slide 8 for additional information. 5) Refer to slide 13 for additional information. Enhanced Leasing Activity (5) Strong Balance Sheet ▪ AFIN continues to focus on maintaining ample Liquidity (2) of $218 million and prudent leverage throughout COVID - 19 pandemic. ▪ Year over year, the Company’s weighted average debt maturity improved from 3.5 to 4.5 years (3) while its weighted average interest rate decreased from 4.2% to 3.8%. ▪ Year over year, AFIN’s percentage of fixed debt increased from 73.2% to 82.6% as the Company locked in attractive interest rates at historically low levels.
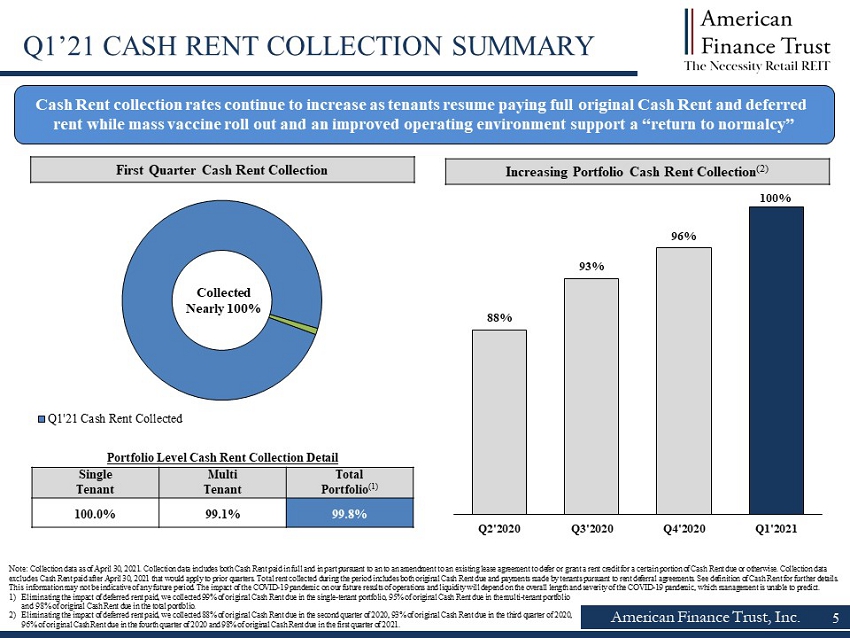
Q1'21 Cash Rent Collected American Finance Trust, Inc. Q1’21 CASH RENT COLLECTION SUMMARY 5 Cash Rent collection rates continue to increase as tenants resume paying full original Cash Rent and deferred rent while mass vaccine roll out and an improved operating environment support a “return to normalcy” First Quarter Cash Rent Collection Increasing Portfolio Cash Rent Collection (2) 100% 96% 93% 88% Q1'2021 Q4'2020 Q3'2020 Q2'2020 Collected Nearly 100% Portfolio Level Cash Rent Collection Detail Single Tenant Multi Tenant Total Portfolio (1) 100.0% 99.1% 99.8% Note: Collection data as of April 30, 2021. Collection data includes both Cash Rent paid in full and in part pursuant to an t o a n amendment to an existing lease agreement to defer or grant a rent credit for a certain portion of Cash Rent due or otherwis e. Collection data excludes Cash Rent paid after April 30, 2021 that would apply to prior quarters. Total rent collected during the period inclu des both original Cash Rent due and payments made by tenants pursuant to rent deferral agreements. See definition of Cash Rent fo r further details. This information may not be indicative of any future period. The impact of the COVID - 19 pandemic on our future results of operat ions and liquidity will depend on the overall length and severity of the COVID - 19 pandemic, which management is unable to predic t. 1) Eliminating the impact of deferred rent paid, we collected 99% of original Cash Rent due in the single - tenant portfolio, 95% of original Cash Rent due in the multi - tenant portfolio and 98% of original Cash Rent due in the total portfolio. 2) Eliminating the impact of deferred rent paid, we collected 88% of original Cash Rent due in the second quarter of 2020, 93% o f o riginal Cash Rent due in the third quarter of 2020, 96% of original Cash Rent due in the fourth quarter of 2020 and 98% of original Cash Rent due in the first quarter of 2021.
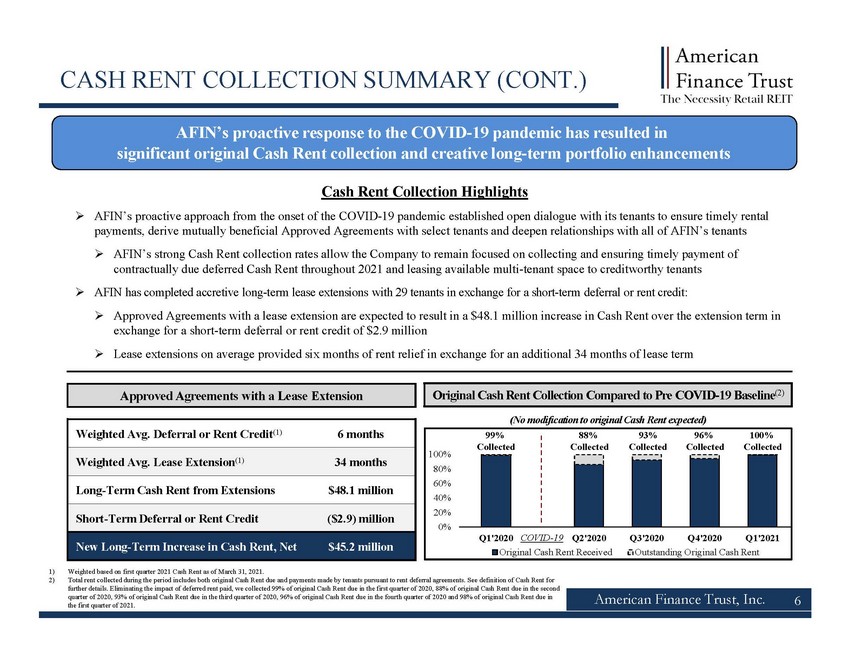
American Finance Trust, Inc. CASH RENT COLLECTION SUMMARY (CONT.) 6 AFIN’s proactive response to the COVID - 19 pandemic has resulted in significant original Cash Rent collection and creative long - term portfolio enhancements Weighted Avg. Deferral or Rent Credit (1) 6 months Weighted Avg. Lease Extension (1) 34 months Long - Term Cash Rent from Extensions $48.1 million Short - Term Deferral or Rent Credit ($2.9) million New Long - Term Increase in Cash Rent, Net $45.2 million Approved Agreements with a Lease Extension » AFIN’s proactive approach from the onset of the COVID - 19 pandemic established open dialogue with its tenants to ensure timely re ntal payments, derive mutually beneficial Approved Agreements with select tenants and deepen relationships with all of AFIN’s tena nts » AFIN’s strong Cash Rent collection rates allow the Company to remain focused on collecting and ensuring timely payment of contractually due deferred Cash Rent throughout 2021 and leasing available multi - tenant space to creditworthy tenants » AFIN has completed accretive long - term lease extensions with 29 tenants in exchange for a short - term deferral or rent credit: » Approved Agreements with a lease extension are expected to result in a $48.1 million increase in Cash Rent over the extension te rm in exchange for a short - term deferral or rent credit of $2.9 million » Lease extensions on average provided six months of rent relief in exchange for an additional 34 months of lease term Cash Rent Collection Highlights 1) Weighted based on first quarter 2021 Cash Rent as of March 31, 2021. 2) Total rent collected during the period includes both original Cash Rent due and payments made by tenants pursuant to rent def err al agreements. See definition of Cash Rent for further details. Eliminating the impact of deferred rent paid, we collected 99% of original Cash Rent due in the first quarte r o f 2020, 88% of original Cash Rent due in the second quarter of 2020, 93% of original Cash Rent due in the third quarter of 2020, 96% of original Cash Rent due in the fourth quar ter of 2020 and 98% of original Cash Rent due in the first quarter of 2021. Original Cash Rent Collection Compared to Pre COVID - 19 Baseline (2) 0% 20% 40% 60% 80% 100% Q1'2020 Original Cash Rent Received Outstanding Original Cash Rent COVID - 19 99% Collected (No modification to original Cash Rent expected) Q2'2020 Q3'2020 Q4'2020 Q1'2021 88% Collected 93% Collected 96% Collected 100% Collected
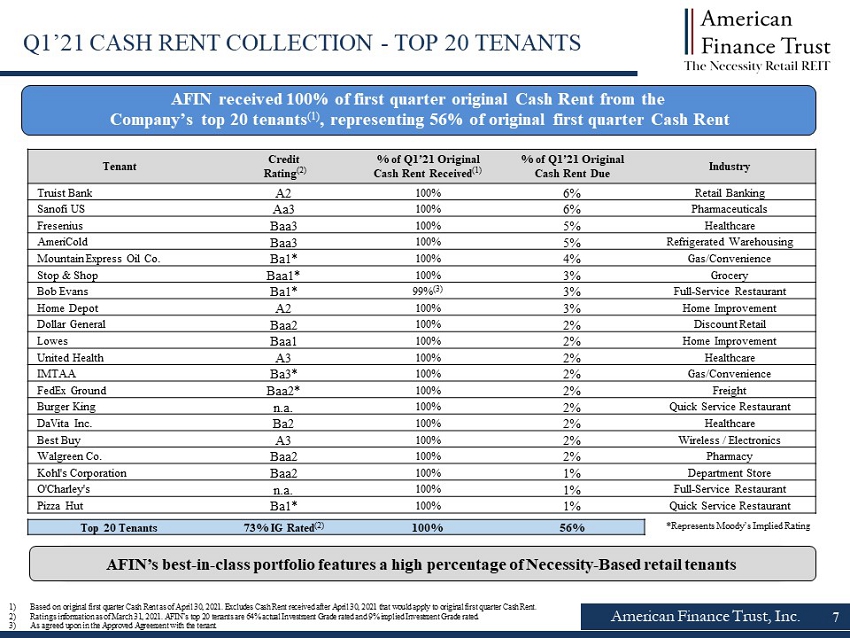
American Finance Trust, Inc. Q1’21 CASH RENT COLLECTION - TOP 20 TENANTS 7 AFIN received 100% of first quarter original Cash Rent from the Company’s top 20 tenants (1) , representing 56% of original first quarter Cash Rent AFIN’s best - in - class portfolio features a high percentage of Necessity - Based retail tenants Tenant Credit Rating (2) % of Q1’21 Original Cash Rent Received (1) % of Q1’21 Original Cash Rent Due Industry Truist Bank A2 100% 6% Retail Banking Sanofi US Aa3 100% 6% Pharmaceuticals Fresenius Baa3 100% 5% Healthcare AmeriCold Baa3 100% 5% Refrigerated Warehousing Mountain Express Oil Co. Ba1* 100% 4% Gas/Convenience Stop & Shop Baa1* 100% 3% Grocery Bob Evans Ba1* 99% (3) 3% Full - Service Restaurant Home Depot A2 100% 3% Home Improvement Dollar General Baa2 100% 2% Discount Retail Lowes Baa1 100% 2% Home Improvement United Health A3 100% 2% Healthcare IMTAA Ba3* 100% 2% Gas/Convenience FedEx Ground Baa2* 100% 2% Freight Burger King n.a. 100% 2% Quick Service Restaurant DaVita Inc. Ba2 100% 2% Healthcare Best Buy A3 100% 2% Wireless / Electronics Walgreen Co. Baa2 100% 2% Pharmacy Kohl's Corporation Baa2 100% 1% Department Store O'Charley's n.a. 100% 1% Full - Service Restaurant Pizza Hut Ba1* 100% 1% Quick Service Restaurant Top 20 Tenants 73% IG Rated (2) 100% 56% *Represents Moody’s Implied Rating 1) Based on original first quarter Cash Rent as of April 30, 2021. Excludes Cash Rent received after April 30, 2021 that would apply to original first quarter Cash Rent. 2) Ratings information as of March 31, 2021. AFIN’s top 20 tenants are 64% actual Investment Grade rated and 9% implied Investme nt Grade rated. 3) As agreed upon in the Approved Agreement with the tenant.
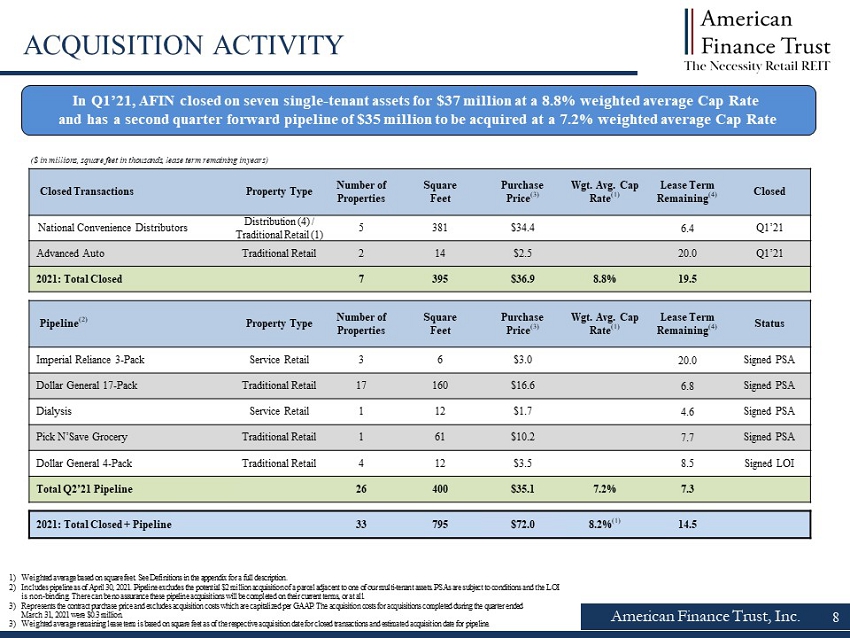
American Finance Trust, Inc. ACQUISITION ACTIVITY ($ in millions, square feet in thousands, lease term remaining in years) 1) Weighted average based on square feet. See Definitions in the appendix for a full description. 2) Includes pipeline as of April 30 , 2021 . Pipeline excludes the potential $2 million acquisition of a parcel adjacent to one of our multi - tenant assets. PSAs are subject to conditions and the LOI is non - binding. There can be no assurance these pipeline acquisitions will be completed on their current terms, or at all. 3) Represents the contract purchase price and excludes acquisition costs which are capitalized per GAAP. The acquisition costs f or acquisitions completed during the quarter ended March 31, 2021 were $0.3 million. 3) Weighted average remaining lease term is based on square feet as of the respective acquisition date for closed transactions a nd estimated acquisition date for pipeline. Closed Transactions Property Type Number of Properties Square Feet Purchase Price (3) Wgt. Avg. Cap Rate (1) Lease Term Remaining (4) Closed National Convenience Distributors Distribution (4) / Traditional Retail (1) 5 381 $34.4 6.4 Q1’21 Advanced Auto Traditional Retail 2 14 $2.5 20.0 Q1’21 2021: Total Closed 7 395 $36.9 8.8% 19.5 Pipeline (2) Property Type Number of Properties Square Feet Purchase Price (3) Wgt. Avg. Cap Rate (1) Lease Term Remaining (4) Status Imperial Reliance 3 - Pack Service Retail 3 6 $3.0 20.0 Signed PSA Dollar General 17 - Pack Traditional Retail 17 160 $16.6 6.8 Signed PSA Dialysis Service Retail 1 12 $1.7 4.6 Signed PSA Pick N’Save Grocery Traditional Retail 1 61 $10.2 7.7 Signed PSA Dollar General 4 - Pack Traditional Retail 4 12 $3.5 8.5 Signed LOI Total Q2’21 Pipeline 26 400 $35.1 7.2% 7.3 2021: Total Closed + Pipeline 33 795 $72.0 8.2% (1) 14.5 8 In Q1’21, AFIN closed on seven single - tenant assets for $37 million at a 8.8% weighted average Cap Rate and has a second quarter forward pipeline of $35 million to be acquired at a 7.2% weighted average Cap Rate
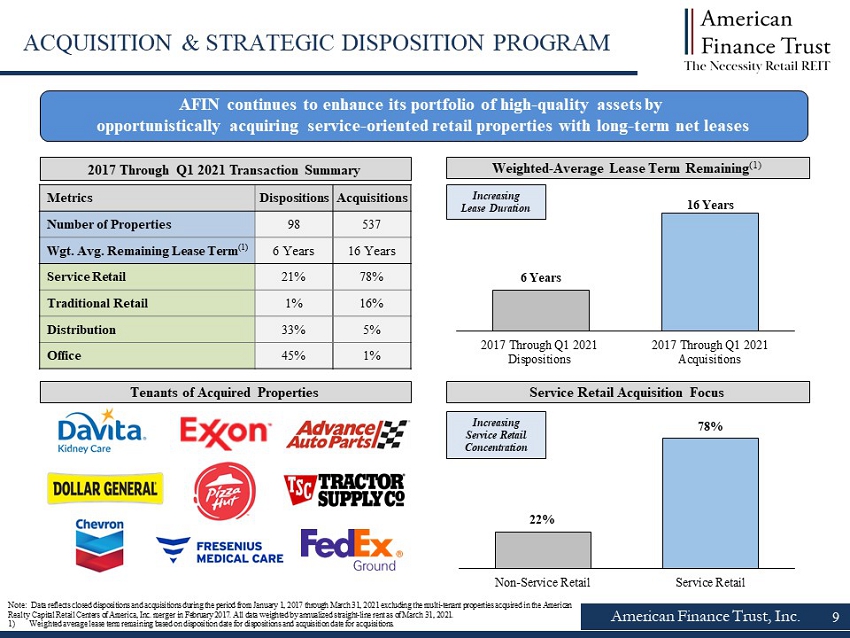
American Finance Trust, Inc. AFIN continues to enhance its portfolio of high - quality assets by opportunistically acquiring service - oriented retail properties with long - term net leases Note: Data reflects closed dispositions and acquisitions during the period from January 1, 2017 through March 31, 2021 excluding the multi - tenant properties acquired in the American Realty Capital Retail Centers of America, Inc. merger in February 2017 . All data weighted by annualized straight - line rent as of March 31, 2021 . 1) Weighted average lease term remaining based on disposition date for dispositions and acquisition date for acquisitions. 9 Metrics Dispositions Acquisitions Number of Properties 98 537 Wgt . Avg. Remaining Lease Term (1) 6 Years 16 Years Service Retail 21% 78% Traditional Retail 1% 16% Distribution 33% 5% Office 45% 1% 2017 Through Q1 2021 Transaction Summary Weighted - Average Lease Term Remaining (1) Service Retail Acquisition Focus Tenants of Acquired Properties Increasing Service Retail Concentration Increasing Lease Duration 6 Years 16 Years 2017 Through Q1 2021 Dispositions 2017 Through Q1 2021 Acquisitions ACQUISITION & STRATEGIC DISPOSITION PROGRAM 22% 78% Non-Service Retail Service Retail
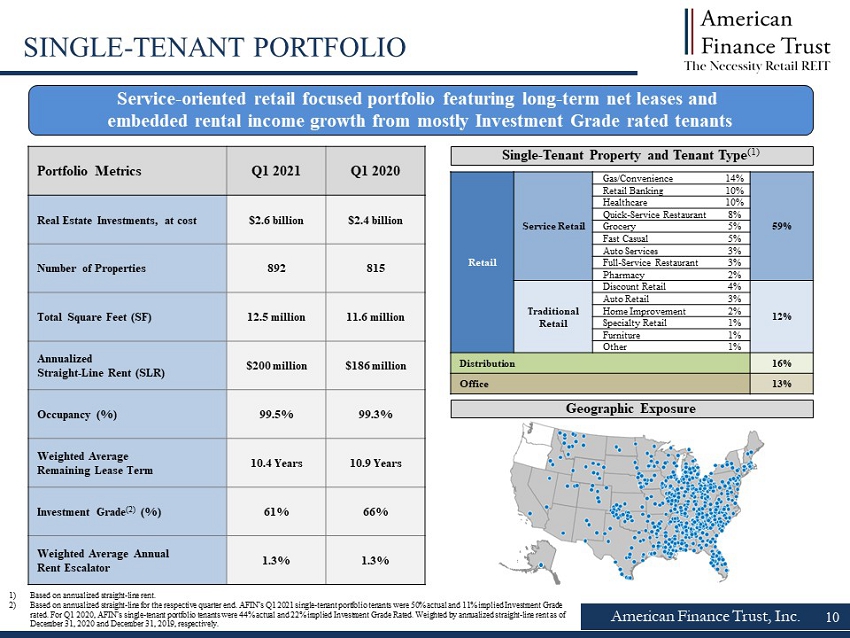
Service - oriented retail focused portfolio featuring long - term net leases and embedded rental income growth from mostly Investment Grade rated tenants Portfolio Metrics Q1 2021 Q1 2020 Real Estate Investments, at cost $2.6 billion $2.4 billion Number of Properties 892 815 Total Square Feet (SF) 12.5 million 11.6 million Annualized Straight - Line Rent (SLR) $200 million $186 million Occupancy (%) 99.5% 99.3% Weighted Average Remaining Lease Term 10.4 Years 10.9 Years Investment Grade (2) (%) 61% 66% Weighted Average Annual Rent Escalator 1.3% 1.3% American Finance Trust, Inc. 10 SINGLE - TENANT PORTFOLIO 1) Based on annualized straight - line rent. 2) Based on annualized straight - line for the respective quarter end. AFIN’s Q1 2021 single - tenant portfolio tenants were 50% actual and 11% implied Investment Grade rated. For Q1 2020, AFIN’s single - tenant portfolio tenants were 44% actual and 22% implied Investment Grade Rated. Weighted by a nnualized straight - line rent as of December 31, 2020 and December 31, 2019, respectively. Single - Tenant Property and Tenant Type (1) Retail Service Retail Gas/Convenience 14% 59% Retail Banking 10% Healthcare 10% Quick - Service Restaurant 8% Grocery 5% Fast Casual 5% Auto Services 3% Full - Service Restaurant 3% Pharmacy 2% Traditional Retail Discount Retail 4% 12% Auto Retail 3% Home Improvement 2% Specialty Retail 1% Furniture 1% Other 1% Distribution 16% Office 13% Geographic Exposure

83% 62% 62% 61% 56% 46% 29% EPRT AFIN STOR NNN O SRC VER 61% 51% 39% 24% 19% n.a. n.a. AFIN O VER SRC NNN EPRT STOR 34% 27% 21% 19% 14% 5% 4% EPRT AFIN STOR NNN O SRC VER 11 American Finance Trust, Inc. x Single - tenant portfolio mostly leased to actual or implied Investment Grade rated tenants, supporting AFIN’s high Cash Rent collection rates throughout the COVID - 19 pandemic x AFIN’s single - tenant portfolio features minimal near - term lease expirations, with 86% of leases expiring after 2025 x 83% of AFIN’s single - tenant portfolio is leased to Service Retail properties that we believe to be Necessity - Based in nature and more resistant to e - commerce Higher percentage of Investment Grade, service - oriented retail tenants compared to peers Service Retail as % of Total Retail Exposure (3) (Single - Tenant) % Investment Grade Tenants (1) (2) (Single - Tenant) Source: Company filings. Note: Company metrics as of March 31, 2021. Peer metrics as of the last reporting period of December 31, 2020 unless otherwis e n oted. See definitions in the appendix for a full description. 1) Base on annualized straight - line rent. 2) AFIN’s single - tenant portfolio is comprised of 50 % actual Investment Grade rated and 11% implied Investment Grade rated tenants. Peers report tenants with actual Investment Grade ratings. STORE Capital and Essential Properties do not disclose tenant credit ratings. 3) Based on annual base rent for AFIN and peers and AFIN’s definition of Service Retail. % of Rent Expiring through 2025 (1) (Single - Tenant) ATTRACTIVE SINGLE - TENANT PORTFOLIO Single - Tenant Highlights
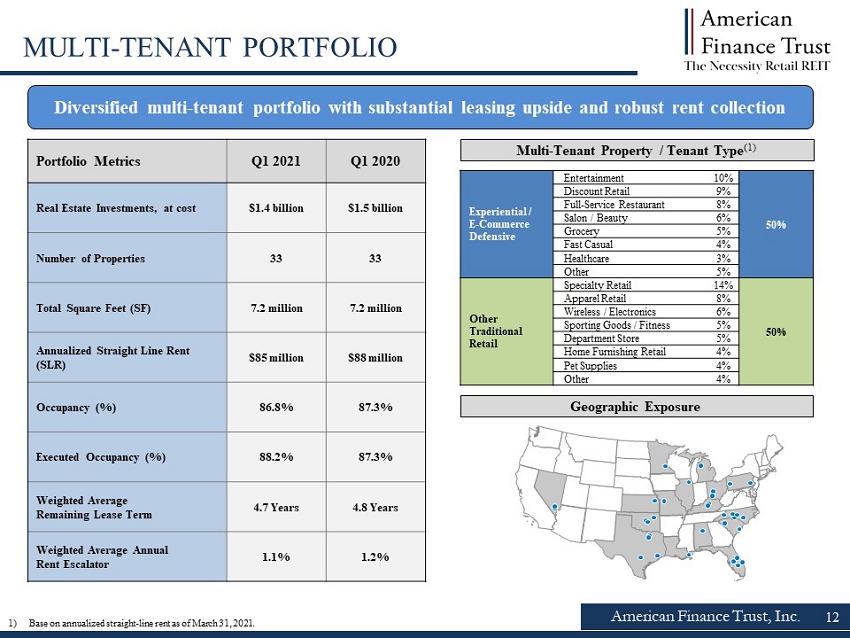
American Finance Trust, Inc. MULTI - TENANT PORTFOLIO Diversified multi - tenant portfolio with substantial leasing upside and robust rent collection Portfolio Metrics Q1 2021 Q1 2020 Real Estate Investments, at cost $1.4 billion $1.5 billion Number of Properties 33 33 Total Square Feet (SF) 7.2 million 7.2 million Annualized Straight Line Rent (SLR) $85 million $88 million Occupancy (%) 86.8% 87.3% Executed Occupancy (%) 88.2% 87.3% Weighted Average Remaining Lease Term 4.7 Years 4.8 Years Weighted Average Annual Rent Escalator 1.1% 1.2% Multi - Tenant Property / Tenant Type (1) Experiential / E - Commerce Defensive Entertainment 10% 50% Discount Retail 9% Full - Service Restaurant 8% Salon / Beauty 6% Grocery 5% Fast Casual 4% Healthcare 3% Other 5% Other Traditional Retail Specialty Retail 14% 50% Apparel Retail 8% Wireless / Electronics 6% Sporting Goods / Fitness 5% Department Store 5% Home Furnishing Retail 4% Pet Supplies 4% Other 4% Geographic Exposure 12 1) Base on annualized straight - line rent as of March 31, 2021.
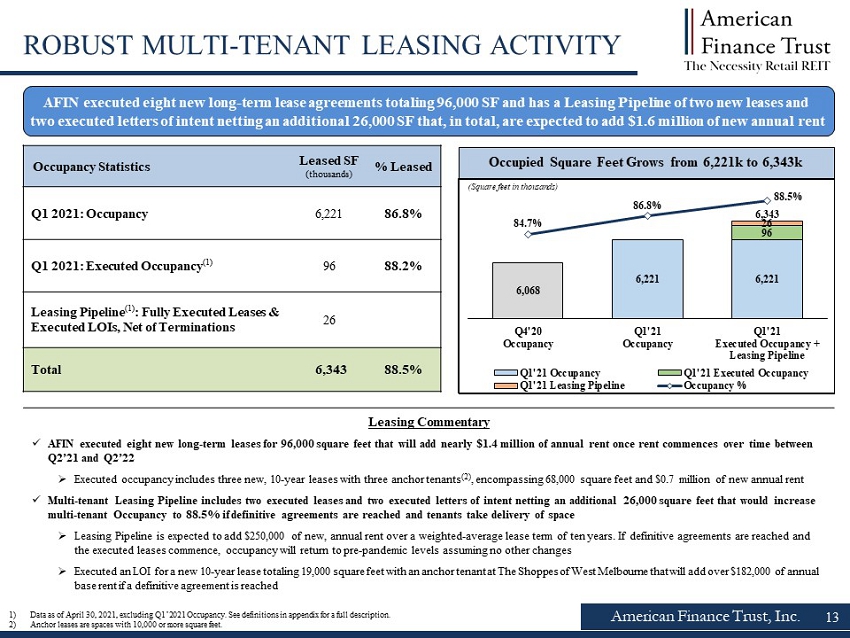
American Finance Trust, Inc. 13 ROBUST MULTI - TENANT LEASING ACTIVITY 1) Data as of April 30, 2021, excluding Q1’2021 Occupancy. See definitions in appendix for a full description. 2) Anchor leases are spaces with 10,000 or more square feet. Occupancy Statistics Leased SF (thousands) % Leased Q1 2021: Occupancy 6,221 86.8% Q1 2021: Executed Occupancy (1) 96 88.2% Leasing Pipeline (1) : Fully Executed Leases & Executed LOIs , Net of Terminations 26 Total 6,343 88.5% Occupied Square Feet Grows from 6,221k to 6,343k (Square feet in thousands) AFIN executed eight new long - term lease agreements totaling 96,000 SF and has a Leasing Pipeline of two new leases and two executed letters of intent netting an additional 26,000 SF that, in total, are expected to add $1.6 million of new annual re nt Leasing Commentary x AFIN executed eight new long - term leases for 96,000 square feet that will add nearly $1.4 million of annual rent once rent commences over time between Q2’21 and Q2’22 » Executed occupancy includes three new, 10 - year leases with three anchor tenants (2) , encompassing 68,000 square feet and $0.7 million of new annual rent x Multi - tenant Leasing Pipeline includes two executed leases and two executed letters of intent netting an additional 26,000 squar e feet that would increase multi - tenant Occupancy to 88.5% if definitive agreements are reached and tenants take delivery of space » Leasing Pipeline is expected to add $250,000 of new, annual rent over a weighted - average lease term of ten years. If definitive agreements are reached and the executed leases commence, occupancy will return to pre - pandemic levels assuming no other changes » Executed an LOI for a new 10 - year lease totaling 19,000 square feet with an anchor tenant at The Shoppes of West Melbourne that will add over $182,000 of annual base rent if a definitive agreement is reached 6,221 6,221 96 26 6,068 6,343 84.7% 86.8% 88.5% 75.0% 77.0% 79.0% 81.0% 83.0% 85.0% 87.0% 5,700 5,800 5,900 6,000 6,100 6,200 6,300 6,400 6,500 Q4'20 Occupancy Q1'21 Occupancy Q1'21 Executed Occupancy + Leasing Pipeline Q1'21 Occupancy Q1'21 Executed Occupancy Q1'21 Leasing Pipeline Occupancy %
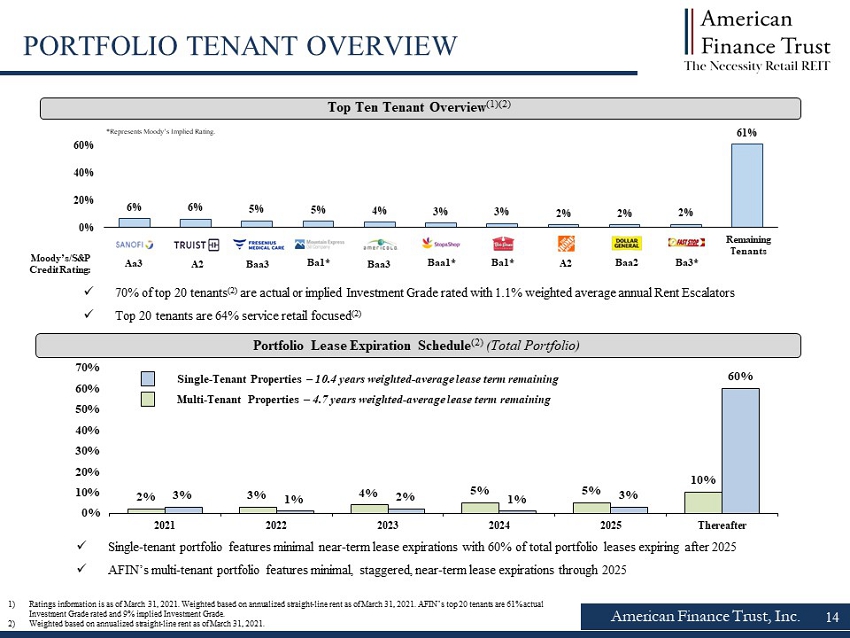
6% 6% 5% 5% 4% 3% 3% 2% 2% 2% 61% 0% 20% 40% 60% Sanofi Truist Fresenius Medical Mountain Express Americold Stop & Shop Bob Evans Home Depot Dollar General IMTAA Remaining Tenants x 70% of top 20 tenants (2) are actual or implied Investment Grade rated with 1.1 % weighted average annual Rent Escalators x Top 20 tenants are 64 % service retail focused (2) 2% 3% 4% 5% 5% 10% 3% 1% 2% 1% 3% 60% 0% 10% 20% 30% 40% 50% 60% 70% 2021 2022 2023 2024 2025 Thereafter American Finance Trust, Inc. PORTFOLIO TENANT OVERVIEW 1) Ratings information is as of March 31, 2021. Weighted based on annualized straight - line rent as of March 31, 2021. AFIN’s top 20 tenants are 61% actual Investment Grade rated and 9% implied Investment Grade. 2) Weighted based on annualized straight - line rent as of March 31, 2021. Top Ten Tenant Overview (1)(2) Remaining Tenants Moody’s/S&P Credit Rating: 14 A2 Portfolio Lease Expiration Schedule (2) (Total Portfolio) x Single - tenant portfolio features minimal near - term lease expirations with 60% of total portfolio leases expiring after 2025 x AFIN’s multi - tenant portfolio features minimal, staggered, near - term lease expirations through 2025 Multi - Tenant Properties – 4.7 years weighted - average lease term remaining Single - Tenant Properties – 10.4 years weighted - average lease term remaining Aa3 Ba1* Baa3 Baa1* Ba1* A2 Ba3* Baa3 Baa2 *Represents Moody’s Implied Rating.
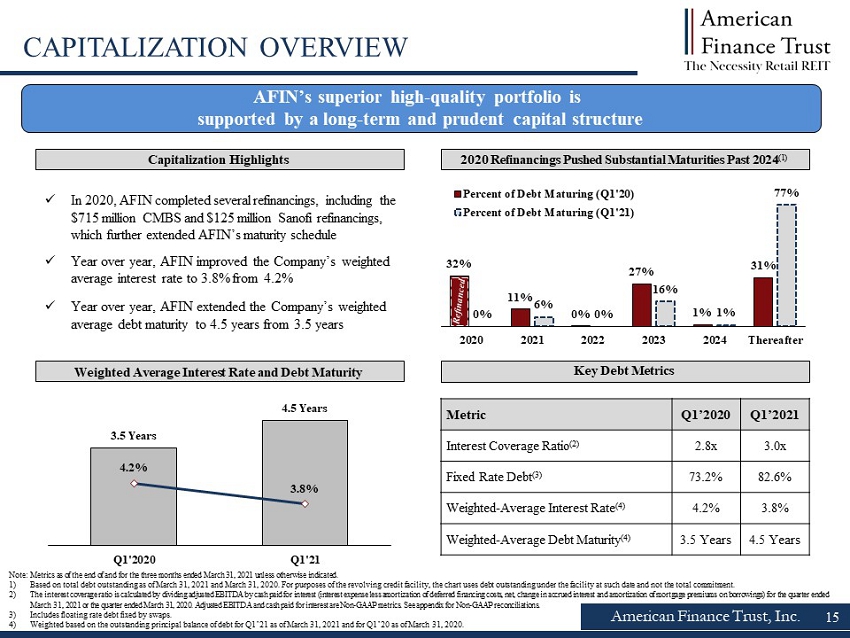
15 American Finance Trust, Inc. AFIN’s superior high - quality portfolio is supported by a long - term and prudent capital structure 2020 Refinancings Pushed Substantial Maturities Past 2024 (1) Capitalization Highlights Weighted Average Interest Rate and Debt Maturity CAPITALIZATION OVERVIEW Key Debt Metrics Metric Q1’2020 Q1’2021 Interest Coverage Ratio (2) 2.8x 3.0x Fixed Rate Debt (3) 73.2% 82.6% Weighted - Average Interest Rate (4) 4.2% 3.8% Weighted - Average Debt Maturity (4) 3.5 Years 4.5 Years 3.5 Years 4.5 Years 4.2% 3.8% 0 1 2 3 4 5 3.0% 3.5% 4.0% 4.5% 5.0% 5.5% 6.0% Q1'2020 Q1'21 x In 2020, AFIN completed several refinancings , including the $715 million CMBS and $125 million Sanofi refinancings , which further extended AFIN’s maturity schedule x Year over year, AFIN improved the Company’s weighted average interest rate to 3.8% from 4.2% x Year over year, AFIN extended the Company’s weighted average debt maturity to 4.5 years from 3.5 years Note: Metrics as of the end of and for the three months ended March 31, 2021 unless otherwise indicated . 1) Based on total debt outstanding as of March 31, 2021 and March 31, 2020. For purposes of the revolving credit facility, the c har t uses debt outstanding under the facility at such date and not the total commitment. 2) The interest coverage ratio is calculated by dividing adjusted EBITDA by cash paid for interest (interest expense less amortizat ion of deferred financing costs, net, change in accrued interest and amortization of mortgage premiums on borrowings) for the qu arter ended March 31, 2021 or the quarter ended March 31, 2020. Adjusted EBITDA and cash paid for interest are Non - GAAP metrics. See appendi x for Non - GAAP reconciliations. 3) Includes floating rate debt fixed by swaps. 4) Weighted based on the outstanding principal balance of debt for Q1’21 as of March 31, 2021 and for Q1’20 as of March 31, 2020. 32% 11% 0% 27% 1% 31% 0% 6% 0% 16% 1% 77% 2020 2021 2022 2023 2024 Thereafter Percent of Debt Maturing (Q1'20) Percent of Debt Maturing (Q1'21)
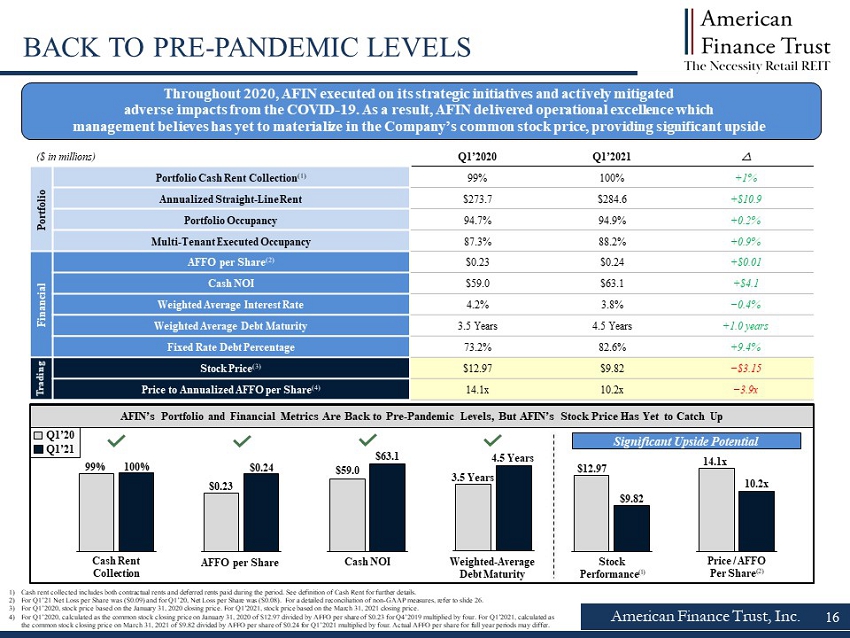
16 American Finance Trust, Inc. BACK TO PRE - PANDEMIC LEVELS ($ in millions) Q1’2020 Q1’2021 Portfolio Portfolio Cash Rent Collection (1) 99% 100% +1% Annualized Straight - Line Rent $273.7 $284.6 +$10.9 Portfolio Occupancy 94.7% 94.9% +0.2% Multi - Tenant Executed Occupancy 87.3% 88.2% +0.9% Financial AFFO per Share (2) $0.23 $0.24 +$0.01 Cash NOI $59.0 $63.1 +$4.1 Weighted Average Interest Rate 4.2% 3.8% −0.4% Weighted Average Debt Maturity 3.5 Years 4.5 Years +1.0 years Fixed Rate Debt Percentage 73.2% 82.6% +9.4% Stock Price (3) $12.97 $9.82 −$3.15 Price to Annualized AFFO per Share (4) 14.1x 10.2x −3.9x AFIN’s Portfolio and Financial Metrics Are Back to Pre - Pandemic Levels, But AFIN’s Stock Price Has Yet to Catch Up 99% 100% Q4'19 Q1'21 $0.23 $0.24 Q4'19 Q1'21 3.5 Years 4.5 Years Q4'19 Q1'21 Cash Rent Collection AFFO per Share Weighted - Average Debt Maturity 1) Cash rent collected includes both contractual rents and deferred rents paid during the period. See definition of Cash Rent fo r f urther details. 2) For Q1’21 Net Loss per Share was ($0.09) and for Q1’20, Net Loss per Share was ($0.08). For a detailed reconciliation of non - GA AP measures, refer to slide 26. 3) For Q1’2020, stock price based on the January 31, 2020 closing price. For Q1’2021, stock price based on the March 31, 2021 cl osi ng price. 4) For Q1’2020, calculated as the common stock closing price on January 31, 2020 of $12.97 divided by AFFO per share of $0.23 fo r Q 4’2019 multiplied by four. For Q1’2021, calculated as the common stock closing price on March 31, 2021 of $9.82 divided by AFFO per share of $0.24 for Q1’2021 multiplied by four. Act ual AFFO per share for full year periods may differ. $59.0 $63.1 Q4'19 Q1'21 Cash NOI Q1’20 Q1’21 $12.97 $9.82 Q4'19 Q1'21 Stock Performance (1) 14.1x 10.2x Q4'19 Q1'21 Price / AFFO Per Share (2) Significant Upside Potential Trading Throughout 2020, AFIN executed on its strategic initiatives and actively mitigated adverse impacts from the COVID - 19. As a result, AFIN delivered operational excellence which management believes has yet to materialize in the Company’s common stock price, providing significant upside

$23.0 $25.5 Net Loss Common Stock Dividends AFFO ($9.4) Net Loss Common Stock Dividends AFFO American Finance Trust, Inc. Q1 2021 FINANCIAL HIGHLIGHTS Note: Metrics as of the end of and for the three months and year ended March 31, 2021 . See Definitions in the appendix for a full description of capitalized terms. 1) Weighted average interest rate based on balance outstanding as of March 31, 2021 . 2) See Definitions in the appendix for a full description. 3) Excludes the effect of deferred financing costs, net and mortgage premiums, net. 4) Adjusted EBITDA is annualized based on Q1 2021 results. 5) See appendix for Non - GAAP reconciliations. AFIN continues to actively manage its capital structure by locking in long - term debt fixed at low interest rates to support continued earnings and portfolio growth 17 Debt Capitalization ($mm) Single - Tenant Mortgages $1,262 Multi - Tenant Mortgages $266 Total Secured Debt $1,528 Revolving Credit Facility $281 Total Unsecured Debt $281 Total Debt $1,809 Weighted Average Interest Rate (1) 3.8% Key Capitalization Metrics ($mm) Net Debt (2)(3) $1, 725 Gross Asset Value (2) $4,272 Net Debt (3) / Adjusted EBITDA (4)(5) 8.3x Net Debt (3) / Gross Asset Value (2) 40.4% Earnings Summary ($ mm) Q1’21 Q1’20 Net loss Attributable to Common Stockholders ($9.4) ($9.2) NOI (2)(4) $65.7 $62.3 Cash NOI (2)(4) $63.1 $59.0 Funds from Operations (FFO) (2)(5) $ 22.6 $23.7 Adjusted Funds from Operations (AFFO) (2)(5) $ 25.5 $25.2 Funds from Operations (FFO) (2)(5) per Share $ 0.21 $0.22 Adjusted Funds from Operations (AFFO) (2)(5) per Share $ 0.24 $0.23 Weighted Average Basic and Diluted Shares Outstanding 108.4 108.4 Q1’21 Net Loss and AFFO and Q1’21 Common Stock Dividends ($mm)

American Finance Trust, Inc. 18 EXPERIENCED MANAGEMENT Jason Slear Executive Vice President of Real Estate Acquisitions and Dispositions ▪ Responsible for sourcing, negotiating, and closing AR Global's real estate acquisitions and dispositions ▪ Oversaw the acquisition of over $3.5 billion of real estate assets and the lease - up of over 10 million square feet during professional career Michael Weil Chief Executive Officer, President and Chairman of the Board of Directors ▪ Founding partner of AR Global ▪ Previously served as Senior VP of sales and leasing for American Financial Realty Trust ▪ Served as president of the Board of Directors of the Real Estate Investment Securities Association (n/k/a ADISA) Boris Korotkin Senior Vice President of Capital Markets and Corporate Strategy ▪ Responsible for leading all debt capital market transactions ▪ Former Executive Vice President of Transaction Structuring for American Financial Realty Trust Ori Kravel Senior Vice President of Corporate Development ▪ Responsible for corporate development and business strategy ▪ Executed over $12 billion of capital market transactions and over $25 billion of M&A transactions Jason Doyle Chief Financial Officer, Treasurer and Secretary ▪ Mr. Doyle is also the chief financial officer, treasurer and secretary of Healthcare Trust, Inc. (“HTI”) ▪ Mr. Doyle previously served as chief accounting officer of Global Net Lease, Inc. (“GNL”). Prior to joining AR Global and GNL , M r. Doyle held various financial and practice leadership roles, including Acting VP Finance at Markforged , Inc. Associate Controller, Head of Global Accounting Operations at Charles River Associates and VP Finance and Practice Director, Transportation at AST Corporation, a pri vately - held software and management consulting firm ▪ Mr. Doyle is a certified public accountant in the State of Rhode Island, holds a B.S. from the University of Rhode Island and an M.B.A. from Babson College

Confidential – Not for Distribution 19 19 Legal Notices
American Finance Trust, Inc. 20 DISCLAIMERS This presentation includes estimated projections of future operating results. These projections were not prepared in accordan ce with published guidelines of the SEC or the guidelines established by the American Institute of Certified Public Accountants for preparation and presentation of f ina ncial projections. This information is not fact and should not be relied upon as being necessarily indicative of future results; the projections were prepared in go od faith by management and are based on numerous assumptions that may prove to be wrong. Important factors that may affect actual results and cause the projections t o n ot be achieved include, but are not limited to, risks and uncertainties relating to the company and other factors described in the “Risk Factors” section of the Com pany's Annual Report on Form 10 - K for the year ended December 31, 2019, the Company's subsequent Quarterly Reports on Form 10 - Q and in future filings with the SEC . The projections also reflect assumptions as to certain business decisions that are subject to change. As a result, actual results may differ materially fr om those contained in the estimates. Accordingly, there can be no assurance that the estimates will be realized. The industry in which we operate is subject to a hig h degree of uncertainty and risk due to variety of factors, including those described in the “Risk Factors” and "Management's Discussion and Analysis of Financial Co ndi tion and Results of Operations" sections of the Company's Annual Report on Form 10 - K for the year ended December 31, 2020, filed with the SEC on February 25, 20 21 and the Company's subsequent Quarterly Reports on Form 10 - Q, Current Reports on Form 8 - K and Annual Reports on Form 10 - K filed with the SEC. These and other factors could cause results to differ materially from those expressed in these publications and reports. This presentation contains estimates and information concerning the Company’s industry and the Company’s peer companies that are based on industry publications, reports and peer company public filings. The Company has not independently verified the accuracy of the data contained in the se industry publications, reports and peer company public filings. These estimates and information involve a number of assumptions and limitations, and you are cau tio ned not to rely on or give undue weight to this information. The majority of the concessions granted to the Company's tenants as a result of the COVID - 19 pandemic are rent deferrals or temp orary rent abatements with the original lease term unchanged and collection of deferred rent deemed probable. The Company's revenue recognition policy requi res that it must be probable that the Company will collect virtually all of the lease payments due and does not provide for partial reserves, or the ability to ass ume partial recovery. In light of the COVID - 19 pandemic, the FASB and SEC agreed that for leases where the total lease cash flows will remain substantially the same o r less than those after the COVID - 19 related effects, companies may choose to forgo the evaluation of the enforceable rights and obligations of the original lease contract as a practical expedient and account for rent concessions as if they were part of the enforceable rights and obligations of the parties unde r t he existing lease contract. As a result, rental revenue used to calculate Net Income and NAREIT FFO has not been, and the Company does not expect it to be, significan tly impacted by these types of deferrals. In addition, since the Company currently believes that these deferral amounts are collectable, they have been excl ude d from the increase in straight - line rent for AFFO purposes the amounts recognized under GAAP relating to these types of rent deferrals. Conversely, for abatement s w here contractual rent has been reduced, the reduction is reflected over the remaining lease term for accounting purposes but represents a permanent reductio n a nd the Company has, accordingly, reduced its AFFO.
American Finance Trust, Inc. 21 FORWARD - LOOKING STATEMENTS Certain statements made in this presentation are “forward - looking statements” (as defined in Section 21E of the Exchange Act), w hich reflect the expectations of the Company regarding future events. The forward - looking statements involve a number of risks, uncertainties and other factors that could cause actual results to differ materially from those contained in the forward - looking statements. Such forward - looking statements include, but are not limited to, market and other expectations, objectives, and intentions, as well as any ot her statements that are not historical facts. Our potential risks and uncertainties are presented in the section titled “Item 1A - Risk Factors” disclosed in our Annual Report on Form 10 - K for the year ended December 31, 2020 filed with the SEC on February 25, 2021, and the Company's subsequent Quarterly Reports on Form 10 - Q filed with the SEC. Forward - looking statements sp eak as of the date they and, we disclaim any obligation to update and revise statements contained in these materials to reflect changed assumptions, the occurrence of unanticipated events or changes to fut ure operating results over time, unless required by law. The following are some of the risks and uncertainties relating to us, although not all risks and uncertainties, that could cause our actual results to dif fer materially from those presented in our forward - looking statements: ▪ We may be unable to acquire properties on advantageous terms or our property acquisitions may not perform as we expect. ▪ We are subject to risks associated with a pandemic, epidemic or outbreak of a contagious disease, such as the ongoing global COV ID - 19 pandemic, including negative impacts on our tenants and their respective businesses. ▪ Provisions in our credit facility may limit our ability to pay dividends on our Class A common stock, Series A Preferred Stoc k a nd Series C Preferred Stock and currently prohibit us from repurchasing shares. ▪ If we are not able to generate sufficient cash from operations, we may have to reduce the amount of dividends we pay or ident ify other financing sources. ▪ Funding dividends from other sources such as borrowings, asset sales or equity issuances limits the amount we can use for pro per ty acquisitions, investments and other corporate purposes. ▪ Our operating results are affected by economic and regulatory changes that have an adverse impact on the real estate market i n g eneral. ▪ Inflation may have an adverse effect on our investments. ▪ In owning properties we may experience, among other things, unforeseen costs associated with complying with laws and regulati ons and other costs, potential difficulties selling properties and potential damages or losses resulting from climate change. ▪ We depend on tenants for our rental revenue and, accordingly, our rental revenue is dependent upon the success and economic v iab ility of our tenants. If a tenant or lease guarantor declares bankruptcy or becomes insolvent, we may be unable to collect balances due under relevant leases. ▪ Our tenants may not be diversified including by industry type or geographic location. ▪ The performance of our retail portfolio is linked to the market for retail space generally and factors that may impact our re tai l tenants, such as the increasing use of the Internet by retailers and consumers. ▪ We depend on our Advisor and Property Manager to provide us with executive officers, key personnel and all services required for us to conduct our operations. ▪ All of our executive officers face conflicts of interest, such as conflicts created by the terms of our agreements with our A dvi sor and compensation payable thereunder, conflicts allocating investment opportunities to us, and conflicts in allocating their time and attention to our matters. Conflicts that arise may not be res olv ed in our favor and could result in actions that are adverse to us. ▪ We have long - term agreements with our Advisor and its affiliates that may be terminated only in limited circumstances. ▪ We have substantial indebtedness and may be unable to repay, refinance, restructure or extend our indebtedness as it becomes due . Increases in interest rates could increase the amount of our debt payments. We may incur additional indebtedness in the future. ▪ The stockholder rights plan adopted by our board of directors, our classified board and other aspects of our corporate struct ure and Maryland law may discourage a third party from acquiring us in a manner that might result in a premium price to our stockholders. ▪ Restrictions on share ownership contained in our charter may inhibit market activity in shares of our stock and restrict our bus iness combination opportunities. ▪ We may fail to continue to qualify as a REIT.

Confidential – Not for Distribution 22 22 Appendix
American Finance Trust, Inc. 23 DEFINITIONS AFFO : In calculating AFFO, we start with FFO, then we exclude certain income or expense items from AFFO that we consider to be more reflective of investing activities, such as non - cash income and expense items and the income and expense effects of other activities that are not a fundamental attribute of our day to day operating business plan, such as amounts related to the litigation arising out of AFIN's 2017 merger with American Realty Capital - Retail Centers of America, Inc . (the “Merger”) . These amounts include legal costs incurred as a result of the litigation, portions of which have been and may in the future be reimbursed under insurance policies maintained by us . Insurance reimbursements are deducted from AFFO in the period of reimbursement . We believe that excluding the litigation costs and subsequent insurance reimbursements litigation arising out of the Merger helps to provide a better understanding of the operating performance of our business . Other income and expense items also include early extinguishment of debt and unrealized gains and losses, which may not ultimately be realized, such as gains or losses on derivative instruments and gains and losses on investments . In addition, by excluding non - cash income and expense items such as amortization of above - market and below - market leases intangibles, amortization of deferred financing costs, straight - line rent, and share - based compensation related to restricted shares and the 2018 outperformance agreement with the Advisor from AFFO, we believe we provide useful information regarding those income and expense items which have a direct impact on our ongoing operating performance . By providing AFFO, we believe we are presenting useful information that can be used to better assess the sustainability of our ongoing operating performance without the impact of transactions or other items that are not related to the ongoing performance of our portfolio of properties . AFFO presented by us may not be comparable to AFFO reported by other REITs that define AFFO differently . Please refer to our Form 10 - Q for further details on our calculation of AFFO . Annualized Straight - Line Rent : Straight - line rent which is annualized and calculated using most recent available lease terms as of the period end indicated . Cap Rate : Capitalization rate is a rate of return on a real estate investment property based on the expected, annualized straight - lined rental income that the property will generate under its existing lease or leases during its first year of ownership . Capitalization rate is calculated by dividing the annualized straight - lined rental income the property will generate (before debt service and depreciation and after fixed costs and variable costs) by the purchase price of the property, excluding acquisition costs . Weighted average cap rates are based on square feet unless otherwise indicated . Cash Cap Rate : For acquisitions, cash cap rate is a rate of return on a real estate investment property based on the expected, annualized cash rental income during the first year of ownership that the property will generate under its existing lease or leases . For dispositions, cash cap rate is a rate of return based on the annualized cash rental income of the property to be sold . For acquisitions, cash cap rate is calculated by dividing this annualized cash rental income the property will generate (before debt service and depreciation and after fixed costs and variable costs) by the purchase price of the property, excluding acquisition costs . For dispositions, cash cap rate is calculated by dividing the annualized cash rental income by the contract sales price for the property, excluding acquisition costs . Weighted average cash cap rates are based on square feet unless otherwise indicated . Cash NOI : We define Cash NOI as NOI excluding amortization of above/below market lease intangibles and straight - line adjustments that are included in GAAP lease revenues . Cash Rent : Represents total of all contractual rents on a cash basis due from tenants as stipulated in the originally executed lease agreements at inception or any lease amendments thereafter prior to a Deferral Agreement or rent credit (see slide 6 for further information) . “Original Cash Rent” refers to contractual rents on a cash basis due from tenants as stipulated in their originally executed lease agreement at inception or as amended, prior to any rent deferral agreement . We calculate “Original Cash Rent collections” by comparing the total amount of rent collected during the period to the original Cash Rent due . Total rent collected during the period includes both original Cash Rent due and payments made by tenants pursuant to rent deferral agreements . Eliminating the impact of deferred rent paid, we collected 98 % of original Cash Rent due in the first quarter of 2021 . Executed Occupancy : Includes Occupancy as defined below as of a particular date as well as all leases fully executed by both parties as of the same date where the tenant has yet to take possession as of such date . There are eight additional leases executed as of March 31 , 2021 where rent commences over time between the second quarter of 2021 and the first quarter of 2022 totaling approximately 96 , 000 square feet . Experiential Retail : We define Experiential Retail as multi - tenant properties leased to tenants in the restaurant, discount retail, entertainment, salon/beauty, and grocery sectors, among others . FFO : We define FFO, a non - GAAP measure, consistent with the standards established over time by the Board of Governors of NAREIT, as restated in a White Paper and approved by the Board of Governors of NAREIT effective in December 2018 (the "White Paper") . The White Paper defines FFO as net income or loss computed in accordance with GAAP excluding depreciation and amortization related to real estate, gains and losses from sales of certain real estate assets, gain and losses from change in control and impairment write - downs of certain real estate assets and investments in entities when the impairment is directly attributable to decreases in the value of depreciable real estate held by the entity . Adjustments for unconsolidated partnerships and joint ventures are calculated to exclude the proportionate share of the non - controlling interest to arrive at FFO attributable to stockholders . Our FFO calculation complies with NAREIT's definition .
American Finance Trust, Inc. 24 DEFINITIONS (CONTINUED) GAAP : Accounting principles generally accepted in the United States of America . Gross Asset Value : Total gross asset value of $ 4 . 3 billion, comprised of total assets of $ 3 . 6 billion plus accumulated depreciation and amortization of $ 0 . 7 b illion as of March 31 , 2021 . Investment Grade : As used herein, investment grade includes both actual investment grade ratings of the tenant or guarantor, if available, or implied investment grade . Implied investment grade may include actual ratings of tenant parent, guarantor parent (regardless of whether or not the parent has guaranteed the tenant’s obligation under the lease) or by using a proprietary Moody’s analytical tool, which generates an implied rating by measuring a company’s probability of default . The term “parent" for these purposes includes any entity, including any governmental entity, owning more than 50 % of the voting stock in a tenant . Ratings information is as of March 31 , 2021 . Single - tenant portfolio tenants are 50 % actual investment grade rated and 11 % implied investment grade rated . Leasing Pipeline : Leasing pipeline ( i ) all leases fully executed by both parties as of April 30, 2021, but after March 31, 2021 and (ii) all leases under negotiat ion with an executed LOI by both parties as of April 30, 2021. This represents two executed leases where rent commences over time between the third quarter of 2021 and the fourth qua rte r of 2021 totaling approximately 11,000 square feet and two LOIs totaling 21,000 square feet, net of one lease termination for 5,000 square feet after March 31, 2021. There can be no assurance that LOIs wil l l ead to definitive leases that will commence on their current terms, or at all. Leasing pipeline should not be considered an indication of future performance. Liquidity: As of March 31, 2021, the Company had $84.2 million in cash and cash equivalents, and $134.3 million available for future borrowings under the Company's credit facility. LOI: Means a non - binding letter of intent. Necessity - Based : AFIN definition of Necessity - Based includes properties leased to Service Retail and/or Experiential Retail tenants . Net Debt : Total debt of $ 1 . 8 billion less cash and cash equivalents of $ 84 . 2 million as of March 31 , 2021 . Net Debt / Adjusted EBITDA : Represents ratio of net debt as of March 31 , 2021 of $ 1 . 8 billion, to the Company’s calculation of its adjusted earnings before interest, tax, depreciation and amortization (“EBITDA”) multiplied by four for the three months ended March 31 , 2021 . Net Leverage : Represents “Net Debt” as defined above divided by “Gross Asset Value” as defined above shown as a percentage . NOI : Defined as a non - GAAP financial measure used by us to evaluate the operating performance of our real estate . NOI is equal to total revenues, excluding contingent purchase price consideration, less property operating and maintenance expense . NOI excludes all other items of expense and income included in the financial statements in calculating net (loss) . Occupancy : Represents percentage of square footage of which the tenant has taken possession of divided by the respective total rentable square feet as of the date or period end indicated . PSA : Means a definitive purchase and sale agreement . Remaining Lease Term : Represents the outstanding tenant lease term . Weighted based on annualized straight - line rent as of the date or period end indicated . Rent Escalators : Represents contractual increases of base rent . Contractual rent increases include fixed percent or actual increases, or CPI - indexed increases . Annual averages are weighted based on annualized straight - line rent as of March 31 , 2021 . Service Retail : AFIN’s definition of Service Retail includes single - tenant retail properties leased to tenants in the retail banking, restaurant, grocery, phar macy, gas/convenience, fitness, healthcare, and auto services sectors . Traditional Retail : AFIN definition of Traditional Retail includes single - tenant retail properties leased to tenants in the discount retail, home improvement, furniture, specialty retail, auto retail, sporting goods sectors, wireless/electronics, department stores, and home improvement .

Three Months Ended March 31, 2021 March 31, 2020 (Unaudited) (Unaudited) EBITDA: Net income (loss) $ (3,754) $ (5,543) Depreciation and amortization 32,319 34,335 Interest expense 19,334 19,106 EBITDA 47,899 47,898 Acquisition, transaction and other costs 42 452 Equity - based compensation 4,347 3,211 Gain on sale of real estate investments (286) (1,440) Other income (24) (72) Adjusted EBITDA 51,978 50,049 Asset management fees to related party 7,321 6,905 General and administrative 6,449 5,328 NOI 65,748 62,282 Amortization of market lease and other intangibles, net (935) (992) Straight - line rent (1,727) (2,265) Cash NOI $ 63,086 $ 59,025 Cash Paid for Interest: Interest expense $ 19,334 $ 19,106 Amortization of deferred financing costs, net and change in accrued interest (2,469) (1,712) Amortization of mortgage discounts and premiums on borrowings 321 506 Total cash paid for interest $ 17,186 $ 17,954 American Finance Trust, Inc. 25 NON - GAAP RECONCILIATIONS Non - GAAP Measures Amounts in thousands
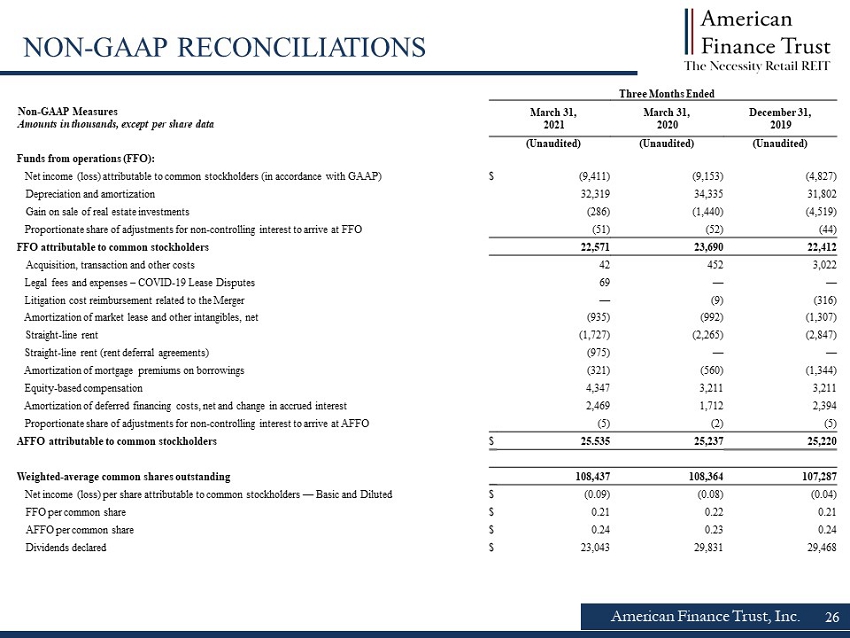
Three Months Ended March 31, 2021 March 31, 2020 December 31, 2019 (Unaudited) (Unaudited) (Unaudited) Funds from operations (FFO): Net income (loss) attributable to common stockholders (in accordance with GAAP) $ (9,411) (9,153) (4,827) Depreciation and amortization 32,319 34,335 31,802 Gain on sale of real estate investments (286) (1,440) (4,519) Proportionate share of adjustments for non - controlling interest to arrive at FFO (51) (52) (44) FFO attributable to common stockholders 22,571 23,690 22,412 Acquisition, transaction and other costs 42 452 3,022 Legal fees and expenses – COVID - 19 Lease Disputes 69 — — Litigation cost reimbursement related to the Merger — (9) (316) Amortization of market lease and other intangibles, net (935) (992) (1,307) Straight - line rent (1,727) (2,265) (2,847) Straight - line rent (rent deferral agreements) (975) — — Amortization of mortgage premiums on borrowings (321) (560) (1,344) Equity - based compensation 4,347 3,211 3,211 Amortization of deferred financing costs, net and change in accrued interest 2,469 1,712 2,394 Proportionate share of adjustments for non - controlling interest to arrive at AFFO (5) (2) (5) AFFO attributable to common stockholders $ 25.535 25,237 25,220 Weighted - average common shares outstanding 108,437 108,364 107,287 Net income (loss) per share attributable to common stockholders — Basic and Diluted $ (0.09) (0.08) (0.04) FFO per common share $ 0.21 0.22 0.21 AFFO per common share $ 0.24 0.23 0.24 Dividends declared $ 23,043 29,831 29,468 American Finance Trust, Inc. 26 NON - GAAP RECONCILIATIONS Non - GAAP Measures Amounts in thousands, except per share data