Exhibit 99.1
The Necessity Retail REIT First Quarter 2023 Investor Presentation May 2023
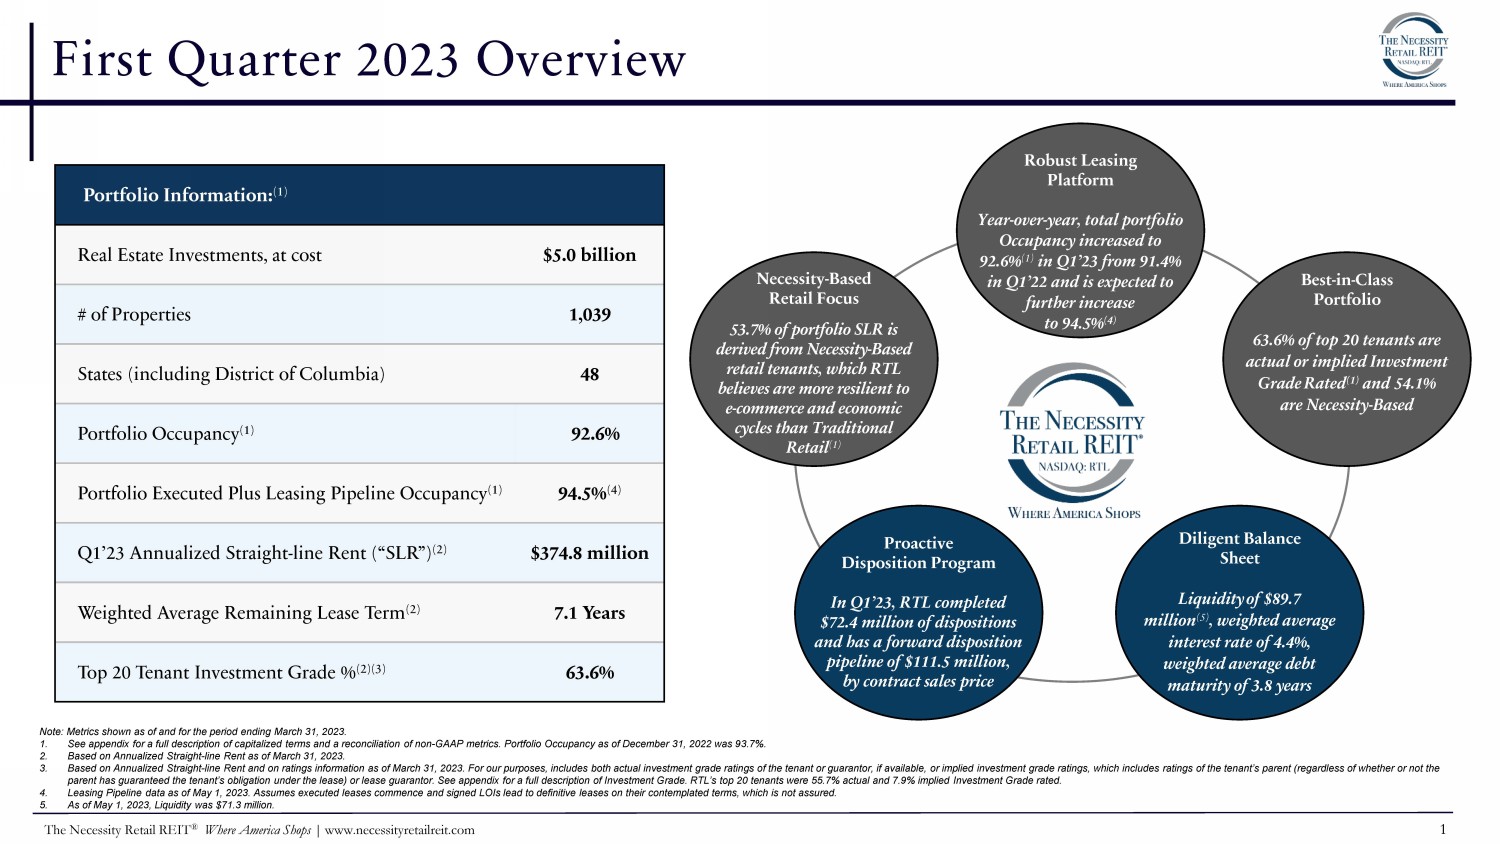
First Quarter 2023 Overview Portfolio Information: (1) Real Estate Investments, at cost $5.0 billion # of Properties 1,039 States (including District of Columbia) 48 Portfolio Occupancy (1) 92.6% Portfolio Executed Plus Leasing Pipeline Occupancy (1) 94.5% (4) Q1’23 Annualized Straight - line Rent (“SLR”) (2) $374.8 million Weighted Average Remaining Lease Term (2) 7.1 Years Top 20 Tenant Investment Grade % (2)(3) 63.6% Note: Metrics shown as of and for the period ending March 31, 2023. 1. See appendix for a full description of capitalized terms and a reconciliation of non - GAAP metrics. Portfolio Occupancy as of December 31, 2022 was 93.7%. 2. Based on Annualized Straight - line Rent as of March 31, 2023. 3. Based on Annualized Straight - line Rent and on ratings information as of March 31, 2023. For our purposes, includes both actual investment grade ratings of the tenant or guarantor, if available, or implied investment grade ratings, which includes ratings of the tenant’s parent (regardless of whether or not the parent has guaranteed the tenant’s obligation under the lease) or lease guarantor. See appendix for a full description of Investment Grade. RTL’s top 20 tenants were 55.7% actual and 7.9% implied Investment Grade rated. 4. Leasing Pipeline data as of May 1, 2023. Assumes executed leases commence and signed LOIs lead to definitive leases on their contemplated terms, which is not assured. 5. As of May 1, 2023, Liquidity was $71.3 million. Diligent Balance Sheet Liquidity of $89.7 million (5) , weighted average interest rate of 4.4%, weighted average debt maturity of 3.8 years N ec essi t y - B ased Retail Focus 53.7% of portfolio SLR is derived from Necessity - Based retail tenants, which RTL believes are more resilient to e - commerce and economic cycles than Traditional Retail (1) Robust Leasing Platform Year - over - year, total portfolio Occupancy increased to 92.6% (1) in Q1’23 from 91.4% in Q1’22 and is expected to further increase to 94.5% (4) Proactive Disposition Program In Q1’23, RTL completed $72.4 million of dispositions and has a forward disposition pipeline of $111.5 million, by contract sales price Best - in - Class Portfolio 63.6% of top 20 tenants are actual or implied Investment Grade Rated (1) and 54.1% are Necessity - Based The Necessity Retail REIT ® Where America Shops | www.necessityretailreit.com 1

First Quarter 2023 Performance Highlights For the periods ended March 31, 2023 and 2022 unless otherwise indicated. 1. Portfolio Occupancy as of December 31, 2022 was 93.7%. Refer to slide 8 for additional information. 2. Leasing Pipeline data as of May 1, 2023. Assumes executed leases commence and signed LOIs lead to definitive leases on their contemplated terms, which is not assured. 3. Includes pipeline as of May 8, 2023. PSAs are subject to conditions and LOIs are non - binding. There can be no assurance the pipeline dispositions will be completed on their current terms, or at all. RTL increased total portfolio Occupancy to 92.6% (1) in Q1’23 from 91.4% in Q1’22 which, including Executed Occupancy and Leasing Pipeline, is expected to further increase to 94.5% (1) and add $7.5 million of SLR (2) . Additionally, RTL reduced net debt by $29 million from Q4’22 to Q1’23 and remains focused on incremental lease - up and its previously announced disposition strategy as part of its efforts to reduce leverage. Significant Leasing Activity (1) Year - over - year, total portfolio Occupancy improved to 92.6% (1) from 91.4% as RTL completed 70 multi - tenant new and renewal leases and 23 single tenant renewals and amendments in Q1’23 that collectively total nearly 1.1 million square feet and $17.8 million of Annualized Straight - line Rent. Total portfolio Executed Occupancy and Leasing Pipeline is expected to increase Occupancy to 94.5% (1) and add $7.5million of SLR (2) . Q1’23 multi - tenant lease renewal spread of 12.7% demonstrates strong renewal demand and market for RTL’s suburban multi - tenant assets. Pandemic - Tested and Resilient Portfolio In 2022, RTL acquired $1.3 billion of pandemic - tested and Necessity - Based retail - focused assets and created the preeminent REIT focused on Necessity - Based retail. As of Q1’23, RTL’s top 20 tenant base was 63.6% Investment Grade rated and featured everyday brands that represent Where America Shops. As of Q1’23, 57% of portfolio SLR was derived from sunbelt markets, with the balance derived from dense suburban markets with strong MSA’s and community centric lifestyles. Diligently Constructed Capital Structure Balanced debt maturity schedule through 2027 that is 83.7% composed of attractive fixed - rate debt. Quarter over quarter, RTL reduced Net Debt by $29 million as RTL remains focused on incremental lease - up and its previously announced disposition strategy as part of its efforts to reduce leverage. RTL’s completed and pipeline disposition activity (3) totaled $183.9 million in Q1’23, by contract sales price, and was composed of $72.4 million of completed dispositions and a forward disposition pipeline of $111.5 million, the net proceeds of which we expect to use to proactively reduce leverage. The Necessity Retail REIT ® Where America Shops | www.necessityretailreit.com 2
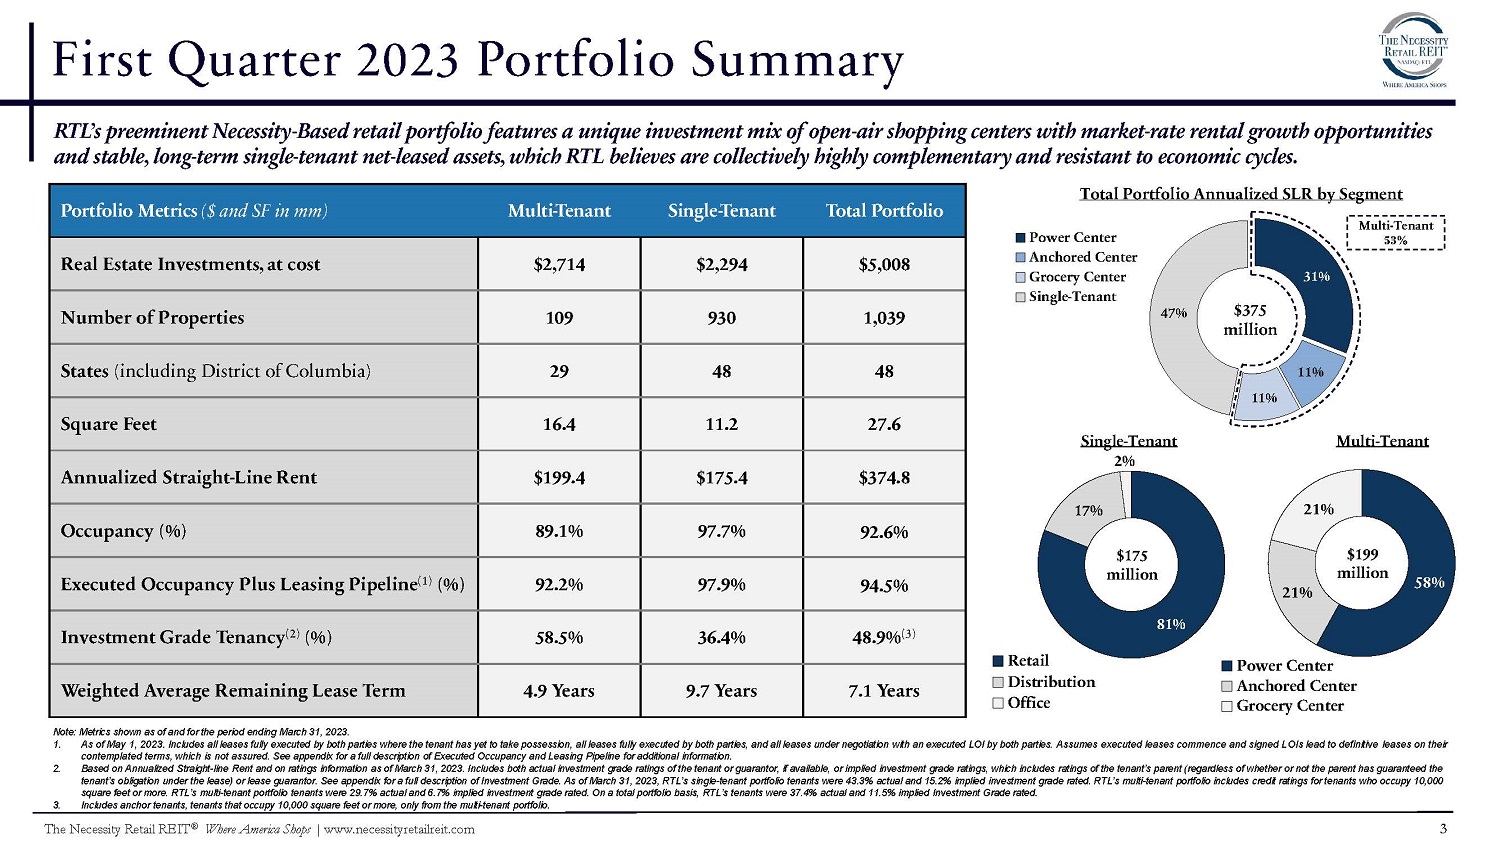
31% 11% 11% 47% Power Center Anchored Center Grocery Center Single - Tenant First Quarter 2023 Portfolio Summary Portfolio Metrics ($ and SF in mm) Multi - Tenant Single - Tenant Total Portfolio Real Estate Investments, at cost $2,714 $2,294 $5,008 Number of Properties 109 930 1,039 States (including District of Columbia) 29 48 48 Square Feet 16.4 11.2 27.6 Annualized Straight - Line Rent $199.4 $175.4 $374.8 Occupancy (%) 89.1% 97.7% 92.6% Executed Occupancy Plus Leasing Pipeline (1) (%) 92.2% 97.9% 94.5% Investment Grade Tenancy (2) (%) 58.5% 36.4% 48.9% (3) Weighted Average Remaining Lease Term 4.9 Years 9.7 Years 7.1 Years RTL’s preeminent Necessity - Based retail portfolio features a unique investment mix of open - air shopping centers with market - rate rental growth opportunities and stable, long - term single - tenant net - leased assets, which RTL believes are collectively highly complementary and resistant to economic c y c l e s . Note : Metrics shown as of and for the period ending March 31 , 2023 . 1. As of May 1 , 2023 . Includes all leases fully executed by both parties where the tenant has yet to take possession, all leases fully executed by both parties, and all leases under negotiation with an executed LOI by both parties . Assumes executed leases commence and signed LOIs lead to definitive leases on their contemplated terms, which is not assured . See appendix for a full description of Executed Occupancy and Leasing Pipeline for additional information . 2. Based on Annualized Straight - line Rent and on ratings information as of March 31 , 2023 . Includes both actual investment grade ratings of the tenant or guarantor, if available, or implied investment grade ratings, which includes ratings of the tenant’s parent (regardless of whether or not the parent has guaranteed the tenant’s obligation under the lease) or lease guarantor . See appendix for a full description of Investment Grade . As of March 31 , 2023 , RTL’s single - tenant portfolio tenants were 43 . 3 % actual and 15 . 2 % implied investment grade rated . RTL’s multi - tenant portfolio includes credit ratings for tenants who occupy 10 , 000 square feet or more . RTL’s multi - tenant portfolio tenants were 29 . 7 % actual and 6 . 7 % implied investment grade rated . On a total portfolio basis, RTL’s tenants were 37 . 4 % actual and 11 . 5 % implied Investment Grade rated . 58% 21% 21% Power Center Anchored Center Grocery Center 81% 17% Single - Tenant 2% Retail Di s t r i b ut io n Office $175 m i l l i o n $199 million Total Portfolio Annualized SLR by Segment $375 mil l i on Multi - Tenant 53% 3. Includes anchor tenants, tenants that occupy 10,000 square feet or more, only from the multi - tenant portfolio. The Necessity Retail REIT ® Where America Shops | www.necessityretailreit.com 3 Multi - Tenant
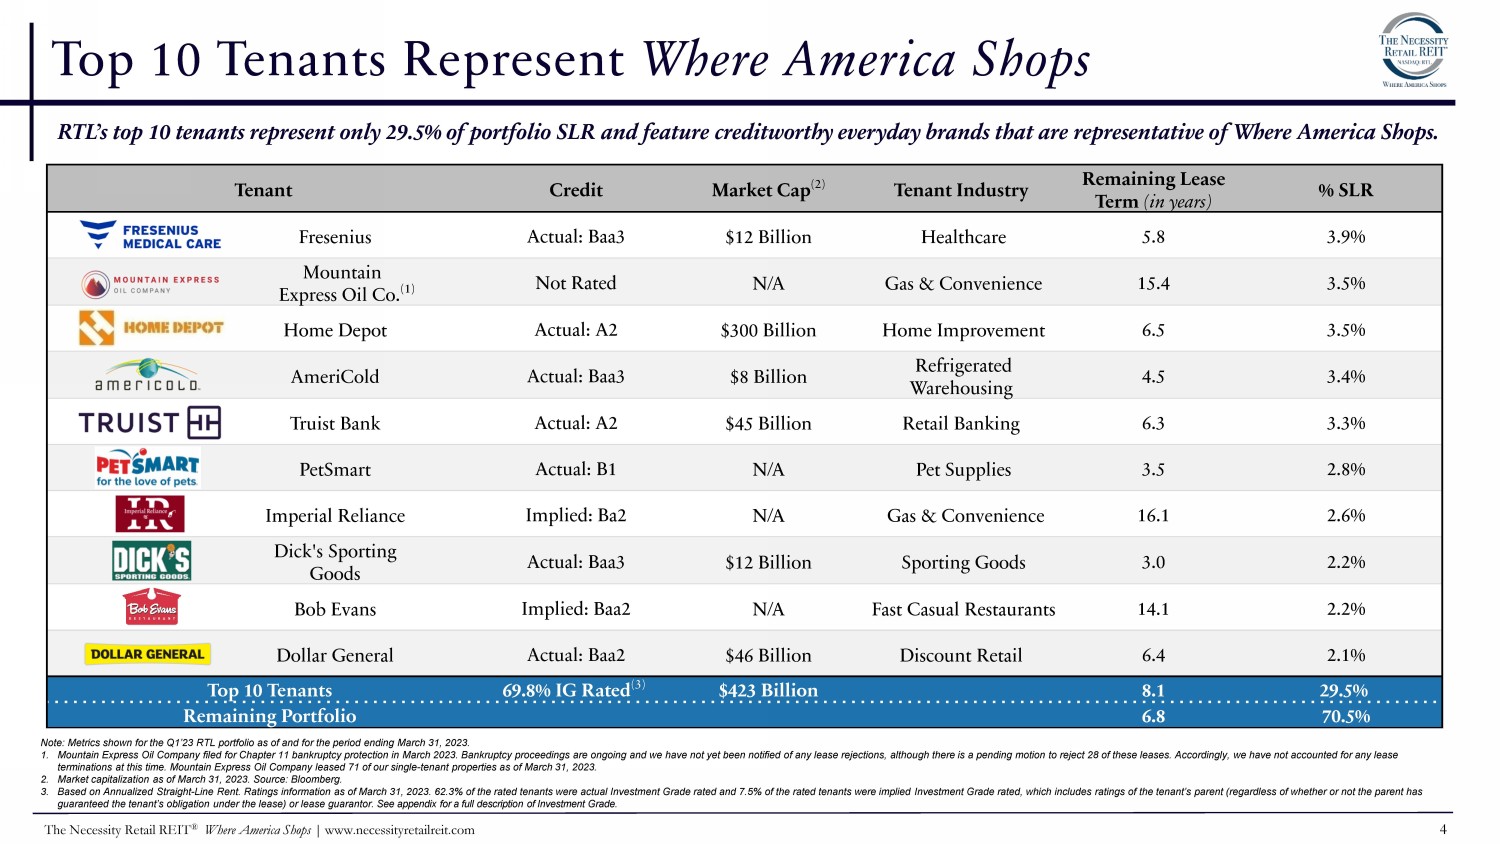
Top 10 Tenants Represent Where America Shops RTL’s top 10 tenants represent only 29.5% of portfolio SLR and feature creditworthy everyday brands that are representative of Where America Shops. Tenant Credit Market Cap (2) Tenant Industry Remaining Lease Term (in years) % SLR Fresenius Actual: Baa3 $12 Billion Healthcare 5.8 3.9% Mountain Express Oil Co. (1) Not Rated N/A Gas & Convenience 15.4 3.5% Home Depot Actual: A2 $300 Billion Home Improvement 6.5 3.5% AmeriCold Actual: Baa3 $8 Billion Refrigerated Warehousing 4.5 3.4% Truist Bank Actual: A2 $45 Billion Retail Banking 6.3 3.3% PetSmart Actual: B1 N/A Pet Supplies 3.5 2.8% Imperial Reliance Implied: Ba2 N/A Gas & Convenience 16.1 2.6% Dick's Sporting Goods Actual: Baa3 $12 Billion Sporting Goods 3.0 2.2% Bob Evans Implied: Baa2 N/A Fast Casual Restaurants 14.1 2.2% Dollar General Actual: Baa2 $46 Billion Discount Retail 6.4 2.1% Top 10 Tenants 69.8% IG Rated (3) $423 Billion 8.1 29.5% Remaining Portfolio 6.8 70.5% Note: Metrics shown for the Q1’23 RTL portfolio as of and for the period ending March 31, 2023. 1. Mountain Express Oil Company filed for Chapter 11 bankruptcy protection in March 2023. Bankruptcy proceedings are ongoing and we have not yet been notified of any lease rejections, although there is a pending motion to reject 28 of these leases. Accordingly, we have not accounted for any lease terminations at this time. Mountain Express Oil Company leased 71 of our single - tenant properties as of March 31, 2023. 2. Market capitalization as of March 31, 2023. Source: Bloomberg. 3. Based on Annualized Straight - Line Rent. Ratings information as of March 31, 2023. 62.3% of the rated tenants were actual Investment Grade rated and 7.5% of the rated tenants were implied Investment Grade rated, which includes ratings of the tenant’s parent (regardless of whether or not the parent has guaranteed the tenant’s obligation under the lease) or lease guarantor. See appendix for a full description of Investment Grade. The Necessity Retail REIT ® Where America Shops | www.necessityretailreit.com 4
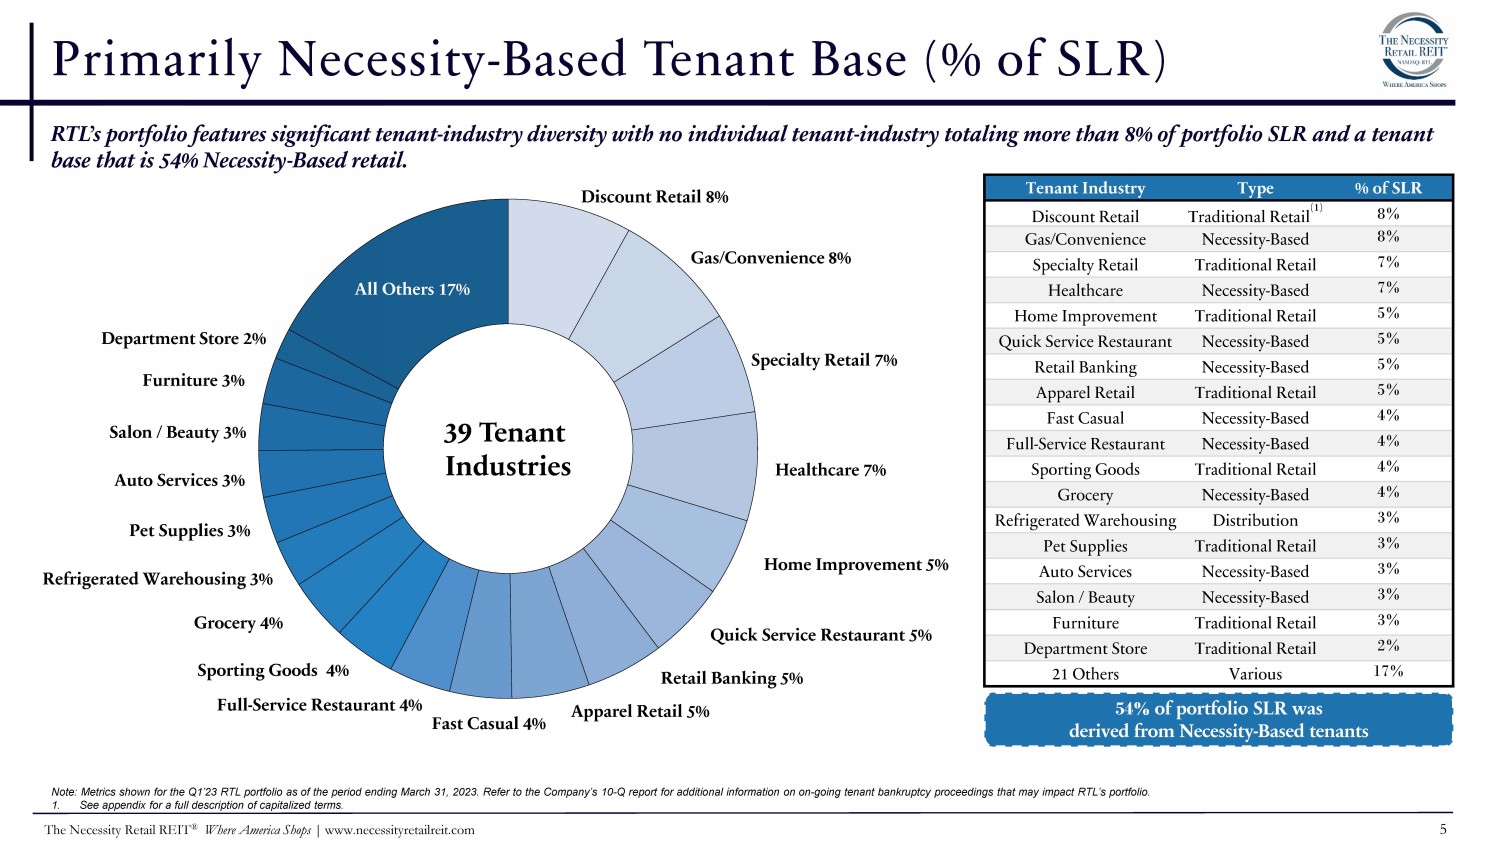
Primarily Necessity - Based Tenant Base (% of SLR) Tenant Industry Type % of SLR Discount Retail Traditional Retail (1) 8% Gas/Convenience Necessity - Based 8% Specialty Retail Traditional Retail 7% Healthcare Necessity - Based 7% Home Improvement Traditional Retail 5% Quick Service Restaurant Necessity - Based 5% Retail Banking Necessity - Based 5% Apparel Retail Traditional Retail 5% Fast Casual Necessity - Based 4% Full - Service Restaurant Necessity - Based 4% Sporting Goods Traditional Retail 4% Grocery Necessity - Based 4% Refrigerated Warehousing Distribution 3% Pet Supplies Traditional Retail 3% Auto Services Necessity - Based 3% Salon / Beauty Necessity - Based 3% Furniture Traditional Retail 3% Department Store Traditional Retail 2% 21 Others Various 17% Specialty Retail 7% Healthcare 7% Home Improvement 5% Quick Service Restaurant 5% Retail Banking 5% Apparel Retail 5% Sporting Goods 4% Full - Service Restaurant 4% Fast Casual 4% Refrigerated Warehousing 3% Grocery 4% Pet Supplies 3% Auto Services 3% Salon / Beauty 3% Department Store 2% Furniture 3% RTL’s portfolio features significant tenant - industry diversity with no individual tenant - industry totaling more than 8% of portfolio SLR and a tenant base that is 54% Necessity - Based retail. Discount Retail 8% Gas/Convenience 8% All Others 17% 39 Tenant I n d ustries 54% of portfolio SLR was derived from Necessity - Based tenants 1. See appendix for a full description of capitalized terms. The Necessity Retail REIT ® Where America Shops | www.necessityretailreit.com 5 Note: Metrics shown for the Q1’23 RTL portfolio as of the period ending March 31, 2023. Refer to the Company’s 10 - Q report for additional information on on - going tenant bankruptcy proceedings that may impact RTL’s portfolio.
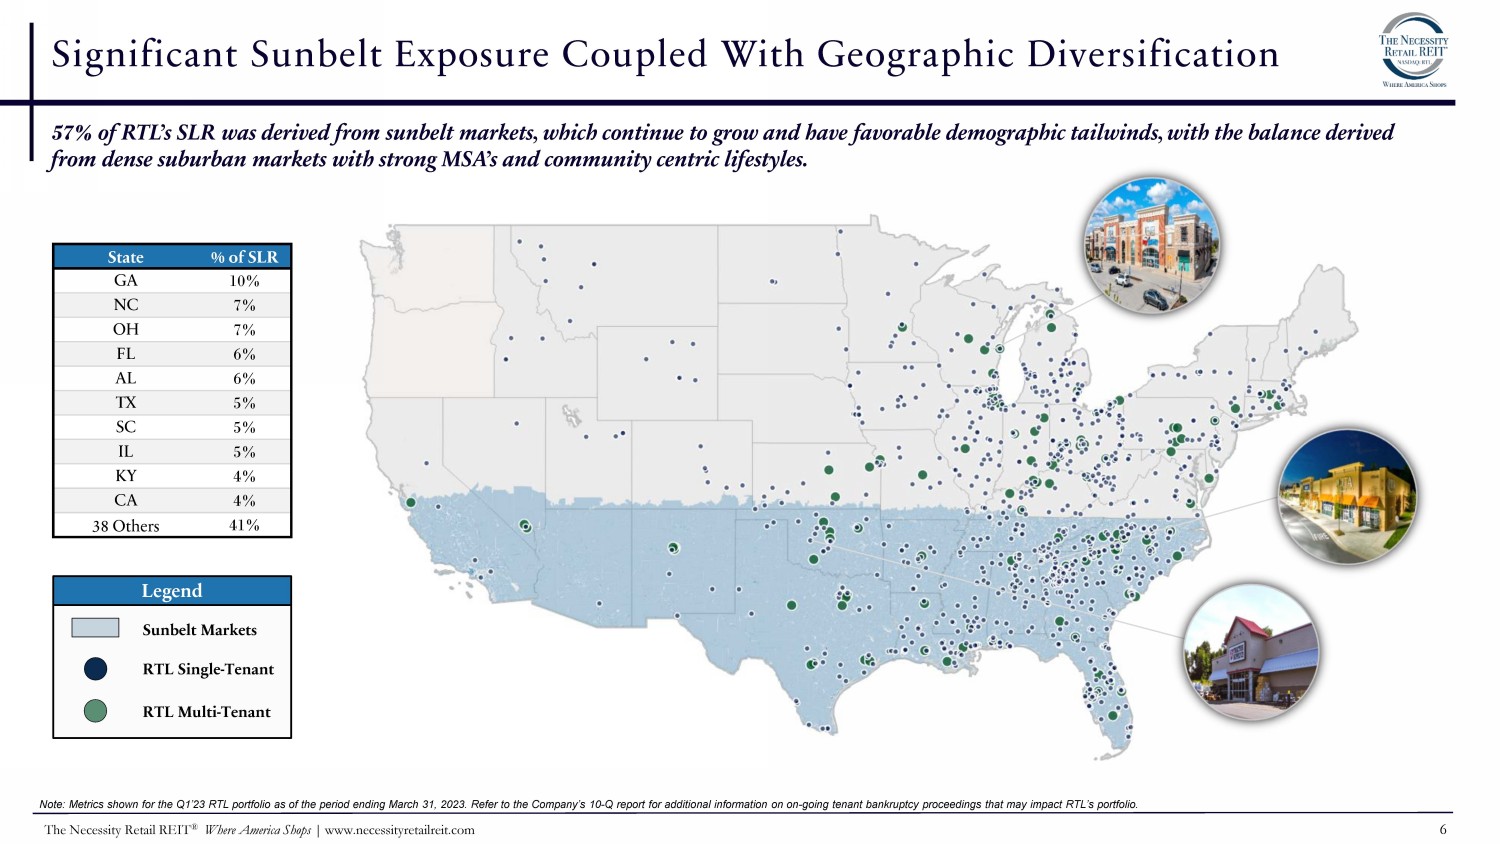
Significant Sunbelt Exposure Coupled With Geographic Diversification 57% of RTL’s SLR was derived from sunbelt markets, which continue to grow and have favorable demographic tailwinds, with the balance derived from dense suburban markets with strong MSA’s and community centric lifestyles. Sunbelt Markets RTL Single - Tenant RTL Multi - Tenant State % of SLR GA 10% NC 7% OH 7% FL 6% AL 6% TX 5% SC 5% IL 5% KY 4% CA 4% 38 Others 41% Legend Note: Metrics shown for the Q1’23 RTL portfolio as of the period ending March 31, 2023. Refer to the Company’s 10 - Q report for additional information on on - going tenant bankruptcy proceedings that may impact RTL’s portfolio. The Necessity Retail REIT ® Where America Shops | www.necessityretailreit.com 6
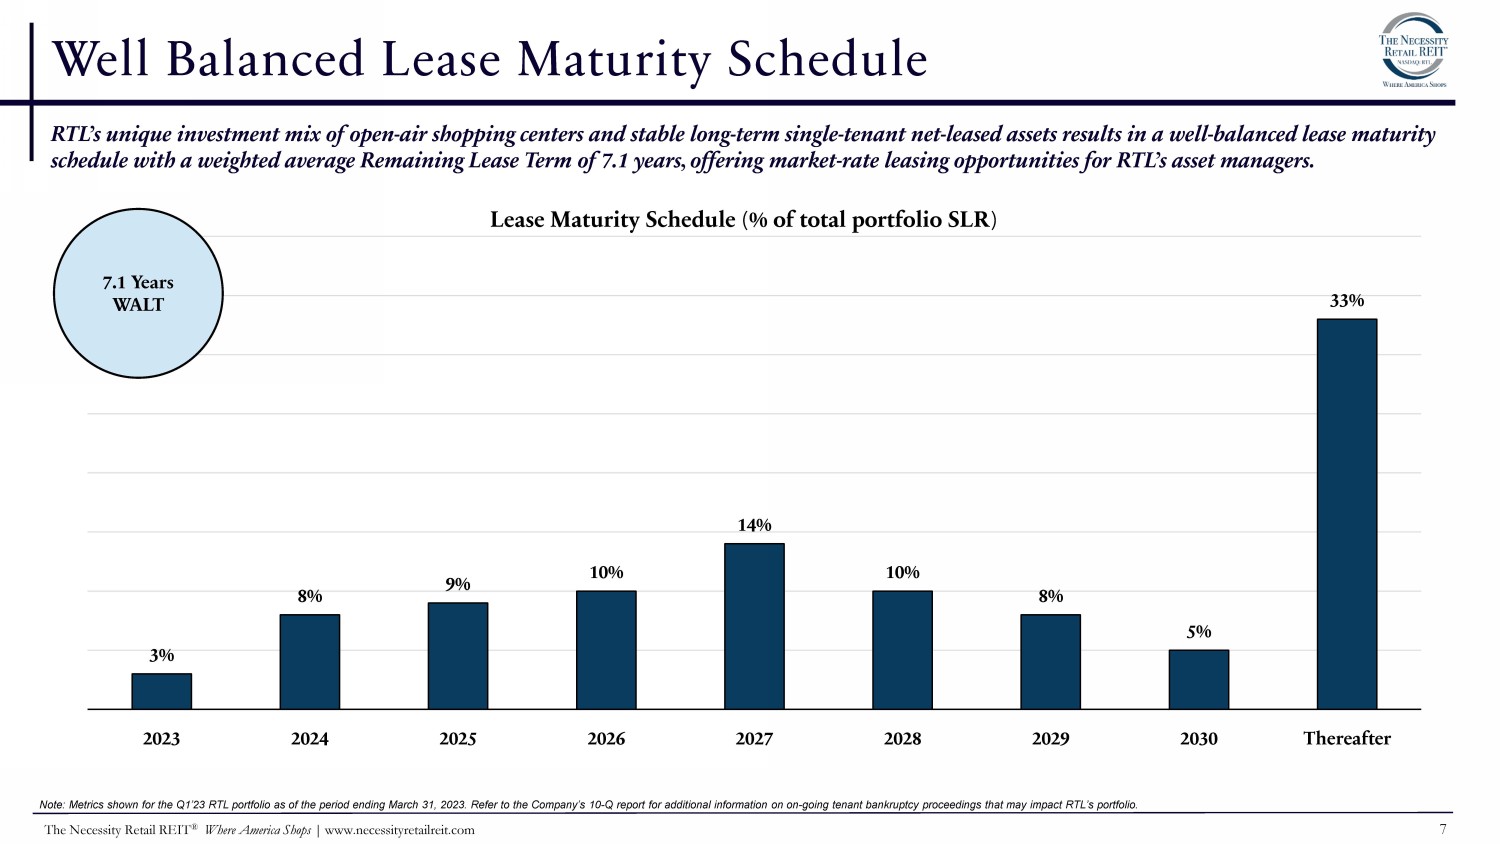
3% 8% 9% 10% 14% 10% 8% 5% 33% 2023 2024 2025 2026 2027 2028 2029 2030 Ther e aft e r Well Balanced Lease Maturity Schedule RTL’s unique investment mix of open - air shopping centers and stable long - term single - tenant net - leased assets results in a well - balanced lease maturity schedule with a weighted average Remaining Lease Term of 7.1 years, offering market - rate leasing opportunities for RTL’s asset managers. Lease Maturity Schedule (% of total portfolio SLR) 7.1 Years WALT Note: Metrics shown for the Q1’23 RTL portfolio as of the period ending March 31, 2023. Refer to the Company’s 10 - Q report for additional information on on - going tenant bankruptcy proceedings that may impact RTL’s portfolio. The Necessity Retail REIT ® Where America Shops | www.necessityretailreit.com 7

14,591 SF 117 SF 385 SF Q1'23 Occupancy Q1'23 Executed Occupancy Q1'23 Leasing Pipeline 87.6% 89.1% 92.2% RTL Q1'22 Occupancy RTL Q1'23 Occupancy Successful Leasing and Asset Management Platform RTL’s Multi - Tenant Leasing Platform Is Expected To Increase SLR By $7.1 Million In the first quarter, RTL completed substantial leasing activity in new leases and renewals, by completing 26 new multi - tenant leases, 44 multi - tenant renewals and modifications with a 12.7% lease spread over the old lease, and 23 single - tenant renewals and modifications. Additionally, RTL had a net 2023 forward Leasing Pipeline of over 502,000 square feet, which is expected to raise its multi - tenant Occupancy rate from 89.1% to 92.2% and increase SLR by $7.1 million. Tenants RTL Transacted With in 2023 RTL Q1’23 + Ex e n c y Leasing Pipeli cuted Occupa & n e ($ in 000’s) Q2'22 Q3'22 Q4'22 Q1’23 Mul t i - Te n a nt New Leases Number of T r a ns acti o n s 22 41 13 26 Square Feet 197,495 512,130 114,080 273,806 Annualized SLR $2,025 $3,531 $1,351 $4,039 Multi - Tenant Renewal / Modification Leases Number of T r a ns acti o n s 38 42 42 44 Square Feet 420,402 571,739 545,234 722,042 Annualized SLR $5,410 $8,377 $6,573 $7,405 Lease Spread (%) 6.8% 7.7% 4.7% 12.7% Single - Tenant Renewal / Modification Leases Number of T r a ns acti o n s 13 3 36 23 Square Feet 116,269 22,032 1,445,343 102,888 Annualized SLR $2,824 $453 $13,195 $6,329 Lease Spread (%) 0.4% 2.8% 2.0% (4.1%) Note: Leasing Pipeline data as of May 1, 2023. Assumes executed leases commence and signed LOIs lead to definitive leases on their contemplated terms, which is not assured. Metrics shown for the Q1’23 RTL portfolio as of the period ending March 31, 2023. The Necessity Retail REIT ® Where America Shops | www.necessityretailreit.com 8
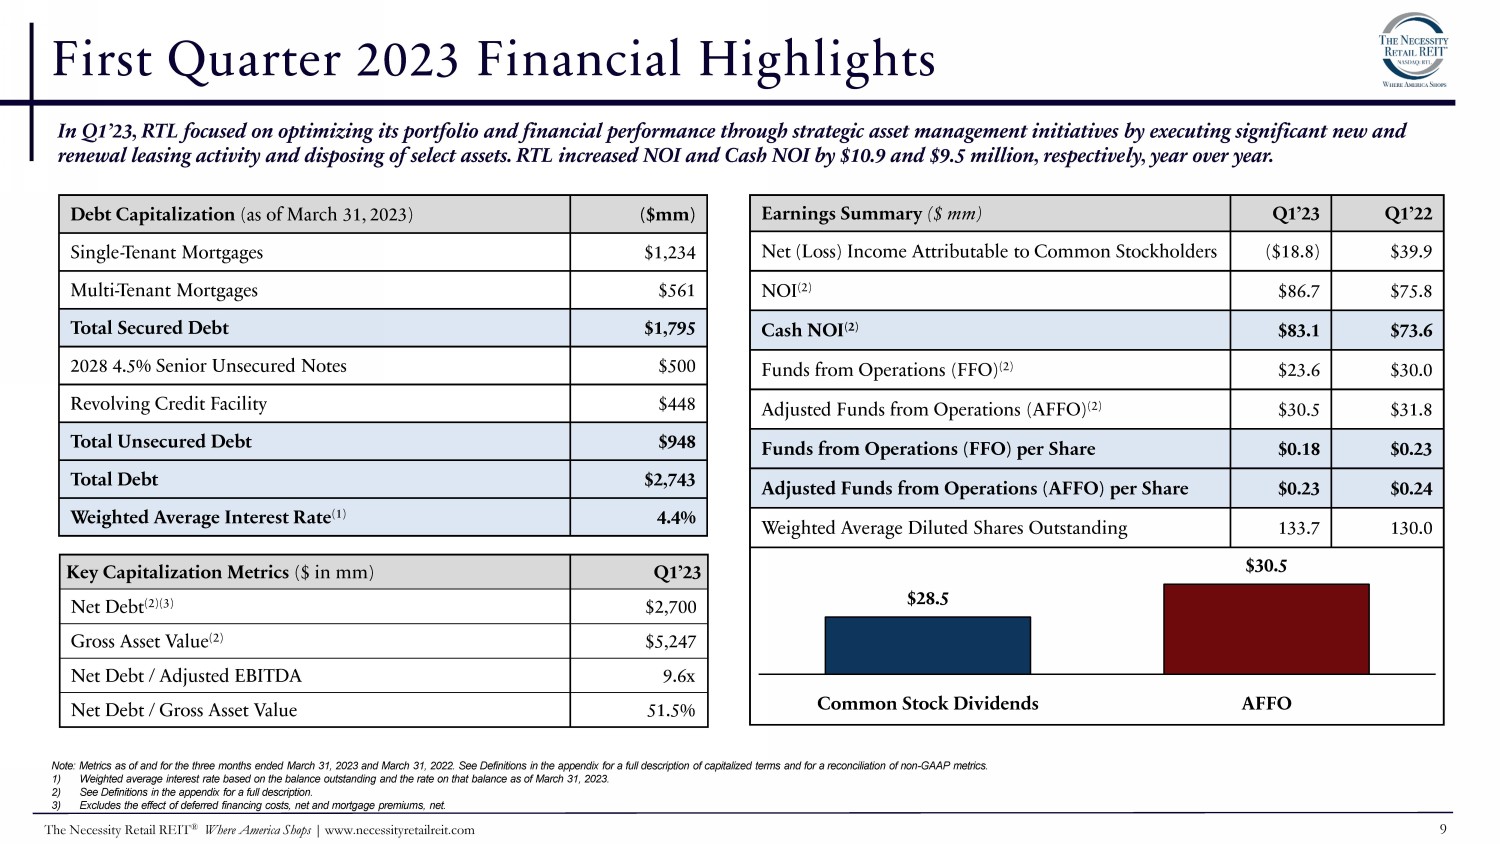
First Quarter 2023 Financial Highlights Note: Metrics as of and for the three months ended March 31, 2023 and March 31, 2022. See Definitions in the appendix for a full description of capitalized terms and for a reconciliation of non - GAAP metrics. 1) Weighted average interest rate based on the balance outstanding and the rate on that balance as of March 31, 2023. 2) See Definitions in the appendix for a full description. 3) Excludes the effect of deferred financing costs, net and mortgage premiums, net. In Q1’23, RTL focused on optimizing its portfolio and financial performance through strategic asset management initiatives by executing significant new and renewal leasing activity and disposing of select assets. RTL increased NOI and Cash NOI by $10.9 and $9.5 million, respectively, year over year. Key Capitalization Metrics ($ in mm) Q1’23 Net Debt (2)(3) $2,700 Gross Asset Value (2) $5,247 Net Debt / Adjusted EBITDA 9.6x Net Debt / Gross Asset Value 51.5% Debt Capitalization (as of March 31, 2023) ($mm) Single - Tenant Mortgages $1,234 Multi - Tenant Mortgages $561 Total Secured Debt $1,795 2028 4.5% Senior Unsecured Notes $500 Revolving Credit Facility $448 Total Unsecured Debt $948 Total Debt $2,743 Weighted Average Interest Rate (1) 4.4% Earnings Summary ($ mm) Q 1’23 Q1’22 Net (Loss) Income Attributable to Common Stockholders ($18.8) $39.9 NOI (2) $86.7 $75.8 Cash NOI (2) $83.1 $73.6 Funds from Operations (FFO) (2) $23.6 $30.0 Adjusted Funds from Operations (AFFO) (2) $30.5 $31.8 Funds from Operations (FFO) per Share $0.18 $0.23 Adjusted Funds from Operations (AFFO) per Share $0.23 $0.24 Weighted Average Diluted Shares Outstanding 133.7 130.0 $30.5 $28.5 Common Stock Dividends AFFO The Necessity Retail REIT ® Where America Shops | www.necessityretailreit.com 9
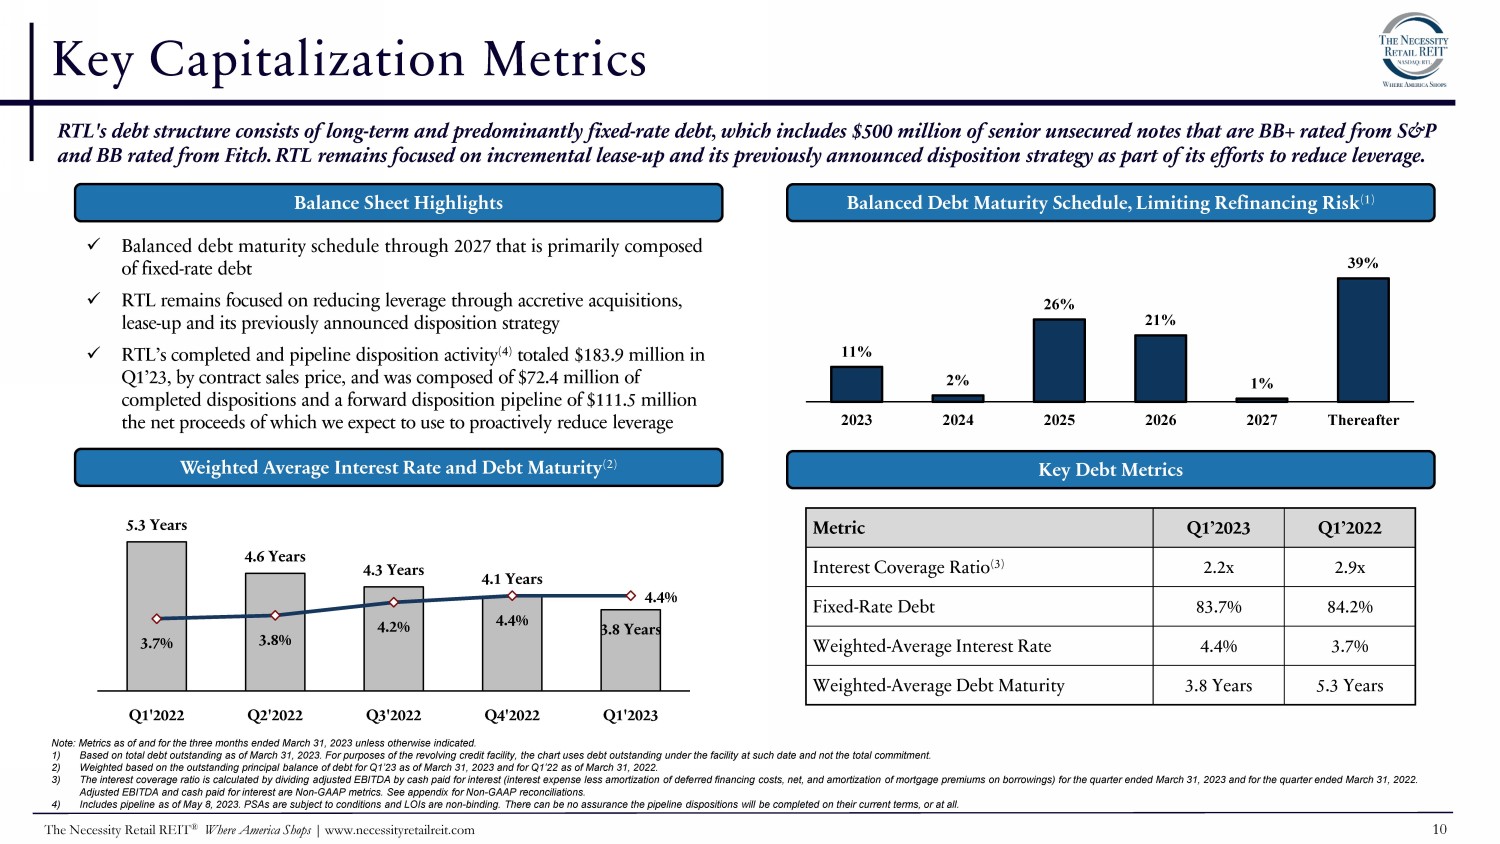
11% 2% 26% 21% 1% 39% 2 0 23 2 0 24 2 0 27 Thereafter Key Capitalization Metrics 5.3 Years 4.6 Years 4.3 Years 4.1 Years 3.8 Years 3 . 7 % 3 . 8 % 4 . 2 % 4 . 4 % 4 . 4 % Q1'2022 Q2'2022 Q3'2022 Q4'2022 Q1'2023 Note: Metrics as of and for the three months ended March 31, 2023 unless otherwise indicated. 1) Based on total debt outstanding as of March 31, 2023. For purposes of the revolving credit facility, the chart uses debt outs tan ding under the facility at such date and not the total commitment. 2) Weighted based on the outstanding principal balance of debt for Q1’23 as of March 31, 2023 and for Q1’22 as of March 31, 2022. 3) The interest coverage ratio is calculated by dividing adjusted EBITDA by cash paid for interest (interest expense less amortization of deferred financing costs, net, and amortization of mortgage premiums on borrowings) for the quarter ended March 31, 2023 and for the quarter ended March 31, 2022. Adjusted EBITDA and cash paid for interest are Non - GAAP metrics. See appendix for Non - GAAP reconciliations. 4) Includes pipeline as of May 8, 2023. PSAs are subject to conditions and LOIs are non - binding. There can be no assurance the pipeline dispositions will be completed on their current terms, or at all. x Balanced debt maturity schedule through 2027 that is primarily composed of fixed - rate debt x RTL remains focused on reducing leverage through accretive acquisitions, lease - up and its previously announced disposition strategy x RTL’s completed and pipeline disposition activity (4) totaled $183.9 million in Q1’23, by contract sales price, and was composed of $72.4 million of completed dispositions and a forward disposition pipeline of $111.5 million the net proceeds of which we expect to use to proactively reduce leverage Metric Q1’2023 Q1’2022 Interest Coverage Ratio (3) 2.2x 2.9x Fixed - Rate Debt 83.7% 84.2% Weighted - Average Interest Rate 4.4% 3.7% Weighted - Average Debt Maturity 3.8 Years 5.3 Years Weighted Average Interest Rate and Debt Maturity (2) 2025 2026 Key Debt Metrics RTL's debt structure consists of long - term and predominantly fixed - rate debt, which includes $500 million of senior unsecured notes that are BB+ rated from S&P and BB rated from Fitch. RTL remains focused on incremental lease - up and its previously announced disposition strategy as part of its efforts to reduce leverage. Balance Sheet Highlights Balanced Debt Maturity Schedule, Limiting Refinancing Risk (1) The Necessity Retail REIT ® Where America Shops | www.necessityretailreit.com 10
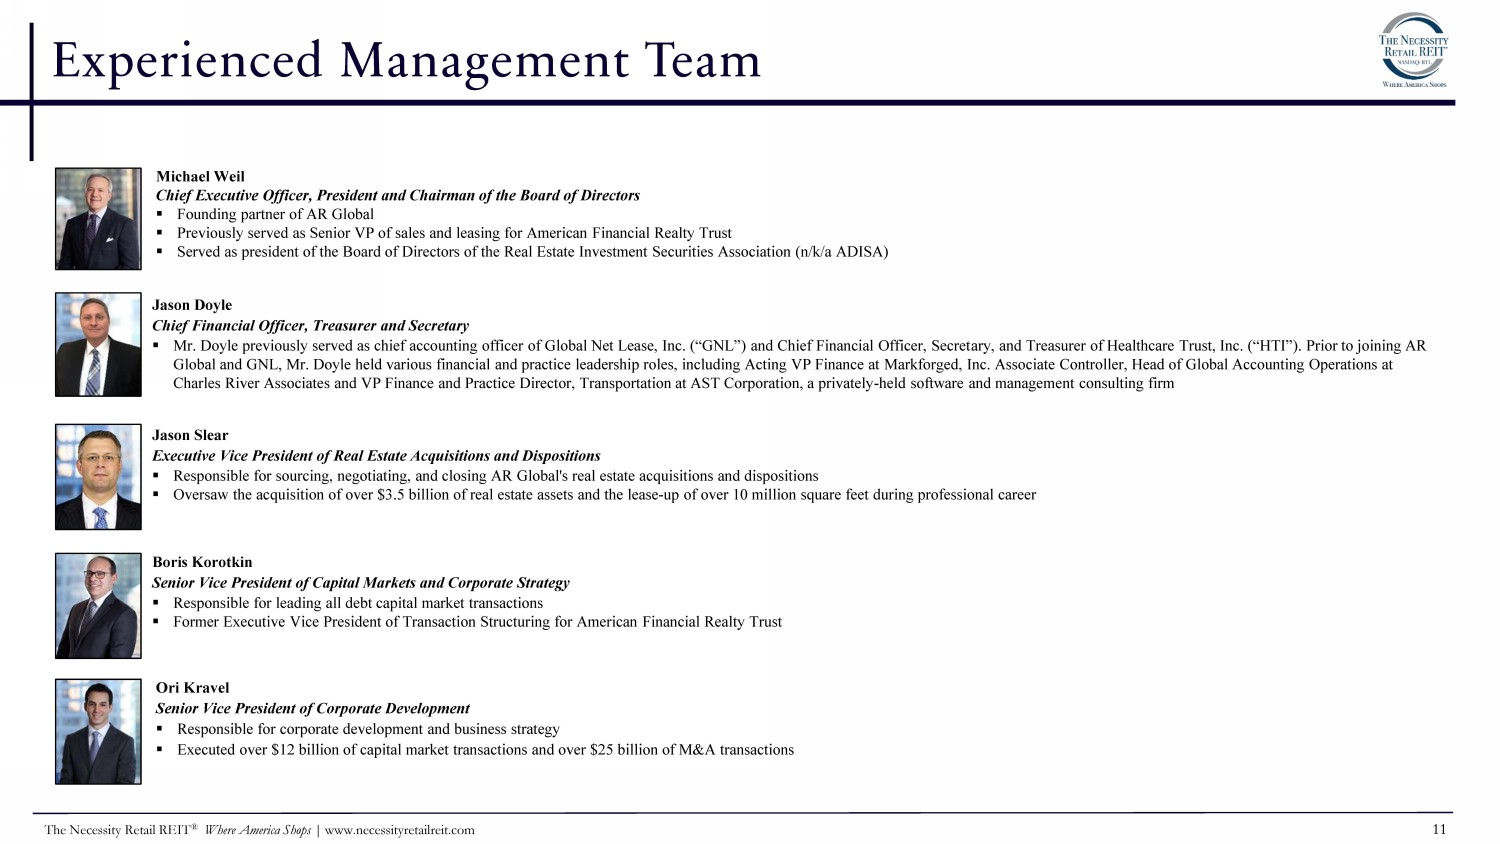
Experienced Management Team Michael Weil Chief Executive Officer, President and Chairman of the Board of Directors ▪ Founding partner of AR Global ▪ Previously served as Senior VP of sales and leasing for American Financial Realty Trust ▪ Served as president of the Board of Directors of the Real Estate Investment Securities Association (n/k/a ADISA) Jason Doyle Chief Financial Officer, Treasurer and Secretary ▪ Mr. Doyle previously served as chief accounting officer of Global Net Lease, Inc. (“GNL”) and Chief Financial Officer, Secretary, and Treasurer of Healthcare Trust, Inc. (“HTI”). Prior to joining AR Global and GNL, Mr. Doyle held various financial and practice leadership roles, including Acting VP Finance at Markforged, Inc. Associate Controller, Head of Global Accounting Operations at Charles River Associates and VP Finance and Practice Director, Transportation at AST Corporation, a privately - held software and management consulting firm Jason Slear Executive Vice President of Real Estate Acquisitions and Dispositions ▪ Responsible for sourcing, negotiating, and closing AR Global's real estate acquisitions and dispositions ▪ Oversaw the acquisition of over $3.5 billion of real estate assets and the lease - up of over 10 million square feet during professional career Boris Korotkin Senior Vice President of Capital Markets and Corporate Strategy ▪ Responsible for leading all debt capital market transactions ▪ Former Executive Vice President of Transaction Structuring for American Financial Realty Trust Ori Kravel Senior Vice President of Corporate Development ▪ Responsible for corporate development and business strategy ▪ Executed over $12 billion of capital market transactions and over $25 billion of M&A transactions The Necessity Retail REIT ® Where America Shops | www.necessityretailreit.com 11

Legal Notices The Necessity Retail REIT ® Where America Shops | www.necessityretailreit.com 12
Disclaimers The Necessity Retail REIT ® Where America Shops | www.necessityretailreit.com 13 Disclaimers This presentation includes estimated projections of future operating results or activities such as leasing activity, among other things . These projections were not prepared in accordance with published guidelines of the SEC or the guidelines established by the American Institute of Certified Public Accountants for preparation and presentation of financial projections . This information is not fact and should not be relied upon as being necessarily indicative of future results ; the projections were prepared in good faith by management and are based on numerous assumptions that may prove to be wrong . Important factors that may affect actual results and cause the projections to not be achieved include, but are not limited to, risks and uncertainties relating to the Company and other factors described in the “Risk Factors” section of the Company's Annual Report on Form 10 - K for the year ended December 31 , 2022 , the Company's subsequent Quarterly Reports on Form 10 - Q and in future filings with the SEC . The projections also reflect assumptions as to certain business decisions that are subject to change . As a result, actual results may differ materially from those contained in the estimates . Accordingly, there can be no assurance that the estimates will be realized . The industry in which we operate is subject to a high degree of uncertainty and risk due to variety of factors, including those described in the “Risk Factors” and "Management's Discussion and Analysis of Financial Condition and Results of Operations" sections of the Company's Annual Report on Form 10 - K for the year ended December 31 , 2022 , filed with the SEC on February 23 , 2023 and the Company's subsequent Quarterly Reports on Form 10 - Q, Current Reports on Form 8 - K and Annual Reports on Form 10 - K filed with the SEC . These and other factors could cause results to differ materially from those expressed in these publications and reports . This presentation contains estimates and information concerning the Company’s industry that is based on industry publications . The Company has not independently verified the accuracy of the data contained in these industry publications . These estimates and information involve a number of assumptions and limitations, and you are cautioned not to rely on or give undue weight to this information . The majority of the concessions granted to the Company's tenants as a result of the COVID - 19 pandemic were rent deferrals or temporary rent abatements with the original lease term unchanged and collection of deferred rent deemed probable . The Company's revenue recognition policy requires that it must be probable that the Company will collect virtually all of the lease payments due and does not provide for partial reserves, or the ability to assume partial recovery . In light of the COVID - 19 pandemic, the FASB and SEC agreed that for leases where the total lease cash flows will remain substantially the same or less than those after the COVID - 19 related effects, companies may choose to forgo the evaluation of the enforceable rights and obligations of the original lease contract as a practical expedient and account for rent concessions as if they were part of the enforceable rights and obligations of the parties under the existing lease contract . As a result, rental revenue used to calculate Net Income and NAREIT FFO has not been significantly impacted by these types of deferrals . In addition, since these deferral amounts were collectable, the Company has excluded from the increase in straight - line rent for AFFO purposes the amounts recognized under GAAP relating to these types of rent deferrals . Conversely, for abatements where contractual rent was reduced, the reduction is reflected over the remaining lease term for accounting purposes but represents a permanent reduction and the Company has, accordingly, reduced its AFFO . Credit Ratings A securities rating is not a recommendation to buy, sell or hold securities and may be subject to revision or withdrawal at any time . Each rating agency has its own methodology for assigning ratings and, accordingly, each rating should be evaluated independently of any other rating .
Forward - Looking Statements The Necessity Retail REIT ® Where America Shops | www.necessityretailreit.com 14 Certain statements made in this presentation are “forward - looking statements” (as defined in Section 21E of the Exchange Act), including estimated projections of future operating results, and the impact and success of any proposed or recently completed acquisitions or dispositions, and which reflect the expectations of the Company regarding future events. The forward - looking statements involve a number of risks, uncertainties and other factors that could cause actual results to differ materially from those contained in the forward - looking statements. Such forward - looking statements include, but are not limited to, market and other expectations, objectives, and intentions, as well as any other statements that are not historical facts. Our potential risks and uncertainties are presented in the section titled “Item 1A - Risk Factors” disclosed in our Annual Report on Form 10 - K for the year ended December 31, 2022 filed with the SEC on February 22, 2023, and the Company's subsequent Quarterly Reports on Form 10 - Q filed with the SEC. Forward - looking statements speak as of the date they are made and, we disclaim any obligation to update and revise statements contained in these materials to reflect changed assumptions, the occurrence of unanticipated events or changes to future operating results over time, unless required by law. The following are some of the risks and uncertainties relating to us, although not all risks and uncertainties, that could cause our actual results to differ materially from those presented in our forward - looking statements: ▪ We may be unable to acquire properties on advantageous terms or our property acquisitions may not perform as we expect. ▪ We are subject to risks associated with a pandemic, epidemic or outbreak of a contagious disease, such as the ongoing global COVID - 19 pandemic, including negative impacts on our tenants and their respective businesses. ▪ We face the uncertainties and costs associated with a proxy contest and related litigation. ▪ Certain of the agreements governing our indebtedness have provisions that may limit our ability to pay dividends on our Class A common stock, our Series A Preferred Stock and our Series C Preferred Stock, and our ability to repurchase shares. ▪ If we are not able to generate sufficient cash from operations, we may have to reduce the amount of dividends we pay or identify and use other financing sources. ▪ Funding dividends from other sources such as borrowings, asset sales or equity issuances limits the amount we can use for property acquisitions, investments and other corporate purposes. ▪ Our operating results are affected by economic and regulatory changes that have an adverse impact on the real estate market in general. ▪ Inflation and continuing increases in the inflation rate may have an adverse effect on our investments and results from operations. ▪ In owning properties we may experience, among other things, unforeseen costs associated with complying with laws and regulations and other costs, potential difficulties selling properties and potential damages or losses resulting from climate change. ▪ We depend on tenants for our rental revenue and, accordingly, our rental revenue depends upon the success and economic viability of our tenants. If a tenant or lease guarantor declares bankruptcy or becomes insolvent, we may be unable to collect balances due under relevant leases. ▪ Our tenants may not be diversified including by industry type or geographic location. ▪ The performance of our retail portfolio is linked to the market for retail space generally and factors that may impact our retail tenants, such as the increasing use of the Internet by retailers and consumers. ▪ Certain of our tenants are facing increased competition with other non - traditional and online grocery retailers and higher costs due to inflation and supply chain issues, which may negatively impact their businesses and ability to pay rent. ▪ We depend on the Advisor and Property Manager to provide us with executives, officers , key personnel and all services required for us to conduct our operations. ▪ All of our executive officers face conflicts of interest, such as conflicts created by the terms of our agreements with the Advisor and compensation payable thereunder, conflicts allocating investment opportunities to us, and conflicts in allocating their time and attention to our matters. Conflicts that arise may not be resolved in our favor and could result in actions that are adverse to us. ▪ We have long - term agreements with our Advisor and its affiliates that may be terminated only in limited circumstances. ▪ We have substantial indebtedness and may be unable to repay, refinance, restructure or extend our indebtedness as it becomes due. Increases in interest rates will increase the amount of our debt payments on certain of our existing debt and any new indebtedness that we are likely to incur in the future. ▪ Our ability to reduce the level of our indebtedness depends on, among other things, sales of properties and ability to raise equity capital neither of which may be on terms acceptable to us, if at all. ▪ The stockholder rights plan adopted by our board of directors, our classified board and other aspects of our corporate structure and Maryland law may discourage a third party from acquiring us in a manner that might result in a premium price to our stockholders. ▪ Restrictions on share ownership contained in our charter may inhibit market activity in shares of our stock and restrict our business combination opportunities. ▪ We may fail to continue to qualify as a REIT.
A pp e n d i x The Necessity Retail REIT ® Where America Shops | www.necessityretailreit.com 15
D e f init i o n s The Necessity Retail REIT ® Where America Shops | www.necessityretailreit.com 16 AFFO : In calculating AFFO, we start with FFO, then we exclude certain income or expense items from AFFO that we consider to be more reflective of investing activities, such as non - cash income and expense items and the income and expense effects of other activities that are not a fundamental attribute of our day to day operating business plan, such as amounts related to litigation arising out of the merger with American Realty Capital - Retail Centers of America, Inc . in February 2017 (the “Merger”) . These amounts include, but are not limited to, legal costs incurred as a result of the litigation, portions of which have been and may in the future be reimbursed under insurance policies maintained by us . Insurance reimbursements are deducted from AFFO in the period of reimbursement . We believe that excluding the litigation costs and subsequent insurance reimbursements related to litigation arising out of the Merger helps to provide a better understanding of the operating performance of our business . Other income and expense items also include early extinguishment of debt and unrealized gains and losses, which may not ultimately be realized, such as gains or losses on derivative instruments and gains and losses on investments . In addition, by excluding non - cash income and expense items such as amortization of above - market and below - market lease intangibles, amortization of deferred financing costs, straight - line rent, and share - based compensation related to restricted shares and the 2021 OPP from AFFO, we believe we provide useful information regarding those income and expense items which have a direct impact on our ongoing operating performance . By providing AFFO, we believe we are presenting useful information that can be used to, among other things, assess our performance without the impact of transactions or other items that are not related to of our portfolio of properties . AFFO presented by us may not be comparable to AFFO reported by other REITs that define AFFO differently . Annualized Straight - Line Rent (“SLR”) : Straight - line rent which is annualized and calculated using the most recent available lease terms as of the period end indicated . Cash Cap Rate : For acquisitions, cash cap rate is a rate of return on a real estate investment property based on the expected, annualized cash rental income during the first year of ownership that the property will generate under its existing lease or leases . For dispositions, cash cap rate is a rate of return based on the annualized cash rental income of the property to be sold . For acquisitions, cash cap rate is calculated by dividing this annualized cash rental income the property will generate (before debt service and depreciation and after fixed costs and variable costs) by the purchase price of the property, excluding acquisition costs . For dispositions, cash cap rate is calculated by dividing the annualized cash rental income by the contract sales price for the property, excluding disposition costs . Weighted average cash cap rates are based on square feet unless otherwise indicated . Cash NOI : We define Cash NOI as NOI excluding amortization of above/below market lease intangibles and straight - line adjustments that are included in GAAP lease revenues . Executed Occupancy : Includes Occupancy as defined below as of a particular date as well as all leases fully executed by both parties as of the same date where the tenant has yet to take possession as of such date . For Q 1 ’ 23 and as of March 31 , 2023 , there are 11 additional leases executed where rent commences over time in 2023 totaling approximately 111 , 400 square feet . FFO: We define FFO, a non - GAAP measure, consistent with the standards established over time by the Board of Governors of NAREIT, as restated in a White Paper and approved by the Board of Governors of NAREIT effective in December 2018 (the "White Paper"). The White Paper defines FFO as net income or loss computed in accordance with GAAP excluding depreciation and amortization related to real estate, gains and losses from sales of certain real estate assets, gains and losses from change in control and impairment write - downs of certain real estate assets and investments in entities when the impairment is directly attributable to decreases in the value of depreciable real estate held by the entity. Adjustments for consolidated partially - owned entities (including our OP) and equity in earnings of unconsolidated affiliates are made to arrive at our proportionate share of FFO attributable to our stockholders. Our FFO calculation complies with NAREIT's definition. Gross Asset Value: Total gross asset value of $5.4 billion, comprised of total assets of $4.6 billion plus accumulated depreciation and amortization of $0.8 billion as of March 31, 2023. Investment Grade: As used herein, Investment Grade includes both actual investment grade ratings of the tenant or guarantor, if available, or implied investment grade. Implied investment grade may include actual ratings of tenant parent, guarantor parent (regardless of whether or not the parent has guaranteed the tenant’s obligation under the lease) or by using a proprietary Moody’s analytical tool, which generates an implied rating by measuring a company’s probability of default. The term “parent" for these purposes includes any entity, including any governmental entity, owning more than 50% of the voting stock in a tenant. Ratings information is as of March 31, 2023 and based on Annualized Straight - Line Rent. Leasing Pipeline : Leasing Pipeline includes (i) all leases fully executed by both parties as of May 1, 2023, but after March 31, 2023 and (ii) all leases under negotiation with an executed LOI by both parties as of May 1, 2023. In our multi - tenant portfolio, this represents three executed lease totaling approximately 95,300 square feet and 25 LOIs totaling approximately 296,300 square feet. Leasing pipeline should not be considered an indication of future performance. Liquidity: As of March 31, 2023, the Company had $43.1 million in cash and cash equivalents, and $46.6 million available for future borrowings under the Company's credit facility. LOI: Means a non - binding letter of intent. Necessity - Based: We define Necessity - Based as properties that are leased to tenants that operate in what we believe to be service - based or essential industries such as auto services, distribution, financial services, gas/convenience, grocery, healthcare, and quick service restaurants, among others. Net Debt: For Q1’2023, represents total debt of $2.7 billion less cash and cash equivalents of $43.1 million as of March 31, 2023. For Q1’2022, represents total debt of $2.4 billion less cash and cash equivalents of $82.1 million as of March 31, 2022. NOI: Defined as a non - GAAP financial measure used by us to evaluate the operating performance of our real estate. NOI is equal to total revenues, excluding contingent purchase price consideration, less property operating and maintenance expense. NOI excludes all other items of expense and income included in the financial statements in calculating net (loss). Occupancy: Represents percentage of square footage of which the tenant has taken possession of divided by the respective total rentable square feet as of the date or period end indicated. PSA: Means a definitive purchase and sale agreement. Remaining Lease Term: Represents the outstanding tenant lease term. Weighted based on Annualized Straight - Line Rent as of the date or period end indicated. Traditional Retail: RTL’s definition of Traditional Retail includes retail properties leased to tenants in the auto retail, department store, discount retail, electronics, furniture, home improvement, home furnishing, specialty retail, and sporting good sectors.

Non - GAAP Reconciliations (Adjusted EBITDA, NOI & Cash NOI) The Necessity Retail REIT ® Where America Shops | www.necessityretailreit.com 17 (Unaudited) Three Months Ended Non - GAAP Measures Amounts in thousands March 31, 2023 March 31, 2022 EBITDA: Net (loss) income $ (1 2 , 937 ) 45 , 83 5 Depreciation and amortization 54 , 18 2 37 , 68 8 Interest expense 34 , 67 5 23 , 74 0 EBITDA (1) $ 75 , 92 0 107 , 26 3 Impairment of real estate investments – 5 , 94 2 Acquisition, transaction and other costs 565 279 Equity - based compensation (2) 3 , 56 7 3 , 49 8 Gain on sale of real estate investments (1 1 , 792 ) (5 3 , 569 ) Other income (2 7 ) (1 8 ) Gain on non - designated derivatives ─ (2, 250 ) Expenses attributable to 2023 proxy contest and related litigation (3) 2 , 18 1 ─ Adjusted EBITDA (1) $ 70 , 41 4 61 , 14 5 Asset management fees to related party 7, 9 56 7, 8 26 General and administrative 10 , 49 2 6 , 83 3 Expenses attributable to 2023 proxy contest and related litigation (3) (2, 181 ) ─ NOI (1) $ 86 , 68 1 75 , 80 4 Accretion of market lease and other intangibles, net (2, 476 ) (1, 098 ) Straight - line rent (1, 121 ) (1, 114 ) Cash NOI (1) $ 83 , 08 4 73 , 59 2 Cash Paid for Interest: Interest expense $ 34 , 67 5 23 , 74 0 Amortization of deferred financing costs, net (3, 760 ) (2, 893 ) Amortization of mortgage discounts and premiums on borrowings (4 71 ) 13 Total cash paid for interest $ 30 , 44 4 20 , 86 0 1) For the three months ended March 31, 2023 and March 31, 2022 includes income from a lease termination fee of $0.1 million and $4.5 million, respectively, which is recorded in Revenue from tenants in the consolidated statements of operations. 2) For the three months ended March 31, 2023 and March 31, 2022, includes equity - based compensation expense related to the Company's restricted common shares of $0.4 million and $0.4 million, respectively. 3) Amount relates to general and administrative expenses incurred for the 2023 proxy, including related litigation, that were specifically related to the Company’s 2023 proxy contest and related litigation. The Company does not consider these expenses to be part of its normal operating performance. Due to the increase in these expenses as a portion of its general and administrative expenses in the first quarter of 2023, the Company began including this adjustment to arrive at Adjusted EBITDA in order to better reflect its operating performance. The first quarter of 2022 did not have any of these expenses.
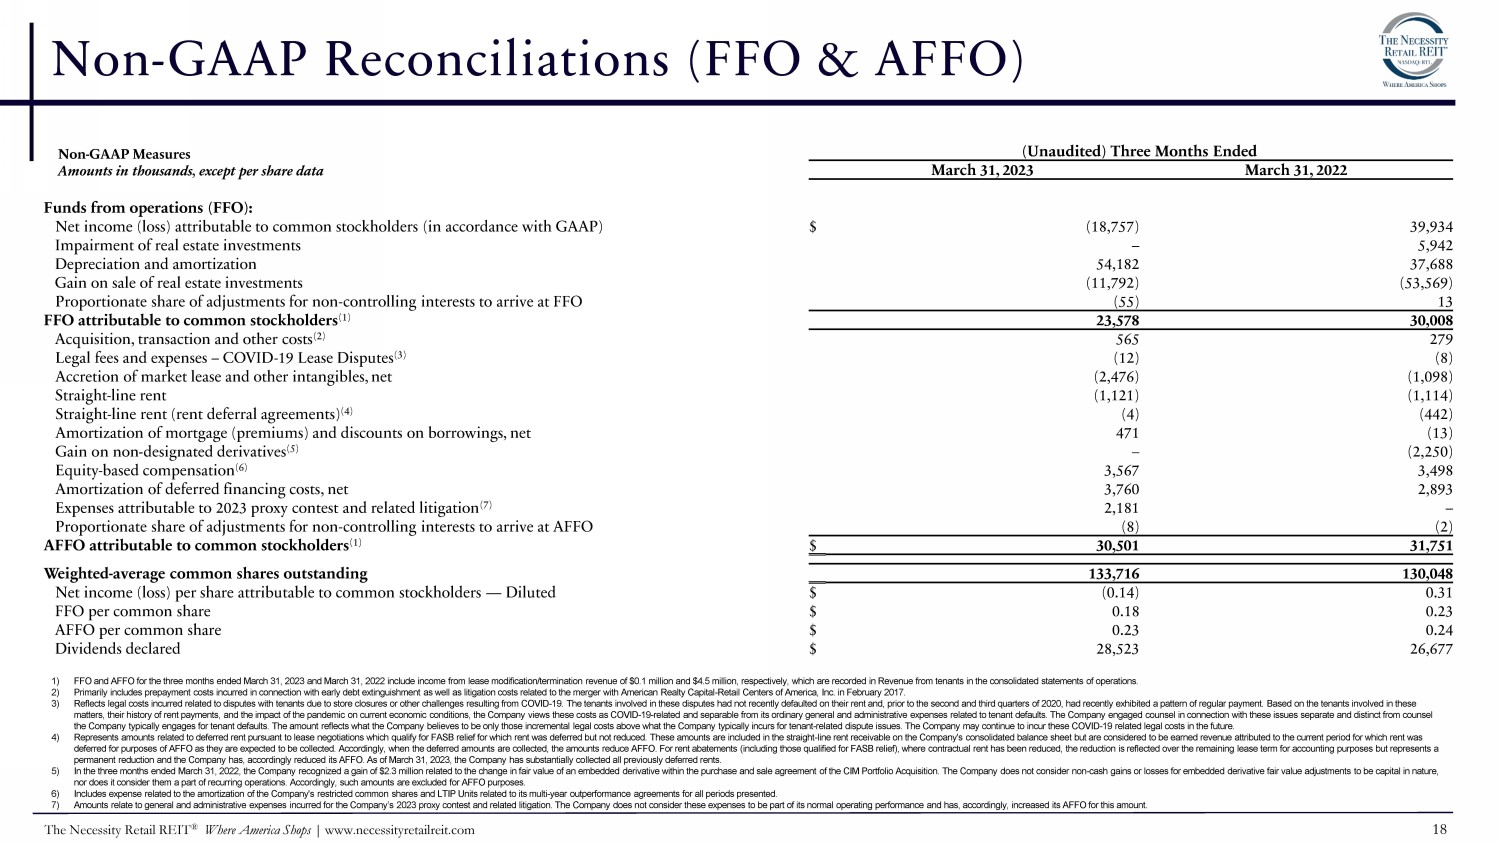
Non - GAAP Reconciliations (FFO & AFFO) 7) Amounts relate to general and administrative expenses incurred for the Company’s 2023 proxy contest and related litigation. The Company does not consider these expenses to be part of its normal operating performance and has, accordingly, increased its AFFO for this amount. The Necessity Retail REIT ® Where America Shops | www.necessityretailreit.com 18 Non - GAAP Measures (Unaudited) Three Months Ended Amounts in thousands, except per share data March 31, 2023 March 31, 2022 Funds from operations (FFO): Net income (loss) attributable to common stockholders (in accordance with GAAP) $ (1 8 , 757 ) 39 , 93 4 Impairment of real estate investments – 5 , 94 2 Depreciation and amortization 54 , 18 2 37 , 68 8 Gain on sale of real estate investments (1 1 , 792 ) (5 3 , 569 ) Proportionate share of adjustments for non - controlling interests to arrive at FFO (5 5 ) 13 FFO attributable to common stockholders (1) 23 , 57 8 30 , 00 8 Acquisition, transaction and other costs (2) 565 279 Legal fees and expenses – COVID - 19 Lease Disputes (3) (1 2 ) (8) Accretion of market lease and other intangibles, net (2, 476 ) (1, 098 ) Straight - line rent (1, 121 ) (1, 114 ) Straight - line rent (rent deferral agreements) (4) (4) (4 42 ) Amortization of mortgage (premiums) and discounts on borrowings, net 471 (1 3 ) Gain on non - designated derivatives (5) – (2, 2 50) Equity - based compensation (6) 3 , 56 7 3 , 49 8 Amortization of deferred financing costs, net 3 , 76 0 2 , 89 3 Expenses attributable to 2023 proxy contest and related litigation (7) 2 , 18 1 – Proportionate share of adjustments for non - controlling interests to arrive at AFFO (8) (2) AFFO attributable to common stockholders (1) $ 30 , 50 1 31 , 75 1 Weighted - average common shares outstanding 133 , 71 6 130 , 04 8 Net income (loss) per share attributable to common stockholders — Diluted $ (0. 14 ) 0 . 3 1 FFO per common share $ 0 . 1 8 0 . 2 3 AFFO per common share $ 0 . 2 3 0 . 2 4 Dividends declared $ 28 , 52 3 26 , 67 7 1) FFO and AFFO for the three months ended March 31, 2023 and March 31, 2022 include income from lease modification/termination revenue of $0.1 million and $4.5 million, respectively, which are recorded in Revenue from tenants in the consolidated statements of operations. 2) Primarily includes prepayment costs incurred in connection with early debt extinguishment as well as litigation costs related to the merger with American Realty Capital - Retail Centers of America, Inc. in February 2017. 3) Reflects legal costs incurred related to disputes with tenants due to store closures or other challenges resulting from COVID - 19. The tenants involved in these disputes had not recently defaulted on their rent and, prior to the second and third quarters of 2020, had recently exhibited a pattern of regular payment. Based on the tenants involved in these matters, their history of rent payments, and the impact of the pandemic on current economic conditions, the Company views these costs as COVID - 19 - related and separable from its ordinary general and administrative expenses related to tenant defaults. The Company engaged counsel in connection with these issues separate and distinct from counsel the Company typically engages for tenant defaults. The amount reflects what the Company believes to be only those incremental legal costs above what the Company typically incurs for tenant - related dispute issues. The Company may continue to incur these COVID - 19 related legal costs in the future. 4) Represents amounts related to deferred rent pursuant to lease negotiations which qualify for FASB relief for which rent was deferred but not reduced. These amounts are included in the straight - line rent receivable on the Company's consolidated balance sheet but are considered to be earned revenue attributed to the current period for which rent was deferred for purposes of AFFO as they are expected to be collected. Accordingly, when the deferred amounts are collected, the amounts reduce AFFO. For rent abatements (including those qualified for FASB relief), where contractual rent has been reduced, the reduction is reflected over the remaining lease term for accounting purposes but represents a permanent reduction and the Company has, accordingly reduced its AFFO. As of March 31, 2023, the Company has substantially collected all previously deferred rents. 5) In the three months ended March 31, 2022, the Company recognized a gain of $2.3 million related to the change in fair value of an embedded derivative within the purchase and sale agreement of the CIM Portfolio Acquisition. The Company does not consider non - cash gains or losses for embedded derivative fair value adjustments to be capital in nature, nor does it consider them a part of recurring operations. Accordingly, such amounts are excluded for AFFO purposes. 6) Includes expense related to the amortization of the Company's restricted common shares and LTIP Units related to its multi - year outperformance agreements for all periods presented.