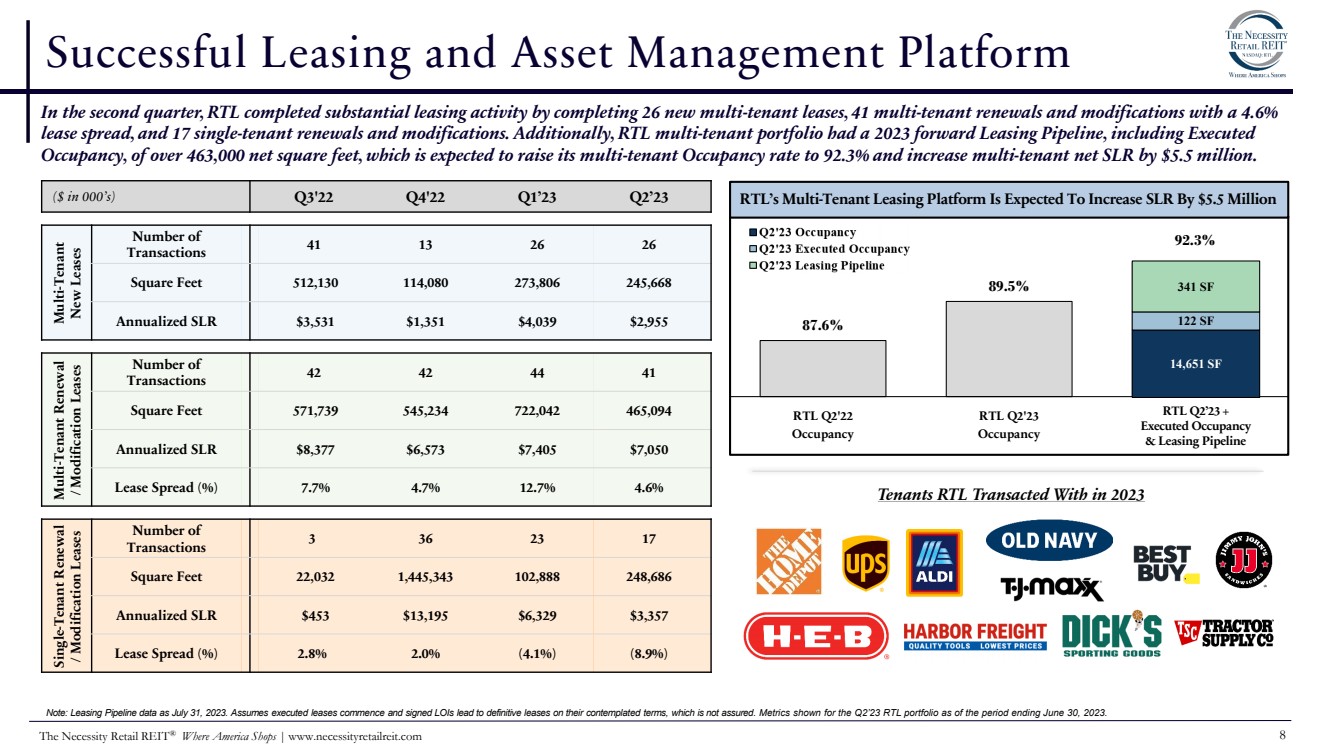
| The Necessity Retail REIT 16 ® Where America Shops | www.necessityretailreit.com Definitions AFFO: In calculating AFFO, we start with FFO, then we exclude certain income or expense items from AFFO that we consider to be more reflective of investing activities, such as non-cash income and expense items and the income and expense effects of other activities that are not a fundamental attribute of our day to day operating business plan. These amounts include, but are not limited to, legal costs incurred as a result of certain litigation. We believe that excluding litigation costs helps to provide a better understanding of the operating performance of our business. Other income and expense items also include early extinguishment of debt and unrealized gains and losses, which may not ultimately be realized, such as gains or losses on derivative instruments and gains and losses on investments. In addition, by excluding non-cash income and expense items such as amortization of above-market and below-market lease intangibles, amortization of deferred financing costs, straight-line rent, and share-based compensation related to restricted shares and the 2021 OPP from AFFO, we believe we provide useful information regarding those income and expense items which have a direct impact on our ongoing operating performance. By providing AFFO, we believe we are presenting useful information that can be used to, among other things, assess our performance without the impact of transactions or other items that are not related to of our portfolio of properties. AFFO presented by us may not be comparable to AFFO reported by other REITs that define AFFO differently. Annualized Straight-Line Rent (“SLR”): Straight-line rent which is annualized and calculated using the most recent available lease terms as of the period end indicated. Cash Cap Rate: For acquisitions, cash cap rate is a rate of return on a real estate investment property based on the expected, annualized cash rental income during the first year of ownership that the property will generate under its existing lease or leases. For dispositions, cash cap rate is a rate of return based on the annualized cash rental income of the property to be sold. For acquisitions, cash cap rate is calculated by dividing this annualized cash rental income the property will generate (before debt service and depreciation and after fixed costs and variable costs) by the purchase price of the property, excluding acquisition costs. For dispositions, cash cap rate is calculated by dividing the annualized cash rental income by the contract sales price for the property, excluding disposition costs. Weighted average cash cap rates are based on square feet unless otherwise indicated. Cash NOI: We define Cash NOI as NOI excluding amortization of above/below market lease intangibles and straight-line adjustments that are included in GAAP lease revenues. Executed Occupancy: Includes Occupancy as defined below as of a particular date as well as all leases fully executed by both parties as of the same date where the tenant has yet to take possession as of such date. For Q2’23 and as of June 30, 2023 , there are 10 additional leases executed where rent commences over time in 2023 totaling approximately 122,200 square feet. FFO: We define FFO, a non-GAAP measure, consistent with the standards established over time by the Board of Governors of NAREIT, as restated in a White Paper and approved by the Board of Governors of NAREIT effective in December 2018 (the "White Paper"). The White Paper defines FFO as net income or loss computed in accordance with GAAP excluding depreciation and amortization related to real estate, gains and losses from sales of certain real estate assets, gains and losses from change in control and impairment write-downs of certain real estate assets and investments in entities when the impairment is directly attributable to decreases in the value of depreciable real estate held by the entity. Adjustments for consolidated partially-owned entities (including our OP) and equity in earnings of unconsolidated affiliates are made to arrive at our proportionate share of FFO attributable to our stockholders. Our FFO calculation complies with NAREIT's definition. Gross Asset Value: Total gross asset value of $5.1 billion, comprised of total assets of $4.3 billion plus accumulated depreciation and amortization of $0.8 billion as of June 30, 2023. Investment Grade: As used herein, Investment Grade includes both actual investment grade ratings of the tenant or guarantor, if available, or implied investment grade. Implied investment grade may include actual ratings of tenant parent, guarantor parent (regardless of whether or not the parent has guaranteed the tenant’s obligation under the lease) or by using a proprietary Moody’s analytical tool, which generates an implied rating by measuring a company’s probability of default. The term “parent" for these purposes includes any entity, including any governmental entity, owning more than 50% of the voting stock in a tenant. Ratings information is as of June 30, 2023 and based on Annualized Straight-Line Rent. Leasing Pipeline: Leasing Pipeline includes (i) all leases fully executed by both parties as of July 31, 2023, but after June 30, 2023, and (ii) all leases under negotiation with an executed LOI by both parties as of July 31, 2023. In our multi-tenant portfolio, this represents 9 leases totaling approximately 183,500 square feet and 23 LOIs totaling approximately 286,400 square feet, net of 6 terminations totaling 129,000 square feet. Leasing pipeline should not be considered an indication of future performance. Liquidity: As of June 30, 2023, the Company had $59.2 million in cash and cash equivalents, and $42.3 million available for future borrowings under the Company's credit facility. LOI: Means a non-binding letter of intent. Necessity-Based: We define Necessity-Based as properties that are leased to tenants that operate in what we believe to be service-based or essential industries such as auto services, distribution, financial services, gas/convenience, grocery, healthcare, and quick service restaurants, among others. Net Debt: For Q2’2023, represents total debt of $2.7 billion less cash and cash equivalents of $59.2 million as of June 30, 2023. For Q2’2022, represents total debt of $2.8 billion less cash and cash equivalents of $69.4 million as of June 30, 2022. NOI: Defined as a non-GAAP financial measure used by us to evaluate the operating performance of our real estate. NOI is equal to total revenues, excluding contingent purchase price consideration, less property operating and maintenance expense. NOI excludes all other items of expense and income included in the financial statements in calculating net (loss). Occupancy: Represents percentage of square footage of which the tenant has taken possession of divided by the respective total rentable square feet as of the date or period end indicated. PSA: Means a definitive purchase and sale agreement. Remaining Lease Term: Represents the outstanding tenant lease term. Weighted based on Annualized Straight-Line Rent as of the date or period end indicated. Traditional Retail: RTL’s definition of Traditional Retail includes retail properties leased to tenants in the auto retail, department store, discount retail, electronics, furniture, home improvement, home furnishing, specialty retail, and sporting good sectors. |