TABLE OF CONTENTS
| Item | Page(s) |
| | |
| Overview | 3 |
| | |
| Financial Information | 4-10 |
| Financial Summary | 4 |
| Consolidated Balance Sheets | 5 |
| Consolidated Statements of Operations | 6 |
| FFO, MFFO, AFFO and Per Share Information | 7 |
| Adjusted EBITDA and Ratio Analysis | 8 |
| Net Operating Income by Property Type | 9 |
| Debt Summary | 10 |
| | |
| Portfolio Metrics | 11-19 |
| Portfolio Composition by Tenant | 11 |
| Portfolio Composition by State | 12 |
| Portfolio Composition by Tenant Industry | 13 |
| Portfolio Composition by Tenant Credit Rating | 14 |
| Lease Expiration Schedule | 15 |
| Portfolio Compositions | 16-18 |
| Top Tenant Descriptions | 19-21 |
| | |
| Definitions | 22-24 |

The data and other information described in these slides are as of the date of the slides or an earlier date as indicated. Future performance may not be consistent with past performance and is subject to change and inherent risks and uncertainties.
This presentation contains certain statements that are American Realty Capital Trust V, Inc.’s (“ARCT V”) and its Management’s hopes, intentions, beliefs, expectations, or projections of the future and might be considered to be forward-looking statements under Federal Securities laws. Prospective investors are cautioned that any such forward-looking statements are not guarantees of future performance, and involve risks and uncertainties. ARCT V’s actual future results may differ significantly from the matters discussed in these forward-looking statements, and we may not release revisions to these forward-looking statements to reflect changes after we’ve made the statements. Factors and risks that could cause actual results to differ materially from expectations are disclosed from time to time in greater detail in ARCT V’s filings with the Securities and Exchange Commission including, but not limited to, ARCT V’s Annual Report on Form 10-K, Quarterly Report on Form 10-Q, as well as ARCT V’s Current Reports on Form 8-K.
OVERVIEW
SUMMARY
American Realty Capital Trust V, Inc. (“ARCT V” or the “Company”), incorporated on January 22, 2013, is a Maryland corporation that intends to elect and qualify to be taxed as a real estate investment trust ("REIT") for U.S. federal income tax purposes.
ARCT V has acquired a diversified portfolio of commercial properties comprised primarily of freestanding single-tenant retail properties that are net leased to investment grade and other creditworthy tenants. On April 29, 2013, ARCT V purchased its first property and commenced active operations.
As of June 30 2014, ARCT V owned 463 properties with an aggregate purchase price of $2.2 billion, comprised of 13.1 million rentable square feet that were 100.0% leased with a weighted average remaining lease term of 10.1 years.
HIGHLIGHTS
Financial Performance1— The Company generated revenue of $42.5million, Adjusted EBITDA1 of $37.4 million and Modified Funds from Operations (MFFO)1 of $26.1 million during the quarter, which represented increases of 40.4%, 45.8% and 24.6% over the first quarter of 2014, respectively, primarily due to the increase in the number of properties owned during the quarter.
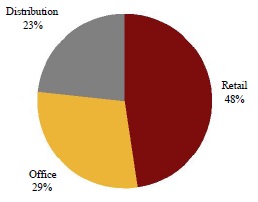
Real Estate Investments— The Company increased real estateinvestments during the quarter through its acquisition of 20 retail properties with an aggregate base purchase price1 of $168.0 million with a weighted average remaining lease term of 12.4 years. As of June 30, 2014, the Company owned $2.2 billion of real estate assets, consisting of $1.0 billion of retail properties, $632.7 million of office properties and $504.6 million of distribution properties, with a weighted average remaining lease term of 10.1 years.
Leverage Profile— The Company’s net leverage ratio was 40.0% as ofJune 30, 2014 with over $1.3 billion, or 60.3%, of its assets unencumbered. The Company had $229.8 million of available borrowings on its Credit Facility at June 30, 2014.
Engagement of Financial Advisors— J.P. Morgan Securities LLC andRCS Capital have been engaged as financial advisors to assist the Company in evaluating potential strategic alternatives.
1See the Definitions section beginning on page 22 for a description of the Company’s non-GAAP measures and pages 7, 8 and 24 for GAAP reconciliations.
FINANCIAL SUMMARY
(dollars in thousands, except per share data)
| | Q2 2014 | Q1 2014 | Q4 2013 | Q3 2013 | Q2 2013 |
| FINANCIAL RESULTS | | | | | | | | | | |
| Revenue | $ | 42,501 | $ | 30,272 | $ | 22,161 | $ | 2,093 | $ | 35 |
| NOI1 | $ | 39,069 | $ | 26,745 | $ | 19,522 | $ | 1,944 | $ | 29 |
| Adjusted EBITDA1 | $ | 37,410 | $ | 25,651 | $ | 18,405 | $ | 773 | $ | (84) |
| | | | | | | | | | | |
| Distributions paid per common share | $ | 0.41 | $ | 0.41 | $ | 0.41 | $ | 0.41 | $ | 0.41 |
| | | | | | | | | | | |
| Funds from operations (FFO)1 | $ | 26,473 | $ | 8,467 | $ | 10,619 | $ | (16,244) | $ | (196) |
| FFO per diluted share | $ | 0.41 | $ | 0.13 | $ | 0.17 | $ | (0.42) | $ | (0.04) |
| | | | | | | | | | | |
| Modified funds from operations (MFFO)1 | $ | 26,144 | $ | 20,990 | $ | 17,718 | $ | 1,816 | $ | (84) |
| MFFO per diluted share | $ | 0.41 | $ | 0.33 | $ | 0.28 | $ | 0.05 | $ | (0.02) |
| | | | | | | | | | | |
| Adjusted funds from operations (AFFO)1 | $ | 27,477 | $ | 21,792 | $ | 18,013 | $ | 1,839 | $ | (50) |
| AFFO per diluted share | $ | 0.43 | $ | 0.34 | $ | 0.29 | $ | 0.05 | $ | (0.01) |
| | | | | | | | | | | |
| | | | | | | | | | | |
| PORTFOLIO STATISTICS | | | | | | | | | | |
| Equity raised by quarter | $ | 15,135 | $ | 14,458 | $ | 97,581 | $ | 1,054,190 | $ | 405,669 |
| Net consolidated debt leverage ratio | | 40.0% | | 37.5% | | NM | | NM | | NM |
| Adjusted fixed charge coverage ratio | | 4.3 x | | 7.9x | | 100.0 x | | 77.3 x | | NM |
| Weighted average remaining lease term | 10.1 years | 10.2 years | 12.1 years | 12.3 years | 14.8 years |
| | | | | | |
| BASE PURCHASE PRICE1 | | | | | | | | | | |
| Retail by quarter | $ | 168,047 | $ | 389,853 | $ | 135,052 | $ | 336,810 | $ | 2,243 |
| Office by quarter | | - | | 259,504 | | 105,281 | | 267,907 | | - |
| Distribution by quarter | | - | | 206,097 | | 8,915 | | 289,599 | | - |
| Total base purchase price | $ | 168,047 | $ | 855,454 | $ | 249,248 | $ | 894,316 | $ | 2,243 |
TOTAL BASE PURCHASE PRICE1
As a % on June 30, 2014
NM – Not meaningful
1See the Definitions section beginning on page 22 for a description of the Company’s non-GAAP measures and pages 7, 8 and 24 for GAAP reconciliations.
4
CONSOLIDATED BALANCE SHEETS
(dollars in thousands)
| | | Q2 2014 | | | Q1 2014 | | | Q4 2013 | | | Q3 2013 | | | Q2 2013 | |
| ASSETS | | | | | | | | | | | | | | | |
| Real estate investments, at cost: | | | | | | | | | | | | | | | |
| Land | $ | 303,803 | | $ | 274,456 | | $ | 147,899 | | $ | 123,176 | | $ | 288 | |
| Building, fixtures and improvements | | 1,667,179 | | | 1,543,752 | | | 868,700 | | | 669,311 | | | 1,632 | |
| Acquired intangible lease assets | | 227,453 | | | 208,879 | | | 130,473 | | | 101,567 | | | 323 | |
| Total real estate investments, at cost | | 2,198,435 | | | 2,027,087 | | | 1,147,072 | | | 894,054 | | | 2,243 | |
| Less: accumulated depreciation and amortization | | (62,367 | ) | | (34,012 | ) | | (14,947 | ) | | (789 | ) | | (19 | ) |
| Total real estate investments, net | | 2,136,068 | | | 1,993,075 | | | 1,132,125 | | | 893,265 | | | 2,224 | |
| | | | | | | | | | | | | | | | |
| Cash and cash equivalents | | 25,009 | | | 17,847 | | | 101,176 | | | 163,056 | | | 346,035 | |
| Investment securities, at fair value | | 35,984 | | | 54,060 | | | 58,566 | | | 93,071 | | | - | |
| Deposits for real estate acquisitions | | - | | | 21,952 | | | 33,035 | | | 110,005 | | | 2,171 | |
| Prepaid expenses and other assets | | 12,011 | | | 6,654 | | | 14,584 | | | 19,740 | | | 10,232 | |
| Deferred costs, net | | 16,516 | | | 15,642 | | | 7,889 | | | 3,217 | | | - | |
| Total assets | $ | 2,225,588 | | $ | 2,109,230 | | $ | 1,347,375 | | $ | 1,282,354 | | $ | 360,662 | |
| | | | | | | | | | | | | | | | |
| LIABILITIES AND STOCKHOLDERS' EQUITY | | | | | | | | | | | | | | | |
| Mortgage notes payable | $ | 470,681 | | $ | 431,075 | | $ | 8,830 | | $ | - | | $ | - | |
| Mortgage premiums, net | | 25,885 | | | 24,410 | | | 334 | | | - | | | - | |
| Credit facility | | 423,000 | | | 338,000 | | | - | | | - | | | - | |
| Below-market lease liabilities, net | | 910 | | | 902 | | | 909 | | | 926 | | | - | |
| Accounts payable and accrued expenses | | 6,402 | | | 8,262 | | | 15,447 | | | 16,898 | | | 2,346 | |
| Deferred rent and other liabilities | | 5,616 | | | 2,284 | | | 1,216 | | | 2,279 | | | - | |
| Distributions payable | | 8,712 | | | 8,913 | | | 8,825 | | | 7,349 | | | 1,731 | |
| Total liabilities | | 941,206 | | | 813,846 | | | 35,561 | | | 27,452 | | | 4,077 | |
| | | | | | | | | | | | | | | | |
| Common stock | | 642 | | | 636 | | | 630 | | | 590 | | | 164 | |
| Additional paid-in capital | | 1,412,896 | | | 1,397,779 | | | 1,383,066 | | | 1,294,059 | | | 358,795 | |
| Accumulated other comprehensive income (loss) | | 323 | | | (1,750 | ) | | (6,981 | ) | | (4,317 | ) | | - | |
| Accumulated deficit | | (129,479 | ) | | (101,281 | ) | | (64,901 | ) | | (35,430 | ) | | (2,374 | ) |
| Total stockholders' equity | | 1,284,382 | | | 1,295,384 | | | 1,311,814 | | | 1,254,902 | | | 356,585 | |
| Total liabilities and stockholders' equity | $ | 2,225,588 | | $ | 2,109,230 | | $ | 1,347,375 | | $ | 1,282,354 | | $ | 360,662 | |
5
CONSOLIDATED STATEMENTS OF OPERATIONS
(dollars in thousands, except share amounts)
| | | Q2 2014 | | | Q1 2014 | | | Q4 2013 | | | Q3 2013 | | | Q2 2013 | |
| REVENUES | | | | | | | | | | | | | | | |
| Rental income | $ | 39,427 | | $ | 26,874 | | $ | 19,821 | | $ | 2,042 | | $ | 29 | |
| Operating expense reimbursements | | 3,074 | | | 3,398 | | | 2,340 | | | 51 | | | 6 | |
| Total revenue | | 42,501 | | | 30,272 | | | 22,161 | | | 2,093 | | | 35 | |
| | | | | | | | | | | | | | | | |
| OPERATING EXPENSES | | | | | | | | | | | | | | | |
| Property operating | | 3,432 | | | 3,527 | | | 2,639 | | | 149 | | | 6 | |
| Acquisition and transaction related | | 4,087 | | | 14,532 | | | 8,663 | | | 18,159 | | | 112 | |
| General and administrative | | 1,659 | | | 1,094 | | | 1,117 | | | 1,171 | | | 113 | |
| Depreciation and amortization | | 28,345 | | | 19,056 | | | 14,158 | | | 770 | | | 19 | |
| Total operating expenses | | 37,523 | | | 38,209 | | | 26,577 | | | 20,249 | | | 250 | |
| | | | | | | | | | | | | | | | |
| OPERATING INCOME (LOSS) | | 4,978 | | | (7,937 | ) | | (4,416 | ) | | (18,156 | ) | | (215 | ) |
| | | | | | | | | | | | | | | | |
| Other (expense) income: | | | | | | | | | | | | | | | |
| Interest expense | | (7,723 | ) | | (3,444 | ) | | (457 | ) | | (28 | ) | | - | |
| Interest income | | 158 | | | 3 | | | 45 | | | 62 | | | - | |
| Income from investment securities | | 606 | | | 955 | | | 1,164 | | | 1,108 | | | - | |
| Gain (Loss) on sale of investment securities | | 109 | | | (166 | ) | | 125 | | | - | | | - | |
| Total other (expense) income, net: | | (6,850 | ) | | (2,652 | ) | | 877 | | | 1,142 | | | - | |
| Net loss | $ | (1,872 | ) | $ | (10,589 | ) | $ | (3,539 | ) | $ | (17,014 | ) | $ | (215 | ) |
| | | | | | | | | | | | | | | | |
| Weighted average shares outstanding: | | | | | | | | | | | | | | | |
| Basic and diluted | | 64,018,318 | | | 62,693,554 | | | 62,329,506 | | | 38,295,114 | | | 5,173,574 | |
| Net loss per share: | | | | | | | | | | | | | | | |
| Basic and diluted | $ | (0.03 | ) | $ | (0.17 | ) | $ | (0.06 | ) | $ | (0.44 | ) | $ | (0.04 | ) |
6
FFO, MFFO, AFFO AND PER SHARE INFORMATION
(dollars in thousands, except share and per share amounts)
| | | Q2 2014 | | | Q1 2014 | | | Q4 2013 | | | Q3 2013 | | | Q2 2013 | |
| FUNDS FROM OPERATIONS | | | | | | | | | | | | | | | |
| Net loss | $ | (1,872 | ) | $ | (10,589 | ) | $ | (3,539 | ) | $ | (17,014 | ) | $ | (215 | ) |
| Depreciation and amortization | | 28,345 | | | 19,056 | | | 14,158 | | | 770 | | | 19 | |
| Funds from operations (FFO)1: | | 26,473 | | | 8,467 | | | 10,619 | | | (16,244 | ) | | (196 | ) |
| | | | | | | | | | | | | | | | |
| Acquisition fees and expenses | | 4,087 | | | 14,532 | | | 8,663 | | | 18,159 | | | 112 | |
| Amortization of above-market lease assets and | | | | | | | | | | | | | | | |
| accretion of below-market lease liabilities, net | | 18 | | | 2 | | | (17 | ) | | (5 | ) | | - | |
| Straight-line rent | | (2,498 | ) | | (1,693 | ) | | (1,422 | ) | | (94 | ) | | - | |
| Amortization of mortgage premiums | | (1,827 | ) | | (484 | ) | | - | | | - | | | - | |
| (Gain) Loss on sale of investments | | (109 | ) | | 166 | | | (125 | ) | | - | | | - | |
| | | | | | | | | | | | | | | | |
| Modified funds from operations (MFFO)1: | | 26,144 | | | 20,990 | | | 17,718 | | | 1,816 | | | (84 | ) |
| | | | | | | | | | | | | | | | |
| Amortization of deferred financing costs | | 1,218 | | | 754 | | | 273 | | | 18 | | | - | |
| Non-cash equity compensation expense | | 6 | | | 5 | | | 4 | | | 5 | | | 34 | |
| Distributions on Class B Units | | 109 | | | 43 | | | 18 | | | - | | | - | |
| Adjusted funds from operations (AFFO)1: | $ | 27,477 | | $ | 21,792 | | $ | 18,013 | | $ | 1,839 | | $ | (50 | ) |
| | | | | | | | | | | | | | | | |
| Weighted average shares outstanding - basic: | | 64,018,318 | | | 62,693,554 | | | 62,329,506 | | | 38,295,114 | | | 5,173,574 | |
| | | | | | | | | | | | | | | | |
| Weighted average shares outstanding - diluted: | | 64,287,745 | | | 63,507,775 | | | 62,377,949 | | | 38,299,308 | | | 5,173,574 | |
| | | | | | | | | | | | | | | | |
| Distributions declared2 | $ | 26,324 | | $ | 25,790 | | $ | 25,933 | | $ | 16,037 | | $ | 2,130 | |
| Distributions paid2 | $ | 26,525 | | $ | 25,702 | | $ | 24,458 | | $ | 10,420 | | $ | 399 | |
| | | | | | | | | | | | | | | | |
| | | | | | | | | | | | | | | | |
| | | Q2 2014 | | | Q1 2014 | | | Q4 2013 | | | Q3 2013 | | | Q2 2013 | |
| PER SHARE INFORMATION | | | | | | | | | | | | | | | |
| FFO per diluted share | $ | 0.41 | | $ | 0.13 | | $ | 0.17 | | $ | (0.42 | ) | $ | (0.04 | ) |
| | | | | | | | | | | | | | | | |
| MFFO per diluted share | $ | 0.41 | | $ | 0.33 | | $ | 0.28 | | $ | 0.05 | | $ | (0.02 | ) |
| | | | | | | | | | | | | | | | |
| AFFO per diluted share | $ | 0.43 | | $ | 0.34 | | $ | 0.29 | | $ | 0.05 | | $ | (0.01 | ) |
1See the Definitions section beginning on page 22 for a description of the Company’s non-GAAP measures.
2Excludes distributions on unvested restricted stock.
7
ADJUSTED EBITDA1 AND RATIO ANALYSIS
(dollars in thousands)
| | | Q2 2014 | | | Q1 2014 | | | Q4 2013 | | | Q3 2013 | | | Q2 2013 | |
| ADJUSTED EBITDA | | | | | | | | | | | | | | | |
| Net loss | $ | (1,872 | ) | $ | (10,589 | ) | $ | (3,539 | ) | $ | (17,014 | ) | $ | (215 | ) |
| Acquisition and transaction related expense | | 4,087 | | | 14,532 | | | 8,663 | | | 18,159 | | | 112 | |
| Depreciation and amortization | | 28,345 | | | 19,056 | | | 14,158 | | | 770 | | | 19 | |
| Interest expense | | 7,723 | | | 3,444 | | | 457 | | | 28 | | | - | |
| Interest income | | (158 | ) | | (3 | ) | | (45 | ) | | (62 | ) | | - | |
| Income from investment securities | | (606 | ) | | (955 | ) | | (1,164 | ) | | (1,108 | ) | | - | |
| (Gain) Loss on sale of investment securities | | (109 | ) | | 166 | | | (125 | ) | | - | | | - | |
| Adjusted EBITDA | $ | 37,410 | | $ | 25,651 | | $ | 18,405 | | $ | 773 | | $ | (84 | ) |
| | | | | | | | | | | | | | | | |
| ADJUSTED INTEREST COVERAGE RATIO | | | | | | | | | | | | | | | |
| Interest expense | $ | 7,723 | | $ | 3,444 | | $ | 457 | | $ | 28 | | $ | - | |
| Non-cash interest expense | | 609 | | | (270 | ) | | (273 | ) | | (18 | ) | | - | |
| Total interest | | 8,332 | | | 3,174 | | | 184 | | | 10 | | | - | |
| Adjusted EBITDA | | 37,410 | | | 25,651 | | | 18,405 | | | 773 | | | (84 | ) |
| Adjusted interest coverage ratio | | 4.5 x | | | 8.1 x | | | 100.0 x | | | 77.3 x | | | NM | |
| | | | | | | | | | | | | | | | |
| ADJUSTED FIXED CHARGE COVERAGE RATIO | | | | | | | | | | | | | | | |
| Total interest | $ | 8,332 | | $ | 3,174 | | $ | 184 | | $ | 10 | | $ | - | |
| Secured debt principal amortization | | 311 | | | 76 | | | - | | | - | | | - | |
| Total fixed charges | | 8,643 | | | 3,250 | | | 184 | | | 10 | | | - | |
| Adjusted EBITDA | | 37,410 | | | 25,651 | | | 18,405 | | | 773 | | | (84 | ) |
| Adjusted fixed charge coverage ratio | | 4.3 x | | | 7.9 x | | | 100.0 x | | | 77.3 x | | | NM | |
| | | | | | | | | | | | | | | | |
| NET DEBT TO ADJUSTED EBITDA RATIO | | | | | | | | | | | | | | | |
| Total debt | $ | 893,681 | | $ | 769,075 | | $ | 8,830 | | $ | - | | $ | - | |
| Less: cash and cash equivalents | | (25,009 | ) | | (17,847 | ) | | (101,176 | ) | | (163,056 | ) | | (346,035 | ) |
| Net debt | | 868,672 | | | 751,228 | | | (92,346 | ) | | (163,056 | ) | | (346,035 | ) |
| Adjusted EBITDA annualized | | 149,640 | | | 102,604 | | | 73,620 | | | 3,092 | | | (336 | ) |
| Net debt to Adjusted EBITDA ratio | | 5.8 x | | | 7.3 x | | | NM | | | NM | | | NM | |
| | | | | | | | | | | | | | | | |
| NET CONSOLIDATED DEBT LEVERAGE RATIO | | | | | | | | | | | | | | | |
| Net debt | $ | 868,672 | | $ | 751,228 | | $ | (92,346 | ) | $ | (163,056 | ) | $ | (346,035 | ) |
| Real estate assets, gross | | 2,169,308 | | | 2,001,261 | | | 1,145,807 | | | 896,559 | | | 2,243 | |
| Net consolidated debt leverage ratio | | 40.0% | | | 37.5% | | | NM | | | NM | | | NM | |
| | | | | | | | | | | | | | | | |
| GROSS CONSOLIDATED DEBT LEVERAGE RATIO | | | | | | | | | | | | | | | |
| Total debt | $ | 893,681 | | $ | 769,075 | | $ | 8,830 | | $ | - | | $ | - | |
| Real estate assets, gross | | 2,169,308 | | | 2,001,261 | | | 1,145,807 | | | 896,559 | | | 2,243 | |
| Gross consolidated debt leverage ratio | | 41.2% | | | 38.4% | | | 0.8% | | | 0.0% | | | 0.0% | |
| | | | | | | | | | | | | | | | |
| UNENCUMBERED ASSETS/TOTAL ASSETS | | | | | | | | | | | | | | | |
| Unencumbered real estate assets, gross | $ | 1,308,965 | | $ | 1,214,745 | | $ | 1,126,461 | | $ | 896,559 | | $ | 2,243 | |
| Real estate assets, gross | | 2,169,308 | | | 2,001,261 | | | 1,145,807 | | | 896,559 | | | 2,243 | |
| Unencumbered assets/total assets | | 60.3% | | | 60.7% | | | 98.3% | | | 100.0% | | | 100.0% | |
NM – Not meaningful
1See the Definitions section beginning on page 22 for a description of the Company’s non-GAAP measures.
NET OPERATING INCOME1 BY PROPERTY TYPE
(dollars in thousands)
| | | Q2 2014 | | | Q1 2014 | | | Q4 2013 | | | Q3 2013 | | | Q2 2013 | |
| REVENUES | | | | | | | | | | | | | | | |
| Retail | $ | 17,658 | | $ | 11,767 | | $ | 7,755 | | $ | 1,521 | | $ | 35 | |
| Office | | 14,825 | | | 10,923 | | | 8,853 | | | 165 | | | - | |
| Distribution | | 10,018 | | | 7,582 | | | 5,553 | | | 407 | | | - | |
| Total revenue | $ | 42,501 | | $ | 30,272 | | $ | 22,161 | | $ | 2,093 | | $ | 35 | |
| | | | | | | | | | | | | | | | |
| | | | | | | | | | | | | | | | |
| PROPERTY OPERATING EXPENSES | | | | | | | | | | | | | | | |
| Retail | $ | 470 | | $ | 482 | | $ | 404 | | $ | 142 | | $ | 6 | |
| Office | | 2,763 | | | 2,855 | | | 2,116 | | | - | | | - | |
| Distribution | | 199 | | | 190 | | | 119 | | | 7 | | | - | |
| Total property operating expenses | $ | 3,432 | | $ | 3,527 | | $ | 2,639 | | $ | 149 | | $ | 6 | |
| | | | | | | | | | | | | | | | |
| | | | | | | | | | | | | | | | |
| NET OPERATING INCOME1 | | | | | | | | | | | | | | | |
| Retail | $ | 17,188 | | $ | 11,285 | | $ | 7,351 | | $ | 1,379 | | $ | 29 | |
| Office | | 12,062 | | | 8,068 | | | 6,737 | | | 165 | | | - | |
| Distribution | | 9,819 | | | 7,392 | | | 5,434 | | | 400 | | | - | |
| Total net operating income | $ | 39,069 | | $ | 26,745 | | $ | 19,522 | | $ | 1,944 | | $ | 29 | |
1See the Definitions section beginning on page 22 for a description of the Company’s non-GAAP measures and page 24 for GAAP reconciliation.
9
DEBT SUMMARY
(dollars in thousands)
| | Minimum | Maximum | Weighted Average | Weighted Average | | |
| | Coupon | Coupon | Effective | Years To | Balance |
| | Rate | Rate | Interest Rate | Maturity | | |
| Fixed rate debt | 5.42% | 5.93% | 5.66% | 4.1 | $ | 470,681 |
| Variable rate debt - credit facility | 1M LIBOR+1.60% | 1M LIBOR+2.20% | 1.76% | 3.2 | | 423,000 |
| Total | | | | | $ | 893,681 |
DEBT DETAIL
(dollars in thousands)
| | Property Base | Contractual | Years to | Effective | | Debt | |
| VARIABLE RATE DEBT - CREDIT FACILITY | Purchase Price1 | Maturity Date | Maturity | Interest Rate | Balance | |
| | | | | | | | |
| Credit facility | $ | 1,217,980 | 9/23/2017 | 3.2 | 1.76% | $ | 423,000 | |
| FIXED RATE DEBT | | | | | | | | |
| SAAB Sensis - Syracuse, NY | | 19,346 | 4/1/2025 | 10.8 | 6.01% | | 8,677 | |
| SunTrust Pool 3 | | 61,326 | 7/1/2021 | 7.0 | 5.50% | | 25,000 | |
| C & S Wholesale - 4-Pack | | 145,850 | 4/1/2017 | 2.8 | 5.56% | | 82,313 | |
| SunTrust Pool 1 | | 247,991 | 7/1/2021 | 7.0 | 5.50% | | 99,821 | |
| SunTrust Pool 2 | | 60,889 | 7/1/2021 | 7.0 | 5.50% | | 25,000 | |
| Sanofi - Bridgewater, NJ | | 251,114 | 12/6/2015 | 1.4 | 5.83% | | 190,000 | |
| Stop & Shop - Malden, MA | | 22,653 | 6/1/2021 | 6.9 | 5.63% | | 12,243 | |
| Stop & Shop - Swampscott, MA | | 19,665 | 6/1/2021 | 6.9 | 5.63% | | 10,659 | |
| Stop & Shop - Framingham, MA | | 16,534 | 6/1/2021 | 6.9 | 5.63% | | 8,931 | |
| Stop & Shop - Bristol, RI | | 14,975 | 6/1/2021 | 6.9 | 5.55% | | 8,037 | |
| Total | | | | | | | | |
| $ | 2,078,323 | | 3.7 | 3.81% | $ | 893,681 | |
DEBT MATURITY SCHEDULE
(dollars in thousands)
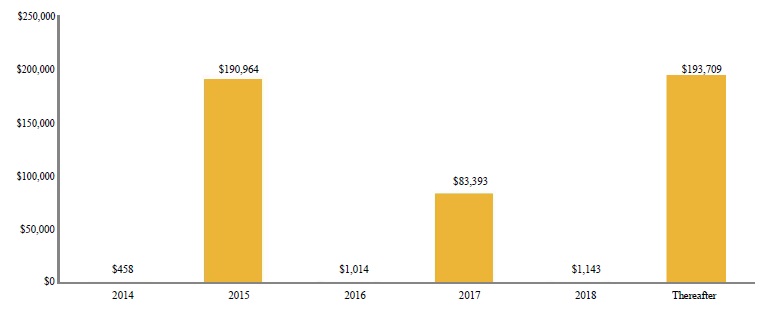
1See the Definitions section beginning on page 22.
TENANT PORTFOLIO COMPOSITION
(dollars in thousands)
| Tenant | # of Properties | Base Purchase Price1 | % | Annualized SLR1 | % | Square Feet | % |
| SunTrust Bank | 213 | $ | 429,600 | 19.8% | $ | 29,140 | 17.9% | 1,148,377 | 8.8% |
| Sanofi US | 1 | | 251,114 | 11.6% | | 18,778 | 11.6% | 736,572 | 5.6% |
| C&S Wholesale Grocer | 5 | | 200,212 | 9.2% | | 16,826 | 10.4% | 3,044,685 | 23.2% |
| AmeriCold | 9 | | 173,939 | 8.0% | | 12,720 | 7.8% | 1,407,166 | 10.7% |
| Merrill Lynch | 3 | | 165,436 | 7.6% | | 12,714 | 7.8% | 553,841 | 4.2% |
| Stop & Shop | 8 | | 145,445 | 6.7% | | 9,855 | 6.1% | 544,112 | 4.2% |
| American Express Travel Rel. Svcs | 2 | | 91,548 | 4.2% | | 7,367 | 4.5% | 785,164 | 6.0% |
| Home Depot | 2 | | 79,055 | 3.7% | | 5,989 | 3.7% | 1,315,200 | 10.0% |
| Walgreens | 18 | | 76,512 | 3.5% | | 5,502 | 3.4% | 253,780 | 1.9% |
| United Health | 1 | | 66,568 | 3.1% | | 5,292 | 3.2% | 400,000 | 3.1% |
| Top 10 Tenants Sub-Total | 262 | $ | 1,679,429 | 77.4% | $ | 124,183 | 76.4% | 10,188,897 | 77.7% |
| | | | | | | | | | |
| Burger King | 41 | $ | 63,138 | 2.9% | $ | 5,163 | 3.2% | 168,192 | 1.3% |
| Lowe's | 5 | | 58,695 | 2.7% | | 4,749 | 2.9% | 671,313 | 5.1% |
| O'Charley's | 20 | | 42,970 | 2.0% | | 3,703 | 2.3% | 135,973 | 1.0% |
| Dollar General | 38 | | 46,438 | 2.1% | | 3,423 | 2.1% | 356,512 | 2.7% |
| New Breed Logistics | 1 | | 24,738 | 1.1% | | 1,913 | 1.2% | 390,486 | 3.0% |
| Citizens Bank | 9 | | 26,158 | 1.2% | | 1,827 | 1.1% | 34,777 | 0.3% |
| Circle K | 19 | | 25,815 | 1.2% | | 1,770 | 1.1% | 54,521 | 0.4% |
| Mattress Firm | 9 | | 18,527 | 0.9% | | 1,592 | 1.0% | 43,561 | 0.3% |
| SAAB Sensis | 1 | | 19,346 | 0.9% | | 1,430 | 0.9% | 90,822 | 0.7% |
| FedEx Ground | 4 | | 17,799 | 0.8% | | 1,290 | 0.8% | 154,036 | 1.2% |
| Family Dollar | 12 | | 11,794 | 0.5% | | 972 | 0.6% | 99,882 | 0.8% |
| L.A. Fitness | 1 | | 12,067 | 0.6% | | 875 | 0.5% | 45,000 | 0.3% |
| CVS | 3 | | 8,939 | 0.4% | | 823 | 0.5% | 34,840 | 0.3% |
| Amazon | 1 | | 9,548 | 0.4% | | 760 | 0.5% | 79,105 | 0.6% |
| Fresenius | 3 | | 8,765 | 0.4% | | 723 | 0.4% | 21,847 | 0.2% |
| Krystal | 6 | | 8,461 | 0.4% | | 708 | 0.4% | 12,730 | 0.1% |
| American Tire Distributors | 1 | | 8,868 | 0.4% | | 681 | 0.4% | 125,060 | 1.0% |
| Academy Sports | 1 | | 8,890 | 0.4% | | 663 | 0.4% | 71,640 | 0.5% |
| Joe's Crab Shack | 2 | | 7,975 | 0.4% | | 662 | 0.4% | 16,012 | 0.1% |
| Tractor Supply | 3 | | 8,514 | 0.4% | | 641 | 0.4% | 61,694 | 0.5% |
| Food Lion | 1 | | 8,910 | 0.4% | | 618 | 0.4% | 44,549 | 0.3% |
| Bi-Lo | 1 | | 7,819 | 0.4% | | 544 | 0.3% | 55,718 | 0.4% |
| Advance Auto | 4 | | 6,078 | 0.3% | | 437 | 0.3% | 30,511 | 0.2% |
| Chili's | 2 | | 5,760 | 0.3% | | 403 | 0.2% | 12,700 | 0.1% |
| National Tire & Battery | 2 | | 3,510 | 0.2% | | 342 | 0.2% | 18,163 | 0.1% |
| AutoZone | 3 | | 4,363 | 0.2% | | 320 | 0.2% | 21,526 | 0.2% |
| Arby's | 2 | | 3,645 | 0.2% | | 281 | 0.2% | 6,494 | 0.0% |
| Talecris Plasma Resources | 1 | | 3,275 | 0.2% | | 270 | 0.2% | 22,262 | 0.2% |
| BSFS | 1 | | 3,047 | 0.1% | | 255 | 0.1% | 8,934 | 0.1% |
| Tire Kingdom | 1 | | 2,063 | 0.1% | | 157 | 0.1% | 6,635 | 0.1% |
| 1st Constitution Bancorp | 1 | | 1,907 | 0.1% | | 131 | 0.1% | 4,500 | 0.0% |
| Aaron's | 1 | | 1,052 | 0.0% | | 86 | 0.1% | 7,964 | 0.1% |
| O'Reilly Auto Parts | 1 | | 1,005 | 0.0% | | 83 | 0.1% | 10,692 | 0.1% |
| Total | 463 | $ | 2,169,308 | 100.0% | $ | 162,478 | 100.0% | 13,107,548 | 100.0% |
1See the Definitions section beginning on page 22.
11
STATE PORTFOLIO COMPOSITION
(dollars in thousands)
| State | # of Properties | Base Purchase Price1 | % | Annualized SLR1 | % | Square Feet | % |
| New Jersey | 7 | $ | 437,733 | 20.2% | $ | 33,003 | 20.3% | 1,372,311 | 10.5% |
| Georgia | 57 | | 245,277 | 11.3% | | 18,192 | 11.2% | 1,794,648 | 13.7% |
| Massachusetts | 8 | | 170,259 | 7.8% | | 13,368 | 8.2% | 1,561,761 | 11.9% |
| Florida | 76 | | 174,850 | 8.1% | | 12,009 | 7.4% | 417,020 | 3.2% |
| North Carolina | 44 | | 146,881 | 6.8% | | 10,945 | 6.7% | 976,396 | 7.4% |
| Alabama | 9 | | 110,077 | 5.1% | | 8,920 | 5.5% | 2,014,125 | 15.4% |
| South Carolina | 14 | | 95,545 | 4.4% | | 7,087 | 4.4% | 900,203 | 6.9% |
| Illinois | 30 | | 84,018 | 3.9% | | 6,251 | 3.8% | 359,408 | 2.7% |
| Wisconsin | 2 | | 67,573 | 3.1% | | 5,375 | 3.3% | 410,692 | 3.1% |
| Maryland | 9 | | 67,312 | 3.1% | | 5,187 | 3.2% | 441,059 | 3.4% |
| Top 10 States Sub-Total | 256 | $ | 1,599,525 | 73.8% | $ | 120,337 | 74.0% | 10,247,623 | 78.2% |
| | | | | | | | | | |
| Ohio | 34 | $ | 52,543 | 2.4% | $ | 4,287 | 2.6% | 139,007 | 1.1% |
| Tennessee | 34 | | 55,648 | 2.6% | | 4,032 | 2.5% | 276,471 | 2.1% |
| Utah | 1 | | 42,238 | 1.9% | | 3,397 | 2.1% | 395,787 | 3.0% |
| Virginia | 25 | | 44,326 | 2.0% | | 3,024 | 1.9% | 186,162 | 1.4% |
| Minnesota | 4 | | 40,215 | 1.9% | | 2,882 | 1.8% | 311,317 | 2.4% |
| Pennsylvania | 15 | | 36,810 | 1.7% | | 2,686 | 1.7% | 70,350 | 0.5% |
| New York | 3 | | 36,447 | 1.7% | | 2,613 | 1.6% | 152,348 | 1.1% |
| Texas | 11 | | 33,184 | 1.5% | | 2,492 | 1.5% | 147,532 | 1.1% |
| Rhode Island | 2 | | 35,645 | 1.6% | | 2,419 | 1.5% | 148,927 | 1.1% |
| Michigan | 13 | | 31,416 | 1.5% | | 2,388 | 1.5% | 140,232 | 1.1% |
| Connecticut | 2 | | 23,924 | 1.1% | | 1,640 | 1.0% | 84,045 | 0.6% |
| Missouri | 7 | | 19,767 | 0.9% | | 1,455 | 0.9% | 139,566 | 1.1% |
| Mississippi | 10 | | 19,368 | 0.9% | | 1,452 | 0.9% | 124,121 | 0.9% |
| Louisiana | 13 | | 17,977 | 0.8% | | 1,379 | 0.8% | 114,185 | 0.9% |
| Kentucky | 4 | | 14,925 | 0.7% | | 1,203 | 0.7% | 113,269 | 0.9% |
| Iowa | 5 | | 14,315 | 0.7% | | 1,012 | 0.6% | 80,955 | 0.6% |
| Arkansas | 6 | | 9,239 | 0.4% | | 662 | 0.4% | 54,620 | 0.4% |
| Indiana | 5 | | 7,434 | 0.3% | | 591 | 0.4% | 35,056 | 0.3% |
| Colorado | 3 | | 6,134 | 0.3% | | 504 | 0.3% | 25,130 | 0.2% |
| Oklahoma | 2 | | 7,252 | 0.3% | | 486 | 0.3% | 26,970 | 0.2% |
| North Dakota | 1 | | 4,071 | 0.2% | | 299 | 0.2% | 24,310 | 0.2% |
| Idaho | 2 | | 3,508 | 0.2% | | 298 | 0.2% | 13,040 | 0.1% |
| Wyoming | 1 | | 4,470 | 0.2% | | 295 | 0.2% | 14,560 | 0.1% |
| South Dakota | 1 | | 3,000 | 0.1% | | 220 | 0.1% | 21,662 | 0.2% |
| District of Columbia | 1 | | 3,171 | 0.1% | | 214 | 0.1% | 2,745 | 0.0% |
| West Virginia | 1 | | 1,634 | 0.1% | | 117 | 0.1% | 9,238 | 0.1% |
| New Mexico | 1 | | 1,122 | 0.1% | | 94 | 0.1% | 8,320 | 0.1% |
| Totals | 463 | $ | 2,169,308 | 100.0% | $ | 162,478 | 100.0% | 13,107,548 | 100.0% |
1See the Definitions section beginning on page 22.
12
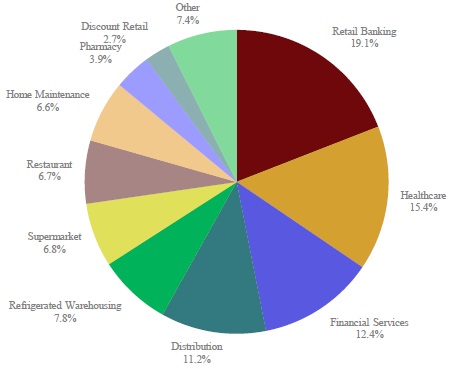
TENANT INDUSTRY PORTFOLIO COMPOSITION
(dollars in thousands)
| Industry | # of Properties | Base Purchase Price1 | % | Annualized SLR1 | % | Square Feet | % |
| Retail Banking | 223 | $ | 457,665 | 21.1% | $ | 31,098 | 19.1% | 1,187,654 | 9.1% |
| Healthcare | 6 | | 329,722 | 15.2% | | 25,063 | 15.4% | 1,180,681 | 9.0% |
| Financial Services | 5 | | 256,984 | 11.8% | | 20,081 | 12.4% | 1,339,005 | 10.2% |
| Distribution | 9 | | 218,011 | 10.1% | | 18,116 | 11.2% | 3,198,721 | 24.4% |
| Refrigerated Warehousing | 9 | | 173,939 | 8.0% | | 12,720 | 7.8% | 1,407,166 | 10.7% |
| Supermarket | 10 | | 162,174 | 7.5% | | 11,017 | 6.8% | 644,379 | 4.9% |
| Restaurant | 73 | | 131,949 | 6.1% | | 10,920 | 6.7% | 352,101 | 2.7% |
| Home Maintenance | 7 | | 137,750 | 6.4% | | 10,738 | 6.6% | 1,986,513 | 15.2% |
| Pharmacy | 21 | | 85,451 | 3.9% | | 6,325 | 3.9% | 288,620 | 2.2% |
| Discount Retail | 50 | | 58,232 | 2.7% | | 4,395 | 2.7% | 456,394 | 3.5% |
| Specialty Retail | 14 | | 36,983 | 1.7% | | 2,982 | 1.8% | 184,859 | 1.4% |
| Freight | 1 | | 24,738 | 1.1% | | 1,913 | 1.2% | 390,486 | 3.0% |
| Gas/Convenience | 19 | | 25,815 | 1.2% | | 1,770 | 1.1% | 54,521 | 0.4% |
| Auto Retail | 9 | | 20,314 | 0.9% | | 1,521 | 0.9% | 187,789 | 1.4% |
| Aerospace | 1 | | 19,346 | 0.9% | | 1,430 | 0.9% | 90,822 | 0.7% |
| Fitness | 1 | | 12,067 | 0.6% | | 875 | 0.5% | 45,000 | 0.3% |
| Consumer Products | 1 | | 9,548 | 0.4% | | 760 | 0.5% | 79,105 | 0.6% |
| Auto Services | 4 | | 8,620 | 0.4% | | 754 | 0.5% | 33,732 | 0.3% |
| Total | 463 | $ | 2,169,308 | 100.0% | $ | 162,478 | 100.0% | 13,107,548 | 100.0% |
TENANT INDUSTRY PORTFOLIO COMPOSITION
As a % of Annualized SLR1 on June 30, 2014
1
1See the Definitions section beginning on page 22.
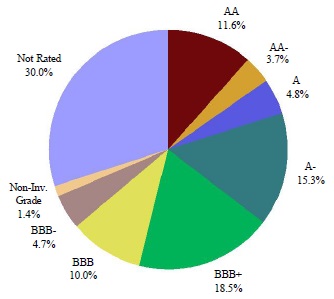
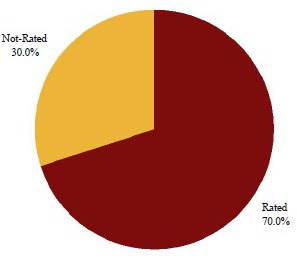
TENANT CREDIT RATING PORTFOLIO COMPOSITION
(dollars in thousands)
| Credit Rating | # of Properties | Base Purchase Price1 | % | Annualized SLR1 | % | Square Feet | % |
| AAA | - | $ | - | 0.0% | $ | - | 0.0% | - | 0.0% |
| AA+ | - | | - | 0.0% | | - | 0.0% | - | 0.0% |
| AA | 1 | | 251,114 | 11.6% | | 18,778 | 11.6% | 736,572 | 5.6% |
| AA- | 2 | | 76,116 | 3.5% | | 6,052 | 3.7% | 479,105 | 3.6% |
| A+ | - | | - | 0.0% | | - | 0.0% | - | 0.0% |
| A | 11 | | 105,213 | 4.9% | | 7,816 | 4.8% | 1,349,977 | 10.3% |
| A- | 10 | | 315,679 | 14.6% | | 24,830 | 15.3% | 2,010,318 | 15.3% |
| BBB+ | 216 | | 438,539 | 20.2% | | 29,963 | 18.5% | 1,183,217 | 9.0% |
| BBB | 31 | | 235,144 | 10.8% | | 16,304 | 10.0% | 885,828 | 6.8% |
| BBB- | 76 | | 104,795 | 4.8% | | 7,623 | 4.7% | 598,675 | 4.6% |
| S&P Inv. Grade Subtotal | 347 | $ | 1,526,600 | 70.4% | $ | 111,366 | 68.6% | 7,243,692 | 55.2% |
| | | | | | | | | | |
| BB+ | 3 | $ | 8,765 | 0.4% | $ | 723 | 0.4% | 21,847 | 0.2% |
| BB | 1 | | 3,275 | 0.2% | | 270 | 0.2% | 22,262 | 0.2% |
| BB- | - | | - | 0.0% | | - | 0.0% | - | 0.0% |
| B+ | - | | - | 0.0% | | - | 0.0% | - | 0.0% |
| B | 2 | | 17,758 | 0.8% | | 1,344 | 0.8% | 196,700 | 1.5% |
| B- | - | | - | 0.0% | | - | 0.0% | - | 0.0% |
| CCC+ | - | | - | 0.0% | | - | 0.0% | - | 0.0% |
| CCC | - | | - | 0.0% | | - | 0.0% | - | 0.0% |
| CCC- | - | | - | 0.0% | | - | 0.0% | - | 0.0% |
| CC | - | | - | 0.0% | | - | 0.0% | - | 0.0% |
| C | - | | - | 0.0% | | - | 0.0% | - | 0.0% |
| D | - | | - | 0.0% | | - | 0.0% | - | 0.0% |
| NOT RATED | 110 | | 612,910 | 28.2% | | 48,775 | 30.0% | 5,623,047 | 42.9% |
| Non-Inv. Grade Sub-Total | 116 | $ | 642,708 | 29.6% | $ | 51,112 | 31.4% | 5,863,856 | 44.8% |
| | | | | | | | | | |
| Totals | 463 | $ | 2,169,308 | 100.0% | $ | 162,478 | 100.0% | 13,107,548 | 100.0% |
| PORTFOLIO TENANT CREDIT RATING | % OF PORTFOLIO RATED | |
| As a % of Annualized SLR1 on June 30, 2014 | As a % of Annualized SLR1 on June 30, 2014 | |
 | 
| |
1See the Definitions section beginning on page 22.
14

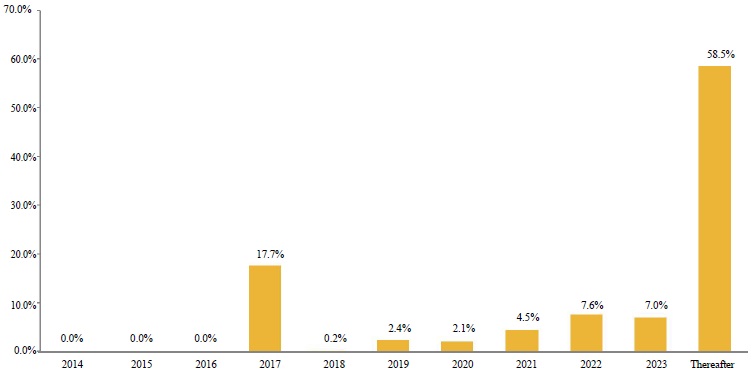
LEASE EXPIRATION SCHEDULE
(dollars in thousands)
| | | EXPIRATION YEAR |
| | | Total | 2014 | | 2015 | | 2016 | | | 2017 | 2018 | 2019 | 2020 | | 2021 | 2022 | | 2023 | Thereafter |
| RETAIL | | | | | | | | | | | | | | | | | | | | | | | | | |
| # of Properties | | 420 | | - | | - | | - | | | 201 | | 4 | | - | | - | | 1 | | 2 | | 28 | | 184 |
| Annualized SLR1 | $ | 74,566 | $ | - | $ | - | $ | - | $ | | 27,655 | $ | 326 | $ | - | $ | - | $ | 81 | $ | 176 | $ | 4,376 | $ | 41,952 |
| | | | | | | | | | | | | | | | | | | | | | | | | | |
| OFFICE | | | | | | | | | | | | | | | | | | | | | | | | | |
| # of Properties | | 21 | | - | | - | | - | | | 8 | | - | | 1 | | 1 | | 1 | | - | | 2 | | 8 |
| Annualized SLR1 | $ | 48,493 | $ | - | $ | - | $ | - | $ | | 1,159 | $ | - | $ | 3,970 | $ | 3,397 | $ | 5,292 | $ | - | $ | 1,030 | $ | 33,645 |
| | | | | | | | | | | | | | | | | | | | | | | | | | |
| DISTRIBUTION | | | | | | | | | | | | | | | | | | | | | | | | | |
| # of Properties | | 22 | | - | | - | | - | | | - | | - | | - | | - | | 1 | | 4 | | 5 | | 12 |
| Annualized SLR1 | $ | 39,419 | $ | - | $ | - | $ | - | $ | - | $ | - | $ | - | $ | - | $ | 1,913 | $ | 12,158 | $ | 5,960 | $ | 19,388 |
| | | | | | | | | | | | | | | | | | | | | | | | | |
| TOTAL | | | | | | | | | | | | | | | | | | | | | | | | | |
| # of Properties | | 463 | | - | | - | | - | | | 209 | | 4 | | 1 | | 1 | | 3 | | 6 | | 35 | | 204 |
| Annualized SLR1 | $ | 162,478 | $ | - | $ | - | $ | - | $ | 28,814 | $ | 326 | $ | 3,970 | $ | 3,397 | $ | 7,286 | $ | 12,334 | $ | 11,366 | $ | 94,985 |
| | | | | | | | | | | | | | | | | | | | | | | | | |
| % of Total | 100.0% | 0.0% | | 0.0% | | 0.0% | | 17.7% | 0.2% | 2.4% | 2.1% | | 4.5% | 7.6% | | 7.0% | 58.5% |
| Cumulative Total | 100.0% | 0.0% | | 0.0% | | 0.0% | | 17.7% | 17.9% | 20.3% | 22.4% | 26.9% | 34.5% | 41.5% | 100.0% |
LEASE EXPIRATION SCHEDULE
As a % of Annualized SLR1 on June 30, 2014
1See the Definitions section beginning on page 22.
15
PORTFOLIO COMPOSITION – RETAIL
(dollars in thousands)
| Portfolio Name | | # of Properties | | State | | Acquisition Date | | Base Purchase
Price1 | | Annualized SLR1 | | Square Feet | | Remaining Lease
Term (Years) |
| Dollar General I | | 2 | | Various | | 4/13 & 5/13 | | $ 2,243 | | $ 172 | | 18,126 | | 13.8 |
| Walgreens I | | 1 | | AR | | 7/13 | | 3,632 | | 242 | | 10,500 | | 23.3 |
| Dollar General II | | 2 | | LA | | 7/13 | | 2,346 | | 174 | | 18,052 | | 13.9 |
| AutoZone I | | 1 | | LA | | 7/13 | | 1,519 | | 111 | | 7,370 | | 13.1 |
| Dollar General III | | 5 | | MI | | 7/13 | | 5,783 | | 429 | | 45,989 | | 13.9 |
| BSFS I | | 1 | | FL | | 7/13 | | 3,047 | | 255 | | 8,934 | | 9.6 |
| Dollar General IV | | 2 | | Various | | 7/13 | | 1,989 | | 155 | | 18,126 | | 11.7 |
| Tractor Supply I | | 1 | | CT | | 8/13 | | 4,074 | | 305 | | 19,097 | | 13.4 |
| Dollar General V | | 1 | | LA | | 8/13 | | 2,295 | | 168 | | 12,480 | | 13.6 |
| Mattress Firm I | | 5 | | Various | | Various | | 10,817 | | 938 | | 23,612 | | 11.2 |
| Family Dollar I | | 1 | | KY | | 8/13 | | 955 | | 81 | | 8,050 | | 7.0 |
| Lowe's I | | 5 | | Various | | 8/13 | | 58,695 | | 4,749 | | 671,313 | | 15.0 |
| O'Reilly Auto Parts I | | 1 | | WI | | 8/13 | | 1,005 | | 83 | | 10,692 | | 16.0 |
| Food Lion I | | 1 | | NC | | 8/13 | | 8,910 | | 618 | | 44,549 | | 15.3 |
| Family Dollar II | | 1 | | AR | | 8/13 | | 969 | | 78 | | 8,028 | | 9.0 |
| Walgreens II | | 1 | | GA | | 8/13 | | 3,200 | | 340 | | 14,490 | | 18.8 |
| Dollar General VI | | 1 | | LA | | 8/13 | | 1,431 | | 107 | | 9,014 | | 11.7 |
| Dollar General VII | | 1 | | VA | | 8/13 | | 1,210 | | 91 | | 9,100 | | 13.8 |
| Family Dollar III | | 1 | | ID | | 8/13 | | 1,004 | | 84 | | 8,000 | | 8.3 |
| Chili's I | | 2 | | TX | | 8/13 | | 5,760 | | 403 | | 12,700 | | 11.4 |
| CVS I | | 1 | | AL | | 8/13 | | 2,640 | | 179 | | 10,055 | | 11.6 |
| Joe's Crab Shack I | | 2 | | Various | | 8/13 | | 7,975 | | 662 | | 16,012 | | 12.8 |
| Dollar General VIII | | 1 | | VA | | 9/13 | | 1,418 | | 104 | | 9,100 | | 14.1 |
| Tire Kingdom I | | 1 | | FL | | 9/13 | | 2,063 | | 157 | | 6,635 | | 10.8 |
| AutoZone II | | 1 | | GA | | 9/13 | | 1,591 | | 115 | | 7,370 | | 8.9 |
| Family Dollar IV | | 1 | | LA | | 9/13 | | 879 | | 74 | | 8,320 | | 9.0 |
| Dollar General IX | | 1 | | AR | | 9/13 | | 875 | | 65 | | 9,014 | | 10.8 |
| Advance Auto I | | 1 | | IN | | 9/13 | | 834 | | 63 | | 10,500 | | 9.0 |
| Walgreens III | | 1 | | MI | | 9/13 | | 4,839 | | 352 | | 15,120 | | 11.8 |
| Walgreens IV | | 1 | | TX | | 9/13 | | 2,796 | | 197 | | 13,500 | | 10.3 |
| CVS II | | 1 | | MA | | 9/13 | | 2,958 | | 387 | | 13,905 | | 22.6 |
| Arby's I | | 1 | | MS | | 9/13 | | 2,320 | | 181 | | 3,000 | | 14.0 |
| Dollar General X | | 1 | | LA | | 9/13 | | 1,305 | | 96 | | 9,100 | | 13.8 |
| L.A. Fitness I | | 1 | | TX | | 9/13 | | 12,067 | | 875 | | 45,000 | | 9.7 |
| SunTrust Bank I | | 31 | | Various | | 9/13 | | 50,695 | | 3,428 | | 138,346 | | 3.5 |
| National Tire & Battery I | | 1 | | TX | | 9/13 | | 1,311 | | 100 | | 10,795 | | 9.4 |
| Circle K I | | 19 | | Various | | 9/13 | | 25,815 | | 1,770 | | 54,521 | | 14.4 |
| Walgreens V | | 1 | | OK | | 9/13 | | 5,750 | | 380 | | 14,490 | | 13.2 |
| Walgreens VI | | 1 | | WY | | 9/13 | | 4,470 | | 295 | | 14,560 | | 14.8 |
| Walgreens VII | | 10 | | Various | | 9/13 | | 40,517 | | 2,861 | | 142,140 | | 15.3 |
| O'Charley's I | | 20 | | Various | | 9/13 | | 42,970 | | 3,703 | | 135,973 | | 17.4 |
| Krystal I | | 6 | | Various | | 9/13 | | 8,461 | | 708 | | 12,730 | | 15.2 |
| 1st Constitution Bancorp I | | 1 | | NJ | | 9/13 | | 1,907 | | 131 | | 4,500 | | 9.6 |
| Tractor Supply II | | 1 | | MI | | 10/13 | | 1,627 | | 123 | | 23,500 | | 9.3 |
| National Tire & Battery II | | 1 | | IL | | 10/13 | | 2,199 | | 242 | | 7,368 | | 17.9 |
| Tractor Supply III | | 1 | | KY | | 10/13 | | 2,813 | | 213 | | 19,097 | | 13.8 |
| Mattress Firm II | | 1 | | TN | | 10/13 | | 1,058 | | 90 | | 4,304 | | 9.2 |
| Dollar General XI | | 1 | | MS | | 10/13 | | 1,102 | | 82 | | 9,026 | | 12.8 |
| Academy Sports I | | 1 | | MO | | 10/13 | | 8,890 | | 663 | | 71,640 | | 14.0 |
| Dollar General XII | | 2 | | Various | | 11/13 & 1/14 | | 2,276 | | 165 | | 18,126 | | 14.5 |
| Dollar General XIII | | 1 | | TX | | 11/13 | | 1,065 | | 80 | | 9,169 | | 11.8 |
1See the Definitions section beginning on page 22.
16
| PORTFOLIO COMPOSITION – RETAIL (cont.) | | | | | | | |
| (dollars in thousands) | | | | | | | | | | |
| Portfolio Name | # of Properties | State | Acquisition Date | Base Purchase | Annualized SLR1 | Square Feet | Remaining Lease | |
| | Price1 | Term (Years) | |
| Advance Auto II | 2 | Various | 11/13 | $ | 3,260 | $ | 232 | 13,887 | 8.9 | |
| Burger King I | 41 | Various | 11/13 | | 63,138 | | 5,163 | 168,192 | 19.4 | |
| Dollar General XIV | 3 | AR | 11/13 | | 3,764 | | 278 | 27,078 | 13.9 | |
| Dollar General XV | 1 | NY | 11/13 | | 1,337 | | 98 | 9,026 | 14.4 | |
| Dollar General XVI | 1 | TN | 11/13 | | 994 | | 73 | 9,014 | 11.4 | |
| Family Dollar V | 1 | MO | 11/13 | | 877 | | 73 | 8,400 | 8.8 | |
| Walgreens VIII | 1 | IA | 12/13 | | 5,150 | | 360 | 14,490 | 9.5 | |
| CVS III | 1 | MI | 12/13 | | 3,341 | | 257 | 10,880 | 9.6 | |
| Mattress Firm III | 1 | GA | 12/13 | | 1,887 | | 160 | 5,057 | 9.0 | |
| Arby's II | 1 | MN | 12/13 | | 1,325 | | 100 | 3,494 | 13.8 | |
| Family Dollar VI | 2 | CO | 12/13 | | 1,903 | | 153 | 17,484 | 9.6 | |
| Citizens Bank I | 9 | PA | 12/13 | | 26,158 | | 1,827 | 34,777 | 9.5 | |
| Walgreens IX | 1 | MI | 1/14 | | 6,158 | | 475 | 14,490 | 8.6 | |
| SunTrust Bank II | 29 | Various | 1/14 | | 59,920 | | 4,069 | 135,839 | 3.5 | |
| Mattress Firm IV | 1 | ID | 1/14 | | 2,504 | | 214 | 5,040 | 10.2 | |
| Mattress Firm V | 1 | AL | 1/14 | | 2,261 | | 190 | 5,548 | 9.3 | |
| Family Dollar VII | 1 | LA | 2/14 | | 794 | | 63 | 8,320 | 10.0 | |
| Aaron's I | 1 | PA | 2/14 | | 1,052 | | 86 | 7,964 | 9.2 | |
| AutoZone III | 1 | MI | 2/14 | | 1,253 | | 94 | 6,786 | 8.8 | |
| Advance Auto III | 1 | MA | 2/14 | | 1,984 | | 142 | 6,124 | 10.2 | |
| Family Dollar VIII | 3 | Various | 3/14 | | 3,179 | | 265 | 24,960 | 9.1 | |
| Dollar General XVII | 3 | LA | 3/14 & 5/14 | | 3,400 | | 252 | 27,078 | 13.8 | |
| SunTrust Bank III | 117 | Various | 3/14 | | 244,219 | | 16,570 | 636,858 | 3.5 | |
| SunTrust Bank IV | 28 | Various | 3/14 | | 57,674 | | 3,914 | 164,211 | 3.5 | |
| Dollar General XVIII | 1 | LA | 3/14 | | 1,139 | | 84 | 9,026 | 13.8 | |
| Family Dollar IX | 1 | PA | 4/14 | | 1,234 | | 101 | 8,320 | 9.8 | |
| Stop & Shop I | 8 | Various | 5/14 | | 145,445 | | 9,855 | 544,112 | 12.4 | |
| Bi-Lo I | 1 | SC | 5/14 | | 7,819 | | 544 | 55,718 | 11.5 | |
| Dollar General XIX | 1 | OK | 5/14 | | 1,502 | | 107 | 12,480 | 14.2 | |
| Dollar General XX | 5 | MS | 5/14 | | 5,988 | | 430 | 48,584 | 12.8 | |
| Dollar General XXI | 1 | WV | 5/14 | | 1,634 | | 117 | 9,238 | 14.2 | |
| Dollar General XXII | 1 | IN | 5/14 | | 1,342 | | 96 | 10,566 | 12.8 | |
| Retail Total | 420 | | | $ | 1,032,005 | $ | 74,566 | 3,908,179 | 10.1 | |
1See the Definitions section beginning on page 22.
17
| PORTFOLIO COMPOSITION – OFFICE | | | | | | | |
| (dollars in thousands) | | | | | | | | | | | | | | |
| Portfolio Name | # of Properties | State | Acquisition Date | Base Purchase | Annualized SLR1 | Square Feet | Remaining Lease | |
| | Price1 | Term (Years) | |
| Fresenius I | 1 | AL | 9/13 | | | | | $ | 2,223 | $ | 182 | 5,800 | 11.0 | |
| American Express Travel Rel. Svcs | 2 | Various | 9/13 | | | | | | 91,548 | | 7,367 | 785,164 | 5.6 | |
| SunTrust Bank I | 1 | GA | 9/13 | | | | | | 8,700 | | 589 | 44,054 | 3.5 | |
| Merrill Lynch I | 3 | NJ | 9/13 | | | | | | 165,436 | | 12,714 | 553,841 | 10.4 | |
| United Health I | 1 | WI | 10/13 | | | | | | 66,568 | | 5,292 | 400,000 | 7.0 | |
| Talecris Plasma Resources I | 1 | TX | 10/13 | | | | | | 3,275 | | 270 | 22,262 | 8.8 | |
| Amazon I | 1 | KY | 10/13 | | | | | | 9,548 | | 760 | 79,105 | 9.1 | |
| Fresenius II | 2 | Various | 10/13 | | | | | | 6,542 | | 541 | 16,047 | 13.1 | |
| SAAB Sensis I | 1 | NY | 12/13 | | | | | | 19,346 | | 1,430 | 90,822 | 10.8 | |
| SunTrust Bank II | 1 | FL | 1/14 | | | | | | 1,406 | | 96 | 12,394 | 3.5 | |
| SunTrust Bank III | 4 | Various | 3/14 | | | | | | 3,772 | | 256 | 9,677 | 3.5 | |
| SunTrust Bank IV | 2 | Various | 3/14 | | | | | | 3,214 | | 218 | 6,998 | 3.5 | |
| Sanofi US I | 1 | NJ | 3/14 | | | | | | 251,114 | | 18,778 | 736,572 | 12.0 | |
| Office Total | 21 | | | | | | | $ | 632,692 | $ | 48,493 | 2,762,736 | 9.8 | |
| | | | | | | | | | | | | | | |
| | | | | | | | | | | | | | | |
| PORTFOLIO COMPOSITION – DISTRIBUTION | | | | | | | |
| (dollars in thousands) | | | | | | | | | | | | | | |
| Portfolio Name | # of Properties | State | Acquisition Date | Base Purchase | Annualized SLR1 | Square Feet | Remaining Lease | |
| | Price1 | Term (Years) | |
| AmeriCold I | 9 | Various | 9/13 | | | | | $ | 173,939 | $ | 12,720 | 1,407,166 | 13.3 | |
| Home Depot I | 2 | Various | 9/13 | | | | | | 79,055 | | 5,989 | 1,315,200 | 12.6 | |
| New Breed Logistics I | 1 | SC | 9/13 | | | | | | 24,738 | | 1,913 | 390,486 | 7.4 | |
| FedEx Ground I | 1 | SD | 9/13 | | | | | | 2,999 | | 220 | 21,662 | 8.9 | |
| American Tire Distributors I | 1 | TN | 9/13 | | | | | | 8,868 | | 681 | 125,060 | 9.6 | |
| FedEx Ground II | 1 | MS | 11/13 | | | | | | 4,844 | | 344 | 48,897 | 9.1 | |
| FedEx Ground III | 1 | ND | 11/13 | | | | | | 4,071 | | 299 | 24,310 | 9.2 | |
| FedEx Ground IV | 1 | IA | 1/14 | | | | | | 5,885 | | 427 | 59,167 | 9.0 | |
| C&S Wholesale Grocer I | 5 | Various | 2/14 | | | | | | 200,212 | | 16,826 | 3,044,685 | 8.3 | |
| Distribution Total | 22 | | | | | | | $ 504,611 | $ | 39,419 | 6,436,633 | 10.5 | |
| | | | | | | | | | | | | | |
| | | | | | | | | | | | | | |
| TOTAL PORTFOLIO COMPOSITION | | | | | | | | | | | | |
| (dollars in thousands) | | | | | | | | | | | | | | |
| Portfolio Name | # of Properties | State | Acquisition Date | Base Purchase | Annualized SLR1 | Square Feet | Remaining Lease | |
| | Price1 | Term (Years) | |
| Retail Total | 420 | Various | Various | $ | 1,032,005 | $ | 74,566 | 3,908,179 | 10.1 | |
| Office Total | 21 | Various | Various | $ | 632,692 | $ | 48,493 | 2,762,736 | 9.8 | |
| Distribution Total | 22 | Various | Various | $ | 504,611 | $ | 39,419 | 6,436,633 | 10.5 | |
| | | | | | | | | | | | | | | |
| Portfolio Total | 463 | | | | | | | $ | 2,169,308 | $ | 162,478 | 13,107,548 | 10.1 | |
1See the Definitions section beginning on page 22.
18
TOP TENANT DESCRIPTIONS
SUNTRUST BANK
Acquisition Dates:September-13 through March-14 | Square Feet:1,148,377 | Percent of Total Revenue:17.9% | Tenant Credit Rating1:S&P BBB+
SunTrust Bank, a Georgia banking corporation, is the largest subsidiary of SunTrust Banks, Inc. (NYSE: STI), an American bank holding company that was established in 1891 in Atlanta, where its headquarters remain. SunTrust Bank is a leading provider of financial services in the Southeastern United States, including Alabama, Arkansas, Florida, Georgia, Maryland, Mississippi, North Carolina, South Carolina, Tennessee, Virginia, West Virginia, and Washington, D.C.
SANOFI SA
Acquisition Date:March-14 | Square Feet:736,572 | Percent of Total Revenue:11.6% | Tenant Credit Rating1:S&P AA
Sanofi S.A. is a leading pharmaceutical company headquartered in Paris, France. Sanofi engages in the research and development, manufacturing and marketing of pharmaceutical products for sale principally in the prescription market, but the firm also develops over-the-counter medication. The company covers seven major therapeutic areas: cardiovascular, central nervous system, diabetes, internal medicine, oncology, thrombosis and vaccines.
C&S WHOLESALE GROCERS, INC.
Acquisition Date:February-14 | Square Feet:3,044,685 | Percent of Total Revenue:10.4% | Tenant Credit Rating1:Not Rated
C&S Wholesale Grocers, Inc. is the lead supply chain company in the food industry and the largest wholesale grocery supply company in the U.S. They operate regional distribution centers throughout the United States as well as offer independent retailers a full range of store management services to help them run their businesses efficiently and profitably.
AMERICOLD LOGISTICS, LLC
Acquisition Date:September-13 | Square Feet:1,407,166 | Percent of Total Revenue:7.8% | Tenant Credit Rating1:Not Rated
Americold Logistics, LLC provides temperature-controlled warehousing, transportation, and logistics solutions to the food industry in the United States and internationally. It manages customer dedicated distribution temperature controlled warehousing facilities. The company offers transportation management services, including expedited shipment management, operations management, claims management, direct-store delivery, national transportation, consolidation programs, carrier control, brokerage capacity management, real-time information control, shuttle, and multi-vendor consolidation. Americold Logistics was founded in 1911 and is headquartered in Atlanta, Georgia. It owns and operates temperature-controlled warehouses in the United States, Australia, New Zealand, China, Argentina, Belgium, and Canada.
1See the Definitions section beginning on page 22.
19
TOP TENANT DESCRIPTIONS
MERRILL LYNCH, PIERCE, FENNER & SMITH INCORPORATED
Acquisition Date:September-13 | Square Feet:553,841 | Percent of Total Revenue:7.8% | Tenant Credit Rating1:S&P A-
Merrill Lynch, Pierce, Fenner & Smith Incorporated (“Merrill Lynch”), together with its subsidiaries, acts as a broker for corporate, institutional, government and other clients and as a dealer in the purchase and sale of corporate debt and equity securities, U.S. Government securities and U.S. Government agency obligations. Merrill Lynch also acts as a broker-dealer in the purchase and sale of mutual funds, money market instruments, high yield bonds, municipal securities, financial futures contracts and options and other financial instruments, including collateralized debt obligations and collateralized mortgage obligations. As an investment banking entity, it provides corporate, institutional, and government clients with a wide variety of financial services, including underwriting the sale of securities to the public, structured and derivative financing, private placements, mortgage and lease financing and financial advisory services, including advice on mergers and acquisitions. Merrill Lynch Pierce Fenner and Smith, Inc. is a private company and a wholly-owned subsidiary of Bank of America Corp (NYSE: BAC).
STOP & SHOP SUPERMARKET COMPANY
Acquisition Date:May-14 | Square Feet:544,112 | Percent of Total Revenue:6.1% | Tenant Credit Rating1:S&P BBB
The Stop & Shop Supermarket Company is a chain of supermarkets located in the northeastern United States. From its beginnings in 1892 as a small grocery store, it has grown to become one of the largest supermarket operators in New England with over 400 stores chain-wide. Stop & Shop has been a wholly owned subsidiary of the Dutch supermarket operator Ahold since 1995 and has been part of the Stop & Shop/Giant-Landover division since a 2004 merger with sister chain Giant.
AMERICAN EXPRESS TRAVEL RELATED SERVICES CO., INC.
Acquisition Date:September-13 | Square Feet:785,164 | Percent of Total Revenue:4.5% | Tenant Credit Rating1:S&P A-
American Express Travel Related Services Co., Inc., a travel agency, provides financial and travel related services for consumers and companies. The company offers various charge and credit cards, travelers’ checks, and other stored value products. It also offers travel and related consulting services to individuals and corporations worldwide. The company was founded in 1982 and is based in New York City, New York. American Express Travel Related Services Co., Inc. operates as a subsidiary of American Express Company (NYSE: AXP).
THE HOME DEPOT, INC.
Acquisition Date:September-13 | Square Feet:1,315,200 | Percent of Total Revenue:3.7% | Tenant Credit Rating1:S&P A
The Home Depot, Inc. (NYSE: HD) is a retailer of home improvement and construction products and services headquartered in Atlanta, GA. It operates many big-box format stores across the United States (including all 50 U.S. states, the District of Columbia, Puerto Rico, the Virgin Islands and Guam), all ten provinces of Canada, as well as Mexico and China.
1See the Definitions section beginning on page 22.
20
TOP TENANT DESCRIPTIONS
WALGREEN CO.
Acquisition Date:July-13 through January-14 | Square Feet:253,780 | Percent of Total Revenue:3.4% | Tenant Credit Rating1:S&P BBB
Walgreen Co. (NYSE: WAG), incorporated on February 15, 1909, together with its subsidiaries, operates the largest drugstore chain in the United States. The company provides its customers with access to consumer goods and services, pharmacy, and health and wellness services in communities across America. The company offers its products and services through drugstores, as well as through mails, by telephone and online. The company sells prescription and non-prescription drugs, as well as general merchandise, including household items, convenience and fresh foods, personal care, beauty care, photofinishing and candy.
UNITED HEALTHCARE SERVICES, INC.
Acquisition Date:October-13 | Square Feet:400,000 | Percent of Total Revenue:3.2% | Tenant Credit Rating1:S&P AA-
United HealthCare Services, Inc. provides health insurance plans for employers, individuals and families in the United States. The company offers employers insurance plans that include employer group health plans; employer ancillary and specialty benefits plans, such as dental, vision, life, disability, critical illness, and accident insurance; and pharmacy and specialty coverage. It also provides specialty products, such as vision and dental insurance, and international coverage, behavioral health, and Medicare and Medicaid coverage options. The company’s network includes physicians and health care professionals, dentists, and hospitals. It sells its products through brokers and consultants. The company was founded in 1977 and is based in Edina, Minnesota. United HealthCare Services, Inc. operates as the largest subsidiary of UnitedHealth Group Inc (NYSE: UNH).
1See the Definitions section beginning on page 22.
DEFINITIONS
This section contains an explanation of certain non-GAAP financial measures we provide in other sections of this document, as well as the reasons why management believes these measures provide useful information to investors about the Company’s financial condition or results of operations. Additional detail can be found in the Company’s most recent annual report on Form 10-K as well as other documents filed with or furnished to the SEC from time to time.
FFO
Pursuant to the revised definition of funds from operations adopted by the Board of Governors of the National Association of Real Estate Investment Trusts (“NAREIT”), we calculate funds from operations (FFO), by adjusting net income (loss) computed in accordance with GAAP for gains (or losses) from sales of properties, impairment losses on depreciable real estate of consolidated real estate, impairment losses on investments in unconsolidated joint ventures driven by a measurable decrease in the fair value of depreciable real estate held by the unconsolidated joint ventures, real estate related depreciation and amortization, and after adjustment for unconsolidated partnerships and joint ventures. FFO is a non-GAAP financial measure. The use of FFO, combined with the required primary GAAP presentations, has been fundamentally beneficial in improving the understanding of operating results of REITs among the investing public and making comparisons of REIT operating results more meaningful. Management generally considers FFO to be a useful measure for reviewing our comparative operating and financial performance because, by excluding gains and losses related to asset sales (land and property), impairment losses and real estate asset depreciation and amortization (which can vary among owners of identical assets in similar condition based on historical cost accounting and useful life estimates), FFO can help one compare the operating performance of a company’s real estate between periods or as compared to different companies. Our computation of FFO may not be comparable to FFO reported by other REITs or real estate companies that do not define the term in accordance with the current NAREIT definition or that interpret the current NAREIT definition differently. FFO should not be considered as an alternative to net income (determined in accordance with GAAP) as an indication of our performance. FFO does not represent cash generated from operating activities determined in accordance with GAAP, and is not a measure of liquidity or an indicator of our ability to make cash distributions. We believe that to further understand our performance FFO should be compared with our reported net income and considered in addition to cash flows determined in accordance with GAAP, as presented in our consolidated financial statements.
MFFO
MFFO is FFO excluding certain income or expense items that we consider more reflective of investing activities, other non-cash income and expense items and the income and expense effects of other activities that are not a fundamental attribute of our business plan. These items include acquisition fees and expenses; amounts relating to deferred rent receivables and amortization of above- and below-market lease assets and liabilities (which are adjusted in order to reflect such payments from a GAAP accrual basis to a cash basis of disclosing the rent and lease payments); accretion of discounts and amortization of premiums on debt investments; mark-to-market adjustments included in net income; gains or losses included in net income from the extinguishment or sale of debt, hedges, foreign exchange, derivatives or securities holdings where trading of such holdings is not a fundamental attribute of the business plan, unrealized gains or losses resulting from consolidation from, or deconsolidation to, equity accounting, and after adjustments for consolidated and unconsolidated partnerships and joint ventures, with such adjustments calculated to reflect MFFO on the same basis. MFFO provides investors a view of the performance of the Company’s portfolio over time. Although our MFFO may not be comparable to that of other REITs and real estate companies, we believe that MFFO can provide, on a going forward basis, an indication of the sustainability (that is, the capacity to continue to be maintained) of our operating performance after the period in which we are acquiring our properties and once our portfolio is stabilized. MFFO should not be considered as an alternative to net income (determined in accordance with GAAP) as an indication of our performance. MFFO does not represent cash generated from operating activities determined in accordance with GAAP, and is not a measure of liquidity or an indicator of our ability to make cash distributions. We believe that to further understand our performance MFFO should be compared with our reported net income and considered in addition to cash flows determined in accordance with GAAP, as presented in our consolidated financial statements.
22
DEFINITIONS
AFFO
In addition to FFO and MFFO, the Company uses Adjusted Funds From Operations (AFFO). AFFO is FFO, excluding certain income or expense items that we consider more reflective of investing activities, other non-cash income and expense items and the income and expense effects of other activities that are not a fundamental attribute of our business plan. These items include unrealized gains and losses, which may not ultimately be realized, such as gains or losses on derivative instruments, gains or losses on contingent valuation rights, gains or losses on investments and early extinguishment of debt. In addition, by excluding non-cash income and expense items such as amortization of above- and below-market leases, amortization of deferred financing costs, straight-line rent and non-cash equity compensation from AFFO, we believe we provide useful information regarding income and expense items which have no cash impact and do not provide liquidity to the company or require capital resources of the company. We exclude distributions related to Class B units and certain interest expenses related to securities that are convertible to common stock as the shares are assumed to have converted to common stock in our calculation of weighted average common shares-fully diluted. Although our AFFO may not be comparable to that of other REITs and real estate companies, we believe it provides a meaningful indicator of our ability to fund cash needs and to make cash distributions to stockholders. In addition, we believe that to further understand our liquidity, AFFO should be compared with our cash flows determined in accordance with GAAP, as presented in our consolidated financial statements. AFFO does not represent cash generated from operating activities determined in accordance with GAAP, and AFFO should not be considered as an alternative to net income (determined in accordance with GAAP) as an indication of our performance, as an alternative to net cash flows from operating activities (determined in accordance with GAAP), or as a measure of our liquidity.
ADJUSTED EBITDA
EBITDA is defined as net income before interest, taxes, depreciation and amortization. We believe EBITDA is an appropriate measure of our ability to incur and service debt. EBITDA should not be considered as an alternative to cash flows from operating activities, as a measure of our liquidity, as an alternative to net income or as an indicator of the Company’s financial performance. Other REITs may calculate EBITDA differently and our calculation should not be compared to that of other REITs. EBITDA is adjusted to include acquisition fees and expenses.
ANNUALIZED SLR
Annualized straight-line rental revenue (“Annualized SLR”) is the sum of the contractual rent over the term of the lease, including escalations and free rent, divided by the number of months in the lease term and annualized. Annualized SLR excludes contingent rental payments, as applicable, that may be collected from certain tenants based on provisions related to sales thresholds and increases in annual rent based on exceeding certain economic indexes among other items.
DEFINITIONS
CREDIT RATING
S&P credit rating may reflect the credit rating of the parent company or a guarantor.
BASE PURCHASE PRICE
Contract purchase price of property acquired, excluding acquisition related costs and mortgage premiums resulting from debt assumed in connection with our property acquisitions.
NET OPERATING INCOME
Net operating income (“NOI”) is a non-GAAP financial measure equal to net income, the most directly comparable GAAP financial measure, less discontinued operations, plus corporate general and administrative expense, acquisition and transaction costs, depreciation and amortization, interest expense, interest and other income, and gain (loss) from investment securities. We use NOI internally as a performance measure and believe NOI provides useful information to investors regarding our financial condition and results of operations because it reflects only those income and expense items that are incurred at the property level. Therefore, we believe NOI is a useful measure for evaluating the operating performance of our real estate assets and to make decisions about resource allocations. Further, we believe NOI is useful to investors as a performance measure because, when compared across periods, NOI reflects the impact on operations from trends in occupancy rates, rental rates, operating costs and acquisition activity on an unleveraged basis, providing perspective not immediately apparent from net income. NOI excludes certain components from net income in order to provide results that are more closely related to a property’s results of operations. For example, interest expense is not necessarily linked to the operating performance of a real estate asset and is often incurred at the corporate level as opposed to the property level. In addition, depreciation and amortization, because of historical cost accounting and useful life estimates, may distort operating performance at the property level. NOI presented by us may not be comparable to NOI reported by other REITs that define NOI differently. We believe that in order to facilitate a clear understanding of our operating results, NOI should be examined in conjunction with net income as presented in our consolidated financial statements. NOI should not be considered as an alternative to net income, as an indication of our performance, or to cash flows as a measure of our liquidity or ability to make distributions.
NOI GAAP RECONCILIATION
(dollars in thousands)
| | | Q2 2014 | | | Q1 2014 | | | Q4 2013 | | | Q3 2013 | | | Q2 2013 | |
| RECONCILIATION OF NOI | | | | | | | | | | | | | | | |
| Net loss | $ | (1,872 | ) | $ | (10,589 | ) | $ | (3,539 | ) | $ | (17,014 | ) | $ | (215 | ) |
| Interest expense | | 7,723 | | | 3,444 | | | 457 | | | 28 | | | - | |
| Interest income | | (158 | ) | | (3 | ) | | (45 | ) | | (62 | ) | | - | |
| Income from investment securities | | (606 | ) | | (955 | ) | | (1,164 | ) | | (1,108 | ) | | - | |
| (Gain) Loss on sale of investment securities | | (109 | ) | | 166 | | | (125 | ) | | - | | | - | |
| Operating income (loss) | | 4,978 | | | (7,937 | ) | | (4,416 | ) | | (18,156 | ) | | (215 | ) |
| Acquisition and transaction related expense | | 4,087 | | | 14,532 | | | 8,663 | | | 18,159 | | | 112 | |
| General and administrative expense | | 1,659 | | | 1,094 | | | 1,117 | | | 1,171 | | | 113 | |
| Depreciation and amortization | | 28,345 | | | 19,056 | | | 14,158 | | | 770 | | | 19 | |
| NOI | $ | 39,069 | | $ | 26,745 | | $ | 19,522 | | $ | 1,944 | | $ | 29 | |
24