Exhibit 99.1

4 th Quarter 2016 Webinar Series

2 A Public Non - Traded Real Estate Investment Trust* Fourth Quarter 2016 Investor Presentation Platform Advisor To Investment Programs
3 Certain statements made in this letter are “forward - looking statements” (as defined in Section 21E of the Exchange Act), which reflect the expectations of the Company regarding future events. The forward - looking statements involve a number of risks, uncertainties and other factors that could cause actual results to differ materially from those contained in the forward - looking statements. Such forward - looking statements include, but are not limited to, market and other expectations, objectives, intentions, as well as any expectations or projections with respect to the combined company, including regarding future dividends and market valuations, and other statements that are not historical facts. The following additional factors, among others, could cause actual results to differ from those set forth in the forward - looking statements: the anticipated benefits from the Merger with RCA may not be realized or may take longer to realize than expected; unexpected costs or unexpected liabilities that may arise from the merger; the inability to retain key personnel; continuation or deterioration of current market conditions; future regulatory or legislative actions that could adversely affect the company; and the business plans of the tenants of the respective parties. Additional factors that may affect future results are contained in the Company’s filings with the SEC, which are available at the SEC’s website at www.sec.gov. The Company disclaims any obligation to update and revise statements contained in these materials based on new information or otherwise. American Finance Trust, Inc. FORWARD - LOOKING STATEMENTS 3
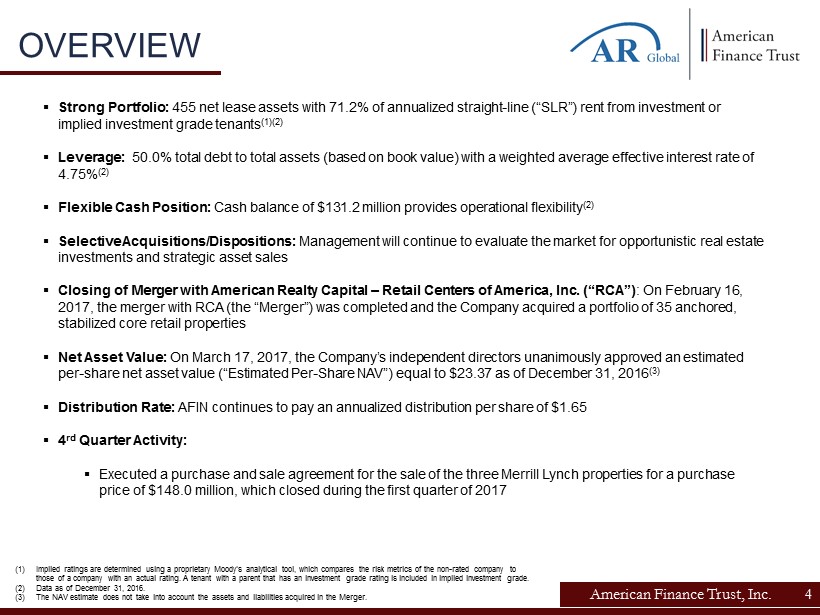
American Finance Trust, Inc. OVERVIEW ▪ Strong Portfolio: 455 net lease assets with 71.2% of annualized straight - line (“SLR”) rent from investment or implied investment grade tenants (1)(2) ▪ Leverage: 50.0% total debt to total assets (based on book value) with a weighted average effective interest rate of 4.75% (2) ▪ Flexible Cash Position: Cash balance of $131.2 million provides operational flexibility (2) ▪ Selective Acquisitions/Dispositions: Management will continue to evaluate the market for opportunistic real estate investments and strategic asset sales ▪ Closing of Merger with American Realty Capital – Retail Centers of America, Inc. (“RCA”) : On February 16, 2017, the merger with RCA (the “Merger”) was completed and the Company acquired a portfolio of 35 anchored, stabilized core retail properties ▪ Net Asset Value: On March 17, 2017, the Company’s independent directors unanimously approved an estimated per - share net asset value (“Estimated Per - Share NAV”) equal to $23.37 as of December 31, 2016 (3) ▪ Distribution Rate: AFIN continues to pay an annualized distribution per share of $1.65 ▪ 4 rd Quarter Activity: ▪ Executed a purchase and sale agreement for the sale of the three Merrill Lynch properties for a purchase price of $148.0 million, which closed during the first quarter of 2017 (1) Implied ratings are determined using a proprietary Moody’s analytical tool, which compares the risk metrics of the non - rated com pany to those of a company with an actual rating. A tenant with a parent that has an investment grade rating is included in implied i nve stment grade. (2) Data as of December 31, 2016. (3) The NAV estimate does not take into account the assets and liabilities acquired in the Merger. 4

5 American Finance Trust, Inc. PORTFOLIO UPDATE
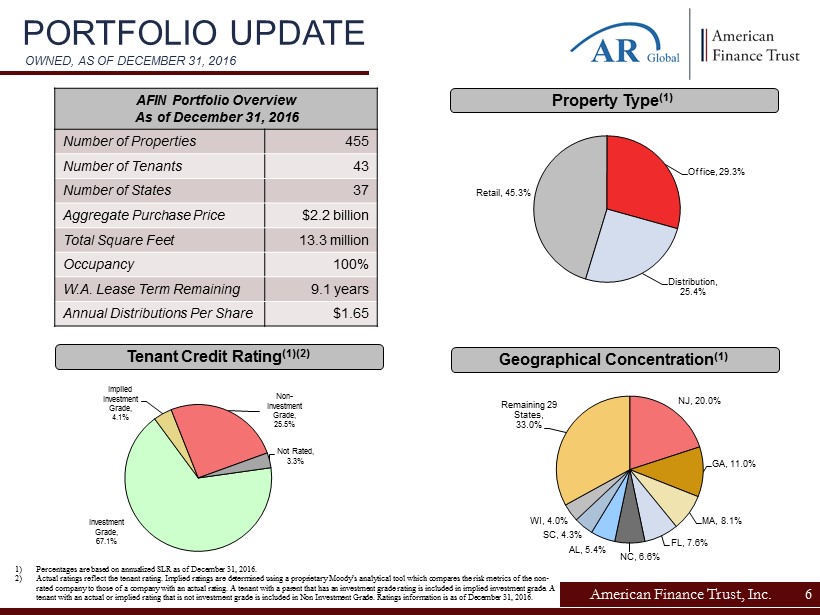
American Finance Trust, Inc. PORTFOLIO UPDATE OWNED, AS OF DECEMBER 31, 2016 Property Type (1) Tenant Credit Rating (1)(2) Geographical Concentration (1) 1) Percentages are based on annualized SLR as of December 31, 2016. 2) Actual ratings reflect the tenant rating. Implied ratings are determined using a proprietary Moody’s analytical tool which co mpa res the risk metrics of the non - rated company to those of a company with an actual rating. A tenant with a parent that has an investment grade rating is incl ude d in implied investment grade. A tenant with an actual or implied rating that is not investment grade is included in Non Investment Grade. Ratings information is as of December 31, 2016. 6 Retail , 45.3% Office , 29.3% Distribution , 25.4% Investment Grade , 67.1% Implied Investment Grade , 4.1% Non - Investment Grade , 25.5% Not Rated , 3.3% NJ , 20.0% GA , 11.0% MA , 8.1% FL , 7.6% NC , 6.6% AL , 5.4% SC , 4.3% WI , 4.0% Remaining 29 States, 33.0% AFIN Portfolio Overview As of December 31, 2016 Number of Properties 455 Number of Tenants 43 Number of States 37 Aggregate Purchase Price $2.2 billion Total Square Feet 13.3 million Occupancy 100% W.A. Lease Term Remaining 9.1 years Annual Distributions Per Share $1.65
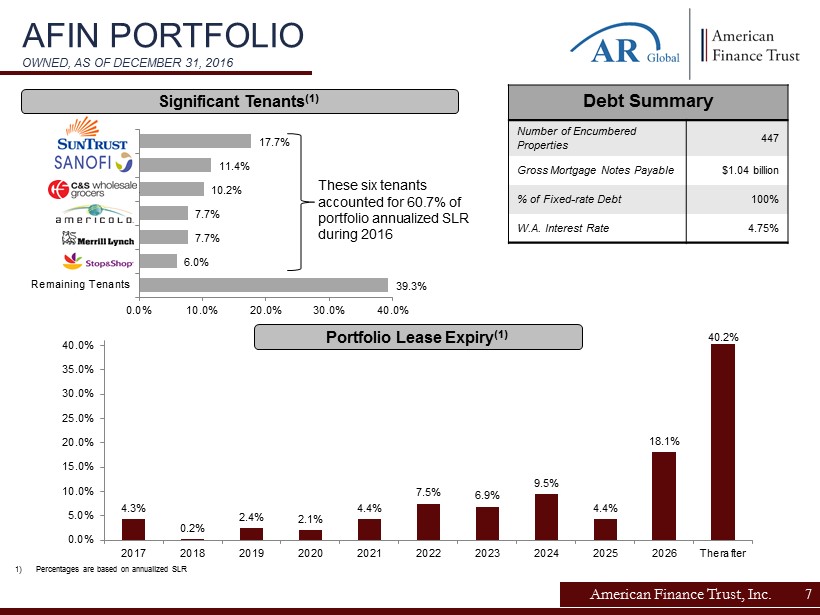
American Finance Trust, Inc. AFIN PORTFOLIO OWNED, AS OF DECEMBER 31, 2016 1) Percentages are based on annualized SLR 7 4.3% 0.2% 2.4% 2.1% 4.4% 7.5% 6.9% 9.5% 4.4% 18.1% 40.2% 0.0% 5.0% 10.0% 15.0% 20.0% 25.0% 30.0% 35.0% 40.0% 2017 2018 2019 2020 2021 2022 2023 2024 2025 2026 Therafter Portfolio Lease Expiry (1) 39.3% 6.0% 7.7% 7.7% 10.2% 11.4% 17.7% 0.0% 10.0% 20.0% 30.0% 40.0% Remaining Tenants Stop & Shop Merrill Lynch AmeriCold C&S Wholesale… Sanofi US Suntrust Bank Significant Tenants (1) These six tenants accounted for 60.7% of portfolio annualized SLR during 2016 Debt Summary Number of Encumbered Properties 447 Gross Mortgage Notes Payable $1.04 billion % of Fixed - rate Debt 100% W.A. Interest Rate 4.75%
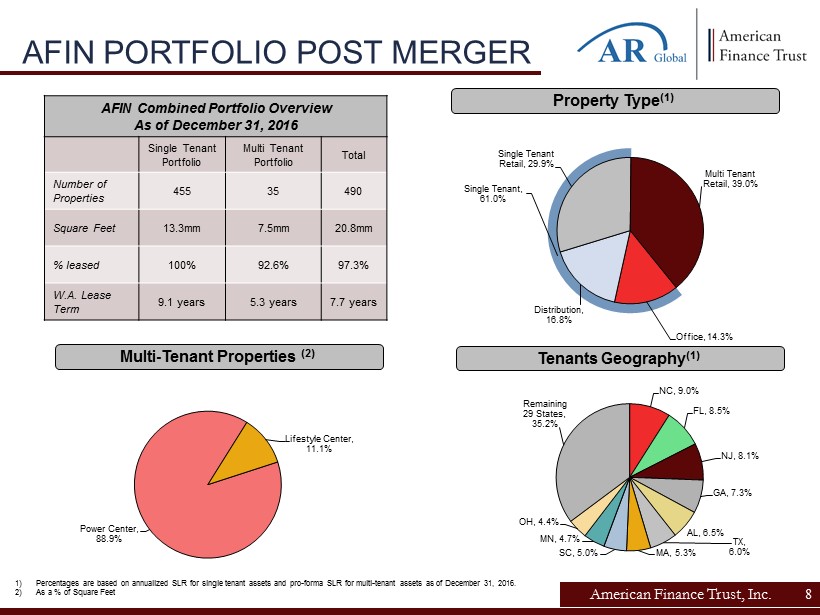
American Finance Trust, Inc. AFIN PORTFOLIO POST MERGER Multi - Tenant Properties (2) Property Type (1) 1) Percentages are based on annualized SLR for single tenant assets and pro - forma SLR for multi - tenant assets as of December 31, 20 16. 2) As a % of Square Feet 8 NC , 9.0% FL , 8.5% NJ , 8.1% GA , 7.3% AL , 6.5% TX , 6.0% MA , 5.3% SC , 5.0% MN , 4.7% OH , 4.4% Remaining 29 States, 35.2% Tenants Geography (1) Power Center , 88.9% Lifestyle Center , 11.1% Single Tenant, 61.0% Office , 14.3% Distribution , 16.8% Single Tenant Retail , 29.9% Multi Tenant Retail , 39.0% AFIN Combined Portfolio Overview As of December 31, 2016 Single Tenant Portfolio Multi Tenant Portfolio Total Number of Properties 455 35 490 Square Feet 13.3mm 7.5mm 20.8mm % leased 100% 92.6% 97.3% W.A. Lease Term 9.1 years 5.3 years 7.7 years
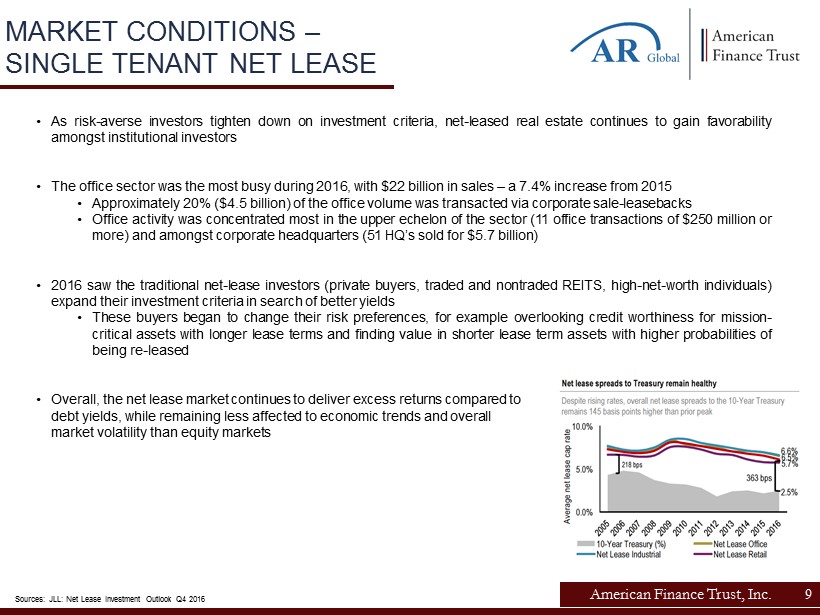
American Finance Trust, Inc. Sources: JLL: Net Lease Investment Outlook Q4 2016 9 • As risk - averse investors tighten down on investment criteria, net - leased real estate continues to gain favorability amongst institutional investors • The office sector was the most busy during 2016 , with $ 22 billion in sales – a 7 . 4 % increase from 2015 • Approximately 20 % ( $ 4 . 5 billion) of the office volume was transacted via corporate sale - leasebacks • Office activity was concentrated most in the upper echelon of the sector ( 11 office transactions of $ 250 million or more) and amongst corporate headquarters ( 51 HQ’s sold for $ 5 . 7 billion) • 2016 saw the traditional net - lease investors (private buyers, traded and nontraded REITS, high - net - worth individuals) expand their investment criteria in search of better yields • These buyers began to change their risk preferences, for example overlooking credit worthiness for mission - critical assets with longer lease terms and finding value in shorter lease term assets with higher probabilities of being re - leased • Overall, the net lease market continues to deliver excess returns compared to debt yields, while remaining less affected to economic trends and overall market volatility than equity markets MARKET CONDITIONS – SINGLE TENANT NET LEASE

American Finance Trust, Inc. Sources: JLL: Net Lease Retail Investment Outlook Q4 2016, Cleveland.com, Kibo 2017 Consumer trends Report, Harvard Business Review 10 • Institutional Investors were the most active purchasers of retail real - estate in 2016 , acquiring $ 15 . 8 billion of assets • Investment Managers led the way, increasing deal flow 77 . 9 % from the prior year . • TIAA, DRA Advisors and PGIM each invested over $ 1 . 0 billion in the sector ; Blackstone invested over $ 3 . 0 billion . • Much has been said about the decline of traditional retail, as numerous prestigious retailers have began to close stores • Investors are beginning to shift preferences from primary urban markets to secondary, suburban markets • Though the primary markets still represent the majority of retail investments, during 2016 investments into secondary markets grew 26 . 5 % while investments into primary markets shrunk by 43 . 9 % • However, according to industry professionals, these fears may be overblown • As retail strategist Steven Dennis puts it : “Malls aren't dead at all, 90 percent of retail is still done in physical stores, and that's only changing about 1 percent a year . There clearly needs to be fewer physical stores, but five years from now, 85 percent of sales will still be in stores” • Though traditional department stores (Sears, Macy’s, J . C . Penny’s) are facing a tougher time, off - price retailers such as T . J . Maxx and higher - end stores with exclusive products harder to find online such as Nordstrom and Saks Fifth Avenue continue to thrive in this changing environment • Retail shopping is not a zero sum game between traditional Brick and mortar and online E - commerce . Both customers and retailers are shifting their preferences to an “Omni - channel” shopping experience, combining both avenues to enhance the shopping experience . According to a study published by Harvard Business Review, 73 % of shoppers were Omni - channel customers, and this group spent an average of 4 % more when shopping in - store . 86% 94% 2015 2016 94% of consumers do online research before a store visit, up from 2015 78% 40 % 78% of consumers have purchased an item online and picked up in store 40% of these visits result in additional items purchased by the customer MARKET CONDITIONS – MULTI - TENANT RETAIL

American Finance Trust, Inc. 11 Source: St. Louis FRED database • AFIN’s management team regularly monitors the net lease market, as well as the broader retail real estate market, and has remained patient in acquiring new assets with the expectation of cap rates reaching favorable levels in the near future . • Based on observable transactions, a large bid - ask spread still remains between buyers and sellers, which we attribute to the historical lag between movement in interest rates, or cost of debt, and movements in cap rates within the real estate market . However, with the U . S . Treasury Bond Yield consistently over 2 . 0 % , we have started to see cap rates begin to increase . Based on market research and conversations with brokers, our acquisitions team feels confident to be able to purchase some assets in the low to mid 7 . 00 % cap rate range . • AFIN has bid on a number of assets during the past two quarters, and while we continue to remain patient, management has positioned itself to take advantage of the dislocation that is starting to present itself in the market . By carefully identifying a pipeline of quality retail properties offering attractive yields and stable cash flow, we continue to look for opportunities to enhance the make up of the overall portfolio and position the REIT for growth . • AFIN’s management team has historically been able to take advantage of cap rate shifts as a result of short - term movements in interest rates . Several instances of these short term interest rate spikes occurred between 2011 and 2013 , where AFIN’s management team ( 1 ) simultaneously adjusted acquisition pricing and was able to achieve better than market yields on its investments . Today, AFIN aims to once again take advantage of the market shift and acquire high quality assets at favorable cap rates . AFIN ACQUISITION PIPELINE (1) AFIN’s management team previously managed other net lease programs during this time period including American Realty Capital Tr ust Inc., American Realty Capital Trust III Inc., and American Realty Capital Trust IV Inc. 0.00% 0.50% 1.00% 1.50% 2.00% 2.50% Jun-16 Jul-16 Aug-16 Sep-16 Oct-16 Nov-16 Dec-16 Jan-17 Feb-17 Ten - Year Treasury Yield
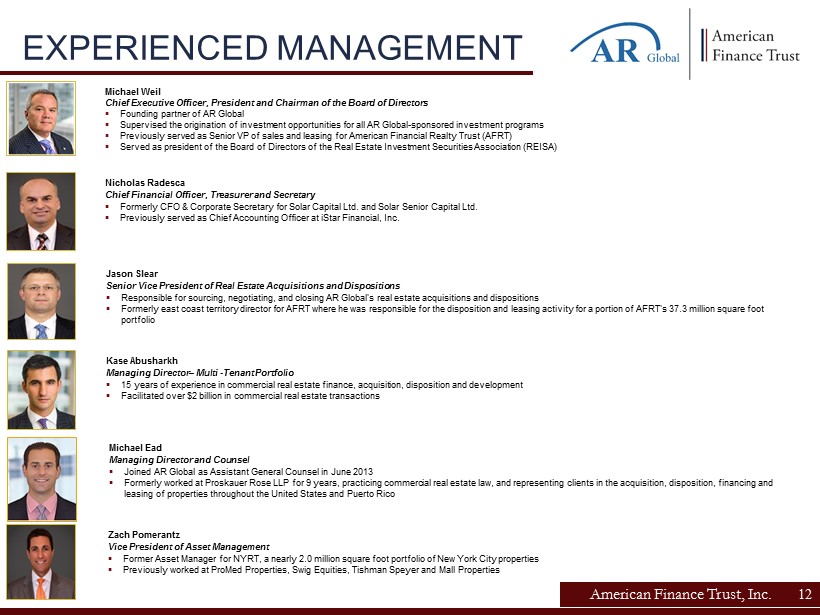
12 American Finance Trust, Inc. Nicholas Radesca Chief Financial Officer, Treasurer and Secretary ▪ Formerly CFO & Corporate Secretary for Solar Capital Ltd. and Solar Senior Capital Ltd. ▪ Previously served as Chief Accounting Officer at iStar Financial, Inc. Michael Weil Chief Executive Officer, President and Chairman of the Board of Directors ▪ Founding partner of AR Global ▪ Supervised the origination of investment opportunities for all AR Global - sponsored investment programs ▪ Previously served as Senior VP of sales and leasing for American Financial Realty Trust (AFRT) ▪ Served as president of the Board of Directors of the Real Estate Investment Securities Association (REISA) Jason Slear Senior Vice President of Real Estate Acquisitions and Dispositions ▪ Responsible for sourcing, negotiating, and closing AR Global's real estate acquisitions and dispositions ▪ Formerly east coast territory director for AFRT where he was responsible for the disposition and leasing activity for a porti on of AFRT's 37.3 million square foot portfolio EXPERIENCED MANAGEMENT 12 Kase Abusharkh Managing Director – Multi - Tenant Portfolio ▪ 15 years of experience in commercial real estate finance, acquisition, disposition and development ▪ Facilitated over $2 billion in commercial real estate transactions Michael Ead Managing Director and Counsel ▪ Joined AR Global as Assistant General Counsel in June 2013 ▪ Formerly worked at Proskauer Rose LLP for 9 years, practicing commercial real estate law, and representing clients in the acquisition, d isposition, financing and leasing of properties throughout the United States and Puerto Rico Zach Pomerantz Vice President of Asset Management ▪ Former Asset Manager for NYRT, a nearly 2.0 million square foot portfolio of New York City properties ▪ Previously worked at ProMed Properties, Swig Equities, Tishman Speyer and Mall Properties

American Finance Trust, Inc. FINANCIAL OVERVIEW • As of December 31, 2016, AFIN had cash and cash equivalents of $131.2 million. • The Company’s leverage ratio as of December 31, 2016 is 50.0%. 13 American Finance Trust, Inc. Balance Sheet Metrics – December 31, 2016 (all in $000s) Total real estate investments, at cost $2,024,387 Less: accumulated depreciation and amortization (287,090) Total real estate investments, net 1,737,297 Cash and cash equivalents 131,215 Commercial mortgage loan, held for investment, net 17,175 Assets held for sale 137,602 Other assets 41,170 Total assets $2,064,459 Mortgage notes payable (1) $1,032,956 Other liabilities 46,637 Total liabilities 1,079,593 Total stockholders’ equity 984,866 Total liabilities and stockholders’ equity $2,064,459 Total debt / Total assets 50.0% (1) Mortgage notes payable reflects the gross payable balance, including mortgage premiums, net, less net deferred financing costs

Since inception, AFIN has paid out $5.92 per share of regular, monthly distributions in cash and DRIP. CONSISTENT DISTRIBUTIONS American Finance Trust, Inc. 14 (1) Totals as of each period presented represent cumulative distributions per share assuming shares had been held since May 1 3, 2013, the date when our distributions began to accrue. On April 9, 2013, our board of directors authorized, and we declared, distributions of $1.65 per annum, per share of common stock. A port ion of the distributions paid in cash has exceeded cumulative cash flow from operations and has been paid out of cash on hand and proceeds from the IPO. $5.92 per share (Cumulative) (1) $- $1.00 $2.00 $3.00 $4.00 $5.00 $6.00 $7.00
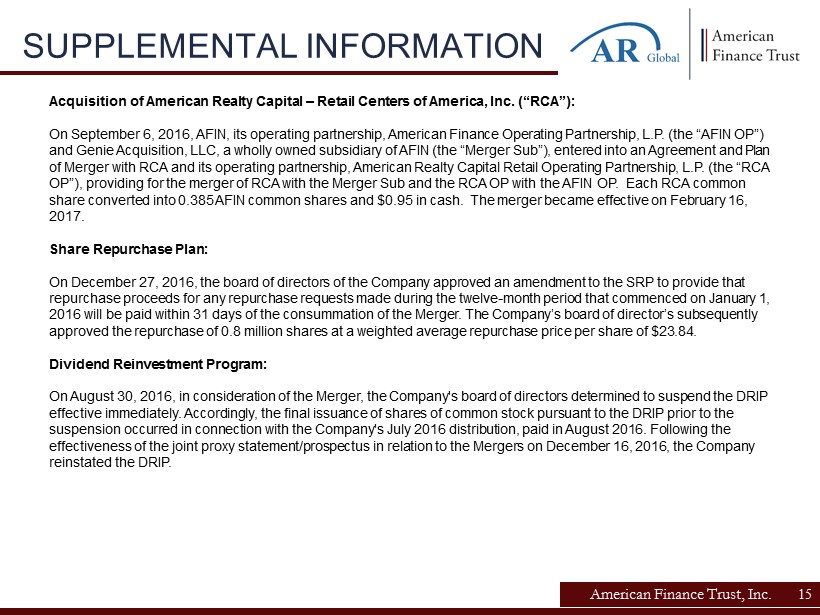
American Finance Trust, Inc. 15 Acquisition of American Realty Capital – Retail Centers of America, Inc. (“RCA”): On September 6, 2016, AFIN, its operating partnership, American Finance Operating Partnership, L.P. (the “AFIN OP”) and Genie Acquisition, LLC, a wholly owned subsidiary of AFIN (the “Merger Sub”), entered into an Agreement and Plan of Merger with RCA and its operating partnership, American Realty Capital Retail Operating Partnership, L.P. (the “RCA OP”), providing for the merger of RCA with the Merger Sub and the RCA OP with the AFIN OP. Each RCA common share converted into 0.385 AFIN common shares and $0.95 in cash. The merger became effective on February 16, 2017. Share Repurchase Plan: On December 27, 2016, the board of directors of the Company approved an amendment to the SRP to provide that repurchase proceeds for any repurchase requests made during the twelve - month period that commenced on January 1, 2016 will be paid within 31 days of the consummation of the Merger. The Company’s board of director’s subsequently approved the repurchase of 0.8 million shares at a weighted average repurchase price per share of $23.84. Dividend Reinvestment Program: On August 30, 2016, in consideration of the Merger, the Company's board of directors determined to suspend the DRIP effective immediately. Accordingly, the final issuance of shares of common stock pursuant to the DRIP prior to the suspension occurred in connection with the Company's July 2016 distribution, paid in August 2016. Following the effectiveness of the joint proxy statement/prospectus in relation to the Mergers on December 16, 2016, the Company reinstated the DRIP. SUPPLEMENTAL INFORMATION
16 American Finance Trust, Inc. RISK FACTORS Our potential risks and uncertainties are presented in the section titled “Item 1 A . Risk Factors” disclosed in our Annual Report on Form 10 - K for the year ended December 31 , 2016 and our Quarterly Reports on Form 10 - Q filed from time to time . The following are some of the risks and uncertainties relating to us and the proposed transaction, although not all risks and uncertainties, that could cause our actual results to differ materially from those presented in our forward - looking statements : ▪ All of our executive officers are also officers, managers or holders of a direct or indirect controlling interest in American Finance Advisors, LLC (our “Advisor”) or other entities under common control with AR Global . As a result, our executive officers, our Advisor and its affiliates face conflicts of interest, including significant conflicts created by our Advisor’s compensation arrangements with us and other investment programs advised by affiliates of our Sponsor and conflicts in allocating time among these entities and us, which could negatively impact our operating results . ▪ Although we have announced our intention to list our shares of common stock on the New York Stock Exchange, at a time yet to be determined, there can be no assurance that our shares of common stock will be listed . No public market currently exists, or may ever exist, for shares of our common stock and our shares are, and may continue to be, illiquid . ▪ Our Advisor has not entered into an agreement with Lincoln Retail REIT Services, LLC (“Lincoln”), or any other party, to act as service provider for our stabilized core retail properties ; the failure of our Advisor to enter an agreement could adversely affect our ability to continue to make investments in, or manage, stabilized core retail properties ▪ We depend on tenants for our rental revenue and, accordingly, our rental revenue is dependent upon the success and economic viability of our tenants . ▪ Our tenants may not achieve our rental rate incentives and our expenses could be greater, which may impact our results of operations . ▪ The business of owning and operating retail properties, including power centers and lifestyle centers, which RCA was engaged in, has different risks than our business prior to the Merger, which primarily consisted of owning net leased real estate, including shorter lease terms, greater exposure to downturns in the retail market, dependence on the success and economic viability of anchor tenants and competition from other retail properties in areas where our operating real estate properties are located and from alternative retail channels such as internet shopping . 16

17 American Finance Trust, Inc. RISK FACTORS ▪ We have not generated, and in the future may not generate, operating cash flows sufficient to cover 100 % of our distributions, and, as such, we may be forced to source distributions from borrowings, which may be at unfavorable rates, or depend on our Advisor to waive reimbursement of certain expenses or fees . There is no assurance that our Advisor will waive reimbursement of expenses or fees . ▪ We may be unable to pay or maintain cash distributions at the current rate or increase distributions over time . ▪ We are obligated to pay fees, which may be substantial, to our Advisor and its affiliates . ▪ We are subject to risks associated with any dislocation or liquidity disruptions that may exist or occur in the credit markets of the United States of America . ▪ We may fail to continue to qualify to be treated as a real estate investment trust for U . S . federal income tax purposes, which would result in higher taxes, may adversely affect our operations and would reduce the value of an investment in our common stock and our cash available for distributions . ▪ We may be deemed by regulators to be an investment company under the Investment Company Act of 1940 , as amended (the “Investment Company Act”), and thus subject to regulation under the Investment Company Act . 17

AmericanFinanceTrust.com ▪ For account information, including balances and the status of submitted paperwork, please call us at (866) 902 - 0063 ▪ Financial Advisors may view client accounts, statements and tax forms at www.dstvision.com ▪ Shareholders may access their accounts at www.ar - global.com