Exhibit 99.1
March 2019 Fourth Quarter 2018 Investor Presentation (NASDAQ: AFIN)
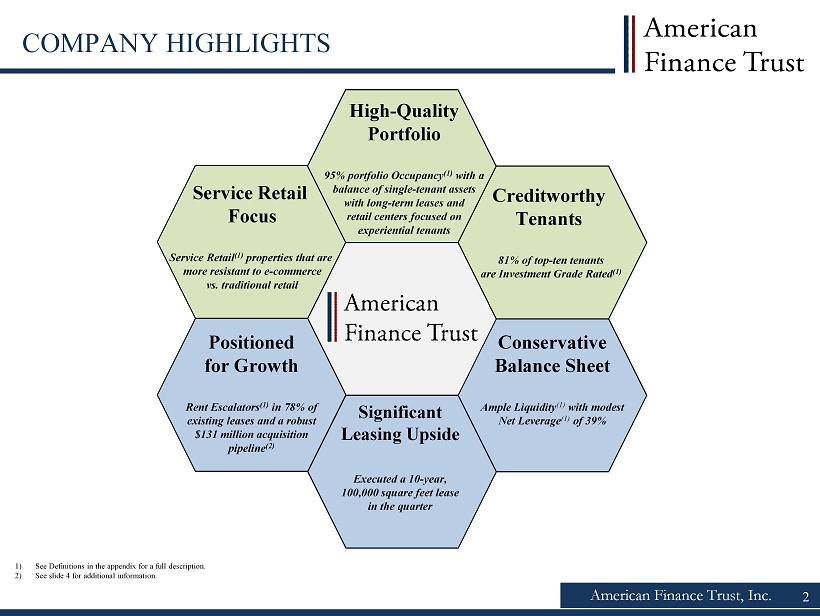
American Finance Trust, Inc. COMPANY HIGHLIGHTS Service Retail Focus Service Retail ( 1) properties that are more resistant to e - commerce vs. traditional retail High - Quality Portfolio 95% portfolio Occupancy (1) with a balance of single - tenant assets with long - term leases and retail centers focused on experiential tenants Creditworthy Tenants 81% of top - ten tenants are Investment Grade Rated (1) Conservative Balance Sheet Ample Liquidity (1) with modest Net Leverage (1) of 39% Positioned for Growth Rent Escalators ( 1) in 78% of existing leases and a robust $131 million acquisition pipeline (2) Significant Leasing Upside E xecuted a 10 - year, 100,000 square feet lease in the quarter 1) See Definitions in the appendix for a full description. 2) See slide 4 for additional information. 2
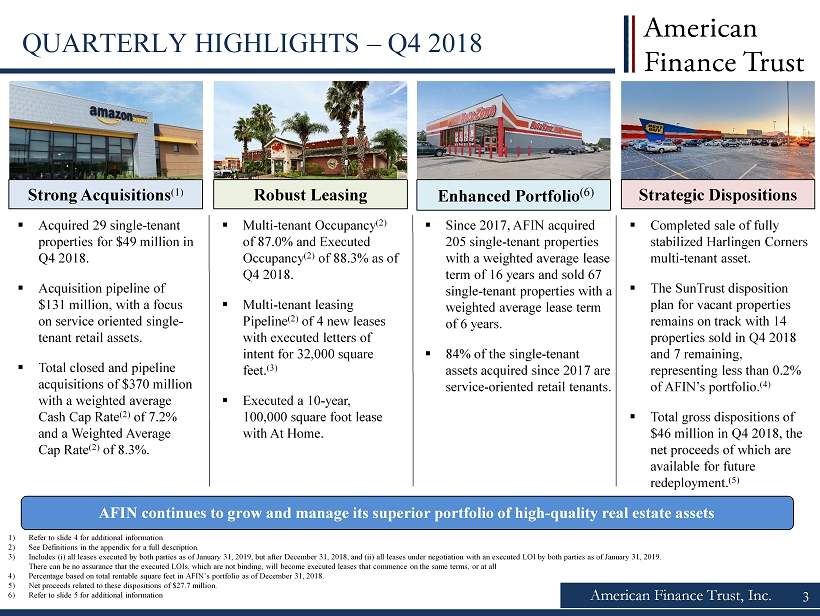
American Finance Trust, Inc. 3 QUARTERLY HIGHLIGHTS – Q4 2018 Robust Leasing Strong Acquisitions (1) Strategic Dispositions ▪ Acquired 29 single - tenant properties for $49 million in Q4 2018. ▪ Acquisition pipeline of $131 million, with a focus on service oriented single - tenant retail assets. ▪ Total closed and pipeline acquisitions of $370 million with a weighted average Cash Cap Rate (2) of 7.2% and a Weighted Average Cap Rate (2) of 8.3%. AFIN continues to grow and manage its superior portfolio of high - quality real estate assets ▪ Completed sale of fully stabilized Harlingen Corners multi - tenant asset. ▪ The SunTrust disposition plan for vacant properties remains on track with 14 properties sold in Q4 2018 and 7 remaining, representing less than 0.2% of AFIN’s portfolio. (4) ▪ Total gross dispositions of $46 million in Q4 2018, the net proceeds of which are available for future redeployment. (5) ▪ Multi - tenant Occupancy (2) of 87.0% and Executed Occupancy (2) of 88.3% as of Q4 2018. ▪ Multi - tenant leasing Pipeline (2) of 4 new leases with executed letters of intent for 32,000 square feet. (3) ▪ Executed a 10 - year, 100,000 square foot lease with At Home. ▪ Since 2017, AFIN acquired 205 single - tenant properties with a weighted average lease term of 16 years and sold 67 single - tenant properties with a weighted average lease term of 6 years. ▪ 84% of the single - tenant assets acquired since 2017 are service - oriented retail tenants. 1) Refer to slide 4 for additional information 2) See Definitions in the appendix for a full description. 3) Includes (i) all leases executed by both parties as of January 31, 2019, but after December 31, 2018, and (ii) all leases und er negotiation with an executed LOI by both parties as of January 31, 2019. There can be no assurance that the executed LOIs, which are not binding, will become executed leases that commence on the sam e t erms, or at all 4) Percentage based on total rentable square feet in AFIN’s portfolio as of December 31, 2018. 5) Net proceeds related to these dispositions of $27.7 million. 6) Refer to slide 5 for additional information Enhanced Portfolio (6)

American Finance Trust, Inc. 4 ROBUST ACQUISITION ACTIVITY Closed on $239 million of single - tenant acquisitions through December 31, 2018 and currently have a $131 million pipeline. Total closed and pipeline acquisitions of $370 million with a Weighted Average Cap Rate (1) of 8.3%. ($ in millions, s quare feet in thousands, lease term remaining in years) Note: Data as of January 31, 2019 and includes pipeline as of January 31, 2019 . There can be no assurance these pipeline acquisitions will be completed on their current terms, or at all. 1) See Definitions in the appendix for a full description. 2) Represents the contract purchase price and excludes capitalized acquisitions costs per GAAP. 3) Weighted average remaining lease term as of December 31, 2018 is based on square feet. 4) “PSA” is defined as a definitive Purchase and Sale Agreement. 5) Weighted average based on square feet. 6) These transactions were previously reported in Q3 2018’s Investor Presentation under the “Office” property type classificatio n. Closed Transactions ( as of December 31, 2018) Property Type Number of Properties Square Feet Purchase Price (2) Wgt . Avg. Cap Rate (1) Lease Term Remaining (3) Closed Sonny's BBQ Service Retail 3 19 $8.4 8.2% 15.1 Q1’18 Mountain Express Service Retail 9 30 $17.9 8.3% 19.0 Q1’18 Kum & Go Service Retail 1 5 $3.3 7.0% 9.4 Q1’18 DaVita Service Retail (6) 2 13 $2.3 7.7% 7.2 Q1’18 White Oak Service Retail 9 22 $11.8 9.3% 19.3 Q1’18 Mountain Express Service Retail 15 59 $27.4 8.5% 19.3 Q2’18 Dialysis Portfolio Service Retail (6) 7 64 $16.3 7.5% 8.8 Q3’18 Children of America Office 2 33 $8.5 8.2% 14.7 Q3’18 Burger King Service Retail 1 3 $1.9 7.8% 14.7 Q3’18 White Oak Service Retail 9 18 $5.8 9.0% 18.9 Q3’18 Bob Evans Service Retail 22 111 $51.7 ––– 18.3 Q3’18 Mountain Express Service Retail 14 47 $29.2 8.7% 19.6 Q3’18 Taco John’s Service Retail 7 15 $5.9 8.5% 14.8 Q3’18 White Oak Service Retail 1 4 $3.2 9.3% 19.9 Q4’18 DaVita Service Retail (6) 1 10 $2.6 8.0% 8.2 Q4’18 Pizza Hut Service Retail 9 23 $10.0 7.7% 14.8 Q4’18 Little Caesars Service Retail 11 19 $9.3 9.4% 20.0 Q4’18 Caliber Collision Service Retail 3 48 $8.9 7.9% 12.8 Q4’18 Tractor Supply Traditional Retail 4 79 $14.6 7.2% 12.8 Q4’18 2018: Total Closed 130 622 $239.0 8.1% (5) 15.6 Pipeline Property Type Number of Properties Square Feet Purchase Price (2) Wgt . Avg. Cap Rate (1) Lease Term Remaining (3) Status (4) Fresenius Service Retail 6 44 $12.7 8.2% 7.4 Closed Q1’19 Pizza Hut Service Retail 31 90 $35.2 7.7% 20.0 Closed Q1’19 White Oak Service Retail 2 18 $8.6 10.3% 20.1 PSA Executed Mountain Express Service Retail 19 109 $49.7 9.3% 20.1 PSA Executed Mountain Express Service Retail 9 27 $18.4 8.8% 20.1 PSA Executed Fresenius Service Retail 1 9 $3.4 7.8% 13.1 PSA Executed Tractor Supply Traditional Retail 1 19 $3.0 7.0% 12.3 PSA Executed 2019: Total Pipeline 69 316 $131.0 8.5% (5) 17.6 2018: Total Closed + Pipeline 199 938 $370.0 8.3% (5) 16.3
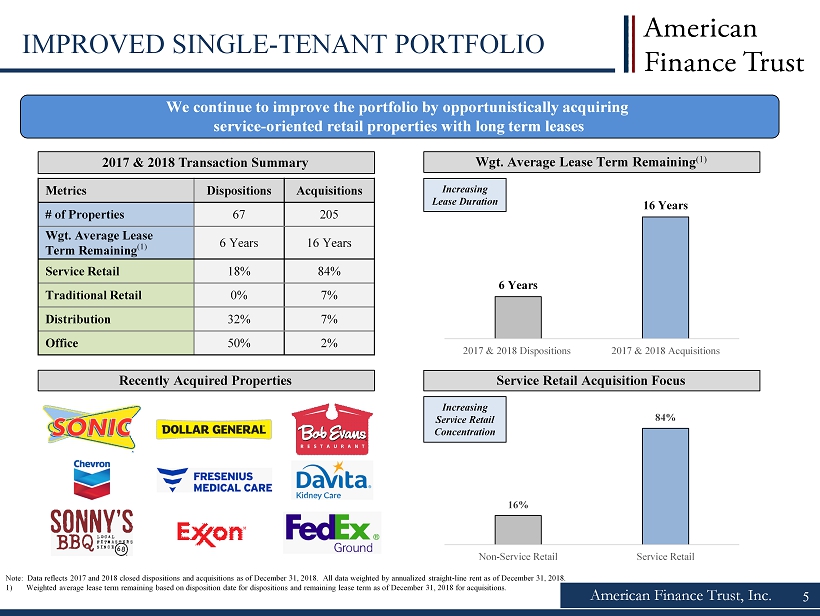
American Finance Trust, Inc. IMPROVED SINGLE - TENANT PORTFOLIO We continue to improve the portfolio by opportunistically acquiring service - oriented retail properties with long term leases Note: Data reflects 2017 and 2018 closed dispositions and acquisitions as of December 31, 2018 . All data weighted by annualized straight - line rent as of December 31, 2018 . 1) Weighted average lease term remaining based on disposition date for dispositions and remaining lease term as of December 31, 2018 for acquisitions. 5 Metrics Dispositions Acquisitions # of Properties 67 205 Wgt . Average Lease Term Remaining (1) 6 Years 16 Years Service Retail 18% 84% Traditional Retail 0% 7% Distribution 32% 7% Office 50% 2% 2017 & 2018 Transaction Summary Wgt . Average Lease Term Remaining (1) Service Retail Acquisition Focus Recently Acquired Properties 6 Years 16 Years 2017 & 2018 Dispositions 2017 & 2018 Acquisitions Increasing Lease Duration 16% 84% Non-Service Retail Service Retail Increasing Service Retail Concentration
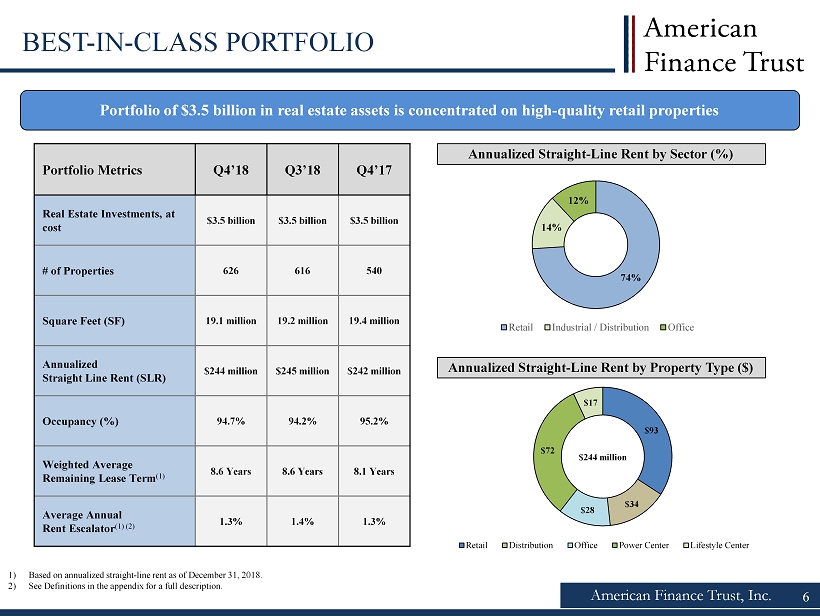
American Finance Trust, Inc. 6 Portfolio of $3.5 billion in real estate assets is concentrated on high - quality retail properties 1) Based on annualized straight - line rent as of December 31, 2018. 2) See Definitions in the appendix for a full description. Portfolio Metrics Q4’18 Q3’18 Q4’17 Real Estate Investments, at cost $3.5 billion $3.5 billion $3.5 billion # of Properties 626 616 540 Square Feet (SF) 19.1 million 19.2 million 19.4 million Annualized Straight Line Rent (SLR) $244 million $245 million $242 million Occupancy (%) 94.7% 94.2% 95.2% Weighted Average Remaining Lease Term (1) 8.6 Years 8.6 Years 8.1 Years Average Annual Rent Escalator (1) (2) 1.3% 1.4% 1.3% Annualized Straight - Line Rent by Property Type ($) BEST - IN - CLASS PORTFOLIO $93 $34 $28 $72 $17 Retail Distribution Office Power Center Lifestyle Center $ 244 million Annualized Straight - Line Rent by Sector (%) 74% 14% 12% Retail Industrial / Distribution Office
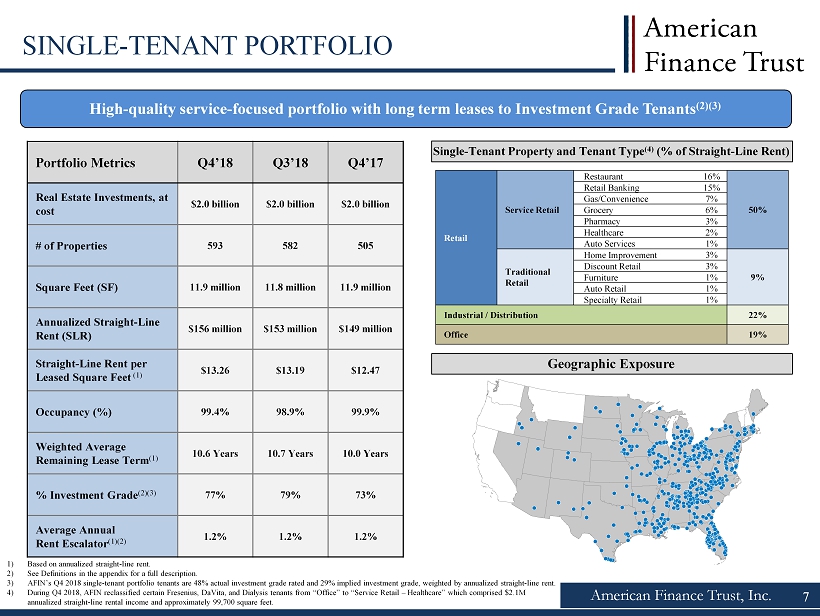
High - quality service - focused portfolio with long term leases to Investment Grade Tenants (2)(3) Portfolio Metrics Q4’18 Q3’18 Q4’17 Real Estate Investments, at cost $2.0 billion $2.0 billion $2.0 billion # of Properties 593 582 505 Square Feet (SF) 11.9 million 11.8 million 11.9 million Annualized Straight - Line Rent (SLR) $156 million $153 million $149 million Straight - Line Rent per Leased Square Feet (1) $13.26 $13.19 $12.47 Occupancy (%) 99.4% 98.9% 99.9% Weighted Average Remaining Lease Term (1) 10.6 Years 10.7 Years 10.0 Years % Investment Grade (2)(3) 77% 79% 73% Average Annual Rent Escalator (1)(2) 1.2% 1.2% 1.2% American Finance Trust, Inc. 7 SINGLE - TENANT PORTFOLIO 1) Based on annualized straight - line rent. 2) See Definitions in the appendix for a full description. 3) AFIN’s Q4 2018 single - tenant portfolio tenants are 48% actual investment grade rated and 29% implied investment grade, weighted by annualized straight - line rent. 4) During Q4 2018, AFIN reclassified certain Fresenius, DaVita, and Dialysis tenants from “Office” to “Service Retail – Healthcare” which comprised $2.1M annualized straight - line rental income and approximately 99,700 square feet. Single - Tenant Property and Tenant Type (4) (% of Straight - Line Rent) Retail Service Retail Restaurant 16% 50% Retail Banking 15% Gas/Convenience 7% Grocery 6% Pharmacy 3% Healthcare 2% Auto Services 1% Traditional Retail Home Improvement 3% 9% Discount Retail 3% Furniture 1% Auto Retail 1% Specialty Retail 1% Industrial / Distribution 22% Office 19% Geographic Exposure
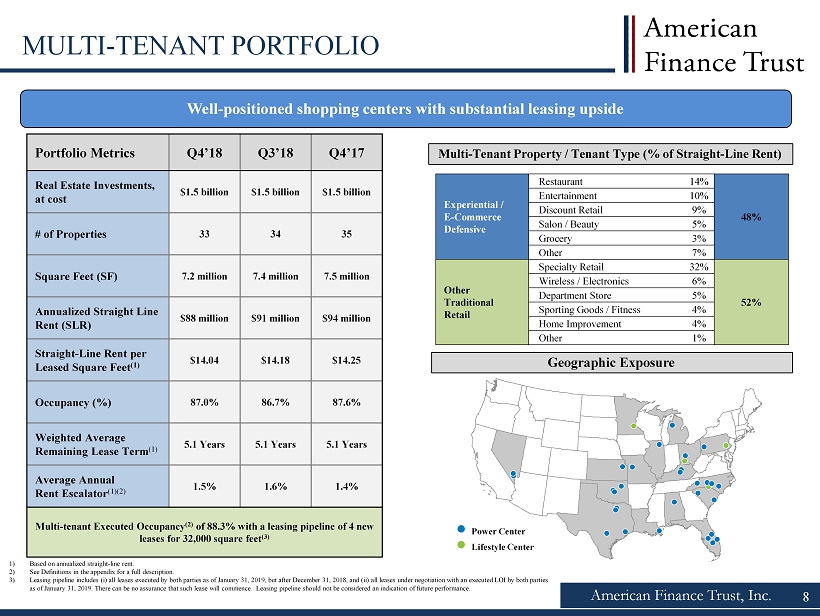
American Finance Trust, Inc. 8 MULTI - TENANT PORTFOLIO Well - positioned shopping centers with substantial leasing upside Portfolio Metrics Q4’18 Q3’18 Q4’17 Real Estate Investments, at cost $1.5 billion $1.5 billion $1.5 billion # of Properties 33 34 35 Square Feet (SF) 7.2 million 7.4 million 7.5 million Annualized Straight Line Rent (SLR) $88 million $91 million $94 million Straight - Line Rent per Leased Square Feet (1) $14.04 $14.18 $14.25 Occupancy (%) 87.0% 86.7% 87.6% Weighted Average Remaining Lease Term (1) 5.1 Years 5.1 Years 5.1 Years Average Annual Rent Escalator (1)(2) 1.5% 1.6% 1.4% Multi - tenant Executed Occupancy (2) of 88.3% with a leasing pipeline of 4 new leases for 32,000 square feet (3) Multi - Tenant Property / Tenant Type (% of Straight - Line Rent) 1) Based on annualized straight - line rent. 2) See Definitions in the appendix for a full description. 3) Leasing pipeline includes (i) all leases executed by both parties as of January 31, 2019, but after December 31, 2018, and (i i) all leases under negotiation with an executed LOI by both parties as of January 31, 2019. There can be no assurance that such lease will commence. Leasing pipeline should not be considered an indication of future p erf ormance. Experiential / E - Commerce Defensive Restaurant 14% 48% Entertainment 10% Discount Retail 9% Salon / Beauty 5% Grocery 3% Other 7% Other Traditional Retail Specialty Retail 32% 52% Wireless / Electronics 6% Department Store 5% Sporting Goods / Fitness 4% Home Improvement 4% Other 1% Geographic Exposure Power Center Lifestyle Center
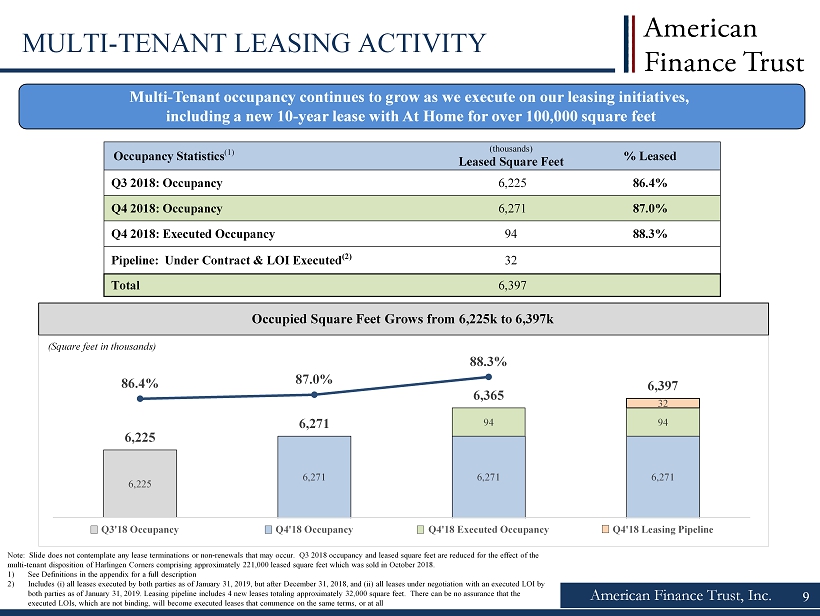
6,225 6,271 6,271 6,271 94 94 32 6,225 6,271 6,365 6,397 86.4% 87.0% 88.3% 78.0% 80.0% 82.0% 84.0% 86.0% 88.0% 6,000 6,002 6,004 6,006 6,008 6,010 6,012 6,014 6,016 6,018 6,020 6,022 6,024 6,026 6,028 6,030 6,032 6,034 6,036 6,038 6,040 6,042 6,044 6,046 6,048 6,050 6,052 6,054 6,056 6,058 6,060 6,062 6,064 6,066 6,068 6,070 6,072 6,074 6,076 6,078 6,080 6,082 6,084 6,086 6,088 6,090 6,092 6,094 6,096 6,098 6,100 6,102 6,104 6,106 6,108 6,110 6,112 6,114 6,116 6,118 6,120 6,122 6,124 6,126 6,128 6,130 6,132 6,134 6,136 6,138 6,140 6,142 6,144 6,146 6,148 6,150 6,152 6,154 6,156 6,158 6,160 6,162 6,164 6,166 6,168 6,170 6,172 6,174 6,176 6,178 6,180 6,182 6,184 6,186 6,188 6,190 6,192 6,194 6,196 6,198 6,200 6,202 6,204 6,206 6,208 6,210 6,212 6,214 6,216 6,218 6,220 6,222 6,224 6,226 6,228 6,230 6,232 6,234 6,236 6,238 6,240 6,242 6,244 6,246 6,248 6,250 6,252 6,254 6,256 6,258 6,260 6,262 6,264 6,266 6,268 6,270 6,272 6,274 6,276 6,278 6,280 6,282 6,284 6,286 6,288 6,290 6,292 6,294 6,296 6,298 6,300 6,302 6,304 6,306 6,308 6,310 6,312 6,314 6,316 6,318 6,320 6,322 6,324 6,326 6,328 6,330 6,332 6,334 6,336 6,338 6,340 6,342 6,344 6,346 6,348 6,350 6,352 6,354 6,356 6,358 6,360 6,362 6,364 6,366 6,368 6,370 6,372 6,374 6,376 6,378 6,380 6,382 6,384 6,386 6,388 6,390 6,392 6,394 6,396 6,398 6,400 6,402 6,404 6,406 6,408 6,410 6,412 6,414 6,416 6,418 6,420 6,422 6,424 6,426 6,428 6,430 6,432 6,434 6,436 6,438 6,440 6,442 6,444 6,446 6,448 6,450 6,452 6,454 6,456 6,458 6,460 6,462 6,464 6,466 6,468 6,470 6,472 6,474 6,476 6,478 6,480 6,482 6,484 6,486 6,488 6,490 6,492 6,494 6,496 6,498 6,500 Q3'18 Occupancy Q4'18 Occupancy Q4'18 Executed Occupancy Q4'18 Leasing Pipeline American Finance Trust, Inc. 9 MULTI - TENANT LEASING ACTIVITY Multi - Tenant occupancy continues to grow as we execute on our leasing initiatives, including a new 10 - year lease with At Home for over 100,000 square feet Note: Slide does not contemplate any lease terminations or non - renewals that may occur. Q3 2018 occupancy and leased square fe et are reduced for the effect of the multi - tenant disposition of Harlingen Corners comprising approximately 221,000 leased square feet which was sold in October 2018 . 1) See Definitions in the appendix for a full description 2) Includes (i) all leases executed by both parties as of January 31, 2019, but after December 31, 2018, and (ii) all leases und er negotiation with an executed LOI by both parties as of January 31, 2019. Leasing pipeline includes 4 new leases totaling approximately 32,000 square feet. There can be no assurance that the executed LOIs, which are not binding, will become executed leases that commence on the same terms, or at all Occupied Square Feet Grows from 6,225k to 6,397k (Square feet in thousands) Occupancy Statistics (1) (thousands) Leased Square Feet % Leased Q3 2018: Occupancy 6,225 86.4% Q4 2018: Occupancy 6,271 87.0% Q4 2018: Executed Occupancy 94 88.3% Pipeline: Under Contract & LOI Executed (2) 32 Total 6,397

9% 7% 5% 4% 3% 3% 3% 3% 3% 2% 58% 0% 20% 40% 60% 80% x 81% of top ten tenants are Investment Grade Rated (1)(2) x Largest tenant is SunTrust, an investment grade tenant, with a weighted average lease term remaining of 10.4 years (1) American Finance Trust, Inc. PORTFOLIO TENANT OVERVIEW 1) Based on annualized straight - line rent as of December 31, 2018 . 2) See Definitions in the appendix for a full description of investment grade rating. Top Tenant Overview (1) Remaining Tenants Moody’s/S&P Credit Rating: 10 Baa1 A1 Aa1 Baa1 Baa2 Ba1 Baa1 A2 n.a n.a. 0% 1% 3% 1% 4% 1% 2% 5% 45% 3% 4% 4% 4% 5% 6% 5% 2% 5% 0% 10% 20% 30% 40% 50% 60% 70% 2019 2020 2021 2022 2023 2024 2025 2026 Thereafter Subtotal Portfolio Lease Expiration Schedule (1) Single - Tenant Properties - 10 .6 years weighted average lease term remaining Multi - Tenant Properties – 5.1 years weighted average lease term remaining x Single - tenant portfolio has limited lease expirations through 2022 x Multi - tenant portfolio has balanced lease expirations

American Finance Trust, Inc. SUNTRUST – BB&T MERGER UPDATE 11 1) Portfolio as of December 31, 2018. Excludes 7 vacant properties which have either been sold in Q1 2019, or are being actively ma rketed for sale. 2) Based on annualized straight - line rent as of December 31, 2018. 3) Moody’s Corporate Credit Rating . 4) Per the SunTrust and BB&T merger presentation filed by SunTrust Banks Inc. with the Securities and Exchange Commission on Feb rua ry 7, 2019. Combined Company Corporate Credit Rating (3) A2 Baa1 x Potential two - notch credit enhancement Assets ($ billions) $226 (4) $216 (4) x 6 th largest U.S. bank (4) Compelling Transaction ▪ The parties believe the c ombination of strong branch deposits creates significant scale and should strengthen the company’s position within the US banking market (4) Transaction Highlights AFIN’s largest tenant, SunTrust, announced a $66 billion merger with BB&T on February 7, 2019, creating a premier investment - grade financial institution between these two regional banks (4) » AFIN has a strong portfolio of 139 occupied SunTrust properties (1) with desirable lease characteristics: ▪ The SunTrust portfolio has a remaining lease term of 10.4 years (2) , equating to a portfolio lease maturity in 2030 ▪ 1.50% annual rent bumps for the entire portfolio ▪ Investment - grade corporate guaranty » AFIN is contractually entitled to receive rent payments from these SunTrust properties through the full duration of the lease term, regardless of any potential synergies associated with the merger
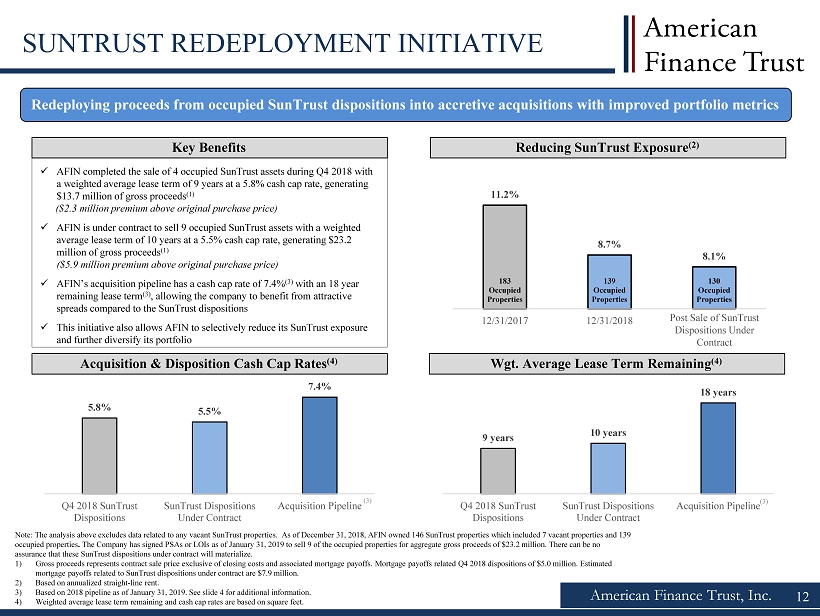
5.8% 5.5% 7.4% Q4 2018 SunTrust Dispositions SunTrust Dispositions Under Contract Acquisition Pipeline 9 years 10 years 18 years Q4 2018 SunTrust Dispositions SunTrust Dispositions Under Contract Acquisition Pipeline Wgt . Average Lease Term Remaining (4) American Finance Trust, Inc. Reducing SunTrust Exposure (2) Redeploying proceeds from occupied SunTrust dispositions into accretive acquisitions with improved portfolio metrics Acquisition & Disposition Cash Cap Rates (4) x AFIN completed the sale of 4 occupied SunTrust assets during Q4 2018 with a weighted average lease term of 9 years at a 5.8% cash cap rate, generating $13.7 million of gross proceeds (1) ($2.3 million premium above original purchase price) x AFIN is under contract to sell 9 occupied SunTrust assets with a weighted average lease term of 10 years at a 5.5% cash cap rate, generating $23.2 million of gross proceeds (1) ($5.9 million premium above original purchase price) x AFIN’s acquisition pipeline has a cash cap rate of 7.4 % (3) with an 18 year remaining lease term (3) , allowing the company to benefit from attractive spreads compared to the SunTrust dispositions x This initiative also allows AFIN to selectively reduce its SunTrust exposure and further diversify its portfolio SUNTRUST REDEPLOYMENT INITIATIVE Key Benefits 1 2 Note: The analysis above excludes data related to any vacant SunTrust properties. As of December 31, 2018, AFIN owned 146 SunTrust properties which included 7 vacant properties and 139 occupied properties . The Company has signed PSAs or LOIs as of January 31, 2019 to sell 9 of the occupied properties for aggregate gross proceeds of $23.2 million . There can be no assurance that these SunTrust dispositions under contract will materialize. 1) Gross proceeds represents contract sale price exclusive of closing costs and associated mortgage payoffs. Mortgage payoffs re lat ed Q4 2018 dispositions of $5.0 million. Estimated mortgage payoffs related to SunTrust dispositions under contract are $7.9 million. 2) Based on annualized straight - line rent. 3) Based on 2018 pipeline as of January 31, 2019. See slide 4 for additional information. 4) Weighted average lease term remaining and cash cap rates are based on square feet. 11.2% 8.7% 8.1% 183 Occupied Properties 139 Occupied Properties 130 Occupied Properties 0 0 0 0 0 6.0% 7.0% 8.0% 9.0% 10.0% 11.0% 12.0% 12/31/2017 12/31/2018 Post Sale (3) (3) Post Sale of SunTrust Dispositions Under Contract
6.1% 5.8% 8.5% Q4 2018 SunTrust Dispositions SunTrust Dispositions Under Contract Acquisition Pipeline 9 years 10 years 18 years Q4 2018 SunTrust Dispositions SunTrust Dispositions Under Contract Acquisition Pipeline Wgt . Average Lease Term Remaining (4) American Finance Trust, Inc. Reducing SunTrust Exposure (2) Redeploying proceeds from occupied SunTrust dispositions into accretive acquisitions with improved portfolio metrics Acquisition & Disposition Wgt . Average Cap Rates (4) x AFIN completed the sale of 4 occupied SunTrust assets during Q4 2018 with a weighted average lease term of 9 years at a 5.8% cash cap rate, generating $13.7 million of gross proceeds (1) ($2.3 million premium above original purchase price) x AFIN is under contract to sell 9 occupied SunTrust assets with a weighted average lease term of 10 years at a 5.5% cash cap rate, generating $23.2 million of gross proceeds (1) ($5.9 million premium above original purchase price) x AFIN’s acquisition pipeline has a Weighted Average Cap Rate of 8.5 % (3) with an 18 year remaining lease term (3) , allowing the company to benefit from attractive spreads compared to the SunTrust dispositions x This initiative also allows AFIN to selectively reduce its SunTrust exposure and further diversify its portfolio SUNTRUST REDEPLOYMENT INITIATIVE Key Benefits 12 Note: The analysis above excludes data related to any vacant SunTrust properties. As of December 31, 2018, AFIN owned 146 SunTrust properties which included 7 vacant properties and 139 occupied properties . The Company has signed PSAs or LOIs as of January 31, 2019 to sell 9 of the occupied properties for aggregate gross proceeds of $23.2 million . There can be no assurance that these SunTrust dispositions under contract will materialize. 1) Gross proceeds represents contract sale price exclusive of closing costs and associated mortgage payoffs. Mortgage payoffs re lat ed Q4 2018 dispositions of $5.0 million. Estimated mortgage payoffs related to SunTrust dispositions under contract are $7.9 million. 2) Based on annualized straight - line rent. 3) Based on 2018 pipeline as of January 31, 2019. See slide 4 for additional information. 4) Weighted average lease term remaining and a weighted average cap rates are based on square feet. 11.2% 8.7% 8.1% 183 Occupied Properties 139 Occupied Properties 130 Occupied Properties 0 0 0 0 0 6.0% 7.0% 8.0% 9.0% 10.0% 11.0% 12.0% 12/31/2017 12/31/2018 Post Sale (3) (3)
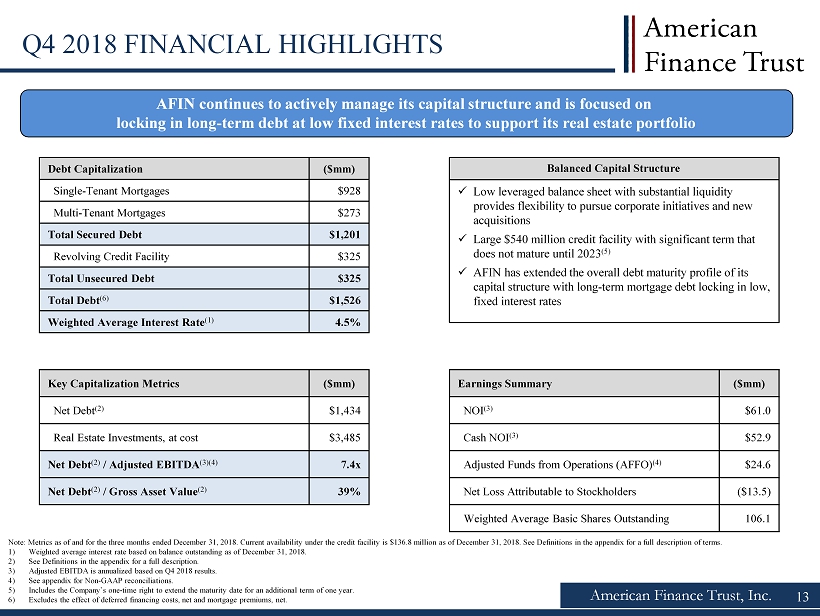
American Finance Trust, Inc. Q4 2018 FINANCIAL HIGHLIGHTS Debt Capitalization ($mm) Single - Tenant Mortgages $928 Multi - Tenant Mortgages $273 Total Secured Debt $1,201 Revolving Credit Facility $325 Total Unsecured Debt $325 Total Debt (6) $1,526 Weighted Average Interest Rate (1) 4.5% Key Capitalization Metrics ($mm) Net Debt (2) $1,434 Real Estate Investments, at cost $3,485 Net Debt (2) / Adjusted EBITDA (3)(4) 7.4x Net Debt (2) / Gross Asset Value (2) 39% Note: Metrics as of and for the three months ended December 31, 2018. Current availability under the credit facility is $136. 8 m illion as of December 31, 2018. See Definitions in the appendix for a full description of terms. 1) Weighted average interest rate based on balance outstanding as of December 31, 2018. 2) See Definitions in the appendix for a full description. 3) Adjusted EBITDA is annualized based on Q4 2018 results. 4) See appendix for Non - GAAP reconciliations. 5) Includes the Company’s one - time right to extend the maturity date for an additional term of one year. 6) Excludes the effect of deferred financing costs, net and mortgage premiums, net. Balanced Capital Structure AFIN continues to actively manage its capital structure and is focused on locking in long - term debt at low fixed interest rates to support its real estate portfolio Earnings Summary ($mm) NOI (3) $61.0 Cash NOI (3) $52.9 Adjusted Funds from Operations (AFFO) (4) $24.6 Net Loss Attributable to Stockholders ($13.5) Weighted Average Basic Shares Outstanding 106.1 x Low leveraged balance sheet with substantial liquidity provides flexibility to pursue corporate initiatives and new acquisitions x Large $540 million credit facility with significant term that does not mature until 2023 ( 5 ) x AFIN has extended the overall debt maturity profile of its capital structure with long - term mortgage debt locking in low, fixed interest rates 13
American Finance Trust, Inc. 14 EXPERIENCED MANAGEMENT Jason Slear Executive Vice President of Real Estate Acquisitions and Dispositions ▪ Responsible for sourcing, negotiating, and closing AR Global's real estate acquisitions and dispositions ▪ Oversaw the acquisition of over $3.5 billion of real estate assets and the lease - up of over 10 million square feet during professional career Michael Weil Chief Executive Officer, President and Chairman of the Board of Directors ▪ Founding partner of AR Global ▪ Previously served as Senior VP of sales and leasing for American Financial Realty Trust ▪ Served as president of the Board of Directors of the Real Estate Investment Securities Association Katie Kurtz Chief Financial Officer, Treasurer and Secretary ▪ Previously served as chief financial officer at American Realty Capital - Retail Centers of America, Inc., Business Development Co rporation of America II and Crossroads Capital, Inc. (formerly BDCA Venture, Inc.). ▪ Previously served as chief accounting officer at Carlyle GMS Finance, Inc., The Carlyle Group’s business development company, Di rector of Finance and Controller for New Mountain Finance Corporation, and Controller at Solar Capital Ltd ▪ Mrs. Kurtz began her career at PricewaterhouseCoopers, LLP and is a certified public accountant in New York State Zachary Pomerantz Senior Vice President of Asset Management ▪ Former Asset Manager for New York REIT (“NYRT”), a nearly 2 million square foot portfolio of New York City properties ▪ Previously worked at ProMed Properties, Swig Equities, Tishman Speyer and Mall Properties Boris Korotkin Senior Vice President of Capital Markets and Corporate Strategy ▪ Responsible for leading all debt capital market transactions ▪ Former Executive Vice President of Transaction Structuring for American Financial Realty Trust

Confidential – Not for Distribution 15 15 Legal Notices
American Finance Trust, Inc. 16 PROJECTIONS This presentation includes estimated projections of future operating results. These projections were not prepared in accordan ce with published guidelines of the SEC or the guidelines established by the American Institute of Certified Public Accountants for p rep aration and presentation of financial projections. This information is not fact and should not be relied upon as being necessarily in dic ative of future results; the projections were prepared in good faith by management and are based on numerous assumptions that may prov e t o be wrong. Important factors that may affect actual results and cause the projections to not be achieved include, but are not lim ite d to, risks and uncertainties relating to the company and other factors described in the “Risk Factors” section of the Company's Annual R epo rt on Form 10 - K for the year ended December 31, 2017, the Company's Quarterly Reports on Form 10 - Q and in future filings with the SEC. The projections also reflect assumptions as to certain business decisions that are subject to change. As a result, actual res ult s may differ materially from those contained in the estimates. Accordingly, there can be no assurance that the estimates will be realized. Th is presentation also contains estimates and information concerning our industry, including market position, market size, and gro wth rates of the markets in which we participate, that are based on industry publications and reports. This information involves a number of assumptions and limitations, and you are cautioned not to give undue weight to these estimates. We have not independently ver ifi ed the accuracy or completeness of the data contained in these industry publications and reports. The industry in which we operate i s s ubject to a high degree of uncertainty and risk due to variety of factors, including those described in the “Risk Factors” and "Managem ent 's Discussion and Analysis of Financial Condition and Results of Operations" sections of the Company's Annual Report on Form 10 - K f or the year ended December 31, 2017, filed with the SEC on March 19, 2018, Amendment No. 1 to the Company's Annual Report on For m 10 - K for the year ended December 31, 2017 filed with the SEC on June 8, 2018, the Company's Quarterly Report on Form 10 - Q for th e three months ended March 31, 2018 filed with the SEC on May 14, 2018, the Company's Quarterly Report on Form 10 - Q for the three months ended June 30, 2018 filed with the SEC on August 9, 2018 and the Company's Quarterly Report on Form 10 - Q for the three months ended September 30, 2018 filed with the SEC on November 6, 2018. These and other factors could cause results to differ materially from those expressed in these publications and reports.
American Finance Trust, Inc. 17 FORWARD - LOOKING STATEMENTS Certain statements made in this presentation are “forward - looking statements” (as defined in Section 21E of the Exchange Act), w hich reflect the expectations of the Company regarding future events. The forward - looking statements involve a number of risks, uncertainties and other factors that could ca use actual results to differ materially from those contained in the forward - looking statements. Such forward - looking statements include, but are not limited to, market and other e xpectations, objectives, and intentions, as well as any other statements that are not historical facts. Our potential risks and uncertainties are presented in the section titled “Item 1A - Risk Factors” disclosed in our Annual Report on Form 10 - K for the year ended December 31, 2017 filed with the SEC on March 19, 2018, Amendment No. 1 to the Company's Annual Report on Form 10 - K for the year ended Decem ber 31, 2017 filed with the SEC on June 8, 2018, the Company's Quarterly Report on Form 10 - Q for the three months ended March 31, 2018 filed with the SEC on May 14, 201 8, the Company's Quarterly Report on Form 10 - Q for the three months ended June 30, 2018 filed with the SEC on August 9, 2018 and the Company's Quarterly Report on Form 10 - Q for the three months ended September 30, 2018 filed with the SEC on November 6, 2018. We disclaim any obligation to update and revise statements contained in thes e m aterials to reflect changed assumptions, the occurrence of unanticipated events or changes to future operating results over time, unless required by law. The following ar e s ome of the risks and uncertainties relating to us, although not all risks and uncertainties, that could cause our actual results to differ materially from those presented in ou r f orward - looking statements: • All of our executive officers are also officers, managers, employees or holders of a direct or indirect controlling interest in the Advisor or other entities under common control with AR Global Investments, LLC (the successor business to AR Capital, LLC, “AR Global”). As a result, our executive officers , t he Advisor and its affiliates face conflicts of interest, including significant conflicts created by the Advisor’s compensation arrangements with us and other investment pro gra ms advised by affiliates of AR Global and conflicts in allocating time among these entities and us, which could negatively impact our operating results. • The trading price of our Class A common stock may fluctuate and no public market currently exists for shares of our two other cl asses of outstanding stock, our Class B - 1 common stock and our Class B - 2 common stock. • Lincoln Retail REIT Services, LLC (“Lincoln”) and its affiliates, which provide services to the Advisor in connection with ou r r etail portfolio, faces conflicts of interest in allocating its employees’ time between providing real estate - related services to the Advisor and other programs and activities i n which they are presently involved or may be involved in the future. • The performance of our retail portfolio is linked to the market for retail space generally and factors that may impact our re tai l tenants, such as the increasing use of the Internet by retailers and consumers. • Our rental revenue is dependent upon the success and economic viability of our tenants. • We have not generated, and in the future may not generate, operating cash flows sufficient to fund all of the dividends we pa y o ur stockholders, and, as such, we may be forced to fund dividends from other sources, including borrowings, which may not be available on favorable terms, or at all. • We may be unable to pay or maintain cash dividends at the current rate or increase distributions over time. • We are obligated to pay fees, which may be substantial, to the Advisor and its affiliates. • We are subject to risks associated with any dislocation or liquidity disruptions that may exist or occur in the credit market s o f the United States of America. • We may fail to continue to qualify to be treated as a real estate investment trust for U.S. federal income tax purposes (“REI T”) , which would result in higher taxes, may adversely affect our operations and would reduce the value of an investment in our common stock and our cash available for di str ibutions. • We may be deemed by regulators to be an investment company under the Investment Company Act of 1940, as amended (the “Investm ent Company Act”), and thus subject to regulation under the Investment Company Act. • There can be no assurance that executed PSAs or LOIs will be completed on their current terms, or at all.

Confidential – Not for Distribution 18 18 Appendix

American Finance Trust, Inc. 19 DEFINITIONS AFFO : In calculating AFFO, we start with FFO, then we exclude certain income or expense items from AFFO that we consider to be more reflective of investing activities, such as fees related to the Listing, non - cash income and expense items and the income and expense effects of other activities that are not a fundamental attribute of our day to day operating business plan, such as amounts related to the RCA merger litigation . These amounts include legal costs incurred as a result of the litigation, a portion of which may be covered under insurance policies maintained by the Company, which could result in future reimbursements to the Company . Insurance reimbursements in future periods, if any, will be deducted from AFFO in the period of reimbursement . We believe that excluding the litigation costs and any subsequent insurance reimbursements, if any, related to the RCA merger helps to provide a better understanding of the operating performance of our business . Other income and expense items also include early extinguishment of debt and unrealized gains and losses, which may not ultimately be realized, such as gains or losses on derivative instruments and gains and losses on investments . In addition, by excluding non - cash income and expense items such as amortization of above - market and below - market leases intangibles, amortization of deferred financing costs, straight - line rent, vesting and conversion of Class B Units and share - based compensation related to restricted shares and the multi - year outperformance agreement from AFFO, we believe we provide useful information regarding income and expense items which have a direct impact on our ongoing operating performance . By providing AFFO, we believe we are presenting useful information that can be used to better assess the sustainability of our ongoing operating performance without the impacts of transactions that are not related to the ongoing profitability of our portfolio of properties . AFFO presented by us may not be comparable to AFFO reported by other REITs that define AFFO differently . Annualized Straight - Line Rent : Straight line rent which is annualized and calculated using most recent available lease terms as of December 31 , 2018 . Cash Cap Rate : For acquisitions, cash cap rate is a rate of return on a real estate investment property based on the expected, annualized cash rental income during the first year of ownership that the property will generate under its existing lease . For dispositions, cash cap rate is a rate of return based on the annualized cash rental income of the property to be sold . For acquisitions, cash cap rate is calculated by dividing the annualized cash rental income the property will generate (before debt service and depreciation and after fixed costs and variable costs) and the purchase price of the property . For dispositions, cash cap rate is calculated by dividing the annualized cash rental income by the contract sales price for the property . The weighted - average cash cap rate is based upon square feet . Cash NOI : We define Cash NOI as net operating income excluding amortization of above/below market lease intangibles and straight - line adjustments that are included in GAAP lease revenues . Executed Occupancy : Includes occupancy as of December 31 , 2018 as defined above as well as all leases executed by both parties as of December 31 , 2018 that have yet to take possession as of such date . FFO : We define FFO, a non - GAAP measure, consistent with the standards established over time by the Board of Governors of NAREIT, as restated in a White Paper and approved by the Board of Governors of NAREIT effective in December 2018 (the "White Paper") . The White Paper defines FFO as net income or loss computed in accordance with GAAP excluding depreciation and amortization related to real estate, gains and losses from sales of certain real estate assets, gain and losses from change in control and impairment write - downs of certain real estate assets and investments in entities when the impairment is directly attributable to decreases in the value of depreciable real estate held by the entity . Adjustments for unconsolidated partnerships and joint ventures are calculated to exclude the proportionate share of the non - controlling interest to arrive at FFO attributable to stockholders . Our FFO calculation complies with NAREIT's definition . Gross Asset Value : Total assets plus accumulated depreciation and amortization . Investment Grade Rating : Includes both actual investment grade ratings of the tenant or implied investment grade . Implied investment grade includes ratings of tenant parent (regardless of whether or not the parent has guaranteed the tenant’s obligation under the lease) or lease guarantor . Implied investment grade ratings are determined using a proprietary Moody’s analytical tool, which compares the risk metrics of the non - rated company to those of a company with an actual rating . Ratings information is as of January 30 , 2019 . AFIN’s top 10 tenants are 52 % actual investment grade rated and 29 % implied investment grade .

American Finance Trust, Inc. 20 DEFINITIONS (CONTINUED) Leasing Pipeline : Includes (i) all leases fully executed by both parties as of January 31 , 2019 , but after December 31 , 2018 , and (ii) all leases under negotiation with an executed LOI by both parties as of January 31 , 2019 . Leasing pipeline includes 4 new leases totaling approximately 32 , 000 square feet . There can be no assurance that such lease will commence . Leasing pipeline should not be considered an indication of future performance . Liquidity : Represents cash and cash equivalents . Net Debt : Total debt less cash and cash equivalents . Net Debt / Adjusted EBITDA : Represents ratio of net debt as of December 31 , 2018 of $ 1 . 4 billion, which represents an annualization of the Company’s calculation of its earnings before interest, tax, depreciation and amortization (“EBITDA”) for the three months ended December 31 , 2018 . EBITDA is defined as FFO, and then adds back Interest Expense and Acquisition Expenses . Net Leverage : Represents “Net Debt” as defined above divided by “Gross Asset Value” as defined above shown as a percentage . NOI : Defined as a non - GAAP financial measure used by us to evaluate the operating performance of our real estate . NOI is equal to total revenues, excluding contingent purchase price consideration, less property operating and maintenance expense . NOI excludes all other items of expense and income included in the financial statements in calculating net loss . Occupancy : Represents percentage of square footage of which the tenant has taken possession of divided by the respective total rentable square feet as of the date or period end indicated . Rent Escalators : Contractual rent increases include fixed percent or actual increases, or CPI - indexed increases . Annual averages are based on annualized straight - line rent as of December 31 , 2018 . Service Retail : AFIN definition of Service Retail includes single - tenant retail properties leased to tenants in the retail banking, restaurant, grocery, pharmacy, gas/convenience, fitness, and auto services sectors . Public REIT comparable service retail exposure is shown as calculated by Green Street Advisors . Traditional Retail : AFIN definition of Traditional Retail includes single - tenant retail properties leased to tenants in the discount retail, home improvement, furniture, specialty retail, auto retail, and sporting goods sectors . Public REIT comparable traditional retail exposure is shown as calculated by Green Street Advisors . Weighted Average Cap Rate : Weighted average capitalization rate is a rate of return on a real estate investment property based on the expected, annualized straight - lined rental income that the property will generate under its existing lease . Weighted average capitalization rate is calculated by dividing the annualized straight - lined rental income the property will generate (before debt service and depreciation and after fixed costs and variable costs) and the purchase price of the property . The weighted - average capitalization rate is based upon square feet .
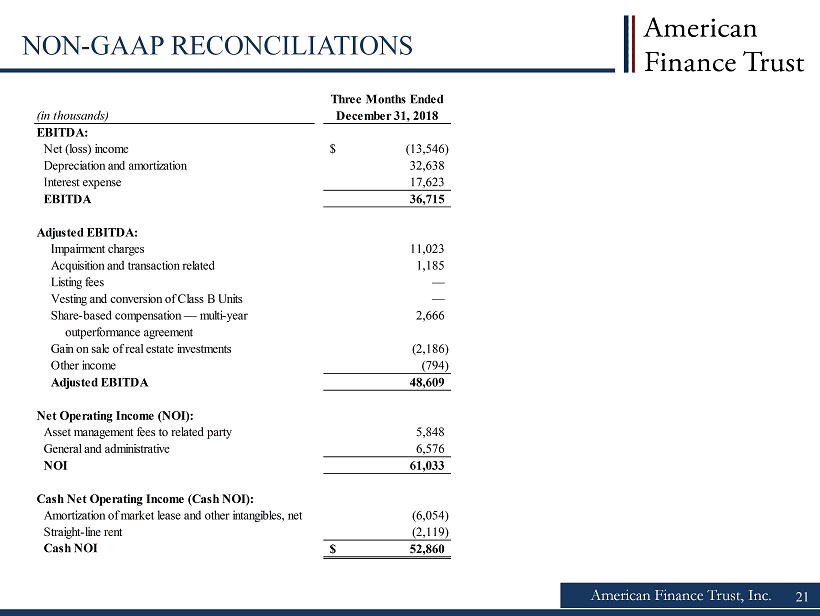
American Finance Trust, Inc. 21 NON - GAAP RECONCILIATIONS (in thousands) Three Months Ended December 31, 2018 EBITDA: Net (loss) income (13,546)$ Depreciation and amortization 32,638 Interest expense 17,623 EBITDA 36,715 Adjusted EBITDA: Impairment charges 11,023 Acquisition and transaction related 1,185 Listing fees — Vesting and conversion of Class B Units — Share-based compensation — multi-year 2,666 outperformance agreement Gain on sale of real estate investments (2,186) Other income (794) Adjusted EBITDA 48,609 Net Operating Income (NOI): Asset management fees to related party 5,848 General and administrative 6,576 NOI 61,033 Cash Net Operating Income (Cash NOI): Amortization of market lease and other intangibles, net (6,054) Straight-line rent (2,119) Cash NOI 52,860$
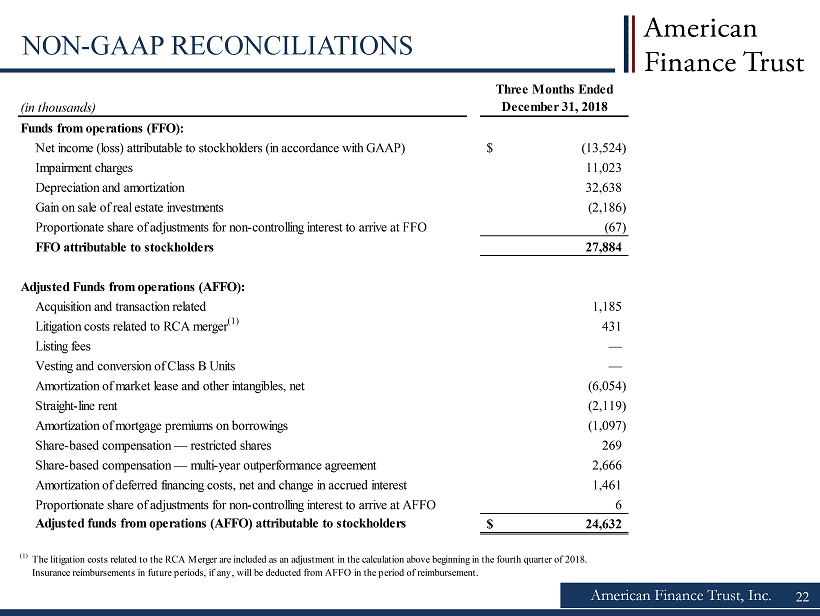
American Finance Trust, Inc. 22 NON - GAAP RECONCILIATIONS (in thousands) Three Months Ended December 31, 2018 Funds from operations (FFO): Net income (loss) attributable to stockholders (in accordance with GAAP) (13,524)$ Impairment charges 11,023 Depreciation and amortization 32,638 Gain on sale of real estate investments (2,186) Proportionate share of adjustments for non-controlling interest to arrive at FFO (67) FFO attributable to stockholders 27,884 Adjusted Funds from operations (AFFO): Acquisition and transaction related 1,185 Litigation costs related to RCA merger (1) 431 Listing fees — Vesting and conversion of Class B Units — Amortization of market lease and other intangibles, net (6,054) Straight-line rent (2,119) Amortization of mortgage premiums on borrowings (1,097) Share-based compensation — restricted shares 269 Share-based compensation — multi-year outperformance agreement 2,666 Amortization of deferred financing costs, net and change in accrued interest 1,461 Proportionate share of adjustments for non-controlling interest to arrive at AFFO 6 Adjusted funds from operations (AFFO) attributable to stockholders 24,632$ (1) The litigation costs related to the RCA Merger are included as an adjustment in the calculation above beginning in the fourth quarter of 2018. Insurance reimbursements in future periods, if any, will be deducted from AFFO in the period of reimbursement.