UNITED STATES
SECURITIES AND EXCHANGE COMMISSION
Washington, D.C. 20549
FORM N-CSR
CERTIFIED SHAREHOLDER REPORT OF REGISTERED
MANAGEMENT INVESTMENT COMPANIES
Investment Company Act file number: 811-22797
FS Global Credit Opportunities Fund—D
(Exact name of registrant as specified in charter)
| | |
201 Rouse Boulevard Philadelphia, Pennsylvania | | 19112 |
| (Address of principal executive offices) | | (Zip code) |
Michael C. Forman
FS Global Credit Opportunities Fund—D
201 Rouse Boulevard
Philadelphia, Pennsylvania 19112
(Name and address of agent for service)
Registrant’s telephone number, including area code: (215) 495-1150
Date of fiscal year end: December 31
Date of reporting period: June 30, 2016
| Item 1. | Reports to Stockholders. |
The semi-annual report (the “Semi-Annual Report”) of FS Global Credit Opportunities Fund—D (the “Company”) for the six months ended June 30, 2016 transmitted to shareholders pursuant to Rule 30e-1 promulgated under the Investment Company Act of 1940, as amended (the “1940 Act”), is as follows:
2016
SEMI-ANNUAL REPORT
FS GLOBAL CREDIT OPPORTUNITIES FUND–D
An alternative approach
to global credit investing
from FS Investments
FS GLOBAL CREDIT
OPPORTUNITIES FUND

Michael C. Forman
CHAIRMAN & CHIEF EXECUTIVE OFFICER
FS GLOBAL CREDIT OPPORTUNITIES FUND
THE CREDIT MARKET RALLY LED TO MEANINGFUL PORTFOLIO APPRECIATION AND SERVES AS A PROOF-OF-CONCEPT OF FSGCO’S NON-TRADED, CLOSED-END FUND STRUCTURE.
Fellow Shareholder,
After a turbulent start to the year, investor appetite for corporate credit improved notably in the first half of 2016. The snapback represented a significant turnaround from January and February when investor concerns about a potential China slowdown and declining commodity prices put a damper on markets. Since then, investor sentiment has improved on the back of encouraging U.S. economic data, ongoing central bank accommodation and easing global growth concerns. Given FS Global Credit Opportunities Fund’s (the “Fund”) value-based approach to credit investing, the credit market decline and subsequent rally led to meaningful portfolio appreciation and serves as a proof-of-concept of the Fund’s non-traded, closed-end fund structure.
The first half of 2016 brought yet another major reset in global interest rates, with more than $13 trillion of negative-yielding sovereign bonds continuing to drive the global search for yield.1 With U.S. corporate fundamentals remaining generally strong and economic growth stable, credit market returns reflected rising investor optimism and the growing need for income producing assets following the declines sustained in 2015.
As of June 30, 2016, high yield bonds and senior secured loans had generated year-to-date returns of 9.3% and 4.2%, respectively.2,3 The value-oriented areas of the market also benefited from a rebound in investor sentiment, with value-oriented high yield bonds and value-oriented senior secured loans returning approximately 21.6% and 8.3%, respectively, in the second quarter.4,5
Toward the end of June, Britain’s decision to exit the European Union injected a fresh bout of volatility into the markets. While the impact on the U.S. corporate credit markets appears to be well contained, we believe the financial market volatility seen in the immediate aftermath of the decision underscores the potential for further credit market volatility ahead. We remain confident that FSGCO’s long-term, unlisted closed-end fund structure will allow it to manage through any such market uncertainty and capitalize on investment opportunities that may result from future market dislocations.
FOR THE SIX MONTHS ENDED JUNE 30, 2016, FUND–A AND FUND–D EACH GENERATED A SHAREHOLDER RETURN OF 8.0% AND PAID DISTRIBUTIONS OF APPROXIMATELY $0.43 PER COMMON SHARE.6,7
A REVIEW OF 1H 2016
Given the Fund’s focus on investing in value-based credit strategies, such as event-driven opportunities, special situations and market-price inefficiencies, we expect that over the long term the Fund generally should provide total returns that are largely uncorrelated to events in the broader economy. FS Global Credit Opportunities Fund–A (Fund–A) and FS Global Credit Opportunities Fund–D (Fund–D and, together with Fund–A, the Companies) each generated a shareholder return of 8.8% during the second quarter, outperforming the high yield bond and senior secured loan indices, as well as value-oriented senior secured loans.2,3,5,6 For the six months ended June 30, 2016, Fund–A and Fund–D each generated a shareholder return of 8.0%.6
Fund–A and Fund–D each paid distributions of approximately $0.43 per common share during the first half of 2016.7
The largest positive contributors to the Fund’s first half performance were a market-price inefficiency opportunity and an event-driven investment. A market-price inefficiency opportunity is an investment made in a security that trades below what the Fund believes to be its intrinsic value. Event-driven investments seek to capitalize on market dislocations resulting from specific corporate events, such as mergers, corporate reorganizations or debt maturities that are expected to impact the value of a company’s securities.
Regarding the market-price inefficiency investment, the Fund invested in the senior secured debt of Aspect Software, a provider of call center software, which traded at a significant discount to face value. Subsequently, the Fund’s position appreciated meaningfully following the completion of a restructuring of the company’s balance sheet that reduced debt and infused additional capital to facilitate growth. Regarding the event-driven investment, the Fund purchased senior debt in U.S. retailer Toys “R” Us during the first quarter based on the view that the company is engaged in a meaningful turnaround of its business and poised to grow both sales and margins over the next two years. The Fund’s position rose after the company reported better-than-expected fourth quarter 2015 earnings and forecast a rise in 2016 cash flows.
Key negative contributors to the Fund’s performance in the second quarter included a special situation investment in Origami Owl, a lifestyle jewelry company, that saw a year-over-year decline in sales, and a market-price inefficiency investment in grocery retailer Fairway Group that is currently undergoing a restructuring. The Fund is cautiously optimistic that Origami Owl is currently taking the necessary steps to improve its business and believes that its senior position in Fairway Group will allow it to potentially influence the restructuring process in order to maximize the company’s long-term value.
Finally, in the second quarter, Fund–A and Fund–D closed their continuous public offerings to new investors and we commenced the continuous public offerings of FS Global Credit Opportunities Fund–T (Fund–T) and FS Global Credit Opportunities Fund–ADV (Fund–ADV). We believe that the offerings of Fund–T and Fund–ADV will provide flexibility for both advisors and investors utilizing both qualified and non-qualified accounts.

VOLATILITY IN THE CREDIT MARKETS OVER THE PAST SEVERAL QUARTERS HAS CREATED ATTRACTIVE RISK-ADJUSTED OPPORTUNITIES FOR THOSE WITH THE PATIENCE, EXPERIENCE AND LIQUIDITY TO CAPITALIZE ON THEM.
TRENDS AND OPPORTUNITIES
Looking forward to the second half of 2016, we believe there are several specific trends in the current investing environment that are beneficial to the Fund’s long-term strategy. Volatility in the credit markets over the past several quarters has created attractive risk-adjusted opportunities for those with the patience, experience and liquidity to capitalize on them. Despite a meaningful rally in high yield bond and senior secured loan prices since the beginning of 2016, high yield bond and senior secured loan yields remained meaningfully above their long-term averages as of June 30, 2016.2,3 At the same time, slow but stable economic growth remains generally supportive of U.S. corporations.
We anticipate generally low levels of secondary market liquidity will continue to give rise to short-term price swings and we will seek to capitalize on any dislocations that arise in the credit markets to invest in assets we believe are undervalued. We believe that the long-term nature of the Fund’s strategy and the benefits of its unlisted, continuously offered closed-end fund structure position the Fund to generate attractive total returns, consisting of a high level of current income and capital appreciation, for its shareholders over the long term.
We look forward to an exciting second half of 2016. Thank you for your continued support and trust in us.
Sincerely,
MICHAEL C. FORMAN
Chairman & Chief Executive Officer
FS Global Credit Opportunities Fund
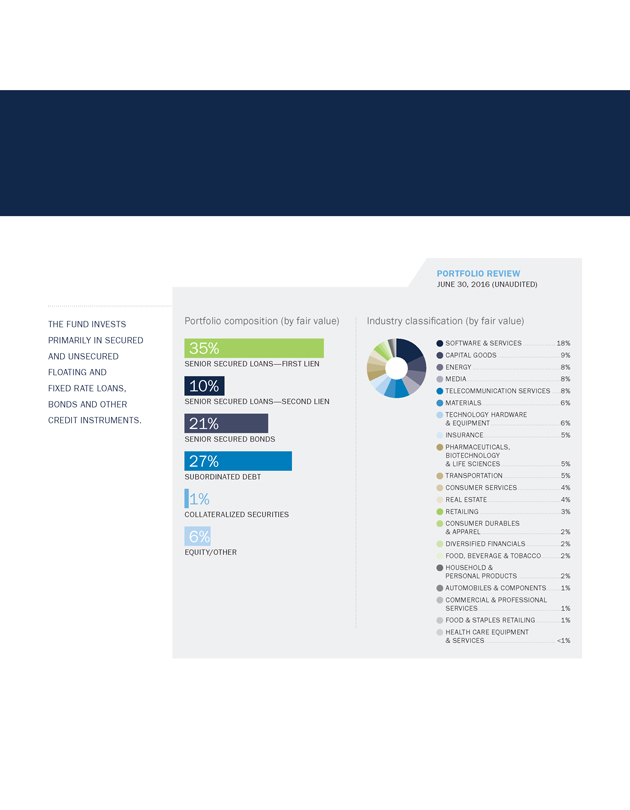
THE FUND INVESTS PRIMARILY IN SECURED AND UNSECURED FLOATING AND FIXED RATE LOANS, BONDS AND OTHER CREDIT INSTRUMENTS.
PORTFOLIO REVIEW
JUNE 30, 2016 (UNAUDITED)
Portfolio composition (by fair value)
35%
SENIOR SECURED LOANS—FIRST LIEN
10%
SENIOR SECURED LOANS—SECOND LIEN
21%
SENIOR SECURED BONDS
27%
SUBORDINATED DEBT
1%
COLLATERALIZED SECURITIES
6%
EQUITY/OTHER
Industry classification (by fair value)
SOFTWARE & SERVICES 18%
CAPITAL GOODS 9%
ENERGY 8%
MEDIA 8%
TELECOMMUNICATION SERVICES 8%
MATERIALS 6%
TECHNOLOGY HARDWARE & EQUIPMENT 6%
INSURANCE 5%
PHARMACEUTICALS, BIOTECHNOLOGY & LIFE SCIENCES 5%
TRANSPORTATION 5%
CONSUMER SERVICES 4%
REAL ESTATE 4%
RETAILING 3%
CONSUMER DURABLES & APPAREL 2%
DIVERSIFIED FINANCIALS 2%
FOOD, BEVERAGE & TOBACCO 2%
HOUSEHOLD & PERSONAL PRODUCTS 2%
AUTOMOBILES & COMPONENTS 1%
COMMERCIAL & PROFESSIONAL SERVICES 1%
FOOD & STAPLES RETAILING 1%
HEALTH CARE EQUIPMENT & SERVICES <1%

1 Credit Suisse, CS Credit Strategy Daily Comment, June 30, 2016.
2 Bank of America Merrill Lynch High Yield Master II Index. Past performance should not be relied upon as being indicative of future results.
3 Credit Suisse Leveraged Loan Index. Past performance should not be relied upon as being indicative of future results.
4 Value-oriented high yield bonds are represented by the Bank of America Merrill Lynch U.S. High Yield Distressed Index, which is a subset of the Bank of America Merrill Lynch U.S. High Yield Master II Index that includes all high yield bonds that trade with a spread over U.S. Treasuries greater than or equal to 10%.
5 Value-oriented loans are represented by the Credit Suisse Distressed Loan Index, which is a subset of the Credit Suisse Leveraged Loan Index that contains only loan facilities that trade at a price of 90% or below.
6 Shareholder returns shown are the total returns an investor received for the period taking into account all distributions paid during such period, compounded monthly. The calculation assumes that the investor purchased shares at Fund–A’s or Fund–D’s public offering price, excluding selling commissions and dealer manager fees, if applicable, at the beginning of the applicable period and reinvested all cash distributions pursuant to Fund–A’s or Fund–D’s distribution reinvestment plan (DRP). Valuation as of the end of each period is the repurchase price pursuant to Fund–A’s or Fund–D’s share repurchase program on such date. Shareholder returns do not include selling commissions and dealer manager fees, which could have totaled up to 8% of Fund–A’s public offering price. Had such selling commissions and dealer manager fees been included, performance would be lower. Upon liquidation or redemption, market conditions may cause the actual values to be more or less than the values shown.
7 The distributions described herein were funded in significant part by the reimbursement of certain expenses, including through the waiver of investment advisory fees payable by the Fund, and additional support payments that may be subject to repayment to the Companies’ and the Fund’s affiliate, Franklin Square Holdings, L.P. (“FS Investments”), and the Companies’ and the Fund’s future distributions may be funded from such waivers, reimbursements and payments. Significant portions of these distributions were not based on the Fund’s investment performance and such waivers, reimbursements and payments by FS Investments may not continue in the future. If FS Investments had not agreed to reimburse certain of the Companies’ expenses, including through the waiver of certain advisory fees, and make additional support payments, significant portions of these distributions would have come from offering proceeds or borrowings. The repayment of amounts owed to FS Investments will reduce the future distributions to which investors would otherwise be entitled. The payment of future distributions on the Companies’ common shares is subject to the discretion of their boards of trustees and applicable legal restrictions and, therefore, there can be no assurance as to the amount or timing of any such future distributions.

FS Global Credit Opportunities Fund
OFFICERS AND BOARD OF TRUSTEES
Officers
MICHAEL C. FORMAN
Chairman & Chief Executive Officer
WILLIAM GOEBEL
Chief Financial Officer
GERALD F. STAHLECKER
Executive Vice President
ZACHARY KLEHR
Executive Vice President
STEPHEN S. SYPHERD
Vice President, Treasurer & Secretary
JAMES F. VOLK
Chief Compliance Officer
Board of Trustees
MICHAEL C. FORMAN
Chairman & Chief Executive Officer
DAVID J. ADELMAN Vice-Chairman
President & Chief Executive Officer,
Campus Apartments, Inc.
THOMAS J. GRAVINA
Trustee
Executive Chairman, GPX Enterprises, L.P.
WALTER W. BUCKLEY, III
Trustee
Chairman & Chief Executive Officer,
Actua Corporation
BARBARA J. FOUSS
Trustee
Former Director of Strategic Initiatives & Chief
Credit Policy Officer, Sun National Bank
DAVID L. COHEN
Trustee
Senior Executive Vice President,
Comcast Corporation
PHILIP E. HUGHES, JR.
Trustee
Vice-Chairman of Keystone Industries
OLIVER C. MITCHELL, JR.
Trustee
Attorney & Consultant
CHARLES P. PIZZI
Trustee
Retired President, Director & Chief Executive
Officer, Tasty Baking Company
TABLE OF CONTENTS
FS Global Credit Opportunities Fund—D
Unaudited Statement of Assets and Liabilities
(in thousands, except share and per share amounts)
| | | | |
| | | June 30, 2016 | |
Assets | | | | |
Investment in FS Global Credit Opportunities Fund, at fair value (cost—$226,323) | | $ | 190,014 | |
Cash | | | 704 | |
Distributions receivable from FS Global Credit Opportunities Fund | | | 102 | |
Expense reimbursement and additional support payment due from sponsor(1) | | | 492 | |
| | | | |
Total assets | | $ | 191,312 | |
| | | | |
Liabilities | | | | |
Shareholder distributions payable | | $ | 126 | |
Payable for investment purchased | | | 748 | |
Administrative services expense payable | | | 2 | |
Transfer agent fees payable | | | 22 | |
Professional fees payable | | | 4 | |
Accounting and administrative fees payable | | | 13 | |
Other accrued expenses and liabilities | | | 17 | |
| | | | |
Total liabilities | | $ | 932 | |
| | | | |
Net assets | | $ | 190,380 | |
| | | | |
Commitments and contingencies—($261)(2) | | | | |
| |
Composition of net assets | | | | |
Common shares, $0.001 par value, unlimited shares authorized, 26,287,093 shares issued and outstanding | | $ | 26 | |
Capital in excess of par value | | | 226,663 | |
Accumulated net investment income(3) | | | — | |
Net unrealized appreciation (depreciation) on investment | | | (36,309 | ) |
| | | | |
Net assets | | $ | 190,380 | |
| | | | |
Net asset value per common share at period end | | $ | 7.24 | |
| (1) | See Note 4 for a discussion of reimbursements and other amounts payable to FS Global Credit Opportunities Fund—D (the “Company”) by its sponsor and affiliates. |
| (2) | See Note 6 for a discussion of the Company’s commitments and contingencies. |
| (3) | See Note 5 for a discussion of the sources of distributions declared by the Company. |
See notes to unaudited financial statements.
1
FS Global Credit Opportunities Fund—D
Unaudited Statement of Operations
(in thousands)
| | | | |
| | | Six Months Ended
June 30, 2016 | |
Investment income | | | | |
Distributions from FS Global Credit Opportunities Fund | | $ | 9,888 | |
| | | | |
Total investment income | | | 9,888 | |
| | | | |
Operating expenses | | | | |
Administrative services expenses | | | 26 | |
Transfer agent fees | | | 82 | |
Accounting and administrative fees | | | 24 | |
Professional fees | | | 18 | |
Printing fees | | | 101 | |
Offering costs | | | 458 | |
Other general and administrative expenses | | | 10 | |
| | | | |
Total operating expenses | | | 719 | |
Less: Expense reimbursement from sponsor(1) | | | (261 | ) |
| | | | |
Net operating expenses | | | 458 | |
| | | | |
Net investment income (loss) | | | 9,430 | |
| | | | |
Realized and unrealized gain/loss from FS Global Credit Opportunities Fund | | | | |
Net realized gain (loss) on investment | | | — | |
Net change in unrealized appreciation (depreciation) on investment | | | 5,734 | |
| | | | |
Total net realized gain (loss) and unrealized appreciation (depreciation) on investment | | | 5,734 | |
Additional support payment from sponsor(1) | | | 406 | |
| | | | |
Net increase (decrease) in net assets resulting from operations | | $ | 15,570 | |
| | | | |
| (1) | See Note 4 for a discussion of reimbursements and other amounts paid to the Company by its sponsor and affiliates. |
See notes to unaudited financial statements.
2
FS Global Credit Opportunities Fund—D
Statements of Changes in Net Assets
(in thousands)
| | | | | | | | |
| | | Six Months Ended
June 30, 2016
(Unaudited) | | | Year Ended
December 31, 2015 | |
Operations | | | | | | | | |
Net investment income (loss) | | $ | 9,430 | | | $ | 13,983 | |
Net realized gain (loss) on investment | | | — | | | | — | |
Net change in unrealized appreciation (depreciation) on investment | | | 5,734 | | | | (32,599 | ) |
Net increase from additional support payment from sponsor(1) | | | 406 | | | | 40 | |
| | | | | | | | |
Net increase (decrease) in net assets resulting from operations | | | 15,570 | | | | (18,576 | ) |
| | | | | | | | |
Shareholder distributions(2) | | | | | | | | |
Distributions from net investment income | | | (10,294 | ) | | | (14,023 | ) |
| | | | | | | | |
Net decrease in net assets resulting from shareholder distributions | | | (10,294 | ) | | | (14,023 | ) |
| | | | | | | | |
Capital share transactions | | | | | | | | |
Issuance of common shares(3) | | | 30,539 | | | | 78,774 | |
Reinvestment of shareholder distributions(3) | | | 6,401 | | | | 8,522 | |
Repurchases of common shares | | | (1,860 | ) | | | (1,054 | ) |
Reimbursement of sponsor(4) | | | — | | | | (758 | ) |
Capital contributions of sponsor(1) | | | — | | | | 703 | |
Offering costs | | | — | | | | (703 | ) |
| | | | | | | | |
Net increase in net assets resulting from capital share transactions | | | 35,080 | | | | 85,484 | |
| | | | | | | | |
Total increase in net assets | | | 40,356 | | | | 52,885 | |
Net assets at beginning of period | | | 150,024 | | | | 97,139 | |
| | | | | | | | |
Net assets at end of period | | $ | 190,380 | | | $ | 150,024 | |
| | | | | | | | |
Accumulated net investment income(2) | | $ | — | | | $ | — | |
| | | | | | | | |
| (1) | See Note 4 for a discussion of reimbursements and other amounts paid to the Company by its sponsor and affiliates. |
| (2) | See Note 5 for a discussion of the sources of distributions declared by the Company. |
| (3) | See Note 3 for a discussion of transactions with respect to the Company’s common shares during the six months ended June 30, 2016 and the year ended December 31, 2015. |
| (4) | See Note 4 for a discussion of reimbursements paid by the Company to its sponsor and affiliates. |
See notes to unaudited financial statements.
3
FS Global Credit Opportunities Fund—D
Unaudited Statement of Cash Flows
(in thousands)
| | | | |
| | | Six Months Ended
June 30, 2016 | |
Cash flows from operating activities | | | | |
Net increase (decrease) in net assets resulting from operations | | $ | 15,570 | |
Adjustments to reconcile net increase (decrease) in net assets resulting from operations to net cash used in operating activities: | | | | |
Purchases of common shares of FS Global Credit Opportunities Fund | | | (34,289 | ) |
Net change in unrealized (appreciation) depreciation on investment | | | (5,734 | ) |
(Increase) decrease in distributions receivable from FS Global Credit Opportunities Fund | | | (1 | ) |
(Increase) decrease in expense reimbursement and additional support payment due from sponsor(1) | | | (350 | ) |
Increase (decrease) in payable for investment purchased | | | (1,217 | ) |
Increase (decrease) in administrative services expense payable | | | (10 | ) |
Increase (decrease) in transfer agent fees payable | | | 11 | |
Increase (decrease) in professional fees payable | | | (67 | ) |
Increase (decrease) in accounting and administrative fees payable | | | 1 | |
| | | | |
Net cash used in operating activities | | | (26,086 | ) |
| | | | |
Cash flow from financing activities | | | | |
Issuance of common shares | | | 31,474 | |
Reinvestment of shareholder distributions | | | 6,401 | |
Repurchases of common shares | | | (1,860 | ) |
Shareholder distributions | | | (10,269 | ) |
| | | | |
Net cash provided by financing activities | | | 25,746 | |
| | | | |
Total increase in cash | | | (340 | ) |
Cash at beginning of period | | | 1,044 | |
| | | | |
Cash at end of period | | $ | 704 | |
| | | | |
| (1) | See Note 4 for a discussion of reimbursements and other amounts payable to the Company by its sponsor and affiliates. |
See notes to unaudited financial statements.
4
FS Global Credit Opportunities Fund—D
Financial Highlights
(in thousands, except share and per share amounts)
| | | | | | | | | | | | | | | | |
| | | Six Months Ended
June 30, 2016
(Unaudited) | | | Year Ended
December 31, 2015 | | | Year Ended
December 31, 2014 | | | Period from
January 28, 2013
(Inception) to
December 31, 2013 | |
Per Share Data:(1) | | | | | | | | | | | | | | | | |
Net asset value, beginning of period | | $ | 7.08 | | | $ | 8.91 | | | $ | 10.02 | | | $ | 10.00 | |
Results of operations | | | | | | | | | | | | | | | | |
Net investment income (loss)(2) | | | 0.40 | | | | 0.87 | | | | 0.87 | | | | 0.02 | |
Net realized gain (loss) and unrealized appreciation (depreciation) on investment | | | 0.19 | | | | (1.78 | ) | | | (1.11 | ) | | | 0.01 | |
| | | | | | | | | | | | | | | | |
Net increase (decrease) in net assets resulting from operations | | | 0.59 | | | | (0.91 | ) | | | (0.24 | ) | | | 0.03 | |
| | | | | | | | | | | | | | | | |
Shareholder distributions(3) | | | | | | | | | | | | | | | | |
Distributions from net investment income | | | (0.43 | ) | | | (0.87 | ) | | | (0.87 | ) | | | (0.05 | ) |
| | | | | | | | | | | | | | | | |
Net decrease in net assets resulting from shareholder distributions | | | (0.43 | ) | | | (0.87 | ) | | | (0.87 | ) | | | (0.05 | ) |
| | | | | | | | | | | | | | | | |
Capital share transactions(2) | | | | | | | | | | | | | | | | |
Reimbursement of sponsor(4) | | | — | | | | (0.05 | ) | | | — | | | | — | |
Offering costs | | | — | | | | (0.04 | ) | | | (0.11 | ) | | | (2.35 | ) |
Capital contributions of sponsor(5) | | | — | | | | 0.04 | | | | 0.11 | | | | 2.39 | |
| | | | | | | | | | | | | | | | |
Net increase in net assets resulting from capital share transactions | | | — | | | | (0.05 | ) | | | — | | | | 0.04 | |
| | | | | | | | | | | | | | | | |
Net asset value, end of period | | $ | 7.24 | | | $ | 7.08 | | | $ | 8.91 | | | $ | 10.02 | |
| | | | | | | | | | | | | | | | |
Shares outstanding, end of period | | | 26,287,093 | | | | 21,201,113 | | | | 10,906,827 | | | | 634,000 | |
| | | | | | | | | | | | | | | | |
Total return(6)(7) | | | 8.84 | % | | | (11.72 | )% | | | (2.94 | )% | | | 0.65 | % |
| | | | | | | | | | | | | | | | |
Ratio/Supplemental Data: | | | | | | | | | | | | | | | | |
Net assets, end of period | | $ | 190,380 | | | $ | 150,024 | | | $ | 97,139 | | | $ | 6,350 | |
| | | | | | | | | | | | | | | | |
Ratio of net investment income (loss) to average net assets(8)(9) | | | 5.73 | % | | | 10.51 | % | | | 9.01 | % | | | 2.88 | % |
| | | | | | | | | | | | | | | | |
Ratio of total operating expenses to average net assets(8) | | | 0.44 | % | | | 0.31 | % | | | 0.45 | % | | | 8.92 | % |
Ratio of expense reimbursement from sponsor to average net assets(8) | | | (0.16 | )% | | | (0.31 | )% | | | (0.45 | )% | | | (2.59 | )% |
| | | | | | | | | | | | | | | | |
Ratio of net operating expenses to average net assets(8) | | | 0.28 | % | | | — | % | | | — | % | | | 6.33 | % |
| | | | | | | | | | | | | | | | |
Portfolio turnover of FS Global Credit Opportunities Fund(7) | | | 51.10 | % | | | 124.78 | % | | | 165.25 | % | | | — | |
| | | | | | | | | | | | | | | | |
| (1) | Per share data may be rounded in order to compute the ending net asset value per share. |
| (2) | The per share data was derived by using the average number of common shares outstanding during the applicable period. |
| (3) | The per share data for distributions reflects the actual amount of distributions declared per common share during the applicable period. |
See notes to unaudited financial statements.
5
FS Global Credit Opportunities Fund—D
Financial Highlights (continued)
(in thousands, except share and per share amounts)
| (4) | See Note 4 for a discussion of reimbursements paid by the Company to its sponsor and affiliates. |
| (5) | See Note 4 for a discussion of reimbursements and other amounts paid to the Company by its sponsor and affiliates. |
| (6) | The total return for each period presented is historical and is calculated by determining the percentage change in net asset value, assuming the reinvestment of all distributions in additional common shares of the Company at the Company’s net asset value per share as of the share closing date occurring on or immediately following the distribution payment date. The total return does not consider the effect of the sales load from the sale of the Company’s common shares. The historical calculation of total return in the table should not be considered a representation of the Company’s future total return, which may be greater or less than the total return shown in the table due to a number of factors, including, among others, FS Global Credit Opportunities Fund’s (the “Fund”) ability or inability to make investments that meet its investment criteria, the interest rates payable on the debt securities the Fund acquires, the level of the Fund’s expenses, variations in and the timing of the recognition of realized and unrealized gains or losses, the degree to which the Fund encounters competition in its markets and general economic conditions. As a result of these and other factors, results for any previous period should not be relied upon as being indicative of performance in future periods. The total return calculations set forth above represent the total return on the Company’s investment in the Fund during the applicable period and do not represent an actual return to shareholders. |
| (7) | Data for periods of less than one year are not annualized. |
| (8) | Average daily net assets for the applicable period is used for this calculation. Does not reflect the proportionate share of income and expenses accrued by the Fund. The period from January 28, 2013 (Inception) to December 31, 2013 is annualized. The six months ended June 30, 2016 is not annualized. |
| (9) | Had the sponsor not reimbursed certain operating expenses and made additional support payments, the ratio of net investment income (loss) to average net assets would have been 5.57%, 10.20%, 8.56% and 0.29% for the six months ended June 30, 2016, the years ended December 31, 2015 and 2014 and the period from January 28, 2013 (Inception) to December 31, 2013, respectively. |
See notes to unaudited financial statements.
6
FS Global Credit Opportunities Fund—D
Notes to Unaudited Financial Statements
(in thousands, except share and per share amounts)
Note 1. Principal Business and Organization
FS Global Credit Opportunities Fund—D, or the Company, was organized as a Delaware statutory trust on January 28, 2013. The Company’s primary investment objective is to generate an attractive total return consisting of a high level of current income and capital appreciation, with a secondary objective of capital preservation. The Company invests substantially all of its net assets in FS Global Credit Opportunities Fund, or the Fund. The investment objectives and strategies of the Fund are identical to the Company’s. The Company’s unaudited financial statements should be read in conjunction with the attached unaudited consolidated financial statements of the Fund. As of June 30, 2016, the Company held approximately 16.1% of the outstanding common shares of the Fund.
The Company commenced investment operations on December 12, 2013, when the Company, together with FS Global Credit Opportunities Fund—A, or Fund—A, another investment company registered under the Investment Company Act of 1940, as amended, or the 1940 Act, whose principal investment strategy is identical to the Company’s and which also invests substantially all of its assets in the Fund, collectively raised net offering proceeds of $2,500 in the aggregate, or the minimum offering requirement, from the sale of common shares in their continuous public offerings to persons who were not affiliated with the Company, Fund—A, the Fund, the Fund’s investment adviser, FS Global Advisor, LLC, or FS Global Advisor, or the investment sub-adviser to FS Global Advisor, GSO Capital Partners LP, or GSO. FS Global Advisor is a private investment firm that is registered as an investment adviser under the Investment Advisers Act of 1940, as amended, and an affiliate of the Company’s sponsor, Franklin Square Holdings, L.P., or Franklin Square Holdings.
The Company is a non-diversified, closed-end management investment company registered under the 1940 Act that has elected to be treated for U.S. federal income tax purposes, and intends to qualify annually, as a regulated investment company, or RIC, under Subchapter M of the Internal Revenue Code of 1986, as amended, or the Code.
Note 2. Summary of Significant Accounting Policies
Basis of Presentation: The accompanying unaudited financial statements of the Company have been prepared in accordance with U.S. generally accepted accounting principles, or GAAP, for interim financial information. Accordingly, they do not include all of the information and footnotes required by GAAP for complete financial statements. In the opinion of management, all adjustments (consisting of normal recurring accruals) considered necessary for a fair presentation have been included. For a more complete discussion of significant accounting policies and certain other information, the Company’s unaudited financial statements should be read in conjunction with its audited financial statements as of and for the year ended December 31, 2015 included in the Company’s certified shareholder report on Form N-CSR. Operating results for the six months ended June 30, 2016 are not necessarily indicative of the results that may be expected for the year ending December 31, 2016. The Company is considered an investment company under GAAP and follows the accounting and reporting guidance applicable to investment companies. The Company has evaluated the impact of subsequent events through the date the unaudited financial statements were issued and filed with the U.S. Securities and Exchange Commission, or the SEC.
Investment in the Fund: The Company’s investment in the Fund is recorded at fair value and is based upon the Company’s percentage ownership of the common shares of the Fund. The performance of the Company is directly affected by the performance of the Fund.
7
FS Global Credit Opportunities Fund—D
Notes to Unaudited Financial Statements (continued)
(in thousands, except share and per share amounts)
Note 2. Summary of Significant Accounting Policies (continued)
Use of Estimates: The preparation of the Company’s unaudited financial statements in conformity with GAAP requires management to make estimates and assumptions that affect the reported amounts of assets and liabilities, and disclosure of contingent assets and liabilities, at the date of the unaudited financial statements and the reported amounts of revenues and expenses during the reporting period. Actual results could differ from those estimates. Many of the amounts have been rounded and all amounts are in thousands, except share and per share amounts.
Cash and Cash Equivalents: The Company considers all highly liquid investments with original maturities of three months or less to be cash equivalents. The Company’s cash and cash equivalents are maintained with high credit quality financial institutions.
Valuation of Portfolio Investment: The Company invests substantially all of its net assets in the Fund. As such, the Company determines the net asset value, or NAV, of its common shares of beneficial interest, par value $0.001 per share, or its common shares, daily based on the NAV of its interest in the Fund (as provided by the Fund). The Company calculates NAV per common share by subtracting liabilities (including accrued expenses and distributions) from the total assets of the Company (the value of its interest in the Fund, plus cash and other assets, including interest and distributions accrued but not yet received) and dividing the result by the total number of its outstanding common shares. The Company’s investment in the Fund is considered Level 3 as defined under fair value accounting standards. See Note 2 to the Fund’s unaudited consolidated financial statements attached hereto for detailed information on the Fund’s policies regarding the valuation of its portfolio investments.
Revenue Recognition: Realized gains and losses from Fund transactions are calculated on the specific share identification basis. Fund transactions are recorded on the effective date of the subscription in or the redemption from the Fund. Distributions received from the Fund are recorded on the record date.
Offering Costs: The Company’s offering costs included, among other things, legal fees and other costs pertaining to the preparation of the Company’s Registration Statement on Form N-2 relating to the continuous public offering of its common shares. Historically, the Company charged offering costs against capital in excess of par value on its financial statements. Following discussions with the Staff of the Division of Investment Management of the SEC, the Company determined to change its accounting treatment of offering costs and defer and amortize such costs as an expense over twelve months. The Company evaluated this change in accounting treatment of offering costs, which it implemented effective January 1, 2016, and determined that it did not have a material impact on the Company’s financial position, results of operations or cash flows (see Note 4). On April 27, 2016 the Company closed its offering to new investors. Upon the closing of the Company’s continuous public offering, all deferred offering costs that had not been amortized were expensed.
Income Taxes: The Company has elected to be treated for U.S. federal income tax purposes, and intends to qualify annually, as a RIC under Subchapter M of the Code. Because the Company invests substantially all of its net assets in the Fund, the Company will generally qualify as a RIC if the Fund qualifies as a RIC. To qualify and maintain qualification as a RIC, the Company and the Fund must, among other things, meet certain source-of-income and asset diversification requirements and distribute to their respective shareholders, for each taxable year, at least 90% of their “investment company taxable income” and their net tax-exempt interest income. In general, a RIC’s “investment company taxable income” for any taxable year is its taxable income, determined without regard to net capital gains and with certain other adjustments. As a RIC, the Company will not have to
8
FS Global Credit Opportunities Fund—D
Notes to Unaudited Financial Statements (continued)
(in thousands, except share and per share amounts)
Note 2. Summary of Significant Accounting Policies (continued)
pay corporate-level U.S. federal income taxes on any income that it distributes to its shareholders. The Company and the Fund intend to distribute all or substantially all of their “investment company taxable income,” net tax-exempt interest income (if any) and net capital gains on an annual basis in order to maintain their RIC status each year and to avoid any U.S. federal income taxes on income so distributed. The Company also will be subject to nondeductible U.S. federal excise taxes if it does not distribute at least 98% of its net ordinary income, 98.2% of net capital gain income, if any, and any recognized and undistributed income from prior years for which it paid no U.S. federal income taxes.
Uncertainty in Income Taxes: The Company evaluates its tax positions to determine if the tax positions taken meet the minimum recognition threshold in connection with accounting for uncertainties in income tax positions taken or expected to be taken for the purposes of measuring and recognizing tax benefits or liabilities in the Company’s financial statements. Recognition of a tax benefit or liability with respect to an uncertain tax position is required only when the position is “more likely than not” to be sustained assuming examination by taxing authorities. The Company recognizes interest and penalties, if any, related to unrecognized tax liabilities as income tax expense on its statement of operations. During the six months ended June 30, 2016, the Company did not incur any interest or penalties.
The Company has analyzed the tax positions taken on U.S. federal and state income tax returns for all open tax years, and has concluded that no provision for income tax is required in the Company’s financial statements. The Company’s U.S. federal and state income and U.S. federal excise tax returns for tax years for which the applicable statutes of limitations have not yet expired are subject to examination by the Internal Revenue Service and state departments of revenue.
Distributions: Distributions to the Company’s shareholders are recorded as of the record date. Subject to the discretion of the Company’s board of trustees, or the Board, and applicable legal restrictions, the Company intends to authorize and declare ordinary cash distributions on a weekly, semi-monthly or monthly basis and to pay such distributions on a monthly or quarterly basis. Such ordinary cash distributions are expected to be paid using ordinary cash distributions received from the Fund, net of any Company operating expenses. At least annually, the Company intends to authorize and declare special cash distributions of net realized long-term capital gains, if any, and any other income, gains and dividends and other distributions not previously distributed. Such special cash distributions are expected to be paid using special cash distributions received from the Fund.
Note 3. Share Transactions
Below is a summary of transactions with respect to the Company’s common shares during the six months ended June 30, 2016 and the year ended December 31, 2015:
| | | | | | | | | | | | | | | | |
| | | Six Months Ended
June 30, 2016 | | | Year Ended
December 31, 2015 | |
| | | Shares | | | Amount | | | Shares | | | Amount | |
Gross Proceeds from Offering | | | 4,434,147 | | | $ | 31,068 | | | | 9,376,303 | | | $ | 80,153 | |
Reinvestment of Distributions | | | 920,365 | | | | 6,401 | | | | 1,049,965 | | | | 8,522 | |
| | | | | | | | | | | | | | | | |
Total Gross Proceeds | | | 5,354,512 | | | | 37,469 | | | | 10,426,268 | | | | 88,675 | |
Dealer Manager Fees | | | — | | | | (529 | ) | | | — | | | | (1,379 | ) |
| | | | | | | | | | | | | | | | |
Net Proceeds to Company | | | 5,354,512 | | | | 36,940 | | | | 10,426,268 | | | | 87,296 | |
Share Repurchase Program | | | (268,532 | ) | | | (1,860 | ) | | | (131,982 | ) | | | (1,054 | ) |
| | | | | | | | | | | | | | | | |
Net Proceeds from Share Transactions | | | 5,085,980 | | | $ | 35,080 | | | | 10,294,286 | | | $ | 86,242 | |
| | | | | | | | | | | | | | | | |
9
FS Global Credit Opportunities Fund—D
Notes to Unaudited Financial Statements (continued)
(in thousands, except share and per share amounts)
Note 3. Share Transactions (continued)
Status of Continuous Public Offering
In April 2016, the Company closed its continuous public offering of common shares to new investors. The Company sold 26,690,075 common shares for gross proceeds of $234,539 in its continuous public offering, including common shares issued pursuant to its distribution reinvestment plan. Following the closing of its continuous public offering, the Company has continued to issue common shares pursuant to its distribution reinvestment plan. As of August 16, 2016, the Company had sold a total of 26,851,057 common shares and raised total gross proceeds of $235,751, including $100 of seed capital contributed by the principals of FS Global Advisor in March 2013 (see Note 4).
During the six months ended June 30, 2016 and the year ended December 31, 2015, the Company sold 5,354,512 and 10,426,268 common shares for gross proceeds of $37,469 and $88,675, respectively, at an average price per share of $7.00 and $8.50, respectively. The gross proceeds received during the six months ended June 30, 2016 and the year ended December 31, 2015 included reinvested shareholder distributions of $6,401 and $8,522, respectively, for which the Company issued 920,365 and 1,049,965 common shares, respectively. During the period from July 1, 2016 to August 16, 2016, the Company issued 150,982 common shares pursuant to its distribution reinvestment plan for gross proceeds of $1,112 at an average price per share of $7.37.
The proceeds from the issuance of common shares as presented on the Company’s unaudited statements of changes in net assets and unaudited statement of cash flows are presented net of dealer manager fees of $529 and $1,379 for the six months ended June 30, 2016 and the year ended December 31, 2015, respectively.
Share Repurchase Program
To provide shareholders with limited liquidity, the Company intends to conduct quarterly repurchases of common shares. In months in which the Company repurchases common shares, the Company will conduct repurchases on the same date that the Company holds its first weekly closing for the sale of common shares in its continuous public offering. Any offer to repurchase common shares will be conducted solely through written tender offer materials mailed to each shareholder.
The Company’s quarterly repurchases will be conducted on such terms as may be determined by the Board in its complete and absolute discretion unless, in the judgment of the independent trustees, such repurchases would not be in the best interests of shareholders or would violate applicable law. The Board also will consider the following factors, among others, in making its determination regarding whether to cause the Company to offer to repurchase common shares and under what terms:
| | • | | the effect of such repurchases on the Company’s and/or the Fund’s qualification as a RIC (including the consequences of any necessary asset sales); |
| | • | | the liquidity of the Fund’s assets (including fees and costs associated with disposing of assets); |
| | • | | the Fund’s investment plans; |
| | • | | the Company’s and the Fund’s working capital requirements; |
| | • | | the Company’s history in repurchasing common shares or portions thereof; and |
| | • | | the condition of the securities markets. |
10
FS Global Credit Opportunities Fund—D
Notes to Unaudited Financial Statements (continued)
(in thousands, except share and per share amounts)
Note 3. Share Transactions (continued)
The Company currently intends to limit the number of common shares to be repurchased on each date of repurchase to the number of common shares the Company can repurchase with the aggregate proceeds it has received from the beginning of the calendar year through, but not including, such date of repurchase from the issuance of common shares under the Company’s distribution reinvestment plan, less the amount of any such proceeds used to repurchase common shares on each previous repurchase date for tender offers conducted during the calendar year. In addition, the Company will limit the number of common shares to be repurchased in any calendar year to 20% of the weighted average number of common shares outstanding in the prior calendar year, or 5% in each quarter, though the actual number of common shares that the Company offers to repurchase may be less in light of the limitations noted above. The Company will offer to repurchase such common shares at a price equal to the NAV per common share in effect on each date of repurchase.
The following table provides information concerning the Company’s repurchases of common shares pursuant to its share repurchase program during the six months ended June 30, 2016 and the year ended December 31, 2015:
| | | | | | | | | | | | | | | | | | | | |
For the Three Months Ended | | Repurchase Date | | | Shares
Repurchased | | | Percentage
of Shares
Tendered
That Were
Repurchased | | | Repurchase
Price Per
Share | | | Aggregate
Consideration
for Repurchased
Shares | |
Fiscal 2015 | | | | | | | | | | | | |
December 31, 2014 | | | January 7, 2015 | | | | 4,473 | | | | 100 | % | | $ | 8.886 | | | $ | 40 | |
March 31, 2015 | | | April 1, 2015 | | | | 8,079 | | | | 100 | % | | $ | 8.882 | | | $ | 72 | |
June 30, 2015 | | | July 1, 2015 | | | | 27,429 | | | | 100 | % | | $ | 8.702 | | | $ | 239 | |
September 30, 2015 | | | October 7, 2015 | | | | 92,001 | | | | 100 | % | | $ | 7.654 | | | $ | 703 | |
| | | |
Fiscal 2016 | | | | | | | | | | | | |
December 31, 2015 | | | January 6, 2016 | | | | 120,715 | | | | 100 | % | | $ | 7.061 | | | $ | 852 | |
March 31, 2016 | | | April 6, 2016 | | | | 147,817 | | | | 100 | % | | $ | 6.813 | | | $ | 1,008 | |
On July 6, 2016, the Company repurchased approximately 146,569 common shares (representing 100% of the common shares tendered for repurchase) at $7.262 per common share for aggregate consideration totaling $1,064.
Note 4. Related Party Transactions
Compensation of FS Global Advisor and its Affiliates
The Company does not incur a separate management fee or incentive fee, but the Company is indirectly subject to the Fund’s management fee and incentive fee incurred pursuant to the amended and restated investment advisory agreement, dated as of October 9, 2013, by and between the Fund and FS Global Advisor. For the services it provides to the Fund, FS Global Advisor is entitled to a fee consisting of two parts—a management fee and an incentive fee. The management fee is calculated and payable quarterly in arrears at the annual rate of 2.0% of the Fund’s average daily gross assets during such period. The incentive fee is calculated and payable quarterly in arrears based upon the Fund’s “pre-incentive fee net investment income” for the immediately preceding quarter, and is subject to a hurdle rate, expressed as a rate of return on the Fund’s “adjusted capital,” equal to 2.25% per quarter (or an annualized hurdle rate of 9.00%), subject to a “catch-up”
11
FS Global Credit Opportunities Fund—D
Notes to Unaudited Financial Statements (continued)
(in thousands, except share and per share amounts)
Note 4. Related Party Transactions (continued)
feature. See Note 4 to the Fund’s unaudited consolidated financial statements attached hereto for a detailed description of the management fee and incentive fee payable by the Fund to FS Global Advisor.
Under the administration agreement, dated as of July 15, 2013, by and between the Company and FS Global Advisor, or the administration agreement, the Company reimburses FS Global Advisor for its actual costs incurred in providing administrative services to the Company, including FS Global Advisor’s allocable portion of the compensation and related expenses of certain personnel of Franklin Square Holdings providing administrative services to the Fund on behalf of FS Global Advisor. Such services include general ledger accounting, fund accounting, legal services, investor relations and other administrative services. FS Global Advisor also performs, or oversees the performance of, the Company’s corporate operations and required administrative services, which includes being responsible for the financial records that the Company is required to maintain and preparing reports to the Company’s shareholders and reports filed with the SEC. In addition, FS Global Advisor assists the Company in calculating NAV, overseeing the preparation and filing of tax returns and the printing and dissemination of reports to the Company’s shareholders, and generally overseeing the payment of the Company’s expenses and the performance of administrative and professional services rendered to the Company by others. FS Global Advisor is required to allocate the cost of these services to the Company based on factors such as assets, revenues and/or time allocations. At least annually, the Board reviews the methodology employed in determining how the expenses are allocated to the Fund and the proposed allocation of administrative expenses among the Fund and certain affiliates of FS Global Advisor. The Board then assesses the reasonableness of such reimbursements for expenses allocated to the Fund based on the breadth, depth and quality of such services as compared to the estimated cost to the Fund of obtaining similar services from third-party service providers known to be available. In addition, the Board considers whether any single third-party service provider would be capable of providing all such services at comparable cost and quality. Finally, the Board compares the total amount paid to FS Global Advisor for such services as a percentage of the Fund’s net assets to the same ratio as reported by other comparable investment companies. The Company will not reimburse FS Global Advisor for any services for which it receives a separate fee or for any administrative expenses allocated to a controlling person of FS Global Advisor.
Under the administration agreement, the Company, either directly or through reimbursement to FS Global Advisor or its affiliates, is responsible for its organization and offering costs in an amount up to 1.5% of aggregate proceeds raised in the Company’s continuous public offering, after payment of dealer manager fees. Organization and offering costs primarily include legal, accounting, printing and other expenses relating to the Company’s continuous public offering, including costs associated with technology integration between the Company’s systems and those of its selected broker-dealers, marketing expenses, salaries and direct expenses of FS Global Advisor’s personnel, employees of its affiliates and others while engaged in registering and marketing the Company’s common shares, which includes the development of marketing materials and presentations, training and educational meetings, and generally coordinating the marketing process for the Company.
Franklin Square Holdings funded certain of the Company’s organization and offering costs. The Company reimbursed FS Global Advisor for certain offering costs incurred by FS Global Advisor on the Company’s behalf, including marketing expenses, salaries and other direct expenses of FS Global Advisor’s personnel and employees of its affiliates while engaged in registering and marketing the Company’s common shares. Organization and offering costs funded directly by Franklin Square Holdings were recorded by the Company as a contribution to capital. Previously, offering costs were offset against capital in excess of par value on the Company’s financial statements and the organization costs were charged to expense as incurred by the
12
FS Global Credit Opportunities Fund—D
Notes to Unaudited Financial Statements (continued)
(in thousands, except share and per share amounts)
Note 4. Related Party Transactions (continued)
Company. All other offering costs, including amounts reimbursed to FS Global Advisor for ongoing organization and offering costs and any reimbursements paid to Franklin Square Holdings for organization and offering costs previously funded, were recorded as a reduction of capital. Commencing January 1, 2016 through the closing of its continuous public offering in April 2016, offering costs incurred by the Company were deferred and amortized to expense over twelve months (see Note 2). Upon the closing of the Company’s continuous public offering, all deferred offering costs that had not been amortized were expensed.
During the six months ended June 30, 2016, Franklin Square Holdings funded offering costs in the amount of $321. Since January 28, 2013 (Inception) through April 27, 2016 (Closing of Offering), Franklin Square Holdings funded $2,988 in offering and organization costs. During the period from December 12, 2013 (Commencement of Investment Operations) through April 27, 2016 (Closing of Offering), the Company paid total reimbursements of $1,216 to FS Global Advisor and its affiliates for organization and offering costs previously funded. As the Company closed its offering, no amounts remain reimbursable to FS Global Advisor and its affiliates under this arrangement.
The dealer manager for the Company’s continuous public offering was FS2 Capital Partners, LLC, or FS2, which is an affiliate of Franklin Square Holdings. Under the dealer manager agreement, dated as of July 15, 2013, by and between the Company and FS2, or the dealer manager agreement, FS2 was entitled to receive selling commissions and dealer manager fees in connection with the sale of common shares in the Company’s continuous public offering, all or a portion of which were re-allowed to selected broker-dealers.
The following table describes the fees and expenses accrued under the administration agreement and the dealer manager agreement during the six months ended June 30, 2016:
| | | | | | | | |
Related Party | | Source Agreement | | Description | | Six Months Ended
June 30, 2016 | |
FS Global Advisor | | Administration Agreement | | Administrative Services Expenses(1) | | $ | 26 | |
FS Global Advisor | | Administration Agreement | | Offering Costs(2) | | $ | 458 | |
FS2 | | Dealer Manager Agreement | | Dealer Manager Fee(3) | | $ | 529 | |
| (1) | During the six months ended June 30, 2016, $26 in administrative services expenses were accrued and have been or may in the future be applied to offset the liability of Franklin Square Holdings under the expense reimbursement agreement (as defined below) (see “—Expense Reimbursement Agreements”). |
| (2) | Represents amounts reimbursed to FS Global Advisor and its affiliates for offering costs incurred on the Company’s behalf, including marketing expenses, salaries and other direct expenses of FS Global Advisor’s personnel and employees of its affiliates while engaged in registering and marketing the Company’s common shares. |
| (3) | Represents aggregate dealer manager fees retained by FS2. |
Capital Contribution by FS Global Advisor
In March 2013, Michael C. Forman and David J. Adelman, the principals of FS Global Advisor, each contributed an aggregate of approximately $50 to purchase 5,000 common shares of the Company at a price of $10.00 per share, which represents the initial public offering price of $10.20 per share, net of dealer manager fees. The principals will not tender these common shares for repurchase as long as FS Global Advisor remains the Fund’s investment adviser.
13
FS Global Credit Opportunities Fund—D
Notes to Unaudited Financial Statements (continued)
(in thousands, except share and per share amounts)
Note 4. Related Party Transactions (continued)
As of August 16, 2016, the Company sold an aggregate of 94,042 common shares for aggregate gross proceeds of $869 to members of the Board and individuals and entities affiliated with FS Global Advisor, including common shares sold to Messrs. Forman and Adelman in March 2013.
Potential Conflicts of Interest
FS Global Advisor, GSO and certain of their affiliates may experience conflicts of interest in connection with the management of the Company and the Fund, including, but not limited to: the allocation of FS Global Advisor’s and GSO’s time and resources between the Fund and other investment activities; compensation payable by the Fund to FS Global Advisor and its affiliates; competition with certain affiliates of FS Global Advisor or GSO for investment opportunities; the due diligence review of the Fund by FS2, which is an affiliate of FS Global Advisor; investments at different levels of an entity’s capital structure by the Fund and other clients of FS Global Advisor and GSO, subject to the limitations of the 1940 Act; differing recommendations given by FS Global Advisor or GSO to the Fund versus other clients; restrictions on FS Global Advisor’s and GSO’s existing business relationships or use of material, non-public information with respect to potential investments by the Fund; the formation of additional investment funds or entrance into other investment advisory relationships by FS Global Advisor, GSO or their affiliates; and limitations on purchasing or selling securities to other clients of FS Global Advisor, GSO or their respective affiliates and on entering into “joint” transactions with certain of the Company’s and the Fund’s affiliates.
Expense Reimbursement Agreements
Pursuant to an expense support and conditional reimbursement agreement, dated as of August 20, 2013, by and between the Company and Franklin Square Holdings, or the expense reimbursement agreement, Franklin Square Holdings has agreed to reimburse the Company for expenses to ensure that the Company bears a reasonable level of expenses in relation to its income. The purpose of this arrangement is to ensure that no portion of any ordinary cash distributions made by the Company will be paid from offering proceeds or borrowings. Such ordinary cash distributions are expected to be paid using distributions received from the Fund.
The Fund has entered into a separate expense support and conditional reimbursement agreement with Franklin Square Holdings to ensure that no portion of any ordinary cash distributions made by the Fund to the Company are paid from offering proceeds or borrowings of the Fund. However, because certain investments the Fund may make may generate dividends and other distributions to the Fund that are treated for tax purposes as a return of capital, a portion of the Fund’s ordinary cash distributions (and therefore a portion of the Company’s ordinary cash distributions) may also be deemed to constitute a return of capital for tax purposes to the extent that the Company may use such dividends or other distribution proceeds as a source of distributions. Under those circumstances, Franklin Square Holdings will not reimburse the Company for the portion of the Fund’s or the Company’s ordinary cash distributions that represent a return of capital for tax purposes, as the purpose of the expense reimbursement arrangement is not to prevent tax-advantaged distributions.
Under the expense reimbursement agreement, Franklin Square Holdings will reimburse the Company quarterly to the extent that (x) the sum of the cumulative ordinary cash distributions paid by the Company in such quarter plus the aggregate Company operating expenses in such quarter exceeds (y) the cumulative ordinary cash distributions from the Fund that are received by the Company in such quarter.
14
FS Global Credit Opportunities Fund—D
Notes to Unaudited Financial Statements (continued)
(in thousands, except share and per share amounts)
Note 4. Related Party Transactions (continued)
Pursuant to the expense reimbursement agreement, the Company has a conditional obligation to reimburse Franklin Square Holdings for any amounts funded by Franklin Square Holdings under this arrangement if (and only to the extent that), during any fiscal quarter occurring within three years of the date on which Franklin Square Holdings funded such amount, (x) the cumulative ordinary cash distributions from the Fund that are received by the Company in such quarter exceed (y) the sum of the cumulative ordinary cash distributions paid by the Company in such quarter plus the aggregate Company operating expenses in such quarter; provided, however, that (i) the Company will only reimburse Franklin Square Holdings for expense support payments made by Franklin Square Holdings to the extent that the payment of such reimbursement (together with any other reimbursement paid during such fiscal year) does not cause “other operating expenses” (as defined below) (on an annualized basis and net of any expense support payments received by the Company during such fiscal year) to exceed the lesser of (A) 1.75% of the Company’s average net assets attributable to its common shares for the fiscal year-to-date period after taking such expense reimbursement payments into account and (B) the percentage of the Company’s average net assets attributable to its common shares represented by “other operating expenses” during the fiscal year in which such expense support payment from Franklin Square Holdings was made (provided, however, that this clause (B) shall not apply to any reimbursement payment which relates to an expense support payment from Franklin Square Holdings made during the same fiscal year) and (ii) the Company will not reimburse Franklin Square Holdings for expense support payments made by Franklin Square Holdings if the annualized rate of distributions per common share declared by the Company at the time of such expense reimbursement payment is less than the annualized rate of distributions per common share declared by the Company at the time Franklin Square Holdings made the expense support payment to which such reimbursement relates. “Other operating expenses” means the Company’s total operating expenses, excluding organization and offering expenses and extraordinary expenses. “Operating expenses” means all operating costs and expenses incurred, as determined in accordance with GAAP for investment companies.
The Company or Franklin Square Holdings may terminate the expense reimbursement agreement at any time. Franklin Square Holdings has indicated that it expects to continue such reimbursements until it deems that the Company has achieved economies of scale sufficient to ensure that the Company bears a reasonable level of expenses in relation to its income.
The specific amount of expenses reimbursed by Franklin Square Holdings pursuant to the expense reimbursement agreement, if any, is determined at the end of each fiscal quarter. Upon termination of the expense reimbursement agreement by Franklin Square Holdings, Franklin Square Holdings will be required to fund any amounts accrued thereunder as of the date of termination. Similarly, the conditional obligation of the Company to reimburse Franklin Square Holdings pursuant to the terms of the expense reimbursement agreement shall survive the termination of such agreement by either party.
Franklin Square Holdings agreed to forgo reimbursement of all expense reimbursement and additional support payments made by it to the Company through December 31, 2015. As such, as of December 31, 2015, there were no amounts subject to reimbursement by the Company to Franklin Square Holdings under the expense reimbursement agreement.
15
FS Global Credit Opportunities Fund—D
Notes to Unaudited Financial Statements (continued)
(in thousands, except share and per share amounts)
Note 4. Related Party Transactions (continued)
The following table reflects the expense reimbursement and additional support payments accrued from Franklin Square Holdings to the Company as of June 30, 2016 that may be subject to reimbursement to Franklin Square Holdings:
| | | | | | | | | | | | | | |
Quarter Ended | | Amount of Expense
Reimbursement and
Additional Support
Payment | | | Annualized “Other Operating
Expenses” Ratio as of the Date of
Support Payment | | | Annualized Rate
of Distributions
Per Common
Share(1) | | | Reimbursement
Eligibility
Expiration |
March 31, 2016 | | $ | 175 | | | | 0.40 | % | | | 12.77 | % | | March 31, 2019 |
June 30, 2016 | | $ | 492 | | | | 0.25 | % | | | 12.01 | % | | June 30, 2019 |
| (1) | The annualized rate of distributions per common share is expressed as a percentage equal to the projected annualized distribution amount as of the end of the applicable quarter (which is calculated by annualizing the regular weekly cash distribution per common share as of such date without compounding), divided by the Company’s net asset value per common share as of such date. |
Franklin Square Holdings is controlled by the Company’s chairman, president and chief executive officer, Michael C. Forman, and the Company’s vice-chairman, David J. Adelman. There can be no assurance that the expense reimbursement agreement will remain in effect or that Franklin Square Holdings will reimburse any portion of the Company’s expenses in future years.
Note 5. Distributions
The following table reflects the cash distributions per common share that the Company declared on its common shares during the six months ended June 30, 2016 and the years ended December 31, 2015 and 2014:
| | | | | | | | |
| | | Distribution | |
Fiscal Period | | Per Share | | | Amount | |
For the Year Ended December 31, 2014 | | $ | 0.8695 | | | $ | 3,446 | |
For the Year Ended December 31, 2015 | | $ | 0.8719 | | | $ | 14,023 | |
For the Six Months Ended June 30, 2016 | | $ | 0.4348 | | | $ | 10,294 | |
On July 7, 2016 and August 2, 2016, the Board declared regular weekly cash distributions for July and August 2016, respectively. The regular weekly cash distributions, each in the amount of $0.016722 per common share, have been or will be paid monthly to shareholders of record as of weekly record dates previously determined by the Board. The timing and amount of any future distributions to shareholders are subject to applicable legal restrictions and the sole discretion of the Board.
The Company has adopted an “opt in” distribution reinvestment plan for its shareholders. As a result, if the Company makes a cash distribution, its shareholders will receive distributions in cash unless they specifically “opt in” to the distribution reinvestment plan so as to have their cash distributions reinvested in additional common shares.
The Company’s distributions to shareholders may be funded from offering proceeds or borrowings, which may constitute a return of capital and reduce the amount of capital available to the Company for investment. Any capital returned to shareholders through distributions will be distributed after payment of fees and expenses, as well as the sales load.
16
FS Global Credit Opportunities Fund—D
Notes to Unaudited Financial Statements (continued)
(in thousands, except share and per share amounts)
Note 5. Distributions (continued)
The Company expects that for a period of time, which time period may be significant, substantial portions of the Company’s distributions may be funded through the reimbursement of certain expenses and additional support payments by Franklin Square Holdings and its affiliates, including through the waiver of certain fees and expenses by FS Global Advisor, that may be subject to repayment by the Company within three years. The purpose of this arrangement is to ensure that no portion of the Company’s distributions to shareholders will be paid from offering proceeds or borrowings. Any such distributions funded through support payments or waivers of fees and expenses are not based on the Fund’s investment performance and the Company’s distributions can only be sustained if the Fund achieves positive investment performance in future periods and/or Franklin Square Holdings continues to make such payments or waivers of such fees and expenses. The Company’s future repayments of amounts reimbursed or waived by Franklin Square Holdings and its affiliates will reduce the distributions that shareholders would otherwise receive in the future. There can be no assurance that the Company or the Fund will achieve the performance necessary to sustain its distributions or that the Company will be able to pay distributions at a specific rate or at all. Franklin Square Holdings and its affiliates have no obligation to waive fees and expenses or otherwise reimburse expenses in future periods. For the six months ended June 30, 2016, if Franklin Square Holdings had not reimbursed certain of the Company’s expenses and provided additional support payments, 6% of the cash distributions declared during such period would have been funded from offering proceeds or borrowings. For the year ended December 31, 2015, if Franklin Square Holdings had not reimbursed certain of the Company’s expenses and provided additional support payments, 3% of the cash distributions declared during such period would have been funded from offering proceeds or borrowings. See Note 4 to the attached unaudited consolidated financial statements of the Fund for information about the reimbursement of Fund expenses and additional support payments provided by Franklin Square Holdings to the Fund.
The following table reflects the sources of the cash distributions on a tax basis that the Company declared on its common shares during the six months ended June 30, 2016 and the year ended December 31, 2015:
| | | | | | | | | | | | | | | | |
| | | Six Months Ended
June 30, 2016 | | | Year Ended
December 31, 2015 | |
Source of Distribution | | Distribution
Amount | | | Percentage | | | Distribution
Amount | | | Percentage | |
Offering proceeds | | $ | — | | | | — | | | $ | — | | | | — | |
Borrowings | | | — | | | | — | | | | — | | | | — | |
Net investment income (prior to expense reimbursement from sponsor) | | | 9,627 | | | | 94 | % | | | 13,568 | | | | 97 | % |
Capital gains proceeds from the sale of assets | | | — | | | | — | | | | — | | | | — | |
Expense reimbursement and additional support payment from sponsor | | | 667 | | | | 6 | % | | | 455 | | | | 3 | % |
| | | | | | | | | | | | | | | | |
Total | | $ | 10,294 | | | | 100 | % | | $ | 14,023 | | | | 100 | % |
| | | | | | | | | | | | | | | | |
The Company’s net investment income on a tax basis for the six months ended June 30, 2016 was $10,294. As of June 30, 2016, the Company had distributed all of its net investment income on a tax basis. For the six months ended June 30, 2016, the difference between the Company’s tax basis net investment income and its GAAP-basis net investment income (including the expense reimbursement and additional support payment from sponsor) is due to the treatment of offering costs.
17
FS Global Credit Opportunities Fund—D
Notes to Unaudited Financial Statements (continued)
(in thousands, except share and per share amounts)
Note 5. Distributions (continued)
The determination of the tax attributes of the Company’s distributions is made annually as of the end of the Company’s fiscal year based upon the Company’s taxable income for the full year and distributions paid for the full year. Therefore, a determination made on an interim basis may not be representative of the actual tax attributes of the Company’s distributions for a full year. The actual tax characteristics of distributions to shareholders are reported to shareholders annually on Form 1099-DIV.
As of June 30, 2016, the components of accumulated earnings on a tax basis were as follows:
| | | | |
| | | June 30, 2016 | |
Distributable ordinary income | | | — | |
Net unrealized appreciation (depreciation) on investment(1) | | | (36,309 | ) |
| | | | |
| | $ | (36,309 | ) |
| | | | |
| (1) | As of June 30, 2016, gross unrealized depreciation on the Company’s investment in the Fund was $36,309. |
The aggregate cost of the Company’s investment for U.S. federal income tax purposes totaled $226,323 as of June 30, 2016. Aggregate net unrealized appreciation (depreciation) on a tax basis was $(36,309) as of June 30, 2016.
Note 6. Commitments and Contingencies
The Company enters into contracts that contain a variety of indemnification provisions. The Company’s maximum exposure under these arrangements is unknown; however, the Company has not had prior claims or losses pursuant to these contracts. Management of FS Global Advisor has reviewed the Company’s existing contracts and expects the risk of loss to the Company to be remote.
The Company is not currently subject to any material legal proceedings and, to the Company’s knowledge, no material legal proceedings are threatened against the Company. From time to time, the Company may be a party to certain legal proceedings in the ordinary course of business. While the outcome of any legal proceedings cannot be predicted with certainty, the Company does not expect that any such proceedings will have a material adverse effect upon its financial condition or results of operations.
See Note 4 for a discussion of the Company’s commitments to Franklin Square Holdings and its affiliates.
18
Supplemental Information
Changes in Accountants and Disagreements with Accountants on Accounting and Financial Disclosure
The Company has not had any changes in its independent registered public accounting firm or disagreements with its independent registered public accounting firm on accounting or financial disclosure matters since its inception.
Form N-Q Filings
The Company files its complete schedule of portfolio holdings with the SEC for the first and third quarters of each fiscal year on Form N-Q. The Company’s Forms N-Q are available on the SEC’s website at http://www.sec.gov. The Company’s Forms N-Q may also be reviewed and copied at the SEC’s Public Reference Room located at 100 F Street, NE, Washington, DC 20549. Shareholders may obtain information on the operation of the SEC’s Public Reference Room by calling the SEC at 1-800-SEC-0330.
Proxy Voting Policies and Procedures
The Company invests substantially all of its assets in the Fund. All investments in portfolio companies are made at the Fund level. The Fund has delegated its proxy voting responsibility to FS Global Advisor, the Fund’s investment adviser. Shareholders may obtain a copy of FS Global Advisor’s proxy voting policies and procedures upon request and without charge by calling the Fund collect at 215-495-1150 or on the SEC’s website at http://www.sec.gov.
Proxy Voting Record
Information regarding how FS Global Advisor voted proxies relating to the Fund’s portfolio securities during the most recent twelve-month period ended June 30 is available upon request and without charge by making a written request to the Fund’s Chief Compliance Officer at FS Global Credit Opportunities Fund, 201 Rouse Boulevard, Philadelphia, Pennsylvania 19112, Attn: Chief Compliance Officer, by calling the Fund collect at 215-495-1150 or on the SEC’s website at http://www.sec.gov.
19
FS GLOBAL CREDIT
OPPORTUNITIES FUND
201 Rouse Boulevard Philadelphia, PA 19112
215-495-1150
Interests in FS Global Credit Opportunities Fund are not registered under the Securities Act of 1933, as amended (the “Securities Act”), and are issued only to FS Global Credit Opportunities Fund–A, FS Global Credit Opportunities Fund–D, FS Global Credit Opportunities Fund–T and FS Global Credit Opportunities Fund–ADV in private placement transactions that do not involve any “public offering” within the meaning of Section 4(a)(2) of, and/or Regulation D under, the Securities Act. This semi-annual report does not constitute an offer to sell, or the solicitation of an offer to buy, any interest in FS Global Credit Opportunities Fund. Past performance is not indicative of future results.
SAR-GCO-D16
RRD 8/16
2016
SEMI-ANNUAL REPORT
FS GLOBAL CREDIT OPPORTUNITIES FUND
An alternative approach
to global credit investing
from FS Investments
FS GLOBAL CREDIT OPPORTUNITIES FUND
Michael C. Forman
CHAIRMAN & CHIEF EXECUTIVE OFFICER
FS GLOBAL CREDIT OPPORTUNITIES FUND
THE CREDIT MARKET RALLY LED TO MEANINGFUL PORTFOLIO APPRECIATION AND SERVES AS A PROOF-OF-CONCEPT OF FSGCO’S NON-TRADED, CLOSED-END FUND STRUCTURE.
Fellow Shareholder,
After a turbulent start to the year, investor appetite for corporate credit improved notably in the first half of 2016. The snapback represented a significant turnaround from January and February when investor concerns about a potential China slowdown and declining commodity prices put a damper on markets. Since then, investor sentiment has improved on the back of encouraging U.S. economic data, ongoing central bank accommodation and easing global growth concerns. Given FS Global Credit Opportunities Fund’s (the “Fund”) value-based approach to credit investing, the credit market decline and subsequent rally led to meaningful portfolio appreciation and serves as a proof-of-concept of the Fund’s non-traded, closed-end fund structure. The first half of 2016 brought yet another major reset in global interest rates, with more than $13 trillion of negative-yielding sovereign bonds continuing to drive the global search for yield.1 With U.S. corporate fundamentals remaining generally strong and economic growth stable, credit market returns reflected rising investor optimism and the growing need for income producing assets following the declines sustained in 2015.
As of June 30, 2016, high yield bonds and senior secured loans had generated year-to-date returns of 9.3% and 4.2%, respectively.2,3 The value-oriented areas of the market also benefited from a rebound in investor sentiment, with value-oriented high yield bonds and value-oriented senior secured loans returning approximately 21.6% and 8.3%, respectively, in the second quarter.4,5 Toward the end of June, Britain’s decision to exit the European Union injected a fresh bout of volatility into the markets. While the impact on the U.S. corporate credit markets appears to be well contained, we believe the financial market volatility seen in the immediate aftermath of the decision underscores the potential for further credit market volatility ahead. We remain confident that FSGCO’s long-term, unlisted closed-end fund structure will allow it to manage through any such market uncertainty and capitalize on investment opportunities that may result from future market dislocations.

FOR THE SIX MONTHS ENDED JUNE 30, 2016, FUND–A AND FUND–D EACH GENERATED A SHAREHOLDER RETURN OF 8.0% AND PAID DISTRIBUTIONS OF APPROXIMATELY $0.43 PER COMMON SHARE.6,7
A REVIEW OF 1H 2016
Given the Fund’s focus on investing in value-based credit strategies, such as event-driven opportunities, special situations and market-price inefficiencies, we expect that over the long term the Fund generally should provide total returns that are largely uncorrelated to events in the broader economy. FS Global Credit Opportunities Fund–A (Fund–A) and FS Global Credit Opportunities Fund–D (Fund–D and, together with Fund–A, the Companies) each generated a shareholder return of 8.8% during the second quarter, outperforming the high yield bond and senior secured loan indices, as well as value-oriented senior secured loans.2,3,5,6 For the six months ended June 30, 2016, Fund–A and Fund–D each generated a shareholder return of 8.0%.6 Fund–A and Fund–D each paid distributions of approximately $0.43 per common share during the first half of 2016.7 The largest positive contributors to the Fund’s first half performance were a market-price inefficiency opportunity and an event-driven investment. A market-price inefficiency opportunity is an investment made in a security that trades below what the Fund believes to be its intrinsic value. Event-driven investments seek to capitalize on market dislocations resulting from specific corporate events, such as mergers, corporate reorganizations or debt maturities that are expected to impact the value of a company’s securities.
Regarding the market-price inefficiency investment, the Fund invested in the senior secured debt of Aspect Software, a provider of call center software, which traded at a significant discount to face value. Subsequently, the Fund’s position appreciated meaningfully following the completion of a restructuring of the company’s balance sheet that reduced debt and infused additional capital to facilitate growth. Regarding the event-driven investment, the Fund purchased senior debt in U.S. retailer Toys “R” Us during the first quarter based on the view that the company is engaged in a meaningful turnaround of its business and poised to grow both sales and margins over the next two years. The Fund’s position rose after the company reported better-than-expected fourth quarter 2015 earnings and forecast a rise in 2016 cash flows.
Key negative contributors to the Fund’s performance in the second quarter included a special situation investment in Origami Owl, a lifestyle jewelry company, that saw a year-over-year decline in sales, and a market-price inefficiency investment in grocery retailer Fairway Group that is currently undergoing a restructuring. The Fund is cautiously optimistic that Origami Owl is currently taking the necessary steps to improve its business and believes that its senior position in Fairway Group will allow it to potentially influence the restructuring process in order to maximize the company’s long-term value.
Finally, in the second quarter, Fund–A and Fund–D closed their continuous public offerings to new investors and we commenced the continuous public offerings of FS Global Credit Opportunities Fund–T (Fund–T) and FS Global Credit Opportunities Fund–ADV (Fund–ADV). We believe that the offerings of Fund–T and Fund–ADV will provide flexibility for both advisors and investors utilizing both qualified and non-qualified accounts.

VOLATILITY IN THE CREDIT MARKETS OVER THE PAST SEVERAL QUARTERS HAS CREATED ATTRACTIVE RISK-ADJUSTED OPPORTUNITIES FOR THOSE WITH THE PATIENCE, EXPERIENCE AND LIQUIDITY TO
CAPITALIZE ON THEM.
TRENDS AND OPPORTUNITIES
Looking forward to the second half of 2016, we believe there are several specific trends in the current investing environment that are beneficial to the Fund’s long-term strategy. Volatility in the credit markets over the past several quarters has created attractive risk-adjusted opportunities for those with the patience, experience and liquidity to capitalize on them. Despite a meaningful rally in high yield bond and senior secured loan prices since the beginning of 2016, high yield bond and senior secured loan yields remained meaningfully above their long-term averages as of June 30, 2016.2,3 At the same time, slow but stable economic growth remains generally supportive of U.S. corporations.
We anticipate generally low levels of secondary market liquidity will continue to give rise to short-term price swings and we will seek to capitalize on any dislocations that arise in the credit markets to invest in assets we believe are undervalued. We believe that the long-term nature of the Fund’s strategy and the benefits of its unlisted, continuously offered closed-end fund structure position the Fund to generate attractive total returns, consisting of a high level of current income and capital appreciation, for its shareholders over the long term.
We look forward to an exciting second half of 2016. Thank you for your continued support and trust in us.
Sincerely,
MICHAEL C. FORMAN
Chairman & Chief Executive Officer FS Global Credit Opportunities Fund

THE FUND INVESTS PRIMARILY IN SECURED AND UNSECURED FLOATING AND
FIXED RATE LOANS, BONDS AND OTHER CREDIT INSTRUMENTS.
Portfolio composition (by fair value)
35%
SENIOR SECURED LOANS—FIRST LIEN
10%
SENIOR SECURED LOANS—SECOND LIEN
21%
SENIOR SECURED BONDS
27%
SUBORDINATED DEBT
1%
COLLATERALIZED SECURITIES
6%
EQUITY/OTHER
PORTFOLIO REVIEW
JUNE 30, 2016 (UNAUDITED)
Industry classification (by fair value)
SOFTWARE & SERVICES .................. 18%
CAPITAL GOODS ...................................9%
ENERGY ..................................................8%
MEDIA ....................................................8%
TELECOMMUNICATION SERVICES .....8%
MATERIALS............................................6%
TECHNOLOGY HARDWARE
& EQUIPMENT.......................................6%
INSURANCE...........................................5%
PHARMACEUTICALS,
BIOTECHNOLOGY
& LIFE SCIENCES .................................5%
TRANSPORTATION................................5%
CONSUMER SERVICES .........................4%
REAL ESTATE.........................................4%
RETAILING .............................................3%
CONSUMER DURABLES
& APPAREL ............................................2%
DIVERSIFIED FINANCIALS ....................2%
FOOD, BEVERAGE & TOBACCO...........2%
HOUSEHOLD &
PERSONAL PRODUCTS ........................2%
AUTOMOBILES & COMPONENTS........1%
COMMERCIAL & PROFESSIONAL
SERVICES..............................................1%
FOOD & STAPLES RETAILING..............1%
HEALTH CARE EQUIPMENT
& SERVICES ........................................ <1%

1 Credit Suisse, CS Credit Strategy Daily Comment, June 30, 2016.
2 Bank of America Merrill Lynch High Yield Master II Index. Past performance should not be relied upon as being indicative of future results.
3 Credit Suisse Leveraged Loan Index. Past performance should not be relied upon as being indicative of future results.
4 Value-oriented high yield bonds are represented by the Bank of America Merrill Lynch U.S. High Yield Distressed Index, which is a subset of the Bank of America Merrill Lynch U.S. High Yield Master II Index that includes all high yield bonds that trade with a spread over U.S. Treasuries greater than or equal to 10%.
5 Value-oriented loans are represented by the Credit Suisse Distressed Loan Index, which is a subset of the Credit Suisse Leveraged Loan Index that contains only loan facilities that trade at a price of 90% or below.
6 Shareholder returns shown are the total returns an investor received for the period taking into account all distributions paid during such period, compounded monthly. The calculation assumes that the investor purchased shares at Fund–A’s or Fund–D’s public offering price, excluding selling commissions and dealer manager fees, if applicable, at the beginning of the applicable period and reinvested all cash distributions pursuant to Fund–A’s or Fund–D’s distribution reinvestment plan (DRP). Valuation as of the end of each period is the repurchase price pursuant to Fund–A’s or Fund–D’s share repurchase program on such date. Shareholder returns do not include selling commissions and dealer manager fees, which could have totaled up to 8% of Fund–A’s public offering price. Had such selling commissions and dealer manager fees been included, performance would be lower. Upon liquidation or redemption, market conditions may cause the actual values to be more or less than the values shown.
7 The distributions described herein were funded in significant part by the reimbursement of certain expenses, including through the waiver of investment advisory fees payable by the Fund, and additional support payments that may be subject to repayment to the Companies’ and the Fund’s affiliate, Franklin Square Holdings, L.P. (“FS Investments”), and the Companies’ and the Fund’s future distributions may be funded from such waivers, reimbursements and payments. Significant portions of these distributions were not based on the Fund’s investment performance and such waivers, reimbursements and payments by FS Investments may not continue in the future. If FS Investments had not agreed to reimburse certain of the Companies’ expenses, including through the waiver of certain advisory fees, and make additional support payments, significant portions of these distributions would have come from offering proceeds or borrowings. The repayment of amounts owed to FS Investments will reduce the future distributions to which investors would otherwise be entitled. The payment of future distributions on the Companies’ common shares is subject to the discretion of their boards of trustees and applicable legal restrictions and, therefore, there can be no assurance as to the amount or timing of any such future distributions.

FS Global Credit
Opportunities Fund
OFFICERS AND BOARD OF TRUSTEES
Officers
MICHAEL C. FORMAN
Chairman & Chief Executive Officer
WILLIAM GOEBEL
Chief Financial Officer
GERALD F. STAHLECKER
Executive Vice President
ZACHARY KLEHR
Executive Vice President
STEPHEN S. SYPHERD
Vice President, Treasurer & Secretary
JAMES F. VOLK
Chief Compliance Officer
Board of Trustees
MICHAEL C. FORMAN
Chairman & Chief Executive Officer
DAVID J. ADELMAN
Vice-Chairman
President & Chief Executive Officer,
Campus Apartments, Inc.
THOMAS J. GRAVINA
Trustee
Executive Chairman, GPX Enterprises, L.P.
WALTER W. BUCKLEY, III
Trustee
Chairman & Chief Executive Officer,
Actua Corporation
BARBARA J. FOUSS
Trustee
Former Director of Strategic Initiatives & Chief
Credit Policy Officer, Sun National Bank
DAVID L. COHEN
Trustee
Senior Executive Vice President,
Comcast Corporation
PHILIP E. HUGHES, JR.
Trustee
Vice-Chairman of Keystone Industries
OLIVER C. MITCHELL, JR.
Trustee
Attorney & Consultant
CHARLES P. PIZZI
Trustee
Retired President, Director & Chief Executive
Officer, Tasty Baking Company
TABLE OF CONTENTS
FS Global Credit Opportunities Fund
FS Global Credit Opportunities Fund
Unaudited Consolidated Schedule of Investments
As of June 30, 2016
(in thousands, except share amounts)
| | | | | | | | | | | | | | | | | | | | | | | | | | | | |
Portfolio Company(a) | | Footnotes | | Industry | | | Rate(b) | | | Floor | | Maturity | | | Principal
Amount(c) | | | Amortized
Cost | | | Fair
Value(d) | |
Senior Secured Loans—First Lien—45.3% | | | | | | | | | | | | | | | | | | | | | | | | | | |
Acision Finance LLC | | | | | Software & Services | | | | L+975 | | | 1.0% | | | 12/17/18 | | | $ | 26,280 | | | $ | 25,602 | | | $ | 26,017 | |
Aspect Software, Inc. | | (g)(s) | | | Software & Services | | | | L+950 | | | 1.0% | | | 5/25/18 | | | | 2,354 | | | | 2,354 | | | | 2,372 | |
Aspect Software, Inc. | | (s) | | | Software & Services | | | | L+950 | | | 1.0% | | | 5/25/20 | | | | 7,183 | | | | 7,183 | | | | 7,237 | |
Avant Credit III Trust | | | | | Diversified Financials | | | | L+1000 | | | 1.0% | | | 9/15/17 | | | | 286 | | | | 286 | | | | 286 | |
Avant Credit III Trust | | | | | Diversified Financials | | | | L+1000 | | | 1.0% | | | 10/15/17 | | | | 306 | | | | 306 | | | | 306 | |
Avant Credit III Trust | | | | | Diversified Financials | | | | L+1000 | | | 1.0% | | | 11/15/17 | | | | 379 | | | | 379 | | | | 379 | |
Avant Credit III Trust | | | | | Diversified Financials | | | | L+1000 | | | 1.0% | | | 4/15/18 | | | | 821 | | | | 821 | | | | 819 | |
Avant Credit III Trust | | | | | Diversified Financials | | | | L+1000 | | | 1.0% | | | 5/15/18 | | | | 305 | | | | 305 | | | | 304 | |
Avant Credit III Trust | | | | | Diversified Financials | | | | L+1000 | | | 1.0% | | | 6/15/18 | | | | 183 | | | | 183 | | | | 183 | |
Avant Credit III Trust | | | | | Diversified Financials | | | | L+1000 | | | 1.0% | | | 7/15/18 | | | | 298 | | | | 298 | | | | 297 | |
Avant Credit III Trust | | | | | Diversified Financials | | | | L+1000 | | | 1.0% | | | 8/15/18 | | | | 308 | | | | 308 | | | | 307 | |
Avant Credit III Trust | | | | | Diversified Financials | | | | L+1000 | | | 1.0% | | | 9/15/18 | | | | 420 | | | | 420 | | | | 418 | |
Avant Credit III Trust | | | | | Diversified Financials | | | | L+1000 | | | 1.0% | | | 10/15/18 | | | | 420 | | | | 420 | | | | 418 | |
Avant Credit III Trust | | | | | Diversified Financials | | | | L+1000 | | | 1.0% | | | 11/15/18 | | | | 411 | | | | 411 | | | | 409 | |
Avant Credit III Trust | | | | | Diversified Financials | | | | L+1000 | | | 1.0% | | | 12/15/18 | | | | 456 | | | | 456 | | | | 454 | |
Avant Credit III Trust | | | | | Diversified Financials | | | | L+1000 | | | 1.0% | | | 1/15/19 | | | | 497 | | | | 497 | | | | 495 | |
Avant Credit III Trust | | | | | Diversified Financials | | | | L+1000 | | | 1.0% | | | 2/15/19 | | | | 509 | | | | 509 | | | | 507 | |
Avaya Inc. | | | | | Technology Hardware & Equipment | | | | L+550 | | | 1.0% | | | 3/31/18 | | | | 408 | | | | 353 | | | | 307 | |
Avaya Inc. | | (e)(f) | | | Technology Hardware & Equipment | | | | L+525 | | | 1.0% | | | 5/29/20 | | | | 2,130 | | | | 1,415 | | | | 1,530 | |
Bioplan USA, Inc. | | (e) | | | Materials | | | | L+475 | | | 1.0% | | | 9/23/21 | | | | 27,941 | | | | 24,374 | | | | 24,449 | |
Blue Coat Holdings, Inc. | | (g) | | | Technology Hardware & Equipment | | | | L+350 | | | 1.0% | | | 5/22/20 | | | | 1,591 | | | | 1,591 | | | | 1,578 | |
Caesars Entertainment Operating Co., Inc. | | (i) | | | Consumer Services | | | | 9.4% | | | | | | 10/31/16 | | | | 881 | | | | 858 | | | | 792 | |
Caesars Entertainment Operating Co., Inc. | | (i) | | | Consumer Services | | | | 5.6% | | | | | | 3/1/17 | | | | 3,370 | | | | 3,281 | | | | 3,067 | |
Caesars Entertainment Operating Co., Inc. | | (f)(i) | | | Consumer Services | | | | 6.5% | | | | | | 3/1/17 | | | | 4,061 | | | | 3,777 | | | | 4,032 | |
Caesars Entertainment Operating Co., Inc. | | (f)(i) | | | Consumer Services | | | | 8.7% | | | | | | 3/1/17 | | | | 13,623 | | | | 13,034 | | | | 13,103 | |
CEVA Group Plc | | (g) | | | Transportation | | | | L+500 | | | | | | 3/19/19 | | | | 25,000 | | | | 24,478 | | | | 20,125 | |
CEVA Group Plc | | (e) | | | Transportation | | | | L+550 | | | 1.0% | | | 3/19/21 | | | | 1,372 | | | | 1,136 | | | | 1,138 | |
CEVA Intercompany BV | | (e) | | | Transportation | | | | L+550 | | | 1.0% | | | 3/19/21 | | | | 1,414 | | | | 1,171 | | | | 1,173 | |
CEVA Logistics Canada, ULC | | (e) | | | Transportation | | | | L+550 | | | 1.0% | | | 3/19/21 | | | | 244 | | | | 202 | | | | 203 | |
CEVA Logistics U.S. Holdings, Inc. | | (e) | | | Transportation | | | | L+550 | | | 1.0% | | | 3/19/21 | | | | 1,951 | | | | 1,615 | | | | 1,617 | |
CITGO Holding, Inc. | | (e)(f) | | | Energy | | | | L+850 | | | 1.0% | | | 5/12/18 | | | | 19,591 | | | | 19,608 | | | | 19,769 | |
CLP Issuer, LLC | | | | | Diversified Financials | | | | L+1000 | | | 1.0% | | | 7/24/16 | | | | 50 | | | | 50 | | | | 50 | |
CLP Issuer, LLC | | | | | Diversified Financials | | | | L+1000 | | | 1.0% | | | 8/21/16 | | | | 96 | | | | 96 | | | | 96 | |
CLP Issuer, LLC | | | | | Diversified Financials | | | | L+1000 | | | 1.0% | | | 9/25/16 | | | | 233 | | | | 233 | | | | 233 | |
CLP Issuer, LLC | | | | | Diversified Financials | | | | L+1000 | | | 1.0% | | | 10/23/16 | | | | 278 | | | | 278 | | | | 278 | |
CLP Issuer, LLC | | | | | Diversified Financials | | | | L+1000 | | | 1.0% | | | 11/20/16 | | | | 392 | | | | 392 | | | | 392 | |
See notes to unaudited consolidated financial statements.
1
FS Global Credit Opportunities Fund
Unaudited Consolidated Schedule of Investments (continued)
As of June 30, 2016
(in thousands, except share amounts)
| | | | | | | | | | | | | | | | | | | | | | |
Portfolio Company(a) | | Footnotes | | Industry | | Rate(b) | | Floor | | Maturity | | Principal
Amount(c) | | | Amortized
Cost | | | Fair
Value(d) | |
CLP Issuer, LLC | | | | Diversified Financials | | L+1000 | | 1.0% | | 12/24/16 | | $ | 661 | | | $ | 661 | | | $ | 660 | |
CLP Issuer, LLC | | | | Diversified Financials | | L+1000 | | 1.0% | | 1/22/17 | | | 751 | | | | 751 | | | | 750 | |
CLP Issuer, LLC | | | | Diversified Financials | | L+1000 | | 1.0% | | 2/19/17 | | | 599 | | | | 599 | | | | 599 | |
CLP Issuer, LLC | | | | Diversified Financials | | L+1000 | | 1.0% | | 3/24/17 | | | 782 | | | | 782 | | | | 782 | |
CLP Issuer, LLC | | | | Diversified Financials | | L+1000 | | 1.0% | | 4/22/17 | | | 1,157 | | | | 1,157 | | | | 1,156 | |
CLP Issuer, LLC | | | | Diversified Financials | | L+1000 | | 1.0% | | 5/20/17 | | | 1,791 | | | | 1,791 | | | | 1,789 | |
CLP Issuer, LLC | | | | Diversified Financials | | L+1000 | | 1.0% | | 6/24/17 | | | 2,689 | | | | 2,689 | | | | 2,687 | |
CLP Issuer, LLC | | | | Diversified Financials | | L+1000 | | 1.0% | | 5/2/17 | | | 464 | | | | 464 | | | | 464 | |
CLP Issuer, LLC | | (g) | | Diversified Financials | | L+1000 | | 1.0% | | 5/2/17 | | | 10,057 | | | | 10,057 | | | | 10,047 | |
Commercial Barge Line Company | | (f) | | Transportation | | L+875 | | 1.0% | | 11/12/20 | | | 44,251 | | | | 41,618 | | | | 41,374 | |
Compuware Corp. | | (e) | | Software & Services | | L+525 | | 1.0% | | 12/15/21 | | | 17,705 | | | | 17,003 | | | | 16,455 | |
Concordia Healthcare Corp. | | (e) | | Pharmaceuticals, Biotechnology & Life Sciences | | L+500 | | 1.0% | | 10/21/21 | | £ | 29,850 | | | | 43,449 | | | | 39,478 | |
Drillships Ocean Ventures Inc. | | | | Transportation | | L+450 | | 1.0% | | 7/25/21 | | $ | 4,083 | | | | 3,434 | | | | 2,453 | |
Emerging Markets Communications, LLC | | (e) | | Telecommunication Services | | L+575 | | 1.0% | | 7/1/21 | | | 9,900 | | | | 9,210 | | | | 9,578 | |
EnergySolutions, LLC | | (e) | | Commercial & Professional Services | | L+575 | | 1.0% | | 5/29/20 | | | 4,181 | | | | 4,122 | | | | 4,077 | |
Fairway Group Acquisition Co. | | | | Food & Staples Retailing | | L+800 | | 1.0% | | 7/29/16 | | | 6,029 | | | | 5,878 | | | | 5,999 | |
Fairway Group Acquisition Co. | | (i)(q) | | Food & Staples Retailing | | L+400 | | 1.0% | | 8/17/18 | | | 22,634 | | | | 20,472 | | | | 13,014 | |
Getty Images, Inc. | | (e) | | Media | | L+350 | | 1.3% | | 10/18/19 | | | 21,000 | | | | 14,756 | | | | 15,729 | |
iHeartCommunications, Inc. | | | | Media | | L+750 | | | | 7/30/19 | | | 9,229 | | | | 9,089 | | | | 6,769 | |
JSS Holdings, Inc. | | | | Capital Goods | | L+650 | | 1.0% | | 8/31/21 | | | 22,859 | | | | 21,562 | | | | 21,716 | |
Kronos Acquisition Holdings Inc. | | | | Household & Personal Products | | L+750 | | 1.0% | | 8/26/22 | | | 33,604 | | | | 33,604 | | | | 34,192 | |
Meldrew Participations B.V. | | (h) | | Food, Beverage & Tobacco | | L+400, 300 PIK
(300 Max PIK) | | 1.0% | | 10/31/19 | | £ | 94 | | | | 141 | | | | 81 | |
Neiman Marcus Group LTD LLC | | (e) | | Retailing | | L+325 | | 1.0% | | 10/25/20 | | $ | 5,816 | | | | 5,332 | | | | 5,239 | |
NextGen Finance, LLC | | (e) | | Telecommunication Services | | L+400 | | 1.0% | | 5/31/21 | | | 4,900 | | | | 4,863 | | | | 4,677 | |
Novitex Acquisition, LLC | | | | Software & Services | | L+625 | | 1.3% | | 7/7/20 | | | 31,093 | | | | 29,835 | | | | 29,539 | |
Origami Owl, LLC | | | | Consumer Durables & Apparel | | L+650, 50 PIK
(50 Max PIK) | | 3.0% | | 12/5/19 | | | 21,092 | | | | 21,092 | | | | 9,702 | |
Origami Owl, LLC | | | | Consumer Durables & Apparel | | L+650, 50 PIK
(50 Max PIK) | | 3.0% | | 12/5/19 | | | 1,591 | | | | 1,591 | | | | 732 | |
Origami Owl, LLC | | (g) | | Consumer Durables & Apparel | | L+650, 50 PIK
(50 Max PIK) | | 3.0% | | 12/5/19 | | | 1,129 | | | | 1,129 | | | | 519 | |
Precyse Acquisition Corp. | | | | Health Care Equipment & Services | | L+550 | | 1.0% | | 10/19/22 | | | 3,627 | | | | 3,574 | | | | 3,616 | |
Propulsion Acquisition, LLC | | (f) | | Commercial & Professional Services | | L+600 | | 1.0% | | 7/13/21 | | | 17,966 | | | | 16,859 | | | | 17,517 | |
Reddy Ice Corp. | | (e) | | Food, Beverage & Tobacco | | L+550 | | 1.3% | | 5/1/19 | | | 2,433 | | | | 2,242 | | | | 2,143 | |
See notes to unaudited consolidated financial statements.
2
FS Global Credit Opportunities Fund
Unaudited Consolidated Schedule of Investments (continued)
As of June 30, 2016
(in thousands, except share amounts)
| | | | | | | | | | | | | | | | | | | | | | | | | | | | | | |
Portfolio Company(a) | | Footnotes | | Industry | | | Rate(b) | | | Floor | | | Maturity | | | Principal
Amount(c) | | | Amortized
Cost | | | Fair
Value(d) | |
Scientific Games International, Inc. | | (e) | | | Consumer Services | | | | L+500 | | | | 1.0% | | | | 10/18/20 | | | $ | 9,949 | | | $ | 9,715 | | | $ | 9,841 | |
Scientific Games International, Inc. | | (e) | | | Consumer Services | | | | L+500 | | | | 1.0% | | | | 10/1/21 | | | | 9,962 | | | | 9,703 | | | | 9,856 | |
Seadrill Operating LP | | | | | Energy | | | | L+300 | | | | 1.0% | | | | 2/21/21 | | | | 16,959 | | | | 13,039 | | | | 7,640 | |
Solocal Group S.A. | | (h) | | | Media | | | | E+400 | | | | | | | | 3/15/18 | | | € | 25,674 | | | | 25,495 | | | | 15,219 | |
Stardust Finance Holdings, Inc. | | (e) | | | Materials | | | | L+550 | | | | 1.0% | | | | 3/14/22 | | | $ | 12,232 | | | | 12,084 | | | | 11,967 | |
Stonewall Gas Gathering LLC | | | | | Capital Goods | | | | L+775 | | | | 1.0% | | | | 1/28/22 | | | | 2,330 | | | | 2,236 | | | | 2,377 | |
SunGard Availability Services Capital, Inc. | | (e) | | | Software & Services | | | | L+500 | | | | 1.0% | | | | 3/29/19 | | | | 25,292 | | | | 23,333 | | | | 22,731 | |
Toys “R” Us-Delaware, Inc. | | (e) | | | Retailing | | | | L+375 | | | | 1.5% | | | | 5/25/18 | | | | 11,792 | | | | 10,307 | | | | 10,898 | |
Toys “R” Us-Delaware, Inc. | | (e) | | | Retailing | | | | L+875 | | | | 1.0% | | | | 4/24/20 | | | | 34,000 | | | | 30,596 | | | | 29,427 | |
TTM Technologies, Inc. | | | | | Technology Hardware & Equipment | | | | L+500 | | | | 1.0% | | | | 5/31/21 | | | | 4,101 | | | | 3,982 | | | | 4,071 | |
Varsity Brands Holding Co., Inc. | | (e) | | | Media | | | | L+400 | | | | 1.0% | | | | 12/11/21 | | | | 9,234 | | | | 9,161 | | | | 9,221 | |
Victory Capital Operating, LLC | | (e) | | | Diversified Financials | | | | L+600 | | | | 1.0% | | | | 10/29/21 | | | | 3,226 | | | | 3,206 | | | | 3,162 | |
| | | | | | | | | | | | | | | | | | | | | | | | | | | | | | |
Total Senior Secured Loans—First Lien | | | | | | | | | | | | | | | | | | | | | | | | | 621,343 | | | | 575,083 | |
Unfunded Loan Commitments | | | | | | | | | | | | | | | | | | | | | | | | | (39,609 | ) | | | (39,609 | ) |
| | | | | | | | | | | | | | | | | | | | | | | | | | | | | | |
Net Senior Secured Loans—First Lien | | | | | | | | | | | | | | | | | | | | | | | | | 581,734 | | | | 535,474 | |
| | | | | | | |
Senior Secured Loans—Second Lien—13.2% | | | | | | | | | | | | | | | | | | | | | | | | | | |
BBB Industries US Holdings, Inc. | | | | | Automobiles & Components | | | | L+875 | | | | 1.0% | | | | 11/3/22 | | | | 10,000 | | | | 9,581 | | | | 8,917 | |
Colouroz Investment 2 LLC | | (e) | | | Materials | | | | L+725 | | | | 1.0% | | | | 9/5/22 | | | | 3,429 | | | | 3,408 | | | | 3,189 | |
Compuware Corp. | | | | | Software & Services | | | | L+825 | | | | 1.0% | | | | 12/15/22 | | | | 25,476 | | | | 22,577 | | | | 21,166 | |
DTZ U.S. Borrower, LLC | | (e) | | | Real Estate | | | | L+825 | | | | 1.0% | | | | 11/4/22 | | | | 6,261 | | | | 6,228 | | | | 6,290 | |
EagleView Technology Corp. | | | | | Software & Services | | | | L+825 | | | | 1.0% | | | | 7/14/23 | | | | 5,385 | | | | 5,312 | | | | 5,142 | |
Inmar, Inc. | | | | | Software & Services | | | | L+700 | | | | 1.0% | | | | 1/27/22 | | | | 11,783 | | | | 11,710 | | | | 10,899 | |
Neff Rental LLC | | | | | Capital Goods | | | | L+625 | | | | 1.0% | | | | 6/9/21 | | | | 33,060 | | | | 31,603 | | | | 31,655 | |
Renaissance Learning, Inc. | | (e) | | | Software & Services | | | | L+700 | | | | 1.0% | | | | 4/11/22 | | | | 2,473 | | | | 2,453 | | | | 2,291 | |
Stadium Management Corp. | | | | | Consumer Services | | | | L+825 | | | | 1.0% | | | | 2/27/21 | | | | 987 | | | | 987 | | | | 950 | |
Stardust Finance Holdings, Inc. | | (e) | | | Materials | | | | L+950 | | | | 1.0% | | | | 3/13/23 | | | | 38,125 | | | | 37,288 | | | | 36,981 | |
Templar Energy LLC | | (i)(q) | | | Energy | | | | L+750 | | | | 1.0% | | | | 11/25/20 | | | | 13,475 | | | | 12,612 | | | | 3,605 | |
TNS, Inc. | | (e) | | | Software & Services | | | | L+800 | | | | 1.0% | | | | 8/14/20 | | | | 8,820 | | | | 8,783 | | | | 8,616 | |
Toys “R” US Property Company I, LLC | | (f) | | | Real Estate | | | | L+500 | | | | 1.0% | | | | 8/21/19 | | | | 15,746 | | | | 14,413 | | | | 14,250 | |
Vantage Energy, LLC | | | | | Energy | | | | L+750 | | | | 1.0% | | | | 12/20/18 | | | | 1,800 | | | | 1,790 | | | | 1,665 | |
| | | | | | | | | | | | | | | | | | | | | | | | | | | | | | |
Total Senior Secured Loans—Second Lien | | | | | | | | | | | | | | | | | | | | | | | | | 168,745 | | | | 155,616 | |
See notes to unaudited consolidated financial statements.
3
FS Global Credit Opportunities Fund
Unaudited Consolidated Schedule of Investments (continued)
As of June 30, 2016
(in thousands, except share amounts)
| | | | | | | | | | | | | | | | | | | | | | | | | | | | |
Portfolio Company(a) | | Footnotes | | Industry | | | Rate(b) | | | Floor | | | Maturity | | Principal
Amount(c) | | | Amortized
Cost | | | Fair
Value(d) | |
Senior Secured Bonds—27.0% | | | | | | | | | | | | | | | | | | | | | | | | |
Atrium Windows and Doors, Inc. | | (o)(p) | | | Capital Goods | | | | 7.8% | | | | | | | 5/1/19 | | $ | 11,658 | | | $ | 9,913 | | | $ | 10,682 | |
Avaya Inc. | | (n)(o)(p) | | | Technology Hardware & Equipment | | | | 7.0% | | | | | | | 4/1/19 | | | 60,796 | | | | 43,307 | | | | 43,393 | |
Avaya Inc. | | (o)(p) | | | Technology Hardware & Equipment | | | | 9.0% | | | | | | | 4/1/19 | | | 408 | | | | 266 | | | | 303 | |
BlueLine Rental Finance Corp. | | (f)(n)(o) | | | Capital Goods | | | | 7.0% | | | | | | | 2/1/19 | | | 4,158 | | | | 3,429 | | | | 3,570 | |
Caesars Entertainment Resort Properties, LLC | | (p) | | | Consumer Services | | | | 8.0% | | | | | | | 10/1/20 | | | 22,000 | | | | 21,662 | | | | 22,110 | |
CEDC Finance Corporation International, Inc. | | (p) | | | Food, Beverage & Tobacco | | | | 10.0% | | | | | | | 4/30/18 | | | 26,069 | | | | 24,893 | | | | 19,606 | |
CEVA Group Plc | | (o)(p) | | | Transportation | | | | 7.0% | | | | | | | 3/1/21 | | | 20,218 | | | | 20,054 | | | | 17,514 | |
CEVA Group Plc | | (o)(p) | | | Transportation | | | | 9.0% | | | | | | | 9/1/21 | | | 20,861 | | | | 20,174 | | | | 17,021 | |
CITGO Holding, Inc. | | (o)(p) | | | Energy | | | | 10.8% | | | | | | | 2/15/20 | | | 25,460 | | | | 24,452 | | | | 25,619 | |
Eircom Finance DAC | | (n) | | | Telecommunication Services | | | | 4.5% | | | | | | | 5/31/22 | | € | 1,500 | | | | 1,703 | | | | 1,647 | |
Gogo Intermediate Holdings LLC | | (n)(o) | | | Software & Services | | | | 12.5% | | | | | | | 7/1/22 | | $ | 60,000 | | | | 60,000 | | | | 59,475 | |
iHeartCommunications, Inc. | | (n)(p) | | | Media | | | | 9.0% | | | | | | | 3/1/21 | | | 17,771 | | | | 13,899 | | | | 12,529 | |
iHeartCommunications, Inc. | | (p) | | | Media | | | | 11.3% | | | | | | | 3/1/21 | | | 21 | | | | 14 | | | | 15 | |
iHeartCommunications, Inc. | | (n)(p) | | | Media | | | | 9.0% | | | | | | | 9/15/22 | | | 9,792 | | | | 7,256 | | | | 6,708 | |
iHeartCommunications, Inc. | | (n)(o)(p) | | | Media | | | | 10.6% | | | | | | | 3/15/23 | | | 21,215 | | | | 15,852 | | | | 14,691 | |
Intelsat Jackson Holdings S.A. | | (f)(n)(o) | | | Telecommunication Services | | | | 8.0% | | | | | | | 2/15/24 | | | 15,931 | | | | 15,874 | | | | 15,787 | |
Lightstream Resources Ltd. | | (n) | | | Energy | | | | 9.9% | | | | | | | 6/15/19 | | | 12,741 | | | | 12,741 | | | | 11,594 | |
Momentive Performance Materials Inc. | | (n) | | | Materials | | | | 4.7% | | | | | | | 4/24/22 | | | 11,408 | | | | 9,703 | | | | 7,888 | |
NES Rentals Holdings, Inc. | | (n)(o)(p) | | | Capital Goods | | | | 7.9% | | | | | | | 5/1/18 | | | 14,900 | | | | 12,538 | | | | 14,248 | |
Numericable-SFR SA | | (n)(o) | | | Media | | | | 7.4% | | | | | | | 5/1/26 | | | 14,177 | | | | 14,221 | | | | 14,017 | |
| | | | | | | | | | | | | | | | | | | | | | | | | | | | |
Total Senior Secured Bonds | | | | | | | | | | | | | | | | | | | | | | | 331,951 | | | | 318,417 | |
| | | | | | | |
Subordinated Debt—34.5% | | | | | | | | | | | | | | | | | | | | | | | | |
Apex Tool Group, LLC | | (n)(o)(p) | | | Capital Goods | | | | 7.0% | | | | | | | 2/1/21 | | | 16,659 | | | | 13,074 | | | | 14,473 | |
Arch Coal, Inc. | | (i)(n)(q) | | | Energy | | | | 7.0% | | | | | | | 6/15/19 | | | 33,606 | | | | 781 | | | | 609 | |
Arch Coal, Inc. | | (i)(n)(q) | | | Energy | | | | 9.9% | | | | | | | 6/15/19 | | | 16,263 | | | | 311 | | | | 295 | |
Arch Coal, Inc. | | (i)(p)(q) | | | Energy | | | | 7.3% | | | | | | | 10/1/20 | | | 10,777 | | | | 597 | | | | 195 | |
Arch Coal, Inc. | | (i)(p)(q) | | | Energy | | | | 7.3% | | | | | | | 6/15/21 | | | 7,151 | | | | 1,632 | | | | 130 | |
Ashton Woods USA LLC | | (n)(o) | | | Consumer Durables & Apparel | | | | 6.9% | | | | | | | 2/15/21 | | | 1,390 | | | | 1,306 | | | | 1,247 | |
Aspect Software, Inc. | | (n)(o)(s) | | | Software & Services | | |
| 3.0% PIK
(3.0% Max PIK) |
| | | | | | 5/25/23 | | | 5,709 | | | | 5,709 | | | | 5,709 | |
Beazer Homes USA, Inc. | | (p) | | | Consumer Durables & Apparel | | | | 7.3% | | | | | | | 2/1/23 | | | 18,550 | | | | 17,846 | | | | 15,383 | |
CIS General Insurance Ltd. | | (n) | | | Insurance | | | | 12.0% | | | | | | | 5/8/25 | | £ | 51,987 | | | | 79,206 | | | | 70,754 | |
See notes to unaudited consolidated financial statements.
4
FS Global Credit Opportunities Fund
Unaudited Consolidated Schedule of Investments (continued)
As of June 30, 2016
(in thousands, except share amounts)
| | | | | | | | | | | | | | | | | | | | | | | | | | | | |
Portfolio Company(a) | | Footnotes | | Industry | | | Rate(b) | | | Floor | | | Maturity | | Principal
Amount(c) | | | Amortized
Cost | | | Fair
Value(d) | |
Eclipse Resources Corp. | | (n)(o) | | | Energy | | | | 8.9% | | | | | | | 7/15/23 | | $ | 4,150 | | | $ | 4,017 | | | $ | 3,927 | |
Frontier Communications Corp. | | (n)(o)(p) | | | Telecommunication Services | | | | 10.5% | | | | | | | 9/15/22 | | | 10,000 | | | | 10,309 | | | | 10,637 | |
Frontier Communications Corp. | | (o)(p) | | | Telecommunication Services | | | | 11.0% | | | | | | | 9/15/25 | | | 20,000 | | | | 20,354 | | | | 20,681 | |
iHeartCommunications, Inc. | | (n) | | | Media | | | | 10.0% | | | | | | | 1/15/18 | | | 54,267 | | | | 41,862 | | | | 28,015 | |
iHeartCommunications, Inc. | | (n) | | | Media | | |
| 12.0%, 2.0% PIK
(2.0% Max PIK) |
| | | | | | 2/1/21 | | | 2,615 | | | | 2,073 | | | | 951 | |
Intelsat Jackson Holdings S.A. | | (n) | | | Telecommunication Services | | | | 7.3% | | | | | | | 4/1/19 | | | 517 | | | | 393 | | | | 378 | |
Intelsat Jackson Holdings S.A. | | (f)(n)(p) | | | Telecommunication Services | | | | 7.3% | | | | | | | 10/15/20 | | | 25,782 | | | | 19,685 | | | | 18,402 | |
Intelsat Jackson Holdings S.A. | | (f)(n)(p) | | | Telecommunication Services | | | | 7.5% | | | | | | | 4/1/21 | | | 20,861 | | | | 15,517 | | | | 14,420 | |
Intelsat Jackson Holdings S.A. | | (n)(p) | | | Telecommunication Services | | | | 6.6% | | | | | | | 12/15/22 | | | 17,297 | | | | 10,982 | | | | 11,719 | |
Intelsat Jackson Holdings S.A. | | (f)(n)(p) | | | Telecommunication Services | | | | 5.5% | | | | | | | 8/1/23 | | | 22,735 | | | | 14,761 | | | | 14,465 | |
Northern Oil and Gas, Inc. | | (n)(p) | | | Energy | | | | 8.0% | | | | | | | 6/1/20 | | | 33,857 | | | | 27,767 | | | | 24,995 | |
Ocean Rig UDW Inc. | | (m)(n)(o) | | | Energy | | | | 7.3% | | | | | | | 4/1/19 | | | 10,000 | | | | 9,572 | | | | 5,200 | |
PriSo Acquisition Corp. | | (o)(p) | | | Capital Goods | | | | 9.0% | | | | | | | 5/15/23 | | | 21,783 | | | | 21,691 | | | | 21,456 | |
Samson Investment Co. | | (i)(n)(q) | | | Energy | | | | 9.8% | | | | | | | 2/15/20 | | | 23,114 | | | | 12,175 | | | | 508 | |
SolarCity Corporation | | (n) | | | Capital Goods | | | | 2.8% | | | | | | | 11/1/18 | | | 717 | | | | 485 | | | | 540 | |
SolarCity Corporation | | (f)(p) | | | Capital Goods | | | | 1.6% | | | | | | | 11/1/19 | | | 26,370 | | | | 17,634 | | | | 17,503 | |
SunGard Availability Services Capital, Inc. | | (n)(o)(p) | | | Software & Services | | | | 8.8% | | | | | | | 4/1/22 | | | 41,896 | | | | 28,135 | | | | 22,990 | |
Valeant Pharmaceuticals International, Inc. | | (o)(p) | | | Pharmaceuticals, Biotechnology & Life Sciences | | | | 6.8% | | | | | | | 8/15/18 | | | 6,000 | | | | 5,756 | | | | 5,813 | |
Valeant Pharmaceuticals International, Inc. | | (o)(p) | | | Pharmaceuticals, Biotechnology & Life Sciences | | | | 7.5% | | | | | | | 7/15/21 | | | 2,818 | | | | 2,499 | | | | 2,489 | |
Valeant Pharmaceuticals International, Inc. | | (n)(o)(p) | | | Pharmaceuticals, Biotechnology & Life Sciences | | | | 5.6% | | | | | | | 12/1/21 | | | 4,043 | | | | 3,211 | | | | 3,341 | |
Valeant Pharmaceuticals International, Inc. | | (o)(p) | | | Pharmaceuticals, Biotechnology & Life Sciences | | | | 7.3% | | | | | | | 7/15/22 | | | 2,016 | | | | 1,766 | | | | 1,731 | |
Valeant Pharmaceuticals International, Inc. | | (f)(r) | | | Pharmaceuticals, Biotechnology & Life Sciences | | | | 4.5% | | | | | | | 5/15/23 | | € | 7,309 | | | | 6,353 | | | | 6,137 | |
Valeant Pharmaceuticals International, Inc. | | (f)(o)(p) | | | Pharmaceuticals, Biotechnology & Life Sciences | | | | 6.1% | | | | | | | 4/15/25 | | $ | 19,037 | | | | 15,468 | | | | 15,349 | |
Western Digital Corp. | | (o)(p) | | | Technology Hardware & Equipment | | | | 10.5% | | | | | | | 4/1/24 | | | 44,290 | | | | 44,459 | | | | 47,446 | |
| | | | | | | | | | | | | | | | | | | | | | | | | | | | |
Total Subordinated Debt | | | | | | | | | | | | | | | | | | | | | | | 457,386 | | | | 407,888 | |
| | | | | | | |
Collateralized Securities—1.4% | | | | | | | | | | | | | | | | | | | | | | | | |
Cedar Funding Ltd. CLO 2014-4A Class Subord. | | (o) | | | Diversified Financials | | | | 16.6% | | | | | | | 10/23/16 | | | 1,000 | | | | 737 | | | | 764 | |
CGMS CLO 2014-1 Class Subord. | | (o) | | | Diversified Financials | | | | 8.5% | | | | | | | 4/17/25 | | | 8,000 | | | | 5,489 | | | | 5,462 | |
CGMS CLO 2015-1A Class Subord. | | (o) | | | Diversified Financials | | | | 10.8% | | | | | | | 4/20/27 | | | 5,000 | | | | 3,249 | | | | 3,275 | |
Palmer Square CLO 2015-1A Class Subord. | | (o) | | | Diversified Financials | | | | 15.4% | | | | | | | 5/21/27 | | | 1,000 | | | | 697 | | | | 689 | |
VOYA CLO 2014-3A Class Subord. | | (o) | | | Diversified Financials | | | | 7.9% | | | | | | | 7/25/26 | | | 5,000 | | | | 3,135 | | | | 2,890 | |
Wind River CLO Ltd. 2013-2A Class Subord. | | (o) | | | Diversified Financials | | | | 10.3% | | | | | | | 1/18/26 | | | 6,000 | | | | 3,743 | | | | 3,291 | |
| | | | | | | | | | | | | | | | | | | | | | | | | | | | |
Total Collateralized Securities | | | | | | | | | | | | | | | | | | | | | | | 17,050 | | | | 16,371 | |
See notes to unaudited consolidated financial statements.
5
FS Global Credit Opportunities Fund
Unaudited Consolidated Schedule of Investments (continued)
As of June 30, 2016
(in thousands, except share amounts)
| | | | | | | | | | | | | | | | | | | | | | |
Portfolio Company(a) | | Footnotes | | Industry | | | Rate(b) | | | Number of
Shares /
Contracts | | | Cost | | | Fair
Value(d) | |
Equity/Other—8.3% | | | | | | | | | | | | | | | | | | | | | | |
Aspect Software, Inc., Common Equity | | (i)(s) | | | Software & Services | | | | | | | | 605,504 | | | $ | 29,912 | | | $ | 31,759 | |
Cheniere Energy Partners LP Holdings, LLC, Common Equity | | (n) | | | Energy | | | | | | | | 143,545 | | | | 2,549 | | | | 2,861 | |
Enviva Partners, LP, Common Equity | | (n) | | | Energy | | | | | | | | 646,395 | | | | 10,950 | | | | 14,712 | |
Federal Home Loan Mortgage Corp., Preferred Equity | | (i)(n) | | | Real Estate | | | | 5.1% | | | | 5,915 | | | | 44 | | | | 40 | |
Federal Home Loan Mortgage Corp., Series F Preferred Equity | | (i)(n) | | | Real Estate | | | | 5.0% | | | | 18,232 | | | | 303 | | | | 109 | |
Federal Home Loan Mortgage Corp., Series K Preferred Equity | | (i)(n) | | | Real Estate | | | | 5.8% | | | | 10,575 | | | | 175 | | | | 73 | |
Federal Home Loan Mortgage Corp., Series O Preferred Equity | | (i)(n) | | | Real Estate | | | | 5.8% | | | | 10,210 | | | | 169 | | | | 72 | |
Federal Home Loan Mortgage Corp., Series R Preferred Equity | | (i)(n) | | | Real Estate | | | | 5.7% | | | | 36,720 | | | | 244 | | | | 234 | |
Federal Home Loan Mortgage Corp., Series S Preferred Equity | | (i)(n) | | | Real Estate | | | | 4.0% | | | | 27,893 | | | | 204 | | | | 176 | |
Federal Home Loan Mortgage Corp., Series U Preferred Equity | | (i)(n) | | | Real Estate | | | | 5.9% | | | | 9,600 | | | | 36 | | | | 33 | |
Federal Home Loan Mortgage Corp., Series V Preferred Equity | | (i)(n) | | | Real Estate | | | | 5.6% | | | | 66,000 | | | | 632 | | | | 218 | |
Federal Home Loan Mortgage Corp., Series W Preferred Equity | | (i)(n) | | | Real Estate | | | | 5.7% | | | | 59,691 | | | | 260 | | | | 198 | |
Federal Home Loan Mortgage Corp., Series X Preferred Equity | | (i)(n) | | | Real Estate | | | | 6.0% | | | | 236,748 | | | | 1,024 | | | | 829 | |
Federal Home Loan Mortgage Corp., Series Z Preferred Equity | | (i)(n) | | | Real Estate | | | | 7.9% | | | | 2,797,355 | | | | 13,246 | | | | 12,448 | |
Federal National Mortgage Association, Series 2004-1 Preferred Equity | | (i)(n) | | | Real Estate | | | | 5.4% | | | | 34 | | | | 579 | | | | 391 | |
Federal National Mortgage Association, Series F Preferred Equity | | (i)(n) | | | Real Estate | | | | CMT-16 | | | | 15,106 | | | | 263 | | | | 104 | |
Federal National Mortgage Association, Series H Preferred Equity | | (i)(n) | | | Real Estate | | | | 5.8% | | | | 25,804 | | | | 392 | | | | 187 | |
Federal National Mortgage Association, Series R Preferred Equity | | (i)(n) | | | Real Estate | | | | 7.6% | | | | 66,000 | | | | 624 | | | | 271 | |
Federal National Mortgage Association, Series S Preferred Equity | | (i)(n) | | | Real Estate | | | | 7.8% | | | | 2,244,468 | | | | 9,551 | | | | 10,033 | |
Federal National Mortgage Association, Series T Preferred Equity | | (i)(n) | | | Real Estate | | | | 8.3% | | | | 140,833 | | | | 831 | | | | 656 | |
iStar Financial Inc., Series D Preferred Equity | | (n) | | | Real Estate | | | | 8.0% | | | | 156,663 | | | | 3,924 | | | | 3,657 | |
iStar Financial Inc., Series F Preferred Equity | | (n) | | | Real Estate | | | | 7.8% | | | | 6,350 | | | | 151 | | | | 146 | |
iStar Financial Inc., Series G Preferred Equity | | (n) | | | Real Estate | | | | 7.7% | | | | 8,149 | | | | 189 | | | | 182 | |
iStar Financial Inc., Series I Preferred Equity | | (n) | | | Real Estate | | | | 7.5% | | | | 167,309 | | | | 3,958 | | | | 3,764 | |
MPM Holdings, Inc., Common Equity | | (i)(n)(o) | | | Materials | | | | | | | | 618 | | | | 13 | | | | 5 | |
Northern Oil and Gas, Inc., Common Equity | | (i)(n) | | | Energy | | | | | | | | 597,597 | | | | 2,054 | | | | 2,761 | |
Warrior Met Coal, LLC, Common Equity, Class A Units | | (i) | | | Materials | | | | | | | | 20,804 | | | | 2,278 | | | | 2,985 | |
Warrior Met Coal, LLC, Common Equity, Class B Units | | (i) | | | Materials | | | | | | | | 47,983 | | | | 3,398 | | | | 6,885 | |
White Star Petroleum Holdings, LLC, Common Equity | | (i) | | | Energy | | | | | | | | 2,969,914 | | | | 2,524 | | | | 2,524 | |
| | | | | | | | | | | | | | | | | | | | | | |
Total Equity/Other | | | | | | | | | | | | | | | | | 90,477 | | | | 98,313 | |
| | | | | | | | | | | | | | | | | | | | | | |
TOTAL INVESTMENTS—129.7% | | | | | | | | | | | | | | | | $ | 1,647,343 | | | | 1,532,079 | |
| | | | | | | | | | | | | | | | | | | | | | |
Liabilities in Excess of Other Assets—(29.7%) | | (j) | | | | | | | | | | | | | | | | | | | (350,740 | ) |
| | | | | | | | | | | | | | | | | | | | | | |
NET ASSETS—100.0% | | | | | | | | | | | | | | | | | | | | $ | 1,181,339 | |
| | | | | | | | | | | | | | | | | | | | | | |
See notes to unaudited consolidated financial statements.
6
FS Global Credit Opportunities Fund
Unaudited Consolidated Schedule of Investments (continued)
As of June 30, 2016
(in thousands, except share amounts)
| | | | | | | | | | | | | | | | | | | | | | | | | | | | |
Credit Default Swaps on Corporate Issues—Buy Protection | | | | | | | | | | | | | | | | | | | | |
| | | | | | | | | | | | | | | | | | | | | | | | | | | | | | |
Reference Entity | | Counterparty | | Implied Credit
Spread at
June 30, 2016(k) | | | Industry | | Fixed
Deal
Pay
Rate | | | Maturity | | Notional(l) | | | Fair
Value(d) | | | Unamortized
Premiums
Paid | | | Unrealized
Appreciation
(Depreciation) | |
Hovnanian Enterprises, Inc. | | JPMorgan Chase Bank, N.A. | | | 18.8 | % | | Consumer Durables & Apparel | | | 5.0 | % | | 9/20/19 | | $ | (5,000 | ) | | $ | 1,499 | | | $ | 944 | | | $ | 555 | |
Hovnanian Enterprises, Inc. | | JPMorgan Chase Bank, N.A. | | | 18.5 | % | | Consumer Durables & Apparel | | | 5.0 | % | | 12/20/19 | | | (2,000 | ) | | | 621 | | | | 434 | | | | 187 | |
| (a) | Security may be an obligation of one or more entities affiliated with the named company. |
| (b) | Certain variable rate securities in FS Global Credit Opportunities Fund’s (the “Fund”) portfolio bear interest at a rate determined by a publicly disclosed base rate plus a basis point spread. As of June 30, 2016, the three-month London Interbank Offered Rate (“L”) was 0.65%, the three-month Euro Interbank Offered Rate (“E”) was (0.29)% and the two-year Constant Maturity Treasury Rate (“CMT”) was 0.58%. |
| (c) | Denominated in U.S. dollars, unless otherwise noted. |
| (d) | Fair value is determined by the Fund’s board of trustees. See Note 2 for information on the Fund’s policy regarding valuation of investments, fair value hierarchy levels and other significant accounting policies. |
| (e) | Security or portion thereof held by Dauphin Funding LLC (“Dauphin Funding”), a wholly-owned subsidiary of the Fund, and is pledged as collateral supporting the amounts outstanding under Dauphin Funding’s revolving credit facility with Deutsche Bank AG, New York Branch (see Note 9). |
| (f) | Position or portion thereof unsettled as of June 30, 2016. |
| (g) | Security is an unfunded loan commitment. |
| (h) | Security or portion thereof held by FS Global Credit Opportunities (Luxembourg) S.à r.l., a wholly-owned subsidiary of the Fund. |
| (i) | Security is non-income producing. |
| (j) | Includes the effect of credit default swap positions. |
| (k) | Implied credit spread, represented in absolute terms, utilized in determining the fair value of the credit default swap agreements as of period end serves as an indicator of the current status of the payment/performance risk and represents the likelihood or risk of default for the credit derivative. The implied credit spread of a particular reference entity reflects the cost of buying/selling protection and may include upfront payments required in connection with the entrance into the agreement. Wider credit spreads generally represent a deterioration of the reference entity’s credit soundness and a greater likelihood or risk of default or other credit event occurring, as defined under the terms of the applicable agreement. |
| (l) | The maximum potential amount the Fund could be required to pay as a seller of credit protection or receive as a buyer of credit protection if a credit event occurs, as defined under the terms of the applicable agreement. |
| (m) | Security or portion thereof on loan as of June 30, 2016. |
See notes to unaudited consolidated financial statements.
7
FS Global Credit Opportunities Fund
Unaudited Consolidated Schedule of Investments (continued)
As of June 30, 2016
(in thousands, except share amounts)
| (n) | Security or portion thereof pledged as collateral supporting the amounts outstanding under the Fund’s prime brokerage facility with JPMorgan Chase Bank, N.A. |
| (o) | Restricted security as to resale. As of June 30, 2016, the Fund held 36.8% of its net assets, with a fair value of $435,185, in restricted securities. |
| (p) | Security or portion thereof held by Bucks Funding, a wholly-owned subsidiary of the Fund, and is pledged as collateral supporting the amounts outstanding under Bucks Funding’s prime brokerage facility with BNP Paribas Prime Brokerage, Inc. (“BNPP”). Securities held by Bucks Funding may be rehypothecated from time to time as permitted by Rule 15c-1(a)(1) promulgated under the Securities Exchange Act of 1934, as amended, subject to the terms and conditions governing Bucks Funding’s prime brokerage facility with BNPP (see Note 9). |
| (q) | Security was on non-accrual status as of June 30, 2016. |
| (r) | Security or portion thereof held by FS Global Credit Opportunities Fund (Cayman), a wholly-owned subsidiary of the Fund. |
| (s) | Under the Investment Company Act of 1940, as amended, the Fund generally is deemed to be an “affiliated person” of a portfolio company if it owns 5% or more of the portfolio company’s voting securities and generally is deemed to “control” a portfolio company if it owns more than 25% of the portfolio company’s voting securities or it has the power to exercise control over the management or policies of such portfolio company. As of June 30, 2016, the Fund held investments in one portfolio company of which it is deemed to be an “affiliated person” but is not deemed to “control”. The following table presents certain information with respect to such portfolio company for the six months ended June 30, 2016: |
| | | | | | | | | | | | | | | | | | | | | | | | | | | | |
Portfolio Company | | Purchases | | | Sales and
Repayments | | | Interest
Income | | | Fee
Income | | | Dividend
Income | | | Net
Realized
Gain
(Loss) | | | Net Change in
Unrealized
Appreciation
(Depreciation) | |
Senior Secured Loans—First Lien | | | | | | | | | | | | | | | | | | | | | | | | | | | | |
Aspect Software, Inc. | | $ | 7,183 | | | | — | | | $ | 78 | | | | — | | | | — | | | | — | | | $ | 54 | |
Aspect Software, Inc.(1) | | | — | | | | — | | | | — | | | $ | 142 | | | | — | | | | — | | | $ | 18 | |
Subordinated Debt | | | | | | | | | | | | | | | | | | | | | | | | | | | | |
Aspect Software, Inc. | | $ | 5,709 | | | | — | | | $ | 17 | | | | — | | | | — | | | | — | | | | — | |
Equity/Other | | | | | | | | | | | | | | | | | | | | | | | | | | | | |
Aspect Software, Inc., Common Equity | | $ | 29,912 | | | | — | | | | — | | | | — | | | | — | | | | — | | | $ | 1,847 | |
| (1) | Security is an unfunded commitment. |
See notes to unaudited consolidated financial statements.
8
FS Global Credit Opportunities Fund
Unaudited Consolidated Statement of Assets and Liabilities
(in thousands, except share and per share amounts)
| | | | |
| | | June 30, 2016 | |
Assets | | | | |
Investments, at fair value—unaffiliated (amortized cost—$1,602,185)(1) | | $ | 1,485,002 | |
Investments, at fair value—affiliated (amortized cost—$45,158) | | | 47,077 | |
Cash | | | 109,310 | |
Foreign currency (cost—$28,705) | | | 24,340 | |
Interest receivable | | | 24,299 | |
Collateral held at broker for open swap contracts | | | 2,300 | |
Receivable for investments sold and repaid | | | 24,970 | |
Collateral held for securities loaned | | | 1,792 | |
Receivable for common shares sold | | | 4,790 | |
Expense reimbursement due from sponsor(2) | | | 2,123 | |
Unamortized swap premiums paid | | | 1,378 | |
Unrealized appreciation on credit default swaps | | | 742 | |
Deferred financing costs | | | 95 | |
| | | | |
Total assets | | $ | 1,728,218 | |
| | | | |
Liabilities | | | | |
Obligation to return collateral held for securities loaned | | $ | 1,792 | |
Payable for investments purchased | | | 45,886 | |
Credit facilities payable (net of deferred financing costs—$0) | | | 332,586 | |
Cash due to broker | | | 153,220 | |
Interest expense payable | | | 2,359 | |
Shareholder distributions payable | | | 635 | |
Management fees payable | | | 8,525 | |
Administrative services expense payable | | | 56 | |
Accounting and administrative fees payable | | | 270 | |
Professional fees payable | | | 381 | |
Payable on credit default swaps | | | 6 | |
Trustees’ fees payable | | | 533 | |
Other accrued expenses and liabilities | | | 630 | |
| | | | |
Total liabilities | | $ | 546,879 | |
| | | | |
Net assets | | $ | 1,181,339 | |
| | | | |
Commitments and contingencies—($8,216)(3) | | | | |
| |
Composition of net assets | | | | |
Common shares, $0.001 par value, unlimited shares authorized, 161,853,112 shares issued and outstanding | | $ | 162 | |
Capital in excess of par value | | | 1,408,467 | |
Accumulated net realized gain (loss)(4) | | | (136,270 | ) |
Accumulated net investment income(4) | | | 6,713 | |
Net unrealized appreciation (depreciation) | | | (97,733 | ) |
| | | | |
Net assets | | $ | 1,181,339 | |
| | | | |
Net asset value per common share at period end | | $ | 7.30 | |
| (1) | Includes fair value of securities on loan of $1,758. |
| (2) | See Note 4 for a discussion of reimbursements payable to the Fund by its investment adviser and affiliates. |
| (3) | See Note 11 for a discussion of the Fund’s commitments and contingencies. |
| (4) | See Note 5 for a discussion of the sources of distributions declared by the Fund. |
See notes to unaudited consolidated financial statements.
9
FS Global Credit Opportunities Fund
Unaudited Consolidated Statement of Operations
(in thousands)
| | | | |
| | | Six Months Ended
June 30, 2016 | |
Investment income | | | | |
Interest income—unaffiliated | | $ | 72,244 | |
Interest income—affiliated | | | 95 | |
Dividend income—unaffiliated | | | 1,108 | |
Fee income—unaffiliated | | | 1,985 | |
Fee income—affiliated | | | 142 | |
Securities lending income—unaffiliated | | | 247 | |
| | | | |
Total investment income | | | 75,821 | |
| | | | |
Operating expenses | | | | |
Management fees | | | 15,245 | |
Administrative services expenses | | | 380 | |
Accounting and administrative fees | | | 570 | |
Interest expense | | | 3,778 | |
Professional fees | | | 205 | |
Trustees’ fees | | | 363 | |
Other general and administrative expenses | | | 1,750 | |
| | | | |
Total operating expenses | | | 22,291 | |
Less: Expense reimbursement from sponsor(1) | | | (8,194 | ) |
| | | | |
Net operating expenses | | | 14,097 | |
| | | | |
Net investment income (loss) | | | 61,724 | |
| | | | |
Realized and unrealized gain/loss | | | | |
Net realized gain (loss) on investments—unaffiliated | | | (44,419 | ) |
Net realized gain (loss) on credit default swaps | | | (6,826 | ) |
Net realized gain (loss) on foreign currency | | | (1,259 | ) |
Net change in unrealized appreciation (depreciation) on investments—unaffiliated | | | 74,433 | |
Net change in unrealized appreciation (depreciation) on investments—affiliated | | | 1,919 | |
Net change in unrealized appreciation (depreciation) on credit default swaps | | | (528 | ) |
Net change in unrealized gain (loss) on foreign currency | | | 13,613 | |
| | | | |
Total net realized gain (loss) and unrealized appreciation (depreciation) | | | 36,933 | |
| | | | |
Net increase (decrease) in net assets resulting from operations | | $ | 98,657 | |
| | | | |
| (1) | See Note 4 for a discussion of reimbursements paid to the Fund by its investment adviser and affiliates. |
See notes to unaudited consolidated financial statements.
10
FS Global Credit Opportunities Fund
Consolidated Statements of Changes in Net Assets
(in thousands)
| | | | | | | | |
| | | Six Months Ended
June 30, 2016
(Unaudited) | | | Year Ended
December 31, 2015 | |
Operations | | | | | | | | |
Net investment income (loss) | | $ | 61,724 | | | $ | 86,589 | |
Net realized gain (loss) | | | (52,504 | ) | | | (67,269 | ) |
Net change in unrealized appreciation (depreciation) on investments | | | 76,352 | | | | (141,410 | ) |
Net change in unrealized appreciation (depreciation) on credit default swaps | | | (528 | ) | | | 2,486 | |
Net change in unrealized appreciation (depreciation) on options written | | | — | | | | 1,333 | |
Net change in unrealized gain (loss) on foreign currency | | | 13,613 | | | | 1,249 | |
Net change in unrealized appreciation (depreciation) on investments sold short | | | — | | | | (185 | ) |
| | | | | | | | |
Net increase (decrease) in net assets resulting from operations | | | 98,657 | | | | (117,207 | ) |
| | | | | | | | |
Shareholder distributions(1) | | | | | | | | |
Distributions from net investment income | | | (61,724 | ) | | | (86,589 | ) |
| | | | | | | | |
Net decrease in net assets resulting from shareholder distributions | | | (61,724 | ) | | | (86,589 | ) |
| | | | | | | | |
Capital share transactions | | | | | | | | |
Issuance of common shares(2) | | | 218,636 | | | | 545,947 | |
| | | | | | | | |
Net increase in net assets resulting from capital share transactions | | | 218,636 | | | | 545,947 | |
| | | | | | | | |
Total increase in net assets | | | 255,569 | | | | 342,151 | |
Net assets at beginning of period | | | 925,770 | | | | 583,619 | |
| | | | | | | | |
Net assets at end of period | | $ | 1,181,339 | | | $ | 925,770 | |
| | | | | | | | |
Accumulated net investment income(1) | | $ | 6,713 | | | $ | 6,713 | |
| | | | | | | | |
| (1) | See Note 5 for a discussion of the sources of distributions declared by the Fund. |
| (2) | See Note 3 for a discussion of transactions with respect to the Fund’s common shares for the six months ended June 30, 2016 and the year ended December 31, 2015. |
See notes to unaudited consolidated financial statements.
11
FS Global Credit Opportunities Fund
Unaudited Consolidated Statement of Cash Flows
(in thousands)
| | | | |
| | | Six Months Ended
June 30, 2016 | |
Cash flows from operating activities | | | | |
Net increase (decrease) in net assets resulting from operations | | $ | 98,657 | |
Adjustments to reconcile net increase (decrease) in net assets resulting from operations to net cash used in operating activities: | | | | |
Purchases of investments | | | (1,118,421 | ) |
Paid-in-kind interest | | | (438 | ) |
Proceeds from sales and repayments of investments | | | 668,421 | |
Premiums paid on credit default swaps—buy, net | | | 12,032 | |
Premiums received on credit default swaps—sell, net | | | (1,374 | ) |
Net realized (gain) loss on investments | | | 44,419 | |
Net change in unrealized (appreciation) depreciation on investments | | | (76,352 | ) |
Net change in unrealized (appreciation) depreciation on credit default swaps | | | 528 | |
Accretion of discount | | | (13,952 | ) |
Amortization of deferred financing costs | | | 340 | |
(Gain) loss on borrowings in foreign currency | | | (3,297 | ) |
(Increase) decrease in collateral held at broker for open swap contracts | | | (806 | ) |
(Increase) decrease in expense reimbursement due from sponsor(1) | | | 4,981 | |
(Increase) decrease in receivable for investments sold and repaid | | | (11,720 | ) |
(Increase) decrease in interest receivable | | | (5,662 | ) |
(Increase) decrease in receivable on credit default swaps | | | 22 | |
(Increase) decrease in prepaid expenses | | | 5 | |
Increase (decrease) in payable on credit default swaps | | | (76 | ) |
Increase (decrease) in payable for investments purchased | | | 36,168 | |
Increase (decrease) in cash due to broker | | | 117,578 | |
Increase (decrease) in interest expense payable | | | 1,561 | |
Increase (decrease) in management fees payable | | | 1,609 | |
Increase (decrease) in administrative services expense payable | | | (201 | ) |
Increase (decrease) in accounting and administrative fees payable | | | 45 | |
Increase (decrease) in professional fees payable | | | (183 | ) |
Increase (decrease) in trustees’ fees payable | | | 68 | |
Increase (decrease) in other accrued expenses and liabilities | | | (149 | ) |
| | | | |
Net cash used in operating activities | | | (246,197 | ) |
| | | | |
Cash flows from financing activities | | | | |
Issuance of common shares | | | 225,909 | |
Shareholder distributions | | | (61,711 | ) |
Borrowings under credit facilities(2) | | | 25,000 | |
| | | | |
Net cash provided by financing activities | | | 189,198 | |
| | | | |
Total increase (decrease) in cash(3) | | | (56,999 | ) |
Cash at beginning of period | | | 190,649 | |
| | | | |
Cash at end of period(4) | | $ | 133,650 | |
| | | | |
| (1) | See Note 4 for a discussion of reimbursements paid to the Fund by its investment adviser and affiliates. |
| (2) | See Note 9 for a discussion of the Fund’s financing arrangements. During the six months ended June 30, 2016, the Fund paid $1,638 of interest expense on the financing arrangements and paid $239 on amounts due to broker. |
| (3) | Includes net change in unrealized gain (loss) on foreign currency of $207. |
| (4) | Balance includes foreign currency. |
See notes to unaudited consolidated financial statements.
12
FS Global Credit Opportunities Fund
Consolidated Financial Highlights
(in thousands, except share and per share amounts)
| | | | | | | | | | | | | | | | |
| | | Six Months Ended
June 30, 2016
(Unaudited) | | | Year Ended
December 31,
2015 | | | Year Ended
December 31,
2014 | | | Period from
January 28, 2013
(Inception) to
December 31, 2013 | |
Per Share Data:(1) | | | | | | | | | | | | | | | | |
Net asset value, beginning of period | | $ | 7.11 | | | $ | 8.91 | | | $ | 10.02 | | | $ | 10.00 | |
Results of operations | | | | | | | | | | | | | | | | |
Net investment income (loss)(2)(3) | | | 0.42 | | | | 0.87 | | | | 0.87 | | | | — | |
Net realized and unrealized appreciation (depreciation) | | | 0.19 | | | | (1.80 | ) | | | (1.11 | ) | | | 0.07 | |
| | | | | | | | | | | | | | | | |
Net increase (decrease) in net assets resulting from operations | | | 0.61 | | | | (0.93 | ) | | | (0.24 | ) | | | (0.07 | ) |
| | | | | | | | | | | | | | | | |
Shareholder distributions(4) | | | | | | | | | | | | | | | | |
Distributions from net investment income | | | (0.42 | ) | | | (0.87 | ) | | | (0.87 | ) | | | (0.05 | ) |
| | | | | | | | | | | | | | | | |
Net decrease in net assets resulting from shareholder distributions | | | (0.42 | ) | | | (0.87 | ) | | | (0.87 | ) | | | (0.05 | ) |
| | | | | | | | | | | | | | | | |
Net asset value, end of period | | $ | 7.30 | | | $ | 7.11 | | | $ | 8.91 | | | $ | 10.02 | |
| | | | | | | | | | | | | | | | |
Shares outstanding, end of period | | | 161,853,112 | | | | 130,181,842 | | | | 65,529,194 | | | | 4,857,035 | |
| | | | | | | | | | | | | | | | |
Total return(5)(6) | | | 9.06 | % | | | (11.37 | )% | | | (2.94 | )% | | | 0.65 | % |
| | | | | | | | | | | | | | | | |
Ratio/Supplemental Data: | | | | | | | | | | | | | | | | |
Net assets, end of period | | $ | 1,181,339 | | | $ | 925,770 | | | $ | 583,619 | | | $ | 48,644 | |
| | | | | | | | | | | | | | | | |
Ratio of net investment income (loss) to average net assets(7)(8) | | | 6.01 | % | | | 10.53 | % | | | 9.01 | % | | | (0.41 | )% |
| | | | | | | | | | | | | | | | |
Ratio of total operating expenses to average net assets(7) | | | 2.17 | % | | | 4.69 | % | | | 3.72 | % | | | 9.36 | % |
Ratio of expense reimbursement from sponsor to average net assets(7) | | | (0.80 | )% | | | (1.51 | )% | | | (3.10 | )% | | | (8.53 | )% |
| | | | | | | | | | | | | | | | |
Ratio of net operating expenses to average net assets(7) | | | 1.37 | % | | | 3.18 | % | | | 0.62 | % | | | 0.83 | % |
| | | | | | | | | | | | | | | | |
Portfolio turnover(6) | | | 51.10 | % | | | 124.78 | % | | | 165.25 | % | | | — | |
| | | | | | | | | | | | | | | | |
Total amount of senior securities outstanding exclusive of treasury securities | | $ | 485,806 | | | $ | 346,525 | | | $ | 157,721 | | | $ | — | |
| | | | | | | | | | | | | | | | |
Asset coverage per unit(9) | | | 3.43 | | | | 3.63 | | | | 4.45 | | | | — | |
| | | | | | | | | | | | | | | | |
| (1) | Per share data may be rounded in order to compute the ending net asset value per share. |
| (2) | The per share data was derived by using the average number of common shares outstanding during the applicable period. |
| (3) | Net investment loss for the period from January 28, 2013 (Inception) to December 31, 2013 was less than $0.005 per common share. |
See notes to unaudited consolidated financial statements.
13
FS Global Credit Opportunities Fund
Consolidated Financial Highlights (continued)
(in thousands, except share and per share amounts)
| (4) | The per share data for distributions reflects the actual amount of distributions declared per common share during the applicable period. |
| (5) | The total return for each period presented is historical and is calculated by determining the percentage change in net asset value, assuming the reinvestment of all distributions in additional common shares of the Fund at the Fund’s net asset value per share as of the share closing date occurring on or immediately following the distribution payment date. The historical calculation of total return in the table should not be considered a representation of the Fund’s future total return, which may be greater or less than the total return shown in the table due to a number of factors, including, among others, the Fund’s ability or inability to make investments that meet its investment criteria, the interest rates payable on the debt securities the Fund acquires, the level of the Fund’s expenses, variations in and the timing of the recognition of realized and unrealized gains or losses, the degree to which the Fund encounters competition in its markets and general economic conditions. As a result of these and other factors, results for any previous period should not be relied upon as being indicative of performance in future periods. The total return calculations set forth above represent the total return on the Fund’s investment portfolio during the applicable period and do not represent an actual return to shareholders. |
| (6) | Data for periods of less than one year are not annualized. |
| (7) | Average daily net assets for the applicable period is used for this calculation. The period from January 28, 2013 (Inception) to December 31, 2013 is annualized. The six months ended June 30, 2016 is not annualized. |
| (8) | Had the sponsor not reimbursed certain operating expenses, the ratio of net investment income (loss) to average net assets would have been 5.21%, 9.02%, 5.91% and (8.94)% for the six months ended June 30, 2016, the years ended December 31, 2015 and 2014 and the period from January 28, 2013 (Inception) to December 31, 2013, respectively. |
| (9) | Asset coverage per unit is the ratio of the carrying value of the Fund’s total consolidated assets available to cover senior securities, less all liabilities and indebtedness not represented by senior securities, to the aggregate amount of senior securities representing indebtedness. |
See notes to unaudited consolidated financial statements.
14
FS Global Credit Opportunities Fund
Notes to Unaudited Consolidated Financial Statements
(in thousands, except share and per share amounts)
Note 1. Principal Business and Organization
FS Global Credit Opportunities Fund, or the Fund, was organized as a Delaware statutory trust on January 28, 2013 and commenced investment operations on December 12, 2013 upon FS Global Credit Opportunities Fund—A, or Fund—A, and FS Global Credit Opportunities Fund—D, or Fund—D, and, together with Fund—A, the Companies, collectively raising net offering proceeds of $2,500 in the aggregate, or the minimum offering requirement, from the sale of common shares in their continuous public offerings to persons who were not affiliated with the Fund, the Companies, the Fund’s investment adviser, FS Global Advisor, LLC, or FS Global Advisor, or the investment sub-adviser to FS Global Advisor, GSO Capital Partners LP, or GSO. FS Global Advisor is a private investment firm that is registered as an investment adviser under the Investment Advisers Act of 1940, as amended, and an affiliate of the Fund’s sponsor, Franklin Square Holdings, L.P., or Franklin Square Holdings.
The Companies each closed their respective continuous public offerings to new investors in April 2016. Two new feeder funds of the Fund, FS Global Credit Opportunities Fund—T, or Fund—T, and FS Global Credit Opportunities Fund—ADV, or Fund—ADV, and collectively with the Companies and Fund—T, the Feeder Funds, were formed in February 2016. Fund—T commenced its investment operations in June 2016. As of June 30, 2016, approximately 83.7%, 16.1% and 0.2% of the Fund’s outstanding common shares of beneficial interest, par value $0.001 per share, or its common shares, were held by Fund—A, Fund—D and Fund—T, respectively.
The Fund is a non-diversified, closed-end management investment company registered under the Investment Company Act of 1940, as amended, or the 1940 Act, that has elected to be treated for U.S. federal income tax purposes, and intends to qualify annually, as a regulated investment company, or RIC, under Subchapter M of the Internal Revenue Code of 1986, as amended, or the Code. As of June 30, 2016, the Fund had two wholly-owned financing subsidiaries and three wholly-owned subsidiaries through which it holds interests in certain portfolio companies. The unaudited consolidated financial statements include both the Fund’s accounts and the accounts of its wholly-owned subsidiaries as of June 30, 2016. All significant intercompany transactions have been eliminated in consolidation. Certain of the Fund’s consolidated subsidiaries may be subject to foreign income taxes.
The Fund’s primary investment objective is to generate an attractive total return consisting of a high level of current income and capital appreciation, with a secondary objective of capital preservation.
Note 2. Summary of Significant Accounting Policies
Basis of Presentation: The accompanying unaudited consolidated financial statements of the Fund have been prepared in accordance with U.S. generally accepted accounting principles, or GAAP, for interim financial information. Accordingly, they do not include all of the information and footnotes required by GAAP for complete financial statements. In the opinion of management, all adjustments (consisting of normal recurring accruals) considered necessary for a fair presentation have been included. For a more complete discussion of significant accounting policies and certain other information, the Fund’s unaudited consolidated financial statements should be read in conjunction with its audited consolidated financial statements as of and for the year ended December 31, 2015 included in the Fund’s certified shareholder report on Form N-CSR. Operating results for the six months ended June 30, 2016 are not necessarily indicative of the results that may be expected for the year ending December 31, 2016. The Fund is considered an investment company under GAAP and follows the accounting and reporting guidance applicable to investment companies. The Fund has evaluated the impact of subsequent events through the date the unaudited consolidated financial statements were issued and filed with the U.S. Securities and Exchange Commission, or the SEC.
15
FS Global Credit Opportunities Fund
Notes to Unaudited Consolidated Financial Statements (continued)
(in thousands, except share and per share amounts)
Note 2. Summary of Significant Accounting Policies (continued)
Use of Estimates: The preparation of the Fund’s unaudited consolidated financial statements in conformity with GAAP requires management to make estimates and assumptions that affect the reported amounts of assets and liabilities, and disclosure of contingent assets and liabilities, at the date of the unaudited consolidated financial statements and the reported amounts of revenues and expenses during the reporting period. Actual results could differ from those estimates. Many of the amounts have been rounded and all amounts are in thousands, except share and per share amounts.
Cash and Cash Equivalents: The Fund considers all highly liquid investments with original maturities of three months or less to be cash equivalents. The Fund’s cash and cash equivalents are maintained with high credit quality financial institutions.
Valuation of Portfolio Investments: The Fund determines the net asset value, or NAV, of its common shares on each day that the New York Stock Exchange, or the NYSE, is open for business as of the close of the regular trading session on the NYSE. The Fund calculates the NAV of its common shares by subtracting liabilities (including accrued expenses and distributions) from the total assets of the Fund (the value of securities, plus cash and other assets, including interest and distributions accrued but not yet received) and dividing the result by the total number of its outstanding common shares. The Fund’s assets and liabilities are valued in accordance with the principles set forth below.
Accounting Standards Codification Topic 820, Fair Value Measurements and Disclosures, or ASC Topic 820, issued by the Financial Accounting Standards Board, or the FASB, clarifies the definition of fair value and requires companies to expand their disclosure about the use of fair value to measure assets and liabilities in interim and annual periods subsequent to initial recognition. ASC Topic 820 defines fair value as the price that would be received from the sale of an asset or paid to transfer a liability in an orderly transaction between market participants at the measurement date. ASC Topic 820 also establishes a three-tier fair value hierarchy, which prioritizes the inputs used in measuring fair value. These tiers include: Level 1, defined as observable inputs such as quoted prices in active markets; Level 2, which includes inputs such as quoted prices for similar securities in active markets and quoted prices for identical securities where there is little or no activity in the market; and Level 3, defined as unobservable inputs for which little or no market data exists, therefore requiring an entity to develop its own assumptions.
The Fund expects that its portfolio will primarily consist of securities listed or traded on a recognized securities exchange or automated quotation system, or exchange-traded securities, or securities traded on a privately negotiated over-the-counter secondary market for institutional investors for which indicative dealer quotes are available, or OTC securities.
For purposes of calculating NAV, the Fund uses the following valuation methods:
| | • | | The market value of each exchange-traded security is the last reported sale price at the relevant valuation date on the composite tape or on the principal exchange on which such security is traded. |
| | • | | If no sale is reported for an exchange-traded security on the valuation date or if a security is an OTC security, the Fund values such investments using quotations obtained from an approved independent third-party pricing service, which provides prevailing bid and ask prices that are screened for validity by such service from dealers on the valuation date. For investments for which an approved independent third-party pricing service is unable to obtain quoted prices, the Fund will obtain bid and ask prices |
16
FS Global Credit Opportunities Fund
Notes to Unaudited Consolidated Financial Statements (continued)
(in thousands, except share and per share amounts)
Note 2. Summary of Significant Accounting Policies (continued)
| | directly from dealers who make a market in such securities. In all such cases, investments are valued at the mid-point of the average bid and ask prices obtained from such sources. |
| | • | | To the extent that the Fund holds investments for which no active secondary market exists and, therefore, no bid and ask prices can be readily obtained, the Fund will value such investments at fair value as determined in good faith by the Fund’s board of trustees, or the Board, in accordance with the Fund’s valuation policy. In making such determination, the Board may rely upon valuations obtained from an approved independent third-party valuation service. With respect to these investments for which market quotations are not readily available, the Fund undertakes a multi-step valuation process each quarter, as described below: |
| | • | | The quarterly fair valuation process begins with FS Global Advisor’s management team reviewing and documenting preliminary valuations for each investment, which valuations may be obtained from an approved independent third-party valuation service, if applicable; |
| | • | | FS Global Advisor’s management team then provides the valuation committee of the Board with preliminary valuations for each investment; |
| | • | | The preliminary valuations are then presented to and discussed with the valuation committee of the Board; |
| | • | | The valuation committee of the Board then reviews the preliminary valuations and FS Global Advisor’s management team, together with any approved independent third-party valuation service, if applicable, respond to and supplement the preliminary valuations to reflect any comments provided by the valuation committee of the Board; |
| | • | | Following its review, the valuation committee of the Board approves the fair valuation of the Fund’s investments and recommends that the Board similarly approve the fair valuation of the Fund’s investments; and |
| | • | | The Board discusses the valuation of the Fund’s investments and determines the fair value of each such investment in the portfolio in good faith based on various statistical and other factors, including the input and recommendation of FS Global Advisor, the valuation committee of the Board and any approved independent third-party valuation service, if applicable. |
Determination of fair value involves subjective judgments and estimates. Accordingly, the notes to the Fund’s unaudited consolidated financial statements refer to the uncertainty with respect to the possible effect of such valuations and any change in such valuations on the Fund’s unaudited consolidated financial statements. In making its determination of fair value, the Board may use any approved independent third-party pricing or valuation service; provided that the Board shall not be required to determine fair value in accordance with the valuation provided by any single source, and the Board shall retain the discretion to use any relevant data, including information obtained from FS Global Advisor, GSO or any approved independent third-party valuation or pricing service, that the Board deems to be reliable in determining fair value under the circumstances.
Below is a description of factors that FS Global Advisor, any approved independent third-party valuation service and the Board may consider when determining the fair value of the Fund’s investments.
Valuation of fixed income investments, such as loans and debt securities, depends upon a number of factors, including prevailing interest rates for like securities, expected volatility in future interest rates, call features, put
17
FS Global Credit Opportunities Fund
Notes to Unaudited Consolidated Financial Statements (continued)
(in thousands, except share and per share amounts)
Note 2. Summary of Significant Accounting Policies (continued)
features and other relevant terms of the debt. For investments without readily available market prices, the Fund may incorporate these factors into discounted cash flow models to arrive at fair value. Other factors that may be considered include the borrower’s ability to adequately service its debt, the fair market value of the borrower in relation to the face amount of its outstanding debt and the quality of collateral securing the borrower’s debt.
For convertible debt securities, fair value will generally approximate the fair value of the debt plus the fair value of an option to purchase the underlying security (i.e., the security into which the debt may convert) at the conversion price. To value such an option, a standard option pricing model may be used.
The Fund’s equity interests in companies for which no active secondary market exists and, therefore, no bid and ask prices can be readily obtained, are valued at fair value. The Board, in its determination of fair value, may consider various factors, including, but not limited to, multiples of earnings before interest, taxes, depreciation and amortization, or EBITDA, cash flows, net income, revenues or, in limited instances, book value or liquidation value. All of these factors may be subject to adjustments based upon the particular circumstances of a company or the Fund’s actual investment position. For example, adjustments to EBITDA may take into account compensation to previous owners or an acquisition, recapitalization, restructuring or other related items.
FS Global Advisor, any approved independent third-party valuation service and the Board may also consider private merger and acquisition statistics, public trading multiples discounted for illiquidity and other factors, valuations implied by third-party investments in the companies, the acquisition price of such investment or industry practices in determining fair value. FS Global Advisor, any approved independent third-party valuation service and the Board may also consider the size and scope of a company and its specific strengths and weaknesses, and may apply discounts or premiums, where and as appropriate, due to the higher (or lower) financial risk and/or the size of the companies relative to comparable firms, as well as such other factors as the Board, in consultation with FS Global Advisor and any approved independent third-party valuation service, if applicable, may consider relevant in assessing fair value.
When the Fund receives warrants or other equity securities at nominal or no additional cost in connection with an investment in a debt security, the cost basis in the investment will be allocated between the debt securities and any such warrants or other equity securities received at the time of origination. The Board will subsequently value the warrants or other equity securities received at fair value.
Securities that carry certain restrictions on sale typically will be valued at a discount from the public market value of the security, where applicable.
If events materially affecting the price of foreign portfolio securities occur between the time when their price was last determined on such foreign securities exchange or market and the time when the Fund’s NAV was last calculated (e.g., movements in certain U.S. securities indices which demonstrate strong correlation to movements in certain foreign securities markets), such securities may be valued at their fair value as determined in good faith by the Board in consultation with FS Global Advisor and any approved independent third-party valuation service, if applicable.
Swaps typically will be valued using valuations provided by an approved independent third-party pricing service. Such valuations generally will be based on the present value of fixed and projected floating rate cash flows over the term of the swap contract and, in the case of credit default swaps, generally will be based on credit
18
FS Global Credit Opportunities Fund
Notes to Unaudited Consolidated Financial Statements (continued)
(in thousands, except share and per share amounts)
Note 2. Summary of Significant Accounting Policies (continued)
spread quotations obtained from broker-dealers and expected default recovery rates determined by the approved independent third-party pricing service using proprietary models. Future cash flows will be discounted to their present value using swap rates provided by electronic data services or by broker-dealers.
The Board is solely responsible for the valuation of the Fund’s portfolio investments at fair value as determined in good faith pursuant the Fund’s valuation policy and consistently applied valuation process. The Board has delegated day-to-day responsibility for implementing the Fund’s valuation policy to FS Global Advisor’s management team, and has authorized FS Global Advisor’s management team to utilize independent third-party valuation and pricing services that have been approved by the Board. The valuation committee of the Board is responsible for overseeing FS Global Advisor’s implementation of the Fund’s valuation process.
Revenue Recognition: Security transactions are accounted for on the trade date. The Fund records interest income on an accrual basis to the extent that it expects to collect such amounts. The Fund records dividend income on the ex-dividend date. The Fund does not accrue as a receivable interest or dividends on loans and securities if it has reason to doubt its ability to collect such income. The Fund’s policy is to place investments on non-accrual status when there is reasonable doubt that interest income will be collected. The Fund considers many factors relevant to an investment when placing it on or removing it from non-accrual status, including, but not limited to, the delinquency status of the investment, economic and business conditions, the overall financial condition of the underlying investment, the value of the underlying collateral, bankruptcy status, if any, and any other facts or circumstances relevant to the investment. If there is reasonable doubt that the Fund will receive any previously accrued interest, then the previously recognized interest income will be written-off. Payments received on non-accrual investments may be recognized as income or applied to principal depending upon the collectability of the remaining principal and interest. Non-accrual investments may be restored to accrual status when principal and interest become current and are likely to remain current based on the Fund’s judgment.
Loan origination fees, original issue discount and market discount are capitalized and such amounts are amortized as interest income over the respective term of the loan or security. Upon the prepayment of a loan or security, any unamortized loan origination fees and original issue discount are recorded as interest income. Structuring and other non-recurring upfront fees are recorded as fee income when earned. The Fund records prepayment premiums on loans and securities as fee income when it receives such amounts.
Net Realized Gains or Losses, Net Change in Unrealized Appreciation or Depreciation and Net Change in Unrealized Gains or Losses on Foreign Currency: Gains or losses on the sale of investments are calculated by using the specific identification method. The Fund measures realized gains or losses by the difference between the net proceeds from the repayment or sale and the amortized cost basis of the investment, without regard to unrealized appreciation or depreciation previously recognized, but considering unamortized fees. Net change in unrealized appreciation or depreciation reflects the change in portfolio investment values during the reporting period, including any reversal of previously recorded unrealized gains or losses, when gains or losses are realized, and the respective unrealized gain or loss on foreign currency for any foreign denominated investments. Net change in unrealized gains or losses on foreign currency reflects the change in the value of receivables or accruals during the reporting period due to the impact of foreign currency fluctuations.
Income Taxes: The Fund has elected to be treated for U.S. federal income tax purposes, and intends to qualify annually, as a RIC under Subchapter M of the Code. To qualify and maintain qualification as a RIC, the Fund must, among other things, meet certain source-of-income and asset diversification requirements and
19
FS Global Credit Opportunities Fund
Notes to Unaudited Consolidated Financial Statements (continued)
(in thousands, except share and per share amounts)
Note 2. Summary of Significant Accounting Policies (continued)
distribute to its shareholders, for each taxable year, at least 90% of its “investment company taxable income,” which is generally the Fund’s net ordinary income plus the excess, if any, of realized net short-term capital gains over realized net long-term capital losses. As a RIC, the Fund will not have to pay corporate-level U.S. federal income taxes on any income that it distributes to its shareholders. The Fund intends to make distributions in an amount sufficient to maintain its RIC status each year and to avoid any U.S. federal income taxes on income so distributed. The Fund also will be subject to nondeductible U.S. federal excise taxes if it does not distribute at least 98% of net ordinary income, 98.2% of capital gain net income, if any, and any recognized and undistributed income from prior years for which it paid no U.S. federal income taxes.
Uncertainty in Income Taxes: The Fund evaluates its tax positions to determine if the tax positions taken meet the minimum recognition threshold in connection with accounting for uncertainties in income tax positions taken or expected to be taken for the purposes of measuring and recognizing tax benefits or liabilities in the Fund’s unaudited consolidated financial statements. Recognition of a tax benefit or liability with respect to an uncertain tax position is required only when the position is “more likely than not” to be sustained assuming examination by taxing authorities. The Fund recognizes interest and penalties, if any, related to unrecognized tax liabilities as income tax expense on its unaudited consolidated statement of operations. During the six months ended June 30, 2016, the Fund did not incur any interest or penalties.
The Fund has analyzed the tax positions taken on U.S. federal and state income tax returns for all open tax years, and has concluded that no provision for income tax is required in the Fund’s unaudited consolidated financial statements. The Fund’s U.S. federal and state income and U.S. federal excise tax returns for tax years for which the applicable statutes of limitations have not yet expired are subject to examination by the Internal Revenue Service and state departments of revenue.
Credit Default Swaps: When the Fund is the buyer of a credit default swap contract, the Fund is entitled to receive the par (or other agreed-upon) value of a referenced debt obligation (or basket of debt obligations) from the counterparty to the contract if a specified credit event with respect to the issuer of the debt obligation, such as a U.S. or foreign corporate issuer or sovereign issuer, occurs. In return, the Fund pays the counterparty a periodic stream of payments over the term of the contract provided that no credit event has occurred. If no specified credit event occurs, the Fund would have paid the stream of payments and received no proceeds from the contract. When the Fund is the seller of a credit default swap contract, it receives the stream of payments, but is obligated to pay to the buyer of the protection an amount up to the notional amount of the swap and in certain instances take delivery of securities of the reference entity upon the occurrence of a credit event, as defined under the terms of that particular swap agreement. Credit events are contract specific but may include bankruptcy, failure to pay principal or interest, restructuring, obligation acceleration and repudiation or moratorium. If the Fund is a seller of protection and a credit event occurs, the maximum potential amount of future payments that the Fund could be required to make would be an amount equal to the notional amount of the agreement. This potential amount would be partially offset by any recovery value of the respective referenced obligation, or net amount received from the settlement of a buy protection credit default swap agreement entered into by the Fund for the same referenced obligation. As the seller of a credit default swap contract, the Fund may create economic leverage because, in addition to its net assets, the Fund is subject to investment exposure on the notional amount of the swap. The interest fee paid or received on the swap contract, which is based on a specified interest rate on a fixed notional amount, is accrued daily and is recorded as realized loss or gain. The Fund records an increase or decrease to unrealized appreciation (depreciation) on credit default swaps in an amount equal to the change in daily valuation. Upfront payments or receipts, if any, are recorded as unamortized swap premiums paid or received, respectively, and are amortized over the life of the swap
20
FS Global Credit Opportunities Fund
Notes to Unaudited Consolidated Financial Statements (continued)
(in thousands, except share and per share amounts)
Note 2. Summary of Significant Accounting Policies (continued)
contract as realized losses or gains. For financial reporting purposes, unamortized upfront payments, if any, are netted with unrealized appreciation (depreciation) on credit default swaps to determine the market value of swaps as presented in Note 6 and Note 8. The Fund will segregate assets in the form of cash and/or liquid securities in an amount equal to any unrealized depreciation on the credit default swaps of which it is the buyer, marked-to-market on a daily basis. The Fund segregates assets in the form of cash and/or liquid securities in an amount equal to the notional amount of the credit default swaps of which it is the seller. These transactions involve certain risks, including the risk that the seller may be unable to fulfill the transaction.
Options Written: The Fund may write call and put options in an effort to manage risk and/or generate gains from options premiums. When the Fund writes a call option, it gives the purchaser (holder) of the option the right (but not the obligation) to buy, and obligates the Fund to sell (when the option is exercised), the underlying instrument at the exercise or strike price at any time or at a specified time during the option period. When the Fund writes a put option, it gives the holder the right to sell and obligates the Fund to buy the underlying instrument at the exercise or strike price at any time or at a specified time during the option period. When the Fund writes an option, an amount equal to the premium received by the Fund is reflected as a liability. The amount of the liability is subsequently marked-to-market to reflect the current fair value of the option written. When an instrument is purchased or sold through an exercise of an option, the related premium received is deducted from the basis of the instrument acquired or added to the proceeds of the instrument sold. When an option expires, the Fund realizes a gain on the option to the extent of the premiums received. When an option is exercised, the Fund realizes a loss to the extent the cost of closing the option exceeds the premiums received, or a gain to the extent the premiums received exceed the cost of closing the option.
Securities Lending: The Fund may make secured loans of its marginable securities to brokers, dealers and other financial institutions to the extent permitted by the 1940 Act. The risks in lending portfolio securities, as with other extensions of credit, consist of possible delay in recovery of the securities or possible loss of rights in the collateral should the borrower fail financially. However, such loans will be made only to broker-dealers and other financial institutions that are believed by FS Global Advisor to be of relatively high credit standing. Loans of securities are made to broker-dealers pursuant to agreements requiring that loans be continuously secured by collateral consisting of U.S. government securities, cash or cash equivalents (negotiable certificates of deposit, bankers’ acceptances or letters of credit) maintained on a daily mark-to-market basis in an amount at least equal at all times to the market value of the securities lent. The borrower pays to the Fund, as the lender, an amount equal to any dividends or interest received on the securities lent. The collateral must have a market value at least equal to 100% of the market value of the loaned securities at all times during the duration of the loan. The Fund invests the cash collateral received in accordance with its investment objectives, subject to the Fund’s agreement with the borrower of the securities. In the case of cash collateral, the Fund typically pays a rebate to the borrower. The reinvestment of cash collateral will result in a form of effective leverage for the Fund. Although voting rights or rights to consent with respect to the loaned securities pass to the borrower, the Fund, as the lender, retains the right to call the loans and obtain the return of the securities loaned at any time on reasonable notice, and it will do so in order that the securities may be voted by the Fund if the holders of such securities are asked to vote upon or consent to matters materially affecting the investment. The Fund may also call such loans in order to sell the securities involved. When engaged in securities lending, the Fund’s performance will continue to reflect changes in the value of the securities loaned and will also reflect the receipt of interest through investment of cash collateral by the Fund in permissible investments. As of June 30, 2016, the Fund had securities on loan valued at $1,758 and received cash collateral with a value of $1,792 representing 0.1% and 0.2% of the Fund’s net assets, respectively.
21
FS Global Credit Opportunities Fund
Notes to Unaudited Consolidated Financial Statements (continued)
(in thousands, except share and per share amounts)
Note 2. Summary of Significant Accounting Policies (continued)
Distributions: Distributions to the Fund’s shareholders are recorded as of the record date. Subject to the discretion of the Board and applicable legal restrictions, the Fund intends to authorize and declare ordinary cash distributions on a weekly, semi-monthly or monthly basis and to pay such distributions on a monthly or quarterly basis. Net realized capital gains, if any, will be distributed or deemed distributed at least annually.
Recently Issued Accounting Standards: In April 2015, the Financial Accounting Standards Board, or the FASB, issued Accounting Standards Update No. 2015-03, Interest-Imputation of Interest, or ASU 2015-03, to simplify the presentation of debt issuance costs in financial statements. Under pre-existing guidance, debt issuance costs were recognized as a deferred charge and presented as an asset on the balance sheet. ASU 2015-03 requires that debt issuance costs related to a recognized liability for indebtedness be presented in the balance sheet as a direct deduction from the carrying amount of that liability, consistent with debt discounts. In August 2015, the FASB issued Accounting Standards Update No. 2015-15, Interest-Imputation of Interest, or ASU 2015-15, to update the guidance to include SEC staff views regarding the presentation and subsequent measurement of debt issuance costs related to line-of-credit arrangements. Given the absence of authoritative guidance within ASU 2015-03 for debt issuance costs related to line-of-credit arrangements, the SEC indicated that it would not object to an entity deferring and presenting debt issuance costs as an asset and subsequently amortizing the deferred debt issuance costs ratably over the term of the line-of-credit arrangement, regardless of whether there are any outstanding borrowings on the line-of-credit arrangement.
Commencing January 1, 2016, the Fund adopted ASU 2015-03 and changed its method of disclosing debt issuance costs for its repurchase agreement and unsecured notes. ASU 2015-03 affects the presentation and disclosure of such costs in the Fund’s financial statements. There is no change to the Fund’s recognition and measurement of debt issuance costs. In accordance with ASU 2015-15, the Fund elected to continue to present debt issuance costs associated with line-of-credit arrangements as an asset, unchanged from its prior method of disclosure.
Comparative financial statements of prior interim and annual periods have been adjusted to apply the new method retrospectively. The adoption and retrospective adjustment of ASU 2015-03 had no material impact on the Fund’s consolidated financial position, results of operations or cash flows as previously reported.
Note 3. Share Transactions
Below is a summary of transactions with respect to the Fund’s common shares during the six months ended June 30, 2016 and the year ended December 31, 2015:
| | | | | | | | | | | | | | | | |
| | | Six Months Ended
June 30, 2016 | | | Year Ended
December 31, 2015 | |
| | | Shares | | | Amount | | | Shares | | | Amount | |
Gross Proceeds from Issuance of Common Shares | | | 31,671,270 | | | $ | 218,636 | | | | 64,652,648 | | | $ | 545,947 | |
Common shares of the Fund are issued solely to Fund—A, Fund—D, Fund—T and Fund—ADV in private placement transactions that do not involve any “public offering” within the meaning of Section 4(a)(2) of, and/or Regulation D under, the Securities Act of 1933, as amended. During the six months ended June 30, 2016, the Fund issued 26,431,516 common shares to Fund—A, 4,941,584 common shares to Fund—D and 298,170 common shares to Fund—T for gross proceeds of $182,159, $34,289 and $2,188, respectively. During the year ended December 31, 2015, the Fund issued 54,458,519 common shares to Fund—A and 10,194,129 common
22
FS Global Credit Opportunities Fund
Notes to Unaudited Consolidated Financial Statements (continued)
(in thousands, except share and per share amounts)
Note 3. Share Transactions (continued)
shares to Fund—D for gross proceeds of $460,415 and $85,532, respectively. During the period from July 1, 2016 to August 16, 2016, the Fund issued 729,979 common shares to Fund—T and 30,152 common shares to Fund—ADV for gross proceeds of $5,424 and $224, respectively.
The Fund intends to repurchase common shares held by Fund—A, Fund—D, Fund—T and Fund—ADV to the extent necessary to accommodate repurchase requests under each Feeder Fund’s share repurchase program. During the six months ended June 30, 2016, the Fund did not repurchase any of its common shares to accommodate repurchase requests under the Feeder Funds’ share repurchase programs.
Note 4. Related Party Transactions
Compensation of the Investment Adviser and its Affiliates
Pursuant to the amended and restated investment advisory agreement, dated as of October 9, 2013, by and between the Fund and FS Global Advisor, or the investment advisory agreement, FS Global Advisor is entitled to (a) an annual management fee of 2.0% of the Fund’s average daily gross assets and (b) an incentive fee based on the Fund’s performance. The Fund commenced accruing fees under the investment advisory agreement on December 12, 2013, upon commencement of the Fund’s investment operations. Management fees are calculated and payable quarterly in arrears.
The incentive fee is calculated and payable quarterly in arrears based upon the Fund’s “pre-incentive fee net investment income” for the immediately preceding quarter, and is subject to a hurdle rate, expressed as a rate of return on the Fund’s “adjusted capital,” equal to 2.25% per quarter (or an annualized hurdle rate of 9.00%), subject to a “catch-up” feature. For this purpose, “pre-incentive fee net investment income” means interest income, dividend income and any other income (including any other fees, such as commitment, origination, structuring, diligence and consulting fees or other fees that the Fund receives from portfolio companies) accrued during the calendar quarter, minus the Fund’s operating expenses for the quarter (including the management fee, expenses reimbursed to FS Global Advisor under the administration agreement, dated as of July 15, 2013, by and between the Fund and FS Global Advisor, or the administration agreement, and any interest expense and distributions paid on any issued and outstanding preferred shares, but excluding the incentive fee). Pre-incentive fee net investment income includes, in the case of investments with a deferred interest feature (such as original issue discount, debt instruments with paid-in-kind interest and zero coupon securities), accrued income that the Fund has not yet received in cash. Pre-incentive fee net investment income does not include any realized capital gains, realized capital losses or unrealized capital appreciation or depreciation. “Adjusted capital” means the cumulative gross proceeds received by the Fund from the issuance of common shares (including common shares issued in respect of reinvested distributions), reduced by amounts paid in connection with repurchases of common shares to accommodate repurchase requests under the Companies’ share repurchase programs.
The calculation of the incentive fee for each quarter is as follows:
| | • | | No incentive fee is payable in any calendar quarter in which the Fund’s pre-incentive fee net investment income does not exceed the quarterly hurdle rate of 2.25% (9.00% annualized); |
| | • | | 100% of the Fund’s pre-incentive fee net investment income, if any, that exceeds the hurdle rate but is less than or equal to 2.8125% in any calendar quarter (11.25% annualized) is payable to FS Global Advisor. This portion of the Fund’s pre-incentive fee net investment income which exceeds the hurdle rate but is less than or equal to 2.8125% is referred to as the “catch-up.” The “catch-up” provision is |
23
FS Global Credit Opportunities Fund
Notes to Unaudited Consolidated Financial Statements (continued)
(in thousands, except share and per share amounts)
Note 4. Related Party Transactions (continued)
| | intended to provide FS Global Advisor with an incentive fee of 20.0% on all of the Fund’s pre-incentive fee net investment income when the Fund’s pre-incentive fee net investment income reaches 2.8125% in any calendar quarter; and |
| | • | | 20.0% of the amount of the Fund’s pre-incentive fee net investment income, if any, that exceeds 2.8125% in any calendar quarter (11.25% annualized) is payable to FS Global Advisor once the hurdle rate and catch-up have been achieved (20.0% of all the Fund’s pre-incentive fee net investment income thereafter is allocated to FS Global Advisor). |
Pursuant to an investment sub-advisory agreement, or the investment sub-advisory agreement, between FS Global Advisor and GSO Capital Partners, LP, or GSO, GSO will receive 50% of all management and incentive fees paid to FS Global Advisor under the investment advisory agreement with respect to each year.
Under the administration agreement, the Fund reimburses FS Global Advisor for its actual costs incurred in providing administrative services to the Fund, including FS Global Advisor’s allocable portion of the compensation and related expenses of certain personnel of Franklin Square Holdings providing administrative services to the Fund on behalf of FS Global Advisor. Such services include general ledger accounting, fund accounting, legal services, investor relations and other administrative services. FS Global Advisor also performs, or oversees the performance of, the Fund’s corporate operations and required administrative services, which includes being responsible for the financial records that the Fund is required to maintain and preparing reports to the Fund’s shareholders and reports filed with the SEC. In addition, FS Global Advisor assists the Fund in calculating NAV, overseeing the preparation and filing of tax returns and the printing and dissemination of reports to the Fund’s shareholders, and generally overseeing the payment of the Fund’s expenses and the performance of administrative and professional services rendered to the Fund by others. FS Global Advisor is required to allocate the cost of these services to the Fund based on factors such as assets, revenues and/or time allocations. At least annually, the Board reviews the methodology employed in determining how the expenses are allocated to the Fund and the proposed allocation of administrative expenses among the Fund and certain affiliates of FS Global Advisor. The Board then assesses the reasonableness of such reimbursements for expenses allocated to the Fund based on the breadth, depth and quality of such services as compared to the estimated cost to the Fund of obtaining similar services from third-party service providers known to be available. In addition, the Board considers whether any single third-party service provider would be capable of providing all such services at comparable cost and quality. Finally, the Board compares the total amount paid to FS Global Advisor for such services as a percentage of the Fund’s net assets to the same ratio as reported by other comparable investment companies. The Fund will not reimburse FS Global Advisor for any services for which it receives a separate fee or for any administrative expenses allocated to a controlling person of FS Global Advisor.
Franklin Square Holdings funded organization costs in the amount of $22 for the period from January 28, 2013 (Inception) to December 31, 2013. These costs were recorded by the Fund as a contribution to capital. The organization costs were charged to expense as incurred by the Fund. Under the terms of the administration agreement, upon satisfaction of the minimum offering requirement, FS Global Advisor became entitled to receive 1.5% of offering proceeds from the issuance of the Fund’s common shares until all organization and offering costs funded by FS Global Advisor and its affiliates (including Franklin Square Holdings) have been recovered. Any such reimbursements will be recorded by the Fund as a reduction of capital. During the period from December 12, 2013 (Commencement of Investment Operations) through June 30, 2016, the Fund did not reimburse FS Global Advisor or its affiliates for organization costs previously funded.
24
FS Global Credit Opportunities Fund
Notes to Unaudited Consolidated Financial Statements (continued)
(in thousands, except share and per share amounts)
Note 4. Related Party Transactions (continued)
The following table describes the fees and expenses accrued under the investment advisory agreement and the administration agreement during the six months ended June 30, 2016:
| | | | | | | | |
Related Party | | Source Agreement | | Description | | Six Months
Ended June 30,
2016 | |
| | | |
FS Global Advisor | | Investment Advisory Agreement | | Management Fee(1) | | $ | 15,245 | |
| | | |
FS Global Advisor | | Investment Advisory Agreement | | Incentive Fee | | $ | — | |
| | | |
FS Global Advisor | | Administration Agreement | | Administrative Services Expenses(2) | | $ | 380 | |
| (1) | During the six months ended June 30, 2016, $461 in management fees were paid to FS Global Advisor and $13,175 of expense reimbursements due from sponsor were used to offset management fees payable. As of June 30, 2016, $8,525 in management fees were payable to FS Global Advisor. |
| (2) | During the six months ended June 30, 2016, the Fund paid $581 in administrative services expenses to FS Global Advisor. |
Capital Contribution by FS Global Advisor
In March 2013, Michael C. Forman and David J. Adelman, the principals of FS Global Advisor, each contributed approximately $100 to purchase 5,000 common shares of beneficial interest of Fund—A and 5,000 common shares of beneficial interest of Fund—D, in each case at a price of $10.00 per share. The Companies, in turn, each purchased 10,000 common shares of the Fund at $10.00 per share. The principals will not tender for repurchase the common shares of the Companies held by them as long as FS Global Advisor remains the Fund’s investment adviser.
In March 2016, Michael C. Forman contributed an aggregate of $200 to purchase 10,000 common shares of beneficial interest of Fund—T and 10,000 common shares of beneficial interest of Fund—ADV, in each case at a price of $10.00 per share. Immediately prior to the initial weekly closing of Fund—T, Fund—T effected a share split to ensure that the per share price paid by Mr. Forman for the common shares purchased by him in the private placement was equal to the NAV per common share of the Fund on the date of the initial weekly closing of the Feeder Funds. Fund—T, in turn, purchased 13,544 common shares of the Fund at $7.38 per share. Mr. Forman will not tender the common shares for repurchase as long as FS Global Advisor remains the Fund’s investment adviser.
Potential Conflicts of Interest
FS Global Advisor’s senior management team is comprised of substantially the same personnel as the senior management teams of the investment advisers to Franklin Square Holdings’ other sponsored investment funds. As a result,these members provide investment advisory services to the Fund and such other accounts. While the investment personnel of FS Global Advisor are not currently making private corporate debt investments for clients other than the Franklin Square funds, they may do so in the future. In the event that FS Global Advisor provides investment advisory services to other clients in the future, it intends to allocate investment opportunities in a fair and equitable manner consistent with the Fund’s investment objectives and strategies, so that the Fund will not be disadvantaged in relation to any other client of FS Global Advisor or its management team. In
25
FS Global Credit Opportunities Fund
Notes to Unaudited Consolidated Financial Statements (continued)
(in thousands, except share and per share amounts)
Note 4. Related Party Transactions (continued)
addition, even in the absence of FS Global Advisor retaining additional clients, it is possible that some investment opportunities may be provided to FS Investment Corporation, FS Energy and Power Fund, FS Investment Corporation II, FS Investment Corporation III and/or FS Investment Corporation IV, rather than to the Fund.
Expense Reimbursement Agreement
Pursuant to an expense support and conditional reimbursement agreement, dated as of August 20, 2013, by and between the Fund and Franklin Square Holdings, or the expense reimbursement agreement, Franklin Square Holdings has agreed to reimburse the Fund for expenses to ensure that the Fund bears a reasonable level of expenses in relation to its income. The purpose of this arrangement is to ensure that no portion of any ordinary cash distributions made by the Fund will be paid from offering proceeds or borrowings. However, because certain investments the Fund may make, including preferred and common equity investments, may generate dividends and other distributions to the Fund that are treated for tax purposes as a return of capital, a portion of the Fund’s ordinary cash distributions may also be deemed to constitute a return of capital for tax purposes to the extent that the Fund may use such dividends or other distribution proceeds as a source of distributions. Under those circumstances, Franklin Square Holdings will not reimburse the Fund for the portion of the Fund’s ordinary cash distributions that represent a return of capital for tax purposes, as the purpose of the expense reimbursement arrangement is not to prevent tax-advantaged distributions.
Under the expense reimbursement agreement, Franklin Square Holdings will reimburse the Fund quarterly in an amount equal to the difference between the cumulative ordinary cash distributions paid to the Fund’s shareholders in such quarter, less the sum of the Fund’s net investment income, net short-term capital gains and dividends and other distributions paid to the Fund on account of investments in portfolio companies (to the extent such amounts are not included in net investment income or net short-term capital gains) in such quarter.
Pursuant to the expense reimbursement agreement, the Fund has a conditional obligation to reimburse Franklin Square Holdings for any amounts funded by Franklin Square Holdings under this arrangement if (and only to the extent that), during any fiscal quarter occurring within three years of the date on which Franklin Square Holdings funded such amount, the sum of the Fund’s net investment income, net short-term capital gains and the amount of any dividends and other distributions paid to the Fund on account of investments in portfolio companies (to the extent not included in net investment income or net short-term capital gains) exceeds the ordinary cash distributions paid by the Fund to shareholders in such quarter; provided, however, that (i) the Fund will only reimburse Franklin Square Holdings for expense support payments made by Franklin Square Holdings to the extent that the payment of such reimbursement (together with any other reimbursement paid during such fiscal year) does not cause “other operating expenses” (as defined below) (on an annualized basis and net of any expense support payments received by the Fund during such fiscal year) to exceed the lesser of (A) 1.75% of the Fund’s average net assets attributable to its common shares for the fiscal year-to-date period after taking such expense reimbursement payments into account and (B) the percentage of the Fund’s average net assets attributable to its common shares represented by “other operating expenses” during the fiscal year in which such expense support payment from Franklin Square Holdings was made (provided, however, that this clause (B) shall not apply to any reimbursement payment which relates to an expense support payment from Franklin Square Holdings made during the same fiscal year) and (ii) the Fund will not reimburse Franklin Square Holdings for expense support payments made by Franklin Square Holdings if the annualized rate of distributions per common share declared by the Fund at the time of such expense reimbursement payment is less than the annualized rate of
26
FS Global Credit Opportunities Fund
Notes to Unaudited Consolidated Financial Statements (continued)
(in thousands, except share and per share amounts)
Note 4. Related Party Transactions (continued)
distributions per common share declared by the Fund at the time Franklin Square Holdings made the expense support payment to which such reimbursement relates. “Other operating expenses” means the Fund’s total operating expenses, excluding the management fee, the incentive fee, organization and offering expenses, financing fees and costs, interest expense and extraordinary expenses. “Operating expenses” means all operating costs and expenses incurred, as determined in accordance with GAAP for investment companies.
The Fund or Franklin Square Holdings may terminate the expense reimbursement agreement at any time. Franklin Square Holdings has indicated that it expects to continue such reimbursements until it deems that the Fund has achieved economies of scale sufficient to ensure that the Fund bears a reasonable level of expenses in relation to its income.
The specific amount of expenses reimbursed by Franklin Square Holdings pursuant to the expense reimbursement agreement, if any, is determined at the end of each fiscal quarter. Upon termination of the expense reimbursement agreement by Franklin Square Holdings, Franklin Square Holdings will be required to fund any amounts accrued thereunder as of the date of termination. Similarly, the conditional obligation of the Fund to reimburse Franklin Square Holdings pursuant to the terms of the expense reimbursement agreement shall survive the termination of such agreement by either party.
Franklin Square Holdings agreed to forgo reimbursement of all expense reimbursements made by it to the Fund through December 31, 2015. As such, as of December 31, 2015, there were no amounts subject to reimbursement by the Fund to Franklin Square Holdings under the expense reimbursement agreement.
The following table reflects the expense reimbursements accrued from Franklin Square Holdings to the Fund as of June 30, 2016 that may be subject to reimbursement to Franklin Square Holdings:
| | | | | | | | |
Quarter Ended | | Amount of Expense
Reimbursements | | Annualized “Other Operating
Expenses” Ratio as of the Date of
Support Payment | | Annualized Rate
of Distributions
Per Common
Share(1) | | Reimbursement
Eligibility
Expiration |
March 31, 2016 | | $6,071 | | 0.69% | | 12.69% | | March 31, 2019 |
June 30, 2016 | | $2,123 | | 0.60% | | 9.78% | | June 30, 2019 |
| (1) | The annualized rate of distributions per common share is expressed as a percentage equal to the projected annualized distribution amount as of the end of the applicable quarter (which is calculated by annualizing the regular weekly cash distribution per common share as of such date without compounding), divided by the Fund’s NAV per common share as of such date. |
Franklin Square Holdings is controlled by the Fund’s chairman, president and chief executive officer, Michael C. Forman, and the Fund’s vice-chairman, David J. Adelman. There can be no assurance that the expense reimbursement agreement will remain in effect or that Franklin Square Holdings will reimburse any portion of the Fund’s expenses in future years.
27
FS Global Credit Opportunities Fund
Notes to Unaudited Consolidated Financial Statements (continued)
(in thousands, except share and per share amounts)
Note 5. Distributions
The following table reflects the cash distributions per common share that the Fund declared on its common shares during the six months ended June 30, 2016 and the years ended December 31, 2015 and 2014:
| | | | | | | | |
| | | Distribution | |
Fiscal Period | | Per Share | | | Amount | |
For the Year Ended December 31, 2014 | | $ | 0.8695 | | | $ | 21,246 | |
For the Year Ended December 31, 2015 | | $ | 0.8719 | | | $ | 86,589 | |
For the Six Months Ended June 30, 2016 | | $ | 0.4219 | | | $ | 61,724 | |
On July 7, 2016 and August 2, 2016, the Board declared regular weekly cash distributions for July and August 2016, respectively. The regular weekly cash distributions, each in the amount of $0.013721 per common share, have been or will be paid monthly to shareholders of record as of weekly record dates previously determined by the Board. The timing and amount of any future distributions to shareholders are subject to applicable legal restrictions and the sole discretion of the Board.
Each of the Feeder Funds has adopted an “opt in” distribution reinvestment plan for its shareholders pursuant to which shareholders of each Feeder Fund can elect to have their cash distributions reinvested in additional common shares of such Feeder Fund. To the extent that a Feeder Fund’s shareholders reinvest their cash distributions, such Feeder Fund will use the proceeds to purchase additional common shares of the Fund. As such, a portion of the cash distributions paid by the Fund (and subsequently paid by the Feeder Funds to their respective shareholders) may be reinvested in additional common shares of the Fund.
The Fund may fund its cash distributions to shareholders from any sources of funds legally available to it, including offering proceeds, borrowings, net investment income, short-term and long-term capital gains proceeds from the sale of assets, gains from credit default swaps, non-capital gains proceeds from the sale of assets, distributions on account of preferred and common equity and expense reimbursements and additional support payments from Franklin Square Holdings. The Fund has not established limits on the amount of funds it may use from available sources to make distributions.
The Fund expects that for a period of time, which time period may be significant, substantial portions of the Fund’s distributions may be funded through the reimbursement of certain expenses and additional support payments by Franklin Square Holdings and its affiliates, including through the waiver of certain investment advisory fees by FS Global Advisor, that may be subject to repayment by the Fund within three years. The purpose of this arrangement is to ensure that no portion of the Fund’s distributions to shareholders will be paid from offering proceeds or borrowings. Any such distributions funded through support payments or waivers of advisory fees are not based on the Fund’s investment performance and the Fund’s distributions can only be sustained if the Fund achieves positive investment performance in future periods and/or Franklin Square Holdings continues to make such payments or waivers of such fees. The Fund’s future repayments of amounts reimbursed or waived by Franklin Square Holdings and its affiliates will reduce the distributions that shareholders would otherwise receive in the future. There can be no assurance that the Fund will achieve the performance necessary to sustain its distributions or that the Fund will be able to pay distributions at a specific rate or at all. Franklin Square Holdings and its affiliates have no obligation to waive advisory fees or otherwise reimburse expenses in future periods. For the six months ended June 30, 2016, if Franklin Square Holdings had not reimbursed certain of the Fund’s expenses, 13% of the cash distributions declared during such period would have been funded from offering proceeds or borrowings. For the year ended December 31, 2015, if Franklin
28
FS Global Credit Opportunities Fund
Notes to Unaudited Consolidated Financial Statements (continued)
(in thousands, except share and per share amounts)
Note 5. Distributions (continued)
Square Holdings had not reimbursed certain of the Fund’s expenses, 14% of the cash distributions declared during such period would have been funded from offering proceeds or borrowings.
The following table reflects the sources of the cash distributions on a tax basis that the Fund declared on its common shares during the six months ended June 30, 2016 and the year ended December 31, 2015:
| | | | | | | | | | | | | | | | |
| | | Six Months Ended
June 30, 2016 | | | Year Ended
December 31, 2015 | |
Source of Distribution | | Distribution
Amount | | | Percentage | | | Distribution
Amount | | | Percentage | |
Offering proceeds | | $ | — | | | | — | | | $ | — | | | | — | |
Borrowings | | | — | | | | — | | | | — | | | | — | |
Net investment income (prior to expense reimbursement from sponsor)(1) | | | 53,530 | | | | 87 | % | | | 74,127 | | | | 86 | % |
Short-term capital gains proceeds from the sale of assets | | | — | | | | — | | | | — | | | | — | |
Long-term capital gains proceeds from the sale of assets | | | — | | | | — | | | | — | | | | — | |
Non-capital gains proceeds from the sale of assets | | | — | | | | — | | | | — | | | | — | |
Distributions on account of preferred and common equity | | | — | | | | — | | | | — | | | | — | |
Expense reimbursement from sponsor | | | 8,194 | | | | 13 | % | | | 12,462 | | | | 14 | % |
| | | | | | | | | | | | | | | | |
Total | | $ | 61,724 | | | | 100 | % | | $ | 86,589 | | | | 100 | % |
| | | | | | | | | | | | | | | | |
| (1) | During the six months ended June 30, 2016 and the year ended December 31, 2015, 82.0% and 86.0% of the Fund’s gross investment income, respectively, was attributable to cash income earned and 18.0% and 14.0%, respectively, was attributable to non-cash accretion of discount and paid-in-kind interest. |
The Fund’s net investment income on a tax basis for the six months ended June 30, 2016 and the year ended December 31, 2015 was $58,053 and $87,790, respectively. As of June 30, 2016, the Fund had $4,371 of undistributed net investment income on a tax basis.
The difference between the Fund’s GAAP-basis net investment income and its tax-basis net investment income is primarily due to the tax treatment of unrealized gains and certain payments on credit default swaps and foreign currency gains and losses.
The following table sets forth a reconciliation between GAAP-basis net investment income and tax-basis net investment income for the six months ended June 30, 2016:
| | | | |
| | | Six Months Ended
June 30, 2016 | |
GAAP-basis net investment income (loss) | | $ | 61,724 | |
Reclassification of the mark-to-market of unrealized gains on credit default swaps | | | (528 | ) |
Reclassification of credit default swap payments and amortization to income for tax purposes from realized gains for book purposes | | | (1,028 | ) |
Foreign currency gains and losses | | | (1,259 | ) |
Other miscellaneous differences | | | (856 | ) |
| | | | |
Tax-basis net investment income (loss) | | $ | 58,053 | |
| | | | |
29
FS Global Credit Opportunities Fund
Notes to Unaudited Consolidated Financial Statements (continued)
(in thousands, except share and per share amounts)
Note 5. Distributions (continued)
The determination of the tax attributes of the Fund’s distributions is made annually as of the end of the Fund’s fiscal year based upon the Fund’s taxable income for the full year and distributions paid for the full year. Therefore, a determination made on an interim basis may not be representative of the actual tax attributes of the Fund’s distributions for a full year. The actual tax characteristics of distributions to shareholders are reported to shareholders annually on Form 1099-DIV.
As of June 30, 2016, the components of accumulated earnings on a tax basis were as follows:
| | | | |
| | | Six Months Ended
June 30, 2016 | |
Distributable ordinary income | | $ | 4,371 | |
Capital loss carryover(1) | | | (126,482 | ) |
Net unrealized appreciation (depreciation) | | | (105,179 | ) |
| | | | |
| | $ | (227,290 | ) |
| | | | |
| (1) | The capital loss carryover is available to reduce capital gain distribution requirements in future years and does not expire. As of June 30, 2016, the Fund had long-term and short-term capital loss carryover of $40,241 and $86,241, respectively. |
The aggregate cost of the Fund’s investments for U.S. federal income tax purposes totaled $1,654,047 as of June 30, 2016. Aggregate net unrealized appreciation (depreciation) on a tax basis was $(121,968), which was comprised of gross unrealized appreciation of $27,079 and gross unrealized depreciation of $149,047, as of June 30, 2016.
Note 6. Financial Instruments
The Fund may trade in financial instruments with off-balance sheet risk in the normal course of its investing activities. These financial instruments may include forward contracts, futures contracts, swap contracts and written options and may involve, to a varying degree, elements of risk in excess of the amounts recognized for financial statement purposes. The notional or contractual amounts of these instruments represent the investment the Fund has in particular classes of financial instruments and do not necessarily represent the amounts potentially subject to risk. The measurement of the risks associated with these instruments is meaningful only when all related and offsetting transactions are considered.
The Fund is subject to credit risk in the normal course of pursuing its investment objectives. The Fund may enter into credit default swap contracts to manage its credit risk, to gain exposure to a credit in which it may otherwise invest or to enhance its returns. The Fund may also purchase and write call and put options in an effort to manage risk and/or generate gains from options premiums.
The Fund may enter into swap contracts containing provisions allowing the counterparty to terminate the contract under certain conditions, including, but not limited to, a decline in the Fund’s NAV below a certain level over a certain period of time, which would trigger a payment by the Fund for those swaps in a liability position. A call option gives the purchaser (holder) of the option the right (but not the obligation) to buy, and obligates the writer to sell (if the option is exercised), the underlying instrument at the exercise or strike price at any time or at a specified time during the option period. A put option gives the holder the right to sell and obligates the writer to
30
FS Global Credit Opportunities Fund
Notes to Unaudited Consolidated Financial Statements (continued)
(in thousands, except share and per share amounts)
Note 6. Financial Instruments (continued)
buy the underlying instrument at the exercise or strike price at any time or at a specified time during the option period. The fair value of open derivative instruments (which are not considered to be hedging instruments for accounting disclosure purposes) whose primary underlying risk exposure is credit risk as of June 30, 2016 was as follows:
| | | | | | | | |
| | | Fair Value | |
Derivative | | Asset Derivative | | | Liability Derivative | |
Credit default swap contracts | | $ | 2,120 | (1) | | $ | — | |
| (1) | Unaudited consolidated statement of assets and liabilities location: Unamortized swap premiums paid and unrealized appreciation on credit default swaps. |
The Fund’s derivative assets and liabilities at fair value by risk, which are reported on a gross basis on its unaudited consolidated statement of assets and liabilities, are presented in the table above.
The following table presents the Fund’s derivative assets by counterparty, net of amounts available for offset under a master netting agreement and net of the related collateral received by the Fund for assets as of June 30, 2016:
| | | | | | | | | | | | | | | | | | | | |
Counterparty | | Derivative Assets
Subject to Master
Netting Agreement | | | Derivatives
Available for
Offset | | | Non-cash
Collateral
Received(1) | | | Cash
Collateral
Received(1) | | | Net
Amount of
Derivative
Assets(2) | |
JPMorgan Chase Bank, N.A. | | $ | 2,120 | | | $ | — | | | $ | — | | | $ | — | | | $ | 2,120 | |
| (1) | In some instances, the actual amount of the collateral received and/or pledged may be more than the amount shown due to overcollateralization. |
| (2) | Net amount of derivative assets represents the net amount due from the counterparty to the Fund in the event of default. |
The effect of derivative instruments (which are not considered to be hedging instruments for accounting disclosure purposes) on the Fund’s unaudited consolidated statement of operations whose primary underlying risk exposure is credit risk for the six months ended June 30, 2016 was as follows:
| | | | | | | | |
Derivative | | Realized Gain (Loss) on
Derivatives Recognized in
Income | | | Net Change in Unrealized
Appreciation
(Depreciation) on
Derivatives Recognized in
Income | |
Credit default swap contracts | | $ | (6,826 | )(1) | | $ | (528 | )(2) |
| (1) | Unaudited consolidated statement of operations location: Net realized gain (loss) on credit default swaps. |
| (2) | Unaudited consolidated statement of operations location: Net change in unrealized appreciation (depreciation) on credit default swaps. |
The average notional amount of credit default swap contracts outstanding during the six months ended June 30, 2016, which is indicative of the volume of this derivative type, was $29,895.
31
FS Global Credit Opportunities Fund
Notes to Unaudited Consolidated Financial Statements (continued)
(in thousands, except share and per share amounts)
Note 7. Investment Portfolio
The following table summarizes the composition of the Fund’s investment portfolio at cost and fair value as of June 30, 2016:
| | | | | | | | | | | | |
| | | June 30, 2016 | |
| | | Amortized Cost(1) | | | Fair Value | | | Percentage
of Portfolio | |
Senior Secured Loans—First Lien | | $ | 581,734 | | | $ | 535,474 | | | | 35 | % |
Senior Secured Loans—Second Lien | | | 168,745 | | | | 155,616 | | | | 10 | % |
Senior Secured Bonds | | | 331,951 | | | | 318,417 | | | | 21 | % |
Subordinated Debt | | | 457,386 | | | | 407,888 | | | | 27 | % |
Collateralized Securities | | | 17,050 | | | | 16,371 | | | | 1 | % |
Equity/Other | | | 90,477 | | | | 98,313 | | | | 6 | % |
| | | | | | | | | | | | |
Total | | $ | 1,647,343 | | | $ | 1,532,079 | | | | 100 | % |
| | | | | | | | | | | | |
| (1) | Amortized cost represents the original cost adjusted for the amortization of premiums and/or accretion of discounts, as applicable, on investments. |
As of June 30, 2016, the Fund did not “control” any of its portfolio companies and except for Aspect Software, Inc., in which the Fund has two senior secured loans, one of which was an unfunded commitment, a subordinated debt investment and an equity/other investment, the Fund was not an “affiliated person” of any of its portfolio companies, each as defined in the 1940 Act.
In general, under the 1940 Act, the Fund would be presumed to “control” a portfolio company if it owned more than 25% of its voting securities or had the power to exercise control over the management or policies of such portfolio company, and would be an “affiliated person” of a portfolio company if it owned 5% or more of its voting securities.
The Fund’s investment portfolio may contain loans that are in the form of lines of credit or revolving credit facilities, which require the Fund to provide funding when requested by portfolio companies in accordance with the terms of the underlying loan agreements. As of June 30, 2016, the Fund had five senior secured loan investments with aggregate unfunded commitments of $39,609. The Fund maintains sufficient cash on hand and/or available borrowings to fund such unfunded commitments should the need arise.
32
FS Global Credit Opportunities Fund
Notes to Unaudited Consolidated Financial Statements (continued)
(in thousands, except share and per share amounts)
Note 7. Investment Portfolio (continued)
The table below describes investments by industry classification and enumerates the percentage, by fair value, of the total portfolio assets in such industries as of June 30, 2016:
| | | | | | | | |
| | | June 30, 2016 | |
Industry Classification | | Fair Value | | | Percentage
of Portfolio | |
Automobiles & Components | | $ | 8,917 | | | | 1 | % |
Capital Goods | | | 138,220 | | | | 9 | % |
Commercial & Professional Services | | | 21,594 | | | | 1 | % |
Consumer Durables & Apparel | | | 26,454 | | | | 2 | % |
Consumer Services | | | 63,751 | | | | 4 | % |
Diversified Financials | | | 35,040 | | | | 2 | % |
Energy | | | 128,609 | | | | 8 | % |
Food & Staples Retailing | | | 19,013 | | | | 1 | % |
Food, Beverage & Tobacco | | | 21,830 | | | | 2 | % |
Health Care Equipment & Services | | | 3,616 | | | | 0 | % |
Household & Personal Products | | | 34,192 | | | | 2 | % |
Insurance | | | 70,754 | | | | 5 | % |
Materials | | | 94,350 | | | | 6 | % |
Media | | | 123,864 | | | | 8 | % |
Pharmaceuticals, Biotechnology & Life Sciences | | | 74,338 | | | | 5 | % |
Real Estate | | | 54,360 | | | | 4 | % |
Retailing | | | 45,564 | | | | 3 | % |
Software & Services | | | 270,044 | | | | 18 | % |
Technology Hardware & Equipment | | | 97,037 | | | | 6 | % |
Telecommunication Services | | | 122,391 | | | | 8 | % |
Transportation | | | 78,141 | | | | 5 | % |
| | | | | | | | |
Total | | $ | 1,532,079 | | | | 100 | % |
| | | | | | | | |
The table below describes the geographic concentration of the Fund’s investment portfolio and enumerates the percentage, by fair value, of the total portfolio assets in such geographic locations as of June 30, 2016:
| | | | | | | | |
| | | June 30, 2016 | |
Geographic Locations(1) | | Fair Value | | | Percentage
of Portfolio | |
United States | | $ | 1,082,274 | | | | 71 | % |
Europe | | | 309,121 | | | | 20 | % |
Other | | | 140,684 | | | | 9 | % |
| | | | | | | | |
Total | | $ | 1,532,079 | | | | 100 | % |
| | | | | | | | |
| (1) | Geographic location based on the portfolio company’s headquarters or principal place of business. |
Purchases and sales of securities during the six months ended June 30, 2016, other than short-term securities and U.S. government obligations, were $1,118,421 and $668,421, respectively.
33
FS Global Credit Opportunities Fund
Notes to Unaudited Consolidated Financial Statements (continued)
(in thousands, except share and per share amounts)
Note 8. Fair Value of Financial Instruments
Under existing accounting guidance, fair value is defined as the price that the Fund would receive upon selling an asset or pay to transfer a liability in an orderly transaction to a market participant in the principal or most advantageous market for the investment. This accounting guidance emphasizes that valuation techniques maximize the use of observable market inputs and minimize the use of unobservable inputs. Inputs refer broadly to the assumptions that market participants would use in pricing an asset or liability, including assumptions about risk. Inputs may be observable or unobservable. Observable inputs are inputs that reflect the assumptions market participants would use in pricing an asset or liability developed based on market data obtained from sources independent of the Fund. Unobservable inputs are inputs that reflect the assumptions market participants would use in pricing an asset or liability developed based on the best information available in the circumstances. The Fund classifies the inputs used to measure these fair values into the following hierarchy as defined by current accounting guidance:
Level 1: Inputs that are quoted prices (unadjusted) in active markets for identical assets or liabilities.
Level 2: Inputs that are quoted prices for similar assets or liabilities in active markets.
Level 3: Inputs that are unobservable for an asset or liability.
A financial instrument’s categorization within the valuation hierarchy is based upon the lowest level of input that is significant to the fair value measurement.
As of June 30, 2016, the Fund’s investments were categorized as follows in the fair value hierarchy:
| | | | |
Valuation Inputs | | June 30, 2016 | |
Level 1—Price quotations in active markets | | $ | 54,155 | |
Level 2—Significant other observable inputs | | | — | |
Level 3—Significant unobservable inputs | | | 1,477,924 | |
| | | | |
Total | | $ | 1,532,079 | |
| | | | |
As of June 30, 2016, the Fund’s credit default swaps were categorized as follows in the fair value hierarchy:
| | | | | | | | |
| | | June 30, 2016 | |
Valuation Inputs | | Asset | | | Liability | |
Level 1—Price quotations in active markets | | $ | — | | | $ | — | |
Level 2—Significant other observable inputs | | | — | | | | — | |
Level 3—Significant unobservable inputs | | | 2,120 | | | | — | |
| | | | | | | | |
Total | | $ | 2,120 | | | $ | — | |
| | | | | | | | |
The Fund’s investments as of June 30, 2016 consisted primarily of debt securities that are traded on a private over-the-counter market for institutional investors. Except as described below, the Fund valued its investments and credit default swaps by using the midpoint of the prevailing bid and ask prices from dealers on the date of the period end, which were provided by an independent third-party pricing service approved by the Board and screened for validity by such service. Twenty-four equity/other investments which were traded on an active public market were valued at their closing price as of June 30, 2016. Thirty-four senior secured loan investments, one senior secured bond investment and one subordinated debt investment were valued by an
34
FS Global Credit Opportunities Fund
Notes to Unaudited Consolidated Financial Statements (continued)
(in thousands, except share and per share amounts)
Note 8. Fair Value of Financial Instruments (continued)
independent third-party valuation service approved by the Board, which determined the fair value of such investments by considering, among other factors, the borrower’s ability to adequately service its debt, prevailing interest rates for like investments, expected cash flows, call features, anticipated prepayments and other relevant terms of the debt. Four of the Fund’s equity/other investments were valued by the same independent valuation firm, which determined the fair value of such investments by considering, among other factors, contractual rights ascribed to such investments, as well as various income scenarios and multiples of earnings before interest, taxes, depreciation and amortization, or EBITDA, cash flows, net income, revenues or, in limited instances, book value or liquidation value.
The Fund periodically benchmarks the bid and ask prices it receives from the third-party pricing service and/or dealers against the actual prices at which the Fund purchases and sells its investments. Based on the results of the benchmark analysis and the experience of the Fund’s management in purchasing and selling these investments in other investment funds managed by the sponsor, the Fund believes that these prices are reliable indicators of fair value. However, because of the private nature of this marketplace (meaning actual transactions are not publicly reported), the Fund believes that these valuation inputs are classified as Level 3 within the fair value hierarchy. The Fund may also use other methods, including the use of an independent third-party valuation service approved by the Board, to determine fair value for securities for which it cannot obtain prevailing bid and ask prices through independent third-party pricing services or independent dealers, or where the Board otherwise determines that the use of such other methods is appropriate. The Fund will periodically benchmark the valuations provided by the independent third-party valuation service against the actual prices at which the Fund purchases and sells its investments. The Fund’s valuation committee and Board reviewed the valuation determinations made with respect to these investments and determined that they were made in a manner consistent with the Fund’s valuation process.
35
FS Global Credit Opportunities Fund
Notes to Unaudited Consolidated Financial Statements (continued)
(in thousands, except share and per share amounts)
Note 8. Fair Value of Financial Instruments (continued)
The following is a reconciliation for the six months ended June 30, 2016 of investments for which significant unobservable inputs (Level 3) were used in determining fair value:
| | | | | | | | | | | | | | | | | | | | | | | | | | | | |
| | | For the Six Months Ended June 30, 2016 | |
| | | Senior
Secured
Loans—First
Lien | | | Senior
Secured
Loans—Second
Lien | | | Senior
Secured
Bonds | | | Subordinated
Debt | | | Collateralized
Securities | | | Equity/
Other | | | Total | |
Fair value at beginning of period | | $ | 429,918 | | | $ | 116,853 | | | $ | 201,436 | | | $ | 220,165 | | | $ | 14,615 | | | $ | 6 | | | $ | 982,993 | |
Accretion of discount (amortization of premium) | | | 5,408 | | | | 447 | | | | 2,940 | | | | 5,157 | | | | — | | | | — | | | | 13,952 | |
Net realized gain (loss) | | | 16,139 | | | | (140 | ) | | | (52,898 | ) | | | (6,460 | ) | | | — | | | | — | | | | (43,359 | ) |
Net change in unrealized appreciation (depreciation) | | | (1,474 | ) | | | 4,202 | | | | 42,894 | | | | 13,199 | | | | 1,662 | | | | 6,040 | | | | 66,523 | |
Purchases | | | 256,789 | | | | 44,157 | | | | 286,638 | | | | 408,034 | | | | 1,454 | | | | 38,125 | | | | 1,035,197 | |
Paid-in-kind interest | | | 112 | | | | — | | | | 286 | | | | 40 | | | | — | | | | — | | | | 438 | |
Sales and redemptions | | | (171,418 | ) | | | (9,903 | ) | | | (162,879 | ) | | | (232,247 | ) | | | (1,360 | ) | | | (13 | ) | | | (577,820 | ) |
Net transfers in or out of Level 3 | | | — | | | | — | | | | — | | | | — | | | | — | | | | — | | | | — | |
| | | | | | | | | | | | | | | | | | | | | | | | | | | | |
Fair value at end of period | | $ | 535,474 | | | $ | 155,616 | | | $ | 318,417 | | | $ | 407,888 | | | $ | 16,371 | | | $ | 44,158 | | | $ | 1,477,924 | |
| | | | | | | | | | | | | | | | | | | | | | | | | | | | |
The amount of total gains or losses for the period included in changes in net assets attributable to the change in unrealized gains or losses relating to investments still held at the reporting date | | $ | (8,150 | ) | | $ | 3,678 | | | $ | 6,671 | | | $ | 11,704 | | | $ | 1,662 | | | $ | 6,034 | | | $ | 21,599 | |
| | | | | | | | | | | | | | | | | | | | | | | | | | | | |
The following is a reconciliation for the six months ended June 30, 2016 of credit default swaps—sell protection for which significant unobservable inputs (Level 3) were used in determining fair value:
| | | | |
| | | For the Six Months Ended
June 30, 2016 | |
Fair value at beginning of period | | $ | (5,045 | ) |
Net realized gain (loss) | | | (2,735 | ) |
Net change in unrealized appreciation (depreciation) | | | 3,671 | |
Swap premiums received | | | — | |
Coupon payments received | | | (121 | ) |
Premiums paid on exit | | | 4,230 | |
Net transfers in or out of Level 3 | | | — | |
| | | | |
Fair value at end of period | | $ | — | |
| | | | |
The amount of total gains or losses for the period included in changes in net assets attributable to the change in unrealized gains or losses relating to credit default swaps—sell protection still held at the reporting date | | $ | — | |
| | | | |
36
FS Global Credit Opportunities Fund
Notes to Unaudited Consolidated Financial Statements (continued)
(in thousands, except share and per share amounts)
Note 8. Fair Value of Financial Instruments (continued)
The following is a reconciliation for the six months ended June 30, 2016 of credit default swaps—buy protection for which significant unobservable inputs (Level 3) were used in determining fair value:
| | | | |
| | | For the Six Months Ended
June 30, 2016 | |
Fair value at beginning of period | | $ | 18,351 | |
Net realized gain (loss) | | | (4,091 | ) |
Net change in unrealized appreciation (depreciation) | | | (4,199 | ) |
Swap premiums paid | | | 8,325 | |
Coupon payments paid | | | 543 | |
Premiums received on exit | | | (16,809 | ) |
Net transfers in or out of Level 3 | | | — | |
| | | | |
Fair value at end of period | | $ | 2,120 | |
| | | | |
The amount of total gains or losses for the period included in changes in net assets attributable to the change in unrealized gains or losses relating to credit default swaps—buy protection still held at the reporting date | | $ | (65 | ) |
| | | | |
The valuation techniques and significant unobservable inputs used in recurring Level 3 fair value measurements as of June 30, 2016 are as follows:
| | | | | | | | | | | | | | | | |
Type of Investment | | Fair Value at
June 30, 2016 | | | Valuation
Technique(1) | | Unobservable Input | | Range | | | Weighted
Average | |
Senior Secured Loans—First Lien | | $ | 468,697 | | | Market Quotes | | Indicative Dealer Quotes | | | 44.4% - 102.5% | | | | 90.6% | |
| | | 56,953 | | | Market Comparables | | Market Yield (%) | | | 7.5% - 11.8% | | | | 9.2% | |
| | | 9,824 | | | Market Comparables | | EBITDA Multiples (x) | | | 5.5x - 6.0x | | | | 5.8x | |
Senior Secured Loans—Second Lien | | | 155,616 | | | Market Quotes | | Indicative Dealer Quotes | | | 26.8% - 100.9% | | | | 91.8% | |
Senior Secured Bonds | | | 306,823 | | | Market Quotes | | Indicative Dealer Quotes | | | 68.3% - 100.8% | | | | 87.6% | |
| | | 11,594 | | | Market Comparables | | Market Yield (%) | | | 13.3% - 14.3% | | | | 13.8% | |
Subordinated Debt | | | 402,179 | | | Market Quotes | | Indicative Dealer Quotes | | | 1.5% - 107.3% | | | | 84.0% | |
| | | 5,709 | | | Market Comparables | | EBITDA Multiples (x) | | | 8.8x - 9.3x | | | | 9.0x | |
Collateralized Securities | | | 16,371 | | | Market Quotes | | Indicative Dealer Quotes | | | 54.9% - 76.4% | | | | 63.6% | |
Equity/Other | | | 5 | | | Market Quotes | | Indicative Dealer Quotes | | | $7.50 - $9.50 | | | | $8.50 | |
| | | 44,153 | | | Market Comparables | | EBITDA Multiples (x) | | | 6.5x - 9.3x | | | | 8.8x | |
| | | | | | | | Production Multiples (Mboe/d) | |
| $40,000.00 -
$45,000.00 |
| | | $42,500.00 | |
| | | | | | | | Proved Reserves Multiples (Mmboe) | | | $8.80 - $9.30 | | | | $9.00 | |
| | | | | | | | PV-10 Multiples (x) | | | 1.7x - 1.8x | | | | 1.8x | |
| | | | | | | | Reserve Multiples ($/tonne) | | | 0.5x - 2.9x | | | | 1.7x | |
| | | | | | Discounted Cash Flow | | Discount Rate (%) | | | 13.5% - 14.5% | | | | 14.0% | |
| | | | | | | | | | | | | | | | |
Total | | $ | 1,477,924 | | | | | | | | | | | | | |
| | | | | | | | | | | | | | | | |
Credit Default Swaps—Buy Protection | | $ | 2,120 | | | Market Quotes | | Indicative Dealer Quotes | | | (31.0)% - (30.0)% | | | | (30.3)% | |
| (1) | Investments using a market quotes valuation technique were valued by using the midpoint of the prevailing bid and ask prices from dealers on the date of the period end, which were provided by an independent third- |
37
FS Global Credit Opportunities Fund
Notes to Unaudited Consolidated Financial Statements (continued)
(in thousands, except share and per share amounts)
Note 8. Fair Value of Financial Instruments (continued)
| | party pricing service and screened for validity by such service. For investments utilizing a market comparables valuation technique, a significant increase (decrease) in the market yield, in isolation, would result in a significantly lower (higher) fair value measurement, and a significant increase (decrease) in any of the valuation multiples, in isolation, would result in a significantly higher (lower) fair value measurement. For investments utilizing a discounted cash flow valuation technique, a significant increase (decrease) in the discount rate, in isolation, would result in a significantly lower (higher) fair value measurement. |
Note 9. Financing Arrangements
The following table presents summary information with respect to the Fund’s outstanding financing arrangements as of June 30, 2016.
| | | | | | | | | | | | | | |
Arrangement | | Type of Arrangement | | Rate | | Amount
Outstanding | | | Amount
Available | | | Maturity Date |
Dauphin Funding Facility | | Revolving Credit Facility | | L+1.55% | | $ | 176,024 | | | $ | 73,976 | | | August 25, 2016(1) |
Bucks Funding Facility | | Prime Brokerage Facility | | L+1.10% | | $ | 156,562 | | | $ | 43,438 | | | March 27, 2017(2) |
| (1) | On August 25, 2016, the Fund’s wholly-owned, special-purpose financing subsidiary, Dauphin Funding LLC, or Dauphin Funding, entered into an amendment to the Dauphin Funding facility (as defined below) to, among other things, extend the maturity date of the Dauphin Funding facility to August 25, 2017 and to increase the borrowing rate to the three-month LIBOR (as defined below) plus a spread of 1.80% per annum. See Note 12 for more information. |
| (2) | As described below, this facility generally is terminable upon 270 days’ notice by either party. As of June 30, 2016, neither party to the facility had provided notice of its intent to terminate the facility. |
Dauphin Funding Facility
On August 26, 2014, the Fund’s wholly-owned, special-purpose financing subsidiary, Dauphin Funding, entered into a revolving credit facility, or the Dauphin Funding facility, with Deutsche Bank AG, New York Branch, or Deutsche Bank, as administrative agent and a lender, and the other lenders party thereto. The Dauphin Funding facility originally provided for borrowings in an aggregate principal amount up to $150,000 on a committed basis. On December 9, 2014, the Dauphin Funding facility was amended to increase the maximum commitment available under the facility to $250,000 and, on August 25, 2015, the Dauphin Funding facility was further amended to, among other things, extend the maturity date of the facility to August 25, 2016.
The Fund may contribute assets to Dauphin Funding from time to time, subject to certain restrictions set forth in the Dauphin Funding facility, and will retain a residual interest in any assets contributed through its ownership of Dauphin Funding or will receive fair market value for any assets sold to Dauphin Funding. Dauphin Funding may purchase additional assets from various sources. Dauphin Funding has appointed the Fund to manage its portfolio of assets pursuant to the terms of an investment management agreement. Dauphin Funding’s obligations to Deutsche Bank under the Dauphin Funding facility are secured by a first priority security interest in substantially all of the assets of Dauphin Funding, including its portfolio of assets. The obligations of Dauphin Funding under the Dauphin Funding facility are non-recourse to the Fund and the Fund’s exposure under the Dauphin Funding facility is limited to the value of the Fund’s investment in Dauphin Funding.
38
FS Global Credit Opportunities Fund
Notes to Unaudited Consolidated Financial Statements (continued)
(in thousands, except share and per share amounts)
Note 9. Financing Arrangements (continued)
Borrowings under the Dauphin Funding facility accrue interest at a rate equal to the three-month London Interbank Offered Rate, or LIBOR, plus a spread of 1.55% per annum. Any amounts borrowed under the Dauphin Funding facility will mature, and all accrued and unpaid interest thereunder will be due and payable, on August 25, 2016. Borrowings under the Dauphin Funding facility are subject to compliance with a borrowing base, pursuant to which the amount of funds advanced to Dauphin Funding varies depending upon the types of assets in Dauphin Funding’s portfolio.
Under the Dauphin Funding facility, Dauphin Funding has made certain representations and warranties and is required to comply with various covenants and reporting requirements customary for facilities of this type. The Dauphin Funding facility contains the following events of default: (a) the failure to make principal payments when due or interest payments within three business days of when due; (b) the purchase by Dauphin Funding of certain ineligible assets; (c) the insolvency or bankruptcy of Dauphin Funding or the Fund; (d) the Fund ceasing to act as investment manager of Dauphin Funding’s assets; (e) the decline of the Fund’s NAV below a specified threshold; (f) fraud or other illicit acts by the Fund, FS Global Advisor or GSO in their respective investment advisory capacities; and (g) the occurrence of a default or similar condition under certain third-party contracts by the Fund or Dauphin Funding. Upon the occurrence of an event of default, Deutsche Bank may declare the outstanding principal and interest and all other amounts owing under the Dauphin Funding facility immediately due and payable. During the continuation of an event of default, Dauphin Funding must pay interest at a default rate.
As of June 30, 2016, $176,024 was outstanding under the Dauphin Funding facility. The carrying amount outstanding under the Dauphin Funding facility approximates its fair value. The Fund incurred costs of $1,251 in connection with obtaining and amending the Dauphin Funding facility, which the Fund has recorded as deferred financing costs on its unaudited consolidated statement of assets and liabilities and amortizes to interest expense over the life of the facility. As of June 30, 2016, $95 of such deferred financing costs had yet to be amortized to interest expense.
For the six months ended June 30, 2016, the components of total interest expense for the Dauphin Funding facility were as follows:
| | | | |
| | | Six Months Ended
June 30, 2016 | |
Direct interest expense | | $ | 1,908 | |
Amortization of deferred financing costs | | | 311 | |
| | | | |
Total interest expense | | $ | 2,219 | |
| | | | |
For the six months ended June 30, 2016, the cash paid for interest expense, average borrowings, effective interest rate and weighted average interest rate for the Dauphin Funding facility were as follows:
| | | | |
| | | Six Months Ended
June 30, 2016 | |
Cash paid for interest expense(1) | | $ | 1,638 | |
Average borrowings under the facility | | $ | 177,962 | |
Effective interest rate on borrowings | | | 2.17 | % |
Weighted average interest rate | | | 2.13 | % |
| (1) | Interest under the Dauphin Funding facility is payable quarterly in arrears. |
39
FS Global Credit Opportunities Fund
Notes to Unaudited Consolidated Financial Statements (continued)
(in thousands, except share and per share amounts)
Note 9. Financing Arrangements (continued)
Borrowings of Dauphin Funding are considered borrowings of the Fund for purposes of complying with the asset coverage requirements under the 1940 Act applicable to closed-end management investment companies.
Bucks Funding Facility
On March 10, 2015, the Fund’s wholly-owned financing subsidiary, Bucks Funding, entered into a committed facility arrangement, or the Bucks Funding facility, with BNP Paribas Prime Brokerage, Inc., or BNPP, on behalf of itself and as agent for BNP Paribas, BNP Paribas Prime Brokerage International, Ltd. and BNPP, or, collectively, the BNPP Entities. The Bucks Funding facility was amended on October 15, 2015 to provide BNPP with the cancellation right described below. Effective June 30, 2016, Bucks Funding entered into an amendment to the Bucks Funding facility to increase the maximum commitment available to Bucks Funding under the facility to $200,000. The Bucks Funding facility was effected through a committed facility agreement by and between Bucks Funding and BNPP, or the committed facility agreement, a U.S. Prime Brokerage agreement by and between Bucks Funding and BNPP and a special custody and pledge agreement by and among Bucks Funding, BNPP and State Street Bank and Trust Company, or State Street, as custodian, each dated as of March 10, 2015, and which are collectively referred to herein as the BNP financing agreements.
The Fund may contribute securities to Bucks Funding from time to time, subject to certain restrictions set forth in the committed facility agreement, and will retain a residual interest in any securities contributed through its ownership of Bucks Funding or will receive fair market value for any securities sold to Bucks Funding. Bucks Funding may purchase additional securities from various sources. Bucks Funding has appointed the Fund to manage its portfolio of securities pursuant to the terms of an investment management agreement. Bucks Funding’s obligations to BNPP under the Bucks Funding facility are secured by a first priority security interest in substantially all of the assets of Bucks Funding, including its portfolio of securities. Such pledged portfolio of securities is held in a segregated custody account with State Street. The value of securities required to be pledged by Bucks Funding is determined in accordance with the margin requirements described in the BNP financing agreements. The obligations of Bucks Funding under the Bucks Funding facility are non-recourse to the Fund, and the Fund’s exposure under the Bucks Funding facility is limited to the value of its investment in Bucks Funding.
Borrowings under the Bucks Funding facility accrue interest at a rate equal to three-month LIBOR plus 1.10% per annum. Interest is payable monthly in arrears. Bucks Funding is required to pay a non-usage fee of 0.55% per annum to the extent the aggregate principal amount available under the Bucks Funding facility has not been utilized. Bucks Funding may terminate the committed facility agreement upon 270 days’ notice. Absent a default or facility termination event (or the ratings decline described in the following sentence), BNPP is required to provide Bucks Funding with 270 days’ notice prior to terminating or materially amending the committed facility agreement. BNPP has a cancellation right if BNP Paribas’ long-term credit rating declines three or more notches below its highest rating by any of Standard & Poor’s Ratings Services, Moody’s Investors Service, Inc. or Fitch Ratings, Inc. during the term of the Bucks Funding facility. Upon any such termination, BNPP is required to pay Bucks Funding a fee equal to 0.50% of the maximum amount of financing available on the termination date. Bucks Funding paid an arrangement fee and incurred certain other customary costs and expenses in connection with obtaining and amending the Bucks Funding facility.
In connection with the Bucks Funding facility, Bucks Funding has made certain representations and warranties and is required to comply with various covenants and reporting requirements customary for facilities
40
FS Global Credit Opportunities Fund
Notes to Unaudited Consolidated Financial Statements (continued)
(in thousands, except share and per share amounts)
Note 9. Financing Arrangements (continued)
of this type. The BNP financing agreements contain the following events of default and termination events, among others: (a) the occurrence of a default or similar condition under certain third-party contracts of the Fund or Bucks Funding; (b) any change in BNPP’s interpretation of applicable law that, in the reasonable opinion of counsel to BNPP, has the effect of impeding or prohibiting the Bucks Funding facility; (c) certain events of insolvency or bankruptcy by the Fund or Bucks Funding; (d) specified material reductions in the Fund’s or Bucks Funding’s NAV; (e) any change in the Fund’s fundamental or material investment policies; and (f) the termination of the investment advisory agreement or if FS Global Advisor otherwise ceases to act as the Fund’s investment adviser and is not immediately replaced by an affiliate or other investment adviser acceptable to BNPP.
Under the terms of the BNP financing agreements, BNPP has the ability to borrow a portion of the pledged collateral, or collectively, the rehypothecated securities, subject to certain limits. Bucks Funding will receive a fee from BNPP in connection with any rehypothecated securities. Bucks Funding may designate any security within the pledged collateral as ineligible to be a rehypothecated security, provided there are eligible securities within the segregated custody account in an amount equal to the outstanding borrowings owed by Bucks Funding to BNPP. Bucks Funding may recall any rehypothecated security at any time, and BNPP must return such security or equivalent security within a commercially reasonable period. In the event BNPP does not return the security, Bucks Funding will have the right to, among other things, apply and set off an amount equal to 100% of the then-current fair market value of such unreturned rehypothecated security against any outstanding borrowings owed to BNPP under the BNP financing agreements. Rehypothecated securities are marked-to-market daily and if the value of all rehypothecated securities exceeds 100% of the outstanding borrowings owed by Bucks Funding under the BNP financing agreements, BNPP may either reduce the amount of rehypothecated securities to eliminate such excess or deposit into the segregated custody account an amount of cash equal to such excess. Bucks Funding will continue to receive interest and the scheduled repayment of principal balances on rehypothecated securities.
As of June 30, 2016, $156,562 was outstanding under the Bucks Funding facility. The carrying amount outstanding under the Bucks Funding facility approximates its fair value. The Fund incurred costs of $225 in connection with obtaining and amending the Bucks Funding facility, which the Fund has recorded as deferred financing costs on its unaudited consolidated statement of assets and liabilities and amortizes to interest expense over the life of the facility. As of June 30, 2016, all of the deferred financing costs had been amortized to interest expense.
For the six months ended June 30, 2016, the components of total interest expense for the Bucks Funding facility were as follows:
| | | | |
| | | Six Months Ended
June 30, 2016 | |
Direct interest expense | | $ | 1,288 | |
Non-usage fees | | | 3 | |
Amortization of deferred financing costs | | | 29 | |
| | | | |
Total interest expense | | $ | 1,320 | |
| | | | |
41
FS Global Credit Opportunities Fund
Notes to Unaudited Consolidated Financial Statements (continued)
(in thousands, except share and per share amounts)
Note 9. Financing Arrangements (continued)
For the six months ended June 30, 2016, the cash paid for interest expense, average borrowings, effective interest rate and weighted average interest rate for the Bucks Funding facility were as follows:
| | | | |
| | | Six Months Ended
June 30, 2016 | |
Cash paid for interest expense(1) | | $ | — | |
Average borrowings under the facility(2) | | $ | 156,058 | |
Effective interest rate on borrowings (including the effect of non-usage fees) | | | 1.75 | % |
Weighted average interest rate (including the effect of non-usage fees) | | | 1.74 | % |
| (1) | Interest under the Bucks Funding facility is payable monthly in arrears. |
Borrowings of Bucks Funding are considered borrowings of the Fund for purposes of complying with the asset coverage requirements under the 1940 Act applicable to closed-end management investment companies.
Note 10. Concentration of Risk
Investing in the Fund involves risks, including, but not limited to, those set forth below. The risks described below are not, and are not intended to be, a complete enumeration or explanation of the risks involved in an investment in the Fund. For a more complete discussion of the risks of investing in the Fund, see the section entitled “Types of Investments and Related Risks” in the Companies’ prospectuses and the Companies’ and the Fund’s other filings with the SEC.
Credit Risk: The Fund’s debt investments are subject to the risk of non-payment of scheduled interest or principal by the borrowers with respect to such investments. Such non-payment would likely result in a reduction of income to the Fund and a reduction in the value of the debt investments experiencing non-payment.
Although the Fund may invest in investments that FS Global Advisor believes are secured by specific collateral, the value of which may exceed the principal amount of the investments at the time of initial investment, there can be no assurance that the liquidation of any such collateral would satisfy the borrower’s obligation in the event of non-payment of scheduled interest or principal payments with respect to such investment, or that such collateral could be readily liquidated. In addition, in the event of bankruptcy of a borrower, the Fund could experience delays or limitations with respect to its ability to realize the benefits of the collateral securing an investment. Under certain circumstances, collateral securing an investment may be released without the consent of the Fund. Moreover, the Fund’s investments in secured debt may be unperfected for a variety of reasons, including the failure to make required filings by lenders, trustees or other responsible parties and, as a result, the Fund may not have priority over other creditors as anticipated. The Fund’s right to payment and its security interest, if any, may be subordinated to the payment rights and security interests of more senior creditors. Certain of these investments may have an interest-only payment schedule, with the principal amount remaining outstanding and at risk until the maturity of the investment. In this case, a portfolio company’s ability to repay the principal of an investment may be dependent upon a liquidity event or the long-term success of the company, the occurrence of which is uncertain.
Companies in which the Fund invests could deteriorate as a result of, among other factors, an adverse development in their business, a change in the competitive environment or an economic downturn. As a result,
42
FS Global Credit Opportunities Fund
Notes to Unaudited Consolidated Financial Statements (continued)
(in thousands, except share and per share amounts)
Note 10. Concentration of Risk (continued)
companies that the Fund expected to be stable may operate, or expect to operate, at a loss or have significant variations in operating results, may require substantial additional capital to support their operations or maintain their competitive position, or may otherwise have a weak financial condition or be experiencing financial distress.
Non-U.S. Securities Risk: Investments in certain securities and other instruments of non-U.S. issuers or borrowers, or non-U.S. securities, involve factors not typically associated with investing in the United States or other developed countries, including, but not limited to, risks relating to: (i) differences between U.S. and non-U.S. securities markets, including potential price volatility in and relative illiquidity of some non-U.S. securities markets; the absence of uniform accounting, auditing and financial reporting standards, practices and disclosure requirements; and less government supervision and regulation; (ii) other differences in law and regulation, including fewer investor protections, less stringent fiduciary duties, less developed bankruptcy laws and difficulty in enforcing contractual obligations; (iii) certain economic and political risks, including potential economic, political or social instability; exchange control regulations; restrictions on foreign investment and repatriation of capital, possibly requiring government approval; expropriation or confiscatory taxation; other government restrictions by the United States or other governments; higher rates of inflation; higher transaction costs; and reliance on a more limited number of commodity inputs, service providers and/or distribution mechanisms; and (iv) the possible imposition of local taxes on income and gains recognized with respect to securities and assets. Certain non-U.S. markets may rely heavily on particular industries or non-U.S. capital and are more vulnerable to diplomatic developments, the imposition of economic sanctions against a particular country or countries, organizations, entities and/or individuals, changes in international trading patterns, trade barriers and other protectionist or retaliatory measures. International trade barriers or economic sanctions against non-U.S. countries, organizations, entities and/or individuals may adversely affect the Fund’s non-U.S. holdings or exposures. Certain non-U.S. investments may become less liquid in response to social, political or market developments or adverse investor perceptions, or become illiquid after purchase by the Fund, particularly during periods of market turmoil. Certain non-U.S. investments may become illiquid when, for instance, there are few, if any, interested buyers and sellers or when dealers are unwilling to make a market for certain securities. When the Fund holds illiquid investments, its portfolio may be harder to value, especially in changing markets. The risks of investments in emerging markets, including the risks described above, are usually greater than the risks involved in investing in more developed markets. Because non-U.S. securities may trade on days when the Fund’s common shares are not priced, NAV may change at times when common shares cannot be sold.
Foreign Currency Risk: Investments made by the Fund, and the income received by the Fund with respect to such investments, may be denominated in various non-U.S. currencies. However, the books of the Fund are maintained in U.S. dollars. Accordingly, changes in currency values may adversely affect the U.S. dollar value of portfolio investments, interest and other revenue streams received by the Fund, gains and losses realized on the sale of portfolio investments and the amount of distributions, if any, made by the Fund. In addition, the Fund may incur substantial costs in converting investment proceeds from one currency to another. The Fund may enter into derivative transactions designed to reduce such currency risks. Furthermore, the portfolio companies in which the Fund invests may be subject to risks relating to changes in currency values. If a portfolio company suffers adverse consequences as a result of such changes, the Fund may also be adversely affected as a result.
43
FS Global Credit Opportunities Fund
Notes to Unaudited Consolidated Financial Statements (continued)
(in thousands, except share and per share amounts)
Note 11. Commitments and Contingencies
The Fund enters into contracts that contain a variety of indemnification provisions. The Fund’s maximum exposure under these arrangements is unknown; however, the Fund has not had prior claims or losses pursuant to these contracts. Management of FS Global Advisor has reviewed the Fund’s existing contracts and expects the risk of loss to the Fund to be remote.
The Fund is not currently subject to any material legal proceedings and, to the Fund’s knowledge, no material legal proceedings are threatened against the Fund. From time to time, the Fund may be a party to certain legal proceedings in the ordinary course of business, including proceedings related to the enforcement of the Fund’s rights under contracts with its portfolio companies. While the outcome of any legal proceedings cannot be predicted with certainty, the Fund does not expect that any such proceedings will have a material adverse effect upon its financial condition or results of operations.
See Note 4 for a discussion of the Fund’s commitments to FS Global Advisor and its affiliates (including Franklin Square Holdings).
See Note 7 for a discussion of the Fund’s unfunded commitments.
Note 12. Subsequent Events
On August 25, 2016, Dauphin Funding entered into an amendment to the Dauphin Funding facility to, among other things, (i) extend the maturity date of the Dauphin Funding facility to August 25, 2017, (ii) increase the applicable spread over LIBOR for a three-month period to 1.80% per annum, (iii) provide for a commitment fee of 0.75% per annum on the unborrowed portion of the Dauphin Funding facility, (iv) provide for an excess unused fee of 1.05% per annum payable on any unborrowed portion of the Dauphin Funding facility in excess of $125 million and (v) provide for a commitment reduction fee in an amount equal to the commitment fee and, as applicable, excess unused fee that would have accrued through scheduled maturity on any amount by which the commitments are reduced.
44
Supplemental Information
Changes in Accountants and Disagreements with Accountants on Accounting and Financial Disclosure
The Fund has not had any changes in its independent registered public accounting firm or disagreements with its independent registered public accounting firm on accounting or financial disclosure matters since its inception.
Form N-Q Filings
The Fund files its complete schedule of portfolio holdings with the SEC for the first and third quarters of each fiscal year on Form N-Q. The Fund’s Forms N-Q are available on the SEC’s website at http://www.sec.gov. The Fund’s Forms N-Q may also be reviewed and copied at the SEC’s Public Reference Room located at 100 F Street, NE, Washington, DC 20549. Shareholders may obtain information on the operation of the SEC’s Public Reference Room by calling the SEC at 1-800-SEC-0330.
Proxy Voting Policies and Procedures
The Fund has delegated its proxy voting responsibility to FS Global Advisor, the Fund’s investment adviser. Shareholders may obtain a copy of FS Global Advisor’s proxy voting policies and procedures upon request and without charge by calling the Fund collect at 215-495-1150 or on the SEC’s website at http://www.sec.gov.
Proxy Voting Record
Information regarding how FS Global Advisor voted proxies relating to the Fund’s portfolio securities during the most recent twelve-month period ended June 30 is available upon request and without charge by making a written request to the Fund’s Chief Compliance Officer at FS Global Credit Opportunities Fund, 201 Rouse Boulevard, Philadelphia, Pennsylvania 19112, Attn: Chief Compliance Officer, by calling the Fund collect at 215-495-1150 or on the SEC’s website at http://www.sec.gov.
45

FS GLOBAL CREDIT OPPORTUNITIES FUND
201 Rouse Boulevard Philadelphia, PA 19112 215-495-1150
Interests in FS Global Credit Opportunities Fund are not registered under the Securities Act of 1933, as amended (the
“Securities Act”), and are issued only to FS Global Credit Opportunities Fund–A, FS Global Credit Opportunities Fund–D,
FS Global Credit Opportunities Fund–T and FS Global Credit Opportunities Fund–ADV in private placement transactions
that do not involve any “public offering” within the meaning of Section 4(a)(2) of, and/or Regulation D under, the
Securities Act. This semi-annual report does not constitute an offer to sell, or the solicitation of an offer to buy,
any interest in FS Global Credit Opportunities Fund. Past performance is not indicative of future results.
SAR-GCO-M16
RRD 8/16
Not applicable to this semi-annual report on Form N-CSR.
| Item 3. | Audit Committee Financial Expert. |
Not applicable to this semi-annual report on Form N-CSR.
| Item 4. | Principal Accountant Fees and Services. |
Not applicable to this semi-annual report on Form N-CSR.
| Item 5. | Audit Committee of Listed Registrants. |
Not applicable to this semi-annual report on Form N-CSR.
| | (a) | The Company invests substantially all of its assets in FS Global Credit Opportunities Fund (the “Fund”), a separate non-diversified, closed-end management investment company with the same investment objectives and strategies as the Company. All investments in portfolio companies are made at the Fund level. The Fund’s unaudited consolidated schedule of investments as of June 30, 2016 is included as part of the Semi-Annual Report included in Item 1 of this semi-annual report on Form N-CSR. |
| Item 7. | Disclosure of Proxy Voting Policies and Procedures for Closed-End Management Investment Companies. |
Not applicable to this semi-annual report on Form N-CSR.
| Item 8. | Portfolio Managers of Closed-End Management Investment Companies. |
| | (a) | Not applicable to this semi-annual report on Form N-CSR. |
| | (b) | As of the date of filing of this semi-annual report on Form N-CSR, there has been no change in any of the portfolio managers identified in Item 8(a)(1) of the Company’s annual report on Form N-CSR for the fiscal year ended December 31, 2015. |
| Item 9. | Purchases of Equity Securities by Closed-End Management Investment Company and Affiliated Purchasers. |
The following table provides information concerning the Company’s repurchases of its common shares of beneficial interest, par value $0.001 per share (“common shares”), during the six months ended June 30, 2016 pursuant to its share repurchase program. All amounts are in thousands, except per share amounts.
REGISTRANT PURCHASES OF EQUITY SECURITIES
| | | | | | | | | | | | | | | | |
Period | | (a)
Total
Number of
Shares
Purchased(1) | | | (b)
Average
Price Paid
per Share | | | (c)
Total Number of
Shares
Purchased as
Part of Publicly
Announced Plans
or Programs | | | (d)
Maximum Number
(or Approximate
Dollar Value) of
Shares that May Yet
Be Purchased
Under the Plans or
Programs | |
January 1 to January 31, 2016 | | | 120,715 | | | $ | 7.061 | | | | 120,715 | | | | (2 | ) |
February 1 to February 29, 2016 | | | — | | | | — | | | | — | | | | — | |
March 1 to March 31, 2016 | | | — | | | | — | | | | — | | | | — | |
April 1 to April 30, 2016 | | | 147,817 | | | $ | 6.813 | | | | 147,817 | | | | (2 | ) |
May 1 to May 31, 2016 | | | — | | | | — | | | | — | | | | — | |
June 1 to June 30, 2016 | | | — | | | | — | | | | — | | | | — | |
| | | | | | | | | | | | | | | | |
Total | | | 268,532 | | | $ | 6.925 | | | | 268,532 | | | | (2 | ) |
| | | | | | | | | | | | | | | | |
| (1) | All shares were purchased as a result of tender offers conducted pursuant to the Company’s previously announced share repurchase program. |
| (2) | The Company currently intends to limit the number of common shares to be repurchased on each date of repurchase to the number of common shares the Company can repurchase with the aggregate proceeds it has received from the beginning of the calendar year through, but not including, such date of repurchase from the issuance of common shares under its distribution reinvestment plan, less the amount of any such proceeds used to repurchase common shares on each previous repurchase date for tender offers conducted during the calendar year. In addition, the Company will limit the number of common shares to be repurchased in any calendar year to 20% of the weighted average number of common shares outstanding in the prior calendar year, or 5% in each quarter, though the actual number of common shares that the Company offers to repurchase may be less in light of the limitations noted above. The Company will offer to repurchase such common shares at a price equal to the net asset value per common share in effect on each date of repurchase. The Company’s board of trustees (the “Board”) may amend, suspend or terminate the Company’s share repurchase program at any time. |
| Item 10. | Submission of Matters to a Vote of Security Holders. |
There were no material changes to the procedures by which the Company’s shareholders may recommend nominees to the Board during the period covered by this semi-annual report on Form N-CSR.
| Item 11. | Controls and Procedures. |
| | (a) | The Company’s principal executive officer and principal financial officer have evaluated the Company’s disclosure controls and procedures (as defined in Rule 30a-3(c) under the 1940 Act) as of a date within 90 days of the filing date of this semi-annual report on Form N-CSR and have concluded that the Company’s disclosure controls and procedures were effective, as of that date, in ensuring that information required to be disclosed by the Company in this semi-annual report on Form N-CSR was recorded, processed, summarized and reported timely. |
| | (b) | There was no change in the Company’s internal control over financial reporting (as defined in Rule 30a-3(d) under the 1940 Act) that occurred during the second fiscal quarter of the period covered by this semi-annual report on Form N-CSR that has materially affected, or is reasonably likely to materially affect, the Company’s internal control over financial reporting. |
| | (a)(1) | Not applicable to this semi-annual report on Form N-CSR. |
| | (a)(2) | The certifications of the Company’s Chief Executive Officer and Chief Financial Officer required by Rule 30a-2(a) under the 1940 Act are attached hereto. |
| | (b) | The certifications of the Company’s Chief Executive Officer and Chief Financial Officer required by Rule 30a-2(b) under the 1940 Act are attached hereto. |
SIGNATURES
Pursuant to the requirements of the Securities Exchange Act of 1934 and the Investment Company Act of 1940, the registrant has duly caused this report to be signed on its behalf by the undersigned, thereunto duly authorized.
| | |
| FS Global Credit Opportunities Fund—D |
| |
| By: | | /s/ Michael C. Forman |
| | Michael C. Forman |
| | President and Chief Executive Officer |
| | Date: August 25, 2016 |
Pursuant to the requirements of the Securities Exchange Act of 1934 and the Investment Company Act of 1940, this report has been signed below by the following persons on behalf of the registrant and in the capacities and on the dates indicated.
| | |
| By: | | /s/ Michael C. Forman |
| | Michael C. Forman |
| | President and Chief Executive Officer |
| | (Principal Executive Officer) |
| | Date: August 25, 2016 |
| | |
| By: | | /s/ William Goebel |
| | William Goebel |
| | Chief Financial Officer |
| | (Principal Financial Officer) |
| | Date: August 25, 2016 |