UNITED STATES
SECURITIES AND EXCHANGE COMMISSION
Washington, D.C. 20549
FORM N-CSR
CERTIFIED SHAREHOLDER REPORT OF REGISTERED
MANAGEMENT INVESTMENT COMPANIES
Investment Company Act file number: 811-22802
FS Global Credit Opportunities Fund
(Exact name of registrant as specified in charter)
| | |
Cira Centre 2929 Arch Street, Suite 675 Philadelphia, Pennsylvania | | 19104 |
| (Address of principal executive offices) | | (Zip code) |
Michael C. Forman
FS Global Credit Opportunities Fund
Cira Centre
2929 Arch Street, Suite 675
Philadelphia, Pennsylvania 19104
(Name and address of agent for service)
Registrant’s telephone number, including area code: (215) 495-1150
Date of fiscal year end: December 31
Date of reporting period: June 30, 2014
| Item 1. | Reports to Stockholders. |
The semi-annual report (the “Semi-Annual Report”) of FS Global Credit Opportunities Fund (the “Fund”) for the six months ended June 30, 2014 transmitted to shareholders pursuant to Rule 30e-1 under the Investment Company Act of 1940, as amended (the “1940 Act”), is as follows:
2014 SEMI-ANNUAL REPORT FS GLOBAL CREDIT OPPORTUNITIES FUND An alternative approach to global credit investing from Franklin Square Capital Partners FS GLOBAL CREDIT OPPORTUNITIES FUND
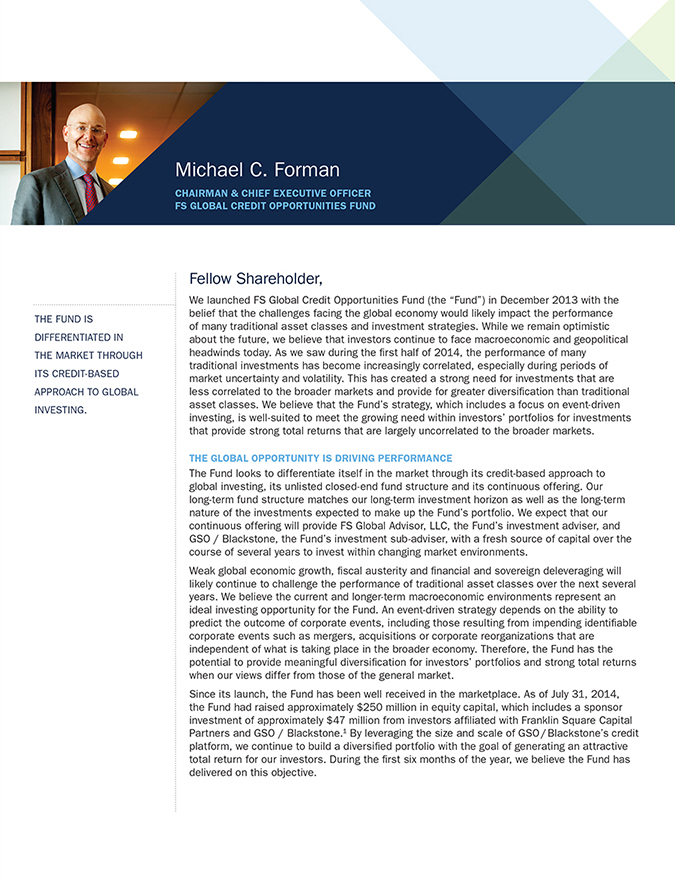
Michael C. Forman CHAIRMAN & CHIEF EXECUTIVE OFFICER FS GLOBAL CREDIT OPPORTUNITIES FUND THE FUND IS DIFFERENTIATED IN THE MARKET THROUGH ITS CREDIT-BASED APPROACH TO GLOBAL INVESTING. Fellow Shareholder, We launched FS Global Credit Opportunities Fund (the “Fund”) in December 2013 with the belief that the challenges facing the global economy would likely impact the performance of many traditional asset classes and investment strategies. While we remain optimistic about the future, we believe that investors continue to face macroeconomic and geopolitical headwinds today. As we saw during the first half of 2014, the performance of many traditional investments has become increasingly correlated, especially during periods of market uncertainty and volatility. This has created a strong need for investments that are less correlated to the broader markets and provide for greater diversification than traditional asset classes. We believe that the Fund’s strategy, which includes a focus on event-driven investing, is well-suited to meet the growing need within investors’ portfolios for investments that provide strong total returns that are largely uncorrelated to the broader markets. THE GLOBAL OPPORTUNITY IS DRIVING PERFORMANCE The Fund looks to differentiate itself in the market through its credit-based approach to global investing, its unlisted closed-end fund structure and its continuous offering. Our long-term fund structure matches our long-term investment horizon as well as the long-term nature of the investments expected to make up the Fund’s portfolio. We expect that our continuous offering will provide FS Global Advisor, LLC, the Fund’s investment adviser, and GSO / Blackstone, the Fund’s investment sub-adviser, with a fresh source of capital over the course of several years to invest within changing market environments. Weak global economic growth, fiscal austerity and financial and sovereign deleveraging will likely continue to challenge the performance of traditional asset classes over the next several years. We believe the current and longer-term macroeconomic environments represent an ideal investing opportunity for the Fund. An event-driven strategy depends on the ability to predict the outcome of corporate events, including those resulting from impending identifiable corporate events such as mergers, acquisitions or corporate reorganizations that are independent of what is taking place in the broader economy. Therefore, the Fund has the potential to provide meaningful diversification for investors’ portfolios and strong total returns when our views differ from those of the general market. Since its launch, the Fund has been well received in the marketplace. As of July 31, 2014, the Fund had raised approximately $250 million in equity capital, which includes a sponsor investment of approximately $47 million from investors affiliated with Franklin Square Capital Partners and GSO / Blackstone.1 By leveraging the size and scale of GSO / Blackstone’s credit platform, we continue to build a diversified portfolio with the goal of generating an attractive total return for our investors. During the first six months of the year, we believe the Fund has delivered on this objective.
PRESERVATION OF CAPITAL IS A CORNERSTONE OF OUR ASSET MANAGEMENT PRACTICE. As a result of strong appreciation of the Fund’s portfolio, its net asset value per share grew from $10.02 per share as of December 31, 2013 to $10.28 per share as of June 30, 2014. Through the first six months of 2014, the Fund generated a total return of 6.88% and provided shareholders with a high level of current income as we paid cash distributions of approximately $0.43 per share. In adhering to Franklin Square’s best practices, no portion of the Fund’s distributions were paid from offering proceeds or borrowings.2,3 Our ability to invest globally allows us to seek out investments that we believe balance our expectations for return with an appropriate level of risk without geographical constraints. As of June 30, 2014, the fair value of the Fund’s investment portfolio was approximately $169.2 million, invested across a range of portfolio companies, industries and geographies. As with all of Franklin Square’s offerings, preservation of capital is a cornerstone of our asset management practice. OUTLOOK: SECOND HALF OF 2014 Looking to the second half of 2014, we will seek to grow the Fund’s portfolio by, among other means, taking advantage of dislocations that arise in the credit markets. We believe our investment strategy, including event-driven investing, can create attractive investment opportunities given the many challenges facing the global economy today. In the United States, near record low interest rates make it difficult for investors to find investments that provide high levels of income with manageable levels of risk. While the U.S. economy has steadily improved since the financial crisis, a lack of wage growth and slack in the labor market has dampened the improving economic outlook. During the first six months of the year, conflicting economic data often led to increased market uncertainty and speculation over the future direction of interest rates. In Europe, many economies remain mired in a period of high unemployment, low inflation and low growth. Despite ongoing efforts by the European Central Bank to boost business growth and spur lending activity, tight regulatory requirements have resulted in a reduction in the supply of credit, making it difficult for many European businesses to obtain the capital they need to expand and fund their operations. As the financing needs of European businesses grow, many are being forced to find alternative sources of funding. We believe the shifting global financial landscape has created a meaningful investment opportunity for those with the necessary investment expertise, patience and capital. Together with GSO / Blackstone, we at Franklin Square look forward to providing the Fund’s shareholders with greater access to the global opportunity through the Fund’s innovative closed-end fund structure and its strategy focused on event-driven investing.
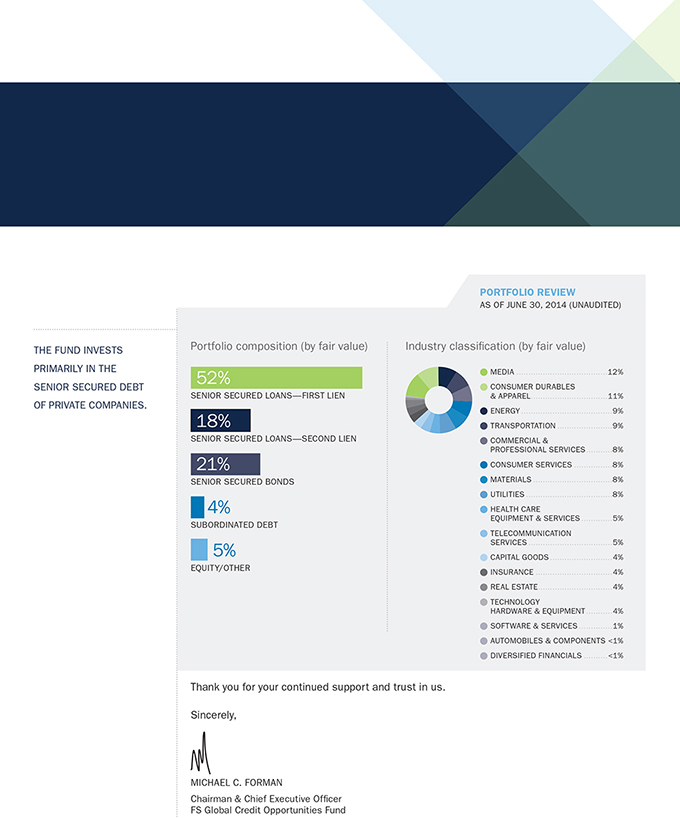
PORTFOLIO REVIEW AS OF JUNE 30, 2014 (UNAUDITED) THE FUND INVESTS PRIMARILY IN THE SENIOR SECURED DEBT OF PRIVATE COMPANIES. Portfolio composition (by fair value) 52% SENIOR SECURED LOANS—FIRST LIEN 18% SENIOR SECURED LOANS—SECOND LIEN 21% SENIOR SECURED BONDS 4% SUBORDINATED DEBT 5% EQUITY/OTHER Industry classification (by fair value) MEDIA 12% CONSUMER DURABLES & APPAREL 11% ENERGY 9% TRANSPORTATION 9% COMMERCIAL & PROFESSIONAL SERVICES 8% CONSUMER SERVICES 8% MATERIALS 8% UTILITIES 8% HEALTH CARE EQUIPMENT & SERVICES 5% TELECOMMUNICATION SERVICES 5% CAPITAL GOODS 4% INSURANCE 4% REAL ESTATE 4% TECHNOLOGY HARDWARE & EQUIPMENT 4% SOFTWARE & SERVICES 1% AUTOMOBILES & COMPONENTS <1% DIVERSIFIED FINANCIALS <1% Thank you for your continued support and trust in us. Sincerely, MICHAEL C. FORMAN Chairman & Chief Executive Officer FS Global Credit Opportunities Fund
FS Global Credit Opportunities Fund OFFICERS AND BOARD OF TRUSTEES 1The sponsor investment shown represents the aggregate investments in FS Global Credit Opportunities Fund—A and FS Global Credit Opportunities Fund—D made by individuals and entities affiliated with Franklin Square and GSO / Blackstone. FS Global Credit Opportunities Fund—A and FS Global Credit Opportunities Fund—D are feeder funds that invest substantially all of the net proceeds from their continuous public offerings in common shares of the Fund. 2Not annualized. The total return is historical and is calculated by determining the percentage change in net asset value for the six months ended June 30, 2014, assuming the reinvestment of all distributions in additional shares of the Fund at the Fund’s net asset value per share as of the share closing date occurring on or immediately following the distribution payment date. 3The Fund’s distributions were funded in significant part by the reimbursement of certain expenses, including through the waiver of investment advisory fees payable by the Fund, that are subject to repayment to the Fund’s affiliate, Franklin Square Holdings, L.P. (“Franklin Square Holdings”), and the Fund’s future distributions may be funded from such waivers and reimbursements. Significant portions of these distributions were not based on the Fund’s investment performance and such waivers and reimbursements by Franklin Square Holdings may not continue in the future. If Franklin Square Holdings had not agreed to reimburse certain of the Fund’s expenses, including through the waiver of certain of its advisory fees, significant portions of these distributions would have come from offering proceeds or borrowings. The repayment of amounts owed to Franklin Square Holdings will reduce the future distributions to which investors would otherwise be entitled. Officers MICHAEL C. FORMAN Chairman & Chief Executive Officer WILLIAM GOEBEL Chief Financial Officer GERALD F. STAHLECKER Executive Vice President ZACHARY KLEHR Executive Vice President STEPHEN S. SYPHERD Vice President, Treasurer and Secretary SALVATORE FAIA Chief Compliance Officer Board of Trustees MICHAEL C. FORMAN Chairman & Chief Executive Officer DAVID J. ADELMAN Vice-Chairman President and Chief Executive Officer, Campus Apartments, Inc. THOMAS J. GRAVINA Trustee Executive Chairman, GPX Enterprises, L.P. WALTER W. BUCKLEY, III Trustee Chairman and Chief Executive Officer, ICG Group, Inc. BARBARA J. FOUSS Trustee Former Director of Strategic Initiatives and Chief Credit Policy Officer, Sun National Bank DAVID L. COHEN Trustee Executive Vice President, Comcast Corporation PHILIP E. HUGHES, JR. Trustee Vice-Chairman of Keystone Industries OLIVER C. MITCHELL, JR. Trustee Attorney and Consultant CHARLES P. PIZZI Trustee Retired President, Director and Chief Executive Officer, Tasty Baking Company
Table of Contents
FS Global Credit Opportunities Fund
Semi-Annual Report for the Six Months Ended June 30, 2014
i
FS Global Credit Opportunities Fund
Unaudited Schedule of Investments
As of June 30, 2014
(in thousands, except share amounts)
| | | | | | | | | | | | | | | | | | | | | | |
Portfolio Company(a) | | Footnotes | | Industry | | Rate(b) | | Floor | | Maturity | | Principal
Amount(c) | | | Amoritzed
Cost | | | Fair
Value(d) | |
Senior Secured Loans—First Lien—53.1% | | | | | | | | | | | | | | | | | | | | | | |
Accellent Inc. | | | | Health Care Equipment & Services | | L+350 | | 1.0% | | 3/12/21 | | $ | 3,041 | | | $ | 3,041 | | | $ | 3,035 | |
American Tire Distributors, Inc. | | | | Automobiles & Components | | L+475 | | 1.0% | | 6/1/18 | | | 644 | | | | 642 | | | | 649 | |
Ascend Learning, LLC | | (e) | | Software & Services | | L+500 | | 1.0% | | 7/31/19 | | | 984 | | | | 979 | | | | 997 | |
Asurion, LLC | | | | Insurance | | L+375 | | 1.3% | | 5/24/19 | | | 2,985 | | | | 2,978 | | | | 3,007 | |
Avaya Inc. | | (e) | | Technology Hardware & Equipment | | L+550 | | 1.0% | | 3/31/18 | | | 5,983 | | | | 5,997 | | | | 5,998 | |
BRG Sports, Inc. | | | | Consumer Durables & Apparel | | L+550 | | 1.0% | | 4/15/21 | | | 1,174 | | | | 1,151 | | | | 1,187 | |
Caesars Entertainment Operating Co., Inc. | | (e) | | Consumer Services | | L+425 | | | | 1/26/18 | | | 3,083 | | | | 2,915 | | | | 2,853 | |
Caesars Entertainment Operating Co., Inc. | | (e) | | Consumer Services | | L+525 | | | | 1/26/18 | | | 46 | | | | 43 | | | | 43 | |
Caesars Entertainment Operating Co., Inc. | | (e) | | Consumer Services | | L+875 | | 1.0% | | 3/1/17 | | | 3,910 | | | | 3,881 | | | | 3,864 | |
Cengage Learning Acquisitions, Inc. | | | | Media | | L+600 | | 1.0% | | 3/31/20 | | | 1,078 | | | | 1,073 | | | | 1,092 | |
Clear Channel Communications, Inc. | | | | Media | | L+675 | | | | 1/30/19 | | | 2,000 | | | | 1,898 | | | | 1,993 | |
Clear Channel Communications, Inc. | | (e) | | Media | | L+750 | | | | 7/30/19 | | | 7,059 | | | | 7,083 | | | | 7,090 | |
Colouroz Investment 2 LLC | | (e) | | Media | | L+375 | | 1.0% | | 5/3/21 | | | 3,226 | | | | 3,194 | | | | 3,241 | |
Drillships Financing Holding Inc. | | | | Energy | | L+500 | | 1.0% | | 3/31/21 | | | 651 | | | | 657 | | | | 662 | |
Empire Generating Co, LLC | | | | Utilities | | L+425 | | 1.0% | | 3/14/21 | | | 3,143 | | | | 3,112 | | | | 3,178 | |
Empire Generating Co, LLC | | | | Utilities | | L+425 | | 1.0% | | 3/14/21 | | | 220 | | | | 218 | | | | 222 | |
Energy Future Intermediate Holding Co., LLC | | | | Utilities | | L+325 | | 1.0% | | 6/19/16 | | | 10,000 | | | | 10,000 | | | | 10,071 | |
EnergySolutions, LLC | | (e) | | Commercial & Professional Services | | L+575 | | 1.0% | | 5/29/20 | | | 7,273 | | | | 7,127 | | | | 7,367 | |
ERC Ireland Holdings Ltd. | | (e) | | Telecommunication Services | | E+450 | | | | 9/30/19 | | € | 1,533 | | | | 1,930 | | | | 2,058 | |
Extreme Reach, Inc. | | | | Media | | L+575 | | 1.0% | | 1/24/20 | | $ | 2,064 | | | | 2,034 | | | | 2,092 | |
Fomento de Construcciones y Contratas, S.A. | | (e) | | Real Estate | | E+300 | | | | 6/30/18 | | € | 253 | | | | 320 | | | | 333 | |
FR Dixie Acquisition Corp. | | | | Energy | | L+475 | | 1.0% | | 12/18/20 | | $ | 2,357 | | | | 2,345 | | | | 2,371 | |
Hudson Products Holdings Inc. | | | | Capital Goods | | L+400 | | 1.0% | | 3/15/19 | | | 4,187 | | | | 4,167 | | | | 4,207 | |
Lineage Logistics, LLC | | | | Transportation | | L+350 | | 1.0% | | 4/7/21 | | | 4,689 | | | | 4,661 | | | | 4,670 | |
Mitel Networks Corp. | | | | Software & Services | | L+425 | | 1.0% | | 1/31/20 | | | 1,513 | | | | 1,506 | | | | 1,529 | |
Mood Media Corp. | | | | Media | | L+600 | | 1.0% | | 5/1/19 | | | 1,090 | | | | 1,079 | | | | 1,093 | |
National Mentor Holdings, Inc. | | | | Health Care Equipment & Services | | L+375 | | 1.0% | | 1/31/21 | | | 1,628 | | | | 1,623 | | | | 1,640 | |
NextGen Finance, LLC | | | | Telecommunication Services | | L+400 | | 1.0% | | 5/28/19 | | | 5,000 | | | | 4,950 | | | | 5,004 | |
Payless ShoeSource, Inc. | | | | Consumer Durables & Apparel | | L+400 | | 1.0% | | 3/11/21 | | | 4,019 | | | | 4,000 | | | | 4,038 | |
Quinn Manufacturing Group HoldCo Ltd. | | (e) | | Materials | | E+677 | | | | 12/2/16 | | € | 717 | | | | 899 | | | | 921 | |
Quinn Manufacturing Group HoldCo Ltd. | | (e) | | Materials | | E+677 | | | | 12/2/16 | | € | 84 | | | | 105 | | | | 108 | |
Quinn Manufacturing Group HoldCo Ltd. | | (e) | | Materials | | 8.6% | | | | 12/2/16 | | $ | 175 | | | | 165 | | | | 166 | |
Vouvray US Finance LLC | | (e) | | Commercial & Professional Services | | L+400 | | 1.0% | | 6/18/21 | | | 1,582 | | | | 1,575 | | | | 1,599 | |
| | | | | | | | | | | | | | | | | | | | | | |
Total Senior Secured Loans—First Lien | | | | | | | | | | | | | | | | | 87,348 | | | | 88,378 | |
| | | | | | | | | | | | | | | | | | | | | | |
See notes to unaudited financial statements.
1
FS Global Credit Opportunities Fund
Unaudited Schedule of Investments (continued)
As of June 30, 2014
(in thousands, except share amounts)
| | | | | | | | | | | | | | | | | | | | | | |
Portfolio Company(a) | | Footnotes | | Industry | | Rate(b) | | Floor | | Maturity | | Principal
Amount(c) | | | Amoritzed
Cost | | | Fair
Value(d) | |
Senior Secured Loans—Second Lien—17.8% | | | | | | | | | | | | | | | | | | | | | | |
Accellent Inc. | | | | Health Care Equipment & Services | | L+650 | | 1.0% | | 3/12/22 | | $ | 2,734 | | | $ | 2,748 | | | $ | 2,720 | |
Asurion, LLC | | | | Insurance | | L+750 | | 1.0% | | 3/3/21 | | | 1,489 | | | | 1,468 | | | | 1,549 | |
BRG Sports, Inc. | | | | Consumer Durables & Apparel | | L+925 | | 1.0% | | 4/15/22 | | | 3,125 | | | | 3,048 | | | | 3,156 | |
Capital Safety North America Holdings Inc. | | | | Capital Goods | | L+550 | | 1.0% | | 3/28/22 | | | 1,333 | | | | 1,332 | | | | 1,342 | |
Colouroz Investment 2 LLC | | (e) | | Media | | L+725 | | 1.0% | | 5/2/22 | | | 3,429 | | | | 3,403 | | | | 3,461 | |
Devix US, Inc. | | (e) | | Health Care Equipment & Services | | L+700 | | 1.0% | | 5/2/22 | | | 636 | | | | 630 | | | | 640 | |
Fomento de Construcciones y Contratas, S.A. | | (e) | | Real Estate | | E+1100 PIK
(1600 Max PIK) | | | | 6/30/18 | | € | 128 | | | | 162 | | | | 168 | |
Fomento de Construcciones y Contratas, S.A. | | (e) | | Real Estate | | E+1100 PIK
(1600 Max PIK) | | | | 6/30/18 | | £ | 25 | | | | 39 | | | | 41 | |
Inmar Acquisition Sub, Inc. | | | | Commercial & Professional Services | | L+700 | | 1.0% | | 1/27/22 | | $ | 2,783 | | | | 2,805 | | | | 2,767 | |
Renaissance Learning, Inc. | | | | Consumer Services | | L+700 | | 1.0% | | 4/11/22 | | | 3,214 | | | | 3,183 | | | | 3,212 | |
Road Infrastructure Investment, LLC | | | | Capital Goods | | L+675 | | 1.0% | | 9/30/21 | | | 1,241 | | | | 1,235 | | | | 1,238 | |
Sedgwick Claims Management Services, Inc. | | | | Insurance | | L+575 | | 1.0% | | 2/28/22 | | | 1,455 | | | | 1,447 | | | | 1,456 | |
Stadium Management Corp. | | | | Consumer Services | | L+825 | | 1.0% | | 2/27/21 | | | 1,000 | | | | 1,000 | | | | 1,018 | |
Templar Energy LLC | | | | Energy | | L+700 | | 1.0% | | 11/25/20 | | | 3,000 | | | | 3,019 | | | | 2,985 | |
Vantage Energy, LLC | | | | Energy | | L+750 | | 1.0% | | 12/20/18 | | | 1,837 | | | | 1,820 | | | | 1,851 | |
Vouvray US Finance LLC | | (e) | | Commercial & Professional Services | | L+750 | | 1.0% | | 12/17/21 | | | 2,000 | | | | 1,980 | | | | 2,008 | |
| | | | | | | | | | | | | | | | | | | | | | |
Total Senior Secured Loans—Second Lien | | | | | | | | | | | | | | | | | 29,319 | | | | 29,612 | |
| | | | | | | | | | | | | | | | | | | | | | |
Senior Secured Bonds—21.7% | | | | | | | | | | | | | | | | | | | | | | |
Caesars Entertainment Operating Co., Inc. | | | | Consumer Services | | 10.0% | | | | 12/15/15 | | | 2,000 | | | | 1,786 | | | | 2,013 | |
Caesars Entertainment Operating Co., Inc. | | | | Consumer Services | | 9.0% | | | | 2/17/20 | | | 13 | | | | 11 | | | | 11 | |
CEVA Group PLC | | (e) | | Transportation | | 9.0% | | | | 9/1/21 | | | 11,000 | | | | 11,335 | | | | 11,359 | |
Momentive Performance Materials Inc. | | | | Materials | | 10.0% | | | | 10/15/20 | | | 1,500 | | | | 1,620 | | | | 1,605 | |
Momentive Performance Materials Inc. | | (f) | | Materials | | 9.0% | | | | 1/15/21 | | | 650 | | | | 579 | | | | 541 | |
Sears Holding Corp. | | (e) | | Consumer Durables & Apparel | | 6.6% | | | | 10/15/18 | | | 11,000 | | | | 10,213 | | | | 10,192 | |
Walter Energy, Inc. | | (e) | | Materials | | 9.5% | | | | 10/15/19 | | | 10,125 | | | | 10,361 | | | | 10,449 | |
| | | | | | | | | | | | | | | | | | | | | | |
Total Senior Secured Bonds | | | | | | | | | | | | | | | | | 35,905 | | | | 36,170 | |
| | | | | | | | | | | | | | | | | | | | | | |
Subordinated Debt—4.2% | | | | | | | | | | | | | | | | | | | | | | |
Arch Coal, Inc. | | (e) | | Energy | | 7.3% | | | | 6/15/21 | | | 64 | | | | 47 | | | | 47 | |
Ocean Rig UDW, Inc. | | (e) | | Energy | | 7.3% | | | | 4/1/19 | | | 6,975 | | | | 6,921 | | | | 6,940 | |
| | | | | | | | | | | | | | | | | | | | | | |
Total Subordinated Debt | | | | | | | | | | | | | | | | | 6,968 | | | | 6,987 | |
| | | | | | | | | | | | | | | | | | | | | | |
See notes to unaudited financial statements.
2
FS Global Credit Opportunities Fund
Unaudited Schedule of Investments (continued)
As of June 30, 2014
(in thousands, except share amounts)
| | | | | | | | | | | | | | | | | | | | |
Portfolio Company(a) | | Footnotes | | Industry | | Rate(b) | | Floor | | Number of
Shares | | | Cost | | | Fair
Value(d) | |
Equity/Other—4.8% | | | | | | | | | | | | | | | | | | | | |
Ally Financial Inc., Series A Preferred Equity | | (f) | | Diversified Financials | | 8.5% | | | | | 1,000 | | | $ | 27 | | | $ | 28 | |
ERC Ireland Holdings Ltd., Common Equity | | (e)(f) | | Telecommunication Services | | | | | | | 6,121 | | | | 1,130 | | | | 1,358 | |
Federal Home Loan Mortgage Corp., Series W Preferred Equity | | (f) | | Real Estate | | 5.7% | | | | | 1,203 | | | | 11 | | | | 11 | |
Federal Home Loan Mortgage Corp., Series Z Preferred Equity | | (e)(f) | | Real Estate | | 8.4% | | | | | 296,926 | | | | 3,129 | | | | 3,239 | |
Federal National Mortgage Association, Series F Preferred Equity | | (f) | | Real Estate | | CMT-16 | | | | | 9,300 | | | | 165 | | | | 164 | |
Federal National Mortgage Association, Series P Preferred Equity | | (f) | | Real Estate | | L+75 | | 3.8% | | | 32,875 | | | | 266 | | | | 286 | |
Federal National Mortgage Association, Series S Preferred Equity | | (e)(f) | | Real Estate | | L+423 | | 3.5% | | | 277,125 | | | | 2,886 | | | | 2,868 | |
Federal National Mortgage Association, Series 2004-1 Preferred Equity | | (f) | | Real Estate | | 5.4% | | | | | 2 | | | | 65 | | | | 68 | |
| | | | | | | | | | | | | | | | | | | | |
Total Equity/Other | | | | | | | | | | | | | | | 7,679 | | | | 8,022 | |
| | | | | | | | | | | | | | | | | | | | |
TOTAL INVESTMENTS—101.6% | | | | | | | | | | | | | | $ | 167,219 | | | | 169,169 | |
| | | | | | | | | | | | | | | | | | | | |
LIABILITIES IN EXCESS OF OTHER ASSETS—(1.6%) | | (g) | | | | | | | | | | | | | | | | | (2,802 | ) |
| | | | | | | | | | | | | | | | | | | | |
NET ASSETS—100.0% | | | | | | | | | | | | | | | | | | $ | 166,367 | |
| | | | | | | | | | | | | | | | | | | | |
Credit Default Swaps on Corporate Issues—Sell Protection
| | | | | | | | | | | | | | | | | | | | | | | | | | | | | | | | | | |
Reference Entity | | Counterparty | | | Implied Credit
Spread at
June 30, 2014(h) | | | Industry | | Fixed Deal
Receive Rate | | | Maturity | | | Notional(i) | | | Market
Value(d) | | | Unamortized
Premiums Paid
(Received) | | | Unrealized
Appreciation
(Depreciation) | |
Caesars Entertainment Operating Co., Inc. | | | JPMorgan Chase Bank, N.A. | | | | 45.1 | % | | Consumer Services | | | 5.0 | % | | | 6/20/15 | | | $ | 4,512 | | | $ | (1,205 | ) | | $ | (1,052 | ) | | $ | (153 | ) |
Caesars Entertainment Operating Co., Inc. | | | JPMorgan Chase Bank, N.A. | | | | 42.9 | % | | Consumer Services | | | 5.0 | % | | | 9/20/15 | | | | 1,500 | | | | (462 | ) | | | (462 | ) | | | — | |
MBIA Insurance Corp. | | | JPMorgan Chase Bank, N.A. | | | | 7.5 | % | | Insurance | | | 5.0 | % | | | 6/20/19 | | | | 7,000 | | | | (659 | ) | | | (661 | ) | | | 2 | |
MBIA Insurance Corp. | | | JPMorgan Chase Bank, N.A. | | | | 7.6 | % | | Insurance | | | 5.0 | % | | | 9/20/19 | | | | 3,000 | | | | (301 | ) | | | (270 | ) | | | (31 | ) |
Norske Skogindustrier ASA | | | JPMorgan Chase Bank, N.A. | | | | 14.4 | % | | Materials | | | 5.0 | % | | | 3/20/16 | | | € | 2,000 | | | | (361 | ) | | | (376 | ) | | | 15 | |
Norske Skogindustrier ASA | | | JPMorgan Chase Bank, N.A. | | | | 15.7 | % | | Materials | | | 5.0 | % | | | 6/20/16 | | | € | 3,000 | | | | (680 | ) | | | (671 | ) | | | (9 | ) |
| (a) | Security may be an obligation of one or more entities affiliated with the named company. |
| (b) | Certain variable rate securities in FS Global Credit Opportunities Fund’s (the “Fund”) portfolio bear interest at a rate determined by a publicly disclosed base rate plus a basis point spread. As of June 30, 2014, the three-month London Interbank Offered Rate (“L”) was 0.23%, the Euro Interbank Offered Rate (“E”) was 0.21% and the two-year Constant Maturity Treasury Rate (“CMT”) was 0.47%. |
| (c) | Denominated in U.S. dollars unless otherwise noted. |
See notes to unaudited financial statements.
3
FS Global Credit Opportunities Fund
Unaudited Schedule of Investments (continued)
As of June 30, 2014
(in thousands, except share amounts)
| (d) | Fair value and market value are determined by FS Global Advisor, LLC, the Fund’s investment adviser. See Note 2 for information on the Fund’s policy regarding valuation of investments, fair value hierarchy levels and other significant accounting policies. |
| (e) | Position or portion thereof unsettled as of June 30, 2014. |
| (f) | Security is non-income producing. |
| (g) | Includes the effect of credit default swap positions. |
| (h) | Implied credit spread, represented in absolute terms, utilized in determining the market value of the credit default swap agreements as of period end serves as an indicator of the current status of the payment/performance risk and represents the likelihood or risk of default for the credit derivative. The implied credit spread of a particular referenced entity reflects the cost of buying/selling protection and may include upfront payments required in connection with the entrance into the agreement. Wider credit spreads generally represent a deterioration of the referenced entity’s credit soundness and a greater likelihood or risk of default or other credit event occurring, as defined under the terms of the applicable agreement. |
| (i) | The maximum potential amount the Fund could be required to pay as a seller of credit protection or receive as a buyer of credit protection if a credit event occurs as defined under the terms of the applicable agreement. |
See notes to unaudited financial statements.
4
FS Global Credit Opportunities Fund
Unaudited Statement of Assets and Liabilities
(in thousands, except share and per share amounts)
| | | | |
| | | June 30,
2014 | |
Assets | | | | |
Investments, at fair value (amortized cost—$167,219) | | $ | 169,169 | |
Cash | | | 20,458 | |
Foreign currency (cost—$506) | | | 479 | |
Cash held by broker(1) | | | 4,247 | |
Collateral held at broker for open swap contracts | | | 11,020 | |
Receivable for investments sold and repaid | | | 17,731 | |
Interest receivable | | | 1,655 | |
Receivable on credit default swaps | | | 35 | |
Unrealized appreciation on credit default swaps | | | 17 | |
Prepaid expenses | | | 59 | |
| | | | |
Total assets | | $ | 224,870 | |
| | | | |
Liabilities | | | | |
Payable for investments purchased | | $ | 53,518 | |
Shareholder distributions payable | | | 232 | |
Management fees payable | | | 723 | |
Administrative services expense payable | | | 42 | |
Accounting and administrative fees payable | | | 16 | |
Professional fees payable | | | 203 | |
Trustees’ fees payable | | | 71 | |
Unamortized swap premiums received | | | 3,492 | |
Unrealized depreciation on credit default swaps | | | 193 | |
Other accrued expenses and liabilities | | | 13 | |
| | | | |
Total liabilities | | $ | 58,503 | |
| | | | |
Net assets | | $ | 166,367 | |
| | | | |
| |
Commitments and contingencies—($1,777)(2) | | | | |
| |
Composition of net assets | | | | |
Common shares, $0.001 par value, unlimited shares authorized, 16,190,247 shares issued and outstanding | | | 16 | |
Capital in excess of par value | | | 164,542 | |
Accumulated undistributed net realized gains on investments, credit default swaps and gain/loss on foreign currency(3) | | | 1,493 | |
Accumulated distributions in excess of net investment income(3) | | | (1,418 | ) |
Net unrealized appreciation (depreciation) on investments, credit default swaps and unrealized gain/loss on foreign currency | | | 1,734 | |
| | | | |
Net assets | | $ | 166,367 | |
| | | | |
Net asset value per common share at period end | | $ | 10.28 | |
| (1) | Represents cash held in a prime brokerage account with JPMorgan Chase Bank, N.A. |
| (2) | See Note 10 for a discussion of the Fund’s commitments and contingencies. |
| (3) | See Note 5 for a discussion of the sources of distributions paid by the Fund. |
See notes to unaudited financial statements.
5
FS Global Credit Opportunities Fund
Unaudited Statement of Operations
(in thousands)
| | | | |
| | | Six Months Ended
June 30, 2014 | |
Investment income | | | | |
Interest income | | $ | 2,053 | |
Dividend income | | | 1 | |
Fee income | | | 498 | |
| | | | |
Total investment income | | | 2,552 | |
| | | | |
Operating expenses | | | | |
Management fees | | | 1,147 | |
Administrative services expenses | | | 79 | |
Accounting and administrative fees | | | 87 | |
Professional fees | | | 180 | |
Trustees’ fees | | | 71 | |
Other general and administrative expenses | | | 99 | |
| | | | |
Total operating expenses | | | 1,663 | |
Less: Expense reimbursement from sponsor(1) | | | (1,296 | ) |
| | | | |
Net operating expenses | | | 367 | |
| | | | |
Net investment income | | | 2,185 | |
| | | | |
Realized and unrealized gain/loss | | | | |
Net realized gain (loss) on investments | | | 505 | |
Net realized gain (loss) on credit default swaps | | | 957 | |
Net realized gain (loss) on foreign currency | | | 31 | |
Net change in unrealized appreciation (depreciation) on investments | | | 1,864 | |
Net change in unrealized appreciation (depreciation) on credit default swaps | | | (176 | ) |
Net change in unrealized gain (loss) on foreign currency | | | (27 | ) |
| | | | |
Total net realized and unrealized gain (loss) on investments | | | 3,154 | |
| | | | |
Net increase (decrease) in net assets resulting from operations | | $ | 5,339 | |
| | | | |
| (1) | See Note 4 for a discussion of reimbursements and other amounts paid to the Fund by its investment adviser and affiliates. |
See notes to unaudited financial statements.
6
FS Global Credit Opportunities Fund
Statements of Changes in Net Assets
(in thousands)
| | | | | | | | |
| | | Six Months Ended
June 30, 2014
(Unaudited) | | | Period from
January 28, 2013
(Inception) to
December 31, 2013 | |
Operations | | | | | | | | |
Net investment income (loss) | | $ | 2,185 | | | $ | (11 | ) |
Net realized gain (loss) on investments, credit default swaps and foreign currency | | | 1,493 | | | | — | |
Net change in unrealized appreciation (depreciation) on investments | | | 1,864 | | | | 86 | |
Net change in unrealized appreciation (depreciation) on credit default swaps | | | (176 | ) | | | — | |
Net change in unrealized gain (loss) on foreign currency | | | (27 | ) | | | (13 | ) |
Net increase from additional support payment from sponsor(1) | | | — | | | | 232 | |
| | | | | | | | |
Net increase (decrease) in net assets resulting from operations | | | 5,339 | | | | 294 | |
| | | | | | | | |
Shareholder distributions(2) | | | | | | | | |
Distributions from net investment income | | | (3,603 | ) | | | (243 | ) |
| | | | | | | | |
Net decrease in net assets resulting from shareholder distributions | | | (3,603 | ) | | | (243 | ) |
| | | | | | | | |
Capital share transactions | | | | | | | | |
Issuance of common shares(3) | | | 115,987 | | | | 48,571 | |
Capital contributions of investment adviser(1) | | | — | | | | 22 | |
| | | | | | | | |
Net increase in net assets resulting from capital share transactions | | | 115,987 | | | | 48,593 | |
| | | | | | | | |
Total increase in net assets | | | 117,723 | | | | 48,644 | |
Net assets at beginning of period | | | 48,644 | | | | — | |
| | | | | | | | |
Net assets at end of period | | $ | 166,367 | | | $ | 48,644 | |
| | | | | | | | |
Accumulated distributions in excess of net investment income(2) | | $ | (1,418 | ) | | $ | — | |
| | | | | | | | |
| (1) | See Note 4 for a discussion of reimbursements and other amounts paid to the Fund by its investment adviser and affiliates. |
| (2) | See Note 5 for a discussion of the sources of distributions paid by the Fund. |
| (3) | See Note 3 for a discussion of transactions with respect to the Fund’s common shares for the six months ended June 30, 2014 and the period from January 28, 2013 (Inception) to December 31, 2013. |
See notes to unaudited financial statements.
7
FS Global Credit Opportunities Fund
Unaudited Statement of Cash Flows
(in thousands)
| | | | |
| | | Six Months Ended
June 30, 2014 | |
Cash flows from operating activities | | | | |
Net increase (decrease) in net assets resulting from operations | | $ | 5,339 | |
Adjustments to reconcile net increase (decrease) in net assets resulting from operations to net cash used in operating activities: | | | | |
Purchases of investments | | | (224,542 | ) |
Proceeds from sales and repayments of investments | | | 76,252 | |
Net realized (gain) loss on investments | | | (505 | ) |
Net change in unrealized (appreciation) depreciation on investments | | | (1,864 | ) |
Net change in unrealized (appreciation) depreciation on swaps | | | 176 | |
Accretion of discount | | | (112 | ) |
(Increase) decrease in cash held by broker | | | (3,247 | ) |
(Increase) decrease in collateral held at broker for open swap contracts | | | (11,020 | ) |
(Increase) decrease in expense reimbursement and additional support payment due from sponsor(1) | | | 459 | |
(Increase) decrease in receivable for investments sold and repaid | | | (17,731 | ) |
(Increase) decrease in interest receivable | | | (1,622 | ) |
(Increase) decrease in receivable on credit default swaps | | | (35 | ) |
(Increase) decrease in prepaid expenses | | | 59 | |
Increase (decrease) in payable for investments purchased | | | 38,685 | |
Increase (decrease) in management fees payable | | | 658 | |
Increase (decrease) in administrative services expense payable | | | 33 | |
Increase (decrease) in accounting and administrative fees payable | | | 11 | |
Increase (decrease) in professional fees payable | | | 69 | |
Increase (decrease) in trustees’ fees payable | | | 71 | |
Increase (decrease) in unamortized swap premiums received | | | 3,492 | |
Increase (decrease) in other accrued expenses and liabilities | | | — | |
| | | | |
Net cash used in operating activities | | | (135,374 | ) |
| | | | |
Cash flows from financing activities | | | | |
Issuance of common shares | | | 115,987 | |
Shareholder distributions | | | (3,614 | ) |
| | | | |
Net cash provided by financing activities | | | 112,373 | |
| | | | |
Total increase (decrease) in cash(2) | | | (23,001 | ) |
Cash at beginning of period | | | 43,938 | |
| | | | |
Cash at end of period(3) | | $ | 20,937 | |
| | | | |
| (1) | See Note 4 for a discussion of reimbursements and other amounts paid to the Fund by its investment adviser and affiliates. |
| (2) | Includes net change in unrealized appreciation (depreciation) on foreign currency of $(27). |
| (3) | Balance includes foreign currency. |
See notes to unaudited financial statements.
8
FS Global Credit Opportunities Fund
Financial Highlights
(in thousands, except share and per share amounts)
| | | | | | | | |
| | | Six Months Ended
June 30, 2014
(Unaudited) | | | Period from
January 28, 2013
(Inception) to
December 31, 2013 | |
Per Share Data:(1) | | | | | | | | |
Net asset value, beginning of period | | $ | 10.02 | | | $ | 10.00 | |
Results of operations | | | | | | | | |
Net investment income (loss)(2)(3) | | | 0.26 | | | | — | |
Net realized and unrealized appreciation (depreciation) on investments, credit default swaps and foreign currency and gain (loss) on foreign currency and additional support payment from sponsor | | | 0.43 | | | | 0.07 | |
| | | | | | | | |
Net increase (decrease) in net assets resulting from operations | | | 0.69 | | | | 0.07 | |
| | | | | | | | |
Shareholder distributions(4) | | | | | | | | |
Distributions from net investment income | | | (0.43 | ) | | | (0.05 | ) |
| | | | | | | | |
Net decrease in net assets resulting from shareholder distributions | | | (0.43 | ) | | | (0.05 | ) |
| | | | | | | | |
Net asset value, end of period | | $ | 10.28 | | | $ | 10.02 | |
| | | | | | | | |
Shares outstanding, end of period | | | 16,190,247 | | | | 4,857,035 | |
| | | | | | | | |
Total return(5)(6) | | | 6.88 | % | | | 0.65 | % |
| | | | | | | | |
Ratios/Supplemental Data: | | | | | | | | |
Net assets, end of period | | $ | 166,367 | | | $ | 48,644 | |
| | | | | | | �� | |
Ratio of net investment income (loss) to average net assets(7)(8) | | | 5.18 | % | | | (0.41 | )% |
| | | | | | | | |
Ratio of total operating expenses to average net assets(7) | | | 3.94 | % | | | 9.36 | % |
Ratio of expense reimbursement from sponsor to average net assets(7) | | | (3.07 | )% | | | (8.53 | )% |
| | | | | | | | |
Ratio of net operating expenses to average net assets(7) | | | 0.87 | % | | | 0.83 | % |
| | | | | | | | |
Portfolio turnover(6) | | | 92.54 | % | | | 0.00 | % |
| | | | | | | | |
| (1) | Per share data may be rounded in order to compute the ending net asset value per share. |
| (2) | The per share data was derived by using the average number of common shares outstanding during the six months ended June 30, 2014 and the period from December 12, 2013 (Commencement of Investment Operations) to December 31, 2013. |
| (3) | Net investment loss for the period from January 28, 2013 (Inception) to December 31, 2013 was less than $0.005 per common share. |
| (4) | The per share data for distributions reflects the actual amount of distributions paid per common share during the applicable period. |
| (5) | The total return for each period presented is historical and is calculated by determining the percentage change in net asset value, assuming the reinvestment of all distributions in additional common shares of the Fund at the Fund’s net asset value per share as of the share closing date occurring on or immediately following the distribution payment date. The historical calculation of total return in the table should not be considered a representation of the Fund’s future total return, which may be greater or less than the return shown in the table due to a number of factors, including the Fund’s ability or inability to make investments that meet its investment criteria, the interest rates payable on the debt securities the Fund acquires, the level of the Fund’s expenses, variations in and the timing of the recognition of realized and unrealized gains or losses, the degree to which the Fund encounters competition in its markets and general economic conditions. As a result of these factors, results for any previous period should not be relied upon as being indicative of performance in future periods. The total return calculations set forth above represent the total return on the Fund’s investment portfolio during the applicable period and are calculated in accordance with U.S. generally accepted accounting principles. These return figures do not represent an actual return to shareholders. |
| (7) | Annualized. Average daily net assets during the applicable period is used for this calculation. |
| (8) | Had the sponsor not reimbursed certain operating expenses, the ratio of net investment income (loss) to average net assets would have been 2.11% and (8.94)% for the six months ended June 30, 2014 and the period from January 28, 2013 (Inception) to December 31, 2013, respectively. |
See notes to unaudited financial statements.
9
FS Global Credit Opportunities Fund
Notes to Unaudited Financial Statements
(in thousands, except share and per share amounts)
Note 1. Principal Business and Organization
FS Global Credit Opportunities Fund, or the Fund, was organized as a Delaware statutory trust on January 28, 2013 and commenced investment operations on December 12, 2013 upon FS Global Credit Opportunities Fund—A, or Fund—A, and FS Global Credit Opportunities Fund—D, or Fund—D, and, together with Fund—A, the Companies, collectively raising aggregate net offering proceeds in excess of $2,500, or the minimum offering requirement, from the sale of common shares in their continuous public offerings to persons who were not affiliated with the Fund, the Companies, the Fund’s investment adviser, FS Global Advisor, LLC, or FS Global Advisor, or the investment sub-adviser to FS Global Advisor, GSO Capital Partners LP. FS Global Advisor is a private investment firm that is registered as an investment adviser under the Investment Advisers Act of 1940, as amended, and an affiliate of the Fund’s sponsor, Franklin Square Holdings, L.P., or Franklin Square Holdings. Prior to satisfaction of the minimum offering requirement, the Fund had no operations except for matters relating to its organization. As of June 30, 2014, approximately 83% and 17% of the Fund’s outstanding common shares of beneficial interest, par value $0.001 per share, or its common shares, were held by Fund—A and Fund—D, respectively.
The Fund is a non-diversified, closed-end management investment company registered under the Investment Company Act of 1940, as amended, or the 1940 Act, that intends to elect to be treated for federal income tax purposes, and intends to qualify annually thereafter, as a regulated investment company, or RIC, under Subchapter M of the Internal Revenue Code of 1986, as amended, or the Code.
The Fund’s primary investment objective is to generate an attractive total return consisting of a high level of current income and capital appreciation, with a secondary objective of capital preservation.
Note 2. Summary of Significant Accounting Policies
Basis of Presentation: The accompanying unaudited financial statements of the Fund have been prepared in accordance with U.S. generally accepted accounting principles, or GAAP, for interim financial information. Accordingly, they do not include all of the information and footnotes required by GAAP for complete financial statements. In the opinion of management, all adjustments (consisting of normal recurring accruals) considered necessary for a fair presentation have been included. For a more complete discussion of significant accounting policies and certain other information, the Fund’s unaudited financial statements should be read in conjunction with its audited financial statements as of and for the period from January 28, 2013 (Inception) to December 31, 2013 included in the Fund’s certified shareholder report on Form N-CSR. Operating results for the six months ended June 30, 2014 are not necessarily indicative of the results that may be expected for the year ending December 31, 2014. The Fund has evaluated the impact of subsequent events through the date the financial statements were issued and filed with the Securities and Exchange Commission, or the SEC.
Use of Estimates: The preparation of the Fund’s unaudited financial statements in conformity with GAAP requires management to make estimates and assumptions that affect the reported amounts of assets and liabilities, and disclosure of contingent assets and liabilities, at the date of the financial statements and the reported amounts of revenues and expenses during the reporting period. Actual results could differ from those estimates. Many of the amounts have been rounded and all amounts are in thousands, except share and per share information.
Cash and Cash Equivalents: The Fund considers all highly liquid investments with original maturities of three months or less to be cash equivalents. The Fund’s cash and cash equivalents are maintained with high credit quality financial institutions.
10
FS Global Credit Opportunities Fund
Notes to Unaudited Financial Statements (continued)
(in thousands, except share and per share amounts)
Note 2. Summary of Significant Accounting Policies (continued)
Valuation of Portfolio Investments: The Fund determines the fair value of its investment portfolio each day that the New York Stock Exchange is open for business as of the close of the regular trading session. The Fund calculates the net asset value, or NAV, of its common shares by subtracting liabilities (including accrued expenses and distributions) from the total assets of the Fund (the value of securities, plus cash or other assets, including interest and distributions accrued but not yet received) and dividing the result by the total number of its outstanding common shares. The Fund’s assets and liabilities are valued in accordance with the principles set forth below.
FS Global Advisor values the Fund’s assets in good faith pursuant to the Fund’s valuation policy and consistently applied valuation process, which was developed by the Fund’s valuation committee and approved by the Fund’s board of trustees, or the Board. Portfolio securities and other assets for which market quotes are readily available are valued at market value. In circumstances where market quotes are not readily available, the Board has adopted methods for determining the fair value of such securities and other assets, and has delegated the responsibility for applying the valuation methods to FS Global Advisor. On a quarterly basis, the Board reviews the valuation determinations made with respect to the Fund’s investments during the preceding quarter and evaluates whether such determinations were made in a manner consistent with the Fund’s valuation process.
Accounting Standards Codification Topic 820, Fair Value Measurements and Disclosure, or ASC Topic 820, issued by the Financial Accounting Standards Board, clarifies the definition of fair value and requires companies to expand their disclosure about the use of fair value to measure assets and liabilities in interim and annual periods subsequent to initial recognition. ASC Topic 820 defines fair value as the price that would be received from the sale of an asset or paid to transfer a liability in an orderly transaction between market participants at the measurement date. ASC Topic 820 also establishes a three-tier fair value hierarchy, which prioritizes the inputs used in measuring fair value. These tiers include: Level 1, defined as observable inputs such as quoted prices in active markets; Level 2, which includes inputs such as quoted prices for similar securities in active markets and quoted prices for identical securities where there is little or no activity in the market; and Level 3, defined as unobservable inputs for which little or no market data exists, therefore requiring an entity to develop its own assumptions.
When determining the fair value of an asset, FS Global Advisor seeks to determine the price that would be received from the sale of the asset in an orderly transaction between market participants at the measurement date, in accordance with ASC Topic 820. Fair value determinations are based upon all available inputs that FS Global Advisor deems relevant, which may include indicative dealer quotes, values of like securities, recent portfolio company financial statements and forecasts, and valuations prepared by third-party valuation services. However, determination of fair value involves subjective judgments and estimates. Accordingly, the notes to the Fund’s unaudited financial statements refer to the uncertainty with respect to the possible effect of such valuations and any change in such valuations on the Fund’s unaudited financial statements.
The Fund expects that its portfolio will primarily consist of securities listed or traded on a recognized securities exchange or automated quotation system, or exchange-traded securities, or securities traded on a privately negotiated over-the-counter secondary market for institutional investors for which indicative dealer quotes are available, or OTC securities.
11
FS Global Credit Opportunities Fund
Notes to Unaudited Financial Statements (continued)
(in thousands, except share and per share amounts)
Note 2. Summary of Significant Accounting Policies (continued)
For purposes of calculating NAV, FS Global Advisor uses the following valuation methods:
| | • | | The market value of each exchange-traded security is the last reported sale price at the relevant valuation date on the composite tape or on the principal exchange on which such security is traded. |
| | • | | If no sale is reported for an exchange-traded security on the valuation date or if a security is an OTC security, the Fund values such securities using quotations obtained from an independent third-party pricing service, which provides prevailing bid and ask prices that are screened for validity by the service from dealers on the valuation date. For investments for which a third-party pricing service is unable to obtain quoted prices, the Fund will obtain bid and ask prices directly from dealers who make a market in such securities. In all such cases, securities are valued at the mid-point of the average bid and ask prices obtained from such sources. |
| | • | | To the extent that the Fund holds investments for which no active secondary market exists and, therefore, no bid and ask prices can be readily obtained, the Fund will value such investments at fair value as determined in good faith by FS Global Advisor in accordance with the Fund’s valuation policy and pursuant to authority delegated by the Board as described below. In making such determination, FS Global Advisor may rely upon valuations obtained from an independent valuation firm. |
In making its determination of fair value, FS Global Advisor may use independent third-party pricing or valuation services; provided that FS Global Advisor shall not be required to determine fair value in accordance with the valuation provided by any single source, and FS Global Advisor shall retain the discretion to use any relevant data, including information obtained from any independent third-party valuation or pricing service, that FS Global Advisor deems to be reliable in determining fair value under the circumstances.
Below is a description of factors that may be considered when valuing securities for which no active secondary market exists.
Valuation of fixed income investments, such as loans and debt securities, depends upon a number of factors, including prevailing interest rates for like securities, expected volatility in future interest rates, call features, put features and other relevant terms of the debt. For investments without readily available market prices, these factors may be incorporated into discounted cash flow models to arrive at fair value. Other factors that may be considered include the borrower’s ability to adequately service its debt, the fair market value of the portfolio company in relation to the face amount of its outstanding debt and the quality of collateral securing its debt investments.
For convertible debt securities, fair value will generally approximate the fair value of the debt plus the fair value of an option to purchase the underlying security (the security into which the debt may convert) at the conversion price. To value such an option, a standard option pricing model may be used.
For equity interests, various factors may be considered in determining fair value, including multiples of earnings before interest, taxes, depreciation and amortization, or EBITDA, cash flows, net income, revenues or, in limited instances, book value or liquidation value. All of these factors may be subject to adjustments based upon the particular circumstances of a portfolio company or the Fund’s actual investment position. For example, adjustments to EBITDA may take into account compensation to previous owners or an acquisition, recapitalization, restructuring or other related items.
12
FS Global Credit Opportunities Fund
Notes to Unaudited Financial Statements (continued)
(in thousands, except share and per share amounts)
Note 2. Summary of Significant Accounting Policies (continued)
Other factors that may be considered in valuing securities include private merger and acquisition statistics, public trading multiples discounted for illiquidity and other factors, valuations implied by third-party investments in the portfolio companies, the acquisition price of such investment or industry practices in determining fair value. FS Global Advisor may also consider the size and scope of a portfolio company and its specific strengths and weaknesses, and may apply discounts or premiums, where and as appropriate, due to the higher (or lower) financial risk and/or the size of the portfolio company relative to comparable firms, as well as such other factors as FS Global Advisor, in consultation with any third-party valuation or pricing service, if applicable, may consider relevant in assessing fair value.
If the Fund receives warrants or other equity securities at nominal or no additional cost in connection with an investment in a debt security, the cost basis in the investment will be allocated between the debt securities and any such warrants or other equity securities received at the time of origination. Such warrants or other equity securities will subsequently be valued at fair value.
Portfolio securities that carry certain restrictions on sale will typically be valued at a discount from the public market value of the security, where applicable.
If events materially affecting the price of foreign portfolio securities occur between the time when their price was last determined on such foreign securities exchange or market and the time when the Fund’s NAV was last calculated (for example, movements in certain U.S. securities indices which demonstrate strong correlation to movements in certain foreign securities markets), such securities may be valued at their fair value as determined in good faith in accordance with procedures established by the Board. For purposes of calculating NAV, all assets and liabilities initially expressed in foreign currencies will be converted into U.S. dollars at prevailing exchange rates as may be determined in good faith by FS Global Advisor, under the supervision of the Board.
Swaps typically will be valued using valuations provided by a third-party pricing service. Such pricing service valuations generally will be based on the present value of fixed and projected floating rate cash flows over the term of the swap contract and, in the case of credit default swaps, generally will be based on credit spread quotations obtained from broker-dealers and expected default recovery rates determined by the third-party pricing service using proprietary models. Future cash flows will be discounted to their present value using swap rates provided by electronic data services or by broker-dealers.
Revenue Recognition: Security transactions are accounted for on their trade date. The Fund records interest income on an accrual basis to the extent that it expects to collect such amounts. The Fund records dividend income on the ex-dividend date. The Fund does not accrue as a receivable interest or dividends on loans and securities if there is reason to doubt the collectability of such income. Loan origination fees, original issue discount and market discount are capitalized and such amounts are amortized as interest income over the respective term of the loan or security. Upon the prepayment of a loan or security, any unamortized loan origination fees and original issuance discount are recorded as interest income. Upfront structuring fees are recorded as fee income when earned. The Fund records prepayment premiums on loans and securities as fee income when it receives such amounts.
13
FS Global Credit Opportunities Fund
Notes to Unaudited Financial Statements (continued)
(in thousands, except share and per share amounts)
Note 2. Summary of Significant Accounting Policies (continued)
Net Realized Gains or Losses, Net Change in Unrealized Appreciation or Depreciation and Net Change in Unrealized Gains or Losses on Foreign Currency: Gains or losses on the sale of investments are calculated by using the specific identification method. The Fund measures realized gains or losses by the difference between the net proceeds from the repayment or sale and the amortized cost basis of the investment, without regard to unrealized appreciation or depreciation previously recognized. Net change in unrealized appreciation or depreciation reflects the change in portfolio investment values during the reporting period, including any reversal of previously recorded unrealized gains or losses, when gains or losses are realized, and the respective unrealized gain or loss on foreign currency for any foreign denominated investments. Net change in unrealized gains or losses on foreign currency reflects the change in the value of receivables or accruals during the reporting period due to the impact of foreign currency fluctuations.
Income Taxes: The Fund intends to elect to be treated for federal income tax purposes, and intends to qualify annually thereafter, as a RIC under Subchapter M of the Code. To qualify for and maintain RIC tax treatment, the Fund must, among other things, meet certain source-of-income and asset diversification requirements and distribute to its shareholders, for each taxable year, at least 90% of its “investment company taxable income,” which is generally the Fund’s net ordinary income plus the excess, if any, of realized net short-term capital gains over realized net long-term capital losses. As a RIC, the Fund will not have to pay corporate-level federal income taxes on any income that it distributes to its shareholders. The Fund intends to make distributions in an amount sufficient to maintain its RIC status each year and to avoid any federal income taxes on income so distributed. The Fund will also be subject to nondeductible federal excise taxes if it does not distribute at least 98% of net ordinary income, 98.2% of capital gain net income, if any, and any recognized and undistributed income from prior years for which it paid no federal income taxes.
Uncertainty in Income Taxes: The Fund evaluates its tax positions to determine if the tax positions taken meet the minimum recognition threshold in connection with accounting for uncertainties in income tax positions taken or expected to be taken for the purposes of measuring and recognizing tax benefits or liabilities in the Fund’s financial statements. Recognition of a tax benefit or liability with respect to an uncertain tax position is required only when the position is “more likely than not” to be sustained assuming examination by taxing authorities. The Fund recognizes interest and penalties, if any, related to unrecognized tax liabilities as income tax expense on its Unaudited Statement of Operations. During the six months ended June 30, 2014, the Fund did not incur any interest or penalties.
Credit Default Swaps: When the Fund is the buyer of a credit default swap contract, the Fund is entitled to receive the par (or other agreed-upon) value of a referenced debt obligation (or basket of debt obligations) from the counterparty to the contract if a credit event by a third party, such as a U.S. or foreign corporate issuer or sovereign issuer, on the debt obligation occurs. In return, the Fund pays the counterparty a periodic stream of payments over the term of the contract provided that no credit event has occurred. If no credit event occurs, the Fund would have spent the stream of payments and received no proceeds from the contract. When the Fund is the seller of a credit default swap contract, it receives the stream of payments, but is obligated to pay to the buyer of the protection an amount up to the notional amount of the swap and in certain instances take delivery of securities of the reference entity upon the occurrence of a credit event, as defined under the terms of that particular swap agreement. Credit events are contract specific but may include bankruptcy, failure to pay principal or interest, restructuring, obligation acceleration and repudiation or moratorium. If the Fund is a seller of protection and a credit event occurs, the maximum potential amount of future payments that the Fund could be required to make would be an amount equal to the notional amount of the agreement. This potential amount would be partially offset by any recovery value of the respective referenced obligation, or net amount received
14
FS Global Credit Opportunities Fund
Notes to Unaudited Financial Statements (continued)
(in thousands, except share and per share amounts)
Note 2. Summary of Significant Accounting Policies (continued)
from the settlement of a buy protection credit default swap agreement entered into by the Fund for the same referenced obligation. As the seller of a credit default swap contract, the Fund may create economic leverage because, in addition to its total net assets, the Fund is subject to investment exposure on the notional amount of the swap. The interest fee paid or received on the swap contract, which is based on a specified interest rate on a fixed notional amount, is accrued daily and is recorded as realized loss or gain. The Fund records an increase or decrease to unrealized appreciation (depreciation) on credit default swaps in an amount equal to the change in daily valuation. Upfront payments or receipts, if any, are recorded as unamortized swap premiums paid or received, respectively, and are amortized over the life of the swap contract as realized losses or gains. For financial reporting purposes, unamortized upfront payments, if any, are netted with unrealized appreciation (depreciation) on credit default swaps to determine the market value of swaps as presented in Note 6 and Note 8. The Fund will segregate assets in the form of cash and/or liquid securities in an amount equal to any unrealized depreciation on the credit default swaps of which it is the buyer, marked-to-market on a daily basis. The Fund segregates assets in the form of cash and/or liquid securities in an amount equal to the notional amount of the credit default swaps of which it is the seller. These transactions involve certain risks, including the risk that the seller may be unable to fulfill the transaction.
Distributions: Distributions to the Fund’s shareholders are recorded as of the record date. Subject to the discretion of the Board and applicable legal restrictions, the Fund intends to authorize and declare ordinary cash distributions on a weekly basis and to pay such distributions on a monthly basis. Net realized capital gains, if any, will be distributed or deemed distributed at least annually.
Note 3. Share Transactions
Below is a summary of transactions with respect to the Fund’s common shares during the six months ended June 30, 2014 and the period from January 28, 2013 (Inception) to December 31, 2013:
| | | | | | | | | | | | | | | | |
| | | Six Months Ended
June 30, 2014
(Unaudited) | | | Period from
January 28, 2013
(Inception) to
December 31, 2013 | |
| | | Shares | | | Amount | | | Shares | | | Amount | |
Proceeds from Issuance of Common Shares | | | 11,333,212 | | | $ | 115,987 | | | | 4,857,035 | | | $ | 48,571 | |
Common shares of the Fund are issued solely to Fund—A and Fund—D in private placement transactions that do not involve any “public offering” within the meaning of Section 4(a)(2) of, and/or Regulation D under, the Securities Act of 1933, as amended. During the six months ended June 30, 2014, the Fund issued 9,292,929 common shares to Fund—A and 2,040,283 common shares to Fund—D for proceeds of $95,192 and $20,795, respectively.
The Fund intends to repurchase common shares held by Fund—A and Fund—D to the extent necessary to accommodate repurchase requests under each Company’s share repurchase program. During the six months ended June 30, 2014, the Fund did not repurchase any of its common shares in connection with the Companies’ share repurchase programs.
15
FS Global Credit Opportunities Fund
Notes to Unaudited Financial Statements (continued)
(in thousands, except share and per share amounts)
Note 4. Related Party Transactions
Compensation of the Investment Adviser and its Affiliates
Pursuant to the amended and restated investment advisory agreement, dated as of October 9, 2013, by and between the Fund and FS Global Advisor, or the investment advisory agreement, FS Global Advisor is entitled to (a) an annual management fee of 2.0% of the average daily value of the Fund’s gross assets and (b) an incentive fee based on the Fund’s performance. The Fund commenced accruing fees under the investment advisory agreement on December 12, 2013, upon commencement of the Fund’s investment operations. Management fees are calculated and payable quarterly in arrears.
The incentive fee is calculated and payable quarterly in arrears based upon the Fund’s “pre-incentive fee net investment income” for the immediately preceding quarter, and is subject to a hurdle rate, expressed as a rate of return on the Fund’s “adjusted capital,” equal to 2.25% per quarter (or an annualized hurdle rate of 9.00%), subject to a “catch-up” feature. For this purpose, “pre-incentive fee net investment income” means interest income, dividend income and any other income accrued during the calendar quarter, minus the Fund’s operating expenses for the quarter (including the management fee, expenses reimbursed to FS Global Advisor under the administration agreement, dated as of July 15, 2013, by and between the Fund and FS Global Advisor, or the administration agreement, and any interest expense and distributions paid on any issued and outstanding preferred shares, but excluding the incentive fee). Pre-incentive fee net investment income includes, in the case of investments with a deferred interest feature (such as original issue discount, debt instruments with paid-in-kind interest and zero coupon securities), accrued income that the Fund has not yet received in cash. Pre-incentive fee net investment income does not include any realized capital gains, realized capital losses or unrealized capital appreciation or depreciation. “Adjusted capital” means the cumulative gross proceeds received by the Fund from the issuance of common shares (including common shares issued in respect of reinvested distributions), reduced by amounts paid in connection with repurchases of common shares to fulfill the Fund’s obligations under the Companies’ share repurchase programs.
The calculation of the incentive fee for each quarter is as follows:
| | • | | No incentive fee is payable in any calendar quarter in which the Fund’s pre-incentive fee net investment income does not exceed the quarterly hurdle rate of 2.25%; |
| | • | | 100% of the Fund’s pre-incentive fee net investment income, if any, that exceeds the hurdle rate but is less than or equal to 2.8125% in any calendar quarter (11.25% annualized) is payable to FS Global Advisor. This portion of the Fund’s pre-incentive fee net investment income which exceeds the hurdle rate but is less than or equal to 2.8125% is referred to as the “catch-up.” The “catch-up” provision is intended to provide FS Global Advisor with an incentive fee of 20.0% on all of the Fund’s pre-incentive fee net investment income when the Fund’s pre-incentive fee net investment income reaches 2.8125% in any calendar quarter; and |
| | • | | 20.0% of the amount of the Fund’s pre-incentive fee net investment income, if any, that exceeds 2.8125% in any calendar quarter (11.25% annualized) is payable to FS Global Advisor once the hurdle rate is reached and the catch-up is achieved (20.0% of all the Fund’s pre-incentive fee net investment income thereafter is allocated to FS Global Advisor). |
Under the administration agreement, the Fund reimburses FS Global Advisor for its actual costs incurred in providing administrative services to the Fund, including general ledger accounting, fund accounting, legal services, investor relations and other administrative services. FS Global Advisor is required to allocate the cost of
16
FS Global Credit Opportunities Fund
Notes to Unaudited Financial Statements (continued)
(in thousands, except share and per share amounts)
Note 4. Related Party Transactions (continued)
these services to the Fund based on factors such as assets, revenues and/or time allocations. At least annually, the Board will review the amount of the administrative services expenses reimbursable to FS Global Advisor to determine whether such amount is reasonable in relation to the services provided. In making this determination, the Board will, among other things, compare the total amount paid to FS Global Advisor for such services as a percentage of the Fund’s net assets to the same ratio as reported by other comparable investment companies. The Fund will not reimburse FS Global Advisor for any services for which it receives a separate fee or for any administrative expenses allocated to a controlling person of FS Global Advisor.
Franklin Square Holdings funded organization costs in the amount of $22 for the period from January 28, 2013 (Inception) to December 31, 2013. These costs were recorded by the Fund as a contribution to capital. The organization costs were charged to expense as incurred by the Fund. Under the terms of the administration agreement, upon satisfaction of the minimum offering requirement, FS Global Advisor became entitled to receive 1.5% of offering proceeds from the issuance of the Fund’s common shares until all organization and offering costs funded by FS Global Advisor and its affiliates (including Franklin Square Holdings) have been recovered. Any such reimbursements will be recorded by the Fund as a reduction of capital. FS Global Advisor has agreed to waive reimbursement of 1.5% of the net proceeds raised through June 30, 2014. As such, no liability is reflected for such reimbursement on the Fund’s financial statements. However, if FS Global Advisor ceases to waive reimbursement of organization and offering costs in the future, FS Global Advisor will thereafter be entitled to reimbursement of up to 1.5% of offering proceeds from the issuance of the Fund’s common shares until all organization and offering costs funded by FS Global Advisor and its affiliates (including Franklin Square Holdings) since the Fund’s inception have been recovered.
The following table describes the fees and expenses accrued under the investment advisory agreement and the administration agreement during the six months ended June 30, 2014:
| | | | | | | | |
Related Party | | Source Agreement | | Description | | Six Months Ended
June 30, 2014 | |
| | | |
FS Global Advisor | | Investment Advisory Agreement | | Management Fee(1) | | $ | 1,147 | |
| | | |
FS Global Advisor | | Investment Advisory Agreement | | Incentive Fee | | $ | — | |
| | | |
FS Global Advisor | | Administration Agreement | | Administrative Services Expenses(1) | | $ | 79 | |
| (1) | During the six months ended June 30, 2014, $1,147 in management fees and $79 in administrative services expenses were accrued and have been or may in the future be applied to offset the liability of Franklin Square Holdings under the expense reimbursement agreement (see “—Expense Reimbursement Agreement and Additional Support Payments”). |
Capital Contribution by FS Global Advisor
In March 2013, Michael C. Forman and David J. Adelman, the principals of FS Global Advisor, each contributed approximately $100 to purchase 5,000 common shares of beneficial interest of Fund—A and 5,000 common shares of beneficial interest of Fund—D, in each case at a price of $10.00 per share. The Companies, in turn, each purchased 10,000 common shares of the Fund at $10.00 per share. The principals will not tender for repurchase the common shares of the Companies held by them as long as FS Global Advisor remains the Fund’s investment adviser.
17
FS Global Credit Opportunities Fund
Notes to Unaudited Financial Statements (continued)
(in thousands, except share and per share amounts)
Note 4. Related Party Transactions (continued)
Potential Conflicts of Interest
FS Global Advisor’s senior management team is comprised of substantially the same personnel as the senior management teams of the investment advisers to Franklin Square Holdings’ other sponsored investment funds, including FB Income Advisor, LLC, the investment adviser to FS Investment Corporation, FS Investment Advisor, LLC, the investment adviser to FS Energy and Power Fund, FSIC II Advisor, LLC, the investment adviser to FS Investment Corporation II, and FSIC III Advisor, LLC, the investment adviser to FS Investment Corporation III. As a result, such members provide investment advisory services to the Fund, FS Investment Corporation, FS Energy and Power Fund, FS Investment Corporation II and FS Investment Corporation III. While none of FS Global Advisor, FB Income Advisor, LLC, FS Investment Advisor, LLC, FSIC II Advisor, LLC or FSIC III Advisor, LLC is currently making private corporate debt investments for clients other than the Fund, FS Investment Corporation, FS Energy and Power Fund, FS Investment Corporation II and FS Investment Corporation III, respectively, any such entity may do so in the future. In the event that FS Global Advisor undertakes to provide investment advisory services to other clients in the future, it intends to allocate investment opportunities in a fair and equitable manner consistent with the Fund’s investment objectives and strategies, so that the Fund will not be disadvantaged in relation to any other client of FS Global Advisor or its management team. In addition, even in the absence of FS Global Advisor retaining additional clients, it is possible that some investment opportunities may be provided to FS Investment Corporation, FS Energy and Power Fund, FS Investment Corporation II and/or FS Investment Corporation III, rather than to the Fund.
Expense Reimbursement Agreement and Additional Support Payments
Pursuant to an expense support and conditional reimbursement agreement, dated as of August 20, 2013, by and between the Fund and Franklin Square Holdings, or the expense reimbursement agreement, Franklin Square Holdings has agreed to reimburse the Fund for expenses to ensure that the Fund bears a reasonable level of expenses in relation to its income. The purpose of this arrangement is to ensure that no portion of any ordinary cash distributions made by the Fund will be paid from offering proceeds or borrowings. However, because certain investments the Fund may make, including preferred and common equity investments, may generate dividends and other distributions to the Fund that are treated for tax purposes as a return of capital, a portion of the Fund’s ordinary cash distributions may also be deemed to constitute a return of capital for tax purposes to the extent that the Fund may use such dividends or other distribution proceeds as a source of distributions. Under those circumstances, Franklin Square Holdings will not reimburse the Fund for the portion of the Fund’s ordinary cash distributions that represent a return of capital for tax purposes, as the purpose of the expense reimbursement arrangement is not to prevent tax-advantaged distributions.
Under the expense reimbursement agreement, Franklin Square Holdings will reimburse the Fund quarterly in an amount equal to the difference between the cumulative ordinary cash distributions paid to the Fund’s shareholders in such quarter, less the sum of the Fund’s net investment income, net short-term capital gains and dividends and other distributions paid to the Fund on account of investments in portfolio companies (to the extent such amounts are not included in net investment income or net short-term capital gains) in such quarter.
Pursuant to the expense reimbursement agreement, the Fund has a conditional obligation to reimburse Franklin Square Holdings for any amounts funded by Franklin Square Holdings under this arrangement if (and only to the extent that), during any fiscal quarter occurring within three years of the date on which Franklin Square Holdings funded such amount, the sum of the Fund’s net investment income, net short-term capital gains and the amount of any dividends and other distributions paid to the Fund on account of investments in portfolio
18
FS Global Credit Opportunities Fund
Notes to Unaudited Financial Statements (continued)
(in thousands, except share and per share amounts)
Note 4. Related Party Transactions (continued)
companies (to the extent not included in net investment income or net short-term capital gains) exceeds the ordinary cash distributions paid by the Fund to shareholders in such quarter; provided, however, that (i) the Fund will only reimburse Franklin Square Holdings for expense support payments made by Franklin Square Holdings to the extent that the payment of such reimbursement (together with any other reimbursement paid during such fiscal year) does not cause “other operating expenses” (as defined below) (on an annualized basis and net of any expense support payments received by the Fund during such fiscal year) to exceed the lesser of (A) 1.75% of the Fund’s average net assets attributable to its common shares for the fiscal year-to-date period after taking such expense reimbursement payments into account and (B) the percentage of the Fund’s average net assets attributable to its common shares represented by “other operating expenses” during the fiscal year in which such expense support payment from Franklin Square Holdings was made (provided, however, that this clause (B) shall not apply to any reimbursement payment which relates to an expense support payment from Franklin Square Holdings made during the same fiscal year) and (ii) the Fund will not reimburse Franklin Square Holdings for expense support payments made by Franklin Square Holdings if the annualized rate of distributions per common share declared by the Fund is less than the annualized rate of distributions per common share declared by the Fund at the time Franklin Square Holdings made the expense support payment to which such reimbursement relates. “Other operating expenses” means the Fund’s total operating expenses, excluding the management fee, the incentive fee, organization and offering expenses, financing fees and costs, interest expense and extraordinary expenses. “Operating expenses” means all operating costs and expenses incurred, as determined in accordance with GAAP for investment companies.
The Fund or Franklin Square Holdings may terminate the expense reimbursement agreement at any time. Franklin Square Holdings has indicated that it expects to continue such reimbursements until it deems that the Fund has achieved economies of scale sufficient to ensure that the Fund bears a reasonable level of expenses in relation to its income.
The specific amount of expenses reimbursed by Franklin Square Holdings pursuant to the expense reimbursement agreement, if any, will be determined at the end of each fiscal quarter. Upon termination of the expense reimbursement agreement by Franklin Square Holdings, Franklin Square Holdings will be required to fund any amounts accrued thereunder as of the date of termination. Similarly, the conditional obligation of the Fund to reimburse Franklin Square Holdings pursuant to the terms of the expense reimbursement agreement shall survive the termination of such agreement by either party.
The following table reflects the expense reimbursement and additional support payments made by Franklin Square Holdings to the Fund as of June 30, 2014 that may be subject to reimbursement to Franklin Square Holdings:
| | | | | | | | | | | | | | |
Quarter Ended | | Amount of Expense
Reimbursement and
Additional Support Payment | | | Annualized “Other Operating
Expenses” Ratio as of the Date of
Support Payment | | | Annualized Rate
of Distributions
Per Share(1) | | | Reimbursement
Eligibility
Expiration |
December 31, 2013 | | $ | 459 | | | | 6.09 | % | | | 8.68 | % | | December 31, 2016 |
March 31, 2014 | | $ | 1,296 | | | | 1.35 | % | | | 8.55 | % | | March 31, 2017 |
June 30, 2014 | | | — | | | | N/A | | | | N/A | | | N/A |
| (1) | The annualized rate of distributions per share is expressed as a percentage equal to the projected annualized distribution amount as of the end of the applicable quarter (which is calculated by annualizing the regular weekly cash distribution per share as of such date without compounding), divided by the Fund’s NAV per share as of such date. |
19
FS Global Credit Opportunities Fund
Notes to Unaudited Financial Statements (continued)
(in thousands, except share and per share amounts)
Note 4. Related Party Transactions (continued)
Franklin Square Holdings is controlled by the Fund’s chairman, president and chief executive officer, Michael C. Forman, and the Fund’s vice-chairman, David J. Adelman. There can be no assurance that the expense reimbursement agreement will remain in effect or that Franklin Square Holdings will reimburse any portion of the Fund’s expenses in future years.
FS Benefit Trust
On May 30, 2013, FS Benefit Trust was formed as a Delaware statutory trust for the purpose of awarding equity incentive compensation to employees of Franklin Square Holdings and its affiliates. In connection with Fund—A’s weekly closing occurring on June 25, 2014, FS Benefit Trust purchased approximately $218 of Fund—A’s common shares at a purchase price of approximately $10.30 per share, which represents Fund—A’s public offering price as of such date, net of selling commissions and dealer manager fees. The Fund issued 21,185 common shares to Fund—A in respect of the common shares of Fund—A purchased by FS Benefit Trust.
Note 5. Distributions
The following table reflects the cash distributions per common share that the Fund has declared and paid on its common shares during the six months ended June 30, 2014:
| | | | | | | | |
| | | Distribution | |
For the Six Months Ended | | Per Share | | | Amount | |
June 30, 2014 | | $ | 0.4324 | | | $ | 3,603 | |
On June 11, 2014, the Board declared regular weekly cash distributions for July 2014 through September 2014. The regular weekly cash distributions, each in the amount of $0.016722 per common share, have been or will be paid monthly to shareholders of record as of weekly record dates previously determined by the Board. The timing and amount of any future distributions to shareholders are subject to applicable legal restrictions and the sole discretion of the Board.
Each of the Companies has adopted an “opt in” distribution reinvestment plan for its shareholders pursuant to which shareholders of each Company can elect to receive their cash distributions in additional common shares of such Company. To the extent that a Company’s shareholders reinvest their cash distributions, such Company will use the proceeds to purchase additional common shares of the Fund. As such, a portion of the cash distributions paid by the Fund (and subsequently paid by the Companies to their respective shareholders) may be reinvested in additional common shares of the Fund.
The Fund may fund its cash distributions to shareholders from any sources of funds legally available to it, including offering proceeds, borrowings, net investment income from operations, short-term and long-term capital gains proceeds from the sale of assets, gains from credit default swaps, non-capital gains proceeds from the sale of assets, dividends or other distributions paid to the Fund on account of preferred and common equity investments in portfolio companies and expense reimbursements and additional support payments from Franklin Square Holdings. The Fund has not established limits on the amount of funds it may use from available sources to make distributions.
20
FS Global Credit Opportunities Fund
Notes to Unaudited Financial Statements (continued)
(in thousands, except share and per share amounts)
Note 5. Distributions (continued)
The Fund expects that for a period of time following commencement of its investment operations, which time period may be significant, substantial portions of the Fund’s distributions may be funded through the reimbursement of certain expenses and additional support payments by Franklin Square Holdings and its affiliates, including through the waiver of certain investment advisory fees by FS Global Advisor, that are subject to repayment by the Fund within three years. The purpose of this arrangement is to ensure that no portion of the Fund’s distributions to shareholders will be paid from offering proceeds or borrowings. Any such distributions funded through support payments or waivers of advisory fees are not based on the Fund’s investment performance and the Fund’s distributions can only be sustained if the Fund achieves positive investment performance in future periods and/or Franklin Square Holdings continues to make such payments or waivers of such fees. The Fund’s future repayments of amounts reimbursed or waived by Franklin Square Holdings and its affiliates will reduce the distributions that shareholders would otherwise receive in the future. There can be no assurance that the Fund will achieve the performance necessary to sustain its distributions or that the Fund will be able to pay distributions at a specific rate or at all. Franklin Square Holdings and its affiliates have no obligation to waive advisory fees or otherwise reimburse expenses in future periods. For the six months ended June 30, 2014, if Franklin Square Holdings had not reimbursed certain of the Fund’s expenses and provided additional support payments, 36% of the cash distributions paid to shareholders during such period would have been funded from offering proceeds or borrowings.
The following table reflects the sources of the cash distributions on a tax basis that the Fund has paid on its common shares during the six months ended June 30, 2014 and the period from January 28, 2013 (Inception) to December 31, 2013:
| | | | | | | | | | | | | | | | |
| | | Six Months Ended
June 30, 2014
(Unaudited) | | | Period from
January 28, 2013
(Inception) to
December 31, 2013 | |
Source of Distribution | | Distribution
Amount | | | Percentage | | | Distribution
Amount | | | Percentage | |
Offering proceeds | | $ | — | | | | — | | | $ | — | | | | — | |
Borrowings | | | — | | | | — | | | | — | | | | — | |
Net investment income (prior to expense reimbursement and additional support payment from sponsor)(1) | | | 889 | | | | 25 | % | | | — | | | | — | |
Short-term capital gains proceeds from the sale of assets | | | 461 | | | | 13 | % | | | — | | | | — | |
Long-term capital gains proceeds from the sale of assets | | | — | | | | — | | | | — | | | | — | |
Gains from credit default swaps (ordinary income for tax) | | | 957 | | | | 26 | % | | | — | | | | — | |
Non-capital gains proceeds from the sale of assets | | | — | | | | — | | | | — | | | | — | |
Distributions on account of preferred and common equity | | | — | | | | — | | | | — | | | | — | |
Expense reimbursement and additional support payment from sponsor | | | 1,296 | | | | 36 | % | | | 243 | | | | 100 | % |
| | | | | | | | | | | | | | | | |
Total | | $ | 3,603 | | | | 100 | % | | $ | 243 | | | | 100 | % |
| | | | | | | | | | | | | | | | |
| (1) | During the six months ended June 30, 2014 and the period from January 28, 2013 (Inception) to December 31, 2013, 95.6% and 90.9% of the Fund’s gross investment income, respectively, was attributable to cash income earned and 4.4% and 9.1%, respectively, was attributable to non-cash accretion of discount. |
The determination of the tax attributes of the Fund’s distributions is made annually as of the end of the Fund’s fiscal year based upon the Fund’s taxable income for the full year and distributions paid for the full year.
21
FS Global Credit Opportunities Fund
Notes to Unaudited Financial Statements (continued)
(in thousands, except share and per share amounts)
Note 5. Distributions (continued)
Therefore, a determination made on an interim basis may not be representative of the actual tax attributes of the Fund’s distributions for a full year.
The aggregate cost of the Fund’s investments for federal income tax purposes totaled $167,219 and $18,312 as of June 30, 2014 and December 31, 2013, respectively. The aggregate net unrealized appreciation (depreciation) on investments on a tax basis was $1,950 and $86 as of June 30, 2014 and December 31, 2013, respectively. The net unrealized depreciation on credit default swaps on a tax basis was $176 and $0 as of June 30, 2014 and December 31, 2013, respectively.
Note 6. Financial Instruments
The Fund may trade in financial instruments with off-balance sheet risk in the normal course of its investing activities. These financial instruments may include forward foreign currency exchange contracts, futures contracts, swap contracts and written options and may involve, to a varying degree, elements of risk in excess of the amounts recognized for financial statement purposes. The notional or contractual amounts of these instruments represent the investment the Fund has in particular classes of financial instruments and do not necessarily represent the amounts potentially subject to risk. The measurement of the risks associated with these instruments is meaningful only when all related and offsetting transactions are considered.
The Fund is subject to credit risk in the normal course of pursuing its investment objectives. The Fund may enter into credit default swap contracts to manage its credit risk, to gain exposure to a credit in which it may otherwise invest or to enhance its returns.
The Fund may enter into swap contracts containing provisions allowing the counterparty to terminate the contract under certain conditions, including, but not limited to, a decline in the Fund’s NAV below a certain level over a certain period of time, which would trigger a payment by the Fund for those swaps in a liability position.
The fair value of open derivative instruments (which are not considered to be hedging instruments for accounting disclosure purposes) whose primary underlying risk exposure is credit risk as of June 30, 2014 was as follows:
| | | | | | | | |
| | | Fair Value | |
Derivative | | Asset
Derivative | | | Liability
Derivative | |
Credit Default Swap Contracts | | $ | 52 | (1) | | $ | 3,685 | (2) |
| (1) | Unaudited Statement of Assets and Liabilities location: Unrealized appreciation on credit default swaps and receivable on credit default swaps. |
| (2) | Unaudited Statement of Assets and Liabilities location: Unrealized depreciation on credit default swaps and unamortized swap premiums received. |
During the six months ended June 30, 2014, the Fund adopted new disclosure requirements for offsetting assets and liabilities, pursuant to which the Fund will disclose both gross and net information for assets and liabilities related to derivatives. The Fund’s derivative assets and liabilities at fair value by risk, which are reported on a gross basis on its Unaudited Statement of Assets and Liabilities, are presented in the table above. The following tables present the Fund’s derivative assets and liabilities by counterparty, net of amounts available
22
FS Global Credit Opportunities Fund
Notes to Unaudited Financial Statements (continued)
(in thousands, except share and per share amounts)
Note 6. Financial Instruments (continued)
for offset under a master netting agreement and net of the related collateral received by the Fund for assets or pledged by the Fund for liabilities as of June 30, 2014:
| | | | | | | | | | | | | | | | | | | | |
Counterparty | | Derivative
Assets
Subject to
Master
Netting
Agreement | | | Derivatives
Available
for Offset | | | Non-cash
Collateral
Received(1) | | | Cash
Collateral
Received(1) | | | Net
Amount of
Derivative
Assets(2) | |
JPMorgan Chase Bank, N.A. | | $ | 17 | | | $ | 17 | | | $ | — | | | $ | — | | | $ | — | |
| | | | | |
Counterparty | | Derivative
Liabilities
Subject to
Master
Netting
Agreement | | | Derivatives
Available
for Offset | | | Non-cash
Collateral
Pledged(1) | | | Cash
Collateral
Pledged(1) | | | Net
Amount of
Derivative
Liabilities(3) | |
JPMorgan Chase Bank, N.A. | | $ | 3,685 | | | $ | 17 | | | $ | — | | | $ | 3,668 | | | $ | — | |
| (1) | In some instances, the actual amount of the collateral received and/or pledged may be more than the amount shown due to overcollateralization. |
| (2) | Net amount of derivative assets represents the net amount due from the counterparty to the Fund in the event of default. |
| (3) | Net amount of derivative liabilities represents the net amount due from the Fund to the counterparty in the event of default. |
The effect of derivative instruments (which are not considered to be hedging instruments for accounting disclosure purposes) on the Fund’s Unaudited Statement of Operations whose primary underlying risk exposure is credit risk for the six months ended June 30, 2014 was as follows:
| | | | | | | | |
Derivative | | Realized Gain
(Loss) on
Derivatives
Recognized in
Income | | | Change in
Unrealized
Appreciation
(Depreciation) on
Derivatives
Recognized in
Income | |
Credit Default Swap Contracts | | $ | 957 | (1) | | $ | (176 | )(2) |
| (1) | Unaudited Statement of Operations location: Net realized gain (loss) on credit default swaps. |
| (2) | Unaudited Statement of Operations location: Net change in unrealized appreciation (depreciation) on credit default swaps. |
The average notional amount of credit default swap contracts outstanding during the six months ended June 30, 2014, which is indicative of the volume of this derivative type, was approximately $7,356.
23
FS Global Credit Opportunities Fund
Notes to Unaudited Financial Statements (continued)
(in thousands, except share and per share amounts)
Note 7. Investment Portfolio
The following table summarizes the composition of the Fund’s investment portfolio at cost and fair value as of June 30, 2014:
| | | | | | | | | | | | |
| | | June 30, 2014 | |
| | | Amortized Cost(1) | | | Fair Value | | | Percentage
of Portfolio | |
Senior Secured Loans—First Lien | | $ | 87,348 | | | $ | 88,378 | | | | 52 | % |
Senior Secured Loans—Second Lien | | | 29,319 | | | | 29,612 | | | | 18 | % |
Senior Secured Bonds | | | 35,905 | | | | 36,170 | | | | 21 | % |
Subordinated Debt | | | 6,968 | | | | 6,987 | | | | 4 | % |
Equity/Other | | | 7,679 | | | | 8,022 | | | | 5 | % |
| | | | | | | | | | | | |
| | $ | 167,219 | | | $ | 169,169 | | | | 100 | % |
| | | | | | | | | | | | |
| (1) | Amortized cost represents the original cost adjusted for the amortization of premiums and/or accretion of discounts, as applicable, on investments. |
As of June 30, 2014, the Fund did not “control” and was not an “affiliated person” of any of its portfolio companies, each as defined in the 1940 Act. In general, under the 1940 Act, the Fund would be presumed to “control” a portfolio company if it owned 25% or more of its voting securities or had the power to exercise control over the management or policies of such portfolio company, and would be an “affiliated person” of a portfolio company if it owned 5% or more of its voting securities.
The Fund’s investment portfolio may contain loans that are in the form of lines of credit or revolving credit facilities, which require the Fund to provide funding when requested by portfolio companies in accordance with the terms of the underlying loan agreements. As of June 30, 2014, the Fund held no such investments. The Fund will maintain sufficient cash on hand and/or available borrowings to fund any such unfunded commitments should the need arise.
24
FS Global Credit Opportunities Fund
Notes to Unaudited Financial Statements (continued)
(in thousands, except share and per share amounts)
Note 7. Investment Portfolio (continued)
The table below describes investments by industry classification and enumerates the percentage, by fair value, of the total portfolio assets in such industries as of June 30, 2014:
| | | | | | | | |
| | | June 30, 2014 | |
Industry Classification | | Fair Value | | | Percentage
of Portfolio | |
Automobiles & Components | | $ | 649 | | | | 0 | % |
Capital Goods | | | 6,787 | | | | 4 | % |
Commercial & Professional Services | | | 13,741 | | | | 8 | % |
Consumer Durables & Apparel | | | 18,573 | | | | 11 | % |
Consumer Services | | | 13,014 | | | | 8 | % |
Diversified Financials | | | 28 | | | | 0 | % |
Energy | | | 14,856 | | | | 9 | % |
Health Care Equipment & Services | | | 8,035 | | | | 5 | % |
Insurance | | | 6,012 | | | | 4 | % |
Materials | | | 13,790 | | | | 8 | % |
Media | | | 20,062 | | | | 12 | % |
Real Estate | | | 7,178 | | | | 4 | % |
Software & Services | | | 2,526 | | | | 1 | % |
Technology Hardware & Equipment | | | 5,998 | | | | 4 | % |
Telecommunication Services | | | 8,420 | | | | 5 | % |
Transportation | | | 16,029 | | | | 9 | % |
Utilities | | | 13,471 | | | | 8 | % |
| | | | | | | | |
Total | | $ | 169,169 | | | | 100 | % |
| | | | | | | | |
The table below describes the geographic concentration of the Fund’s investment portfolio and enumerates the percentage, by fair value, of the total portfolio assets in such geographic locations as of June 30, 2014:
| | | | | | | | |
| | | June 30, 2014 | |
Geographical Locations(1) | | Fair Value | | | Percentage
of Portfolio | |
United States | | $ | 127,119 | | | | 75 | % |
Europe | | | 33,763 | | | | 20 | % |
Australia | | | 5,003 | | | | 3 | % |
Canada | | | 2,622 | | | | 2 | % |
Other | | | 662 | | | | 0 | % |
| | | | | | | | |
Total | | $ | 169,169 | | | | 100 | % |
| | | | | | | | |
| (1) | Geographic location based on the portfolio company’s headquarters or principal place of business. |
Purchases and sales of securities during the six months ended June 30, 2014, other than short-term securities and U.S. government obligations, aggregated $224,542 and $76,252, respectively.
25
FS Global Credit Opportunities Fund
Notes to Unaudited Financial Statements (continued)
(in thousands, except share and per share amounts)
Note 8. Fair Value of Financial Instruments
Under existing accounting guidance, fair value is defined as the price that the Fund would receive upon selling an asset or pay to transfer a liability in an orderly transaction to a market participant in the principal or most advantageous market for the investment. This accounting guidance emphasizes that valuation techniques maximize the use of observable market inputs and minimize the use of unobservable inputs. Inputs refer broadly to the assumptions that market participants would use in pricing an asset or liability, including assumptions about risk. Inputs may be observable or unobservable. Observable inputs are inputs that reflect the assumptions market participants would use in pricing an asset or liability developed based on market data obtained from sources independent of the Fund. Unobservable inputs are inputs that reflect the assumptions market participants would use in pricing an asset or liability developed based on the best information available in the circumstances. The Fund classifies the inputs used to measure these fair values into the following hierarchy as defined by current accounting guidance:
Level 1: Inputs that are quoted prices (unadjusted) in active markets for identical assets or liabilities.
Level 2: Inputs that are quoted prices for similar assets or liabilities in active markets.
Level 3: Inputs that are unobservable for an asset or liability.
A financial instrument’s categorization within the valuation hierarchy is based upon the lowest level of input that is significant to the fair value measurement.
As of June 30, 2014, the Fund’s investments and credit default swaps were categorized as follows in the fair value hierarchy:
| | | | |
Valuation Inputs | | Investments | |
Level 1—Price quotations in active markets | | $ | 6,664 | |
Level 2—Significant other observable inputs | | | — | |
Level 3—Significant unobservable inputs | | | 162,505 | |
| | | | |
Total | | $ | 169,169 | |
| | | | |
| | | | | | | | |
| | | Credit Default Swaps | |
Valuation Inputs | | Asset | | | Liability | |
Level 1—Price quotations in active markets | | $ | — | | | $ | — | |
Level 2—Significant other observable inputs | | | — | | | | — | |
Level 3—Significant unobservable inputs | | | 17 | | | | (3,685 | ) |
| | | | | | | | |
Total | | $ | 17 | | | $ | (3,685 | ) |
| | | | | | | | |
The Fund’s investments as of June 30, 2014 consisted primarily of debt securities that are traded on a private over-the-counter market for institutional investors. Except as described below, the Fund valued its investments and credit default swaps by using the midpoint of the prevailing bid and ask prices from dealers on the date of the relevant period end, which were provided by an independent third-party pricing service and screened for validity by such service. Seven equity investments which were traded on an active public market were valued at their closing price as of June 30, 2014.
26
FS Global Credit Opportunities Fund
Notes to Unaudited Financial Statements (continued)
(in thousands, except share and per share amounts)
Note 8. Fair Value of Financial Instruments (continued)
The Fund periodically benchmarks the bid and ask prices it receives from the third-party pricing service against the actual prices at which the Fund purchases and sells its investments. Based on the results of the benchmark analysis and the experience of the Fund’s management in purchasing and selling these investments in other investment funds managed by the sponsor, the Fund believes that these prices are reliable indicators of fair value. However, because of the private nature of this marketplace (meaning actual transactions are not publicly reported), the Fund believes that these valuation inputs are classified as Level 3 within the fair value hierarchy. The Fund may also use other methods, including the use of an independent valuation firm, to determine fair value for securities for which it cannot obtain prevailing bid and ask prices through third-party pricing services or independent dealers, or where the Board otherwise determines that the use of such other methods is appropriate. The Fund will periodically benchmark the valuations provided by the independent valuation firm against the actual prices at which the Fund purchases and sells its investments. The Fund’s valuation committee and Board reviewed the valuation determinations made with respect to these investments and determined that they were made in a manner consistent with the Fund’s valuation process.
The following is a reconciliation for the six months ended June 30, 2014 of investments and credit default swaps for which significant unobservable inputs (Level 3) were used in determining fair value or market value, as applicable:
| | | | | | | | | | | | | | | | | | | | | | | | | | | | |
| | | Senior Secured
Loans—First
Lien | | | Senior Secured
Loans—Second
Lien | | | Senior
Secured
Bonds | | | Subordinated
Debt | | | Government
Bonds | | | Equity/
Other | | | Total | |
Fair value at beginning of period | | $ | 9,996 | | | $ | 4,863 | | | $ | 3,091 | | | $ | — | | | $ | — | | | $ | — | | | $ | 17,950 | |
Accretion of discount (amortization of premium) | | | 31 | | | | 3 | | | | 75 | | | | 1 | | | | 2 | | | | — | | | | 112 | |
Net realized gain (loss) | | | 244 | | | | — | | | | (102 | ) | | | 273 | | | | 78 | | | | — | | | | 493 | |
Net change in unrealized appreciation (depreciation) | | | 1,007 | | | | 277 | | | | 245 | | | | 19 | | | | — | | | | 228 | | | | 1,776 | |
Purchases | | | 118,668 | | | | 24,531 | | | | 37,990 | | | | 34,252 | | | | 1,780 | | | | 1,130 | | | | 218,351 | |
Sales and redemptions | | | (41,568 | ) | | | (62 | ) | | | (5,129 | ) | | | (27,558 | ) | | | (1,860 | ) | | | — | | | | (76,177 | ) |
Net transfers in or out of Level 3 | | | — | | | | — | | | | — | | | | — | | | | — | | | | — | | | | — | |
| | | | | | | | | | | | | | | | | | | | | | | | | | | | |
Fair value at end of period | | $ | 88,378 | | | $ | 29,612 | | | $ | 36,170 | | | $ | 6,987 | | | $ | — | | | $ | 1,358 | | | $ | 162,505 | |
| | | | | | | | | | | | | | | | | | | | | | | | | | | | |
The amount of total gains or losses for the period included in changes in net assets attributable to the change in unrealized gains or losses relating to investments still held at the reporting date | | $ | 1,159 | | | $ | 136 | | | $ | 251 | | | $ | 19 | | | $ | — | | | $ | 228 | | | $ | 1,793 | |
| | | | | | | | | | | | | | | | | | | | | | | | | | | | |
| | | | |
| | | Credit
Default
Swaps | |
Market value at beginning of period | | $ | — | |
Net realized gain (loss) | | | 957 | |
Net change in unrealized appreciation (depreciation) | | | (176 | ) |
Unamortized swap premiums received | | | (5,641 | ) |
Coupon payments received | | | (125 | ) |
Premiums paid on exit | | | 1,317 | |
Net transfers in or out of Level 3 | | | — | |
| | | | |
Market value at end of period | | $ | (3,668 | ) |
| | | | |
The amount of total gains or losses for the period included in changes in net assets attributable to the change in unrealized gains or losses relating to credit default swaps still held at the reporting date | | $ | (176 | ) |
| | | | |
27
FS Global Credit Opportunities Fund
Notes to Unaudited Financial Statements (continued)
(in thousands, except share and per share amounts)
Note 8. Fair Value of Financial Instruments (continued)
The valuation techniques and significant unobservable inputs used in recurring Level 3 fair value measurements as of June 30, 2014 is as follows:
| | | | | | | | | | | | | | |
Type of Investment | | Fair Value or
Market Value at
June 30, 2014 | | | Valuation
Technique(1) | | Unobservable Input | | Range | | Weighted
Average | |
Senior Secured Loans—First Lien | | $ | 88,378 | | | Market Quotes | | Indicative Dealer Quotes | | 92.3% - 102.1% | | | 100.0 | % |
Senior Secured Loans—Second Lien | | | 29,612 | | | Market Quotes | | Indicative Dealer Quotes | | 95.3% - 104.2% | | | 100.4 | % |
Senior Secured Bonds | | | 36,170 | | | Market Quotes | | Indicative Dealer Quotes | | 82.8% - 107.4% | | | 99.7 | % |
Subordinated Debt | | | 6,987 | | | Market Quotes | | Indicative Dealer Quotes | | 73.1% - 100.0% | | | 99.3 | % |
Equity/Other | | | 1,358 | | | Market Quotes | | Indicative Dealer Quotes | | €160.8 - €163.4 | | € | 162.1 | |
| | | | | | | | | | | | | | |
| | $ | 162,505 | | | | | | | | | | | |
| | | | | | | | | | | | | | |
| | | | | |
Credit Default Swaps | | $ | (3,668 | ) | | Market Quotes | | Indicative Dealer Quotes | | (30.8%) - (9.4%) | | | (16.0 | %) |
| (1) | Investments using a market quotes valuation technique were valued by using the midpoint of the prevailing bid and ask prices from dealers on the date of the relevant period end, which were provided by an independent third-party pricing service and screened for validity by such service. |
Note 9. Concentration of Risk
Investing in the Fund involves risks, including those set forth below. The risks described below are not, and are not intended to be, a complete enumeration or explanation of the risks involved in an investment in the Fund. For a more complete discussion of the risks of investing in the Fund, see the section entitled “Types of Investments and Related Risks” in the Companies’ prospectuses and the Companies’ and the Fund’s other filings with the SEC.
Credit Risk: The Fund’s debt investments will be subject to the risk of non-payment of scheduled interest or principal by the borrowers with respect to such investments. Such non-payment would likely result in a reduction of income to the Fund and a reduction in the value of the debt investments experiencing non-payment.
Although the Fund may invest in investments that FS Global Advisor believes are secured by specific collateral, the value of which may exceed the principal amount of the investments at the time of initial investment, there can be no assurance that the liquidation of any such collateral would satisfy the borrower’s obligation in the event of non-payment of scheduled interest or principal payments with respect to such investment, or that such collateral could be readily liquidated. In addition, in the event of bankruptcy of a borrower, the Fund could experience delays or limitations with respect to its ability to realize the benefits of the collateral securing an investment. Under certain circumstances, collateral securing an investment may be released without the consent of the Fund. Moreover, the Fund’s investments in secured debt may be unperfected for a variety of reasons, including the failure to make required filings by lenders, trustees or other responsible parties and, as a result, the Fund may not have priority over other creditors as anticipated. The Fund’s right to payment and its security interest, if any, may be subordinated to the payment rights and security interests of more senior creditors. Certain of these investments may have an interest-only payment schedule, with the principal amount remaining outstanding and at risk until the maturity of the investment. In this case, a portfolio company’s ability to repay the principal of an investment may be dependent upon a liquidity event or the long-term success of the company, the occurrence of which is uncertain.
28
FS Global Credit Opportunities Fund
Notes to Unaudited Financial Statements (continued)
(in thousands, except share and per share amounts)
Note 9. Concentration of Risk (continued)
Companies in which the Fund invests could deteriorate as a result of, among other factors, an adverse development in their business, a change in the competitive environment or an economic downturn. As a result, companies that the Fund expected to be stable may operate, or expect to operate, at a loss or have significant variations in operating results, may require substantial additional capital to support their operations or maintain their competitive position, or may otherwise have a weak financial condition or be experiencing financial distress.
Non-U.S. Securities Risk: Investments in certain securities and other instruments of non-U.S. issuers or borrowers, or non-U.S. securities, involve factors not typically associated with investing in the United States or other developed countries, including risks relating to: (i) differences between U.S. and non-U.S. securities markets, including potential price volatility in and relative illiquidity of some non-U.S. securities markets; the absence of uniform accounting, auditing and financial reporting standards, practices, and disclosure requirements; and less government supervision and regulation; (ii) other differences in law and regulation, including fewer investor protections, less stringent fiduciary duties, less developed bankruptcy laws and difficulty in enforcing contractual obligations; (iii) certain economic and political risks, including potential economic, political or social instability; exchange control regulations; restrictions on foreign investment and repatriation of capital, possibly requiring government approval; expropriation or confiscatory taxation; other government restrictions by the United States or other governments; higher rates of inflation; higher transaction costs; and reliance on a more limited number of commodity inputs, service providers, and/or distribution mechanisms; and (iv) the possible imposition of local taxes on income and gains recognized with respect to securities and assets. Certain non-U.S. markets may rely heavily on particular industries or non-U.S. capital and are more vulnerable to diplomatic developments, the imposition of economic sanctions against a particular country or countries, organizations, entities and/or individuals, changes in international trading patterns, trade barriers, and other protectionist or retaliatory measures. International trade barriers or economic sanctions against non-U.S. countries, organizations, entities and/or individuals may adversely affect the Fund’s non-U.S. holdings or exposures. Certain non-U.S. investments may become less liquid in response to social, political or market developments or adverse investor perceptions, or become illiquid after purchase by the Fund, particularly during periods of market turmoil. Certain non-U.S. investments may become illiquid when, for instance, there are few, if any, interested buyers and sellers or when dealers are unwilling to make a market for certain securities. When the Fund holds illiquid investments, its portfolio may be harder to value, especially in changing markets. The risks of investments in emerging markets, if any, including the risks described above, are usually greater than the risks involved in investing in more developed markets. Because non-U.S. securities may trade on days when the common shares are not priced, NAV may change at times when common shares cannot be sold.
Foreign Currency Risk: Investments made by the Fund, and the income received by the Fund with respect to such investments, may be denominated in various non-U.S. currencies. However, the books of the Fund are maintained in U.S. dollars. Accordingly, changes in currency values may adversely affect the U.S. dollar value of portfolio investments, interest and other revenue streams received by the Fund, gains and losses realized on the sale of portfolio investments, and the amount of distributions, if any, made by the Fund. In addition, the Fund may incur substantial costs in converting investment proceeds from one currency to another. The Fund may enter into derivative transactions designed to reduce such currency risks. Furthermore, the portfolio companies in which the Fund invests may be subject to risks relating to changes in currency values. If a portfolio company suffers adverse consequences as a result of such changes, the Fund may also be adversely affected as a result.
29
FS Global Credit Opportunities Fund
Notes to Unaudited Financial Statements (continued)
(in thousands, except share and per share amounts)
Note 10. Commitments and Contingencies
The Fund enters into contracts that contain a variety of indemnification provisions. The Fund’s maximum exposure under these arrangements is unknown; however, the Fund has not had prior claims or losses pursuant to these contracts. Management of FS Global Advisor has reviewed the Fund’s existing contracts and expects the risk of loss to the Fund to be remote.
The Fund is not currently subject to any material legal proceedings and, to the Fund’s knowledge, no material legal proceedings are threatened against the Fund. From time to time, the Fund may be a party to certain legal proceedings in the ordinary course of business, including proceedings related to the enforcement of the Fund’s rights under contracts with its portfolio companies. While the outcome of any legal proceedings cannot be predicted with certainty, the Fund does not expect that any such proceedings will have a material adverse effect upon its financial condition or results of operations.
See Note 4 for a discussion of the Fund’s commitments to FS Global Advisor and its affiliates (including Franklin Square Holdings) for the reimbursement of organization and offering costs funded by Franklin Square Holdings.
Note 11. Subsequent Events
On August 26, 2014, the Fund’s wholly-owned, special-purpose financing subsidiary, Dauphin Funding LLC, or Dauphin Funding, entered into a revolving credit facility, or the Dauphin Funding facility, with Deutsche Bank AG, New York Branch, or Deutsche Bank, as administrative agent and a lender, and the other lenders party thereto. The Dauphin Funding facility provides for borrowings in an aggregate principal amount up to $150,000 on a committed basis.
The Fund may contribute assets to Dauphin Funding from time to time and will retain a residual interest in any assets contributed through its ownership of Dauphin Funding or will receive fair market value for any assets sold to Dauphin Funding. Dauphin Funding may purchase additional assets from various sources. Dauphin Funding has appointed the Fund to manage its portfolio of assets pursuant to the terms of an investment management agreement. Dauphin Funding’s obligations to Deutsche Bank under the Dauphin Funding facility are secured by a first priority security interest in substantially all of the assets of Dauphin Funding, including its portfolio of assets. The obligations of Dauphin Funding under the Dauphin Funding facility are non-recourse to the Fund and the Fund’s exposure under the facility is limited to the value of its investment in Dauphin Funding.
Pricing under the Dauphin Funding facility is based on the three-month London Interbank Offered Rate, or LIBOR, plus a spread of 1.55% per annum. Interest is payable quarterly in arrears. Any amounts borrowed under the Dauphin Funding facility will mature, and all accrued and unpaid interest thereunder will be due and payable, on August 25, 2015. Dauphin Funding paid a structuring fee and incurred certain other customary costs and expenses in connection with obtaining the Dauphin Funding facility. Borrowings under the Dauphin Funding facility are subject to compliance with a borrowing base, pursuant to which the amount of funds advanced to Dauphin Funding varies depending upon the types of assets in Dauphin Funding’s portfolio.
Borrowings of Dauphin Funding will be considered borrowings of the Fund for purposes of complying with the asset coverage requirements under the 1940 Act applicable to closed-end management investment companies.
30
Supplemental Information
Changes in and Disagreements with Accountants on Accounting and Financial Disclosure
FS Global Credit Opportunities Fund (the “Fund”) has not had any changes in or disagreements with its independent registered public accounting firm on accounting or financial disclosure matters since its inception.
Form N-Q Filings
The Fund files its complete schedule of portfolio holdings with the U.S. Securities and Exchange Commission (the “SEC”) for the first and third quarters of each fiscal year on Form N-Q. The Fund’s Forms N-Q are available on the SEC’s website at http://www.sec.gov. The Fund’s Forms N-Q may also be reviewed and copied at the SEC’s Public Reference Room located at 100 F Street, NE, Washington, DC 20549. Shareholders may obtain information on the operation of the SEC’s Public Reference Room by calling the SEC at 1-800-SEC-0330.
Proxy Voting Policies and Procedures
The Fund has delegated its proxy voting responsibility to FS Global Advisor, LLC, the Fund’s investment adviser (“FS Global Advisor”). You may obtain a copy of FS Global Advisor’s proxy voting policies and procedures upon request and without charge by calling the Fund collect at 215-495-1150 or on the SEC’s website at http://www.sec.gov.
Proxy Voting Record
Information regarding how FS Global Advisor voted proxies relating to the Fund’s portfolio securities during the most recent 12-month period ending June 30 is available upon request without charge by making a written request to the Fund’s Chief Compliance Officer at FS Global Credit Opportunities Fund, Cira Centre, 2929 Arch Street, Suite 675, Philadelphia, Pennsylvania 19104, Attn: Chief Compliance Officer, by calling the Fund collect at 215-495-1150 or on the SEC’s website at http://www.sec.gov.
31
2929 Arch Street, Suite 675 Philadelphia, PA 19104 215-495-1150 Interests in FS Global Credit Opportunities Fund are not registered under the Securities Act of 1933, as amended (the “Securities Act”), and are issued only to FS Global Credit Opportunities Fund—A and FS Global Credit Opportunities Fund—D in private placement transactions that do not involve any “public offering” within the meaning of Section 4(a)(2) of, and/or Regulation D under, the Securities Act. This semi-annual report does not constitute an offer to sell, or the solicitation of an offer to buy, any interest in FS Global Credit Opportunities Fund. Past performance is not indicative of future results. Franklin Square Capital Partners is not affiliated with Franklin Resources/Franklin Templeton Investments or the Franklin Funds. FS GLOBAL CREDIT OPPORTUNITIES FUND SAN14-FSGCO RRD 8/14
Not applicable to this semi-annual report on Form N-CSR.
| Item 3. | Audit Committee Financial Expert. |
Not applicable to this semi-annual report on Form N-CSR.
| Item 4. | Principal Accountant Fees and Services. |
Not applicable to this semi-annual report on Form N-CSR.
| Item 5. | Audit Committee of Listed Registrants. |
| | (a) | Not applicable. The Fund is not a listed issuer as defined in Rule 10A-3 under the Securities Exchange Act of 1934, as amended (the “Exchange Act”). |
| | (b) | Not applicable. The Fund is not a listed issuer as defined in Rule 10A-3 under the Exchange Act. |
| | (a) | The Fund’s unaudited schedule of investments as of June 30, 2014 is included as part of the Semi-Annual Report included in Item 1 of this semi-annual report on Form N-CSR. |
| Item 7. | Disclosure of Proxy Voting Policies and Procedures for Closed-End Management Investment Companies. |
Not applicable to this semi-annual report on Form N-CSR.
| Item 8. | Portfolio Managers of Closed-End Management Investment Companies. |
| | (a) | Not applicable to this semi-annual report on Form N-CSR. |
| | (b) | As of the date of filing of this semi-annual report on Form N-CSR, there has been no change in any of the portfolio managers identified in Item 8(a)(1) of the Fund’s annual report on Form N-CSR for the fiscal year ended December 31, 2013. |
| Item 9. | Purchases of Equity Securities by Closed-End Management Investment Company and Affiliated Purchasers. |
No such purchases were made by or on behalf of the Fund during the period covered by this semi-annual report on Form N-CSR.
| Item 10. | Submission of Matters to a Vote of Security Holders. |
There were no material changes to the procedures by which shareholders of the Fund may recommend nominees to the Fund’s board of trustees (the “Board”) during the period covered by this semi-annual report on Form N-CSR.
| Item 11. | Controls and Procedures |
| | (a) | The Fund’s principal executive officer and principal financial officer have evaluated the Fund’s disclosure controls and procedures (as defined in Rule 30a-3(c) under the 1940 Act) within 90 days of the filing of this semi-annual report on Form N-CSR and have concluded that the Fund’s disclosure controls and procedures were effective, as of that date, in ensuring that information required to be disclosed by the Fund in this semi-annual report on Form N-CSR was recorded, processed, summarized and reported timely. |
| | (b) | There was no change in the Fund’s internal control over financial reporting (as defined in Rule 30a-3(d) under the 1940 Act) that occurred during the second fiscal quarter of the period covered by this semi-annual report on Form N-CSR that has materially affected, or is reasonably likely to materially affect, the Fund’s internal control over financial reporting. |
| | |
| (a)(1) | | Not applicable to this semi-annual report on Form N-CSR. |
| |
| (a)(2) | | The certifications of the Fund’s Chief Executive Officer and Chief Financial Officer required by Rule 30a-2(a) under the 1940 Act are attached hereto. |
| |
| (a)(3) | | Not applicable. |
| |
| (b) | | The certifications of the Fund’s Chief Executive Officer and Chief Financial Officer required by Rule 30a-2(b) under the 1940 Act are attached hereto. |
SIGNATURES
Pursuant to the requirements of the Securities Exchange Act of 1934 and the Investment Company Act of 1940, the registrant has duly caused this report to be signed on its behalf by the undersigned, thereunto duly authorized.
| | |
| FS Global Credit Opportunities Fund |
| |
| By: | | /s/ Michael C. Forman |
| Name: | | Michael C. Forman |
| Title: | | President and Chief Executive Officer |
| Date: | | September 4, 2014 |
Pursuant to the requirements of the Securities and Exchange Act of 1934 and the Investment Company Act of 1940, this report has been signed below by the following persons on behalf of the registrant and in the capacities and on the dates indicated.
| | |
| By: | | /s/ Michael C. Forman |
| Name: | | Michael C. Forman |
| Title: | | President and Chief Executive Officer (Principal Executive Officer) |
| Date: | | September 4, 2014 |
| |
| By: | | /s/ William Goebel |
| Name: | | William Goebel |
| Title: | | Chief Financial Officer (Principal Financial Officer) |
| Date: | | September 4, 2014 |