FS Credit Opportunities Corp. 8-K
Exhibit 99.1

FS Credit Opportunities Corp. A flexible credit solution for today’s complex and changing markets October 2022 All information is as of June 30, 2022, unless otherwise noted.
2 Forward - looking statements Statements included herein may constitute “forward - looking” statements as that term is defined in Section 27A of the Securities Act of 1933, as amended (the Securities Act), and Section 21E of the Securities Exchange Act of 1934, as amended by the Private Securities Litigation Reform Act of 1995, including statements with regard to future events or the future performance or operations of the Fund. Words such as “intends”, “will”, “may”, “believes,” “expects,” “projects,” and “future” or similar expressions are intended to identify forward - looking statements. These forward - looking statements are subject to the inherent uncertainties in predicting future results and conditions. Certain factors could cause actual results to differ materially from those projected in these forward - looking statements. Factors that could cause actual results to differ materially include changes in the economy, geo - political risks, risks associated with possible disruption to the Fund’s operations or the economy generally due to hostilities, terrorism, natural disasters or pandemics such as COVID - 19, future changes in laws or regulations and conditions in the Fund’s operating area, unexpected costs, the ability of the Fund to complete the listing of the common stock of the Fund on a national securities exchange, the price at which the Fund’s shares of common stock may trade on a national securities exchange, and failure to list the common stock of the Fund on a national securities exchange. Some of these factors are enumerated in the filings the Fund made with the Securities and Exchange Commission (the SEC) and are also contained in the presentation. The inclusion of forward - looking statements should not be regarded as a representation that any plans, estimates or expectations will be achieved. Any forward - looking statements speak only as of the date of this communication. Except as required by federal securities laws, the Fund undertakes no obligation to update or revise any forward - looking statements, whether as a result of new information, future events or otherwise. Readers are cautioned not to place undue reliance on any of these forward - looking statements. Disclosures
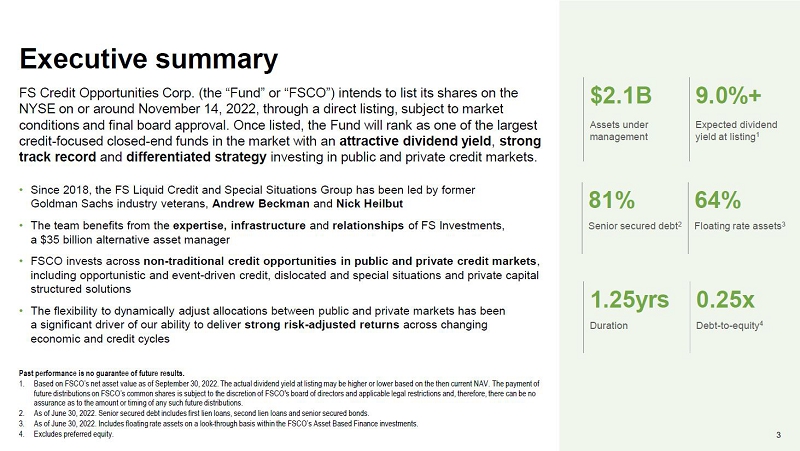
3 FS Credit Opportunities Corp. (the “Fund” or “FSCO”) intends to list its shares on the NYSE on or around November 14, 2022, through a direct listing, subject to market conditions and final board approval. Once listed, the Fund will rank as one of the largest credit - focused closed - end funds in the market with an attractive dividend yield , strong track record and differentiated strategy investing in public and private credit markets. • Since 2018, the FS Liquid Credit and Special Situations Group has been led by former Goldman Sachs industry veterans, Andrew Beckman and Nick Heilbut • The team benefits from the expertise, infrastructure and relationships of FS Investments, a $35 billion alternative asset manager • FSCO invests across non - traditional credit opportunities in public and private credit markets , including opportunistic and event - driven credit, dislocated and special situations and private capital structured solutions • The flexibility to dynamically adjust allocations between public and private markets has been a significant driver of our ability to deliver strong risk - adjusted returns across changing economic and credit cycles Past performance is no guarantee of future results. 1. Based on FSCO’s net asset value as of September 30, 2022. The actual dividend yield at listing may be higher or lower based on the then current NAV. The payment of future distributions on FSCO’s common shares is subject to the discretion of FSCO's board of directors and applicable legal restrictions and, therefore, there can be no assurance as to the amount or timing of any such future distributions. 2. As of June 30, 2022. Senior secured debt includes first lien loans, second lien loans and senior secured bonds. 3. As of June 30, 2022. Includes floating rate assets on a look - through basis within the FSCO’s Asset Based Finance investments. 4. Excludes preferred equity. Executive summary $2.1B 9.0%+ Assets under management Expected dividend yield at listing 1 81% 64% Senior secured debt 2 Floating rate assets 3 1.25yrs 0.25x Duration Debt - to - equity 4

4 1 Strategy overview 2 Management team & investment process 3 Portfolio highlights & competitive positioning 4 Appendix Agenda

Strategy overview
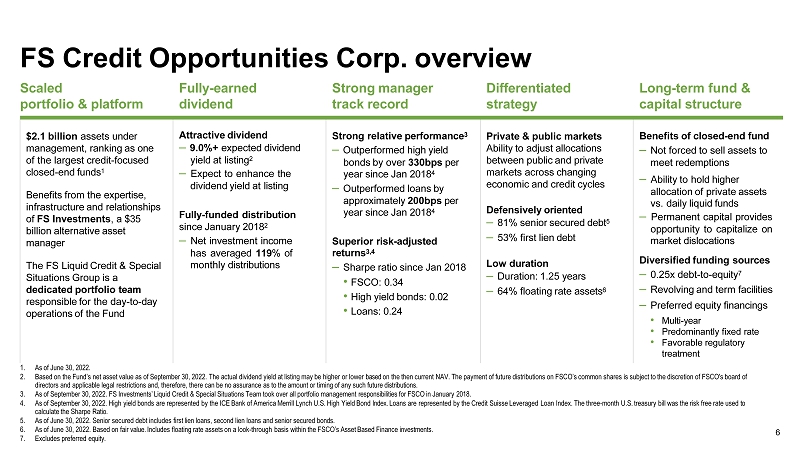
6 1. As of June 30, 2022. 2. Based on the Fund’s net asset value as of September 30, 2022. The actual dividend yield at listing may be higher or lower based on the then current NAV. The payment of future distributions on FSCO’s common shares is subject to the discretion of FSCO's board of directors and applicable legal restrictions and, therefore, there can be no assurance as to the amount or timing of any such future distributions. 3. As of September 30, 2022. FS Investments’ Liquid Credit & Special Situations Team took over all portfolio management responsibilities for FSCO in January 2018. 4. As of September 30, 2022. High yield bonds are represented by the ICE Bank of America Merrill Lynch U.S. High Yield Bond Index. Loans are represented by the Credit Suisse Leveraged Loan Index. The three - month U.S. treasury bill was the risk free rate used to calculate the Sharpe Ratio. 5. As of June 30, 2022. Senior secured debt includes first lien loans, second lien loans and senior secured bonds. 6. As of June 30, 2022. Based on fair value. Includes floating rate assets on a look - through basis within the FSCO’s Asset Based Finance investments. 7. Excludes preferred equity. FS Credit Opportunities Corp. overview Scaled portfolio & platform Fully - earned dividend Strong manager track record Differentiated strategy Long - term fund & capital structure $2.1 billion assets under management, ranking as one of the largest credit - focused closed - end funds 1 Benefits from the expertise, infrastructure and relationships of FS Investments , a $35 billion alternative asset manager The FS Liquid Credit & Special Situations Group is a dedicated portfolio team responsible for the day - to - day operations of the Fund Attractive dividend ‒ 9 . 0 % + expected dividend yield at listing 2 ‒ Expect to enhance the dividend yield at listing Fully - funded distribution since January 2018 2 ‒ Net investment income has averaged 119 % of monthly distributions Strong relative performance 3 ‒ Outperformed high yield bonds by over 330bps per year since Jan 2018 4 ‒ Outperformed loans by approximately 200bps per year since Jan 2018 4 Superior risk - adjusted returns 3,4 ‒ Sharpe ratio since Jan 2018 • FSCO: 0.34 • High yield bonds: 0.02 • Loans: 0.24 Private & public markets Ability to adjust allocations between public and private markets across changing economic and credit cycles Defensively oriented ‒ 81% senior secured debt 5 ‒ 53% first lien debt Low duration ‒ Duration: 1.25 years ‒ 64% floating rate assets 6 Benefits of closed - end fund ‒ Not forced to sell assets to meet redemptions ‒ Ability to hold higher allocation of private assets vs. daily liquid funds ‒ Permanent capital provides opportunity to capitalize on market dislocations Diversified funding sources ‒ 0.25x debt - to - equity 7 ‒ Revolving and term facilities ‒ Preferred equity financings • Multi - year • Predominantly fixed rate • Favorable regulatory treatment
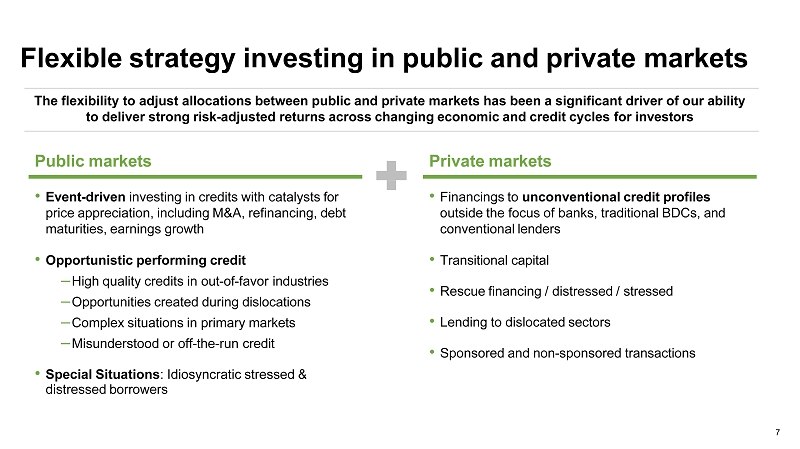
7 Flexible strategy investing in public and private markets Public markets Private markets • Event - driven investing in credits with catalysts for price appreciation, including M&A, refinancing, debt maturities, earnings growth • Opportunistic performing credit ‒ High quality credits in out - of - favor industries ‒ Opportunities created during dislocations ‒ Complex situations in primary markets ‒ Misunderstood or off - the - run credit • Special Situations : Idiosyncratic stressed & distressed borrowers • Financings to unconventional credit profiles outside the focus of banks, traditional BDCs, and conventional lenders • Transitional capital • Rescue financing / distressed / stressed • Lending to dislocated sectors • Sponsored and non - sponsored transactions The flexibility to adjust allocations between public and private markets has been a significant driver of our ability to deliver strong risk - adjusted returns across changing economic and credit cycles for investors

8 Differentiated strategy vs. competitor set FSCO vs. Public closed - end funds FSCO vs. Direct lending strategies • Ability to increase private credit allocation when risk - reward is more compelling vs. public markets • Strategy more heavily focused on event - driven investing vs. peers • Greater flexibility to allocate between fixed & floating rate assets • Dedicated investment team & full beneficiary of deal flow • Greater flexibility to adjust allocations across business cycles & changing market conditions by investing in public markets • Potential for yield/return premium by focusing on opportunities often overlooked by larger credit platforms ‒ Avg. size of our private investments (~$30M) ‒ Potential for structuring/exit fees • Size of asset base allows us to be nimble and allocate to high - conviction ideas to drive alpha • Lower duration • Daily liquidity with a ticker post - NYSE listing • No drawdown
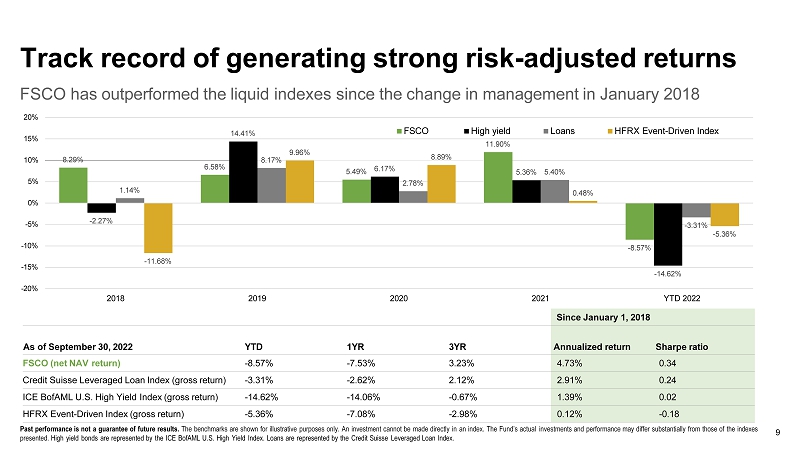
9 FSCO has outperformed the liquid indexes since the change in management in January 2018 Past performance is not a guarantee of future results. The benchmarks are shown for illustrative purposes only. An investment cannot be made directly in an index. The Fund’s actual investments and performance may differ substantially from those of the indexes presented. High yield bonds are represented by the ICE BofAML U.S. High Yield Index. Loans are represented by the Credit Suisse Leveraged Loan Index. Track record of generating strong risk - adjusted returns Since January 1, 2018 As of September 30, 2022 YTD 1YR 3YR Annualized return Sharpe ratio FSCO (net NAV return) - 8.57% - 7.53% 3.23% 4.73% 0.34 Credit Suisse Leveraged Loan Index (gross return) - 3.31% - 2.62% 2.12% 2.91% 0.24 ICE BofAML U.S. High Yield Index (gross return) - 14.62% - 14.06% - 0.67% 1.39% 0.02 HFRX Event - Driven Index (gross return) - 5.36% - 7.08% - 2.98% 0.12% - 0.18 6.58% 5.49% 11.90% - 8.57% - 2.27% 14.41% 6.17% 5.36% - 14.62% 1.14% 8.17% 2.78% 5.40% - 3.31% - 11.68% 9.96% 8.89% 0.48% - 5.36% 10% 8.29% - 20% - 15% - 10% - 5% 0% 5% 15% 20% 2018 2019 2020 2021 YTD 2022 FSCO High yield Loans HFRX Event - Driven Index

10 Management team & investment process
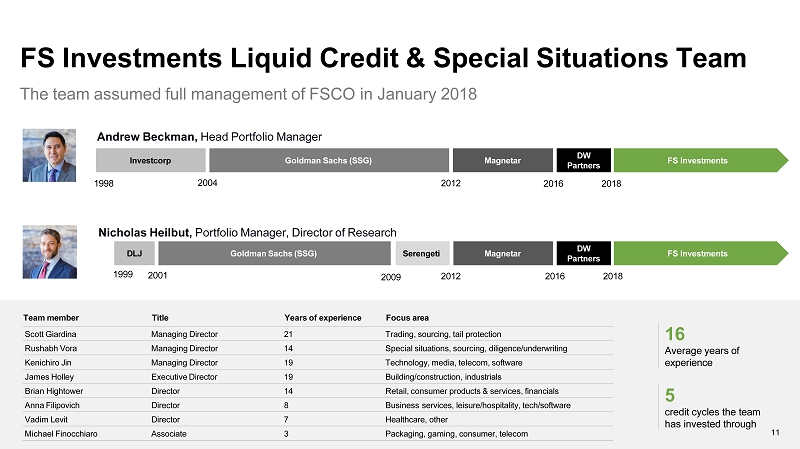
DLJ Goldman Sachs (SSG) Serengeti Magnetar DW Partners FS Investments Liquid Credit & Special Situations Team The team assumed full management of FSCO in January 2018 Andrew Beckman, Head Portfolio Manager Nicholas Heilbut, Portfolio Manager, Director of Research Team member Title Years of experience Focus area Scott Giardina Managing Director 21 Trading, sourcing, tail protection Rushabh Vora Managing Director 14 Special situations, sourcing, diligence/underwriting Kenichiro Jin Managing Director 19 Technology, media, telecom, software James Holley Executive Director 19 Building/construction, industrials Brian Hightower Director 14 Retail, consumer products & services, financials Anna Filipovich Director 8 Business services, leisure/hospitality, tech/software Vadim Levit Director 7 Healthcare, other Michael Finocchiaro Associate 3 Packaging, gaming, consumer, telecom 1998 Investcorp Goldman Sachs (SSG) Magnetar DW Partners FS Investments 2018 2016 2012 2001 FS Investments 16 Average years of experience 5 credit cycles the team has invested through 2004 2012 2018 2016 1999 2009 11
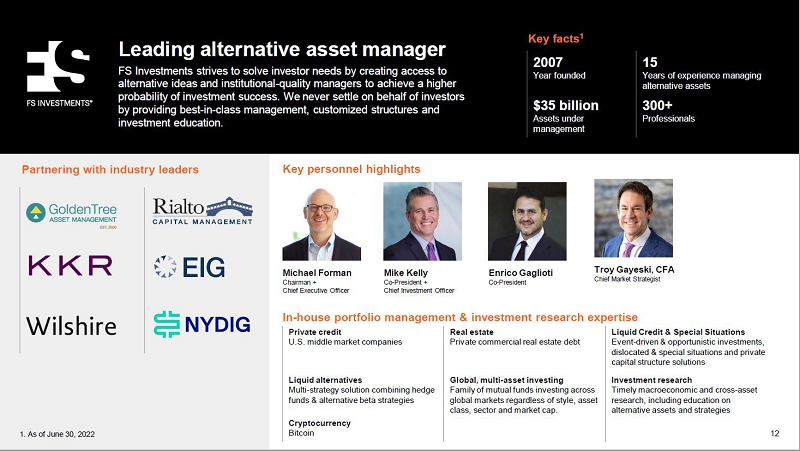
CONFIDENTIAL. FOR FINANCIAL PROFESSIONAL USE ONLY. NOT FOR USE WITH IN VESTORS. Leading alternative asset manager FS Investments strives to solve investor needs by creating access to alternative ideas and institutional - quality managers to achieve a higher probability of investment success. We never settle on behalf of investors by providing best - in - class management, customized structures and investment education. Key personnel highlights Partnering with industry leaders Michael Forman Chairman + Chief Executive Officer Enrico Gaglioti Co - President In - house portfolio management & investment research expertise Private credit U.S. middle market companies Real estate Private commercial real estate debt Liquid Credit & Special Situations Event - driven & opportunistic investments, dislocated & special situations and private capital structure solutions Liquid alternatives Multi - strategy solution combining hedge funds & alternative beta strategies Global, multi - asset investing Family of mutual funds investing across global markets regardless of style, asset class, sector and market cap. Investment research Timely macroeconomic and cross - asset research, including education on alternative assets and strategies Cryptocurrency Bitcoin 2007 Year founded 15 Years of experience managing alternative assets $35 billion Assets under management 300+ Professionals Key facts 1 1. As of June 30, 2022 Troy Gayeski, CFA Chief Market Strategist Mike Kelly Co - President + Chief Investment Officer 12
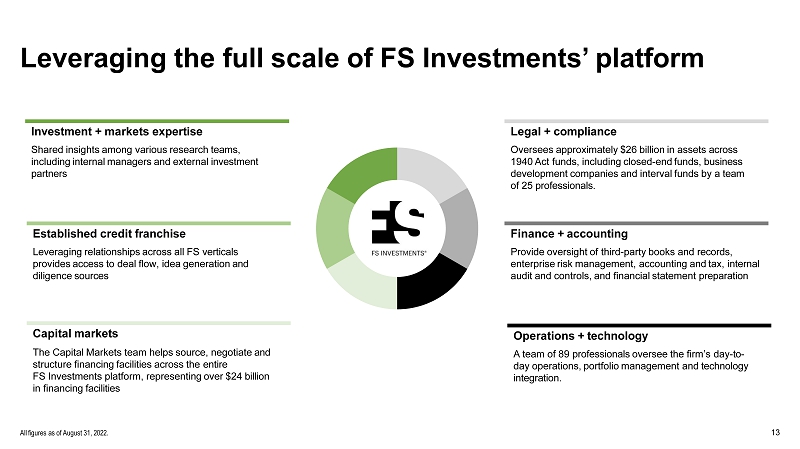
13 All figures as of August 31, 2022. Leveraging the full scale of FS Investments’ platform Investment + markets expertise Shared insights among various research teams, including internal managers and external investment partners Operations + technology A team of 89 professionals oversee the firm’s day - to - day operations, portfolio management and technology integration. Finance + accounting Provide oversight of third - party books and records, enterprise risk management, accounting and tax, internal audit and controls, and financial statement preparation Legal + compliance Oversees approximately $26 billion in assets across 1940 Act funds, including closed - end funds, business development companies and interval funds by a team of 25 professionals. Established credit franchise Leveraging relationships across all FS verticals provides access to deal flow, idea generation and diligence sources Capital markets The Capital Markets team helps source, negotiate and structure financing facilities across the entire FS Investments platform, representing over $24 billion in financing facilities
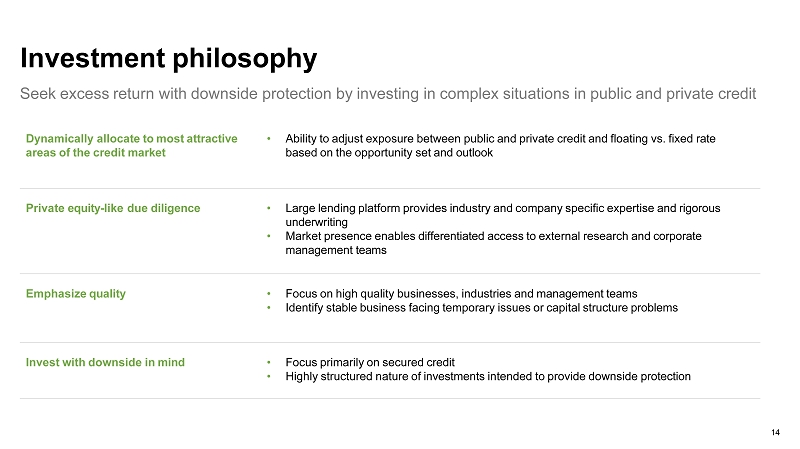
Seek excess return with downside protection by investing in complex situations in public and private credit Investment philosophy Dynamically allocate to most attractive areas of the credit market • Ability to adjust exposure between public and private credit and floating vs. fixed rate based on the opportunity set and outlook Private equity - like due diligence • Large lending platform provides industry and company specific expertise and rigorous underwriting • Market presence enables differentiated access to external research and corporate management teams Emphasize quality • Focus on high quality businesses, industries and management teams • Identify stable business facing temporary issues or capital structure problems Invest with downside in mind • Focus primarily on secured credit • Highly structured nature of investments intended to provide downside protection 14
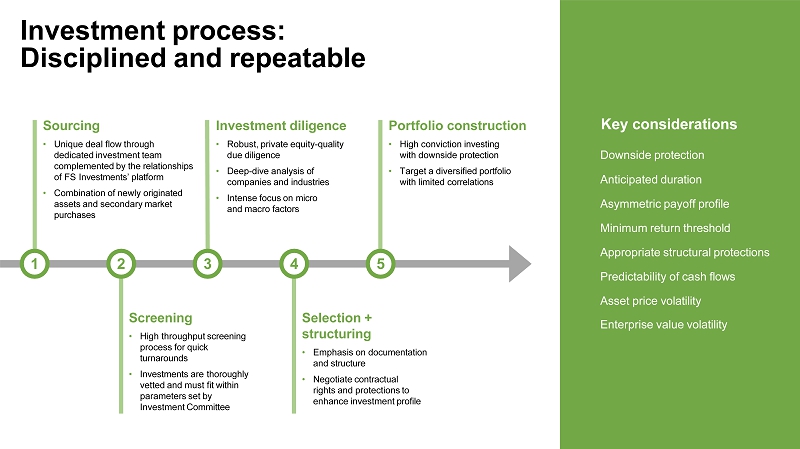
Investment process: Disciplined and repeatable 15 Key considerations Sourcing • Unique deal flow through dedicated investment team complemented by the relationships of FS Investments’ platform • Combination of newly originated assets and secondary market purchases Investment diligence • Robust, private equity - quality due diligence • Deep - dive analysis of companies and industries • Intense focus on micro and macro factors Screening • High throughput screening process for quick turnarounds • Investments are thoroughly vetted and must fit within parameters set by Investment Committee Selection + structuring • Emphasis on documentation and structure • Negotiate contractual rights and protections to enhance investment profile Portfolio construction • High conviction investing with downside protection • Target a diversified portfolio with limited correlations 1 2 3 4 5 Downside protection Anticipated duration Asymmetric payoff profile Minimum return threshold Appropriate structural protections Predictability of cash flows Asset price volatility Enterprise value volatility
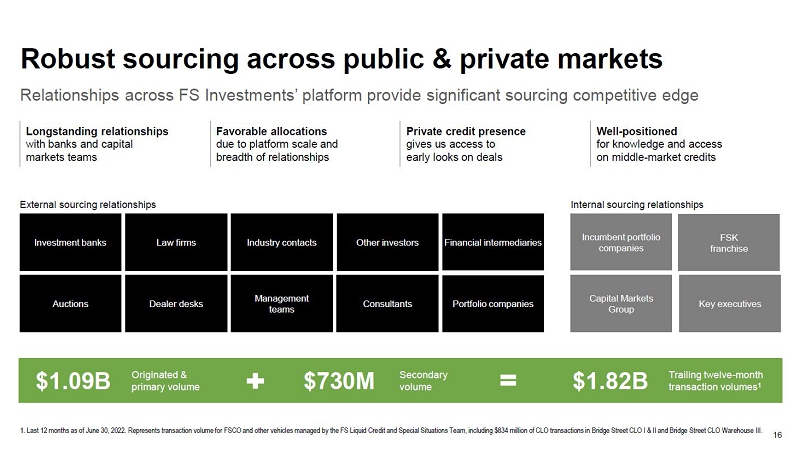
Relationships across FS Investments’ platform provide significant sourcing competitive edge 1. Last 12 months as of June 30, 2022. Represents transaction volume for FSCO and other vehicles managed by the FS Liquid Credit and Special Situations Team, including $834 million of CLO transactions in Bridge Street CLO I & II and Bridge Street CLO Warehouse III. Robust sourcing across public & private markets Longstanding relationships with banks and capital markets teams Favorable allocations due to platform scale and breadth of relationships Private credit presence gives us access to early looks on deals Well - positioned for knowledge and access on middle - market credits External sourcing relationships Internal sourcing relationships FSK franchise Key executives Incumbent portfolio companies Capital Markets Group Investment banks Law firms Industry contacts Other investors Financial intermediaries Auctions Dealer desks Management teams Consultants Portfolio companies 16 $1.09B Originated & primary volume $730M Secondary volume $1.82B Trailing twelve - month transaction volumes 1

17 Portfolio highlights & competitive positioning
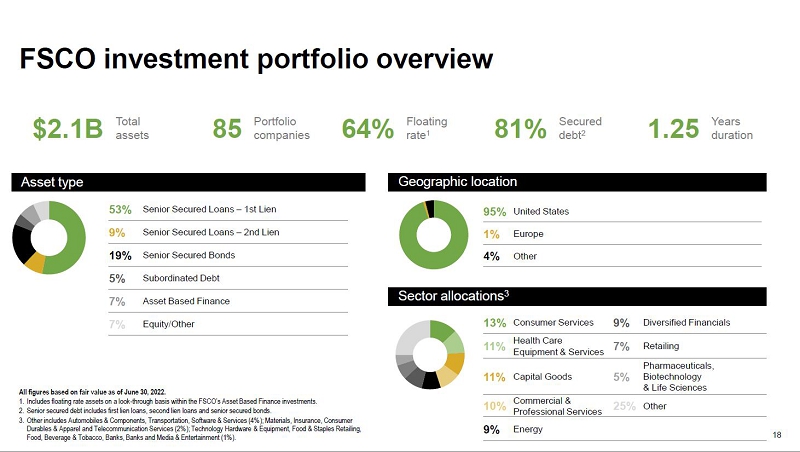
FSCO investment portfolio overview Asset type 53% Senior Secured Loans – 1st Lien 9% Senior Secured Loans – 2nd Lien 19% Senior Secured Bonds 5% Subordinated Debt 7% Asset Based Finance 7% Equity/Other Geographic location Sector allocations 3 95% United States 1% Europe 4% Other 13% Consumer Services 9% Diversified 11% Health Care Equipment & Services 7% Retailing 11% Capital Goods 5% Pharmaceuticals, Biotechnology & 10% Commercial & Professional Services 25% Other 9% Energy All figures based on fair value as of June 30, 2022. 1. Includes floating rate assets on a look - through basis within the FSCO’s Asset Based Finance investments. 2. Senior secured debt includes first lien loans, second lien loans and senior secured bonds. 3. Other includes Automobiles & Components, Transportation, Software & Services (4%); Materials, Insurance, Consumer Durables & Apparel and Telecommunication Services (2%); Technology Hardware & Equipment, Food & Staples Retailing, Food, Beverage & Tobacco, Banks, Banks and Media & Entertainment (1%). 18 $2.1B Total assets 85 Portfolio companies 64% Floating rate 1 81% Secured debt 2 1.25 Years duration
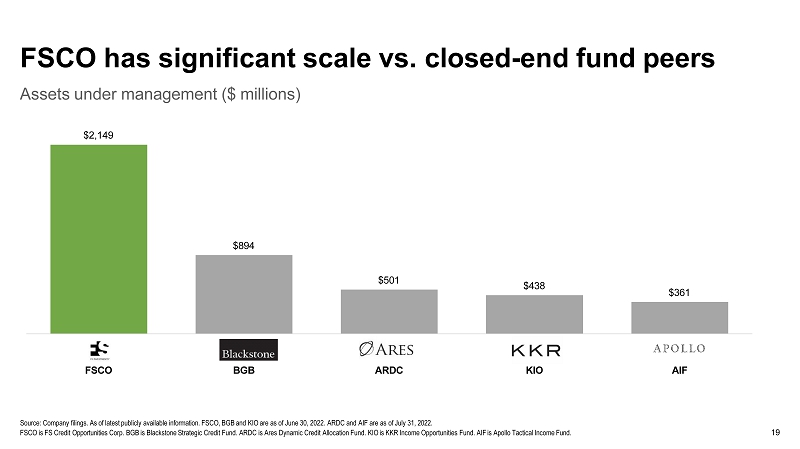
19 Assets under management ($ millions) Source: Company filings. As of latest publicly available information. FSCO, BGB and KIO are as of June 30, 2022. ARDC and AIF are as of July 31, 2022. FSCO is FS Credit Opportunities Corp. BGB is Blackstone Strategic Credit Fund. ARDC is Ares Dynamic Credit Allocation Fund. KIO is KKR Income Opportunities Fund. AIF is Apollo Tactical Income Fund. FSCO has significant scale vs. closed - end fund peers $2,149 $894 $501 $438 $361 FSCO BGB ARDC KIO AIF
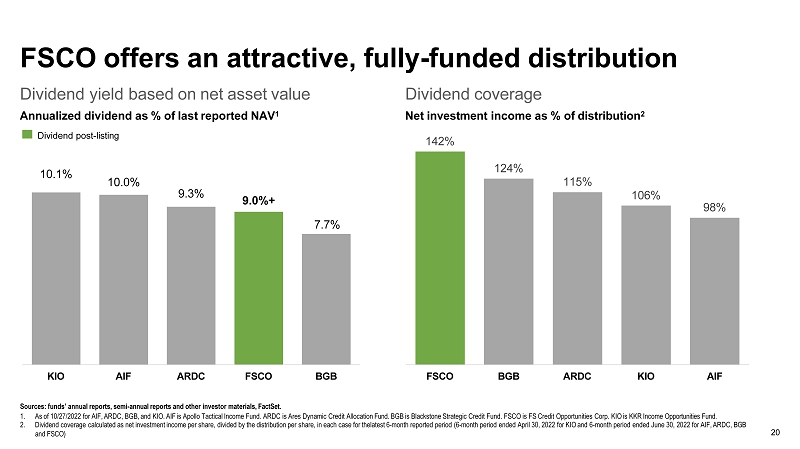
20 Dividend yield based on net asset value Annualized dividend as % of last reported NAV 1 Dividend post - listing Dividend coverage Net investment income as % of distribution 2 FSCO offers an attractive, fully - funded distribution 142% 124% 115% 106% 98% KIO AIF ARDC FSCO BGB FSCO BGB ARDC KIO AIF Sources: funds’ annual reports, semi - annual reports and other investor materials, FactSet. 1. As of 10/27/2022 for AIF, ARDC, BGB, and KIO. AIF is Apollo Tactical Income Fund. ARDC is Ares Dynamic Credit Allocation Fund. BGB is Blackstone Strategic Credit Fund. FSCO is FS Credit Opportunities Corp. KIO is KKR Income Opportunities Fund. 2. Dividend coverage calculated as net investment income per share, divided by the distribution per share, in each case for thelatest 6 - month reported period (6 - month period ended April 30, 2022 for KIO and 6 - month period ended June 30, 2022 for AIF, ARDC, BGB and FSCO) 10.1% 10.0% 9.3% 9.0%+ 7.7%
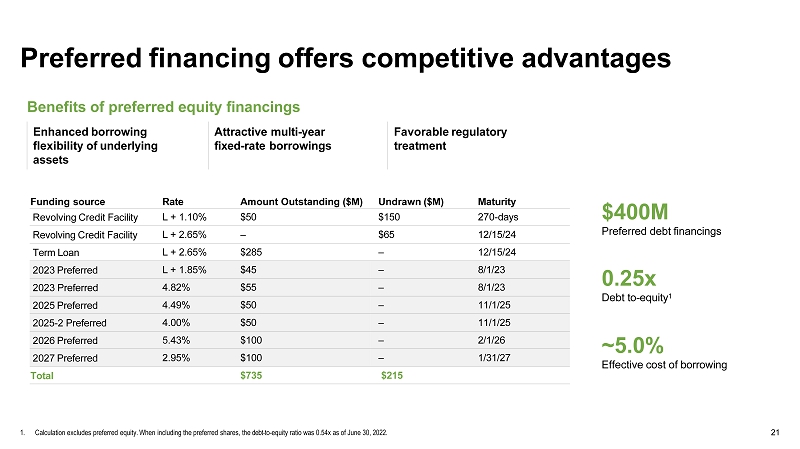
21 1. Calculation excludes preferred equity. When including the preferred shares, the debt - to - equity ratio was 0.54x as of June 30, 2022. Preferred financing offers competitive advantages Funding source Rate Amount Outstanding ($M) Undrawn ($M) Maturity Revolving Credit Facility L + 1.10% $50 $150 270 - days Revolving Credit Facility L + 2.65% – $65 12/15/24 Term Loan L + 2.65% $285 – 12/15/24 2023 Preferred L + 1.85% $45 – 8/1/23 2023 Preferred 4.82% $55 – 8/1/23 2025 Preferred 4.49% $50 – 11/1/25 2025 - 2 Preferred 4.00% $50 – 11/1/25 2026 Preferred 5.43% $100 – 2/1/26 2027 Preferred 2.95% $100 – 1/31/27 Total $735 $215 Benefits of preferred equity financings Enhanced borrowing flexibility of underlying assets Attractive multi - year fixed - rate borrowings Favorable regulatory treatment $400M Preferred debt financings 0.25x Debt to - equity 1 ~5.0% Effective cost of borrowing

22 Appendix
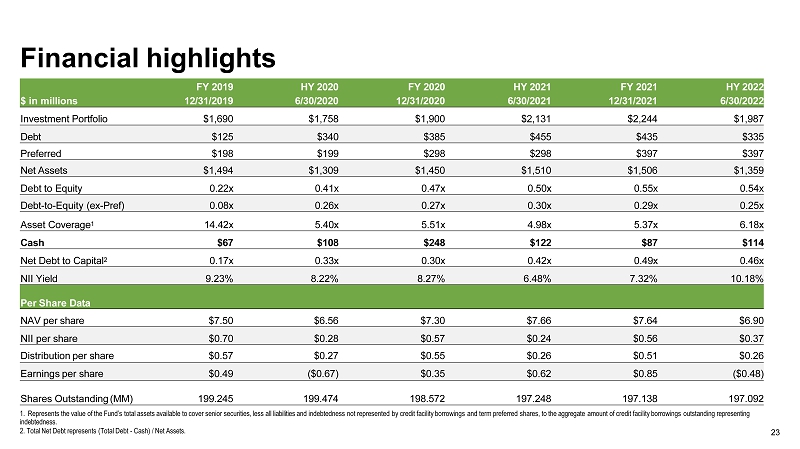
23 Financial highlights 1. Represents the value of the Fund’s total assets available to cover senior securities, less all liabilities and indebtedness not represented by credit facility borrowings and term preferred shares, to the aggregate amount of credit facility borrowings outstanding representing indebtedness. 2. Total Net Debt represents (Total Debt - Cash) / Net Assets. FY 2019 HY 2020 FY 2020 HY 2021 FY 2021 HY 2022 $ in millions 12/31/2019 6/30/2020 12/31/2020 6/30/2021 12/31/2021 6/30/2022 Investment Portfolio $1,690 $1,758 $1,900 $2,131 $2,244 $1,987 Debt $125 $340 $385 $455 $435 $335 Preferred $198 $199 $298 $298 $397 $397 Net Assets $1,494 $1,309 $1,450 $1,510 $1,506 $1,359 Debt to Equity 0.22x 0.41x 0.47x 0.50x 0.55x 0.54x Debt - to - Equity (ex - Pref) 0.08x 0.26x 0.27x 0.30x 0.29x 0.25x Asset Coverage 1 14.42x 5.40x 5.51x 4.98x 5.37x 6.18x Cash $67 $108 $248 $122 $87 $114 Net Debt to Capital 2 0.17x 0.33x 0.30x 0.42x 0.49x 0.46x NII Yield 9.23% 8.22% 8.27% 6.48% 7.32% 10.18% Per Share Data NAV per share $7.50 $6.56 $7.30 $7.66 $7.64 $6.90 NII per share $0.70 $0.28 $0.57 $0.24 $0.56 $0.37 Distribution per share $0.57 $0.27 $0.55 $0.26 $0.51 $0.26 Earnings per share $0.49 ($0.67) $0.35 $0.62 $0.85 ($0.48) Shares Outstanding (MM) 199.245 199.474 198.572 197.248 197.138 197.092

A phased approach to the listing 24 The timing of the listing is subject to market conditions and the satisfaction of other customary conditions. Designed to help ease downward pressure on FSCO’s market share price shortly after listing An additional 1/3 of all shares available for trading Day of Listing 90 days post - listing 1/3 of all shares available for trading Final 1/3 of all shares available for trading 180 days post - listing Accounts with balances of $15,000 or less will not be subject to the phased liquidity schedule and will have all shares available for trading on the day of the listing
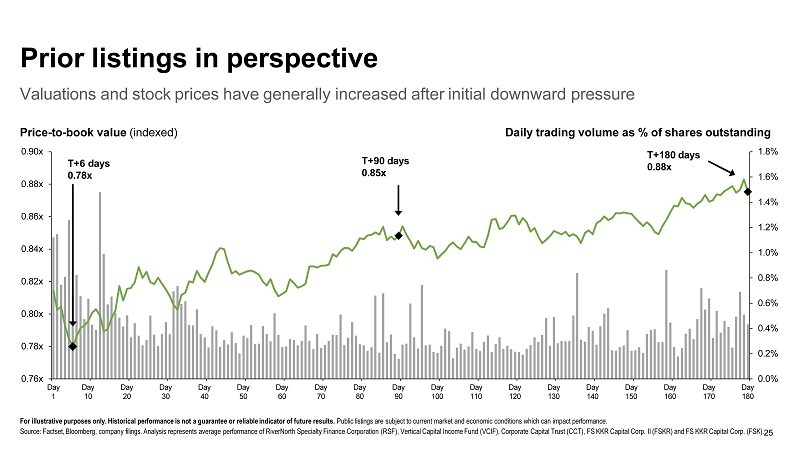
Valuations and stock prices have generally increased after initial downward pressure For illustrative purposes only. Historical performance is not a guarantee or reliable indicator of future results. Public listings are subject to current market and economic conditions which can impact performance. Source: Factset, Bloomberg, company filings. Analysis represents average performance of RiverNorth Specialty Finance Corporation (RSF), Vertical Capital Income Fund (VCIF), Corporate Capital Trust (CCT), FS KKR Capital Corp. II (FSKR) and FS KKR Capital Corp. (FSK). 25 Price - to - book value (indexed) Daily trading volume as % of shares outstanding Prior listings in perspective 0.0% 0.2% 0.4% 0.6% 0.8% 1.0% 1.2% 1.4% 1.6% 1.8% 0.76x 0.78x 0.80x 0.82x 0.84x 0.86x 0.88x 0.90x Day 1 Day 10 Day 20 Day 30 Day 40 Day 50 Day 60 Day 70 Day 80 Day 90 Day 100 Day 110 Day 120 Day 130 Day 140 Day 150 Day 160 Day 170 Day 180 T+6 days 0.78x T+90 days 0.85x T+180 days 0.88x
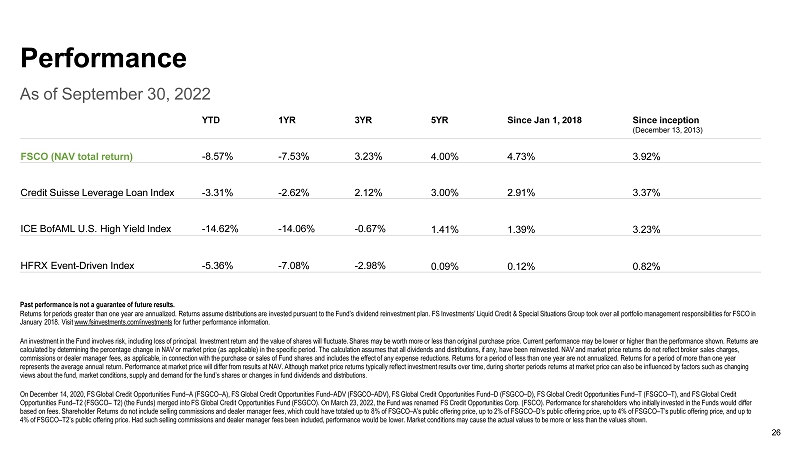
Past performance is not a guarantee of future results. Returns for periods greater than one year are annualized. Returns assume distributions are invested pursuant to the Fund’s dividend reinvestment plan. FS Investments’ Liquid Credit & Special Situations Group took over all portfolio management responsibilities for FSCO in January 2018. Visit www.fsinvestments.com/investments for further performance information. An investment in the Fund involves risk, including loss of principal. Investment return and the value of shares will fluctuate. Shares may be worth more or less than original purchase price. Current performance may be lower or higher than the performance shown. Returns are calculated by determining the percentage change in NAV or market price (as applicable) in the specific period. The calculation assumes that all dividends and distributions, if any, have been reinvested. NAV and market price returns do not reflect broker sales charges, commissions or dealer manager fees, as applicable, in connection with the purchase or sales of Fund shares and includes the effect of any expense reductions. Returns for a period of less than one year are not annualized. Returns for a period of more than one year represents the average annual return. Performance at market price will differ from results at NAV. Although market price returns typically reflect investment results over time, during shorter periods returns at market price can also be influenced by factors such as changing views about the fund, market conditions, supply and demand for the fund’s shares or changes in fund dividends and distributions. On December 14, 2020, FS Global Credit Opportunities Fund – A (FSGCO – A), FS Global Credit Opportunities Fund – ADV (FSGCO – ADV), FS Global Credit Opportunities Fund – D (FSGCO – D), FS Global Credit Opportunities Fund – T (FSGCO – T), and FS Global Credit Opportunities Fund – T2 (FSGCO – T2) (the Funds) merged into FS Global Credit Opportunities Fund (FSGCO). On March 23, 2022, the Fund was renamed FS Credit Opportunities Corp. (FSCO). Performance for shareholders who initially invested in the Funds would differ based on fees. Shareholder Returns do not include selling commissions and dealer manager fees, which could have totaled up to 8% of FSGCO – A’s public offering price, up to 2% of FSGCO – D’s public offering price, up to 4% of FSGCO – T’s public offering price, and up to 4% of FSGCO – T2’s public offering price. Had such selling commissions and dealer manager fees been included, performance would be lower. Market conditions may cause the actual values to be more or less than the values shown. 26 As of September 30, 2022 Performance YTD 1YR 3YR 5YR Since Jan 1, 2018 Since inception (December 13, 2013) FSCO (NAV total return) - 8.57% - 7.53% 3.23% 4.00% 4.73% 3.92% Credit Suisse Leverage Loan Index - 3.31% - 2.62% 2.12% 3.00% 2.91% 3.37% ICE BofAML U.S. High Yield Index - 14.62% - 14.06% - 0.67% 1.41% 1.39% 3.23% HFRX Event - Driven Index - 5.36% - 7.08% - 2.98% 0.09% 0.12% 0.82%