UNITED STATES
SECURITIES AND EXCHANGE COMMISSION
Washington, D.C. 20549
FORM N-CSR
CERTIFIED SHAREHOLDER REPORT OF REGISTERED
MANAGEMENT INVESTMENT COMPANIES
Investment Company Act file number 811-22800
IVY HIGH INCOME OPPORTUNITIES FUND
(Exact name of registrant as specified in charter)
6300 Lamar Avenue, Overland Park, Kansas 66202
(Address of principal executive offices) (Zip code)
Mara D. Herrington
6300 Lamar Avenue
Overland Park, Kansas 66202
(Name and address of agent for service)
Registrant’s telephone number, including area code: 913-236-2000
Date of fiscal year end: September 30
Date of reporting period: March 31, 2015
ITEM 1. REPORTS TO STOCKHOLDERS.
Semiannual Report
March 31, 2015
Ivy High Income Opportunities Fund
The Fund’s common shares are listed on the New York Stock Exchange and trade under the ticker symbol IVH
| | |
| |
The Fund is a non-diversified, closed-end management investment company designed primarily as a long-term investment and not as a trading vehicle. | |  |
Contents
Ivy High Income Opportunities Fund
PRESIDENT’S LETTER
Ivy High Income Opportunities Fund | MARCH 31, 2015 (UNAUDITED) |

Henry Hermann, CFA
Dear Shareholder,
Over the six months since our last report to you, we saw gradual improvement in the U.S. economy, modest declines in Europe, and slowing growth in Japan and China. Geopolitical tensions rose in the Middle East and Eastern Europe. Financial markets overall performed relatively well, albeit with intermittent volatility.
In fixed income markets, central bank policy and economic weakness drove already-low yields even lower. Central banks around the world took unprecedented measures to address growth concerns. Diving oil prices gave rise to concerns about deflation risk and possible energy-related defaults in the high-yield sector.
These issues have tested investors and added a level of complexity to the Federal Reserve’s (Fed’s) policy decisions. Fed officials have indicated the central bank would like to begin raising interest rates this year. However, the Fed has not previously faced an environment with negative interest rates in other parts of the world or the level of liquidity we now see in the system. The concern is that any rise in rates could negatively impact the financial markets and derail the recovery. These concerns already may have pushed a rate hike many expected to occur in the summer of 2015 into at least the fall, and possibly into 2016.
We will closely monitor not only the economic data that will contribute to the Fed’s interest rate decisions, but also the outside pressures that continue to influence the market over the months ahead. While challenges remain, we do see potential catalysts for growth in several areas and industries and our team continues to seek investment opportunities around the globe.
Economic Snapshot
| | | | | | | | |
| | | 3/31/15 | | | 9/30/14 | |
S&P 500 Index | | | 2,067.89 | | | | 1,972.29 | |
MSCI EAFE Index | | | 1.849.34 | | | | 1,846.08 | |
10-Year Treasury Yield | | | 1.94% | | | | 2.52% | |
U.S. unemployment rate | | | 5.50% | | | | 5.90% | |
30-year fixed mortgage rate | | | 3.70% | | | | 4.30% | |
Oil price per barrel | | $ | 47.60 | | | $ | 91.16 | |
Sources: Bloomberg, U.S. Department of Labor, MBA, CME
All government statistics shown are subject to periodic revision. The S&P 500 Index is an unmanaged index that tracks the stocks of 500 primarily large-cap U.S. companies. MSCI EAFE Index is an unmanaged index comprised of securities that represent the securities markets in Europe, Australasia and the Far East. It is not possible to invest directly in any of these indexes. Mortgage rates are from BankRate and reflect the overnight national average rate on a conventional 30-year fixed loan. Oil prices reflect the market price of West Texas intermediate grade crude.
Respectfully,

Henry J. Herrmann, CFA
President
The opinions expressed in this letter are those of the President of the Ivy Funds and are current only through the end of the period of the report, as stated on the cover. The President’s views are subject to change at any time, based on market and other conditions, and no forecasts can be guaranteed.
PORTFOLIO HIGHLIGHTS
Ivy High Income Opportunities Fund | ALL DATA IS AS OF MARCH 31, 2015 (UNAUDITED) |
| | | | |
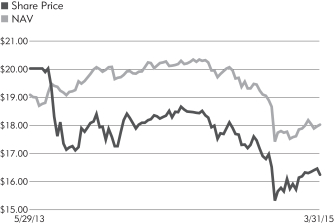
| Total Return(1) | | Share Price | | NAV |
6-month period ended 3-31-15 | | 1.09% | | 0.18% |
1-year period ended 3-31-15 | | -0.37% | | -0.10% |
Since commencement of fund operations (5-29-13) through 3-31-15 | | -0.95% | | 7.45% |
|
| Share Price/NAV Performance |
Commencement of operations (5-29-13) through 3-31-15 |
| | |
| Share Price/NAV | | |
Share Price | | $16.23 |
NAV | | $18.00 |
Discount to NAV(3) | | -9.83% |
Share Price Yield(4) | | 9.24% |
Structural Leverage Ratio(5) | | 31.09% |
Effective Leverage Ratio(6) | | 31.08% |
Asset Allocation (%‘s based on total investments)
| | | | |
Bonds | | | 97.3% | |
Corporate Debt Securities | | | 74.1% | |
Loans | | | 23.2% | |
Borrowings(2) | | | -32.1% | |
Cash Equivalents+ | | | 2.7% | |
Quality Weightings (%‘s based on total investments)
| | | | |
Non-Investment Grade | | | 97.3% | |
BB | | | 23.2% | |
B | | | 49.3% | |
CCC | | | 23.6% | |
Non-rated | | | 1.2% | |
Borrowings(2) | | | -32.1% | |
Cash Equivalents+ | | | 2.7% | |
Our preference is to always use ratings obtained from Standard & Poor’s. For securities not rated by Standard & Poor’s, ratings are obtained from Moody’s. We do not evaluate these ratings, but simply assign them to the appropriate credit quality category as determined by the rating agency.
| + | Cash equivalents are defined as highly liquid securities with maturities of less than three months. Cash equivalents may include U.S. Government Treasury bills, bank certificates of deposit, bankers’ acceptances, corporate commercial paper and other money market instruments. |
| (1) | Past performance is not necessarily indicative of future performance. Total return is calculated by determining the percentage change in NAV or share price (as applicable) in the specified period. The calculation assumes that all dividends and distributions, if any, have been reinvested. Performance at share price will differ from results at NAV. Returns at share price can be influenced by factors such as changing views about the Fund, market conditions, supply and demand for the Fund’s stock, or changes in the Fund’s dividends. An investment in the Fund involves risk, including the loss of principal. Total return, share price, share price yield and NAV will fluctuate with changes in market conditions. This data is provided for information purposes only and is not intended for trading purposes. Closed-end funds, unlike open-end funds, are not continuously offered. There is a one time public offering and, once issued, shares of closed-end funds are traded in the open market through a stock exchange. NAV is equal to total assets less total liabilities divided by the total number of shares outstanding. Holdings are subject to change daily. |
| (2) | The Fund has entered into a borrowing arrangement with Pershing LLC as a means of financial leverage. See Note 7 in the Notes to Financial Statements for additional information. |
| (3) | The premium/discount is calculated as (most recent share price/most recent NAV) -1. |
| (4) | Share price yield is determined by dividing the annualized current monthly dividend per share (comprised of net investment income) by the share price per share at March 31, 2015. |
| (5) | Structural leverage consists of borrowings outstanding as a percentage of managed assets. Managed assets are the Fund’s total assets, including the assets attributable to the proceeds from any borrowings, minus liabilities other than the aggregate indebtedness entered into for the purpose of leverage. |
| (6) | The Fund’s effective leverage ratio includes both structural leverage and the leveraging effects of certain derivative instruments in the Fund’s portfolio (referred to as “portfolio leverage”), expressed as a percentage of managed assets. Portfolio leverage from the Fund’s use of forward foreign currency contracts is included in the Fund’s effective leverage values. |
SCHEDULE OF INVESTMENTS
Ivy High Income Opportunities Fund (in thousands) | MARCH 31, 2015 (UNAUDITED) |
| | | | | | | | |
CORPORATE DEBT
SECURITIES | | Principal | | | Value | |
Consumer Discretionary | |
| |
Advertising – 0.7% | |
Acosta, Inc., | | | | | | | | |
7.750%, 10-1-22(A) | | $ | 200 | | | $ | 207 | |
Lamar Media Corp., | | | | | | | | |
5.375%, 1-15-24(B) | | | 977 | | | | 1,018 | |
Outfront Media Capital LLC and Outfront Media Capital Corp.: | | | | | | | | |
5.250%, 2-15-22 | | | 481 | | | | 504 | |
5.625%, 2-15-24 | | | 350 | | | | 367 | |
5.625%, 2-15-24(A) | | | 37 | | | | 39 | |
| | | | | | | | |
| | | | | | | 2,135 | |
| | | | | | | | |
| |
Apparel Retail – 1.1% | |
Chinos Intermediate Holdings A, Inc., | | | | | | | | |
7.750%,
5-1-19(A)(C) | | | 276 | | | | 242 | |
Gymboree Corp. (The), | | | | | | | | |
9.125%, 12-1-18 | | | 488 | | | | 229 | |
Hot Topic, Inc., | | | | | | | | |
9.250%,
6-15-21(A)(B) | | | 976 | | | | 1,057 | |
Nine West Holdings, Inc., | | | | | | | | |
8.250%, 3-15-19(A) | | | 2,110 | | | | 1,751 | |
| | | | | | | | |
| | | | | | | 3,279 | |
| | | | | | | | |
| |
Auto Parts & Equipment – 1.1% | |
IDQ Holdings, Inc., | | | | | | | | |
11.500%,
4-1-17(A)(B) | | | 132 | | | | 139 | |
Schaeffler Finance B.V., | | | | | | | | |
4.250%,
5-15-21(A)(B) | | | 686 | | | | 682 | |
Schaeffler Holding Finance B.V., | | | | | | | | |
6.875%,
8-15-18
(A)(C)(D) | | | EUR 2,275 | | | | 2,557 | |
| | | | | | | | |
| | | | | | | 3,378 | |
| | | | | | | | |
| |
Automobile Manufacturers – 0.5% | |
Group 1 Automotive, Inc., | | | | | | | | |
5.000%,
6-1-22(A)(B) | | $ | 570 | | | | 571 | |
Navistar International Corp., | | | | | | | | |
8.250%, 11-1-21(B) | | | 947 | | | | 921 | |
| | | | | | | | |
| | | | | | | 1,492 | |
| | | | | | | | |
| |
Automotive Retail – 0.3% | |
Sonic Automotive, Inc., | | | | | | | | |
5.000%, 5-15-23(B) | | | 919 | | | | 910 | |
| | | | | | | | |
| |
Broadcasting – 5.7% | |
Clear Channel Communications, Inc., | | | | | | | | |
10.000%, 1-15-18 | | | 2,255 | | | | 1,917 | |
Clear Channel Worldwide Holdings, Inc., Series A, | | | | | | | | |
7.625%, 3-15-20(B) | | | 119 | | | | 123 | |
Clear Channel Worldwide Holdings, Inc., Series B, | | | | | | | | |
7.625%, 3-15-20(B) | | | 10,000 | | | | 10,525 | |
Cumulus Media, Inc., | | | | | | | | |
7.750%, 5-1-19(B) | | | 4,500 | | | | 4,410 | |
| | | | | | | | |
| | | | | | | 16,975 | |
| | | | | | | | |
| |
Cable & Satellite – 18.9% | |
Altice Financing S.A., | | | | | | | | |
6.625%, 2-15-23(A) | | | 367 | | | | 378 | |
| | | | | | | | |
CORPORATE DEBT
SECURITIES
(Continued) | | Principal | | | Value | |
Cable & Satellite (Continued) | |
Altice S.A.: | | | | | | | | |
7.250%,
5-15-22(A)(D) | | EUR | 152 | | | $ | 170 | |
7.750%,
5-15-22(A)(B) | | $ | 7,502 | | | | 7,633 | |
6.250%,
2-15-25(A)(D) | | EUR | 184 | | | | 198 | |
7.625%, 2-15-25(A) | | $ | 11,190 | | | | 11,211 | |
Cablevision Systems Corp., | | | | | | | | |
5.875%, 9-15-22(B) | | | 10,000 | | | | 10,475 | |
CCO Holdings LLC and CCO Holdings Capital Corp.: | | | | | | | | |
5.250%, 3-15-21(B) | | | 206 | | | | 211 | |
5.250%, 9-30-22(B) | | | 276 | | | | 282 | |
5.125%, 2-15-23(B) | | | 276 | | | | 279 | |
5.750%, 9-1-23(B) | | | 69 | | | | 72 | |
5.750%, 1-15-24(B) | | | 276 | | | | 288 | |
CCOH Safari LLC: | | | | | | | | |
5.500%, 12-1-22(B) | | | 1,030 | | | | 1,053 | |
5.750%, 12-1-24(B) | | | 1,546 | | | | 1,592 | |
Columbus International, Inc., | | | | | | | | |
7.375%, 3-30-21(A) | | | 268 | | | | 282 | |
DISH DBS Corp.: | | | | | | | | |
6.750%, 6-1-21(B) | | | 7,500 | | | | 7,988 | |
5.875%, 7-15-22(B) | | | 2,000 | | | | 2,033 | |
5.000%, 3-15-23 | | | 250 | | | | 243 | |
Sirius XM Radio, Inc.: | | | | | | | | |
5.875%,
10-1-20(A)(B) | | | 905 | | | | 944 | |
5.750%,
8-1-21(A)(B) | | | 2,513 | | | | 2,615 | |
4.625%,
5-15-23(A)(B) | | | 4,586 | | | | 4,414 | |
VTR Finance B.V., | | | | | | | | |
6.875%,
1-15-24(A)(B) | | | 3,584 | | | | 3,718 | |
Wave Holdco LLC and Wave Holdco Corp., | | | | | | | | |
8.250%,
7-15-19(A)(C) | | | 299 | | | | 306 | |
| | | | | | | | |
| | | | | | | 56,385 | |
| | | | | | | | |
| |
Casinos & Gaming – 1.6% | |
Gateway Casinos & Entertainment Ltd., | | | | | | | | |
8.500%,
11-26-20(A)(D) | | CAD | 904 | | | | 722 | |
MCE Finance Ltd., | | | | | | | | |
5.000%,
2-15-21(A)(B) | | $ | 2,390 | | | | 2,235 | |
Wynn Macau Ltd., | | | | | | | | |
5.250%,
10-15-21(A)(B) | | | 1,931 | | | | 1,830 | |
| | | | | | | | |
| | | | | | | 4,787 | |
| | | | | | | | |
| |
Catalog Retail – 0.1% | |
Argos Merger Sub, Inc., | | | | | | | | |
7.125%, 3-15-23(A) | | | 220 | | | | 228 | |
| | | | | | | | |
| |
Distributors – 0.9% | |
Pinnacle Operating Corp., | | | | | | | | |
9.000%, 11-15-20(A) | | | 2,618 | | | | 2,644 | |
| | | | | | | | |
| |
Movies & Entertainment – 1.3% | |
AMC Entertainment, Inc., | | | | | | | | |
5.875%, 2-15-22(B) | | | 250 | | | | 259 | |
Cinemark USA, Inc.: | | | | | | | | |
5.125%, 12-15-22(B) | | | 533 | | | | 541 | |
4.875%, 6-1-23(B) | | | 1,651 | | | | 1,643 | |
WMG Acquisition Corp.: | | | | | | | | |
5.625%,
4-15-22(A)(B) | | | 161 | | | | 161 | |
6.750%, 4-15-22(A) | | | 1,188 | | | | 1,126 | |
| | | | | | | | |
| | | | | | | 3,730 | |
| | | | | | | | |
| | | | | | | | |
CORPORATE DEBT
SECURITIES
(Continued) | | Principal | | | Value | |
Specialized Consumer Services – 3.8% | |
AA Bond Co. Ltd., | | | | | | | | |
9.500%,
7-31-19(A)(D) | | GBP | 656 | | | $ | 1,078 | |
B-Corp Merger Sub, Inc., | | | | | | | | |
8.250%, 6-1-19 | | $ | 4,500 | | | | 3,904 | |
Carlson Travel Holdings, | | | | | | | | |
7.500%,
8-15-19(A)(C) | | | 800 | | | | 810 | |
Carlson Wagonlit B.V., | | | | | | | | |
6.875%,
6-15-19(A)(B) | | | 107 | | | | 112 | |
Lansing Trade Group, | | | | | | | | |
9.250%,
2-15-19(A)(B) | | | 1,170 | | | | 1,161 | |
Nielsen Finance, | | | | | | | | |
5.500%,
10-1-21(A)(B) | | | 1,396 | | | | 1,441 | |
Nielsen Finance LLC and Nielsen Finance Co., | | | | | | | | |
5.000%,
4-15-22(A)(B) | | | 2,677 | | | | 2,694 | |
| | | | | | | | |
| | | | | | | 11,200 | |
| | | | | | | | |
| |
Specialty Stores – 1.3% | |
Jo-Ann Stores Holdings, Inc., | | | | | | | | |
9.750%,
10-15-19
(A)(C) | | | 1,046 | | | | 1,015 | |
Jo-Ann Stores, Inc., | | | | | | | | |
8.125%,
3-15-19(A) | | | 81 | | | | 81 | |
New Academy Finance Co. LLC, | | | | | | | | |
8.000%,
6-15-18(A)(C) | | | 2,000 | | | | 2,000 | |
PC Nextco Holdings LLC and PC Nextco Finance, Inc., | | | | | | | | |
8.750%,
8-15-19(C) | | | 826 | | | | 841 | |
| | | | | | | | |
| | | | | | | 3,937 | |
| | | | | | | | |
| |
Total Consumer Discretionary – 37.3% | | | | 111,080 | |
Consumer Staples | |
| |
Agricultural Products – 1.8% | |
American Seafoods Group LLC, | | | | | | | | |
10.750%,
5-15-16(A)(B) | | | 5,787 | | | | 5,425 | |
| | | | | | | | |
| |
Food Distributors – 0.3% | |
Simmons Foods, Inc., | | | | | | | | |
7.875%,
10-1-21(A) | | | 1,000 | | | | 988 | |
| | | | | | | | |
| |
Packaged Foods & Meats – 1.0% | |
JBS USA LLC and JBS USA Finance, Inc., | | | | | | | | |
5.875%,
7-15-24(A)(B) | | | 2,496 | | | | 2,527 | |
Post Holdings, Inc., | | | | | | | | |
7.375%, 2-15-22(B) | | | 515 | | | | 533 | |
| | | | | | | | |
| | | | | | | 3,060 | |
| | | | | | | | |
| |
Tobacco – 0.6% | |
Prestige Brands, Inc., | | | | | | | | |
5.375%,
12-15-21(A) | | | 1,630 | | | | 1,653 | |
| | | | | | | | |
| |
Total Consumer Staples – 3.7% | | | | 11,126 | |
Energy | |
| |
Coal & Consumable Fuels – 0.8% | |
Foresight Energy LLC and Foresight Energy Finance Corp., | | | | | | | | |
7.875%,
8-15-21(A) | | | 2,427 | | | | 2,421 | |
| | | | | | | | |
SCHEDULE OF INVESTMENTS
Ivy High Income Opportunities Fund (in thousands) | MARCH 31, 2015 (UNAUDITED) |
| | | | | | | | |
CORPORATE DEBT
SECURITIES (Continued) | | Principal | | | Value | |
Oil & Gas Drilling – 0.2% | |
KCA DEUTAG UK Finance plc, | | | | | | | | |
7.250%, 5-15-21(A)(B) | | $ | 617 | | | $ | 488 | |
| | | | | | | | |
| |
Oil & Gas Equipment & Services – 0.0% | |
Seventy Seven Energy, Inc., | | | | | | | | |
6.500%, 7-15-22(B) | | | 360 | | | | 167 | |
| | | | | | | | |
| |
Oil & Gas Exploration & Production – 2.7% | |
California Resources Corp., | | | | | | | | |
6.000%, 11-15-24(A) | | | 6,440 | | | | 5,643 | |
Chesapeake Energy Corp.: | | | | | | | | |
3.503%, 4-15-19(B)(E) | | | 338 | | | | 325 | |
4.875%, 4-15-22(B) | | | 614 | | | | 576 | |
Crownrock L.P., | | | | | | | | |
7.750%, 2-15-23(A) | | | 257 | | | | 260 | |
Parsley Energy LLC and Parsely Finance Corp., | | | | | | | | |
7.500%, 2-15-22(A) | | | 437 | | | | 441 | |
Rice Energy, Inc., | | | | | | | | |
7.250%, 5-1-23(A) | | | 411 | | | | 411 | |
Whiting Petroleum Corp., | | | | | | | | |
5.750%, 3-15-21 | | | 293 | | | | 291 | |
| | | | | | | | |
| | | | | | | 7,947 | |
| | | | | | | | |
| |
Oil & Gas Refining & Marketing – 3.2% | |
Offshore Drilling Holding S.A., | | | | | | | | |
8.375%, 9-20-20(A)(E) | | | 2,874 | | | | 2,302 | |
Offshore Group Investment Ltd., | | | | | | | | |
7.500%, 11-1-19(B) | | | 2,006 | | | | 1,143 | |
Shelf Drilling Holdings Ltd., | | | | | | | | |
8.625%, 11-1-18(A)(B) | | | 7,608 | | | | 6,220 | |
| | | | | | | | |
| | | | | | | 9,665 | |
| | | | | | | | |
| | |
Total Energy – 6.9% | | | | | | | 20,688 | |
Financials | |
| |
Consumer Finance – 2.2% | |
Creditcorp, | | | | | | | | |
12.000%, 7-15-18(A)(B) | | | 5,248 | | | | 4,671 | |
Speedy Cash Intermediate Holdings Corp., | | | | | | | | |
10.750%, 5-15-18(A) | | | 2,033 | | | | 1,977 | |
| | | | | | | | |
| | | | | | | 6,648 | |
| | | | | | | | |
| |
Diversified Capital Markets – 0.8% | |
Patriot Merger Corp., | | | | | | | | |
9.000%, 7-15-21(A) | | | 2,327 | | | | 2,379 | |
| | | | | | | | |
| |
Other Diversified Financial Services – 1.9% | |
AAF Holdings LLC and AAF Finance Co., | | | | | | | | |
12.000%, 7-1-19(A)(C) | | | 925 | | | | 869 | |
Abengoa Finance SAU, | | | | | | | | |
7.750%, 2-1-20(A)(B) | | | 2,813 | | | | 2,701 | |
Balboa Merger Sub, Inc., | | | | | | | | |
11.375%, 12-1-21(A) | | | 237 | | | | 240 | |
Greektown Holdings LLC and Greektown Mothership Corp., | | | | | | | | |
8.875%, 3-15-19(A)(B) | | | 1,625 | | | | 1,714 | |
New Cotai LLC and New Cotai Capital Corp., | | | | | | | | |
10.625%, 5-1-19(A)(B)(C) | | | 263 | | | | 262 | |
| | | | | | | | |
| | | | | | | 5,786 | |
| | | | | | | | |
| | | | | | | | |
CORPORATE DEBT
SECURITIES (Continued) | | Principal | | | Value | |
Property & Casualty Insurance – 0.5% | |
Hub International Ltd., | | | | | | | | |
7.875%, 10-1-21(A) | | $ | 1,300 | | | $ | 1,332 | |
| | | | | | | | |
| |
Real Estate Development – 0.3% | |
Hub Holdings LLC and Hub Holdings Finance, Inc., | | | | | | | | |
8.125%, 7-15-19(A)(C) | | | 970 | | | | 963 | |
| | | | | | | | |
| |
Real Estate Services – 1.2% | |
Stearns Holdings, Inc., | | | | | | | | |
9.375%, 8-15-20(A)(B) | | | 3,571 | | | | 3,517 | |
| | | | | | | | |
| |
Specialized Finance – 3.0% | |
Consolidated Communications Finance II Co., | | | | | | | | |
6.500%, 10-1-22(A) | | | 812 | | | | 822 | |
Flexi-Van Leasing, Inc., | | | | | | | | |
7.875%, 8-15-18(A)(B) | | | 5,208 | | | | 5,286 | |
TMX Finance LLC and TitleMax Finance Corp., | | | | | | | | |
8.500%, 9-15-18(A)(B) | | | 3,985 | | | | 2,830 | |
| | | | | | | | |
| | | | | | | 8,938 | |
| | | | | | | | |
| |
Specialized REITs – 2.2% | |
Aircastle Ltd.: | | | | | | | | |
5.125%, 3-15-21 | | | 1,719 | | | | 1,796 | |
5.500%, 2-15-22 | | | 803 | | | | 854 | |
CNL Lifestyles Properties, Inc., | | | | | | | | |
7.250%, 4-15-19(B) | | | 3,669 | | | | 3,743 | |
| | | | | | | | |
| | | | | | | 6,393 | |
| | | | | | | | |
Thrifts & Mortgage Finance – 2.4% | |
Provident Funding Associates L.P. and PFG Finance Corp., | | | | | | | | |
6.750%, 6-15-21(A)(B) | | | 7,500 | | | | 7,144 | |
| | | | | | | | |
| | |
Total Financials – 14.5% | | | | | | | 43,100 | |
Health Care | |
| |
Health Care Equipment – 0.2% | |
Mallinckrodt International Finance S.A. and Mallinckrodt CB LLC, | | | | | | | | |
5.750%, 8-1-22(A)(B) | | | 687 | | | | 709 | |
| | | | | | | | |
| |
Health Care Facilities – 3.8% | |
Acadia Healthcare Co., Inc., | | | | | | | | |
5.625%, 2-15-23(A) | | | 149 | | | | 152 | |
AmSurg Corp., | | | | | | | | |
5.625%, 11-30-20(B) | | | 485 | | | | 495 | |
AmSurg Escrow Corp., | | | | | | | | |
5.625%, 7-15-22 | | | 751 | | | | 768 | |
Capsugel S.A., | | | | | | | | |
7.000%, 5-15-19(A)(C) | | | 991 | | | | 1,007 | |
Catamaran Corp., | | | | | | | | |
4.750%, 3-15-21 | | | 545 | | | | 606 | |
ConvaTec Finance International S.A., | | | | | | | | |
8.250%, 1-15-19(A)(C) | | | 1,236 | | | | 1,251 | |
FWCT-2 Escrow Corp., | | | | | | | | |
6.875%, 2-1-22(B) | | | 1,229 | | | | 1,307 | |
| | | | | | | | |
CORPORATE DEBT
SECURITIES (Continued) | | Principal | | | Value | |
Health Care Facilities (Continued) | |
Tenet Healthcare Corp.: | | | | | | | | |
6.000%, 10-1-20(B) | | $ | 1,042 | | | $ | 1,103 | |
8.125%, 4-1-22(B) | | | 4,337 | | | | 4,781 | |
| | | | | | | | |
| | | | | | | 11,470 | |
| | | | | | | | |
| |
Health Care Services – 1.8% | |
MedImpact Holdings, Inc., | | | | | | | | |
10.500%, 2-1-18(A)(B) | | | 5,000 | | | | 5,263 | |
| | | | | | | | |
| |
Pharmaceuticals – 1.1% | |
Salix Pharmaceuticals Ltd., | | | | | | | | |
6.500%,
1-15-21(A)(B)(E) | | | 1,182 | | | | 1,311 | |
VRX Escrow Corp.: | | | | | | | | |
5.375%, 3-15-20(A) | | | 736 | | | | 743 | |
5.875%, 5-15-23(A) | | | 736 | | | | 755 | |
6.125%, 4-15-25(A) | | | 368 | | | | 381 | |
| | | | | | | | |
| | | | | | | 3,190 | |
| | | | | | | | |
| | |
Total Health Care – 6.9% | | | | | | | 20,632 | |
Industrials | |
| |
Aerospace & Defense – 1.8% | |
Silver II Borrower SCA and Silver II U.S. Holdings, | | | | | | | | |
7.750%, 12-15-20(A)(B) | | | 6,000 | | | | 5,355 | |
| | | | | | | | |
| |
Air Freight & Logistics – 0.4% | |
TRAC Intermodal LLC and TRAC Intermodal Corp., | | | | | | | | |
11.000%, 8-15-19(B) | | | 979 | | | | 1,072 | |
| | | | | | | | |
| |
Building Products – 1.6% | |
CPG Merger Sub LLC, | | | | | | | | |
8.000%, 10-1-21(A) | | | 1,311 | | | | 1,331 | |
Ply Gem Industries, Inc., | | | | | | | | |
6.500%, 2-1-22 | | | 2,018 | | | | 1,950 | |
Roofing Supply Group LLC and Roofing Supply Finance, Inc., | | | | | | | | |
10.000%, 6-1-20(A) | | | 1,274 | | | | 1,245 | |
USG Corp., | | | | | | | | |
5.500%, 3-1-25(A) | | | 366 | | | | 373 | |
| | | | | | | | |
| | | | | | | 4,899 | |
| | | | | | | | |
| |
Diversified Support Services – 3.9% | |
Algeco Scotsman Global Finance plc, | | | | | | | | |
8.500%, 10-15-18(A)(B) | | | 10,575 | | | | 10,482 | |
Nexeo Solutions LLC, | | | | | | | | |
8.375%, 3-1-18 | | | 1,331 | | | | 1,188 | |
| | | | | | | | |
| | | | | | | 11,670 | |
| | | | | | | | |
| |
Environmental & Facilities Services – 0.5% | |
GFL Environmental, Inc., | | | | | | | | |
7.875%, 4-1-20(A) | | | 1,468 | | | | 1,483 | |
| | | | | | | | |
| |
Railroads – 0.7% | |
Florida East Coast Holdings Corp. and Florida East Coast Industries LLC: | | | | | | | | |
6.750%, 5-1-19(A) | | | 1,462 | | | | 1,473 | |
9.750%, 5-1-20(A) | | | 607 | | | | 590 | |
| | | | | | | | |
| | | | | | | 2,063 | |
| | | | | | | | |
| |
Total Industrials – 8.9% | | | | 26,542 | |
SCHEDULE OF INVESTMENTS
Ivy High Income Opportunities Fund (in thousands) | MARCH 31, 2015 (UNAUDITED) |
| | | | | | | | |
CORPORATE DEBT
SECURITIES (Continued) | | Principal | | | Value | |
Information Technology | |
| |
Communications Equipment – 1.4% | |
Eagle Midco, Inc., | | | | | | | | |
9.000%, 6-15-18(A)(C) | | $ | 4,000 | | | $ | 4,075 | |
| | | | | | | | |
| |
Data Processing & Outsourced Services – 0.6% | |
Alliance Data Systems Corp., | | | | | | | | |
5.375%, 8-1-22(A) | | | 1,853 | | | | 1,848 | |
| | | | | | | | |
| |
Electronic Manufacturing Services – 0.5% | |
KEMET Corp., | | | | | | | | |
10.500%, 5-1-18 | | | 1,440 | | | | 1,472 | |
| | | | | | | | |
| |
IT Consulting & Other Services – 1.2% | |
iGATE Corp., | | | | | | | | |
4.750%, 4-15-19(B) | | | 1,167 | | | | 1,175 | |
NCR Escrow Corp.: | | | | | | | | |
5.875%, 12-15-21(B) | | | 1,154 | | | | 1,203 | |
6.375%, 12-15-23(B) | | | 1,233 | | | | 1,313 | |
| | | | | | | | |
| | | | | | | 3,691 | �� |
| | | | | | | | |
| |
Semiconductors – 1.2% | |
Micron Technology, Inc.: | | | | | | | | |
5.875%, 2-15-22(B) | | | 1,798 | | | | 1,898 | |
5.500%, 2-1-25(A)(B) | | | 1,577 | | | | 1,589 | |
| | | | | | | | |
| | | | | | | 3,487 | |
| | | | | | | | |
| |
Technology Distributors – 0.0% | |
Sophia L.P. and Sophia Finance, Inc., | | | | | | | | |
9.625%, 12-1-18(A)(C) | | | 107 | | | | 108 | |
| | | | | | | | |
| |
Total Information Technology – 4.9% | | | | 14,681 | |
Materials | |
| |
Aluminum – 1.4% | |
Constellium N.V.: | | | | | | | | |
8.000%, 1-15-23(A) | | | 1,892 | | | | 1,982 | |
5.750%, 5-15-24(A)(B) | | | 260 | | | | 246 | |
Wise Metals Intermediate Holdings, | | | | | | | | |
9.750%, 6-15-19(A)(C) | | | 1,774 | | | | 1,918 | |
| | | | | | | | |
| | | | | | | 4,146 | |
| | | | | | | | |
| |
Construction Materials – 0.4% | |
Hillman Group, Inc. (The), | | | | | | | | |
6.375%, 7-15-22(A) | | | 1,220 | | | | 1,220 | |
| | | | | | | | |
| |
Diversified Metals & Mining – 3.8% | |
Artsonig Pty Ltd., | | | | | | | | |
11.500%, 4-1-19(A)(C) | | | 2,046 | | | | 1,698 | |
Compass Minerals International, Inc., | | | | | | | | |
4.875%, 7-15-24(A)(B) | | | 530 | | | | 531 | |
Crystal Merger Sub, Inc., | | | | | | | | |
7.625%,
10-15-21(A)(B) | | | 391 | | | | 391 | |
FMG Resources Pty Ltd.: | | | | | | | | |
6.875%, 2-1-18(A) | | | 81 | | | | 80 | |
8.250%, 11-1-19(A) | | | 2,350 | | | | 1,986 | |
6.875%, 4-1-22(A)(B) | | | 7,238 | | | | 5,347 | |
Lundin Mining Corp.: | | | | | | | | |
7.500%, 11-1-20(A)(B) | | | 715 | | | | 747 | |
7.875%, 11-1-22(A) | | | 584 | | | | 609 | |
| | | | | | | | |
| | | | | | | 11,389 | |
| | | | | | | | |
| | | | | | | | |
CORPORATE DEBT
SECURITIES (Continued) | | Principal | | | Value | |
Metal & Glass Containers – 1.1% | |
Ardagh Finance Holdings, | | | | | | | | |
8.625%, 6-15-19(A)(C) | | $ | 1,443 | | | $ | 1,503 | |
Ardagh Packaging Finance plc and Ardagh Holdings USA, Inc., | | | | | | | | |
6.000%, 6-30-21(A)(B) | | | 200 | | | | 197 | |
Consolidated Container Co. LLC and Consolidated Container Capital, Inc., | | | | | | | | |
10.125%, 7-15-20(A) | | | 1,812 | | | | 1,576 | |
| | | | | | | | |
| | | | | | | 3,276 | |
| | | | | | | | |
| |
Precious Metals & Minerals – 1.0% | |
Prince Mineral Holding Corp., | | | | | | | | |
11.500%,
12-15-19(A)(B)(E) | | | 3,000 | | | | 2,902 | |
| | | | | | | | |
| | |
Total Materials – 7.7% | �� | | | | | | 22,933 | |
Telecommunication Services | |
| |
Alternative Carriers – 1.5% | |
Level 3 Communications, Inc., | | | | | | | | |
5.750%, 12-1-22 | | | 2,694 | | | | 2,758 | |
Level 3 Escrow II, Inc., | | | | | | | | |
5.375%, 8-15-22 | | | 1,709 | | | | 1,759 | |
| | | | | | | | |
| | | | | | | 4,517 | |
| | | | | | | | |
| |
Integrated Telecommunication Services – 9.6% | |
BCP (Singapore) VI Cayman Financing Co. Ltd., | | | | | | | | |
8.000%, 4-15-21(A)(B) | | | 403 | | | | 396 | |
CenturyLink, Inc.: | | | | | | | | |
5.625%, 4-1-20(B) | | | 349 | | | | 367 | |
5.800%, 3-15-22(B) | | | 13,000 | | | | 13,536 | |
Frontier Communications Corp.: | | | | | | | | |
6.250%, 9-15-21(B) | | | 811 | | | | 815 | |
7.125%, 1-15-23(B) | | | 682 | | | | 697 | |
6.875%, 1-15-25(B) | | | 649 | | | | 643 | |
GCI, Inc., | | | | | | | | |
6.875%, 4-15-25(A) | | | 1,497 | | | | 1,508 | |
Sprint Corp.: | | | | | | | | |
7.250%, 9-15-21(B) | | | 9,458 | | | | 9,505 | |
7.875%, 9-15-23(B) | | | 1,094 | | | | 1,116 | |
| | | | | | | | |
| | | | | | | 28,583 | |
| | | | | | | | |
| |
Wireless Telecommunication Service – 1.8% | |
Telecom Italia S.p.A., | | | | | | | | |
5.303%, 5-30-24(A)(B) | | | 769 | | | | 805 | |
T-Mobile USA, Inc.: | | | | | | | | |
6.464%, 4-28-19(B) | | | 728 | | | | 751 | |
6.542%, 4-28-20(B) | | | 788 | | | | 829 | |
6.633%, 4-28-21(B) | | | 1,120 | | | | 1,173 | |
6.125%, 1-15-22(B) | | | 372 | | | | 384 | |
6.731%, 4-28-22(B) | | | 158 | | | | 166 | |
6.000%, 3-1-23(B) | | | 597 | | | | 612 | |
6.500%, 1-15-24(B) | | | 221 | | | | 231 | |
6.375%, 3-1-25(B) | | | 487 | | | | 503 | |
| | | | | | | | |
| | | | | | | 5,454 | |
| | | | | | | | |
| |
Total Telecommunication
Services – 12.9% | | | | 38,554 | |
| | | | | | | | |
CORPORATE DEBT
SECURITIES (Continued) | | Principal | | | Value | |
Utilities | |
| |
Renewable Electricity – 0.4% | |
Abengoa Yield plc, | | | | | | | | |
7.000%, 11-15-19(A) | | $ | 1,108 | | | $ | 1,141 | |
| | | | | | | | |
| | |
Total Utilities - 0.4% | | | | | | | 1,141 | |
| |
TOTAL CORPORATE DEBT SECURITIES – 104.1% | | | $ | 310,477 | |
(Cost: $318,060) | | | | | | | | |
| | |
| LOANS(E) | | | | | | |
Consumer Discretionary | |
| |
Advertising – 0.3% | |
Advantage Sales & Marketing, Inc., | | | | | | | | |
7.500%, 7-25-22 | | | 955 | | | | 955 | |
| | | | | | | | |
| |
Apparel Retail – 4.8% | |
Hoffmaster Group, Inc., | | | | | | | | |
10.000%, 5-9-21 | | | 1,222 | | | | 1,205 | |
True Religion Apparel, Inc.: | | | | | | | | |
5.875%, 7-30-19 | | | 14,475 | | | | 12,931 | |
| | | | | | | | |
| | | | | | | 14,136 | |
| | | | | | | | |
| |
Auto Parts & Equipment – 2.0% | |
Direct ChassisLink, Inc., | | | | | | | | |
8.250%, 11-7-19 | | | 6,098 | | | | 5,896 | |
| | | | | | | | |
| |
Casinos & Gaming – 0.2% | |
Gateway Casinos & Entertainment Ltd.: | | | | | | | | |
5.348%, 11-26-19(D) | | CAD | 732 | | | | 574 | |
6.016%, 11-26-19(D) | | | 2 | | | | 2 | |
| | | | | | | | |
| | | | | | | 576 | |
| | | | | | | | |
| |
General Merchandise Stores – 1.9% | |
BJ’s Wholesale Club, Inc., | | | | | | | | |
8.500%, 3-31-20 | | $ | 1,275 | | | | 1,264 | |
Orchard Acquisition Co. LLC, | | | | | | | | |
7.000%, 2-8-19 | | | 4,641 | | | | 4,502 | |
| | | | | | | | |
| | | | | | | 5,766 | |
| | | | | | | | |
| |
Housewares & Specialties – 0.6% | |
KIK Custom Products, Inc.: | | | | | | | | |
5.500%, 4-29-19 | | | 1,108 | | | | 1,107 | |
9.500%, 10-29-19 | | | 781 | | | | 780 | |
| | | | | | | | |
| | | | | | | 1,887 | |
| | | | | | | | |
| |
Movies & Entertainment – 3.2% | |
Formula One Holdings Ltd. and Delta Two S.a.r.l., | | | | | | | | |
7.750%, 7-29-22 | | | 500 | | | | 497 | |
Yonkers Racing Corp., | | | | | | | | |
8.750%, 8-20-20 | | | 10,111 | | | | 9,100 | |
| | | | | | | | |
| | | | | | | 9,597 | |
| | | | | | | | |
SCHEDULE OF INVESTMENTS
Ivy High Income Opportunities Fund (in thousands) MARCH 31, 2015 (UNAUDITED) |
| | | | | | | | |
| LOANS(E) (Continued) | | Principal | | | Value | |
Restaurants – 0.4% | |
TGI Friday’s, Inc.: | | | | | | | | |
5.250%, 7-15-20 | | $ | 98 | | | $ | 98 | |
9.250%, 7-15-21 | | | 1,063 | | | | 1,064 | |
| | | | | | | | |
| | | | | | | 1,162 | |
| | | | | | | | |
| |
Specialized Consumer Services – 0.3% | |
Wand Intermediate I L.P.: | | | | | | | | |
4.750%, 9-17-21 | | | 485 | | | | 487 | |
8.250%, 9-17-22 | | | 487 | | | | 487 | |
| | | | | | | | |
| | | | | | | 974 | |
| | | | | | | | |
| |
Total Consumer Discretionary – 13.7% | | | | 40,949 | |
Consumer Staples | |
| |
Hypermarkets & Super Centers – 0.3% | |
GOBP Holdings, Inc., | | | | | | | | |
9.250%, 10-21-22 | | | 979 | | | | 962 | |
| | | | | | | | |
| |
Packaged Foods & Meats – 0.3% | |
Shearer’s Foods LLC, | | | | | | | | |
7.750%, 6-30-22 | | | 748 | | | | 738 | |
| | | | | | | | |
| |
Total Consumer Staples – 0.6% | | | | 1,700 | |
Energy | |
| |
Coal & Consumable Fuels – 0.4% | |
Westmoreland Coal Co., | | | | | | | | |
7.500%, 12-16-20 | | | 1,297 | | | | 1,294 | |
| | | | | | | | |
| |
Oil & Gas Drilling – 0.4% | |
KCA Deutag Alpha Ltd., | | | | | | | | |
6.250%, 5-16-20 | | | 1,375 | | | | 1,150 | |
| | | | | | | | |
| |
Oil & Gas Equipment & Services – 0.3% | |
Regent Purchaser Investment, Inc., | | | | | | | | |
6.000%, 8-14-21 | | | 1,138 | | | | 853 | |
| | | | | | | | |
| |
Oil & Gas Exploration & Production – 0.3% | |
Callon Petroleum Co., | | | | | | | | |
8.500%, 10-8-21 | | | 929 | | | | 902 | |
| | | | | | | | |
| |
Oil & Gas Refining & Marketing – 1.1% | |
Fieldwood Energy LLC, | | | | | | | | |
8.375%, 9-30-20 | | | 1,684 | | | | 1,228 | |
Shelf Drilling Midco Ltd., | | | | | | | | |
10.000%,
10-8-18(C) | | | 3,209 | | | | 2,166 | |
| | | | | | | | |
| | | | | | | 3,394 | |
| | | | | | | | |
| |
Oil & Gas Storage & Transportation – 1.2% | |
Bowie Resources Holdings LLC: | | | | | | | | |
6.750%, 8-12-20 | | | 2,386 | | | | 2,329 | |
11.750%, 2-16-21 | | | 1,224 | | | | 1,175 | |
| | | | | | | | |
| | | | | | | 3,504 | |
| | | | | | | | |
| |
Total Energy – 3.7% | | | | 11,097 | |
Financials | |
| |
Consumer Finance – 0.2% | |
TransFirst, Inc., | | | | | | | | |
9.000%, 11-12-22 | | | 692 | | | | 693 | |
| | | | | | | | |
| | | | | | | | |
| LOANS(E) (Continued) | | Principal | | | Value | |
Other Diversified Financial
Services – 0.5% | |
WP Mustang Holdings LLC, | | | | | | | | |
8.500%, 5-29-22 | | $ | 1,500 | | | $ | 1,460 | |
| | | | | | | | |
| |
Total Financials – 0.7% | | | | 2,153 | |
Health Care | |
| |
Health Care Facilities – 0.6% | |
Surgery Center Holdings, Inc.: | | | | | | | | |
5.250%, 11-3-20 | | | 125 | | | | 125 | |
8.500%, 11-3-21 | | | 1,553 | | | | 1,531 | |
| | | | | | | | |
| | | | | | | 1,656 | |
| | | | | | | | |
| |
Life Sciences Tools & Services – 0.5% | |
Atrium Innovations, Inc., | | | | | | | | |
7.750%, 8-10-21 | | | 1,740 | | | | 1,600 | |
| | | | | | | | |
| |
Total Health Care – 1.1% | | | | 3,256 | |
Industrials | |
| |
Air Freight & Logistics – 0.1% | |
DAE Aviation Holdings, Inc., | | | | | | | | |
7.750%, 8-5-19 | | | 229 | | | | 229 | |
| | | | | | | | |
| |
Building Products – 1.3% | |
GYP Holdings III Corp.: | | | | | | | | |
4.750%, 4-1-21 | | | 477 | | | | 465 | |
7.750%, 4-1-22 | | | 2,012 | | | | 1,972 | |
Hampton Rubber Co. & SEI Holding Corp., | | | | | | | | |
9.000%, 3-27-22 | | | 1,719 | | | | 1,375 | |
| | | | | | | | |
| | | | | | | 3,812 | |
| | | | | | | | |
| |
Construction & Engineering – 0.3% | |
Tensar International Corp.: | | | | | | | | |
5.750%, 7-10-21 | | | 445 | | | | 409 | |
9.500%, 7-10-22 | | | 604 | | | | 469 | |
| | | | | | | | |
| | | | | | | 878 | |
| | | | | | | | |
| |
Industrial Machinery – 1.6% | |
Accudyne Industries LLC, | | | | | | | | |
4.000%, 12-13-19 | | | 89 | | | | 84 | |
Capital Safety North America Holdings, Inc., | | | | | | | | |
6.500%, 3-28-22 | | | 1,769 | | | | 1,731 | |
Dynacast International LLC, | | | | | | | | |
9.500%, 1-30-23 | | | 2,563 | | | | 2,589 | |
NN, Inc., | | | | | | | | |
6.000%, 8-29-21 | | | 395 | | | | 395 | |
| | | | | | | | |
| | | | | | | 4,799 | |
| | | | | | | | |
| |
Research & Consulting Services – 1.5% | |
Larchmont Resources LLC, | | | | | | | | |
8.250%, 8-7-19 | | | 5,213 | | | | 4,674 | |
| | | | | | | | |
| |
Total Industrials – 4.8% | | | | 14,392 | |
Information Technology | |
| |
Application Software – 1.5% | |
Misys plc and Magic Newco LLC, | | | | | | | | |
12.000%, 6-12-19 | | | 2,400 | | | | 2,610 | |
| | | | | | | | |
| LOANS(E) (Continued) | | Principal | | | Value | |
Application Software (Continued) | |
TIBCO Software, Inc., | | | | | | | | |
6.500%, 12-4-20 | | $ | 1,748 | | | $ | 1,746 | |
| | | | | | | | |
| | | | | | | 4,356 | |
| | | | | | | | |
| |
Data Processing & Outsourced
Services – 0.4% | |
Sedgwick Claims Management Services, Inc., | | | | | | | | |
6.750%, 2-28-22 | | | 1,412 | | | | 1,373 | |
| | | | | | | | |
| |
IT Consulting & Other Services – 1.6% | |
Active Network, Inc. (The): | | | | | | | | |
5.500%, 11-15-20 | | | 1,307 | | | | 1,301 | |
9.500%, 11-15-21 | | | 2,147 | | | | 2,050 | |
Triple Point Group Holdings, Inc., | | | | | | | | |
5.250%, 7-13-20 | | | 1,561 | | | | 1,409 | |
| | | | | | | | |
| | | | | | | 4,760 | |
| | | | | | | | |
| |
Total Information
Technology – 3.5% | | | | 10,489 | |
Materials | |
| |
Construction Materials – 1.1% | |
Quickrete Holdings, Inc., | | | | | | | | |
7.000%, 3-30-21 | | | 261 | | | | 262 | |
U.S. LBM Holdings LLC: | | | | | | | | |
8.000%, 5-2-20 | | | 3,141 | | | | 3,086 | |
| | | | | | | | |
| | | | | | | 3,348 | |
| | | | | | | | |
| |
Diversified Metals & Mining – 0.4% | |
EP Minerals LLC: | | | | | | | | |
5.500%, 8-20-20 | | | 552 | | | | 552 | |
8.500%, 8-20-21 | | | 545 | | | | 542 | |
| | | | | | | | |
| | | | | | | 1,094 | |
| | | | | | | | |
| |
Metal & Glass Containers – 0.1% | |
Consolidated Container Co. LLC, | | | | | | | | |
7.750%, 1-3-20 | | | 451 | | | | 417 | |
| | | | | | | | |
| |
Paper Packaging – 1.1% | |
FPC Holdings, Inc., | | | | | | | | |
9.250%, 5-27-20 | | | 2,500 | | | | 2,363 | |
Ranpak (Rack Merger), | | | | | | | | |
8.250%, 10-1-22 | | | 873 | | | | 872 | |
| | | | | | | | |
| | | | | | | 3,235 | |
| | | | | | | | |
| |
Specialty Chemicals – 1.0% | |
Chemstralia Ltd., | | | | | | | | |
7.250%, 2-26-22 | | | 2,310 | | | | 2,264 | |
Chromaflo Technologies Corp., | | | | | | | | |
8.250%, 6-2-20 | | | 706 | | | | 692 | |
| | | | | | | | |
| | | | | | | 2,956 | |
| | | | | | | | |
| |
Total Materials – 3.7% | | | | 11,050 | |
Telecommunication Services | |
| |
Alternative Carriers – 0.3% | |
Cable & Wireless Communications, | | | | | | | | |
6.500%, 12-31-16 | | | 700 | | | | 702 | |
| | | | | | | | |
| |
Total Telecommunication
Services – 0.3% | | | | 702 | |
SCHEDULE OF INVESTMENTS
Ivy High Income Opportunities Fund (in thousands) MARCH 31, 2015 (UNAUDITED) |
| | | | | | | | |
| LOANS(E) (Continued) | | Principal | | | Value | |
Utilities | |
| |
Independent Power Producers & Energy Traders – 0.6% | |
Alinta Energy Finance PTY Ltd.: | | | | | | | | |
0.000%,
8-13-19(F) | | $ | 73 | | | $ | 73 | |
6.375%, 8-13-19 | | | 1,528 | | | | 1,526 | |
| | | | | | | | |
| | | | | | | 1,599 | |
| | | | | | | | |
| |
Total Utilities – 0.6% | | | | 1,599 | |
| |
TOTAL LOANS – 32.7% | | | $ | 97,387 | |
(Cost: $102,787) | | | | | | | | |
| | | | | | | | |
SHORT-TERM
SECURITIES | | Principal | | | Value | |
Commercial Paper(G) – 3.5% | |
J.M. Smucker Co. (The), | | | | | | | | |
0.280%, 4-1-15 | | $ | 4,169 | | | $ | 4,169 | |
Kellogg Co., | | | | | | | | |
0.430%, 4-1-15 | | | 6,000 | | | | 6,000 | |
| | | | | | | | |
| | | | | | | 10,169 | |
| | | | | | | | |
| |
Master Note - 0.4% | |
Toyota Motor Credit Corp., | | | | | | | | |
0.130%, 4-1-15(H) | | | 1,297 | | | | 1,297 | |
| | | | | | | | |
| | | | | | |
SHORT-TERM
SECURITIES (Continued) | | | | Value | |
TOTAL SHORT-TERM SECURITIES – 3.9% | | $ | 11,466 | |
(Cost: $11,466) | | | | | | |
| |
TOTAL INVESTMENT SECURITIES – 140.7% | | $ | 419,330 | |
(Cost: $432,313) | | | | | | |
| |
BORROWINGS(I) – (45.1)% | | | (134,500 | ) |
| |
CASH AND OTHER ASSETS, NET OF
LIABILITIES – 4.4% | | | 13,304 | |
| |
NET ASSETS – 100.0% | | $ | 298,134 | |
Notes to Schedule of Investments
| (A) | Securities were purchased pursuant to Rule 144A under the Securities Act of 1933 and may be resold in transactions exempt from registration, normally to qualified institutional buyers. At March 31, 2015 the total value of these securities amounted to $192,245 or 64.5% of net assets. |
| (B) | All or a portion of securities with an aggregate value of $138,162 have been pledged as collateral on open borrowings. |
| (C) | Payment-in-kind bonds. |
| (D) | Principal amounts are denominated in the indicated foreign currency, where applicable (CAD - Canadian Dollar, EUR - Euro and GBP - British Pound). |
| (E) | Variable rate security. Interest rate disclosed is that which is in effect at March 31, 2015. |
| (F) | All or a portion of this position has not settled. Full contract rates do not take effect until settlement date. |
| (G) | Rate shown is the yield to maturity at March 31, 2015. |
| (H) | Variable rate security. Interest rate disclosed is that which is in effect at March 31, 2015. Date shown represents the date that the variable rate resets. |
| (I) | Borrowings Payable as a percentage of Total Investments is 32.1%. |
The following forward foreign currency contracts were outstanding at March 31, 2015:
| | | | | | | | | | | | | | | | | | | | | | | | | | |
| | | Currency to be
Delivered | | | | | Currency to be
Received | | | Settlement
Date | | | Counterparty | | Unrealized
Appreciation | | | Unrealized
Depreciation | | | |
British Pound | | | 708 | | | U.S. Dollar | | | 1,068 | | | | 4-13-15 | | | Morgan Stanley International | | $ | 17 | | | $ | — | | | |
Canadian Dollar | | | 1,621 | | | U.S. Dollar | | | 1,283 | | | | 4-13-15 | | | Morgan Stanley International | | | 3 | | | | — | | | |
Euro | | | 2,690 | | | U.S. Dollar | | | 2,895 | | | | 4-13-15 | | | Morgan Stanley International | | | 3 | | | | — | | | |
| | | | | | | | | | | | | | | | | | | |
| | | | | | | | | | | | | | | | | | $ | 23 | | | $ | — | | | |
| | | | | | | | | | | | | | | | | | | |
The following table is a summary of the valuation of the Fund’s investments by the fair value hierarchy levels as of March 31, 2015. See Note 3 to the Financial Statements for further information regarding fair value measurement.
| | | | | | | | | | | | |
| | | Level 1 | | | Level 2 | | | Level 3 | |
Assets | | | | | | | | | | | | |
Investments in Securities | | | | | | | | | | | | |
Corporate Debt Securities | | $ | — | | | $ | 310,477 | | | $ | — | |
Loans | | | — | | | | 75,178 | | | | 22,209 | |
Short-Term Securities | | | — | | | | 11,466 | | | | — | |
Total | | $ | — | | | $ | 397,121 | | | $ | 22,209 | |
Forward Foreign Currency Contracts | | $ | — | | | $ | 23 | | | $ | — | |
| | | |
Liabilities | | | | | | | | | | | | |
Payable for Borrowing | | $ | — | | | $ | 134,500 | | | $ | — | |
SCHEDULE OF INVESTMENTS
Ivy High Income Opportunities Fund (in thousands) MARCH 31, 2015 (UNAUDITED) |
The following table is a reconciliation of Level 3 investments for which significant unobservable inputs were used to determine fair value:
| | | | | | | | |
| | | Corporate Debt
Securities | | | Loans | |
Beginning Balance 10-1-14 | | $ | 286 | | | $ | 45,648 | |
Net realized gain (loss) | | | — | | | | (1,262 | ) |
Net change in unrealized appreciation (depreciation) | | | — | | | | 1,083 | |
Purchases | | | — | | | | 4,197 | |
Sales | | | — | | | | (9,744 | ) |
Amortization/Accretion of premium/discount | | | — | | | | 69 | |
Transfers into Level 3 during the period | | | — | | | | 1,547 | |
Transfers out of Level 3 during the period | | | (286 | ) | | | (19,329 | ) |
Ending Balance 3-31-15 | | $ | — | | | $ | 22,209 | |
Net change in unrealized appreciation (depreciation) for all Level 3 investments still held as of 3-31-15 | | $ | — | | | $ | 1,117 | |
Transfers from Level 2 to Level 3 occurred primarily due to the lack of observable market data due to decreased market activity or information for these securities. Transfers from Level 3 to Level 2 occurred primarily due to the increased availability of observable market data due to increased market activity or information. As shown above, transfers in and out of Level 3 represent the values as of the beginning of the reporting period. During the period ended March 31, 2015, there were no transfers between Levels 1 and 2.
Information about Level 3 fair value measurements:
| | | | | | | | |
| | | Fair Value at 3-31-15 | | | Valuation Technique(s) | | Unobservable Input(s) |
Assets | | | | | | | | |
Loans | | $ | 22,209 | | | Third-party valuation service | | Broker quotes |
The following acronym is used throughout this schedule:
REIT = Real Estate Investment Trust
See Accompanying Notes to Financial Statements.
| | | | | | |
| 10 | | SEMIANNUAL REPORT | | 2015 | | |
STATEMENT OF ASSETS AND LIABILITIES
Ivy High Income Opportunities Fund | AS OF MARCH 31, 2015 (UNAUDITED) |
| | | | |
| (In thousands, except per share amounts) | | | |
ASSETS | | | | |
Investments in unaffiliated securities at value+ | | $ | 419,330 | |
Investments at Value | | | 419,330 | |
Cash | | | 4,003 | |
Cash denominated in foreign currencies at value+ | | | 3 | |
Investment securities sold receivable | | | 7,610 | |
Interest receivable | | | 7,436 | |
Unrealized appreciation on forward foreign currency contracts | | | 23 | |
Prepaid and other assets | | | 1 | |
Total Assets | | | 438,406 | |
| |
LIABILITIES | | | | |
Investment securities purchased payable | | | 5,513 | |
Independent Trustees and Chief Compliance Officer fees payable | | | 3 | |
Shareholder servicing payable | | | 7 | |
Investment management fee payable | | | 12 | |
Accounting services fee payable | | | 11 | |
Payable for borrowing | | | 134,500 | |
Interest payable for borrowing | | | 42 | |
Other liabilities | | | 184 | |
Total Liabilities | | | 140,272 | |
Total Net Assets | | $ | 298,134 | |
| |
NET ASSETS | | | | |
Capital paid in | | $ | 315,769 | |
Distributions in excess of net investment income | | | (23 | ) |
Accumulated net realized loss | | | (4,650 | ) |
Net unrealized depreciation | | | (12,962 | ) |
Total Net Assets | | $ | 298,134 | |
| |
SHARES OUTSTANDING | | | 16,567 | |
| |
NET ASSET VALUE PER SHARE | | $ | 18.00 | |
| |
+COST | | | | |
Investments in unaffiliated securities at cost | | $ | 432,313 | |
Cash denominated in foreign currencies at cost | | | 3 | |
See Accompanying Notes to Financial Statements.
| | | | | | |
| | 2015 | | SEMIANNUAL REPORT | | 11 |
| | |
STATEMENT OF OPERATIONS Ivy High Income Opportunities Fund | | FOR THE SIX MONTHS ENDED MARCH 31, 2015 (UNAUDITED) |
| | | | |
| (In thousands) | | | |
INVESTMENT INCOME | | | | |
Interest and amortization from unaffiliated securities | | $ | 16,165 | |
Total Investment Income | | | 16,165 | |
| |
EXPENSES | | | | |
Investment management fee | | | 2,185 | |
Interest expense for borrowing | | | 622 | |
Shareholder servicing fees | | | 13 | |
Custodian fees | | | 6 | |
Independent Trustees and Chief Compliance Officer fees | | | 5 | |
Accounting services fee | | | 63 | |
Professional fees | | | 50 | |
Other | | | 34 | |
Total Expenses | | | 2,978 | |
Net Investment Income | | | 13,187 | |
| |
REALIZED AND UNREALIZED GAIN (LOSS) | | | | |
Net realized gain (loss) on: | | | | |
Investments in unaffiliated securities | | | (5,845 | ) |
Forward foreign currency contracts | | | 1,539 | |
Foreign currency exchange transactions | | | (2 | ) |
Net change in unrealized appreciation (depreciation) on: | | | | |
Investments in unaffiliated securities | | | (10,735 | ) |
Forward foreign currency contracts | | | (544 | ) |
Foreign currency exchange transactions | | | (48 | ) |
Net Realized and Unrealized Loss | | | (15,635 | ) |
Net Decrease in Net Assets Resulting from Operations | | $ | (2,448 | ) |
See Accompanying Notes to Financial Statements.
| | | | | | |
| 12 | | SEMIANNUAL REPORT | | 2015 | | |
STATEMENTS OF CHANGES IN NET ASSETS
Ivy High Income Opportunities Fund
| | | | | | | | |
| (In thousands) | | Six-months
ended
3-31-15
(unaudited) | | | Year ended
9-30-14 | |
INCREASE (DECREASE) IN NET ASSETS | | | | | | | | |
Operations: | | | | | | | | |
Net investment income | | $ | 13,187 | | | $ | 27,625 | |
Net realized gain (loss) on investments | | | (4,308 | ) | | | 4,743 | |
Net change in unrealized depreciation | | | (11,327 | ) | | | (2,749 | ) |
Net Increase (Decrease) in Net Assets Resulting from Operations | | | (2,448 | ) | | | 29,619 | |
| | |
Distributions to Shareholders From: | | | | | | | | |
Net investment income | | | (15,059 | ) | | | (29,291 | ) |
Net realized gains | | | (4,904 | ) | | | (1,367 | ) |
Total Distributions to Shareholders | | | (19,963 | ) | | | (30,658 | ) |
Capital Share Transactions | | | — | | | | — | |
Net Decrease in Net Assets | | | (22,411 | ) | | | (1,039 | ) |
Net Assets, Beginning of Period | | | 320,545 | | | | 321,584 | |
Net Assets, End of Period | | $ | 298,134 | | | $ | 320,545 | |
Undistributed (distributions in excess of) net investment income | | $ | (23 | ) | | $ | 2,145 | |
See Accompanying Notes to Financial Statements.
| | | | | | |
| | 2015 | | SEMIANNUAL REPORT | | 13 |
| | |
STATEMENT OF CASH FLOWS Ivy High Income Opportunities Fund | | FOR THE SIX MONTHS ENDED MARCH 31, 2015 (UNAUDITED) |
| | | | |
| (In thousands) | | | |
Cash flows provided by operating activities: | | | | |
Net decrease in net assets resulting from operations | | $ | (2,448 | ) |
Adjustments to reconcile net decrease in net assets from operations to net cash provided by operating activities: | | | | |
Purchases of long-term investment securities | | | (101,280 | ) |
Proceeds from sales of long-term investment securities | | | 115,394 | |
Purchases of short-term portfolio investment securities, net | | | (5,635 | ) |
Increase in interest receivable | | | (1,008 | ) |
Decrease in prepaid and other assets | | | 4 | |
Decrease in shareholder servicing fees payable | | | (3 | ) |
Decrease in investment management fee payable | | | (1 | ) |
Increase in interest payable for borrowing | | | 39 | |
Increase in other liabilities | | | 128 | |
Net realized loss on investments in unaffiliated securities | | | 5,845 | |
Net change in unrealized depreciation on investments in unaffiliated securities | | | 10,735 | |
Net change in unrealized depreciation on forward foreign currency contracts | | | 544 | |
Net amortization on investment securities | | | 326 | |
Net cash provided by operating activities | | | 22,640 | |
Cash flows used for financing activities: | | | | |
Cash dividends paid | | | (19,963 | ) |
Net cash used for financing activities | | | (19,963 | ) |
Net increase in cash and foreign currency | | | 2,677 | |
Cash and foreign currency, at beginning of year | | | 1,329 | |
Cash and foreign currency, at end of period | | $ | 4,006 | |
Supplemental disclosure of cash flow information: | | | | |
Interest expense paid during the period | | $ | 580 | |
See Accompanying Notes to Financial Statements.
| | | | | | |
| 14 | | SEMIANNUAL REPORT | | 2015 | | |
| | |
FINANCIAL HIGHLIGHTS Ivy High Income Opportunities Fund | | FOR A SHARE OF CAPITAL STOCK OUTSTANDING THROUGHOUT EACH PERIOD |
| | | | | | | | | | | | |
| | | Six-month
period ended
3-31-15
(unaudited) | | | Year ended
9-30-14 | | | Period from
5-29-13
(commencement
of operations)
to 9-30-13 | |
Net Asset Value, Beginning of Period | | $ | 19.35 | | | $ | 19.41 | | | $ | 19.10 | |
Net Investment Income(1) | | | 0.80 | | | | 1.67 | | | | 0.45 | |
Net Realized and Unrealized Gain (Loss) on Investments | | | (0.94 | ) | | | 0.12 | | | | 0.15 | |
Total from Investment Operations | | | (0.14 | ) | | | 1.79 | | | | 0.60 | |
Distributions From Net Investment Income | | | (0.91 | ) | | | (1.77 | ) | | | (0.25 | ) |
Distributions From Net Realized Gains | | | (0.30 | ) | | | (0.08 | ) | | | — | |
Total Distributions | | | (1.21 | ) | | | (1.85 | ) | | | (0.25 | ) |
Common Shares Offering Costs | | | — | | | | — | | | | (0.04 | ) |
Net Asset Value, End of Period | | $ | 18.00 | | | $ | 19.35 | | | $ | 19.41 | |
Share Price, End of Period | | $ | 16.23 | | | $ | 17.29 | | | $ | 17.80 | |
Total Return(2) — Net Asset Value | | | 0.18 | % | | | 10.52 | % | | | 3.07 | % |
Total Return(2) — Share Price(3) | | | 1.09 | % | | | 7.69 | % | | | (9.73 | )% |
Net Assets, End of Period (in millions) | | $ | 298 | | | $ | 321 | | | $ | 322 | |
Managed Assets, End of Period (in millions) | | $ | 433 | | | $ | 455 | | | $ | 476 | |
Ratio of Expenses to Average Net Assets | | | 1.97 | %(4) | | | 1.94 | % | | | 1.82 | %(4) |
Ratio of Expenses to Average Net Assets Excluding Interest Expense | | | 1.56 | %(4) | | | 1.55 | % | | | 1.49 | %(4) |
Ratio of Net Investment Income to Average Net Assets | | | 8.71 | %(4) | | | 8.35 | % | | | 6.88 | %(4) |
Ratio of Expenses to Average Managed Assets | | | 1.31 | %(4) | | | 1.36 | % | | | 1.35 | %(4) |
Ratio of Expenses to Average Managed Assets Excluding Interest Expense | | | 1.04 | %(4) | | | 1.08 | % | | | 1.11 | %(4) |
Ratio of Net Investment Income to Average Managed Assets | | | 5.81 | %(4) | | | 5.83 | % | | | 5.12 | %(4) |
Portfolio Turnover Rate | | | 23 | % | | | 43 | % | | | 44 | %(5) |
| (1) | Based on average weekly shares outstanding. |
| (2) | Total investment return is calculated assuming a purchase of common stock on the opening of the first day and a sale on the closing of the last day of each period reported. Dividends and distributions, if any, are assumed, for purposes of this calculation, to be reinvested at prices obtained under the Fund’s dividend reinvestment plan. Total returns for periods less than one year are not annualized. |
| (3) | Total investment return at share price will differ from results at NAV. Returns at share price can be influenced by factors such as changing views about the Fund, market conditions, supply and demand for the Fund’s stock, or changes in the Fund’s dividends. |
| (5) | Portfolio turnover is calculated at the fund level. Percentage indicated was calculated for the year ended September 30,2013. |
See Accompanying Notes to Financial Statements.
| | | | | | |
| | 2015 | | SEMIANNUAL REPORT | | 15 |
NOTES TO FINANCIAL STATEMENTS
Ivy High Income Opportunities Fund | MARCH 31, 2015 (UNAUDITED) |
Ivy High Income Opportunities Fund (the “Fund”) is registered under the Investment Company Act of 1940, as amended (the “1940 Act”) as a non-diversified, closed-end management investment company. The Fund was organized as a Delaware statutory trust on January 30, 2013, pursuant to an Agreement and Declaration of Trust, as amended and restated on March 28, 2013, governed by the laws of the State of Delaware. The Fund commenced operations on May 29, 2013. Prior to that date, the Fund had no operations other than matters relating to its organization and the sale and issuance of 5,236 common shares of beneficial interest to Ivy Investment Management Company (“IICO” or the “Adviser”), the Fund’s investment adviser. The Fund’s common shares are listed on the New York Stock Exchange (the “NYSE”) and trade under the ticker symbol “IVH.”
The Fund’s investment objective is to seek to provide total return through a combination of a high level of current income and capital appreciation. The Fund will seek to achieve its investment objective by investing primarily in a portfolio of high yield corporate bonds of varying maturities and other fixed income instruments of predominantly corporate issuers, including secured and unsecured loan assignments, loan participations and other loan instruments (“Loans”). Under normal circumstances, the Fund will invest at least 80% of its Managed Assets (as defined in the prospectus) in a portfolio of U.S. and foreign bonds, loans and other fixed income instruments, as well as other investments (including derivatives) with similar economic characteristics. The Fund will invest primarily in instruments that are, at the time of purchase, rated below investment grade (below Baa3 by Moody’s Investors Service, Inc. (“Moody’s”) or below BBB- by either Standard & Poor’s Rating Services (“S&P”) or Fitch, Inc. (“Fitch”), or comparably rated by another nationally recognized statistical rating organization (“NRSRO”)), or unrated but judged by the Fund’s investment adviser to be of comparable quality.
| 2. | | SIGNIFICANT ACCOUNTING POLICIES |
The following is a summary of significant accounting policies consistently followed by the Fund.
Security Transactions and Related Investment Income. Security transactions are accounted for on the trade date (date the order to buy or sell is executed). Realized gains and losses are calculated on the identified cost basis. Interest income is recorded on the accrual basis and includes paydown gain (loss) and accretion of discounts and amortization of premiums. All or a portion of the distributions received from a real estate investment trust or publicly traded partnership may be designated as a reduction of cost of the related investment and/or realized gain.
Foreign Currency Translation. The Fund’s accounting records are maintained in U.S. dollars. All assets and liabilities denominated in foreign currencies are translated into U.S. dollars daily, using foreign exchange rates obtained from an independent pricing service authorized by the Board of Trustees of the Fund (the “Board”). Purchases and sales of investment securities and accruals of income and expenses are translated at the rate of exchange prevailing on the date of the transaction. For assets and liabilities other than investments in securities, net realized and unrealized gains and losses from foreign currency translation arise from changes in currency exchange rates. The Fund combines fluctuations from currency exchange rates and fluctuations in value when computing net realized gain (loss) and net change in unrealized appreciation (depreciation) on investments. Foreign exchange rates are typically valued as of the close of the NYSE, normally 4:00 P.M. Eastern time, on each day the NYSE is open for trading.
Dividends and Distributions to Shareholders. Dividends to shareholders are declared monthly. Distributions from net realized capital gains from investment transactions, if any, are declared and distributed to shareholders at least annually. Net investment income dividends and capital gains distributions are determined in accordance with income tax regulations which may differ from accounting principles generally accepted in the United States of America (“U.S. GAAP”). If the total dividends and distributions made in any tax year exceeds net investment income and accumulated realized capital gains, a portion of the total distribution may be treated as a tax return of capital.
Income Taxes. It is the policy of the Fund to distribute all of its taxable income and capital gains to its shareholders and otherwise qualify as a regulated investment company under Subchapter M of the Internal Revenue Code. In addition, the Fund intends to pay distributions as required to avoid imposition of excise tax. Accordingly, no provision has been made for Federal income taxes. Management of the Fund periodically reviews all tax positions to assess that it is more likely than not that the position would be sustained upon examination by the relevant tax authority based on the technical merits of each position. As of and for the period ended March 31, 2015, management believes that no liability for unrecognized tax positions is required. The Fund is subject to examination by U.S. federal and state authorities for returns filed for tax years after 2012.
Segregation and Collateralization. In cases in which the 1940 Act and the interpretive positions of the Securities and Exchange Commission (“SEC”) require that the Fund either deliver collateral or segregate assets in connection with certain investments (e.g., dollar rolls, financial futures contracts, foreign currency exchange contracts, options written, securities with extended settlement periods and swaps), the Fund will segregate collateral or designate on its books and records cash or other liquid securities having a value at least equal to the amount that is required to be physically segregated for the benefit of the counterparty. Furthermore, based on requirements and agreements with certain exchanges and third party broker-dealers, each party has requirements to deliver/deposit cash or securities as collateral for certain investments. Certain countries require that cash reserves be held while investing in companies incorporated in that country. These cash reserves and cash collateral that has been pledged to cover obligations of the Fund under derivative contracts, if any, will be reported separately on the Statement of Assets and Liabilities as “Restricted cash.” Securities collateral pledged for the same purpose, if any, is noted on the Schedule of Investments.
Concentration of Market and Credit Risk. In the normal course of business, the Fund invests in securities and enters into transactions where risks exist due to fluctuations in the market (market risk) or failure of the issuer of a security to meet all its obligations (issuer credit risk). The value of securities held by the Fund may decline in response to certain events, including those directly involving the issuers whose securities are owned by the Fund; conditions affecting the general economy; overall market changes; local, regional or global political, social or economic instability; and currency and interest rate and price fluctuations. Similar to issuer credit risk, the Fund may be exposed to counterparty credit risk, or the risk that an entity with which the Fund has unsettled or open transactions may fail to or be unable to perform on its commitments. The Fund manages counterparty credit risk by entering into transactions only with counterparties that it believes have the financial resources to honor their obligations and by
| | | | | | |
| 16 | | SEMIANNUAL REPORT | | 2015 | | |
monitoring the financial stability of those counterparties. Financial assets, which potentially expose the Fund to market, issuer and counterparty credit risks, consist principally of financial instruments and receivables due from counterparties. The extent of the Fund’s exposure to market, issuer and counterparty credit risks with respect to these financial assets is generally approximated by their value recorded on the Fund’s Statement of Assets and Liabilities, less any collateral held by the Fund.
The Fund may hold high-yield and/or non-investment-grade bonds, which may be subject to a greater degree of credit risk. Credit risk relates to the ability of the issuer to meet interest or principal payments or both as they become due. While the Fund may not invest in issues (such as secured debt issues and/or corporate debt issues) that are in default at the time of purchase, issuers in which the Fund may invest may become subject to a bankruptcy reorganization proceeding, subject to some other form of a public or private debt restructuring or otherwise become in default or in significant risk of default in the payment of interest or repayment of principal or trading at prices substantially below other below-investment grade debt securities of companies in similar industries.
The Fund may enter into financial instrument transactions (such as swaps, futures, options and other derivatives) that may have off-balance sheet market risk. Off-balance sheet market risk exists when the maximum potential loss on a particular financial instrument is greater than the value of such financial instrument, as reflected on the Statement of Assets and Liabilities.
If the Fund invests directly in foreign currencies or in securities that trade in, and receive revenues in, foreign currencies, or in financial derivatives that provide exposure to foreign currencies, it will be subject to the risk that those currencies will decline in value relative to the base currency of the Fund, or, in the case of hedging positions, that the Fund’s base currency will decline in value relative to the currency being hedged. Currency rates in foreign countries may fluctuate significantly over short periods of time for a number of reasons, including changes in interest rates, intervention (or the failure to intervene) by U.S. or foreign governments, central banks or supranational entities such as the International Monetary Fund, or by the imposition of currency controls or other political developments in the United States or abroad.
Leverage Risk. The Fund’s use of leverage creates the possibility of higher volatility for the Fund’s Net Asset Value (“NAV”), share price and distributions. Leverage risk can be introduced through structural leverage (borrowings) or portfolio leverage through the use of certain derivative instruments held in the Fund’s portfolio. Leverage typically magnifies the total return of the Fund’s portfolio, whether that return is positive or negative. The use of leverage creates an opportunity for increased net income per share, but there is no assurance that the Fund’s leveraging strategy will be successful.
Loans. The Fund may invest in loans, the interest rates of which float or adjust periodically based upon a specified adjustment schedule, benchmark indicator, or prevailing interest rates, the debtor of which may be a domestic or foreign corporation, partnership or other entity (“Borrower”). Loans generally pay interest at rates which are periodically redetermined by reference to a base lending rate plus a premium. These base lending rates generally include prime rates of one or more major U.S. banks, London Interbank Offered Rate (“LIBOR”) rates or certificates of deposit rates. Loans often require prepayments from excess cash flow or permit the Borrower to repay at its election. The degree to which Borrowers repay cannot be predicted with accuracy. As a result, the actual maturity may be substantially less than the stated maturities. Loans are exempt from registration under the Securities Act of 1933, as amended, may contain certain restrictions on resale, and cannot be sold publicly. The Fund’s investment in loans may be in the form of participations in loans or assignments of all or a portion of loans from third parties.
When the Fund purchases assignments, it acquires all the rights and obligations under the loan agreement of the assigning lender. Assignments may, however, be arranged through private negotiations between potential assignees and potential assignors, and the rights and obligations acquired by the purchaser of an assignment may differ from, and be more limited than those held by the assigning lender. When the Fund purchases a participation of a loan interest, the Fund typically enters into a contractual agreement with the lender or other third party selling the participation. A participation interest in loans includes the right to receive payments of principal, interest and any fees to which it is entitled from the lender and only upon receipt by the lender of payments from the Borrower, but not from the Borrower directly. When investing in a participation interest, if a Borrower is unable to meet its obligations under a loan agreement, the Fund generally has no right to enforce compliance with the terms of the loan agreement. As a result, the Fund assumes the credit risk of the Borrower, the selling participant, and any other persons that are interpositioned between the Fund and the Borrower. If the lead lender in a typical lending syndicate becomes insolvent, enters Federal Deposit Insurance Corporation (“FDIC”) receivership or, if not FDIC insured, enters into bankruptcy, the Fund may incur certain costs and delays in receiving payment or may suffer a loss of principal and/or interest.
Payment In-Kind Securities. The Fund may invest in payment in-kind securities (“PIKs”). PIKs give the issuer the option at each interest payment date of making interest payments in either cash or additional debt securities. Those additional debt securities usually have the same terms, including maturity dates and interest rates, and associated risks as the original bonds. The daily market quotations of the original bonds may include the accrued interest (referred to as a dirty price) and require a pro-rata adjustment from the unrealized appreciation or depreciation on investments to interest receivable on the Statement of Assets and Liabilities.
Securities on a When-Issued or Delayed Delivery Basis. The Fund may purchase securities on a “when-issued” basis, and may purchase or sell securities on a “delayed delivery” basis. “When-issued” or “delayed delivery” refers to securities whose terms and indenture are available and for which a market exists, but which are not available for immediate delivery. Delivery and payment for securities that have been purchased by the Fund on a when-issued basis normally take place within six months and possibly as long as two years or more after the trade date. During this period, such securities do not earn interest, are subject to market fluctuation and may increase or decrease in value prior to their delivery. The purchase of securities on a when-issued basis may increase the volatility of the Fund’s NAV to the extent the Fund executes such transactions while remaining substantially fully invested. When the Fund engages in when-issued or delayed delivery transactions, it relies on the buyer or seller, as the case may be, to complete the transaction. Their failure to do so may cause the Fund to lose the opportunity to obtain or dispose of the security at a price and yield IICO, or the Fund’s investment subadviser, as applicable, consider advantageous. The Fund maintains internally designated assets with a value
| | | | | | |
| | 2015 | | SEMIANNUAL REPORT | | 17 |
equal to or greater than the amount of its purchase commitments. The Fund may also sell securities that it purchased on a when-issued or delayed delivery basis prior to settlement of the original purchase.
Custodian Fees. “Custodian fees” on the Statement of Operations may include interest expense incurred by the Fund on any cash overdrafts of its custodian account during the period. Such cash overdrafts may result from the effects of failed trades in portfolio securities and from cash outflows resulting from unanticipated shareholder redemption activity. The Fund pays interest to its custodian on such cash overdrafts, to the extent they are not offset by positive cash balances maintained by the Fund. The “Earnings credit” line item, if shown, represents earnings on cash balances maintained by the Fund during the period. Such interest expense and other custodian fees may be paid with these earnings.
Independent Trustees and Chief Compliance Officer Fees. Fees paid to the Independent Trustees can be paid in cash or deferred to a later date, at the election of the Trustee according to the Trust’s Deferred Fee Agreement entered into between the Fund and the Trustee(s). The Fund records the deferred fees as a liability on the Statement of Assets and Liabilities. All fees paid in cash plus any appreciation (depreciation) in the underlying deferred plan are shown on the Statement of Operations. Additionally, fees paid to the office of the Chief Compliance Officer of the Fund are shown on the Statement of Operations.
Indemnifications. The Fund’s organizational documents provide current and former Trustees and Officers with a limited indemnification against liabilities arising in connection with the performance of their duties to the Fund. In the normal course of business, the Fund may also enter into contracts that provide general indemnification. The Fund’s maximum exposure under these arrangements is unknown and is dependent on future claims that may be made against the Fund. The risk of material loss from such claims is considered remote.
Basis of Preparation. The Fund is an investment company and follows accounting and reporting guidance in the Financial Accounting Standards Board (“FASB”) Accounting Standards Codification Topic 946 (“ASC 946”). The accompanying financial statements were prepared in accordance with U.S. GAAP, including but not limited to ASC 946. U.S. GAAP requires the use of estimates made by management. Management believes that estimates and valuations are appropriate; however, actual results may differ from those estimates, and the valuations reflected in the accompanying financial statements may differ from the value ultimately realized upon sale or maturity.
Statement of Cash Flows. U.S. GAAP requires entities providing financial statements that report both financial position and results of operations to also provide a statement of cash flows for each period for which results of operations are provided, but exempts investment companies meeting certain conditions. One of the conditions is that the enterprise had little or no debt, based on the average debt outstanding during the period, in relation to average total assets. Funds with certain degrees of borrowing activity, typically through the use of borrowing arrangements, have been determined to be at a level requiring a Statement of Cash Flows. The Statement of Cash Flows has been prepared using the indirect method which requires net increase/decrease in net assets resulting from operations to be adjusted to reconcile to net cash flows from operating activities.
Subsequent Events. Management has performed a review for subsequent events through the date this report was issued.
| 3. | | INVESTMENT VALUATION AND FAIR VALUE MEASUREMENTS |
The Fund’s investments are reported at fair value. Fair value is defined as the price that the Fund would receive upon selling an asset or would pay upon satisfying a liability in an orderly transaction between market participants at the measurement date. The Fund calculates the NAV of its shares as of the close of the NYSE, normally 4:00 P.M. Eastern time, on each day the NYSE is open for trading.
For purposes of calculating the NAV, the portfolio securities and other assets are valued on each business day using pricing and valuation methods as adopted by the Board. Where market quotes are readily available, fair value is generally determined on the basis of last reported sales prices, or if no sales are reported, based on quotes obtained from a quotation reporting system, established market makers, or pricing services.
Prices for fixed-income securities are typically based on quotes that are obtained from an independent pricing service authorized by the Board. To determine values of fixed-income securities, the independent pricing service utilizes such factors as current quotations by broker/dealers, coupon, maturity, quality, type of issue, trading characteristics, and other yield and risk factors it deems relevant in determining valuations. Securities that cannot be valued by the independent pricing service may be valued using quotes obtained from dealers that make markets in the securities.
Short-term securities with maturities of 60 days or less are valued on the basis of amortized cost (which approximates value), whereby a portfolio security is valued at its cost initially, and thereafter valued to reflect a constant amortization to maturity of any discount or premium.
Because many foreign markets close before the NYSE, events may occur between the close of the foreign market and the close of the NYSE that could have a material impact on the valuation of foreign securities. Waddell & Reed Services Company (“WRSCO”), pursuant to procedures adopted by the Board, evaluates the impact of these events and may adjust the valuation of foreign securities to reflect the fair value as of the close of the NYSE. In addition, all securities for which values are not readily available or are deemed unreliable are appraised at fair value as determined in good faith under the supervision of the Board.
Where market quotes are not readily available, portfolio securities or assets are valued at fair value, as determined in good faith by the Board or Valuation Committee pursuant to procedures approved by the Board.
Market quotes are considered not readily available in circumstances where there is an absence of current or reliable market-based data (e.g., trade information or broker quotes), including where events occur after the close of the relevant market, but prior to the NYSE close, that materially affect the values of the Fund’s securities or assets. In addition, market quotes are considered not readily available when, due to extraordinary circumstances, the exchanges or markets on which the securities trade do not open for trading for the entire day and no other market prices are available.
| | | | | | |
| 18 | | SEMIANNUAL REPORT | | 2015 | | |
The Board has delegated to WRSCO the responsibility for monitoring significant events that may materially affect the values of the Fund’s securities or assets and for determining whether the value of the applicable securities or assets should be re-evaluated in light of such significant events. The Board has established a Valuation Committee to administer and oversee the valuation process, including the use of third party pricing vendors.
The Board has adopted methods for valuing securities and other assets in circumstances where market quotes are not readily available. For instances in which daily market quotes are not readily available, investments may be valued, pursuant to procedures established by the Board, with reference to other securities or indices. In the event that the security or asset cannot be valued pursuant to one of the valuation methods established by the Board, the value of the security or asset will be determined in good faith by the Valuation Committee in accordance with the procedures adopted by the Board.
When the Fund uses these fair valuation methods applied by WRSCO that use significant unobservable inputs to determine its NAV, securities will be priced by a method that the Board or persons acting at their direction believe accurately reflects fair value and are categorized as Level 3 of the fair value hierarchy. These methods may require subjective determinations about the value of a security. The prices used by the Fund may differ from the value that will ultimately be realized at the time the securities were sold.
WRSCO is responsible for monitoring the implementation of the pricing and valuation policies through a series of activities to provide reasonable comfort of the accuracy of prices including: 1) periodic vendor due diligence meetings to review methodologies, new developments, and process at vendors, 2) daily and monthly multi-source pricing comparisons reviewed and submitted to the Valuation Committee, and 3) daily review of unpriced, stale, and variance reports with exceptions reviewed by management and the Valuation Committee.
Accounting standards establish a framework for measuring fair value and a three-level hierarchy for fair value measurements based upon the transparency of inputs to the valuation of an asset or liability. Inputs may be observable or unobservable and refer broadly to the assumptions that market participants would use in pricing the asset or liability. Observable inputs reflect the assumptions market participants would use in pricing the asset or liability based on market data obtained from sources independent of the reporting entity. Unobservable inputs reflect the reporting entity’s own assumptions about the factors that market participants would use in pricing the asset or liability developed based on the best information available in the circumstances.
An individual investment’s fair value measurement is assigned a level based upon the observability of the inputs which are significant to the overall valuation.
The three-tier hierarchy of inputs is summarized as follows:
Level 1 – Observable input such as quoted prices, available in active markets, for identical assets or liabilities.
Level 2 – Significant other observable inputs, which may include, but are not limited to, quoted prices for similar assets or liabilities in markets that are active, quoted prices for identical or similar assets or liabilities in markets that are not active, inputs other than quoted prices that are observable for the assets or liabilities (such as interest rates, yield curves, volatilities, prepayment speeds, loss severities, credit risks and default rates) or other market corroborated inputs.
Level 3 – Significant unobservable inputs based on the best information available in the circumstances, to the extent observable inputs are not available, which may include assumptions made by the Board or persons acting at their direction that are used in determining the fair value of investments.
A description of the valuation techniques applied to the Fund’s major classes of assets and liabilities measured at fair value on a recurring basis follows:
Corporate Bonds. The fair value of corporate bonds, as obtained from an independent pricing service, is estimated using various techniques, which consider recently executed transactions in securities of the issuer or comparable issuers, market price quotations (where observable), bond spreads, fundamental data relating to the issuer, and credit default swap spreads adjusted for any basis difference between cash and derivative instruments. While most corporate bonds are categorized in Level 2 of the fair value hierarchy, in instances where lower relative weight is placed on transaction prices, quotations, or similar observable inputs, they are categorized in Level 3 of the fair value hierarchy.
Derivative Instruments. Forward foreign currency contracts are valued based upon the closing prices of the forward currency rates determined at the close of the NYSE provided by an independent pricing service and are categorized in Level 2 of the fair value hierarchy.
Loans. Loans are valued using a price or composite price from one or more brokers or dealers as obtained from an independent pricing service. The fair value of loans is estimated using recently executed transactions, market price quotations, credit/market events, and cross-asset pricing. Inputs are generally observable market inputs obtained from independent sources. Loans are generally categorized in Level 2 of the fair value hierarchy, unless key inputs are unobservable in which case they would be categorized as Level 3.
Municipal Bonds. Municipal bonds are fair valued based on pricing models used by and obtained from an independent pricing service that take into account, among other factors, information received from market makers and broker-dealers, current trades, bid-wants lists, offerings, market movements, the callability of the bond, state of issuance, benchmark yield curves, and bond insurance. To the extent that these inputs are observable and timely, the fair values of municipal bonds would be categorized as Level 2; otherwise the fair values would be categorized as Level 3.
Payable for Borrowings. The Fund uses a market yield approach, which utilizes expected future cash flows that are discounted using estimated current market rates. Discounted cash flow calculations may be adjusted to reflect current market conditions and/or the perceived credit risk of the Fund as applicable. Consideration may also include an evaluation of collateral.
| | | | | | |
| | 2015 | | SEMIANNUAL REPORT | | 19 |
Restricted Securities. Restricted securities that are deemed to be both Rule 144A securities and illiquid, as well as restricted securities held in non-public entities, are included in Level 3 of the fair value hierarchy because they trade infrequently, and, therefore, the inputs are unobservable. Restricted securities that are valued at a discount to similar publicly traded securities may be categorized as Level 2 of the fair value hierarchy to the extent that the discount is considered to be insignificant to the fair value measurement in its entirety; otherwise they may be categorized as Level 3.
Transfers from Level 2 to Level 3 occurred primarily due to the lack of observable market data due to decreased market activity or information for these securities. Transfers from Level 3 to Level 2 occurred primarily due to the increased availability of observable market data due to increased market activity or information. Transfers between levels represent the values as of the beginning of the reporting period.
For fair valuations using unobservable inputs, U.S. GAAP requires a reconciliation of the beginning to ending balances for reported fair values that presents changes attributable to total realized and unrealized gains or losses, purchases and sales, and transfers in or out of the Level 3 category during the period. The beginning of period timing recognition is used for the transfers between Levels of the Fund’s assets and liabilities. In accordance with the requirements of U.S. GAAP, a fair value hierarchy and Level 3 reconciliation, if any, have been included in the Notes to the Schedule of Investments for the Fund.
Net realized gain (loss) and net unrealized appreciation (depreciation), shown on the reconciliation of Level 3 investments if applicable, are included on the Statement of Operations in net realized gain (loss) on investments in unaffiliated securities and in net change in unrealized appreciation (depreciation) on investments in unaffiliated securities, respectively. Additionally, the net change in unrealized appreciation for all Level 3 investments still held as of March 31, 2015, if applicable, is included on the Statement of Operations in net change in unrealized appreciation (depreciation) on investments in unaffiliated securities.
The Fund may own different types of assets that are classified as Level 2 or Level 3. Assets classified as Level 2 can have a variety of observable inputs, including, but not limited to, benchmark yields, reported trades, broker quotes, benchmark securities, and bid/offer quotations. These observable inputs are collected and utilized, primarily by an independent pricing service, in different evaluated pricing approaches depending upon the specific asset to determine a value.
| 4. | | DERIVATIVE INSTRUMENTS ($ amounts in thousands unless indicated otherwise) |
The following disclosures contain information on why and how the Fund uses derivative instruments, the associated risks of investing in derivative instruments, and how derivative instruments affect the Fund’s financial positions and results of operations when presented by primary underlying risk exposure.
Forward Foreign Currency Contracts. The Fund may enter into forward foreign currency contracts (“forward contracts”) for the purchase or sale of a foreign currency at a negotiated rate at a future date. Forward contracts are reported on a schedule following the Schedule of Investments. Forward contracts will be valued daily based upon the closing prices of the forward currency rates provided by an independent pricing service determined at the close of the NYSE as provided by a bank, dealer or independent pricing service. The resulting unrealized appreciation and depreciation is reported on the Statement of Assets and Liabilities as a receivable or payable and on the Statement of Operations within the change in unrealized appreciation (depreciation). At contract close, the difference between the original cost of the contract and the value at the close date is recorded as a realized gain (loss) on the Statement of Operations.
Risks to the Fund related to the use of such contracts include both market and credit risk. Market risk is the risk that the value of the forward contract will depreciate due to unfavorable changes in the exchange rates. Credit risk arises from the possibility that the counterparty will default. If the counterparty defaults, the Fund’s maximum loss will consist of the aggregate unrealized gain on appreciated contracts that is not collateralized.
Collateral and rights of offset. The Fund may mitigate credit risk with respect to OTC derivative counterparties through credit support annexes (“CSA”) included with an International Swaps and Derivatives Association, Inc. (“ISDA”) Master Agreement which is the standard contract governing most derivative transactions between the Fund and each of its counterparties. The CSA allows the Fund and its counterparty to offset certain derivative financial instruments’ payables and/or receivables against each other and/or with collateral, which is generally held by the Fund’s custodian. The amount of collateral moved to/from applicable counterparties is based upon minimum transfer amounts specified in the CSA. To the extent amounts due to the Fund from its counterparties are not fully collateralized contractually or otherwise, the Fund bears the risk of loss from counterparty non-performance. See Note 2 “Segregation and Collateralization” for additional information with respect to collateral practices.
Offsetting of Assets and Liabilities. FASB Accounting Standards Update 2011-11, Disclosures about Offsetting Assets and Liabilities, requires an entity that has financial instruments that are either (1) offset or (2) subject to an enforceable master netting arrangement or similar agreement to disclose information about offsetting and related arrangements to enable users of its financial statements to understand the effect of those arrangements on its financial position.
| | | | | | |
| 20 | | SEMIANNUAL REPORT | | 2015 | | |
The following table presents financial instruments subject to master netting agreements as of March 31, 2015:
| | | | | | | | | | | | | | | | | | | | | | | | | | | | |
| | | | | | | | | | | | Gross Amounts Not Offset on the
Statement of Assets and Liabilities | |
| | | Gross
Amounts of
Recognized
Assets | | | Gross Amounts
Offset on the
Statement of
Assets and
Liabilities | | | Net Amounts of
Assets
Presented on the
Statement of
Assets and
Liabilities | | | Financial
Instruments and
Derivatives
Available for
Offset | | | Non-Cash
Collateral
Received | | | Cash
Collateral
Received | | | Net
Amount
Receivable | |
Ivy High Income Opportunities Fund | | | | | | | | | | | | | | | | | | | | | | | | | |
| Unrealized appreciation on forward foreign currency contracts | | $ | 23 | | | $ | — | | | $ | 23 | | | $ | — | | | $ | — | | | $ | — | | | $ | 23 | |
| Additional | | Disclosure Related to Derivative Instruments |
Fair values of derivative instruments as of period ended March 31, 2015:
| | | | | | | | | | |
| | | | | Assets | | Liabilities |
| | | Type of Risk
Exposure | | Statement of Assets & Liabilities
Location | | Value | | Statement of Assets & Liabilities
Location | | Value |
| Ivy High Income Opportunities Fund | | Foreign currency | | Unrealized appreciation on
forward foreign currency contracts | | $23 | | | | $— |
Amount of realized gain (loss) on derivatives recognized on the Statement of Operations for the period ended March 31, 2015:
| | | | | | | | | | | | | | |
| | | | | Net realized gain (loss) on: | | |
| | | Type of Risk
Exposure | | Investments in
unaffiliated
securities* | | Swap
agreements | | Futures
contracts | | Written
options | | Forward
foreign
currency
contracts | | Total |
| Ivy High Income Opportunities Fund | | Foreign currency | | $— | | $— | | $— | | $— | | $1,539 | | $1,539 |
| *Purchased | options are reported as investments in unaffiliated securities and are reflected in the accompanying Schedule of Investments. |
Change in unrealized appreciation (depreciation) on derivatives recognized on the Statement of Operations for the period ended March 31, 2015:
| | | | | | | | | | | | | | |
| | | | | Net change in unrealized appreciation (depreciation) on: | | |
| | | Type of Risk
Exposure | | Investments in
unaffiliated
securities* | | Swap
agreements | | Futures
contracts | | Written
options | | Forward
foreign
currency
contracts | | Total |
| Ivy High Income Opportunities Fund | | Foreign currency | | $— | | $— | | $— | | $— | | $(544) | | $(544) |
| *Purchased | options are reported as investments in unaffiliated securities and are reflected in the accompanying Schedule of Investments. |
During the period ended March 31, 2015, the average derivative volume was as follows:
| | | | | | | | | | | | | | | | | | | | | | | | |
| | | Forward foreign
currency contracts(1) | | | Long futures
contracts(1) | | | Short futures
contracts(1) | | | Swap
agreements(2) | | | Purchased
options(1) | | | Written
options(1) | |
Ivy High Income Opportunities Fund | | $ | 150 | | | $ | — | | | $ | — | | | $ | — | | | $ | — | | | $ | — | |
| (1) | Average value outstanding during the period. |
| (2) | Average notional amount outstanding during the period. |
The derivative instruments outstanding as of period end and the amounts of realized and changes in unrealized gains and losses on derivative instruments during the period, as disclosed in the Statement of Operations and Notes to Schedule of Investments, serve as indicators of the volume of derivative activity for the Fund.
Objective and Strategy
Ivy High Income Opportunities Fund. The Fund’s objective in using derivatives during the period was to hedge the exposure to foreign currencies of securities held in the Fund. To achieve this objective, the Fund utilized forward foreign currency contracts.
| 5. | | INVESTMENT MANAGEMENT AND PAYMENTS TO AFFILIATED PERSONS ($ amounts in thousands unless indicated otherwise) |
Management Fees. IICO, a wholly owned subsidiary of Waddell & Reed Financial, Inc. (“WDR”), serves as the Fund’s investment manager. The Fund has agreed to pay the Adviser a management fee at an annual rate 1.00% of the average daily value of the Fund’s “Managed Assets”. Managed Assets means the Fund’s total assets, including the assets attributable to the proceeds from any borrowings or other forms of structural leverage, minus liabilities other than the aggregate indebtedness entered into for purposes of leverage.
| | | | | | |
| | 2015 | | SEMIANNUAL REPORT | | 21 |
Accounting Services Fees. The Fund has an Accounting Services and Administrative Agreement with WRSCO, doing business as WI Services Company (“WISC”), an indirect subsidiary of WDR. Under the agreement, WISC acts as the agent in providing bookkeeping and accounting services and assistance to the Fund, including maintenance of Fund records, pricing of Fund shares and preparation of certain shareholder reports. For these services, the Fund pays WISC a monthly fee of one-twelfth of the annual fee based on the average managed asset levels shown in the following table:
| | | | | | | | | | | | | | | | | | | | | | | | | | | | | | | | | | | | | | | | |
| (M-Millions) | | $0 to
$10M | | | $10 to
$25M | | | $25 to
$50M | | | $50 to
$100M | | | $100 to
$200M | | | $200 to
$350M | | | $350 to
$550M | | | $550 to
$750M | | | $750 to
$1,000M | | | Over
$1,000M | |
Annual Fee Rate | | $ | 0.00 | | | $ | 11.50 | | | $ | 23.10 | | | $ | 35.50 | | | $ | 48.40 | | | $ | 63.20 | | | $ | 82.50 | | | $ | 96.30 | | | $ | 121.60 | | | $ | 148.50 | |
The Fund also pays WISC a monthly administrative fee at the annual rate of 0.01%, or one basis point, for the first $1 billion of managed assets with no fee charged for managed assets in excess of $1 billion. This fee is voluntarily waived by WISC until the Fund’s managed assets are at least $10 million and is included in “Accounting services fee” on the Statement of Operations.
Other Fees. The Fund pays all costs and expenses of its operations, including, but not limited to, compensation of its trustees (other than those affiliated with the Adviser), custodian, administrator, leveraging expenses, transfer and dividend disbursing agent expenses, legal fees, rating agency fees, listing fees and expenses, expenses of independent auditors, expenses of repurchasing shares, expenses of preparing, printing and distributing shareholder reports, notices, proxy statements and reports to governmental agencies and taxes, if any.
| 6. | | INVESTMENT SECURITIES TRANSACTIONS ($ amounts in thousands) |
The cost of purchases and the proceeds from maturities and sales of investment securities (excluding short-term securities) for the period ended March 31, 2015, were as follows:
| | | | | | | | | | | | | | | | |
| | | Purchases | | | Sales | |
| | | U.S. Government | | | Other Issuers | | | U.S. Government | | | Other Issuers | |
Ivy High Income Opportunities Fund | | $ | — | | | $ | 95,512 | | | $ | — | | | $ | 119,778 | |
The Fund entered into a $160 million (“Facility Limit”) prime brokerage facility (“Borrowings”) with Bank of America, N.A. as a means of financial leverage. Interest was charged on the Borrowings at the British Bankers Association London Interbank Offered Rate (“BBA LIBOR”) plus 0.75% on the amount borrowed. The Fund also accrued a commitment fee of 0.25% on the daily undrawn portion of the Facility Limit. The commitment fee was calculated monthly in arrears and was due and payable monthly in arrears on each interest payment date and maturity date. No commitment fee was due on any interest payment date where the average daily undrawn portion of the Facility Limit during the month for which payment was otherwise due on such interest payment date was less than 20% of the Facility Limit. Effective December 11, 2014 this agreement was terminated. For the period from April 1, 2014 to December 11, 2014, the average daily balance outstanding and weighted interest rate on the Borrowings were $133,617,647 and 0.904%, respectively.
On December 12, 2014, the Fund entered into a $160 million prime brokerage facility with Pershing LLC. Interest is charged on the Borrowings at the one month LIBOR plus 0.75% on the amount borrowed. There are no other fees associated with this borrowing arrangement. For the period from December 12, 2014 to March 31, 2015, the average daily balance outstanding and weighted interest rate on the Borrowings were $134,500,000 and 0.921%, respectively.
In order to maintain the Borrowings, the Fund must meet certain collateral, asset coverage and other requirements. Borrowings outstanding are secured by securities held by the Fund.
Borrowings outstanding are recognized as “Payable for borrowing” on the Statement of Assets and Liabilities. Interest charged on the amount borrowed and undrawn balance are each recognized as a component of “Interest expense for borrowing” on the Statement of Operations.
| 8. | | CAPITAL SHARE TRANSACTIONS ($ amounts in thousands) |
The Fund has authorized 18,750,000 of $0.001 par value common shares of beneficial interest. There were no transactions in shares of beneficial interest during the period ended March 31, 2015.
Bridge loan commitments may obligate the Fund to furnish temporary financing to a borrower until permanent financing can be arranged. In connection with these commitments, the Fund earns a commitment fee, typically set as a percentage of the commitment amount. Such fee income is included in interest income on the Statement of Operations. At period ended March 31, 2015, the Fund did not have any bridge loan commitments outstanding.
| 10. | | FEDERAL INCOME TAX MATTERS ($ amounts in thousands) |
For Federal income tax purposes, cost of investments owned at March 31, 2015 and the related unrealized appreciation (depreciation) were as follows:
| | | | | | | | | | | | | | | | |
| Fund | | Cost of
Investments | | | Gross
Appreciation | | | Gross
Depreciation | | | Net
Unrealized
Appreciation
(Depreciation) | |
Ivy High Income Opportunities Fund | | $ | 433,403 | | | $ | 5,010 | | | $ | 19,083 | | | $ | (14,073 | ) |
| | | | | | |
| 22 | | SEMIANNUAL REPORT | | 2015 | | |
For Federal income tax purposes, the Fund’s distributed and undistributed earnings and profit for the year ended September 30, 2014 and the post-October and late-year ordinary activity were as follows:
| | | | | | | | | | | | | | | | | | | | | | | | | | | | |
| Fund | | Distributed
Ordinary
Income | | | Undistributed
Ordinary
Income | | | Distributed
Long-Term
Capital Gains | | | Undistributed
Long-Term
Capital Gains | | | Tax Return
of Capital | | | Post-
October
Capital
Losses
Deferred | | | Late-Year
Ordinary
Losses
Deferred | |
Ivy High Income Opportunities Fund | | $ | 30,658 | | | $ | 6,198 | | | $ | — | | | $ | 838 | | | $ | — | | | $ | — | | | $ | — | |
Internal Revenue Code regulations permit the Fund to elect to defer into its next fiscal year capital losses incurred between each November 1 and the end of its fiscal year. The Fund is also permitted to defer into its next fiscal year late-year ordinary losses that arise from the netting of activity generated between each November 1 and the end of its fiscal year on certain specified ordinary items.
| | | | | | |
| | 2015 | | SEMIANNUAL REPORT | | 23 |
DIVIDEND REINVESTMENT PLAN
Ivy High Income Opportunities Fund
Pursuant to the Fund’s Dividend Reinvestment Plan (the “DRIP”), unless you elect to receive distributions in cash (i.e., opt-out), all dividends, including any capital gain dividends, on your common shares will be automatically reinvested by Computershare Trust Company, N.A., as agent for the shareholders (the “DRIP Agent”), in additional common shares under the DRIP. You may elect not to participate in the DRIP by contacting the DRIP Agent. If you do not participate, you will receive all cash distributions paid by check mailed directly to you by Computershare, Inc. as dividend paying agent.
If you participate in the DRIP, the number of common shares you will receive will be determined as follows:
(1) If the market price of the common shares on the record date (or, if the record date is not a New York Stock Exchange (“NYSE”) trading day, the immediately preceding trading day) for determining shareholders eligible to receive the relevant dividend or distribution (the “determination date”) is equal to or exceeds 98% of the net asset value per share of the common shares, the Fund will issue new common shares at a price equal to the greater of:
| (a) | 98% of the net asset value per share at the close of trading on the NYSE on the determination date or |
| (b) | 95% of the market price of the common shares on the determination date. |
(2) If 98% of the net asset value per share of the common shares exceeds the market price of the common shares on the determination date, the DRIP Agent will receive the dividend or distribution in cash and will buy common shares in the open market, on the NYSE or elsewhere, for your account as soon as practicable commencing on the trading day following the determination date and terminating no later than the earlier of (a) 30 days after the dividend or distribution payment date, or (b) the record date for the next succeeding dividend or distribution to be made to the shareholders; except when necessary to comply with applicable provisions of the federal securities laws. If during this period: (i) the market price rises so that it equals or exceeds 98% of the net asset value per share of the common shares at the close of trading on the NYSE on the determination date before the DRIP Agent has completed the open market purchases or (ii) if the DRIP Agent is unable to invest the full amount eligible to be reinvested in open market purchases, the DRIP Agent will cease purchasing common shares in the open market and the Fund shall issue the remaining common shares at a price per share equal to the greater of (a) 98% of the net asset value per share at the close of trading on the NYSE on the determination date or (b) 95% of the then-current market price per share.
Common shares in your account will be held by the DRIP Agent in non-certificated form. Any proxy you receive will include all shares of common shares you have received under the DRIP.
You may withdraw from the DRIP (i.e., opt-out) by notifying the DRIP Agent in writing at P.O. Box 43078, Providence, Rhode Island 02940-3078. Such withdrawal will be effective immediately if notice is received by the DRIP Agent prior to any dividend or distribution record date; otherwise such withdrawal will be effective as soon as practicable after the DRIP Agent’s investment of the most recently declared dividend or distribution on the common shares. The DRIP may be amended or supplemented by the Fund upon notice in writing mailed to shareholders at least 30 days prior to the record date for the payment of any dividend or distribution by the Fund for which the termination is to be effective. Upon any termination, the DRIP Agent will continue to hold whole shares for you in non-certificated form until otherwise notified by you, and will cause a cash adjustment for any fractional shares to be delivered to you after deducting brokerage commissions actually incurred. You may elect to notify the DRIP Agent in advance of such termination, or at any time following termination, to have the DRIP Agent sell part or all of your common shares on your behalf. You will be charged a service charge and the DRIP Agent is authorized to deduct brokerage charges actually incurred for this transaction from the proceeds.
There is no service charge for reinvestment of your dividends or distributions in common shares. However, all participants will pay a per share processing fee, which includes any brokerage commissions incurred by the DRIP Agent when it makes open market purchases. Because all dividends and distributions will be automatically reinvested in additional common shares, this allows you to add to your investment through dollar cost averaging, which may lower the average cost of your common shares over time. Dollar cost averaging is a technique for lowering the average cost per share over time if the Fund’s net asset value declines. While dollar cost averaging has definite advantages, it cannot assure profit or protect against loss in declining markets.
Automatically reinvesting dividends and distributions does not mean that you do not have to pay income taxes due upon receiving dividends and distributions. Investors will be subject to income tax on amounts reinvested under the DRIP.
The Fund reserves the right to amend or terminate the DRIP if, in the judgment of the Board, the change is warranted. There is no direct service charge to participants in the DRIP; however, the Fund reserves the right to amend the DRIP to include a service charge payable by the participants.
Additional information about the DRIP and your account may be obtained from the DRIP Agent at P.O. Box 43078, Providence, Rhode Island 02940-3078 or by calling the DRIP Agent at (800)-426-5523.
| | | | | | |
| 24 | | SEMIANNUAL REPORT | | 2015 | | |
This page has been intentionally left blank
| | | | | | |
| | 2015 | | SEMIANNUAL REPORT | | 25 |
This page has been intentionally left blank
| | | | | | |
| 26 | | SEMIANNUAL REPORT | | 2015 | | |
PROXY VOTING INFORMATION
Ivy High Income Opportunities Fund
Proxy Voting Guidelines
A description of the policies and procedures the Fund uses to determine how to vote proxies relating to portfolio securities is available (i) without charge, upon request, by calling 1.800.777.6472 and (ii) on the Securities and Exchange Commission’s (“SEC”) website at www.sec.gov.
Proxy Voting Records
Information regarding how the Fund voted proxies relating to portfolio securities during the most recent 12-month period ended June 30 is available on Form N-PX through the Ivy Funds’ website at www.ivyfunds.com and on the SEC’s website at www.sec.gov.
QUARTERLY PORTFOLIO SCHEDULE INFORMATION
Ivy High Income Opportunities Fund
Portfolio holdings can be found on the Fund’s website at www.ivyfunds.com. Alternatively, a complete schedule of portfolio holdings of the Fund for the first and third quarters of each fiscal year is filed with the SEC and can be found on the Fund’s Form N-Q. These holdings may be viewed in the following ways:
| • | | On the SEC’s website at www.sec.gov. |
| • | | For review and copy at the SEC’s Public Reference Room in Washington, DC. Information on the operations of the Public Reference Room may be obtained by calling 1.800.SEC.0330. |
Visit us online at www.ivyfunds.com
The Fund is managed by Ivy Investment Management Company.
| | | | | | |
| | 2015 | | SEMIANNUAL REPORT | | 27 |
SEMIANN-IVH (3-15)
ITEM 2. CODE OF ETHICS
Required in annual report only.
ITEM 3. AUDIT COMMITTEE FINANCIAL EXPERT
Required in annual report only.
ITEM 4. PRINCIPAL ACCOUNTANT FEES AND SERVICES.
Required in annual report only.
ITEM 5. AUDIT COMMITTEE OF LISTED REGISTRANTS
Not applicable.
ITEM 6. SCHEDULE OF INVESTMENTS.
See Item 1 Shareholder Report.
ITEM 7. DISCLOSURE OF PROXY VOTING POLICIES AND PROCEDURES FOR CLOSED-END
MANAGEMENT INVESTMENT COMPANIES
Not applicable.
ITEM 8. PORTFOLIO MANAGERS OF CLOSED-END MANAGEMENT INVESTMENT COMPANIES.
Not applicable.
ITEM 9. PURCHASES OF EQUITY SECURITIES BY CLOSED-END MANAGEMENT INVESTMENT COMPANY AND AFFILIATED PURCHASERS
| | | | | | | | | | | | | | | | |
Period* | | (a)
TOTAL
NUMBER OF
SHARES (OR
UNITS)
PURCHASED | | | (b)
AVERAGE
PRICE
PAID PER
SHARE
(OR UNIT) | | | (c)
TOTAL NUMBER OF
SHARES (OR UNITS)
PURCHASED AS
PART OF PUBLICLY
ANNOUNCED PLANS
OR PROGRAMS | | | (d)*
MAXIMUM NUMBER (OR
APPROXIMATE DOLLAR
VALUE) OF SHARES (OR
UNITS) THAT MAY YET BE
PURCHASED UNDER THE
PLANS OR PROGRAMS | |
10-1-14 – 10-31-14 | | | 11,896 | | | $ | 17.67 | | | | 11,896 | | | | 2,182,912 | |
11-1-14 – 11-30-14 | | | 12,322 | | | $ | 16.95 | | | | 12,322 | | | | 2,182,912 | |
12-1-14 – 12-31-14 | | | 58,726 | | | $ | 15.89 | | | | 58,726 | | | | 2,182,912 | |
1-1-15 – 1-31-15 | | | 12,276 | | | $ | 15.92 | | | | 12,276 | | | | 2,182,912 | |
2-1-15 – 2-28-15 | | | 11,969 | | | $ | 16.24 | | | | 11,969 | | | | 2,182,912 | |
3-1-15 – 3-31-15 | | | 11,784 | | | $ | 16.39 | | | | 11,784 | | | | 2,182,912 | |
TOTAL | | | 118,973 | | | | | | | | | | | | | |
| * | The registrant’s repurchase program, for the repurchase of 2,182,912 shares, was authorized May 29, 2013. Any repurchases made by the registrant pursuant to the program were made through open-market transactions and not through the issuance of new shares. |
ITEM 10. SUBMISSION OF MATTERS TO A VOTE OF SECURITY HOLDERS
There have been no material changes to the procedures by which shareholders may recommend nominees to the Registrant’s board of directors.
ITEM 11. CONTROLS AND PROCEDURES.
| (a) | The Registrant’s Principal Executive Officer and Principal Financial Officer, or persons performing similar functions, based on their evaluation of the Registrant’s disclosure controls and procedures as of a date within 90 days of the filing date of this report, have concluded that such controls and procedures (as defined in Rule 30a-3(c) under the Investment Company Act of 1940, as amended) are effective and adequately designed to ensure that information required to be disclosed by the Registrant in its reports that it files or submits is accumulated and communicated to the Registrant’s management, including the Principal Executive Officer and Principal Financial Officer, or persons performing similar functions, as appropriate, to allow timely decisions regarding required disclosure. |
| (b) | There were no significant changes in the registrant’s internal controls over financial reporting (as defined in Rule 30a-3(d) under the Investment Company Act of 1940, as amended) that occurred during the registrant’s second fiscal half-year that has materially affected, or is reasonably likely to materially affect, the registrant’s internal control over financial reporting. |
ITEM 12. EXHIBITS.
| (a)(1) | Required in annual report only. |
| (a)(2) | A separate certification for each principal executive officer and principal financial officer of the registrant as required by Rule 30a-2(a) under the Investment Company Act of 1940 (17 CFR
270.30a-2(a)). |
Attached hereto as Exhibit 99.CERT.
| (b) | A separate certification for each principal executive officer and principal financial officer of the registrant as required by Rule 30a-2(b) under the Investment Company Act of 1940 (17 CFR
270.30a-2(b)). |
Attached hereto as Exhibit 99.906CERT.
SIGNATURES
Pursuant to the requirements of the Securities Exchange Act of 1934 and the Investment Company Act of 1940, the registrant has duly caused this report to be signed on its behalf by the undersigned, thereunto duly authorized.
| | |
| Ivy High Income Opportunities Fund |
| (Registrant) |
| |
| By | | /s/ Mara D. Herrington |
| | Mara D. Herrington, Vice President and Secretary |
Date: June 4, 2015
Pursuant to the requirements of the Securities Exchange Act of 1934 and the Investment Company Act of 1940, this report has been signed below by the following persons on behalf of the registrant and in the capacities and on the dates indicated.
| | |
| By | | /s/ Henry J. Herrmann |
| | Henry J. Herrmann, President and Principal Executive Officer |
Date: June 4, 2015
| | |
| By | | /s/ Joseph W. Kauten |
| | Joseph W. Kauten, Vice President and Principal Financial Officer |
Date: June 4, 2015