HIOSCAR.COM Oscar Health, Inc. Second Quarter 2022 Earnings Presentation August 11, 2022
Safe Harbor Statement and Forward-Looking Statements 2 This presentation contains forward-looking statements within the meaning of the Private Securities Litigation Reform Act of 1995. All statements other than statements of historical fact contained herein are forward-looking statements. These statements include, but are not limited to, statements about our financial outlook and estimates, including direct and assumed policy premiums, medical loss ratio, InsuranceCo administrative expense ratio, adjusted administrative expense ratio, adjusted EBITDA, and other financial performance, and the related underlying assumptions, our business and financial prospects, and our management’s plans and objectives for future operations, expectations and business strategy. In some cases, you can identify forward-looking statements by terms such as “may,” “will,” “should,” “expects,” “plans,” “anticipates,” “could,” “intends,” “targets,” “projects,” “contemplates,” “believes,” “estimates,” “predicts,” “potential,” or “continue” or the negative of these terms or other similar expressions. Accordingly, we caution you that any such forward-looking statements are not guarantees of future performance and are subject to risks, assumptions, and uncertainties that are difficult to predict and generally beyond our control. Although we believe that the expectations reflected in these forward-looking statements are reasonable as of the date made, there are or will be important factors that could cause our actual results to differ materially from those indicated in these forward-looking statements, including, but not limited to, the following: the impact of COVID-19 on global markets, economic conditions, the healthcare industry and our results of operations, and the response by governments and other third parties; our ability to retain and expand our member base; our ability to execute our growth strategy and scale our operations; our ability to maintain or enter into new partnerships, service arrangements or collaborations with healthcare industry participants; negative publicity, unfavorable shifts in perception of our digital platform or other member service channels; our ability to achieve and/or maintain profitability in the future; changes in federal or state laws or regulations, including changes with respect to the Patient Protection and Affordable Care Act and the Health Care and Education Reconciliation Act of 2010, as amended (collectively, the “ACA”) and any regulations enacted thereunder; our ability to accurately estimate our incurred claims expenses or effectively manage our claims costs or related administrative costs, including as a result of fluctuations in medical utilization rates due to the impact of COVID-19; our ability to comply with ongoing regulatory requirements and applicable performance standards, including as a result of our participation in government-sponsored programs, such as Medicare, and as a result of changing regulatory requirements; changes or developments in the health insurance markets in the United States, including the passage and implementation of a law to create a single-payer or government-run health insurance program; our ability to comply with applicable privacy, security, and data laws, regulations, and standards; our ability to maintain key in-network providers and good relations with the physicians, hospitals, and other providers within and outside our provider networks, or to arrange for the delivery of quality care; unfavorable or otherwise costly outcomes of lawsuits, regulatory investigations and audits and claims that arise from the extensive laws and regulations to which we are subject; unanticipated results of risk adjustment programs; delays in our receipt of premiums; disruptions or challenges to our relationship with the Oscar Medical Group; cyber-security breaches of our and our partners’ information and technology systems; unanticipated changes in population morbidity and large-scale changes in health care utilization; and the other factors set forth under the caption “Risk Factors” in our Quarterly Report on Form 10-Q for the quarterly period ended March 31, 2022, filed with the Securities and Exchange Commission (“SEC”), and our other filings with the SEC, including our Quarterly Report on Form 10-Q for the quarterly period ended June 30, 2022, to be filed with the SEC. You are cautioned not to place undue reliance on any forward-looking statements made in this presentation. Any forward-looking statement speaks only as of the date as of which it is made, and, except as otherwise required by law, we do not undertake any obligation to publicly update or review any forward-looking statement, whether as a result of new information, future developments or otherwise. New factors emerge from time to time, and it is not possible for us to predict which will arise. This presentation presents Adjusted EBITDA, a non-GAAP financial metric, which is provided as a complement to the results provided in accordance with accounting principles generally accepted in the United States of America (“GAAP”). A reconciliation of such non-GAAP financial information to the most directly comparable GAAP financial measure is provided at the end of this presentation.
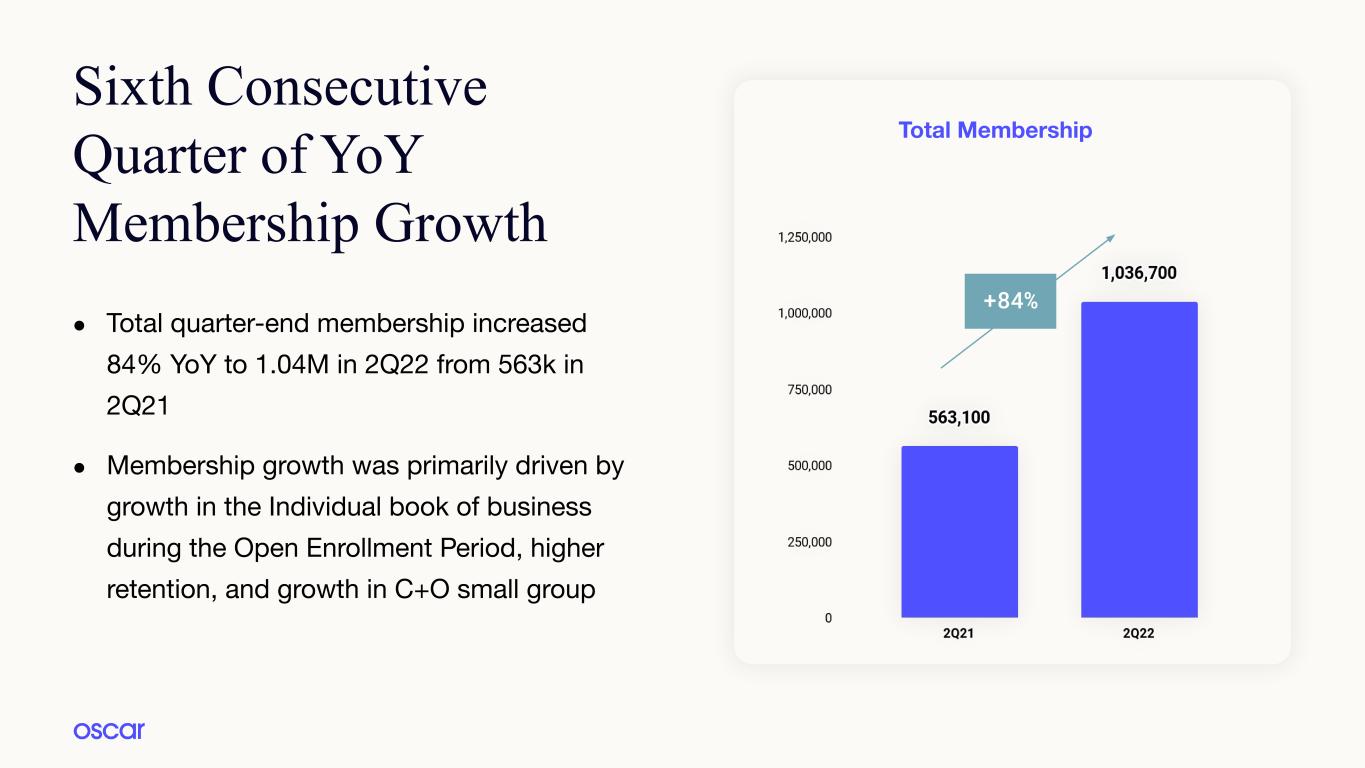
Sixth Consecutive Quarter of YoY Membership Growth ● Total quarter-end membership increased 84% YoY to 1.04M in 2Q22 from 563k in 2Q21 ● Membership growth was primarily driven by growth in the Individual book of business during the Open Enrollment Period, higher retention, and growth in C+O small group Total Membership +84%
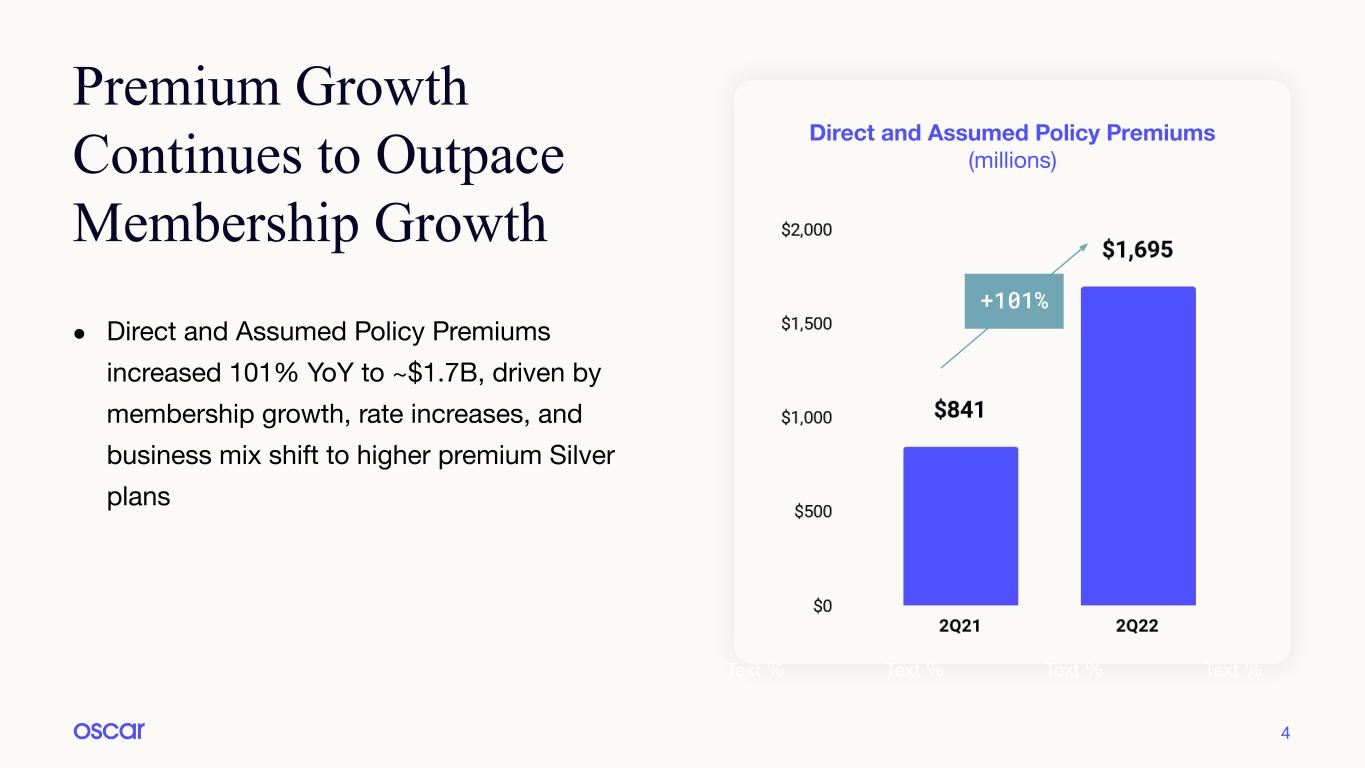
Premium Growth Continues to Outpace Membership Growth 4 Text % Text % Text % Text % ● Direct and Assumed Policy Premiums increased 101% YoY to ~$1.7B, driven by membership growth, rate increases, and business mix shift to higher premium Silver plans Direct and Assumed Policy Premiums (millions) +101%
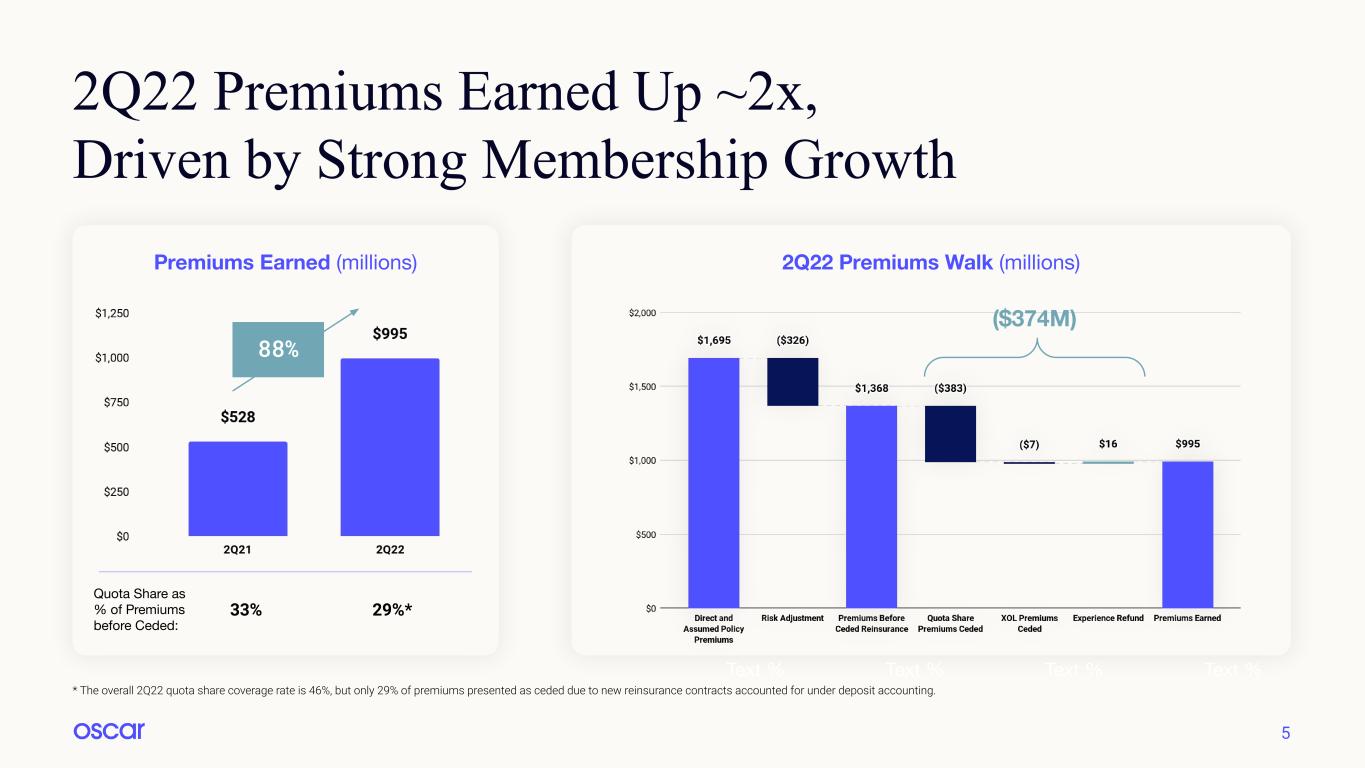
5 Text % Text % Text % Text % 2Q22 Premiums Walk (millions)Premiums Earned (millions) * The overall 2Q22 quota share coverage rate is 46%, but only 29% of premiums presented as ceded due to new reinsurance contracts accounted for under deposit accounting. Quota Share as % of Premiums before Ceded: 33% 29%* 88% 2Q22 Premiums Earned Up ~2x, Driven by Strong Membership Growth ($374M)

2Q22 MLR Improved ~20bps YoY 6 2Q22 MLR of 82.2% improved YoY primarily due to pricing and lower net COVID-19 impact and mix shifts in the population, partially offset by lower net favorable development 2Q22 MLR 1H22 MLR of 79.9% increased YoY primarily due to unfavorable prior year development, which was partially offset by pricing and mix shifts in population 1H22 MLR
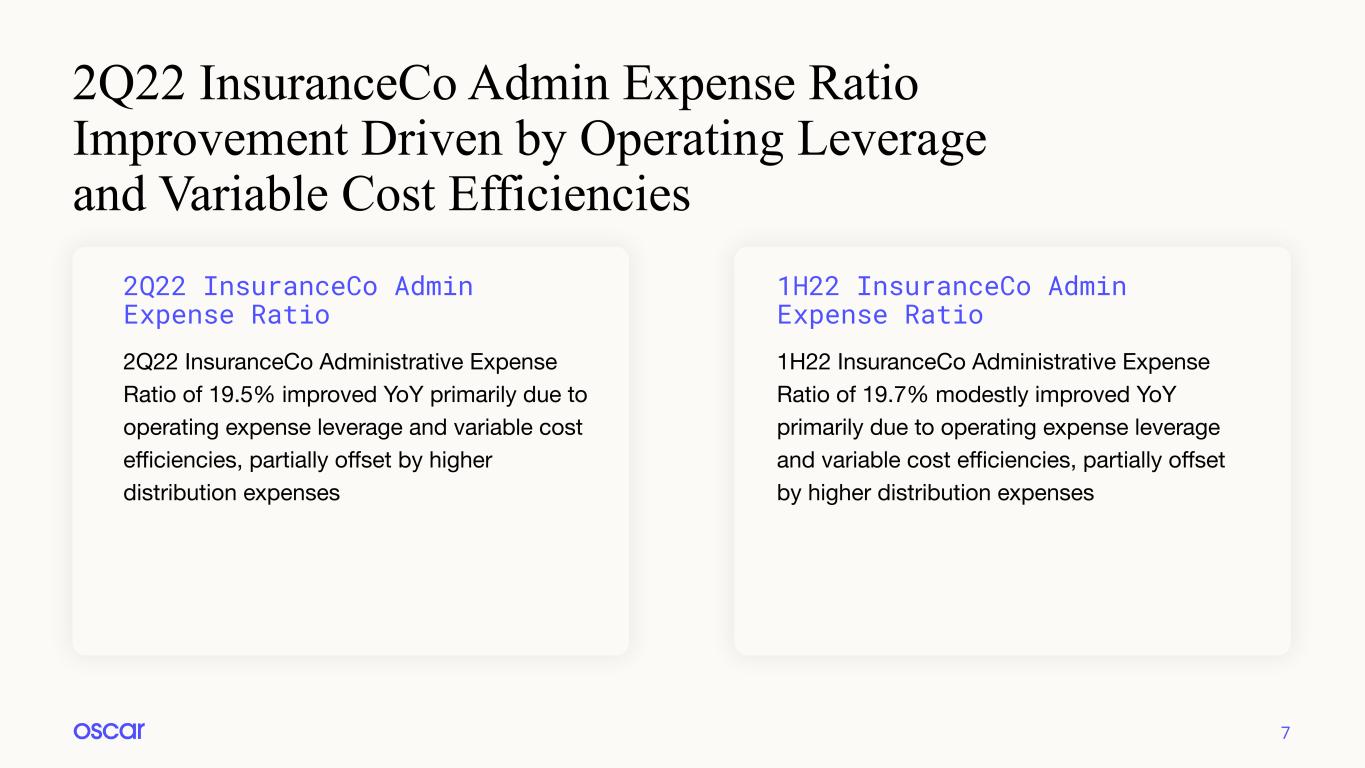
2Q22 InsuranceCo Admin Expense Ratio Improvement Driven by Operating Leverage and Variable Cost Efficiencies 7 2Q22 InsuranceCo Administrative Expense Ratio of 19.5% improved YoY primarily due to operating expense leverage and variable cost efficiencies, partially offset by higher distribution expenses 2Q22 InsuranceCo Admin Expense Ratio 1H22 InsuranceCo Administrative Expense Ratio of 19.7% modestly improved YoY primarily due to operating expense leverage and variable cost efficiencies, partially offset by higher distribution expenses 1H22 InsuranceCo Admin Expense Ratio
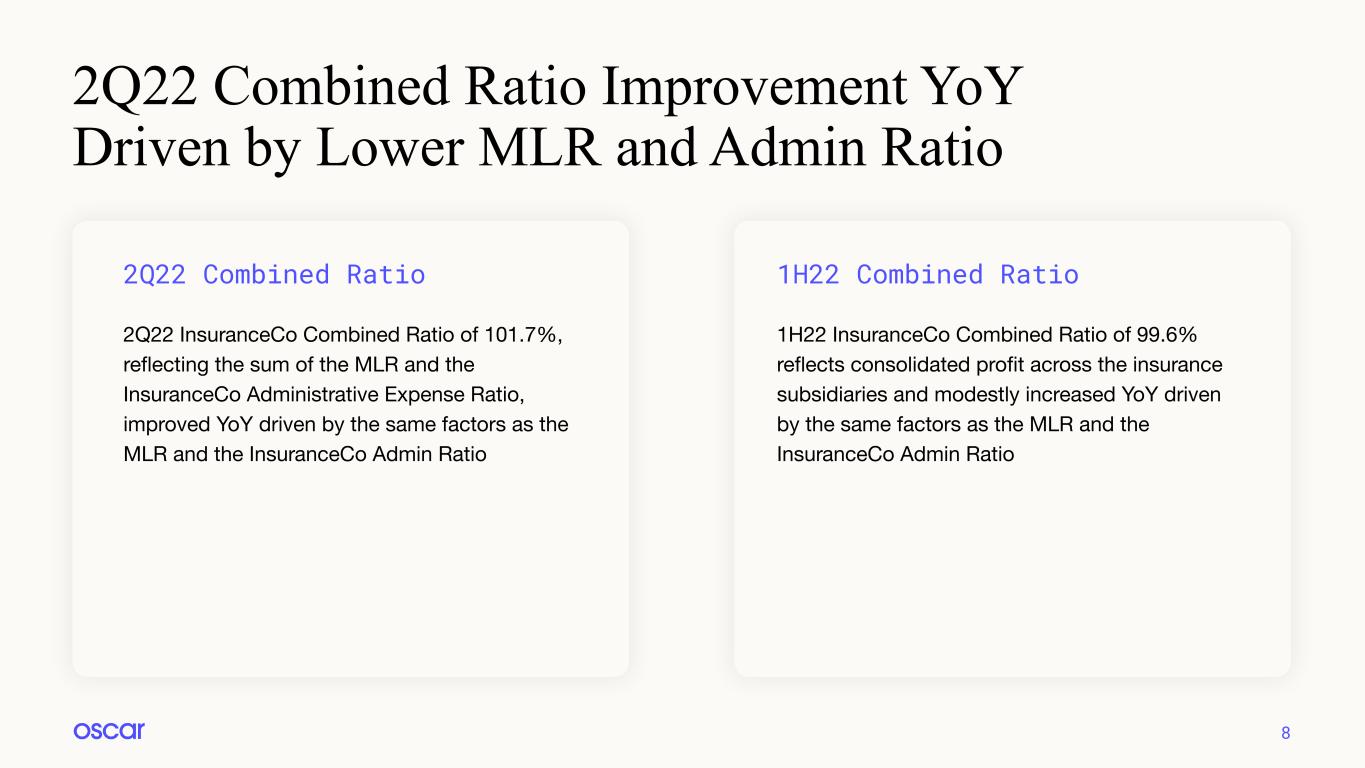
2Q22 Combined Ratio Improvement YoY Driven by Lower MLR and Admin Ratio 8 2Q22 InsuranceCo Combined Ratio of 101.7%, reflecting the sum of the MLR and the InsuranceCo Administrative Expense Ratio, improved YoY driven by the same factors as the MLR and the InsuranceCo Admin Ratio 2Q22 Combined Ratio 1H22 InsuranceCo Combined Ratio of 99.6% reflects consolidated profit across the insurance subsidiaries and modestly increased YoY driven by the same factors as the MLR and the InsuranceCo Admin Ratio 1H22 Combined Ratio
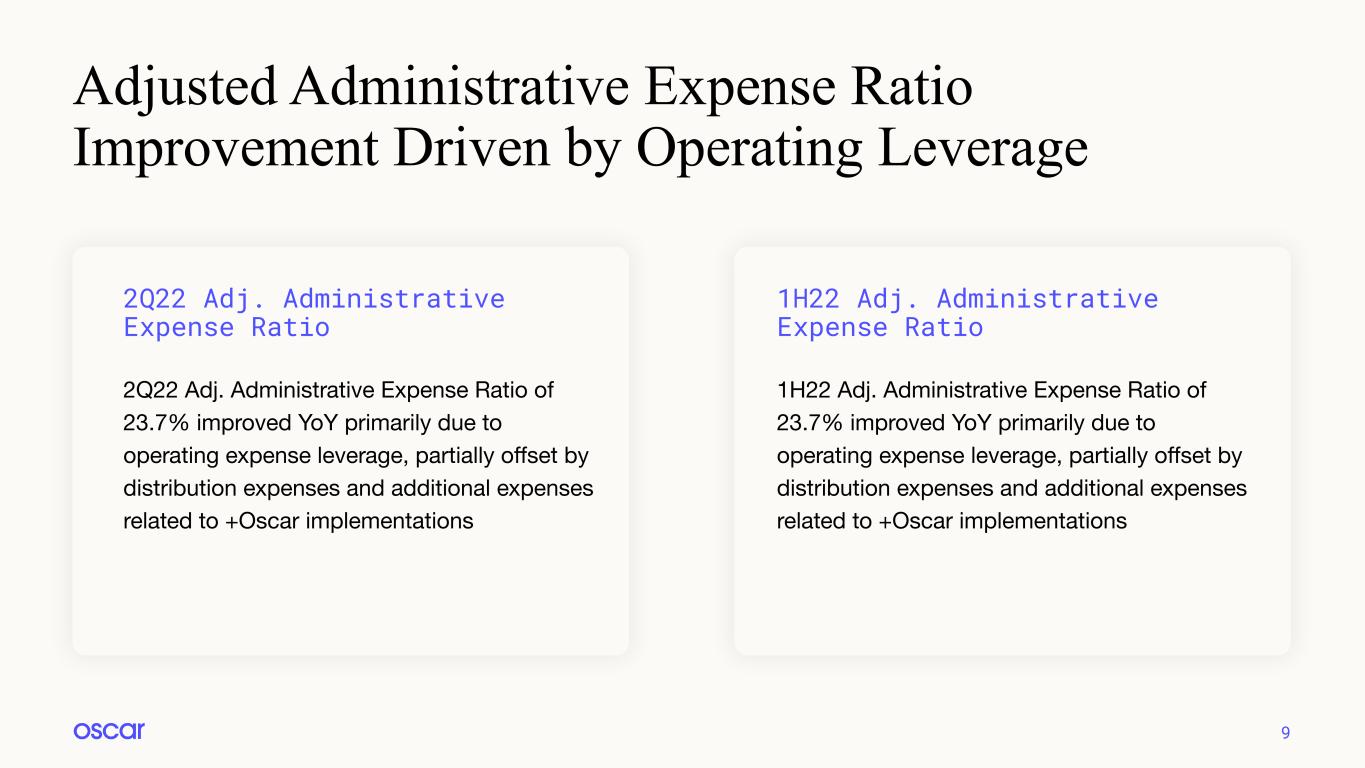
Adjusted Administrative Expense Ratio Improvement Driven by Operating Leverage 9 2Q22 Adj. Administrative Expense Ratio of 23.7% improved YoY primarily due to operating expense leverage, partially offset by distribution expenses and additional expenses related to +Oscar implementations 2Q22 Adj. Administrative Expense Ratio 1H22 Adj. Administrative Expense Ratio of 23.7% improved YoY primarily due to operating expense leverage, partially offset by distribution expenses and additional expenses related to +Oscar implementations 1H22 Adj. Administrative Expense Ratio
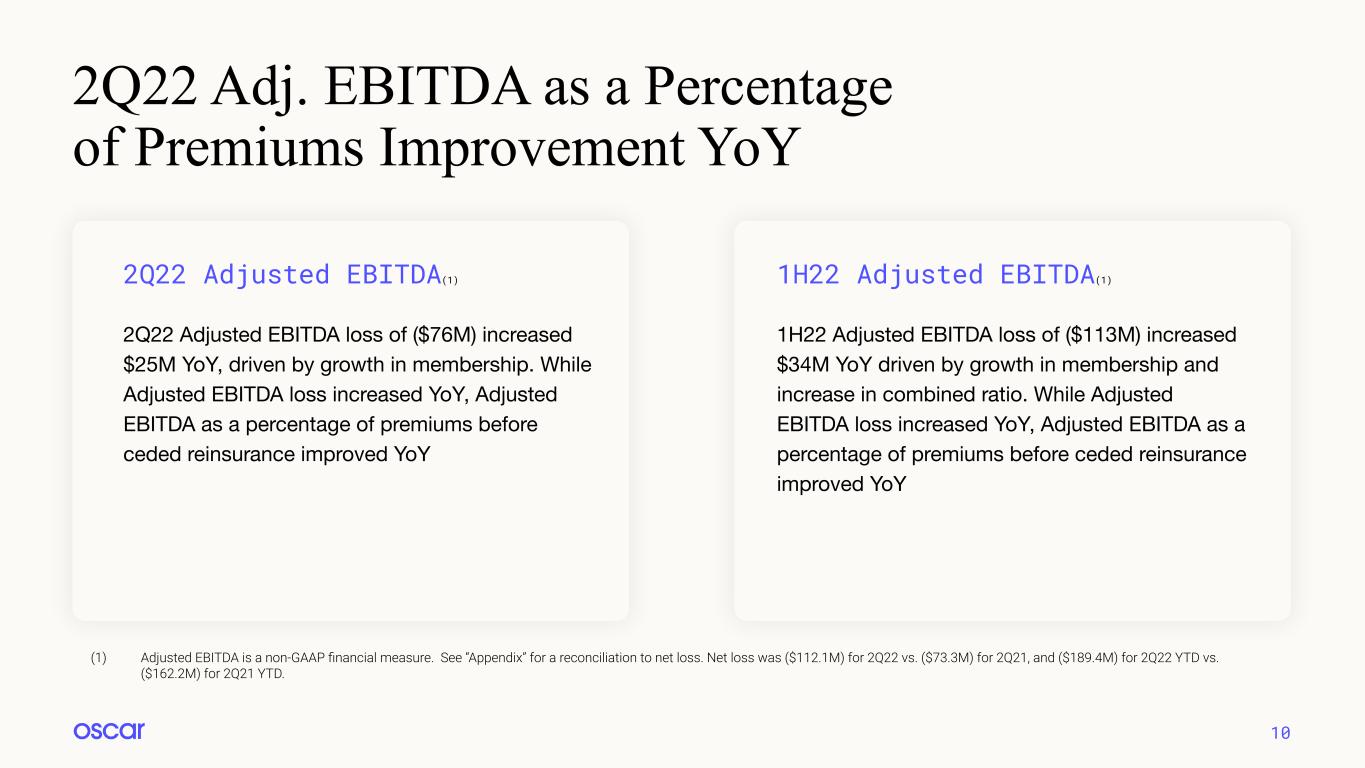
2Q22 Adj. EBITDA as a Percentage of Premiums Improvement YoY 10 2Q22 Adjusted EBITDA loss of ($76M) increased $25M YoY, driven by growth in membership. While Adjusted EBITDA loss increased YoY, Adjusted EBITDA as a percentage of premiums before ceded reinsurance improved YoY 2Q22 Adjusted EBITDA(1) 1H22 Adjusted EBITDA loss of ($113M) increased $34M YoY driven by growth in membership and increase in combined ratio. While Adjusted EBITDA loss increased YoY, Adjusted EBITDA as a percentage of premiums before ceded reinsurance improved YoY 1H22 Adjusted EBITDA(1) (1) Adjusted EBITDA is a non-GAAP financial measure. See “Appendix” for a reconciliation to net loss. Net loss was ($112.1M) for 2Q22 vs. ($73.3M) for 2Q21, and ($189.4M) for 2Q22 YTD vs. ($162.2M) for 2Q21 YTD.
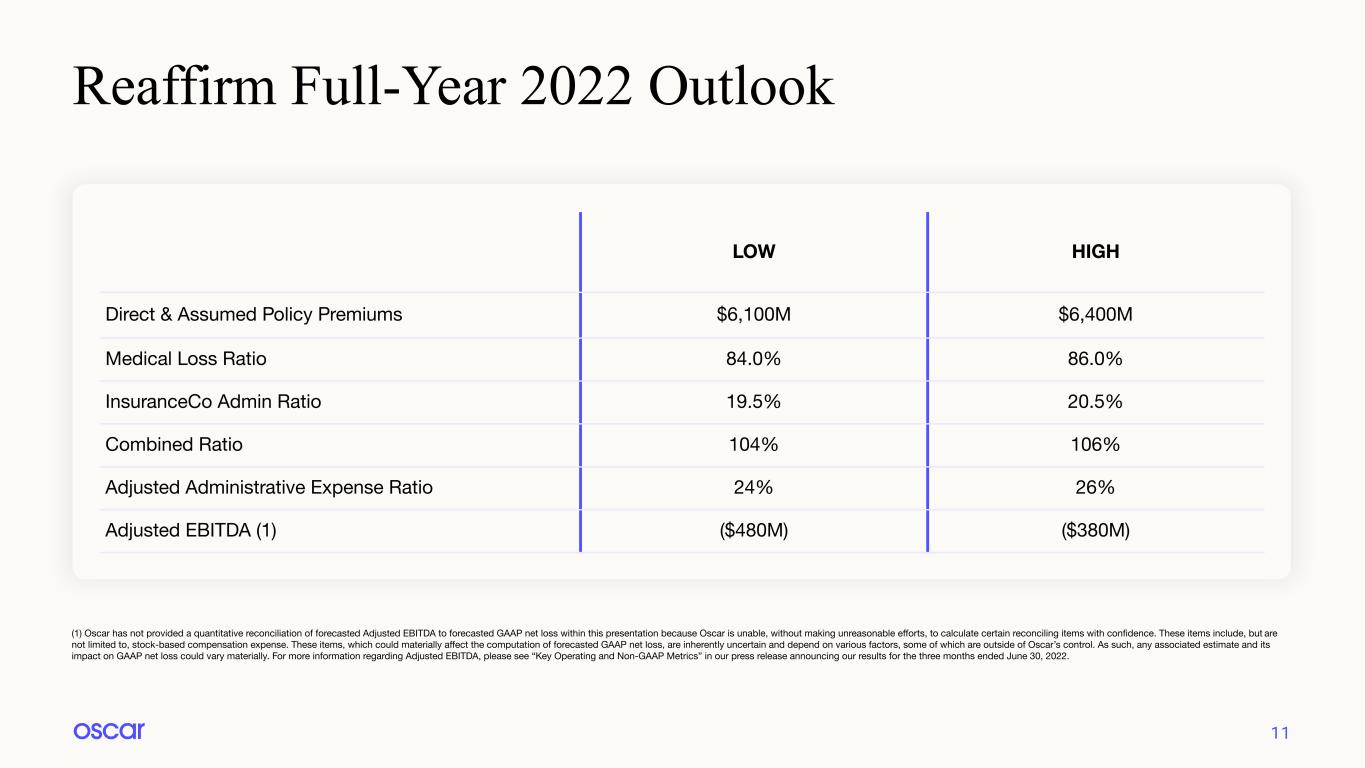
11 LOW HIGH Direct & Assumed Policy Premiums $6,100M $6,400M Medical Loss Ratio 84.0% 86.0% InsuranceCo Admin Ratio 19.5% 20.5% Combined Ratio 104% 106% Adjusted Administrative Expense Ratio 24% 26% Adjusted EBITDA (1) ($480M) ($380M) (1) Oscar has not provided a quantitative reconciliation of forecasted Adjusted EBITDA to forecasted GAAP net loss within this presentation because Oscar is unable, without making unreasonable efforts, to calculate certain reconciling items with confidence. These items include, but are not limited to, stock-based compensation expense. These items, which could materially affect the computation of forecasted GAAP net loss, are inherently uncertain and depend on various factors, some of which are outside of Oscar’s control. As such, any associated estimate and its impact on GAAP net loss could vary materially. For more information regarding Adjusted EBITDA, please see “Key Operating and Non-GAAP Metrics” in our press release announcing our results for the three months ended June 30, 2022. Reaffirm Full-Year 2022 Outlook

12 Net Loss June 30, 2022* $(112,125) June 30, 2021* $(73,323) Interest expense 6,141 228 Other expenses (793) Income tax expense 290 589 Depreciation and amortization 3,691 3,587 Stock-based compensation/warrant expense 26,991 18,273 Adjusted EBITDA $(75,805) $(50,646) *(in thousands) Three Months Ended Appendix: Adjusted EBITDA GAAP Reconciliation
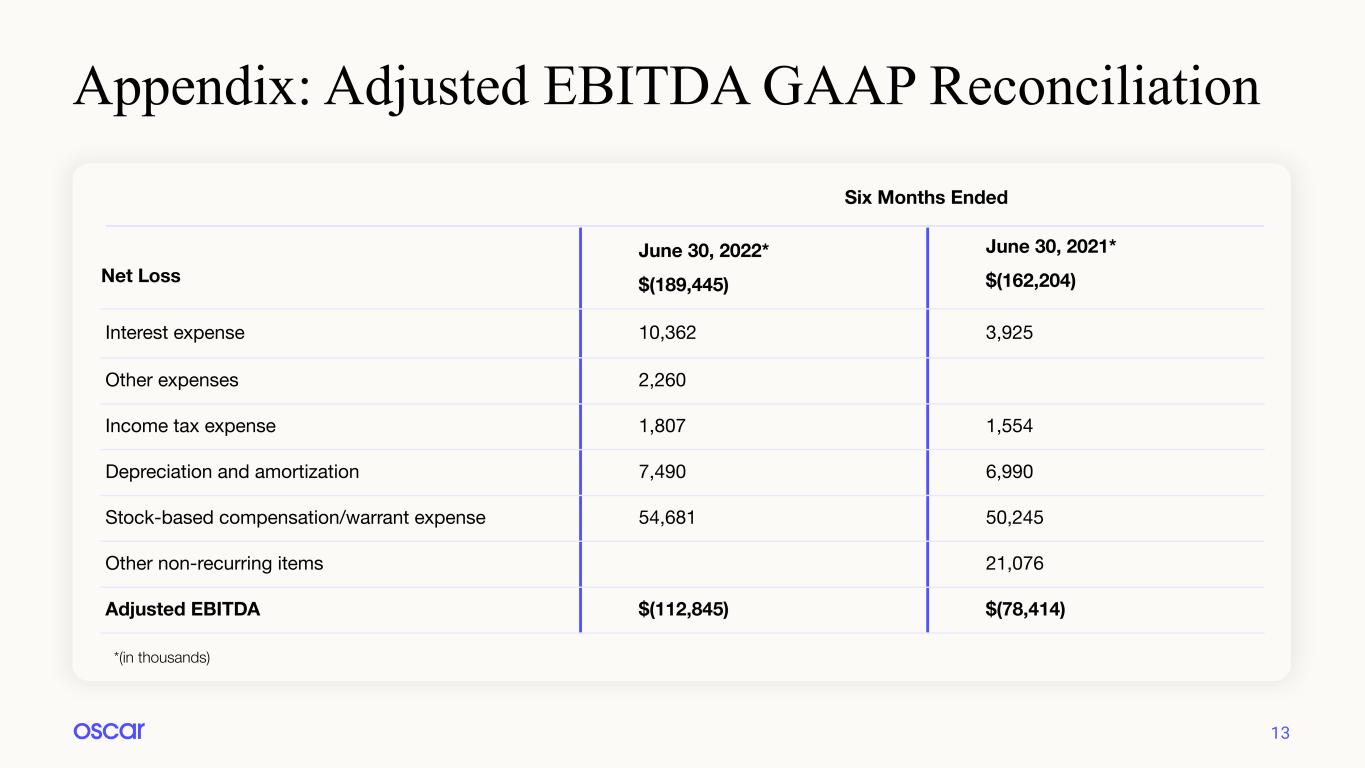
13 Net Loss June 30, 2022* $(189,445) June 30, 2021* $(162,204) Interest expense 10,362 3,925 Other expenses 2,260 Income tax expense 1,807 1,554 Depreciation and amortization 7,490 6,990 Stock-based compensation/warrant expense 54,681 50,245 Other non-recurring items 21,076 Adjusted EBITDA $(112,845) $(78,414) *(in thousands) Six Months Ended Appendix: Adjusted EBITDA GAAP Reconciliation


