| Third Quarter 2017 Earnings Report Exhibit 99.2 |

| Forward-Looking Statements 2 This presentation forward-looking statements within the meaning of Section 21E of the Securities Exchange Act of 1934, as amended, regarding management’s beliefs, estimates, projections and assumptions with respect to, among other things, the Company’s financial results, future operations, business plans and investment strategies, as well as industry and market conditions, all of which are subject to change. Words like “believe,” “expect,” “anticipate,” “promise,” “plan,” and other expressions or words of similar meanings, as well as future or conditional verbs such as “will,” “would,” “should,” “could,” or “may” are generally intended to identify forward-looking statements. Actual results and operations for any future period may vary materially from those projected herein and from past results discussed herein. Factors which could cause actual results to differ materially from historical results or those anticipated include, but are not limited to: the continually changing federal, state and local laws and regulations applicable to the highly regulated industry in which we operate; lawsuits or governmental actions that may result from any noncompliance with the laws and regulations applicable to our businesses; the mortgage lending and servicing-related regulations promulgated by the Consumer Financial Protection Bureau and its enforcement of these regulations; our dependence on U.S. government‑sponsored entities and changes in their current roles or their guarantees or guidelines; changes to government mortgage modification programs; the licensing and operational requirements of states and other jurisdictions applicable to the Company’s businesses, to which our bank competitors are not subject; foreclosure delays and changes in foreclosure practices; certain banking regulations that may limit our business activities; our dependence on the multifamily and commercial real estate sectors for future originations of commercial mortgage loans and other commercial real estate related loans; changes in macroeconomic and U.S. real estate market conditions; difficulties inherent in growing loan production volume; difficulties inherent in adjusting the size of our operations to reflect changes in business levels; purchase opportunities for mortgage servicing rights and our success in winning bids; changes in prevailing interest rates; increases in loan delinquencies and defaults; our reliance on PennyMac Mortgage Investment Trust (NYSE: PMT) as a significant source of financing for, and revenue related to, our mortgage banking business; any required additional capital and liquidity to support business growth that may not be available on acceptable terms, if at all; our obligation to indemnify third‑party purchasers or repurchase loans if loans that we originate, acquire, service or assist in the fulfillment of, fail to meet certain criteria or characteristics or under other circumstances; our obligation to indemnify PMT and the Investment Funds if its services fail to meet certain criteria or characteristics or under other circumstances; decreases in the returns on the assets that we select and manage for our clients, and our resulting management and incentive fees; the extensive amount of regulation applicable to our investment management segment; conflicts of interest in allocating our services and investment opportunities among us and our advised entities; the effect of public opinion on our reputation; our recent growth; our ability to effectively identify, manage, monitor and mitigate financial risks; our initiation of new business activities or expansion of existing business activities; our ability to detect misconduct and fraud; and our ability to mitigate cybersecurity risks and cyber incidents. You should not place undue reliance on any forward-looking statement and should consider all of the uncertainties and risks described above, as well as those more fully discussed in reports and other documents filed by the Company with the Securities and Exchange Commission from time to time. The Company undertakes no obligation to publicly update or revise any forward-looking statements or any other information contained herein, and the statements made in this presentation are current as of the date of this presentation only. |
| Third Quarter Highlights 3 Pretax income was $94.1 million; diluted earnings per share were $0.71 Strong earnings contributions from both the production and servicing businesses Issued $500 million of 5-year term notes at attractive levels under Ginnie Mae mortgage servicing rights (MSR) financing structure Repurchased approximately 500,000 shares of PFSI’s Class A common stock at a cost of $8.6 million; weighted average price of $17.01 per share Book value per share increased to $17.20 from $16.40 at June 30, 2017 and from $14.41 at September 30, 2016 Production segment pretax income was $69.0 million, up 3% from 2Q17 and down 54% from 3Q16 Total funded production volume was $18.9 billion in unpaid principal balance (UPB), up 8% from 2Q17 and down 8% from 3Q16 Total correspondent government and consumer direct locks were $13.2 billion in UPB, down 2% from 2Q17 and 19% from 3Q16 Servicing segment pretax income was $24.5 million compared to pretax losses of $11.2 million in 2Q17 and $10.7 million in 3Q16 Servicing portfolio grew to $238.4 billion in UPB, up 4% from June 30, 2017 and 31% from September 30, 2016 Successfully transferred $11.9 billion in UPB of MSRs from previously settled acquisitions Pretax income excluding valuation-related changes was $37.1 million, up from $15.3 million in 2Q17 and $9.9 million in 3Q16 Valuation-related changes include a $22.0 million decrease in MSR values, a $4.8 million gain due to the change in fair value of the excess servicing spread (ESS) liability and $7.2 million in hedging gains |
| Third Quarter Highlights (continued) 4 Investment Management segment pretax income was $0.7 million, down from $2.5 million in 2Q17 and up from $0.2 million in 3Q16 Net assets under management (AUM) were $1.6 billion, essentially unchanged from $1.6 billion at June 30, 2017 and September 30, 2016 The Investment Funds successfully completed the sale of substantially all of their remaining assets to a third party; $61 million of previously recognized carried interest was received by PFSI |
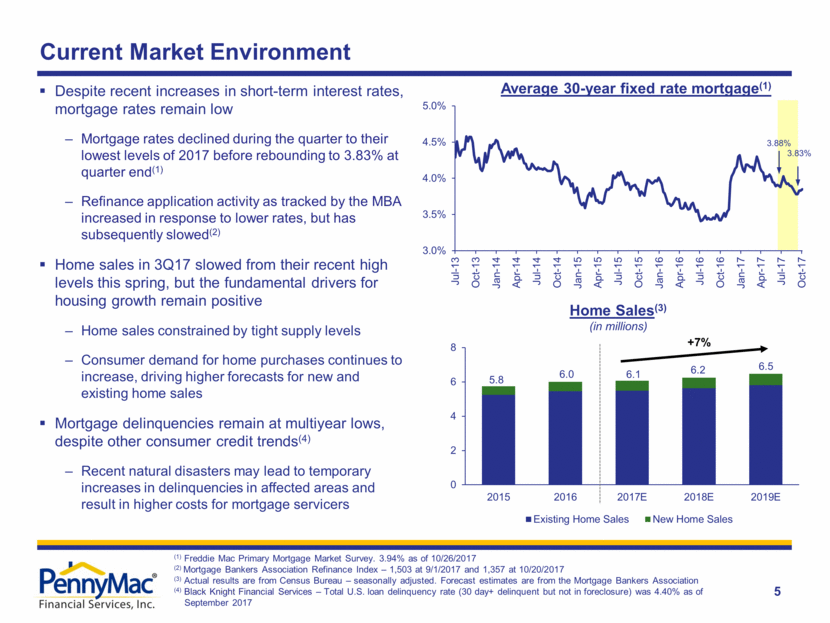
| Current Market Environment 5 Average 30-year fixed rate mortgage(1) (1) Freddie Mac Primary Mortgage Market Survey. 3.94% as of 10/26/2017 (2) Mortgage Bankers Association Refinance Index – 1,503 at 9/1/2017 and 1,357 at 10/20/2017 (3) Actual results are from Census Bureau – seasonally adjusted. Forecast estimates are from the Mortgage Bankers Association (4) Black Knight Financial Services – Total U.S. loan delinquency rate (30 day+ delinquent but not in foreclosure) was 4.40% as of September 2017 3.88% Despite recent increases in short-term interest rates, mortgage rates remain low Mortgage rates declined during the quarter to their lowest levels of 2017 before rebounding to 3.83% at quarter end(1) Refinance application activity as tracked by the MBA increased in response to lower rates, but has subsequently slowed(2) Home sales in 3Q17 slowed from their recent high levels this spring, but the fundamental drivers for housing growth remain positive Home sales constrained by tight supply levels Consumer demand for home purchases continues to increase, driving higher forecasts for new and existing home sales Mortgage delinquencies remain at multiyear lows, despite other consumer credit trends(4) Recent natural disasters may lead to temporary increases in delinquencies in affected areas and result in higher costs for mortgage servicers 3.83% Home Sales(3) (in millions) +7% 3.0% 3.5% 4.0% 4.5% 5.0% Jul-13 Oct-13 Jan-14 Apr-14 Jul-14 Oct-14 Jan-15 Apr-15 Jul-15 Oct-15 Jan-16 Apr-16 Jul-16 Oct-16 Jan-17 Apr-17 Jul-17 Oct-17 5.8 6.0 6.1 6.2 6.5 0 2 4 6 8 2015 2016 2017E 2018E 2019E Existing Home Sales New Home Sales |
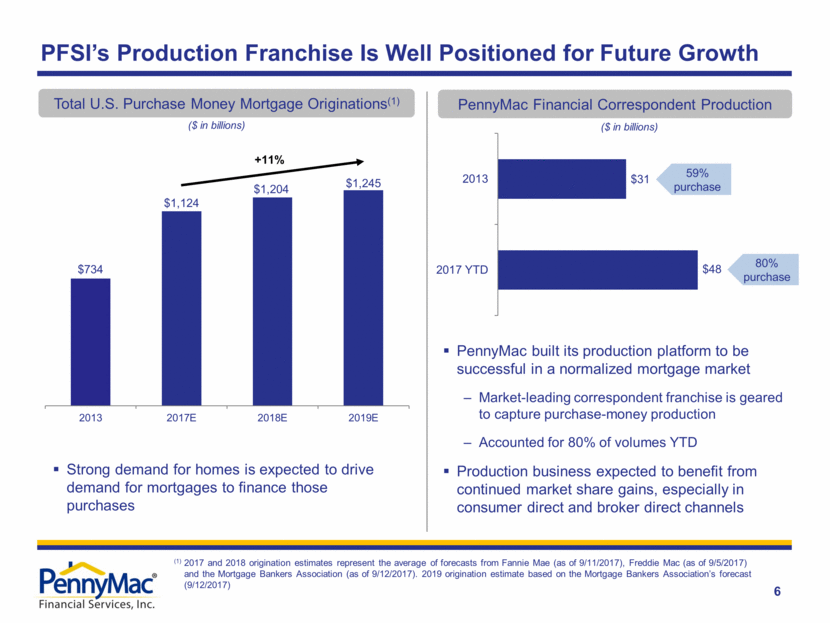
| 6 Total U.S. Purchase Money Mortgage Originations(1) ($ in billions) PennyMac Financial Correspondent Production ($ in billions) (1) 2017 and 2018 origination estimates represent the average of forecasts from Fannie Mae (as of 9/11/2017), Freddie Mac (as of 9/5/2017) and the Mortgage Bankers Association (as of 9/12/2017). 2019 origination estimate based on the Mortgage Bankers Association’s forecast (9/12/2017) PennyMac built its production platform to be successful in a normalized mortgage market Market-leading correspondent franchise is geared to capture purchase-money production Accounted for 80% of volumes YTD Production business expected to benefit from continued market share gains, especially in consumer direct and broker direct channels PFSI’s Production Franchise Is Well Positioned for Future Growth 59% purchase 80% purchase +11% Strong demand for homes is expected to drive demand for mortgages to finance those purchases $734 $1,124 $1,204 $1,245 2013 2017E 2018E 2019E $48 $31 2017 YTD 2013 |
|
|
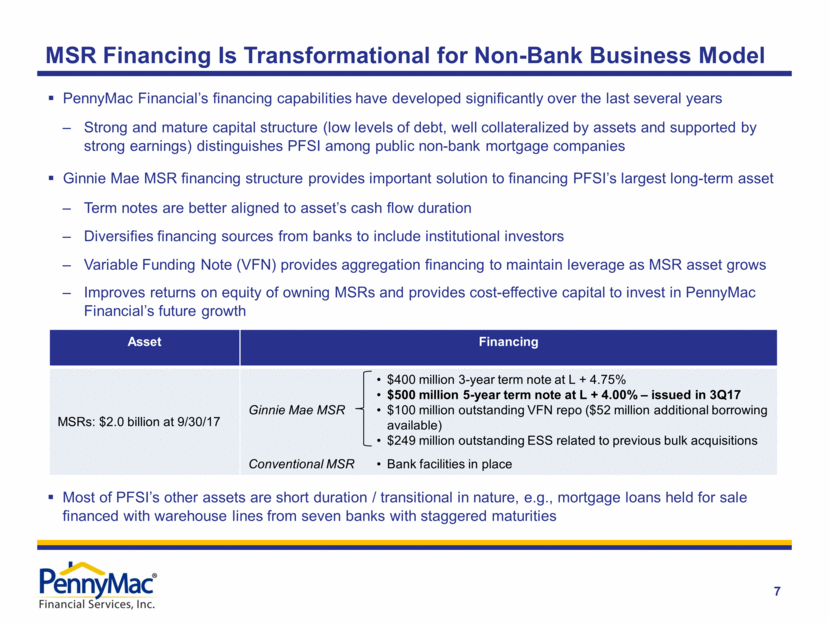
| MSR Financing Is Transformational for Non-Bank Business Model 7 PennyMac Financial’s financing capabilities have developed significantly over the last several years Strong and mature capital structure (low levels of debt, well collateralized by assets and supported by strong earnings) distinguishes PFSI among public non-bank mortgage companies Ginnie Mae MSR financing structure provides important solution to financing PFSI’s largest long-term asset Term notes are better aligned to asset’s cash flow duration Diversifies financing sources from banks to include institutional investors Variable Funding Note (VFN) provides aggregation financing to maintain leverage as MSR asset grows Improves returns on equity of owning MSRs and provides cost-effective capital to invest in PennyMac Financial’s future growth Asset Financing MSRs: $2.0 billion at 9/30/17 Ginnie Mae MSR $400 million 3-year term note at L + 4.75% $500 million 5-year term note at L + 4.00% – issued in 3Q17 $100 million outstanding VFN repo ($52 million additional borrowing available) $249 million outstanding ESS related to previous bulk acquisitions Conventional MSR Bank facilities in place Most of PFSI’s other assets are short duration / transitional in nature, e.g., mortgage loans held for sale financed with warehouse lines from seven banks with staggered maturities |
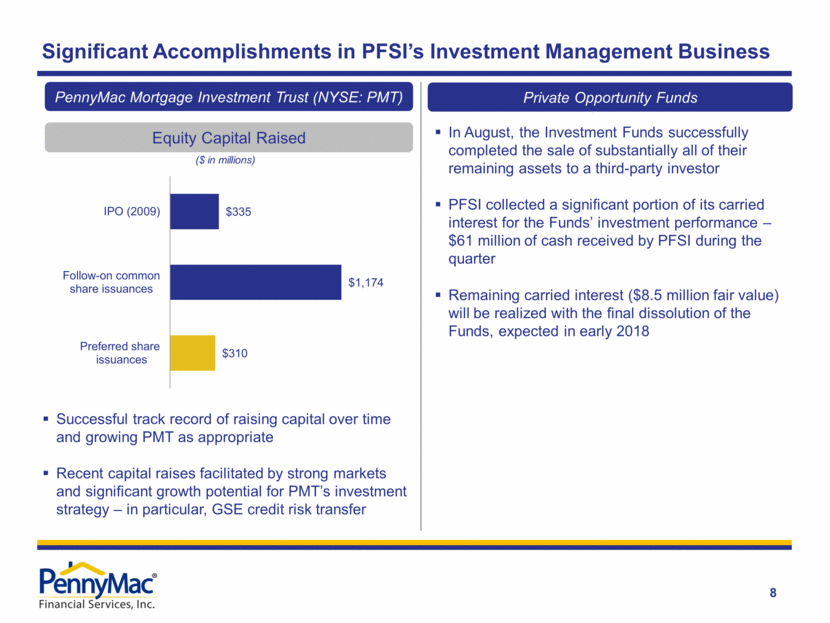
| 8 ($ in millions) In August, the Investment Funds successfully completed the sale of substantially all of their remaining assets to a third-party investor PFSI collected a significant portion of its carried interest for the Funds’ investment performance – $61 million of cash received by PFSI during the quarter Remaining carried interest ($8.5 million fair value) will be realized with the final dissolution of the Funds, expected in early 2018 Significant Accomplishments in PFSI’s Investment Management Business Equity Capital Raised Successful track record of raising capital over time and growing PMT as appropriate Recent capital raises facilitated by strong markets and significant growth potential for PMT’s investment strategy – in particular, GSE credit risk transfer PennyMac Mortgage Investment Trust (NYSE: PMT) Private Opportunity Funds $310 $1,174 $335 Preferred share issuances Follow-on common share issuances IPO (2009) |
|
|
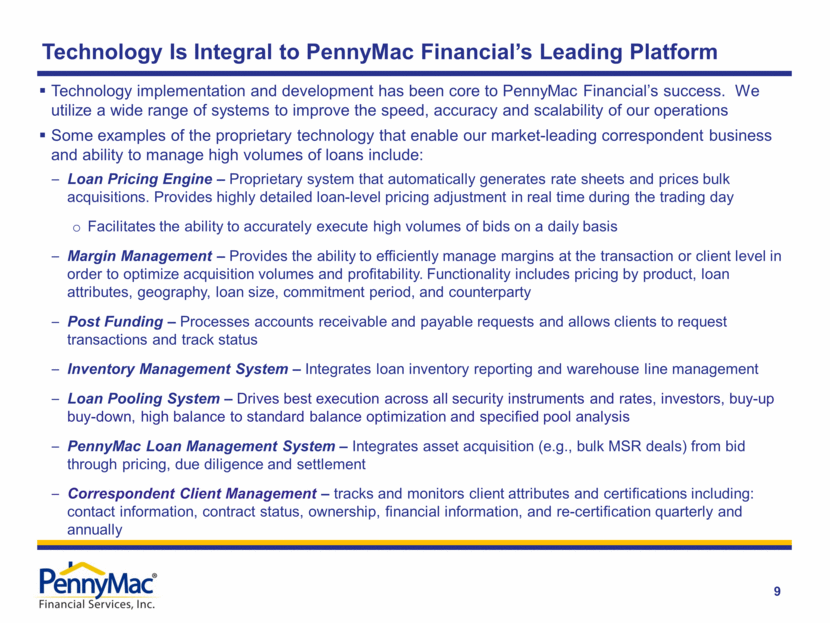
| Loan Pricing Engine – Proprietary system that automatically generates rate sheets and prices bulk acquisitions. Provides highly detailed loan-level pricing adjustment in real time during the trading day Facilitates the ability to accurately execute high volumes of bids on a daily basis Margin Management – Provides the ability to efficiently manage margins at the transaction or client level in order to optimize acquisition volumes and profitability. Functionality includes pricing by product, loan attributes, geography, loan size, commitment period, and counterparty Post Funding – Processes accounts receivable and payable requests and allows clients to request transactions and track status Inventory Management System – Integrates loan inventory reporting and warehouse line management Loan Pooling System – Drives best execution across all security instruments and rates, investors, buy-up buy-down, high balance to standard balance optimization and specified pool analysis PennyMac Loan Management System – Integrates asset acquisition (e.g., bulk MSR deals) from bid through pricing, due diligence and settlement Correspondent Client Management – tracks and monitors client attributes and certifications including: contact information, contract status, ownership, financial information, and re-certification quarterly and annually Technology Is Integral to PennyMac Financial’s Leading Platform 9 Technology implementation and development has been core to PennyMac Financial’s success. We utilize a wide range of systems to improve the speed, accuracy and scalability of our operations Some examples of the proprietary technology that enable our market-leading correspondent business and ability to manage high volumes of loans include: |
| 10 Broker Direct Channel Launch Will Utilize Innovative New Technology Broker direct channel launch - expected in 4Q17. Combines state-of-the-art technology of the new broker direct platform with PennyMac’s industry-leading operational capabilities Broker platform - designed with a focus on process transparency, consistency and delivering exceptional experience for brokers on every loan, everyday Seamless integration between brokers and our centralized sales and fulfillment functions Sophisticated CRM functionality Pipeline account managers Broker channel is an attractive growth opportunity Access to an additional 10% of the $1.7 trillion mortgage market(1) Leverages our ability to profitably produce high volumes of loans Elements of this system are portable to our Consumer Direct channel Broker POWER platform is the centerpiece of our centralized sales and engagement model (1) 2017 origination estimate represents the average of forecasts from Fannie Mae (as of 9/11/2017), Freddie Mac (as of 9/5/2017) and the Mortgage Bankers Association (as of 9/12/2017). 17-27: Day 1 Certainty Simplified Thursday Oct 26, 2017 Enhancements to Power simplify Day 1 Certainty validations. Click here for more details 17-26: New Broker Education Tools Available Tuesday Oct 24, 2017 Resources portal of Power has been updated. Click here for new videos and reference materials. |

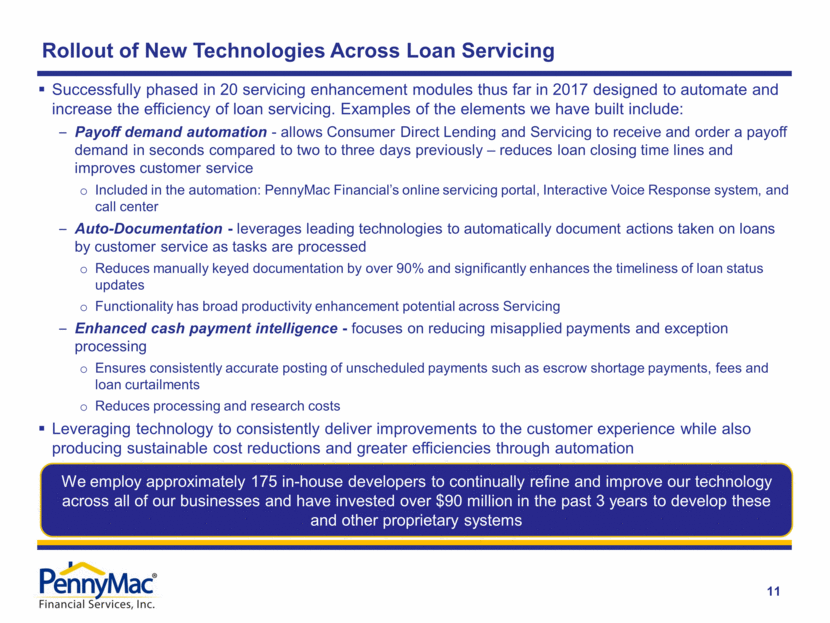
| 11 Rollout of New Technologies Across Loan Servicing Successfully phased in 20 servicing enhancement modules thus far in 2017 designed to automate and increase the efficiency of loan servicing. Examples of the elements we have built include: Payoff demand automation - allows Consumer Direct Lending and Servicing to receive and order a payoff demand in seconds compared to two to three days previously – reduces loan closing time lines and improves customer service Included in the automation: PennyMac Financial’s online servicing portal, Interactive Voice Response system, and call center Auto-Documentation - leverages leading technologies to automatically document actions taken on loans by customer service as tasks are processed Reduces manually keyed documentation by over 90% and significantly enhances the timeliness of loan status updates Functionality has broad productivity enhancement potential across Servicing Enhanced cash payment intelligence - focuses on reducing misapplied payments and exception processing Ensures consistently accurate posting of unscheduled payments such as escrow shortage payments, fees and loan curtailments Reduces processing and research costs Leveraging technology to consistently deliver improvements to the customer experience while also producing sustainable cost reductions and greater efficiencies through automation We employ approximately 175 in-house developers to continually refine and improve our technology across all of our businesses and have invested over $90 million in the past 3 years to develop these and other proprietary systems |
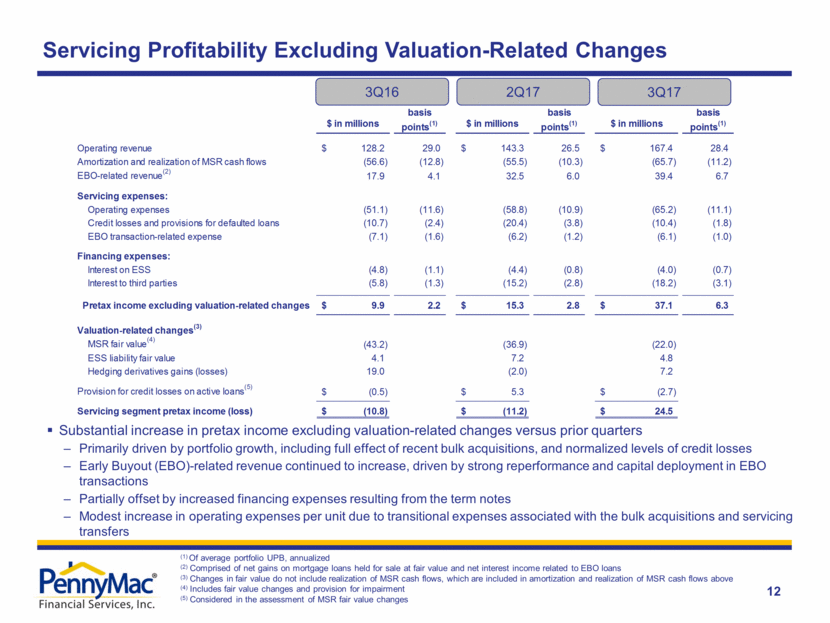
| Servicing Profitability Excluding Valuation-Related Changes 12 (1) Of average portfolio UPB, annualized (2) Comprised of net gains on mortgage loans held for sale at fair value and net interest income related to EBO loans (3) Changes in fair value do not include realization of MSR cash flows, which are included in amortization and realization of MSR cash flows above (4) Includes fair value changes and provision for impairment (5) Considered in the assessment of MSR fair value changes 3Q16 2Q17 3Q17 Substantial increase in pretax income excluding valuation-related changes versus prior quarters Primarily driven by portfolio growth, including full effect of recent bulk acquisitions, and normalized levels of credit losses Early Buyout (EBO)-related revenue continued to increase, driven by strong reperformance and capital deployment in EBO transactions Partially offset by increased financing expenses resulting from the term notes Modest increase in operating expenses per unit due to transitional expenses associated with the bulk acquisitions and servicing transfers $ in millions basis points(1) $ in millions basis points(1) $ in millions basis points(1) Operating revenue $ 128.2 29.0 $ 143.3 26.5 $ 167.4 28.4 Amortization and realization of MSR cash flows (56.6) (12.8) (55.5) (10.3) (65.7) (11.2) EBO-related revenue(2) 17.9 4.1 32.5 6.0 39.4 6.7 Servicing expenses: Operating expenses (51.1) (11.6) (58.8) (10.9) (65.2) (11.1) Credit losses and provisions for defaulted loans (10.7) (2.4) (20.4) (3.8) (10.4) (1.8) EBO transaction-related expense (7.1) (1.6) (6.2) (1.2) (6.1) (1.0) Financing expenses: Interest on ESS (4.8) (1.1) (4.4) (0.8) (4.0) (0.7) Interest to third parties (5.8) (1.3) (15.2) (2.8) (18.2) (3.1) Pretax income excluding valuation-related changes $ 9.9 2.2 $ 15.3 2.8 $ 37.1 6.3 Valuation-related changes(3) MSR fair value(4) (43.2) (36.9) (22.0) ESS liability fair value 4.1 7.2 4.8 Hedging derivatives gains (losses) 19.0 (2.0) 7.2 Provision for credit losses on active loans(5) $ (0.5) $ 5.3 $ (2.7) Servicing segment pretax income (loss) $ (10.8) $ (11.2) $ 24.5 |
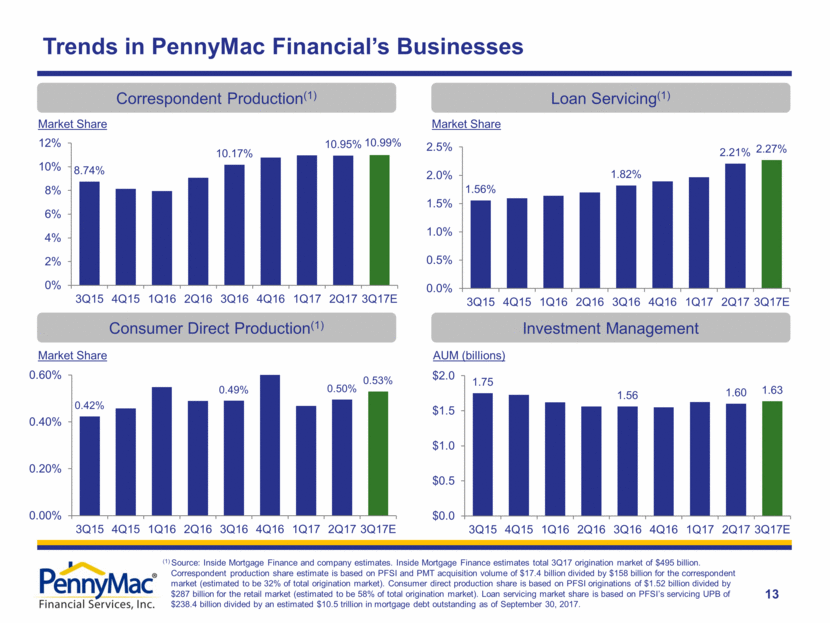
| Trends in PennyMac Financial’s Businesses Correspondent Production(1) Market Share Market Share Consumer Direct Production(1) Loan Servicing(1) Market Share Investment Management AUM (billions) 13 (1) Source: Inside Mortgage Finance and company estimates. Inside Mortgage Finance estimates total 3Q17 origination market of $495 billion. Correspondent production share estimate is based on PFSI and PMT acquisition volume of $17.4 billion divided by $158 billion for the correspondent market (estimated to be 32% of total origination market). Consumer direct production share is based on PFSI originations of $1.52 billion divided by $287 billion for the retail market (estimated to be 58% of total origination market). Loan servicing market share is based on PFSI’s servicing UPB of $238.4 billion divided by an estimated $10.5 trillion in mortgage debt outstanding as of September 30, 2017. 8.74% 10.17% 10.95% 10.99% 0% 2% 4% 6% 8% 10% 12% 3Q15 4Q15 1Q16 2Q16 3Q16 4Q16 1Q17 2Q17 3Q17E 1.56% 1.82% 2.21% 2.27% 0.0% 0.5% 1.0% 1.5% 2.0% 2.5% 3Q15 4Q15 1Q16 2Q16 3Q16 4Q16 1Q17 2Q17 3Q17E 0.42% 0.49% 0.50% 0.53% 0.00% 0.20% 0.40% 0.60% 3Q15 4Q15 1Q16 2Q16 3Q16 4Q16 1Q17 2Q17 3Q17E 1.75 1.56 1.60 1.63 $0.0 $0.5 $1.0 $1.5 $2.0 3Q15 4Q15 1Q16 2Q16 3Q16 4Q16 1Q17 2Q17 3Q17E |
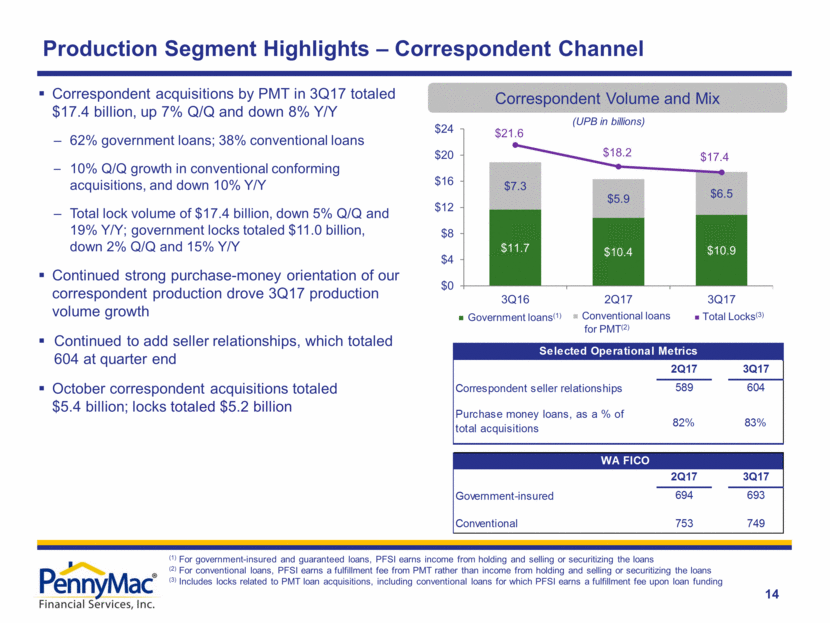
| 14 (UPB in billions) Production Segment Highlights – Correspondent Channel (1) For government-insured and guaranteed loans, PFSI earns income from holding and selling or securitizing the loans (2) For conventional loans, PFSI earns a fulfillment fee from PMT rather than income from holding and selling or securitizing the loans (3) Includes locks related to PMT loan acquisitions, including conventional loans for which PFSI earns a fulfillment fee upon loan funding Correspondent Volume and Mix Correspondent acquisitions by PMT in 3Q17 totaled $17.4 billion, up 7% Q/Q and down 8% Y/Y 62% government loans; 38% conventional loans 10% Q/Q growth in conventional conforming acquisitions, and down 10% Y/Y Total lock volume of $17.4 billion, down 5% Q/Q and 19% Y/Y; government locks totaled $11.0 billion, down 2% Q/Q and 15% Y/Y Continued strong purchase-money orientation of our correspondent production drove 3Q17 production volume growth Continued to add seller relationships, which totaled 604 at quarter end October correspondent acquisitions totaled $5.4 billion; locks totaled $5.2 billion ■ Government loans(1) ■ Total Locks(3) ■ Conventional loans for PMT(2) Selected Operational Metrics 2Q17 3Q17 Correspondent seller relationships 589 604 Purchase money loans, as a % of total acquisitions 82% 83% WA FICO 2Q17 3Q17 Government-insured 694 693 Conventional 753 749 $11.7 $10.4 $10.9 $7.3 $5.9 $6.5 $21.6 $18.2 $17.4 $0 $4 $8 $12 $16 $20 $24 3Q16 2Q17 3Q17 |
|
|
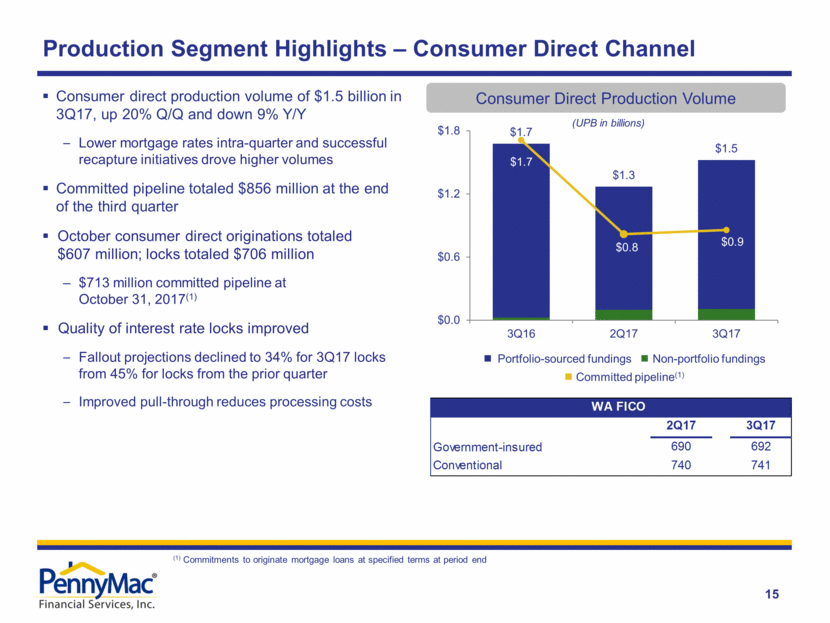
| ■ Portfolio-sourced fundings ■ Non-portfolio fundings ■ Committed pipeline(1) (UPB in billions) Consumer direct production volume of $1.5 billion in 3Q17, up 20% Q/Q and down 9% Y/Y Lower mortgage rates intra-quarter and successful recapture initiatives drove higher volumes Committed pipeline totaled $856 million at the end of the third quarter October consumer direct originations totaled $607 million; locks totaled $706 million $713 million committed pipeline at October 31, 2017(1) Quality of interest rate locks improved Fallout projections declined to 34% for 3Q17 locks from 45% for locks from the prior quarter Improved pull-through reduces processing costs Production Segment Highlights – Consumer Direct Channel Consumer Direct Production Volume (1) Commitments to originate mortgage loans at specified terms at period end 15 WA FICO 2Q17 3Q17 Government-insured 690 692 Conventional 740 741 $1.7 $1.3 $1.5 $1.7 $0.8 $0.9 $0.0 $0.6 $1.2 $1.8 3Q16 2Q17 3Q17 |
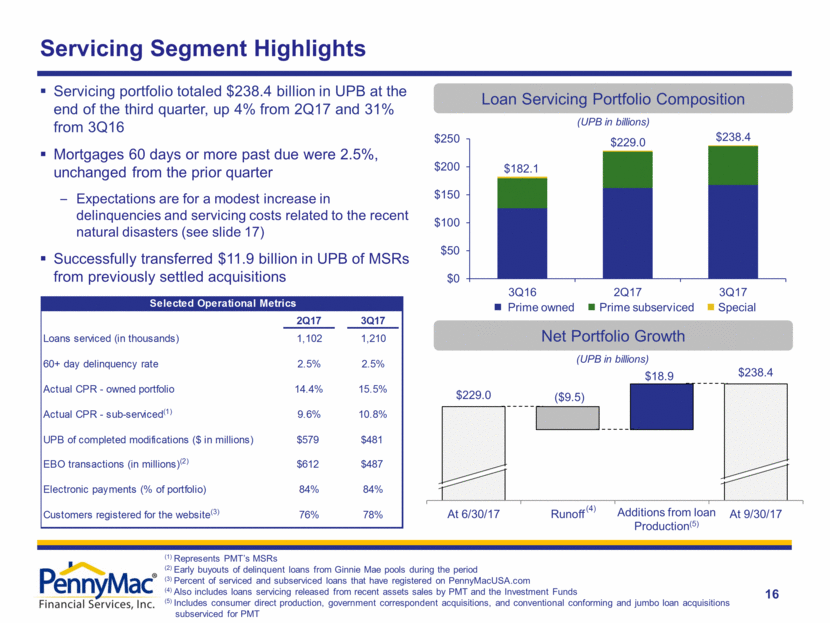
| (UPB in billions) Servicing portfolio totaled $238.4 billion in UPB at the end of the third quarter, up 4% from 2Q17 and 31% from 3Q16 Mortgages 60 days or more past due were 2.5%, unchanged from the prior quarter Expectations are for a modest increase in delinquencies and servicing costs related to the recent natural disasters (see slide 17) Successfully transferred $11.9 billion in UPB of MSRs from previously settled acquisitions Servicing Segment Highlights Loan Servicing Portfolio Composition Net Portfolio Growth (UPB in billions) (1) 16 (1) Represents PMT’s MSRs (2) Early buyouts of delinquent loans from Ginnie Mae pools during the period (3) Percent of serviced and subserviced loans that have registered on PennyMacUSA.com (4) Also includes loans servicing released from recent assets sales by PMT and the Investment Funds (5) Includes consumer direct production, government correspondent acquisitions, and conventional conforming and jumbo loan acquisitions subserviced for PMT ■ Prime owned ■ Prime subserviced ■ Special Additions from loan Production(5) $18.9 (4) Selected Operational Metrics 2Q17 3Q17 Loans serviced (in thousands) 1,102 1,210 60+ day delinquency rate 2.5% 2.5% Actual CPR - owned portfolio 14.4% 15.5% Actual CPR - sub-serviced(1) 9.6% 10.8% UPB of completed modifications ($ in millions) $579 $481 EBO transactions (in millions)(2) $612 $487 Electronic payments (% of portfolio) 84% 84% Customers registered for the website(3) 76% 78% $229.0 $238.4 ($9.5) At 6/30/17 Runoff At 9/30/17 $182.1 $229.0 $238.4 $0 $50 $100 $150 $200 $250 3Q16 2Q17 3Q17 |
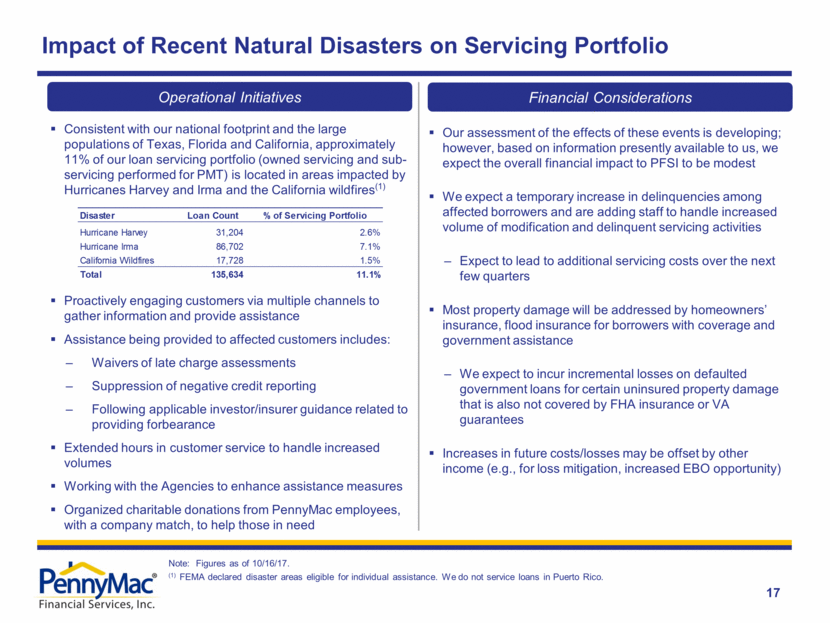
| 17 Our assessment of the effects of these events is developing; however, based on information presently available to us, we expect the overall financial impact to PFSI to be modest We expect a temporary increase in delinquencies among affected borrowers and are adding staff to handle increased volume of modification and delinquent servicing activities Expect to lead to additional servicing costs over the next few quarters Most property damage will be addressed by homeowners’ insurance, flood insurance for borrowers with coverage and government assistance We expect to incur incremental losses on defaulted government loans for certain uninsured property damage that is also not covered by FHA insurance or VA guarantees Increases in future costs/losses may be offset by other income (e.g., for loss mitigation, increased EBO opportunity) Impact of Recent Natural Disasters on Servicing Portfolio Consistent with our national footprint and the large populations of Texas, Florida and California, approximately 11% of our loan servicing portfolio (owned servicing and sub-servicing performed for PMT) is located in areas impacted by Hurricanes Harvey and Irma and the California wildfires(1) Proactively engaging customers via multiple channels to gather information and provide assistance Assistance being provided to affected customers includes: Waivers of late charge assessments Suppression of negative credit reporting Following applicable investor/insurer guidance related to providing forbearance Extended hours in customer service to handle increased volumes Working with the Agencies to enhance assistance measures Organized charitable donations from PennyMac employees, with a company match, to help those in need Operational Initiatives Financial Considerations Note: Figures as of 10/16/17. (1) FEMA declared disaster areas eligible for individual assistance. We do not service loans in Puerto Rico. Disaster Loan Count % of Servicing Portfolio Hurricane Harvey 31,204 2.6% Hurricane Irma 86,702 7.1% California Wildfires 17,728 1.5% Total 135,634 11.1% |
| 18 ($ in millions) Net assets under management were $1.6 billion, essentially unchanged from June 30, 2017 Investment management revenues were $5.0 million, down 21% from 2Q17 and 11% from 3Q16 PMT continued to transition capital from distressed whole loans toward MSRs and credit risk transfer on its correspondent production In August, the Investment Funds successfully completed the sale of substantially all of their remaining assets to a third-party investor Investment Management Segment Highlights Investment Management AUM Shift in mix of AUM reflects PMT’s issuance of preferred equity and liquidation of the Investment Funds’ assets $1,355 $1,455 $1,611 $202 $145 $24 $1,557 $1,600 $1,634 $0 $600 $1,200 $1,800 3Q16 2Q17 3Q17 PMT Investment Funds |
|
|
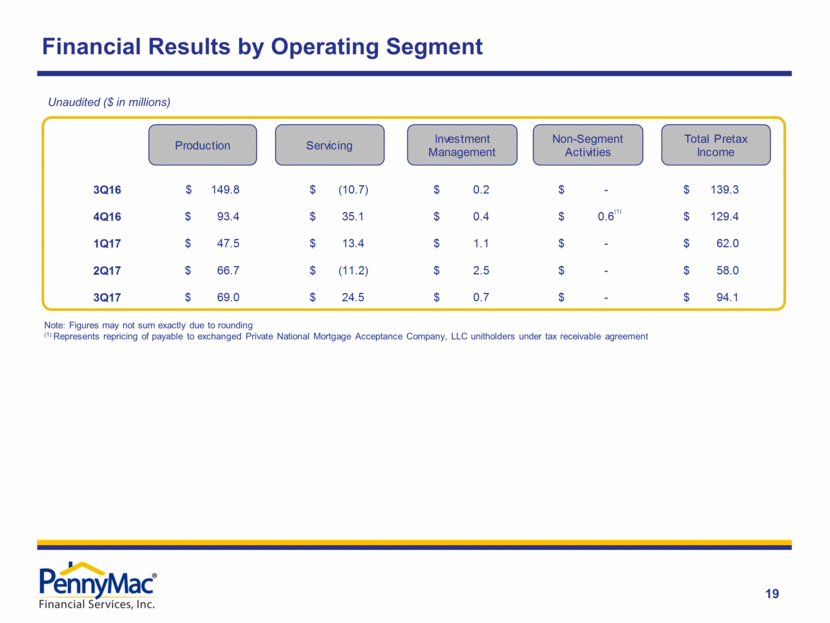
| Financial Results by Operating Segment 19 Unaudited ($ in millions) Note: Figures may not sum exactly due to rounding (1) Represents repricing of payable to exchanged Private National Mortgage Acceptance Company, LLC unitholders under tax receivable agreement (1) ($ in millions) 3Q16 $ 149.8 $ (10.7) $ 0.2 $ - $ 139.3 4Q16 $ 93.4 $ 35.1 $ 0.4 $ 0.6 $ 129.4 1Q17 $ 47.5 $ 13.4 $ 1.1 $ - $ 62.0 2Q17 $ 66.7 $ (11.2) $ 2.5 $ - $ 58.0 3Q17 $ 69.0 $ 24.5 $ 0.7 $ - $ 94.1 Production Servicing Investment Management Total Pretax Income Non-Segment Activities |
|
|
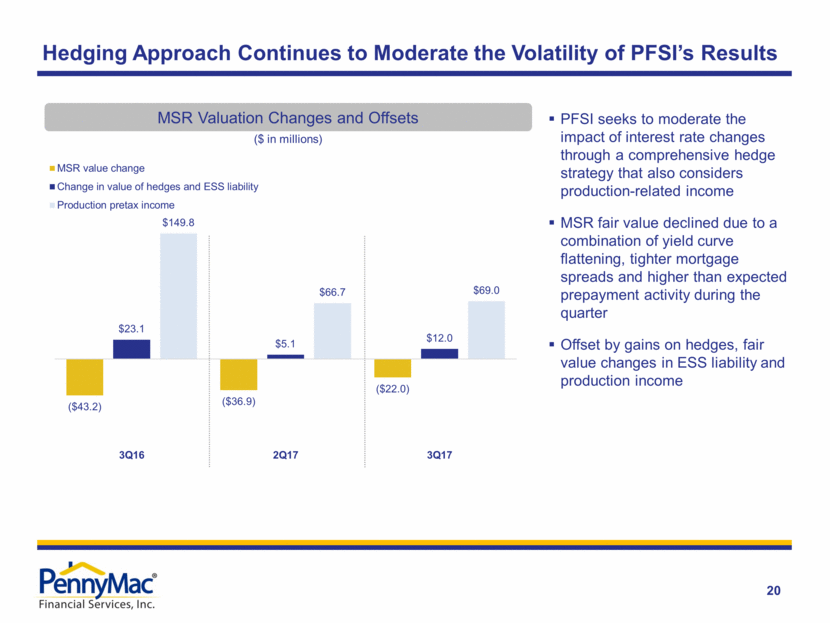
| Hedging Approach Continues to Moderate the Volatility of PFSI’s Results 20 PFSI seeks to moderate the impact of interest rate changes through a comprehensive hedge strategy that also considers production-related income MSR fair value declined due to a combination of yield curve flattening, tighter mortgage spreads and higher than expected prepayment activity during the quarter Offset by gains on hedges, fair value changes in ESS liability and production income MSR Valuation Changes and Offsets ($ in millions) ($43.2) ($36.9) ($22.0) $23.1 $5.1 $12.0 $149.8 $66.7 $69.0 3Q16 2Q17 3Q17 MSR value change Change in value of hedges and ESS liability Production pretax income |
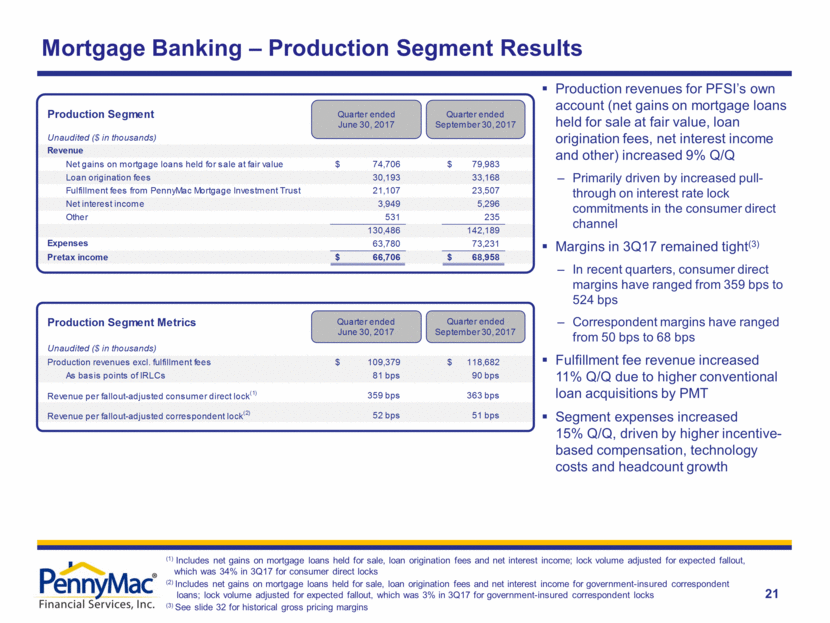
| 21 Mortgage Banking – Production Segment Results (1) Includes net gains on mortgage loans held for sale, loan origination fees and net interest income; lock volume adjusted for expected fallout, which was 34% in 3Q17 for consumer direct locks (2) Includes net gains on mortgage loans held for sale, loan origination fees and net interest income for government-insured correspondent loans; lock volume adjusted for expected fallout, which was 3% in 3Q17 for government-insured correspondent locks (3) See slide 32 for historical gross pricing margins Production revenues for PFSI’s own account (net gains on mortgage loans held for sale at fair value, loan origination fees, net interest income and other) increased 9% Q/Q Primarily driven by increased pull-through on interest rate lock commitments in the consumer direct channel Margins in 3Q17 remained tight(3) In recent quarters, consumer direct margins have ranged from 359 bps to 524 bps Correspondent margins have ranged from 50 bps to 68 bps Fulfillment fee revenue increased 11% Q/Q due to higher conventional loan acquisitions by PMT Segment expenses increased 15% Q/Q, driven by higher incentive-based compensation, technology costs and headcount growth Production Segment PCG Locks Consumer Direct Locks Unaudited ($ in thousands) Timeframe Totals Timeframe Totals Revenue 2016 Q2 Conf $ 5,957,343,983 2016 Q2 Conf $ 842,055,443 Net gains on mortgage loans held for sale at fair value $ 74,706 $ 79,983 2016 Q2 Govt $ 10,023,369,957 2016 Q2 Govt $ 2,054,278,801 Loan origination fees 30,193 33,168 2016 Q2 Jumbo $ 7,131,150 2016 Q2 Jumbo $ 4,995,728 Fulfillment fees from PennyMac Mortgage Investment Trust 21,107 23,507 2016 Q2 Total $ 15,987,845,090 2016 Q2 Total $ 2,901,329,972 Net interest income 3,949 5,296 2016 Q1 Conf $ 3,856,825,421 2016 Q1 Conf $ 542,287,910 Other 531 235 2016 Q1 Govt $ 6,510,763,537 2016 Q1 Govt $ 1,682,247,218 130,486 142,189 2016 Q1 Jumbo $ 11,393,814 2016 Q1 Jumbo $ 5,029,100 Expenses 63,780 73,231 2016 Q1 Total $ 10,378,982,772 2016 Q1 Total $ 2,229,564,228 Pretax income $ 66,706 $ 68,958 Production Segment Metrics 3Q16 2Q16 1Q16 PFSI Locks PCG Govt. $ 12,868,000,000 $ 10,023,369,957 $ 6,510,763,537 54% Unaudited ($ in thousands) Consumer Direct $ 3,463,000,000 $ 2,901,329,972 $ 2,229,564,228 30% Production revenues excl. fulfillment fees $ 109,379 $ 118,682 $ 16,331,000,000 $ 12,924,699,929 $ 8,740,327,765 48% As basis points of IRLCs 81 bps 90 bps Revenue per fallout-adjusted consumer direct lock(1) 359 bps 363 bps 323 bps 307 bps Revenue per fallout-adjusted correspondent lock(2) 52 bps 51 bps 68 bps 61 bps CDL MARGIN 3.07% 2.98% PCG Govt. MARGIN 0.20% 0.80% Servicing Segment Unaudited ($ in thousands) $ 89,070.83 $ 66,441.01 Revenue $ 20,308.43 $ 52,240.99 Net loan servicing fees $ 26,609 $ 17,519 Net interest expense (9,600) (10,993) Net gains on mortgage loans held for sale at fair value 14,308 13,310 Other 798 (232) 32,115 19,604 Expenses 53,085 59,066 Pretax income $ (20,970) $ (39,462) Set to 211 pixels to match servicing fee schedule width Mortgage Banking Segment Total Pretax income $ 45,736 $ 29,496 Quarter ended September 30, 2015 Quarter ended June 30, 2015 Quarter ended September 30, 2015 Quarter ended June 30, 2015 Quarter ended September 30, 2015 Quarter ended June 30, 2015 Quarter ended June 30, 2017 Quarter ended September 30, 2017 Quarter ended June 30, 2016 Quarter ended March 31, 2016 Quarter ended June 30, 2017 Quarter ended September 30, 2017 |
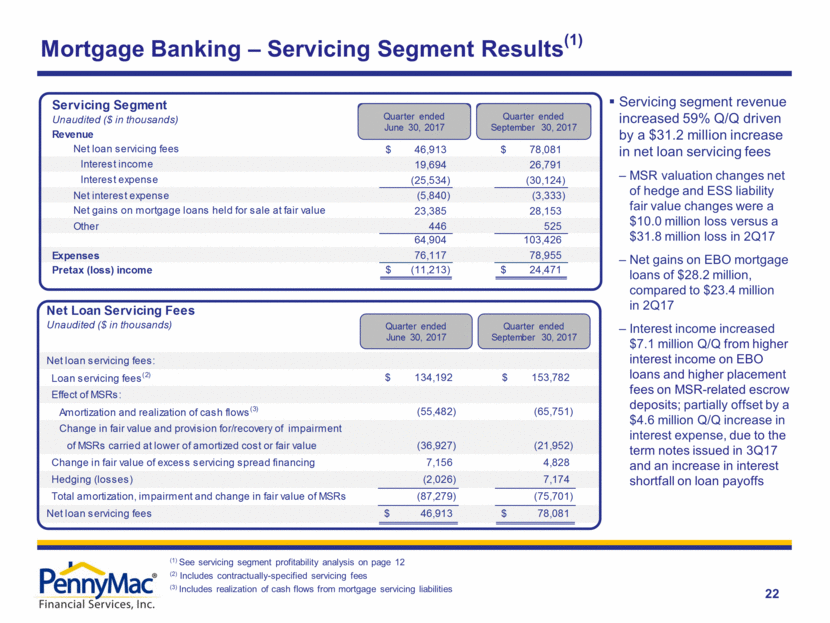
| Mortgage Banking – Servicing Segment Results(1) (1) See servicing segment profitability analysis on page 12 (2) Includes contractually-specified servicing fees (3) Includes realization of cash flows from mortgage servicing liabilities 22 Servicing segment revenue increased 59% Q/Q driven by a $31.2 million increase in net loan servicing fees MSR valuation changes net of hedge and ESS liability fair value changes were a $10.0 million loss versus a $31.8 million loss in 2Q17 Net gains on EBO mortgage loans of $28.2 million, compared to $23.4 million in 2Q17 Interest income increased $7.1 million Q/Q from higher interest income on EBO loans and higher placement fees on MSR-related escrow deposits; partially offset by a $4.6 million Q/Q increase in interest expense, due to the term notes issued in 3Q17 and an increase in interest shortfall on loan payoffs ($ in thousands) ($ in thousands) Production Segment Unaudited ($ in thousands) Revenue Net gains on mortgage loans held for sale at fair value $ 115,895 $ 78,214 Loan origination fees 28,907 22,434 Fulfillment fees from PennyMac Mortgage Investment Trust 18,053 12,935 Net interest income 4,704 3,494 Other 848 239 168,407 117,316 Expenses 64,960 48,908 103447 Pretax income $ 103,447 $ 68,408 Production Segment Metrics Calcs Unaudited ($ in thousands) Net gains on mortgage loans $ 115,895 $ 78,214 As % of IRLCs 3.00% 2.03% #DIV/0! Loan origination fees $ 28,907 $ 22,434 As % of PFSI fundings 0.90% 0.63% #DIV/0! Fulfillment fees from PMT $ 18,053 $ 12,935 Average fulfillment fee Servicing Segment Unaudited ($ in thousands) Revenue Net loan servicing fees $ 46,913 $ 78,081 Interest income 19,694 26,791 Interest expense (25,534) (30,124) Net interest expense (5,840) (3,333) Net gains on mortgage loans held for sale at fair value 23,385 28,153 Other 446 525 64,904 103,426 Expenses 76,117 78,955 Set to 211 pixels to match servicing fee schedule width Pretax (loss) income $ (11,213) $ 24,471 Mortgage Banking Segment Total Pretax income $ 92,233 $ 92,879 Quarter ended September 30, 2015 Quarter ended June 30, 2015 Quarter ended September 30, 2015 Quarter ended June 30, 2015 Quarter ended September 30, 2015 Quarter ended June 30, 2015 Quarter ended June 30, 2016 Quarter ended March 31, 2016 Quarter ended June 30, 2017 Quarter ended September 30, 2017 Quarter ended June 30, 2016 Quarter ended March 31, 2016 Net Loan Servicing Fees Unaudited ($ in thousands) Net loan servicing fees: Loan servicing fees(2) $ 134,192 $ 153,782 Effect of MSRs: Amortization and realization of cash flows(3) (55,482) (65,751) Change in fair value and provision for/recovery of impairment of MSRs carried at lower of amortized cost or fair value (36,927) (21,952) Change in fair value of excess servicing spread financing 7,156 4,828 Hedging (losses) (2,026) 7,174 Total amortization, impairment and change in fair value of MSRs (87,279) (75,701) Net loan servicing fees $ 46,913 $ 78,081 (1) Includes contractually-specified servicing fees (2) Includes realization of cash flows from the Mortgage Servicing Liability which was previously included in fair value changes. Prior periods have been adjusted accordingly. Quarter ended June 30, 2017 Quarter ended September 30, 2017 |
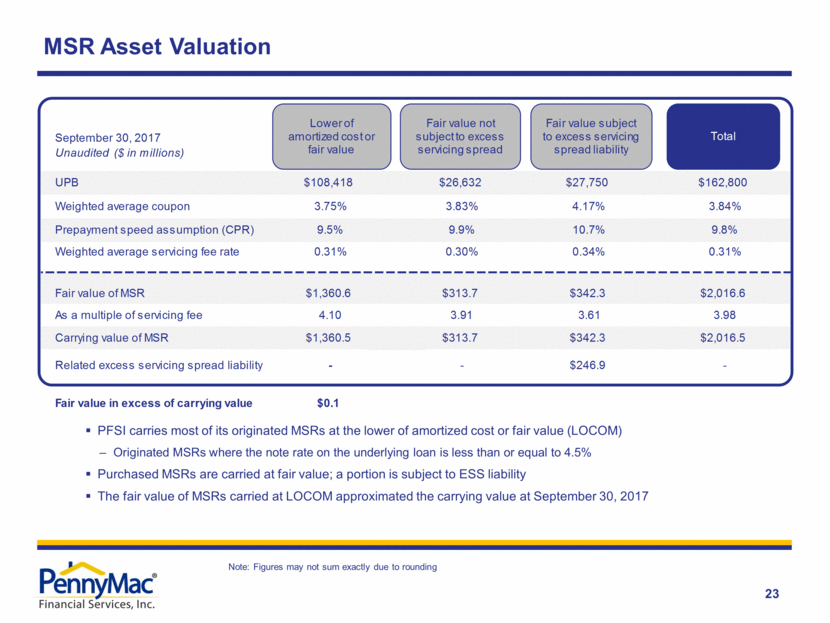
| MSR Asset Valuation 23 PFSI carries most of its originated MSRs at the lower of amortized cost or fair value (LOCOM) Originated MSRs where the note rate on the underlying loan is less than or equal to 4.5% Purchased MSRs are carried at fair value; a portion is subject to ESS liability The fair value of MSRs carried at LOCOM approximated the carrying value at September 30, 2017 Note: Figures may not sum exactly due to rounding September 30, 2017 Unaudited ($ in millions) UPB $108,418 $26,632 $27,750 $162,800 Weighted average coupon 3.75% 3.83% 4.17% 3.84% Prepayment speed assumption (CPR) 9.5% 9.9% 10.7% 9.8% Weighted average servicing fee rate 0.31% 0.30% 0.34% 0.31% Fair value of MSR $1,360.6 $313.7 $342.3 $2,016.6 As a multiple of servicing fee 4.10 3.91 3.61 3.98 Carrying value of MSR $1,360.5 $313.7 $342.3 $2,016.5 Related excess servicing spread liability - - $246.9 - Fair value in excess of carrying value $0.1 Lower of amortized cost or fair value Total Fair value subject to excess servicing spread liability Fair value not subject to excess servicing spread liability |
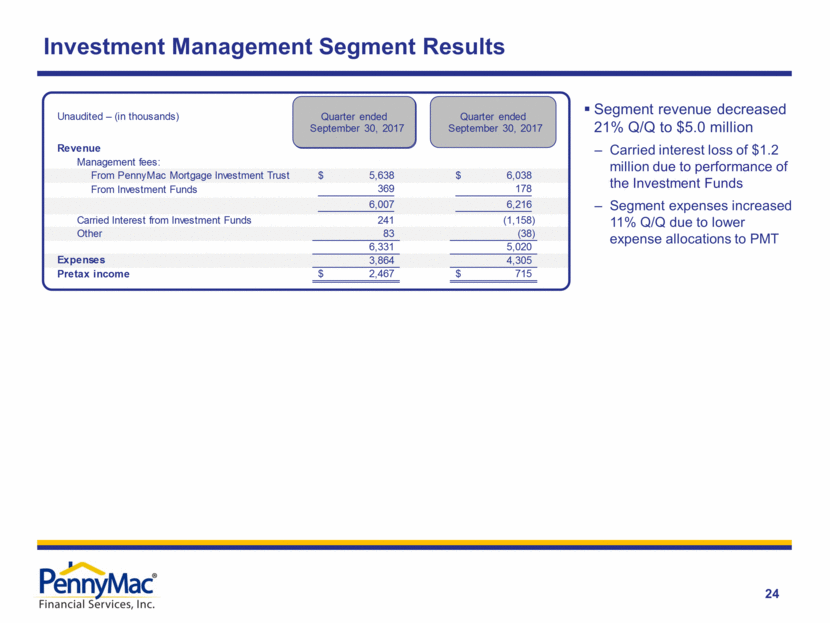
| Investment Management Segment Results 24 Segment revenue decreased 21% Q/Q to $5.0 million Carried interest loss of $1.2 million due to performance of the Investment Funds Segment expenses increased 11% Q/Q due to lower expense allocations to PMT Quarter ended June 30, 2015 Center Center Unaudited – (in thousands) Revenue Management fees: From PennyMac Mortgage Investment Trust $ 5,638 $ 6,038 From Investment Funds 369 178 6,007 6,216 Carried Interest from Investment Funds 241 (1,158) Other 83 (38) 6,331 5,020 Expenses 3,864 4,305 Pretax income $ 2,467 $ 715 Quarter ended December $ 5,742 714 6,456 1,483 (141) 7,798 5,618 $ 2,180 30, 2015 Quarter ended June 30, 2015 Quarter ended September 30, 2017 Quarter ended September 30, 2017 |
| Appendix |

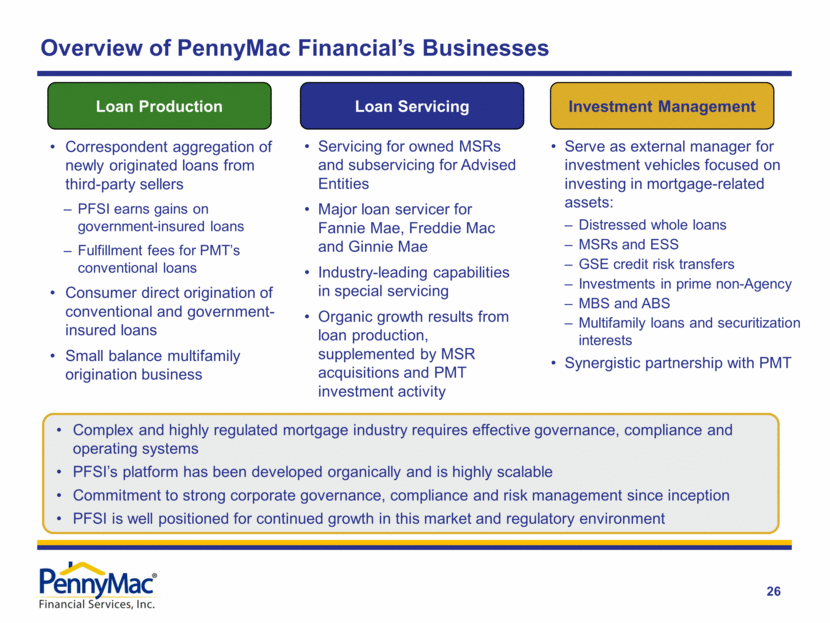
| Overview of PennyMac Financial’s Businesses Complex and highly regulated mortgage industry requires effective governance, compliance and operating systems PFSI’s platform has been developed organically and is highly scalable Commitment to strong corporate governance, compliance and risk management since inception PFSI is well positioned for continued growth in this market and regulatory environment Loan Production Loan Servicing Investment Management Servicing for owned MSRs and subservicing for Advised Entities Major loan servicer for Fannie Mae, Freddie Mac and Ginnie Mae Industry-leading capabilities in special servicing Organic growth results from loan production, supplemented by MSR acquisitions and PMT investment activity Serve as external manager for investment vehicles focused on investing in mortgage-related assets: Distressed whole loans MSRs and ESS GSE credit risk transfers Investments in prime non-Agency MBS and ABS Multifamily loans and securitization interests Synergistic partnership with PMT Correspondent aggregation of newly originated loans from third-party sellers PFSI earns gains on government-insured loans Fulfillment fees for PMT’s conventional loans Consumer direct origination of conventional and government-insured loans Small balance multifamily origination business 26 |
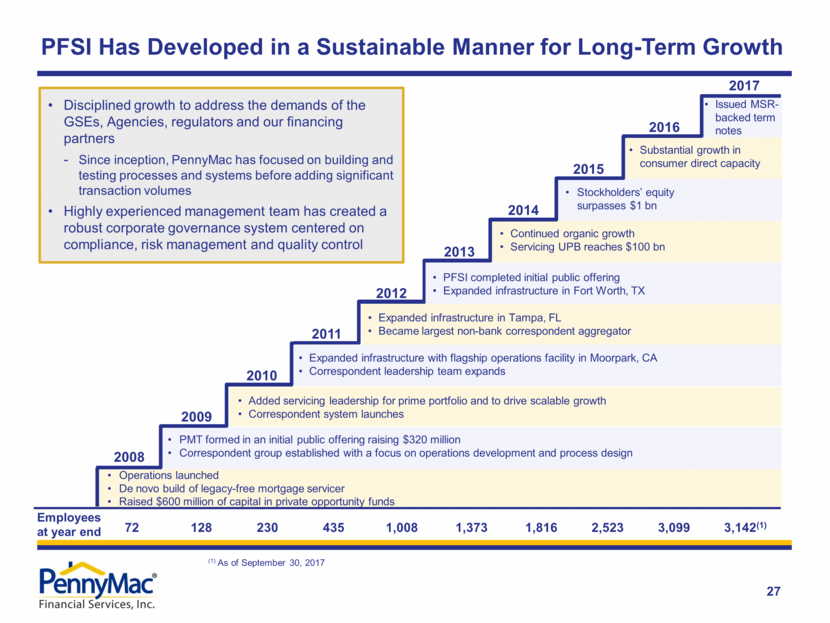
| Issued MSR- backed term notes 2017 2008 2009 2010 2011 2012 2013 2014 2015 Added servicing leadership for prime portfolio and to drive scalable growth Correspondent system launches Expanded infrastructure with flagship operations facility in Moorpark, CA Correspondent leadership team expands Expanded infrastructure in Tampa, FL Became largest non-bank correspondent aggregator PFSI completed initial public offering Expanded infrastructure in Fort Worth, TX Continued organic growth Servicing UPB reaches $100 bn Stockholders’ equity surpasses $1 bn 2016 Substantial growth in consumer direct capacity PFSI Has Developed in a Sustainable Manner for Long-Term Growth 72 128 230 435 1,008 1,373 1,816 2,523 3,099 3,142(1) Employees at year end 27 Disciplined growth to address the demands of the GSEs, Agencies, regulators and our financing partners - Since inception, PennyMac has focused on building and testing processes and systems before adding significant transaction volumes Highly experienced management team has created a robust corporate governance system centered on compliance, risk management and quality control (1) As of September 30, 2017 Operations launched De novo build of legacy-free mortgage servicer Raised $600 million of capital in private opportunity funds PMT formed in an initial public offering raising $320 million Correspondent group established with a focus on operations development and process design |
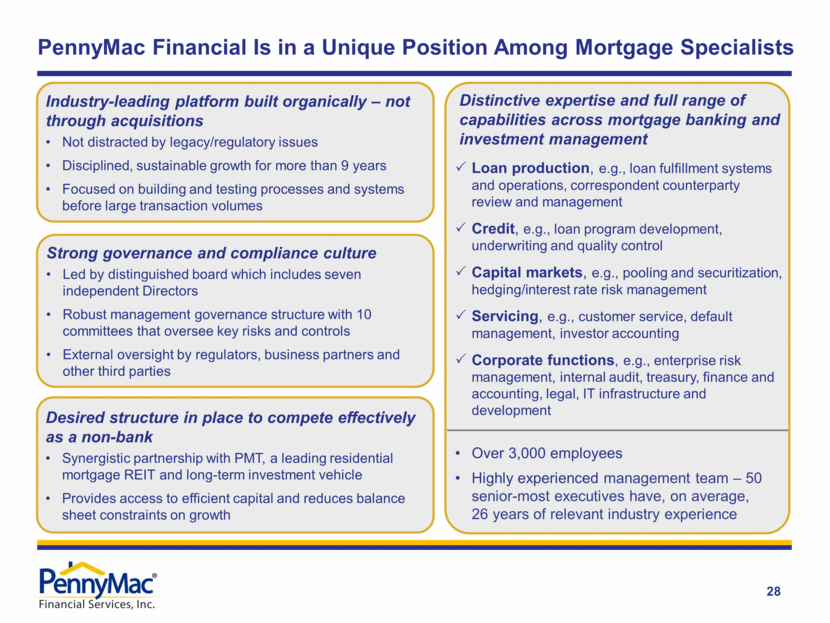
| 28 PennyMac Financial Is in a Unique Position Among Mortgage Specialists Industry-leading platform built organically – not through acquisitions Not distracted by legacy/regulatory issues Disciplined, sustainable growth for more than 9 years Focused on building and testing processes and systems before large transaction volumes Distinctive expertise and full range of capabilities across mortgage banking and investment management Loan production, e.g., loan fulfillment systems and operations, correspondent counterparty review and management Credit, e.g., loan program development, underwriting and quality control Capital markets, e.g., pooling and securitization, hedging/interest rate risk management Servicing, e.g., customer service, default management, investor accounting Corporate functions, e.g., enterprise risk management, internal audit, treasury, finance and accounting, legal, IT infrastructure and development Over 3,000 employees Highly experienced management team – 50 senior-most executives have, on average, 26 years of relevant industry experience Strong governance and compliance culture Led by distinguished board which includes seven independent Directors Robust management governance structure with 10 committees that oversee key risks and controls External oversight by regulators, business partners and other third parties Desired structure in place to compete effectively as a non-bank Synergistic partnership with PMT, a leading residential mortgage REIT and long-term investment vehicle Provides access to efficient capital and reduces balance sheet constraints on growth |
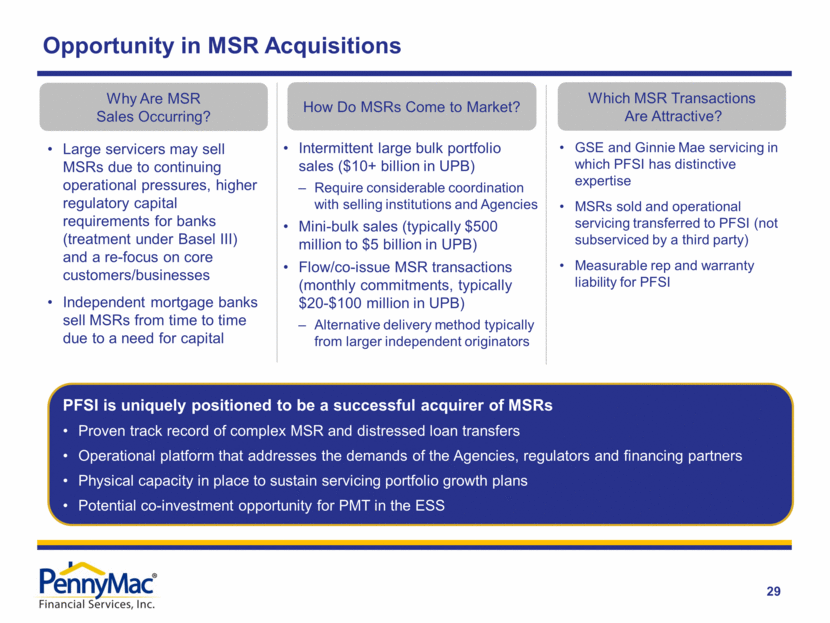
| Opportunity in MSR Acquisitions 29 Why Are MSR Sales Occurring? How Do MSRs Come to Market? Large servicers may sell MSRs due to continuing operational pressures, higher regulatory capital requirements for banks (treatment under Basel III) and a re-focus on core customers/businesses Independent mortgage banks sell MSRs from time to time due to a need for capital Intermittent large bulk portfolio sales ($10+ billion in UPB) Require considerable coordination with selling institutions and Agencies Mini-bulk sales (typically $500 million to $5 billion in UPB) Flow/co-issue MSR transactions (monthly commitments, typically $20-$100 million in UPB) Alternative delivery method typically from larger independent originators Which MSR Transactions Are Attractive? GSE and Ginnie Mae servicing in which PFSI has distinctive expertise MSRs sold and operational servicing transferred to PFSI (not subserviced by a third party) Measurable rep and warranty liability for PFSI PFSI is uniquely positioned to be a successful acquirer of MSRs Proven track record of complex MSR and distressed loan transfers Operational platform that addresses the demands of the Agencies, regulators and financing partners Physical capacity in place to sustain servicing portfolio growth plans Potential co-investment opportunity for PMT in the ESS |
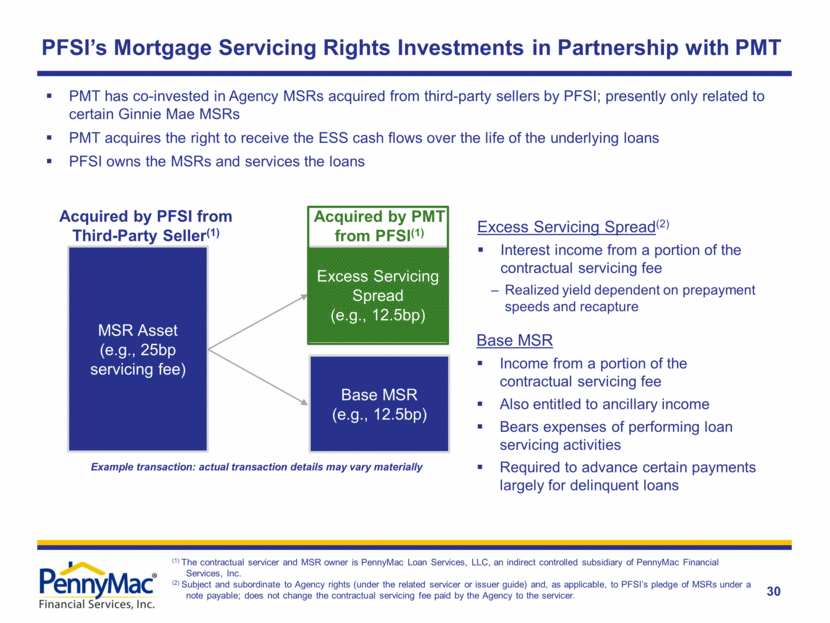
| 30 PFSI’s Mortgage Servicing Rights Investments in Partnership with PMT Excess Servicing Spread (e.g., 12.5bp) MSR Asset (e.g., 25bp servicing fee) Acquired by PFSI from Third-Party Seller(1) PMT has co-invested in Agency MSRs acquired from third-party sellers by PFSI; presently only related to certain Ginnie Mae MSRs PMT acquires the right to receive the ESS cash flows over the life of the underlying loans PFSI owns the MSRs and services the loans (1) The contractual servicer and MSR owner is PennyMac Loan Services, LLC, an indirect controlled subsidiary of PennyMac Financial Services, Inc. (2) Subject and subordinate to Agency rights (under the related servicer or issuer guide) and, as applicable, to PFSI’s pledge of MSRs under a note payable; does not change the contractual servicing fee paid by the Agency to the servicer. Excess Servicing Spread(2) Interest income from a portion of the contractual servicing fee Realized yield dependent on prepayment speeds and recapture Base MSR Income from a portion of the contractual servicing fee Also entitled to ancillary income Bears expenses of performing loan servicing activities Required to advance certain payments largely for delinquent loans Base MSR (e.g., 12.5bp) Acquired by PMT from PFSI(1) Example transaction: actual transaction details may vary materially |
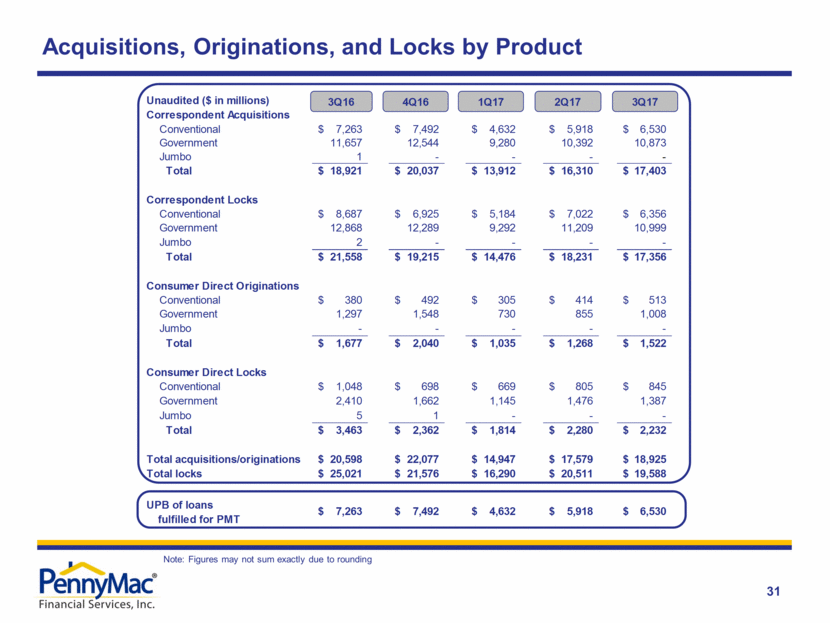
| Acquisitions, Originations, and Locks by Product 31 Note: Figures may not sum exactly due to rounding Unaudited ($ in millions) Correspondent Acquisitions Conventional $ 7,263 $ 7,492 $ 4,632 $ 5,918 $ 6,530 Government 11,657 12,544 9,280 10,392 10,873 Jumbo 1 - - - - Total $ 18,921 $ 20,037 $ 13,912 $ 16,310 $ 17,403 Correspondent Locks Conventional $ 8,687 $ 6,925 $ 5,184 $ 7,022 $ 6,356 Government 12,868 12,289 9,292 11,209 10,999 Jumbo 2 - - - - Total $ 21,558 $ 19,215 $ 14,476 $ 18,231 $ 17,356 Consumer Direct Originations Conventional $ 380 $ 492 $ 305 $ 414 $ 513 Government 1,297 1,548 730 855 1,008 Jumbo - - - - - Total $ 1,677 $ 2,040 $ 1,035 $ 1,268 $ 1,522 Consumer Direct Locks Conventional $ 1,048 $ 698 $ 669 $ 805 $ 845 Government 2,410 1,662 1,145 1,476 1,387 Jumbo 5 1 - - - Total $ 3,463 $ 2,362 $ 1,814 $ 2,280 $ 2,232 Total acquisitions/originations $ 20,598 $ 22,077 $ 14,947 $ 17,579 $ 18,925 Total locks $ 25,021 $ 21,576 $ 16,290 $ 20,511 $ 19,588 UPB of loans $ 7,263 $ 7,492 $ 4,632 $ 5,918 $ 6,530 fulfilled for PMT 2Q17 3Q16 4Q16 1Q17 3Q17 |
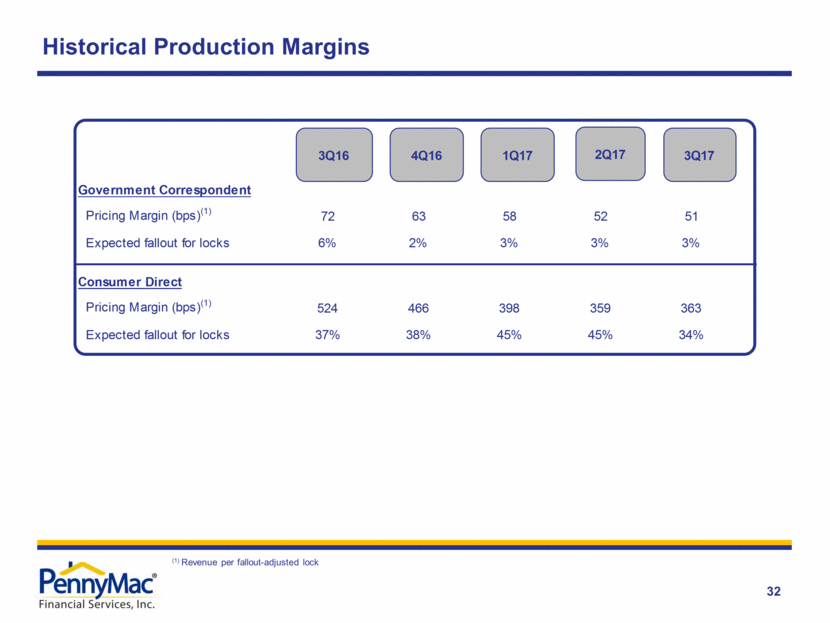
| Historical Production Margins 32 (1) Revenue per fallout-adjusted lock Government Correspondent Pricing Margin (bps)(1) 72 63 58 52 51 Expected fallout for locks 6% 2% 3% 3% 3% Consumer Direct Pricing Margin (bps)(1) 524 466 398 359 363 Expected fallout for locks 37% 38% 45% 45% 34% 3Q17 2Q17 1Q17 4Q16 3Q16 |