united states
securities and exchange commission
washington, d.c. 20549
form n-csr
certified shareholder report of registered management
investment companies
Investment Company Act file number 811-22808
PREDEX
(Exact name of registrant as specified in charter)
225 Pictoria Drive, Ste 450, Cincinnati, OH 45246
(Address of principal executive offices) (Zip code)
Michael Achterberg, PREDEX
222 North Pacific Coast Hwy, Suite 2000, El Segundo, CA 90245
(Name and address of agent for service)
Registrant's telephone number, including area code: 949-336-3445
Date of fiscal year end: 4/30
Date of reporting period: 10/31/21
Item 1. Reports to Stockholders.

Semi-Annual Report
October 31, 2021

INVESTOR INFORMATION: (877) 940-7202
This report and the financial statements contained herein are submitted for the general information of shareholders and are not authorized for distribution to prospective investors unless preceded or accompanied by an effective prospectus. Nothing herein contained is to be considered an offer of sale or solicitation of an offer to buy shares of PREDEX. Such offering is made only by prospectus, which includes details as to offering price and other material information.
Distributed by Northern Lights Distributors, LLC
Member FINRA

Dear Fellow Shareholders,
We are pleased to provide you with the PREDEX (the “Fund”) semi-annual report and this letter highlighting the Fund’s performance. We have continued to utilize a low-cost, passive approach to investing in the flagship U.S. core property funds managed by the leading institutional real estate sponsors. The Fund is invested in 24 private and non-listed institutional real estate funds totaling $250 billion in more than 3,600 properties.
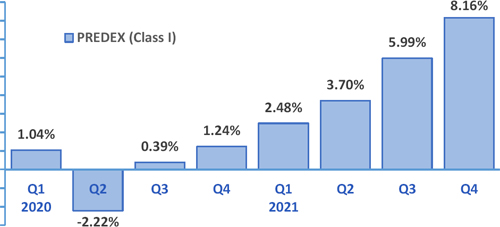
Continued Growth from a Relatively Small Decline
As the nation continues to deal with variants and containment measures nearly two years into the global COVID-19 pandemic, we are encouraged by the resiliency of the commercial real estate market. Since experiencing its only negative quarter of -2.22% for the second quarter of 2020, the Fund has recorded increasingly positive returns each subsequent quarter culminating in a record +8.16% for the quarter ending December 31, 2021.
Performance of PREDEX (Class I) from January 1, 2020 through December 31, 2021
Over the six months ended October 31, 2021 the Fund’s Class I shares delivered a total return of +11.18%. During this same period the publicly traded equity REITs returned +12.78% (MSCI US REIT Index), the S&P 500 +10.91%, and US Bonds +1.06% (Barclays US Aggregate Bond Index). Each of these other major asset classes were rebounding from far larger drawdowns they all experienced together in late March 2020.
For the period from July 1, 2016 (inception) through October 31, 2021
| | Annualized | Annualized | Sharpe | Maximum |
| | Return | Std Dev | Ratio | Drawdown |
| PREDEX (Class I) | +5.50% | 0.77% | 5.79 | -2.50% | 7/01/20 |
| MSCI US REIT Index | +7.59% | 22.54% | 0.29 | -44.03% | 3/23/20 |
| S&P 500 | +18.06% | 18.64% | 0.91 | -33.79% | 3/23/20 |
| Barclays US Agg Bond | +2.84% | 3.47% | 0.51 | -6.30% | 3/19/20 |
Since its inception the Fund has experienced minimum volatility relative to the major asset classes and generated a higher risk-adjusted return (Sharpe Ratio).
Letter to Shareholders (Unaudited)
Additionally, we believe the Fund may be considered an ideal portfolio diversifier as it has experienced little correlation with other major asset classes since inception.
Correlation of Monthly Returns
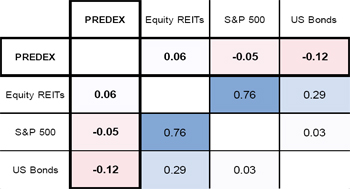
No amount of diversification or correlation can ensure profits or prevent losses.
We also believe the Fund is well diversified by fund manager, property type, and geography. As compared to this time last year, the Fund continues to be more defensively positioned with a 37% allocation to industrial (representing an increase of 5 percentage points) and a reduced allocation to the historically more cyclical sectors of office and retail (respective allocation declines of 4 and 2 percentage points). The underlying funds primarily invest in buildings in major metropolitan areas with high quality tenants and longer-term, staggered leases, less subject to near-term fluctuations.
| SECTOR | GEOGRAPHIC |
| DIVERSIFICATION | DIVERSIFICATION |
| (unaudited) | (unaudited) |
| | |
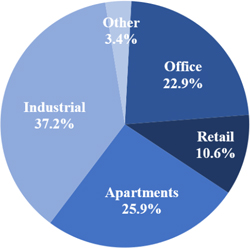 | 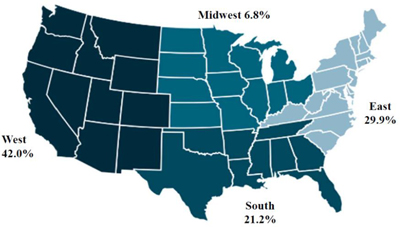 |
The charts represent the underlying fund holdings. Allocation, Sector and Geographic Diversification are subject to change. Diversification does not eliminate the risk of experiencing losses.
Letter to Shareholders (Unaudited)
As we eagerly await a definitive end to this global pandemic, we are encouraged by the increases in vaccinations and hopeful of the progress being made on potential treatments. Whether the current increase in inflation is transient or persistent, we believe that real estate should provide an effective hedge and we continue to closely monitor the potential long-term impact it and the pandemic will have on the economy and real estate markets.
As always, we maintain frequent communication with the institutional fund managers as they assess the situation and implement both defensive and offensive strategies and tactics in their flagship U.S. core property funds.
We thank you for your investment and continued confidence in the Fund.
Sincerely,
 |  |
| | |
| Michael Achterberg, CAIA | J. Grayson Sanders |
| Portfolio Manager | Chief Investment Officer |
The performance data quoted here represents past performance. Past performance is no guarantee of future results. Current performance may be lower or higher than the performance data quoted above. The investment return and principal value of an investment will fluctuate so that investor’s shares, when redeemed, may be worth more or less than their original cost. For performance information current to the most recent month-end, please call 877-940-7202.
The Fund’s investment adviser has contractually agreed to limit its fees and absorb expenses of the Fund until at least August 31, 2022 so that the annual operating expenses (excluding interest and extraordinary expenses) will not exceed 1.10%, 1.35% and 1.35% per annum of the average daily net assets of Class I, Class T and Class W, respectively. Without the waiver the ratio of expenses to average net assets, excluding interest expense, would be 1.03%, 1.43% and 1.44% for Class I, Class T and Class W, respectively per the Fund’s prospectus dated September 1, 2021.
The referenced indices are shown for general market comparisons and are not meant to represent the Fund. You cannot invest directly in an index and unmanaged index returns do not reflect any fees, expenses or sales charges.
Letter to Shareholders (Unaudited)
Indices
Equity REITs are represented by the MSCI US REIT Index, which is a free-float adjusted, market capitalization-weighted index of publicly listed U.S. Equity REITs not designated as Mortgage REITs or selected Specialized REITs.
The S&P 500 Index is an unmanaged index of the 500 largest stocks (in terms of market value), weighted by market capitalization and considered representative of the broad stock market.
US Bonds are represented by the Barclays Capital Aggregate Bond Index, an index of securities that are SEC-registered, taxable and dollar denominated. The index covers the U.S. investment grade fixed rate bond market, with index components for government and corporate securities, mortgage pass-through securities and asset-backed securities. These major sectors are subdivided into more specific indices that are calculated and reported on a regular basis.
Total returns presented assume reinvestment of distributions. Investors are not able to invest directly in the indices referenced in this illustration and unmanaged index returns do not reflect any fees, expenses or sales charges. The referenced indices are shown for general market comparisons.
Definitions
Correlation measures how one investment performs in relation to another, with a coefficient of +1 being a perfect, positive correlation and a coefficient of -1 being a perfect, negative correlation. When two asset classes have a correlation of +1, they will both move up or down by the same amount in the same direction. Conversely, a correlation of -1 indicates that when one asset class moves up or down, the other moves in the opposite direction by the same amount. In general, asset classes with a correlation less than 0.70 or greater than -0.70 are considered to have relatively low correlation. Lower volatility could result in lower returns during certain periods of time.
Maximum drawdown is the maximum decline a security experiences prior to reaching its previous peak.
Sharpe Ratio is a measure of risk-adjusted returns. It is calculated by using standard deviation and excess return (over annualized risk-free rate of 1.07%) to determine reward per unit of risk. In general, a higher Sharpe Ratio indicates better return for the same risk (or the same return for lower risk).
Standard Deviation is the amount of variance that took place for the designated time period. In general, the higher the standard deviation, the greater the volatility of return.
1014-NLD-01/06/2022
| PREDEX |
| PORTFOLIO REVIEW (Unaudited) |
| October 31, 2021 |
The Fund’s performance* compared to its benchmarks for the periods ended October 31, 2021:
| | | | | | | | | | | Since |
| | | | | | | | | Since | | Inception |
| | | | | | | | | Inception | | Class T and |
| | | Six Months | | One Year | | Three Year | | Class I (1) | | Class W (2) |
| PREDEX: | | | | | | | | | | |
| Class I | | + 11.18% | | + 15.57% | | + 6.37% | | + 5.50% | | — |
| Class W | | + 11.12% | | + 15.44% | | + 6.33% | | — | | +6.35% |
| Class T – without load | | + 11.12% | | + 15.44% | | + 6.33% | | — | | +6.35% |
| Class T – with load (3) | | + 6.40% | | + 10.54% | | + 4.79% | | — | | +5.10% |
| Bloomberg Barclays Aggregate Bond Index | | + 1.06% | | - 0.48% | | + 5.63% | | + 2.84% | | +4.49% |
| S&P 500 Total Return Index | | + 10.91% | | + 42.91% | | + 21.48% | | +18.06% | | +17.60% |
| (1) | Annualized total return since July 1, 2016 when the class commenced operations. |
| (2) | Annualized total return since March 1, 2018 when the class commenced operations. |
| (3) | Adjusted for initial maximum sales charge of 4.25%. |
The Bloomberg Barclays Aggregate Bond Index is an unmanaged index which represents the U.S. investment-grade fixed-rate bond market (including government and corporate securities, mortgage pass-through securities and asset-backed securities). The S&P 500 Total Return Index is an unmanaged market capitalization-weighted index which is comprised of 500 of the largest U.S. domiciled companies and includes the reinvestment of all dividends. Investors cannot invest directly in an index or benchmark.
| * | Past performance is not predictive of future results. The investment return and principal value of an investment will fluctuate. An investor’s shares, when redeemed, may be worth more or less than the original cost. Total return is calculated assuming reinvestment of all dividends and distributions. The chart does not reflect the deduction of taxes that a shareholder may have to pay on Fund distributions or the redemption of the Fund shares. For performance information current to the most recent month end, please call 877-940-7202. |
Class I and Class W shares are offered at net asset value. Class T shares are offered subject to a maximum load of 4.25% of the offering price. The Fund’s investment adviser has contractually agreed to reduce its fees and absorb expenses of the Fund at least until August 31, 2022 so that the annual operating expenses (including offering expenses, but excluding taxes, interest, brokerage commissions, acquired fund fees and expenses and extraordinary expenses) will not exceed 1.10%, 1.35% and 1.35% per annum of the average daily net assets of Class I, Class T and Class W, respectively. Without the waiver the expenses would be 1.36% for Class I and 1.76% and 1.77% for Class T and Class W per the Fund’s prospectus dated September 1, 2021. Please review the accompanying Financial Highlights and the Fund’s Prospectus for more details regarding the Fund’s fees and expenses.
Portfolio Composition as of October 31, 2021 (Unaudited)
| | | Percent of | |
| | | Net Assets | |
| Real Estate Investment Funds | | | 99.3 | % |
| Short-Term Investments | | | 3.2 | % |
| Total Investments | | | 102.5 | % |
| Liabilities in Excess of Other Assets | | | (2.5 | %) |
| Total Net Assets | | | 100.0 | % |
See the Portfolio of Investments in this report for a more detailed account of the Fund’s holdings.
PREDEX |
| PORTFOLIO OF INVESTMENTS (Unaudited) |
| October 31, 2021 |
| Shares | | | | | Fair Value | |
| | | | | REAL ESTATE INVESTMENT FUNDS (99.3%) | | | | |
| | | | | Private Investment Funds (1)(2) (96.3%) | | | | |
| | 6,168 | | | AEW Core Property Trust (U.S.), Inc. | | $ | 6,796,146 | |
| | 42 | | | ARA Core Property Fund, LP | | | 5,630,576 | |
| | 43,427 | | | Barings Core Property Fund LP | | | 6,212,721 | |
| | 227,813 | | | BGO Daily Value Fund, LP | | | 2,963,253 | |
| | 2,844 | | | BGO Diversified US Property Fund LP | | | 7,316,188 | |
| | n/a | | | BlackRock US Core Property Fund, LP | | | 6,376,753 | |
| | 5,066,108 | | | CBRE U.S. Core Partners, LP | | | 8,527,779 | |
| | 2,406 | | | Clarion Lion Industrial Trust | | | 7,041,059 | |
| | 4,663 | | | Clarion Lion Properties Fund, LP | | | 7,977,204 | |
| | n/a | | | GWL U.S. Property Fund LP | | | 8,989,900 | |
| | 51 | | | Invesco Core Real Estate-U.S.A., LP | | | 10,569,379 | |
| | 2,168 | | | Invesco U.S. Income Fund, LP | | | 3,454,196 | |
| | 316 | | | Morgan Stanley Prime Property Fund, LLC | | | 6,416,910 | |
| | 323,093 | | | Principal Enhanced Property Fund, LP | | | 4,457,519 | |
| | 3,026 | | | PRISA LP | | | 6,166,925 | |
| | 2,441 | | | Prologis Targeted U.S. Logistics Holdings, LP | | | 6,168,727 | |
| | 46,469 | | | RREEF America REIT II, Inc. | | | 6,379,310 | |
| | 34,870 | | | RREEF Core Plus Industrial Fund, LP | | | 6,175,501 | |
| | 45 | | | Sentinel Real Estate Fund, LP | | | 4,779,334 | |
| | 3,847 | | | Stockbridge Smart Markets Fund, LP | | | 6,938,149 | |
| | 703 | | | UBS Trumbull Property Fund LP | | | 7,413,131 | |
| | n/a | | | USAA US Government Building Fund | | | 5,375,320 | |
| | | | | Total Private Investment Funds (Cost $123,808,420) | | | 142,125,980 | |
| | | | | | | | | |
| | | | | Public Non-Traded Funds (3.0%) | | | | |
| | 323,764 | | | Black Creek Diversified Property Fund (Class I) (1) | | | 2,536,272 | |
| | 149,093 | | | Jones Lang LaSalle Income Property Trust, Inc. (Class M-I) | | | 1,918,832 | |
| | | | | Total Public Non-Traded Funds (Cost $4,245,522) | | | 4,455,104 | |
| | | | | TOTAL REAL ESTATE INVESTMENT FUNDS (Cost $128,053,942) | | | 146,581,084 | |
| | | | | | | | | |
| | | | | SHORT-TERM INVESTMENTS (3) (3.2%) | | | | |
| | 1,607,734 | | | Dreyfus Treasury Obligations Cash Management, Institutional Shares, 0.01% | | | 1,607,734 | |
| | 3,072,327 | | | Federated Hermes Treasury Obligations Fund, Institutional Shares, 0.01% | | | 3,072,327 | |
| | | | | TOTAL SHORT-TERM INVESTMENTS (Cost $4,680,061) | | | 4,680,061 | |
| | | | | | | | | |
| | | | | TOTAL INVESTMENTS (102.5%) (Cost $132,734,003) | | | 151,261,145 | |
| | | | | | | | | |
| | | | | LIABILITIES IN EXCESS OF OTHER ASSETS (-2.5%) | | | (3,651,748 | ) |
| | | | | | | | | |
| | | | | NET ASSETS (100.0%) | | $ | 147,609,397 | |
| | | | | | | | | |
| (1) | Fair value estimated using Fair Valuation Procedures adopted by the Board of Trustees as discussed in the notes. |
| (2) | Pledged as collateral for borrowings under a line of credit. |
| (3) | Money market funds; interest rate reflects seven-day effective yield on October 31, 2021. |
See Notes to Financial Statements.
| PREDEX |
| STATEMENT OF ASSETS AND LIABILITIES (Unaudited) |
| October 31, 2021 |
| ASSETS | | | | |
| Investments at fair value (identified cost $132,734,003) | | $ | 151,261,145 | |
| Receivable for securities sold | | | 5,603,954 | |
| Dividends and interest receivable | | | 380,560 | |
| Receivable for fund shares sold | | | 20,269 | |
| Prepaid expenses and other assets | | | 23,521 | |
| Total Assets | | | 157,289,449 | |
| | | | | |
| LIABILITIES | | | | |
| Line of credit payable | | | 9,508,348 | |
| Accrued advisory fee | | | 75,597 | |
| Due to custodian bank | | | 28,747 | |
| Distribution fees payable | | | 49 | |
| Accrued expenses and other liabilities | | | 67,311 | |
| Total Liabilities | | | 9,680,052 | |
| Total Commitments and Contingencies (see Note 8) | | | | |
| NET ASSETS | | $ | 147,609,397 | |
| | | | | |
| COMPONENTS OF NET ASSETS | | | | |
| Paid-in capital | | $ | 118,944,748 | |
| Accumulated earnings | | | 28,664,649 | |
| NET ASSETS | | $ | 147,609,397 | |
| | | | | |
| Class I | | | | |
| Net assets | | $ | 147,355,184 | |
| Shares of beneficial interest outstanding (no par value; unlimited shares authorized) | | | 5,293,230 | |
| Net asset value, offering and redemption price per share | | $ | 27.84 | |
| | | | | |
| Class T | | | | |
| Net assets | | $ | 109,591 | |
| Shares of beneficial interest outstanding (no par value; unlimited shares authorized) | | | 3,915 | |
| Net asset value and redemption price per share | | $ | 27.99 | |
| Maximum offering price per share (maximum sales charge of 4.25%) | | $ | 29.23 | |
| | | | | |
| Class W | | | | |
| Net assets | | $ | 144,622 | |
| Shares of beneficial interest outstanding (no par value; unlimited shares authorized) | | | 5,167 | |
| Net asset value, offering and redemption price per share | | $ | 27.99 | |
| | | | | |
See Notes to Financial Statements.
| PREDEX |
| STATEMENT OF OPERATIONS (Unaudited) |
| For the Six Months Ended October 31, 2021 |
| INVESTMENT INCOME | | | | |
| Dividend income | | $ | 2,338,164 | |
| Interest income | | | 748 | |
| Total Investment Income | | | 2,338,912 | |
| | | | | |
| EXPENSES | | | | |
| Investment advisory fees | | | 457,909 | |
| Distribution fees: | | | | |
| Class T | | | 130 | |
| Class W | | | 173 | |
| Interest expense | | | 216,910 | |
| Shareholder service fees | | | 98,302 | |
| Administration fees | | | 74,507 | |
| Trustees fees | | | 42,850 | |
| Transfer agent fees | | | 36,970 | |
| Legal fees | | | 25,606 | |
| Audit and tax fees | | | 25,301 | |
| Fund accounting fees | | | 25,256 | |
| Registration fees | | | 22,685 | |
| Printing fees | | | 22,225 | |
| Professional fees | | | 18,426 | |
| Custodian fees | | | 11,767 | |
| Insurance fees | | | 7,562 | |
| Miscellaneous expenses | | | 2,017 | |
| Total Expenses | | | 1,088,596 | |
| Net Investment Income | | | 1,250,316 | |
| | | | | |
| REALIZED AND UNREALIZED GAIN (LOSS) ON INVESTMENTS | | | | |
| Net realized gain on investments | | | 4,643,903 | |
| Net change in unrealized appreciation on investments | | | 11,589,463 | |
| Net Realized and Unrealized Gain on Investments | | | 16,233,366 | |
| Net Increase in Net Assets Resulting from Operations | | $ | 17,483,682 | |
| | | | | |
See Notes to Financial Statements.
| PREDEX |
| STATEMENTS OF CHANGES IN NET ASSETS |
| | | For the | | | For the | |
| | | Six Months Ended | | | Year Ended | |
| | | October 31, 2021 | | | April 30, 2021 | |
| | | (Unaudited) | | | | |
| INCREASE (DECREASE) IN NET ASSETS FROM OPERATIONS | | | | | | | | |
| Net investment income | | $ | 1,250,316 | | | $ | 2,324,389 | |
| Net realized gain on investments | | | 4,643,903 | | | | 2,553,968 | |
| Net change in unrealized appreciation on investments | | | 11,589,463 | | | | (844,221 | ) |
| Net Increase in Net Assets Resulting from Operations | | | 17,483,682 | | | | 4,034,136 | |
| | | | | | | | | |
| DISTRIBUTIONS TO SHAREHOLDERS | | | | | | | | |
| Class I: | | | | | | | | |
| From distributable earnings | | | (3,510,878 | ) | | | (3,563,003 | ) |
| From return of capital | | | — | | | | (4,860,160 | ) |
| Class T: | | | | | | | | |
| From distributable earnings | | | (2,045 | ) | | | (1,461 | ) |
| From return of capital | | | — | | | | (2,361 | ) |
| Class W: | | | | | | | | |
| From distributable earnings | | | (2,729 | ) | | | (2,049 | ) |
| From return of capital | | | — | | | | (3,284 | ) |
| Total Distributions to Shareholders | | | (3,515,652 | ) | | | (8,432,318 | ) |
| | | | | | | | | |
| BENEFICIAL INTEREST TRANSACTIONS | | | | | | | | |
| Class I: | | | | | | | | |
| Proceeds from shares issued | | | 9,451,432 | | | | 20,662,438 | |
| Distributions reinvested | | | 601,885 | | | | 1,961,654 | |
| Payments for shares redeemed | | | (43,120,778 | ) | | | (65,151,200 | ) |
| Class T: | | | | | | | | |
| Distributions reinvested | | | 2,045 | | | | 3,822 | |
| Class W: | | | | | | | | |
| Distributions reinvested | | | 712 | | | | 1,448 | |
| Payments for shares redeemed | | | — | | | | (3,009 | ) |
| Total Beneficial Interest Transactions | | | (33,064,704 | ) | | | (42,524,847 | ) |
| Decrease in Net Assets | | | (19,096,674 | ) | | | (46,923,029 | ) |
| | | | | | | | | |
| NET ASSETS | | | | | | | | |
| Beginning of period | | | 166,706,071 | | | | 213,629,100 | |
| End of period | | $ | 147,609,397 | | | $ | 166,706,071 | |
| | | | | | | | | |
| SHARE ACTIVITY | | | | | | | | |
| Class I: | | | | | | | | |
| Shares issued | | | 359,926 | | | | 816,660 | |
| Shares reinvested | | | 23,203 | | | | 77,897 | |
| Shares redeemed | | | (1,598,739 | ) | | | (2,571,080 | ) |
| Net decrease in shares of beneficial interest outstanding | | | (1,215,610 | ) | | | (1,676,523 | ) |
| Class T: | | | | | | | | |
| Shares reinvested | | | 77 | | | | 152 | |
| Net increase in shares of beneficial interest outstanding | | | 77 | | | | 152 | |
| Class W: | | | | | | | | |
| Shares reinvested | | | 27 | | | | 57 | |
| Shares redeemed | | | — | | | | (117 | ) |
| Net increase (decrease) in shares of beneficial interest outstanding | | | 27 | | | | (60 | ) |
See Notes to Financial Statements.
| PREDEX |
| STATEMENT OF CASH FLOWS (Unaudited) |
| For the Six Months Ended October 31, 2021 |
| Cash Flows from Operating Activities | | | |
| Net increase in net assets resulting from operations | | $ | 17,483,682 | |
| Adjustments to reconcile net increase in net assets resulting from operations to net cash provided by operating activities: | | | | |
| Purchases of real estate investments | | | (1,709,827 | ) |
| Proceeds from sales | | | 32,467,750 | |
| Net sales of short term investments | | | 14,540,048 | |
| Net realized gain on investments | | | (4,643,903 | ) |
| Net change in unrealized appreciation on investments | | | (11,589,463 | ) |
| (Increase)/Decrease in assets: | | | | |
| Receivable for securities sold | | | (5,256,716 | ) |
| Dividends and interest receivable | | | (3,044 | ) |
| Prepaid expenses and other assets | | | 924 | |
| Increase/(Decrease) in liabilities: | | | | |
| Accrued advisory fee | | | (16,620 | ) |
| Distribution fees payable | | | 6 | |
| Accrued expenses and other liabilities | | | (74,466 | ) |
| Net cash provided by operating activities | | | 41,198,371 | |
| | | | | |
| Cash Flows from Financing Activities | | | | |
| Proceeds from shares issued (net of change in receivable for fund shares sold) | | | 9,441,430 | |
| Payments for shares redeemed | | | (43,120,778 | ) |
| Proceeds from line of credit (including accrued interest) | | | 105,297 | |
| Repayment of borrowings | | | (4,889,388 | ) |
| Distributions paid (net of reinvestments) | | | (2,911,010 | ) |
| Net cash used in financing activities | | | (41,374,449 | ) |
| | | | | |
| Net decrease in cash | | | (176,078 | ) |
| Cash at beginning of period | | | 176,078 | |
| Cash at end of period | | $ | — | |
| | | | | |
| | | | | |
| Supplemental Disclosure of Cash Flow Information | | | | |
| Non-cash financing activities not included herein consists of: | | | | |
| Reinvestment of dividends | | $ | 604,642 | |
| Accrued interest on borrowings | | $ | 215,908 | |
See Notes to Financial Statements.
| PREDEX |
| FINANCIAL HIGHLIGHTS |
The table below sets forth financial data for one share of capital stock outstanding throughout each period presented.
| | | Class I | |
| | | For the | | | For the | | | For the | | | For the | | | For the | | | For the | |
| | | Six Months Ended | | | Year Ended | | | Year Ended | | | Year Ended | | | Year Ended | | | Year Ended | |
| | | October 31, | | | April 30, | | | April 30, | | | April 30, | | | April 30, | | | April 30, | |
| | | 2021 | | | 2021 | | | 2020 | | | 2019 | | | 2018 | | | 2017 (1) | |
| | | (Unaudited) | | | | | | | | | | | | | | | | |
| | | | | | | | | | | | | | | | | | | | | | | | | |
| Net Asset Value, Beginning of Period | | $ | 25.58 | | | $ | 26.07 | | | $ | 26.28 | | | $ | 26.10 | | | $ | 25.19 | | | $ | 25.00 | |
| From Operations: | | | | | | | | | | | | | | | | | | | | | | | | |
| Net investment income (a) | | | 0.20 | | | | 0.30 | | | | 0.41 | | | | 0.48 | | | | 0.43 | | | | — | |
| Net gain from investments (both realized and unrealized) | | | 2.62 | | | | 0.29 | | | | 0.49 | | | | 0.80 | | | | 1.11 | | | | 0.31 | |
| Total from operations | | | 2.82 | | | | 0.59 | | | | 0.90 | | | | 1.28 | | | | 1.54 | | | | 0.31 | |
| Less Distributions: | | | | | | | | | | | | | | | | | | | | | | | | |
| From distributable earnings (f) | | | (0.56 | ) | | | (0.45 | ) | | | (0.19 | ) | | | (0.02 | ) | | | (0.21 | ) | | | (0.12 | ) |
| From return of capital | | | — | | | | (0.63 | ) | | | (0.92 | ) | | | (1.08 | ) | | | (0.42 | ) | | | — | |
| Total distributions | | | (0.56 | ) | | | (1.08 | ) | | | (1.11 | ) | | | (1.10 | ) | | | (0.63 | ) | | | (0.12 | ) |
| Net Asset Value, End of Period | | $ | 27.84 | | | $ | 25.58 | | | $ | 26.07 | | | $ | 26.28 | | | $ | 26.10 | | | $ | 25.19 | |
| | | | | | | | | | | | | | | | | | | | | | | | | |
| Total Return (b) | | | 11.18 | % (h) | | | 2.40 | % | | | 3.48 | % | | | 5.01 | % | | | 6.18 | % | | | 1.27 | % |
| | | | | | | | | | | | | | | | | | | | | | | | | |
| Ratios/Supplemental Data: | | | | | | | | | | | | | | | | | | | | | | | | |
| Net assets, end of period (in 000’s) | | $ | 147,355 | | | $ | 166,475 | | | $ | 213,397 | | | $ | 183,803 | | | $ | 44,034 | | | $ | 39,871 | |
| Ratio of expenses to average net assets, including interest expense (c): | | | | | | | | | | | | | | | | | | | | | | | | |
| before reimbursement/recoupment | | | 1.31 | % (g) | | | 1.33 | % | | | 1.02 | % | | | n/a | | | | n/a | | | | n/a | |
| after reimbursement/recoupment | | | 1.31 | % (g) | | | 1.43 | % | | | 1.16 | % | | | n/a | | | | n/a | | | | n/a | |
| Ratio of expenses to average net assets, excluding interest expense (c): | | | | | | | | | | | | | | | | | | | | | | | | |
| before reimbursement/recoupment | | | 1.05 | % (g) | | | 1.00 | % | | | 0.97 | % | | | 1.10 | % | | | 1.73 | % | | | 3.63 | % (e) |
| after reimbursement/recoupment | | | 1.05 | % (g) | | | 1.10 | % | | | 1.11 | % | | | 1.16 | % | | | 1.20 | % | | | 1.20 | % (e) |
| Ratio of net investment income to average net assets (c) (d) | | | 1.50 | % (g) | | | 1.18 | % | | | 1.57 | % | | | 1.81 | % | | | 1.70 | % | | | 0.02 | % (e) |
| Portfolio turnover rate | | | 1 | % (h) | | | 11 | % | | | 5 | % | | | 0 | % | | | 0 | % | | | 0 | % |
| (1) | Commencement of operations was July 1, 2016. |
| (a) | Per share amounts calculated using the average shares method, which more appropriately presents the per share data for the period. |
| (b) | Total returns are historical in nature and assume changes in share price, reinvestment of dividends and capital gain distributions, if any. Had the advisor not recouped historically waived fees or absorbed a portion of the expenses, total return would have been higher and lower, respectively. |
| (c) | Does not include expenses of investment companies in which the Fund invests. The Fund’s Total Return is reported net of all fees and expenses. |
| (d) | Recognition of net investment income by the Fund is affected by the timing and declaration of dividends by the underlying investment companies in which the Fund invests. |
| (e) | Recurring expenses that were not charged until the Fund commenced operations on July 1, 2016 have been annualized. |
| (f) | Prior year data has been reclassified to conform with current year presentation. |
See Notes to Financial Statements.
| PREDEX |
| FINANCIAL HIGHLIGHTS (Continued) |
The table below sets forth financial data for one share of capital stock outstanding throughout each period presented.
| | | Class T | | | Class W | |
| | | For the | | | For the | | | For the | | | For the | | | For the | | | For the | | | For the | | | For the | | | For the | | | For the | |
| | | Six Months Ended | | | Year Ended | | | Year Ended | | | Year Ended | | | Period Ended | | | Six Months Ended | | | Year Ended | | | Year Ended | | | Year Ended | | | Period Ended | |
| | | October 31, | | | April 30, | | | April 30, | | | April 30, | | | April 30, | | | October 31, | | | April 30, | | | April 30, | | | April 30, | | | April 30, | |
| | | 2021 | | | 2021 | | | 2020 | | | 2019 | | | 2018 (1) | | | 2021 | | | 2021 | | | 2020 | | | 2019 | | | 2018 (1) | |
| | | (Unaudited) | | | | | | | | | | | | | | | (Unaudited) | | | | | | | | | | | | | |
| | | | | | | | | | | | | | | | | | | | | | | | | | | | | | | | | | | | | | | | | |
| Net Asset Value, Beginning of Period | | $ | 25.70 | | | $ | 26.14 | | | $ | 26.29 | | | $ | 26.09 | | | $ | 25.89 | | | $ | 25.70 | | | $ | 26.14 | | | $ | 26.29 | | | $ | 26.09 | | | $ | 25.89 | |
| From Operations: | | | | | | | | | | | | | | | | | | | | | | | | | | | | | | | | | | | | | | | | |
| Net investment income (a) | | | 0.18 | | | | 0.29 | | | | 0.41 | | | | 0.58 | | | | 0.08 | | | | 0.18 | | | | 0.29 | | | | 0.39 | | | | 0.47 | | | | 0.08 | |
| Net gain from investments (both realized and unrealized) | | | 2.64 | | | | 0.29 | | | | 0.48 | | | | 0.66 | | | | 0.34 | | | | 2.64 | | | | 0.29 | | | | 0.50 | | | | 0.77 | | | | 0.34 | |
| Total from operations | | | 2.82 | | | | 0.58 | | | | 0.89 | | | | 1.24 | | | | 0.42 | | | | 2.82 | | | | 0.58 | | | | 0.89 | | | | 1.24 | | | | 0.42 | |
| Less Distributions: | | | | | | | | | | | | | | | | | | | | | | | | | | | | | | | | | | | | | | | | |
| From distributable earnings | | | (0.53 | ) | | | (0.39 | ) | | | (0.12 | ) | | | (0.02 | ) | | | — | | | | (0.53 | ) | | | (0.39 | ) | | | (0.12 | ) | | | (0.02 | ) | | | — | |
| From return of capital | | | — | | | | (0.63 | ) | | | (0.92 | ) | | | (1.02 | ) | | | (0.22 | ) | | | — | | | | (0.63 | ) | | | (0.92 | ) | | | (1.02 | ) | | | (0.22 | ) |
| Total distributions | | | (0.53 | ) | | | (1.02 | ) | | | (1.04 | ) | | | (1.04 | ) | | | (0.22 | ) | | | (0.53 | ) | | | (1.02 | ) | | | (1.04 | ) | | | (1.04 | ) | | | (0.22 | ) |
| Net Asset Value, End of Period | | $ | 27.99 | | | $ | 25.70 | | | $ | 26.14 | | | $ | 26.29 | | | $ | 26.09 | | | $ | 27.99 | | | $ | 25.70 | | | $ | 26.14 | | | $ | 26.29 | | | $ | 26.09 | |
| | | | | | | | | | | | | | | | | | | | | | | | | | | | | | | | | | | | | | | | | |
| Total Return (b) | | | 11.12 | % (f) | | | 2.35 | % | | | 3.46 | % | | | 4.84 | % | | | 1.63 | % (f) | | | 11.12 | % (f) | | | 2.35 | % | | | 3.46 | % | | | 4.84 | % | | | 1.63 | % (f) |
| | | | | | | | | | | | | | | | | | | | | | | | | | | | | | | | | | | | | | | | | |
| Ratios/Supplemental Data: | | | | | | | | | | | | | | | | | | | | | | | | | | | | | | | | | | | | | | | | |
| Net assets, end of period (in 000’s) | | $ | 109 | | | $ | 99 | | | $ | 96 | | | $ | 93 | | | $ | 3 | | | $ | 145 | | | $ | 132 | | | $ | 136 | | | $ | 26 | | | $ | 3 | |
| Ratio of expenses to average net assets, including interest expense (c): | | | | | | | | | | | | | | | | | | | | | | | | | | | | | | | | | | | | | | | | |
| before reimbursement | | | 1.44 | % (e) | | | 1.48 | % | | | 1.16 | % | | | n/a | | | | n/a | | | | 1.44 | % (e) | | | 1.49 | % | | | 1.18 | % | | | n/a | | | | n/a | |
| after reimbursement | | | 1.44 | % (e) | | | 1.48 | % | | | 1.16 | % | | | n/a | | | | n/a | | | | 1.44 | % (e) | | | 1.49 | % | | | 1.18 | % | | | n/a | | | | n/a | |
| Ratio of expenses to average net assets, excluding interest expense (c): | | | | | | | | | | | | | | | | | | | | | | | | | | | | | | | | | | | | | | | | |
| before reimbursement | | | 1.18 | % (e) | | | 1.15 | % | | | 1.11 | % | | | 1.20 | % | | | 2.41 | % (e) | | | 1.18 | % (e) | | | 1.15 | % | | | 1.12 | % | | | 1.32 | % | | | 2.41 | % (e) |
| after reimbursement | | | 1.18 | % (e) | | | 1.15 | % | | | 1.11 | % | | | 1.19 | % | | | 1.45 | % (e) | | | 1.18 | % (e) | | | 1.15 | % | | | 1.12 | % | | | 1.29 | % | | | 1.45 | % (e) |
| Ratio of net investment income to average net assets (c) (d) | | | 1.38 | % (e) | | | 1.13 | % | | | 1.57 | % | | | 2.19 | % | | | 1.87 | % (e) | | | 1.38 | % (e) | | | 1.13 | % | | | 1.49 | % | | | 1.77 | % | | | 1.87 | % (e) |
| Portfolio turnover rate | | | 1 | % (f) | | | 11 | % | | | 5 | % | | | 0 | % | | | 0 | % (f) | | | 1 | % (f) | | | 11 | % | | | 5 | % | | | 0 | % | | | 0 | % (f) |
| (1) | Commencement of operations was March 1, 2018. |
| (a) | Per share amounts calculated using the average shares method, which more appropriately presents the per share data for the period. |
| (b) | Total returns are historical in nature and assume changes in share price, reinvestment of dividends and capital gain distributions, if any. Had the advisor not absorbed a portion of the expenses, total return would have been lower. |
| (c) | Does not include expenses of investment companies in which the Fund invests. The Fund’s Total Return is reported net of all fees and expenses. |
| (d) | Recognition of net investment income by the Fund is affected by the timing and declaration of dividends by the underlying investment companies in which the Fund invests. |
See Notes to Financial Statements.
| PREDEX |
| NOTES TO FINANCIAL STATEMENTS (Unaudited) |
| October 31, 2021 |
PREDEX (the “Fund”) is registered under the Investment Company Act of 1940, as amended (the “1940 Act”), as a closed-end management investment company. The Fund is non-diversified, engages in a continuous offering of shares and operates as an interval fund that offers to make quarterly repurchases of shares at net asset value. The Fund’s investment advisor is PREDEX Capital Management, LLC (the “Advisor”).
The primary investment objective of the Fund is to seek consistent current income while secondarily seeking long-term capital appreciation with moderate volatility.
The Fund was organized as a statutory trust on February 5, 2013 under the laws of the State of Delaware.
The Fund currently offers Class I, Class T and Class W shares. The Fund commenced operations July 1, 2016 with a single class of shares which was renamed Class I on March 1, 2018. Class T and Class W shares commenced operations on March 1, 2018. Class T shares are offered at net asset value plus a maximum sales charge of 4.25%. Class I and Class W shares are offered at net asset value. Each class represents an interest in the same assets of the Fund and classes are identical except for differences in their sales charge structures and ongoing service and distribution charges. All classes of shares have equal voting privileges except that each class has exclusive voting rights with respect to its service and/or distribution plans. The Fund’s income, expenses (other than class specific distribution fees) and realized and unrealized gains and losses are allocated proportionately each day based upon the relative net assets of each class.
| (2) | SIGNIFICANT ACCOUNTING POLICIES |
The following is a summary of significant accounting policies followed by the Fund in preparation of its financial statements. These policies are in conformity with accounting principles generally accepted in the United States of America (“GAAP”). The Fund is an investment company and accordingly follows the investment company accounting and reporting guidance of the Financial Accounting Standards Board (FASB) Accounting Standard Codification Topic 946 “Financial Services Investment Companies” including FASB Accounting Standard Update ASU 2013-08. The preparation of financial statements requires management to make estimates and assumptions that affect the reported amounts of assets and liabilities and disclosure of contingent assets and liabilities at the date of the financial statements and the reported amounts of income and expenses for the period. Actual results could differ from those estimates.
Security Valuation – The Fund uses fair valuation procedures to value a substantial portion of its assets. The Fund uses the fair value of a security to calculate its net asset value (“NAV”) when, for example, (1) a portfolio security is not traded in a public market or the principal market in which the security trades is closed, (2) trading in a portfolio security is suspended and not resumed prior to the normal market close, (3) a portfolio security is not traded in significant volume for a substantial period, or (4) the Advisor determines that the quotation or price for a portfolio security provided by a broker-dealer or independent pricing service is inaccurate. Short-term investments having 60 days or less remaining until maturity, at time of purchase, are valued at amortized cost, which approximates fair value.
Valuation of Private Investment Funds – The Fund invests a significant portion of its assets in Private Investment Funds (each a “Private Fund” and collectively, the “Private Funds”). The Private Funds measure their real estate investments at fair value, and report a NAV per share on typically a calendar quarter basis. The Fund estimates the fair value of each Private Fund by adjusting the most recent NAV for each Private Fund by the change in a proprietary benchmark that the Fund has deemed to be representative of the entire Private Fund market. If an underlying fund manager reports the NAV per share (or its equivalent) to the
| PREDEX |
| NOTES TO FINANCIAL STATEMENTS (Unaudited) (Continued) |
| October 31, 2021 |
Fund on a daily basis, then that unadjusted NAV per share is used to value the investment. Use of a NAV per share is commonly used as an acceptable valuation technique for investments in private investment companies, and is referred to as the “practical expedient” by ASC 820 Fair Value Measurement.
Fair Value Process – The “fair value” of securities may be difficult to determine and thus judgment plays a greater role in the valuation process. The fair valuation methodology may include or consider the following guidelines, as appropriate: (1) evaluation of all relevant factors, including but not limited to, pricing history, current market level, supply and demand of the respective security; (2) comparison to the values and current pricing of securities that have comparable characteristics; (3) knowledge of historical market information with respect to the security; (4) other factors relevant to the security which would include, but not be limited to, duration, yield, fundamental analytical data, the Treasury yield curve, and credit quality.
The values assigned to fair valued investments will be based on available information and will not necessarily represent amounts that might ultimately be realized, since such amounts depend on future developments inherent in long-term investments. Changes in the fair valuation of portfolio securities may be less frequent and of greater magnitude than changes in the price of portfolio securities valued at their last sale price, by an independent pricing service, or based on market quotations. Imprecision in estimating fair value can also impact the amount of unrealized appreciation or depreciation recorded for a particular portfolio security and differences in the assumptions used could result in a different determination of fair value, and those differences could be material.
The Fund utilizes various methods to measure the fair value of its investments on a recurring basis. GAAP establishes a hierarchy that prioritizes inputs to valuation methods. The three levels of input are:
Level 1 – Unadjusted quoted prices in active markets for identical assets and liabilities that the Fund has the ability to access.
Level 2 – Observable inputs other than quoted prices included in Level 1 that are observable for the asset or liability, either directly or indirectly. These inputs may include quoted prices for the identical instrument on an inactive market, prices for similar instruments, interest rates, prepayment speeds, credit risk, yield curves, default rates and similar data.
Level 3 – Unobservable inputs for the asset or liability, to the extent relevant observable inputs are not available, representing the Fund’s own assumptions about the assumptions a market participant would use in valuing the asset or liability, and would be based on the best information available.
The availability of observable inputs can vary from security to security and is affected by a wide variety of factors, including, for example, the type of security, whether the security is new and not yet established in the marketplace, the liquidity of markets, and other characteristics particular to the security. To the extent that valuation is based on models or inputs that are less observable or unobservable in the market, the determination of fair value requires more judgment. Accordingly, the degree of judgment exercised in determining fair value is greatest for instruments categorized in Level 3.
The inputs used to measure fair value may fall into different levels of the fair value hierarchy. In such cases, for disclosure purposes, the level in the fair value hierarchy within which the fair value measurement falls in its entirety, is determined based on the lowest level input that is significant to the fair value measurement in its entirety.
| PREDEX |
| NOTES TO FINANCIAL STATEMENTS (Unaudited) (Continued) |
| October 31, 2021 |
The inputs or methodology used for valuing securities are not necessarily an indication of the risk associated with investing in those securities. The following tables summarize the inputs used as of October 31, 2021 for the Fund’s assets and liabilities measured at fair value:
| Investments* | | Level 1 | | | Level 2 | | | Level 3 | | | Total Value | |
| Real Estate Investment Funds | | $ | 1,918,832 | | | $ | — | | | $ | 141,698,999 | | | $ | 143,617,831 | |
| Short-Term Investments | | | 4,680,061 | | | | — | | | | — | | | | 4,680,061 | |
| Subtotal | | $ | 6,598,893 | | | $ | — | | | $ | 141,698,999 | | | | 148,297,892 | |
| Private Fund** | | | | | | | | | | | | | | | 2,963,253 | |
| Total Investments | | | | | | | | | | | | | | $ | 151,261,145 | |
| * | Refer to the Portfolio of Investments for a more detailed account of the Fund’s holdings. |
| ** | BGO Daily Value Fund, LP (“DVF”) is a private fund investment that is fair valued daily using the NAV per share (or its equivalent) practical expedient. Accordingly, the investment has not been categorized in the fair value hierarchy. DVF was designed to allow limited partners to invest in BGO Diversified US Property Fund LP (“DUSPF”) through a vehicle that provides daily valuation and enhanced liquidity. The DVF portfolio invests approximately 90% of its assets in DUSPF. |
Security Transactions and Investment Income – Investment security transactions are accounted for on a trade date basis. Cost is determined and gains and losses are based upon the specific identification method for both financial statement and federal income tax purposes. Dividend income is recorded on the ex-dividend date and interest income is recorded on the accrual basis. Purchase discounts and premiums on securities are accreted and amortized over the life of the respective securities.
Federal Income Taxes – The Fund intends to continue to qualify as a “regulated investment company” under Subchapter M of the Internal Revenue Code of 1986, as amended, and, if so qualified, will not be liable for federal income taxes to the extent earnings are distributed to shareholders on a timely basis. Accordingly, no provision for Federal income taxes is required in the financial statements.
As of October 31, 2021, the Fund had no uncertain tax positions that would require financial statement recognition, de-recognition or disclosure. Management has analyzed the Fund’s tax positions and has concluded that no liability for unrecognized tax benefits should be recorded related to uncertain tax positions for open tax years ended April 30, 2019 through April 30, 2021 or expected to be taken in the Fund’s April 30, 2022 year-end tax return. The Fund’s federal tax returns are subject to examination by the Internal Revenue Service for a period of three years after filing.
Distributions to Shareholders – Distributions from investment income, if any, are declared and paid quarterly. Distributions from net realized capital gains, if any, are declared and paid annually and are recorded on the ex-dividend date. The character of income and gains to be distributed is determined in accordance with income tax regulations, which may differ from GAAP.
Indemnification – The Fund indemnifies its officers and trustees for certain liabilities that may arise from the performance of their duties to the Fund. Additionally, in the normal course of business, the Fund enters into contracts that contain a variety of representations and warranties which provide general indemnities. The Fund’s maximum exposure under these arrangements is unknown, as this would involve future claims that may be made against the Fund that have not yet occurred. However, the Fund expects the risk of loss due to these warranties and indemnities to be remote.
| PREDEX |
| NOTES TO FINANCIAL STATEMENTS (Unaudited) (Continued) |
| October 31, 2021 |
| (3) | INVESTMENT ADVISORY AGREEMENT AND TRANSACTIONS WITH RELATED PARTIES |
Advisory Fees – Pursuant to an investment advisory agreement with the Trust, with respect to the Fund (the “Advisory Agreement”), investment advisory services are provided to the Fund by the Advisor. Under the terms of the Advisory Agreement, the Advisor receives monthly fees calculated at an annual rate of 0.55% of the average daily net assets of the Fund. For the six months ended October 31, 2021, the Advisor earned advisory fees of $457,909.
The Advisor, pursuant to an Expense Limitation Agreement (the “Agreement”) has contractually agreed to reduce its fees and/or absorb expenses of the Fund at least until August 31, 2022 so that Net Annual Operating Expenses (including organizational and offering expenses, but excluding taxes, interest, brokerage commissions, acquired fund fees and expenses and extraordinary expenses) will not exceed 1.10%, 1.35% and 1.35% per annum of the average daily net assets of Class I, Class T and Class W, respectively.
The Agreement allows the Advisor to recover amounts previously reimbursed for operating expenses to the Fund to the extent that the Fund’s expense ratio falls below the above indicated expense limitation. The amount that can be recovered will be limited to the difference between the actual expense ratio and the amount of the expense limitation. Under the Agreement, the Advisor can only recover such amounts for a period of up to three fiscal years subsequent to the fiscal year fees were waived or reimbursed by the Advisor. As of October 31, 2021, no amount is recoverable by the Advisor under the Agreement.
Northern Lights Distributors, LLC (the “Distributor”) is serving as the Fund’s principal underwriter and acts as the distributor of the Fund’s shares on a best efforts basis, subject to various conditions. The Fund’s Board of Trustees (the “Board”) has adopted, on behalf of the Fund, a Shareholder Services Plan (the “Plan”), under which the Fund may compensate financial industry professionals for providing ongoing services in respect of clients with whom they have distributed shares of the Fund. Under the Plan, the Fund may pay 0.25% per year of its average daily net assets attributed to Class I, Class T and Class W shares, respectively, for such services. For the six months ended October 31, 2021, the Fund incurred shareholder servicing fees of $98,302 for Class I. The Class T and Class W shares pay to the Distributor a distribution fee, payable under distribution plans adopted by the Board (“Distribution Plans”), for certain activities relating to the distribution of shares to investors and maintenance of shareholder accounts. These activities include marketing and other activities to support the distribution of the Class T and Class W shares. Under the Distribution Plans, the Fund pays 0.25% per year of its average daily net assets for such services for Class T and Class W shares, respectively. For the six months ended October 31, 2021, the Fund incurred distribution fees of $130 and $173 for Class T and Class W shares, respectively.
In addition, certain affiliates of the Distributor provide services to the Fund as follows:
Ultimus Fund Solutions, LLC (“UFS”) – UFS, an affiliate of the Distributor, provides administration, fund accounting, and transfer agent services to the Trust. Pursuant to a separate servicing agreement with UFS, the Fund pays UFS customary fees for providing administration, fund accounting and transfer agency services to the Fund. Certain officers of the Fund are also officers of UFS, and are not paid any fees directly by the Fund for servicing in such capacities.
Northern Lights Compliance Services, LLC (“NLCS”) - NLCS, an affiliate of UFS and the Distributor, provides a Chief Compliance Officer to the Fund, as well as related compliance services, pursuant to a consulting agreement between NLCS and the Fund. Under the terms of such agreement, NLCS receives customary fees from the Fund.
| PREDEX |
| NOTES TO FINANCIAL STATEMENTS (Unaudited) (Continued) |
| October 31, 2021 |
Blu Giant, LLC (“Blu Giant”) – Blu Giant, an affiliate of UFS and the Distributor, provides EDGAR conversion and filing services as well as print management services for the Fund on an ad-hoc basis. For the provision of these services, Blu Giant receives customary fees from the Fund.
Trustees – The Fund pays each Trustee who is not affiliated with the Fund or Advisor an annual fee of $25,000, as well as reimbursement for any reasonable expenses incurred attending the meetings. The Trustee who serves as Chairperson of the Board receives an additional annual fee of $2,000. The Trustee who serves as Chairperson of the Audit Committee receives an additional annual fee of $5,000. None of the executive officers receive compensation from the Fund.
| (4) | INVESTMENT TRANSACTIONS |
The cost of purchases and proceeds from the sale of securities, other than short-term securities, for the six months ended October 31, 2021 amounted to $1,709,827 and $32,467,750 respectively.
| (5) | AGGREGATE UNREALIZED APPRECIATION AND DEPRECIATION – TAX BASIS |
The identified cost of investments for federal income tax purposes, and its respective unrealized appreciation and depreciation at October 31, 2021, were as follows:
| | | | Gross Unrealized | | | Gross Unrealized | | | Net Unrealized | |
| Tax Cost | | | Appreciation | | | (Depreciation) | | | Appreciation | |
| $ | 125,410,661 | | | $ | 26,215,750 | | | $ | (365,266 | ) | | $ | 25,850,484 | |
| (6) | DISTRIBUTIONS TO SHAREHOLDERS AND TAX COMPONENTS OF CAPITAL |
The tax character of distributions and composition of distributable earnings/(accumulated losses) are finalized at fiscal year-end. The tax character of distributions paid for the year ending April 30, 2021 and April 30, 2020 are as follows:
| | | Fiscal Year Ended | | | Fiscal Year Ended | |
| | | April 30, 2021 | | | April 30, 2020 | |
| Ordinary Income | | $ | 7,013 | | | $ | 714,862 | |
| Long-Term Capital Gain | | | 3,559,500 | | | | 711,904 | |
| Return of Capital | | | 4,865,805 | | | | 7,530,846 | |
| | | $ | 8,432,318 | | | $ | 8,957,612 | |
As of April 30, 2021, the components of accumulated earnings/(deficit) on a tax basis were as follows:
| Undistributed | | | Post October | | | | | | | | | Total | |
| Long-Term | | | Loss and Late | | | Other Book/Tax | | | Net Unrealized | | | Accumulated | |
| Gains | | | Year Loss | | | Differences | | | Appreciation | | | Earnings | |
| $ | 1,259,783 | | | $ | (764,498 | ) | | $ | (59,687 | ) | | $ | 14,261,021 | | | $ | 14,696,619 | |
The difference between book basis and tax basis accumulated net investment income/loss and unrealized appreciation from investments is primarily attributable to tax adjustments for partnerships and amortization of certain organization costs for tax purposes.
| PREDEX |
| NOTES TO FINANCIAL STATEMENTS (Unaudited) (Continued) |
| October 31, 2021 |
Late year losses incurred after December 31 within the fiscal year are deemed to arise on the first business day of the following fiscal year for tax purposes. The Fund incurred and elected to defer such late year losses of $764,498.
For the year ended April 30, 2021, the following reclassifications, which had no impact on results of operations or net assets, were recorded to reflect tax character.
| Paid-in Capital | | | Accumulated Earnings | |
| $ | (679,037 | ) | | $ | 679,037 | |
Pursuant to Rule 23c-3 under the Investment Company Act of 1940, as amended, the Fund offers shareholders on a quarterly basis the option of redeeming shares, at net asset value, of no less than 5% and no more than 25% of the shares outstanding. There is no guarantee that shareholders will be able to sell all of the shares they desire in a quarterly repurchase offer, although each shareholder will have the right to require the Fund to purchase up to and including 5% of such shareholder’s shares in each quarterly repurchase. Liquidity will be provided to shareholders only through the Fund’s quarterly repurchases.
During the six months ended October 31, 2021, the Fund completed two repurchase offers. In each offer, the Fund offered to repurchase at least 5% (and an additional 2% at the Fund’s discretion) of the number of its outstanding shares as of the Repurchase Pricing Date. The result of the repurchase offers were as follows:
| | | Repurchase | | Repurchase |
| | | Offer # 1 | | Offer # 2 |
| Commencement Date | | 6/29/2021 | | 9/29/2021 |
| Repurchase Request Deadline | | 7/23/2021 | | 10/22/2021 |
| Repurchase Pricing Deadline | | 7/23/2021 | | 10/22/2021 |
| | | | | |
| Net Asset Value as of Repurchase Pricing Date: |
| Class I | | $26.33 | | $27.75 |
| Class T | | $26.47 | | $27.91 |
| Class W | | $26.47 | | $27.90 |
| | | | | |
| Amount Repurchased: | | | | |
| Class I | | $23,071,172 | | $20,049,606 |
| Class T | | — | | — |
| Class W | | — | | — |
| (8) | COMMITMENTS AND CONTINGENCIES |
As of October 31, 2021, the Fund did not have any unfunded commitment amounts which had not yet been called for investment. While redemptions can be requested at the frequency listed in the following table, there is no guarantee the Fund will be paid all or any of a redemption amount at the time requested. Each of the below investment funds can suspend redemptions if its respective Board deems it in the best interest of its shareholders.
| PREDEX |
| NOTES TO FINANCIAL STATEMENTS (Unaudited) (Continued) |
| October 31, 2021 |
| Initial | | | | |
| Acquisition | | | | Redemption |
| Date | | | | Frequency |
| 7/01/2016 | | AEW Core Property Trust (U.S.), Inc. | | Quarterly |
| 8/01/2016 | | American Core Realty Fund, LP | | Quarterly |
| 7/01/2016 | | Barings Core Property Fund LP | | Quarterly |
| 10/01/2018 | | BGO Daily Value Fund, LP | | Daily |
| 4/01/2017 | | BGO Diversified US Property Fund LP | | Quarterly |
| 9/26/2017 | | Black Creek Diversified Property Fund | | Monthly |
| 4/01/2017 | | BlackRock US Core Property Fund, LP | | Quarterly |
| 7/01/2017 | | CBRE U.S. Core Partners, LP | | Quarterly |
| 7/01/2020 | | Clarion Lion Industrial Trust | | Quarterly |
| 4/01/2017 | | Clarion Lion Properties Fund, LP | | Quarterly |
| 4/01/2017 | | GWL U.S. Property Fund LP | | Quarterly |
| 4/01/2017 | | Invesco Core Real Estate-U.S.A., LP | | Quarterly |
| 4/01/2019 | | Invesco U.S. Income Fund, LP | | Quarterly |
| 8/02/2016 | | Jones Lang LaSalle Income Property Trust, Inc. | | Daily |
| 7/01/2019 | | Morgan Stanley Prime Property Fund, LLC | | Quarterly |
| 7/01/2019 | | Principal Enhanced Property Fund, LP | | Quarterly |
| 4/01/2017 | | PRISA LP | | Quarterly |
| 4/01/2017 | | Prologis Targeted U.S. Logistics Holdings, LP | | Quarterly |
| 7/01/2017 | | RREEF America REIT II, Inc. | | Quarterly |
| 10/01/2018 | | RREEF Core Plus Industrial Fund LP | | Quarterly |
| 4/11/2017 | | Sentinel Real Estate Fund, LP | | Daily |
| 4/01/2017 | | Stockbridge Smart Markets Fund, LP | | Quarterly |
| 4/01/2017 | | UBS Trumbull Property Fund LP | | Quarterly |
| 4/01/2017 | | USAA US Government Building Fund | | Quarterly |
| (9) | REVOLVING CREDIT FACILITIES |
Effective December 10, 2019, the Fund entered a secured $25 million line of credit through Credit Suisse for the purpose of liquidity subject to the limitations of the 1940 Act for borrowings. Borrowings under the arrangement bear interest at the 3-month LIBOR plus 2.35% at the time of borrowing and an unused commitment fee rate equal to 0.775%. As collateral for borrowings under the line of credit, the Fund grants Credit Suisse a first position security interest in and lien on the securities held by the Fund in a collateral account. As of October 31, 2021, all the Fund’s Private Investment Funds with a total fair value of $142,125,980 were pledged as collateral. The revolving credit facility has a maturity of September 30, 2022.
During the six months ended October 31, 2021, the Fund incurred $147,701 of interest expense related to the borrowings and $69,209 of unused commitment fees, which is included in the interest expense in the Statement of Operations. Average borrowings and the average interest rate for the days the line of credit was outstanding during the six months ended October 31, 2021 were $11,681,881 and 2.49%, respectively. As of October 31, 2021, the Fund had $9,508,348 in outstanding borrowings with an effective interest rate
| PREDEX |
| NOTES TO FINANCIAL STATEMENTS (Unaudited) (Continued) |
| October 31, 2021 |
of 2.48%. The largest amount outstanding during the six months then ended October 31, 2021 was $14,373,867.
The beneficial ownership, either directly or indirectly, of more than 25% of the voting securities of a fund creates presumption of control of the fund, under Section 2(a)(9) of the 1940 Act. As of October 31, 2021, National Financial Services LLC accounts holding shares for the benefit of others in nominee name, held approximately 52% of the voting securities of the Fund. The Fund has no evidence that any beneficial owner included in these nominee accounts holds more than 25% of the voting shares.
Subsequent events after the date of the Statement of Assets and Liabilities have been evaluated through the date the financial statements were issued.
Management has determined that no events or transactions occurred requiring adjustment or disclosure in the financial statements.
Consideration and Renewal of the Management Agreement between PREDEX Capital Management, LLC and PREDEX
In connection with a meeting held on June 22, 2021, the Board of Trustees (the “Board” or the “Trustees”) of PREDEX (the “Fund”), discussed the renewal of the management agreement (the “Agreement”) between the Fund and PREDEX Capital Management, LLC (the “Adviser” or “PCM”).
Counsel assisted the Board in reviewing the Adviser’s responses to a series of questions regarding, among other things, the investment performance of the Fund, the Adviser’s services to PREDEX, comparative fee and expense information, and the Adviser’s profitability from its relationship with the Fund (the “15c Response”.) The Trustees relied upon the advice of counsel and their own business judgment in evaluating the Agreement and the weight to be given to each of the factors. The conclusions reached by the Board were based upon a comprehensive evaluation and discussion of all the information provided, both in written and verbal form, and were not the result of any one factor. Moreover, each Trustee may have afforded different weight to the various factors in reaching his/her conclusions with respect to the Agreement.
Nature, Extent and Quality of Services. The Board then reviewed materials provided by the Adviser related to the approval of the renewal of the Agreement, including the Adviser’s Form ADV and related schedules, a description of the manner in which investment decisions will be made and executed, a review of the personnel performing services for the Fund, including the team of individuals that will primarily monitor and execute the investment process. The Trustees considered services provided by the Adviser beyond portfolio management, including managing cash positions, marketing, and sales support. The Board discussed the extent of the Adviser’s research capabilities, the quality of the Adviser’s compliance infrastructure and the experience of its management personnel. The Board also discussed details of the Adviser’s compliance program with the CCO of the Trust. The Trust’s CCO noted no issue with the Adviser’s compliance program, and that the Adviser has been instrumental in the operation of the Fund’s compliance program. Additionally, the Board received satisfactory responses from the representative of the Adviser with respect to a series of important questions, including whether the Adviser was involved in any lawsuits or pending regulatory actions, and whether the Adviser’s CCO would routinely review the portfolio managers’ performance of their duties to ensure compliance under PREDEX’s compliance program. The Board then reviewed the capitalization of the Adviser based on financial information provided, and representations made, by the Adviser and its representative, and concluded that the Adviser was sufficiently well-capitalized, and it has the ability to make additional capital contribution calls in order to meet its obligations to the Fund. The Board concluded that the Adviser had sufficient quality and depth of personnel, resources, investment methods and compliance policies and procedures essential to performing its duties under the Agreement and that the nature, overall quality, and extent of the management services to be provided by the Adviser to the Fund were satisfactory.
Performance. The Trustees reviewed the performance of the Fund for the 1-year, 3-year, and since-inception periods ended April 30, 2021 as compared to the Bloomberg Barclays Aggregate Bond Index, the S&P 500 Index, MSCI U.S. REIT Index and certain funds in the Real Estate Interval Fund peer group. The Trustees considered performance as measured by the Fund’s Class I shares, which returned 2.40%, 3.63% and 3.78% for the one-year, three-year and since inception periods, respectively, outperforming the Bloomberg Barclays Aggregate Bond Index for the one-year and since inception periods, and underperforming the S&P 500 Index, the MSCI U.S. REIT Index and most Real Estate Interval Fund peer group funds for each period. The Trustees noted that performance data for the Morningstar Real Estate Mutual Funds category are no longer available to the Adviser without a burdensome subscription and have not been provided. Next, the Trustees compared the
Fund’s returns for the 1-year, 3-year, and since-inception periods ended March 31, 2021 of 1.84%, 3.78%, and 3.73%, respectively, to the NFI-ODCE Index. The Trustees noted that the Fund outperformed for the 1-year period, while lagging slightly for the 3-year period. They further observed that, generally, since inception returns are less meaningful as the Fund was in a start-up phase and not fully invested during the first twelve months of operations. The Trustees acknowledged that the Fund is the only client of the Adviser, that the Adviser has no other managed funds to compare to the Fund, and that the Fund does not easily lend itself to one performance benchmark or peer group due to its novel nature and strategy. The Trustees concluded that they were satisfied with the Fund’s current performance and they continue to have a reasonable expectation that the Adviser would deliver acceptable performance to shareholders.
Fees and Expenses. With respect to the cost of services provided by the Adviser, the Board considered the Fund’s fees against the fees of the Morningstar Real Estate Mutual Funds peer group, the Exchange-Traded Real Estate Closed End Fund peer group, and the Real Estate Interval Fund peer group. The Board reviewed peer group information provided by the Adviser, and the Board noted that the Fund’s 0.55% management fee was below the peer group averages. The Trustees further noted share class expenses were below the Exchange-Traded Real Estate Closed End Fund and the Real Estate Interval Fund peer group averages, while slightly or somewhat above Morningstar Real Estate Mutual Fund group averages, but within their range. The Trustees noted that the advisory fee payable to the Adviser and share class expenses were not unreasonable.
Profitability. The Board considered the 26% gross margin profitability reported by PCM and acknowledged the increase in revenue included the re-capture of advisory fees previously waived by the Adviser. The Board also noted that profits would have been only slightly higher if marketing expenses were removed from the Adviser’s calculations. The Board concluded that based on the services provided and the current size and projected growth of the Fund, the level of profit from the Adviser’s relationship with the Fund was not excessive.
Economies of Scale. With respect to economies of scale, the Board considered the fact that the Adviser has in place an expense limitation agreement that would limit expenses borne by shareholders through August 31, 2021, which would be renewed for another 12 months in a substantially similar form. The Board also considered that the Agreement did not contain breakpoints that would reduce the fee rate as assets grow, but further noted that the Adviser was willing to revisit the issue. At the current asset levels, and with uncertainty in the market, the Board determined that the Adviser would not realize economies of scale and that the absence of breakpoints at this time was acceptable.
Conclusion. Having requested and received such information from the Adviser that the Board believed to be reasonably necessary to evaluate the terms of the Agreement, and as assisted by the advice of independent counsel, the Board, including a majority of the Independent Trustees, determined that approval of the Agreement was in the best interests of the Trust and its shareholders. In considering the Agreement, the Trustees did not identify any one factor as all important, but rather considered these factors collectively in light of the Trust’s surrounding circumstances.
| PRIVACY NOTICE |
| |
| FACTS | WHAT DOES PREDEX DO WITH YOUR PERSONAL INFORMATION? |
| | |
| Why? | Financial companies choose how they share your personal information. Federal law gives consumers the right to limit some but not all sharing. Federal law also requires us to tell you how we collect, share, and protect your personal information. Please read this notice carefully to understand what we do. |
| | |
| What? | The types of personal information we collect and share depend on the product or service you have with us. This information can include: |
| | ■ Social Security number ■ Assets ■ Retirement Assets ■ Transaction History ■ Checking Account Information | ■ Purchase History ■ Account Balances ■ Account Transactions ■ Wire Transfer Instructions |
| | | |
| | When you are no longer our customer, we continue to share your information as described in this notice. |
| | |
| How? | All financial companies need to share customers’ personal information to run their everyday business. In the section below, we list the reasons financial companies can share their customers’ personal information; the reasons PREDEX chooses to share; and whether you can limit this sharing. |
| | | |
| Reasons we can share your personal information | Does PREDEX
share? | Can you limit this
sharing? |
For our everyday business purposes –
such as to process your transactions, maintain your account(s), respond to court orders and legal investigations, or report to credit bureaus | Yes | No |
For our marketing purposes –
to offer our products and services to you | No | We don’t share |
| For joint marketing with other financial companies | No | We don’t share |
For our affiliates’ everyday business purposes –
information about your transactions and experiences | No | We don’t share |
For our affiliates’ everyday business purposes –
information about your creditworthiness | No | We don’t share |
| For nonaffiliates to market to you | No | We don’t share |
| Questions? | Call 1-877-940-7202 |
| Who we are |
| Who is providing this notice? | PREDEX |
| What we do |
| How does PREDEX protect my personal information? | To protect your personal information from unauthorized access and use, we use security measures that comply with federal law. These measures include computer safeguards and secured files and buildings. Our service providers are held accountable for adhering to strict policies and procedures to prevent any misuse of your nonpublic personal information. |
| How does PREDEX collect my personal information? | We collect your personal information, for example, when you ■ Open an account ■ Provide account information ■ Give us your contact information ■ Make deposits or withdrawals from your account ■ Make a wire transfer ■ Tell us where to send the money ■ Tells us who receives the money ■ Show your government-issued ID ■ Show your driver’s license We also collect your personal information from other companies. |
| Why can’t I limit all sharing? | Federal law gives you the right to limit only ■ Sharing for affiliates’ everyday business purposes – information about your creditworthiness ■ Affiliates from using your information to market to you ■ Sharing for nonaffiliates to market to you State laws and individual companies may give you additional rights to limit sharing. |
| Definitions |
| Affiliates | Companies related by common ownership or control. They can be financial and nonfinancial companies. ■ PREDEX does not share with our affiliates. |
| Nonaffiliates | Companies not related by common ownership or control. They can be financial and nonfinancial companies ■ PREDEX does not share with nonaffiliates so they can market to you. |
| Joint marketing | A formal agreement between nonaffiliated financial companies that together market financial products or services to you. ■ PREDEX doesn’t jointly market. |
| Investment Advisor |
| PREDEX Capital Management, LLC |
| 222 N Pacific Coast Hwy, Suite 2000 |
| El Segundo, CA 90245 |
| |
| |
| Distributor |
| Northern Lights Distributors, LLC |
| 4221 North 203rd Street, Suite 100 |
| Elkhorn, NE 68022-3474 |
| |
| Legal Counsel |
| Thompson Hine LLP |
| 41 South High Street, Suite 1700 |
| Columbus, OH 43215 |
| |
| |
| Independent Registered Public Accounting Firm |
| RSM US LLP |
| 555 Seventeenth Street, Suite 1200 |
| Denver, CO 80202 |
| |
| |
| |
| |
| |
| |
| |
How to Obtain Proxy Voting Information
Information regarding how the Fund voted proxies relating to portfolio securities for the 12 month period ended June 30th as well as a description of the policies and procedures that the Fund used to determine how to vote proxies is available without charge, upon request, by calling (877) 940-7202 or by referring to the Securities and Exchange Commission’s (“SEC”) website at http://www.sec.gov.
How to Obtain 1st and 3rd Fiscal Quarter Portfolio Holdings
The Fund files its complete schedule of portfolio holdings with the SEC for the first and third quarters of each fiscal year as an exhibit to its reports on Form N-PORT, within sixty days after the end of the period. Form N-PORT reports are available on the SEC’s website at http://www.sec.gov. The information on Form N-PORT is available without charge, upon request, by calling (877) 940-7202.
(b) Not applicable.
Item 2. Code of Ethics. Not applicable.
Item 3. Audit Committee Financial Expert. Not applicable.
Item 4. Principal Accountant Fees and Services. Not applicable.
Item 5. Audit Committee of Listed Companies. Not applicable.
Item 6. Schedule of Investments. Schedule of investments in securities of unaffiliated issuers is included under Item 1.
Item 7. Disclosure of Proxy Voting Policies and Procedures for Closed-End Funds. Not applicable.
Item 8. Portfolio Managers of Closed-End Management Investment Companies. Not applicable.
Item 9. Purchases of Equity Securities by Closed-End Funds. Not applicable.
Item 10. Submission of Matters to a Vote of Security Holders. None
Item 11. Controls and Procedures.
(a) Based on an evaluation of the Registrant’s disclosure controls and procedures as of a date within 90 days of filing date of this Form N-CSR, the principal executive officer and principal financial officer of the Registrant have concluded that the disclosure controls and procedures of the Registrant are reasonably designed to ensure that the information required in filings on Form N-CSR is recorded, processed, summarized, and reported by the filing date, including that information required to be disclosed is accumulated and communicated to the Registrant’s management, including the Registrant’s principal executive officer and principal financial officer, as appropriate to allow timely decisions regarding required disclosure.
(b) There were no significant changes in the Registrant’s internal control over financial reporting that occurred during the Registrant’s last fiscal half-year that have materially affected, or are reasonably likely to materially affect, the Registrant’s internal control over financial reporting.
Item 12. Disclosure of Securities Lending Activities for Closed-End Management Investment Companies. Not applicable.
Item 13. Exhibits.
(a)(1) Code of Ethics filed herewith.
(a)(2) Certifications required by Section 302 of the Sarbanes-Oxley Act of 2002 (and Item 11(a)(2) of Form N-CSR) are filed herewith.
(a)(3) Not applicable.
(b) Certifications required by Section 906 of the Sarbanes-Oxley Act of 2002 (and Item 11(b) of Form N-CSR) are filed herewith.
SIGNATURES
Pursuant to the requirements of the Securities Exchange Act of 1934 and the Investment Company Act of 1940, the registrant has duly caused this report to be signed on its behalf by the undersigned, thereunto duly authorized.
(Registrant) PREDEX
By (Signature and Title)
/s/ J. Grayson Sanders
J. Grayson Sanders, Principal Executive Officer/President
Date 1/7/22
Pursuant to the requirements of the Securities Exchange Act of 1934 and the Investment Company Act of 1940, this report has been signed below by the following persons on behalf of the registrant and in the capacities and on the dates indicated.
By (Signature and Title)
/s/ J. Grayson Sanders
J. Grayson Sanders, Principal Executive Officer/President
Date 1/7/22
By (Signature and Title)
/s/ Michael Achterberg
Michael Achterberg, Principal Financial Officer/Treasurer
Date 1/7/22