united states
securities and exchange commission
washington, d.c. 20549
form n-csr
certified shareholder report of registered management
investment companies
Investment Company Act file number 811-22808
PREDEX
(Exact name of registrant as specified in charter)
4221 North 203rd Street, Suite 100, Elkhorn, NE 68022
(Address of principal executive offices) (Zip code)
Michael Achterberg, PREDEX
235 Whitehorse Lane, Suite 200, Kennett Square, PA 19348
(Name and address of agent for service)
Registrant's telephone number, including area code: 949-336-3445
Date of fiscal year end: 3/31
Date of reporting period: 3/31/24
Item 1. Reports to Stockholders.

Annual Report
March 31, 2024

INVESTOR INFORMATION: (877) 940-7202
This report and the financial statements contained herein are submitted for the general information of shareholders and are not authorized for distribution to prospective investors unless preceded or accompanied by an effective prospectus. Nothing herein contained is to be considered an offer of sale or solicitation of an offer to buy shares of PREDEX. Such offering is made only by prospectus, which includes details as to offering price and other material information.
Distributed by Northern Lights Distributors, LLC
Member FINRA

Dear Fellow Shareholders,
We are pleased to provide you with the PREDEX (the “Fund”) annual report for the fiscal year ending March 31, 2024 (the “Reporting Period”). We have continued to utilize a low-cost, diversified approach to investing in the flagship U.S. core property funds managed by the leading institutional real estate sponsors. The Fund is invested in 25 private and non-listed institutional real estate funds totaling $282 billion in more than 4,200 properties.
Diversification to Other Major Asset Classes
Since its inception, the Fund has experienced minimum volatility relative to other major asset classes and generated a higher risk-adjusted return (Sharpe Ratio).
For the period from July 1, 2016 (inception) through March 31, 2024
| | Annualized | Annualized | Sharpe | Maximum |
| | Return | Std Dev | Ratio | Drawdown |
| PREDEX (Class I) | + 3.10% | 1.42% | 0.99 | -21.31% | 3/28/24 |
| MSCI U.S. REIT Index | + 4.10% | 26.64% | 0.25 | -44.03% | 3/23/20 |
| S&P 500 Index | + 14.61% | 22.39% | 0.88 | -33.79% | 3/23/20 |
| Bloomberg U.S. Aggregate Bond Index | + 0.73% | 5.90% | -0.25 | -18.41% | 10/24/22 |
The Fund’s ability to be a potentially ideal portfolio diversifier to these major asset classes is further demonstrated by the non-correlation of its daily returns over the last five years.
Correlation of Daily Returns (5 Years)
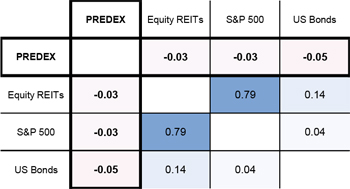
No amount of diversification or correlation can ensure profits or prevent losses.
Letter to Shareholders (Unaudited)
Market Review
Heading into the Reporting Period, the Federal Reserve was still on its quest to bring inflation back down to its 2% target after peaking at almost 9% in 2022. The Fed continued to raise interest rates until July of 2023, which they believed was necessary as the US consumer showed no signs of slowing and unemployment remained at historic lows. A strong U.S. consumer and low unemployment are typically a good economic backdrop for commercial real estate. However, because the Fed increased rates at a historic pace, commercial real estate markets effectively halted resulting in uncertainty and price declines. In fact, the price declines have resulted in the second worst drawdown in the asset class’s history dating back to 1978.
All commercial real estate property types experienced a decline in values over the Reporting Period primarily because cap rates pushed higher to account for higher interest rates. However, operating fundamentals remain healthy across industrial, residential, and retail properties (~79% of the portfolio). We believe these three property types will continue to be the relatively stronger performers in the coming quarters. Office properties’ fundamentals continued to struggle as the return to office has been slower than expected (~10% of the portfolio). Although the office property type continues to face headwinds, it should be noted that not all office is created equal. Some Class A office buildings that offer best in class amenities are winning in this environment, experiencing increased leasing activity and, in some cases, increasing rents. Given that the underlying funds predominantly focus on the much more resilient Class A office, we believe most of the valuation declines have already been taken in the office properties held within the Fund, and the office sector will have a much less meaningful impact on performance going forward.
Manager Discussion of Fund Performance
During the eleven-month period ending March 31, 2024, the Fund’s Class I shares recorded a return of -13.46%. Over this same period, publicly traded equity REITs returned +9.48% (MSCI U.S. REIT Index), the S&P 500 returned +27.89%, and U.S. Bonds returned +1.09% (Bloomberg U.S. Aggregate Bond Index).
It is important to remember that a relatively uncorrelated asset such as private real estate can deliver positive returns when other asset classes are negative, such as during 2022, but can also lag other asset classes as they recover. Yet achieving a given total return with an inverse correlation to the other assets in a portfolio does provide a greater diversification benefit.
We continue to believe that the Fund provides exposure to the highest quality core commercial real estate in the U.S. The Fund continues to deliver on its goals of low correlation to broader markets and has been a ballast in our investors’ portfolios. Furthermore, it should be highlighted, especially in this environment, that the managers within the Fund utilize relatively low leverage (~28%) and the majority of their outstanding debt does not mature until after 2026. We believe that if investors are going to own commercial real estate, this is the type of real estate they should want to own.
Across property types, the underlying funds primarily invest in highly amenitized buildings in major metropolitan areas with high quality tenants and longer-term, staggered leases, less subject to near-term fluctuations. We also believe the Fund is well diversified by fund manager, property type, and geography.
Letter to Shareholders (Unaudited)
| SECTOR | | GEOGRAPHIC |
| DIVERSIFICATION | | DIVERSIFICATION |
| (unaudited) | | (unaudited) |
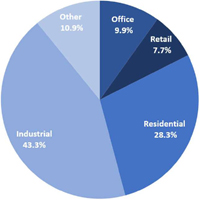 | | 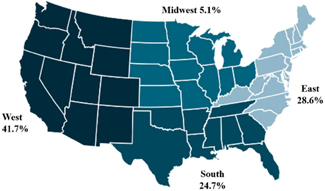 |
The charts represent the underlying fund holdings. Allocation, Sector and Geographic Diversification are subject to change. Diversification does not eliminate the risk of experiencing losses.
Outlook
While the environment has been difficult for commercial real estate because of one of the fastest rate hiking campaigns in the Federal Reserve’s history, it is important to remember that declines are a natural part of investing, and actually necessary to keep markets functioning properly. While private markets are generally less volatile, the Fund experienced negative returns over the Reporting Period, yet the operating fundamentals remain strong. We believe most of the declines are now behind us and this is one of the most attractive entry points for this asset class in history. As previously mentioned, this is now the second worst drawdown in history dating back to 1978. Additionally, while the Fed’s interest rate policy may not have yet slowed the consumer, it has certainly slowed new construction. Deliveries of new commercial real estate are set to fall dramatically in 2025, 2026 and 2027 while demand is likely to remain strong. As a result, core stabilized assets could see a period of strong returns. Private real estate has consistently proven its ability to be a non-correlated asset and a true diversifier and in periods such as these we believe investors should be looking to allocate to the asset class, not away from it.
We thank you for your investment and continued confidence in the Fund.
Sincerely,
 |  |
| Thomas Miller, CFA | Michael Achterberg, CAIA |
| CEO and Chief Investment Officer | Senior Portfolio Manager |
The performance data quoted here represents past performance. Past performance is no guarantee of future results. Current performance may be lower or higher than the performance data quoted above. The investment return and principal value of an investment will fluctuate so that investor’s shares, when redeemed, may be worth more or less than their original cost. For performance information current to the most recent month-end, please call 877-940-7202.
Letter to Shareholders (Unaudited)
The Fund’s investment adviser has contractually agreed to limit its fees and absorb expenses of the Fund until at least August 31, 2024 so that the annual operating expenses (excluding interest and extraordinary expenses) will not exceed 1.10%, 1.35% and 1.35% per annum of the average daily net assets of Class I, Class T and Class W, respectively. Per the Fund’s most recent prospectus, the total expense ratio is 1.71%, 2.11% and 2.11% for Class I, Class T and Class W, respectively.
The referenced indices are shown for general market comparisons and are not meant to represent the Fund. You cannot invest directly in an index and unmanaged index returns do not reflect any fees, expenses or sales charges.
Indices
Equity REITs are represented by the MSCI U.S. REIT Index, which is a free-float adjusted, market capitalization-weighted index of publicly listed U.S. Equity REITs not designated as Mortgage REITs or selected Specialized REITs.
The S&P 500 Index is an unmanaged index of the 500 largest stocks (in terms of market value), weighted by market capitalization and considered representative of the broad stock market.
US Bonds are represented by the Bloomberg U.S. Aggregate Bond Index, an index of securities that are taxable and dollar denominated. The index covers the U.S. investment grade fixed rate bond market, with index components for government and corporate securities, mortgage pass-through securities and asset-backed securities. These major sectors are subdivided into more specific indices that are calculated and reported on a regular basis.
Total returns presented assume reinvestment of distributions. Investors are not able to invest directly in the indices referenced in this illustration and unmanaged index returns do not reflect any fees, expenses or sales charges. The referenced indices are shown for general market comparisons.
Definitions
Correlation measures how one investment performs in relation to another, with a coefficient of +1 being a perfect, positive correlation and a coefficient of -1 being a perfect, negative correlation. When two asset classes have a correlation of +1, they will both move up or down by the same amount in the same direction. Conversely, a correlation of -1 indicates that when one asset class moves up or down, the other moves in the opposite direction by the same amount. In general, asset classes with a correlation less than 0.70 or greater than -0.70 are considered to have relatively low correlation. Lower volatility could result in lower returns during certain periods of time.
Maximum drawdown is the maximum decline a security experiences prior to reaching its previous peak.
Sharpe Ratio is a measure of risk-adjusted returns. It is calculated by using standard deviation and excess return (over an annualized risk-free rate) to determine reward per unit of risk. In general, a higher Sharpe Ratio indicates better return for the same risk (or the same return for lower risk).
Standard Deviation is the amount of variance that took place for the designated time period. In general, the higher the standard deviation, the greater the volatility of return.
1433-NLD-05282024
| PREDEX |
| PORTFOLIO REVIEW (Unaudited) |
| March 31, 2024 |
| |
The Fund’s performance compared to its benchmarks for the periods ended March 31, 2024:
| | | | | | | | | | | | | Since |
| | | | | | | | | | | Since | | Inception |
| | | Eleven | | One | | Three | | Five | | Inception | | Class T and |
| | | Months | | Year | | Year | | Year | | Class I (1) | | Class W (2) |
| PREDEX: | | | | | | | | | | | | |
| Class I | | - 13.46% | | - 14.21% | | + 2.12% | | + 2.44% | | + 3.10% | | — |
| Class W | | - 13.61% | | - 14.38% | | + 1.96% | | + 2.35% | | — | | +2.90% |
| Class T – without load | | - 13.61% | | - 14.38% | | + 1.96% | | + 2.35% | | — | | +2.90% |
| Class T – with load (3) | | - 17.27% | | - 18.01% | | + 0.50% | | + 1.46% | | — | | +2.16% |
| Bloomberg U.S. Aggregate Bond Index | | + 1.09% | | + 1.70% | | - 2.46% | | + 0.36% | | + 0.73% | | +1.13% |
| S&P 500 Total Return Index | | + 27.89% | | + 29.88% | | + 11.49% | | +15.05% | | + 14.61% | | +13.41% |
| (1) | Annualized total return since July 1, 2016 when the class commenced operations. |
| (2) | Annualized total return since March 1, 2018 when the class commenced operations. |
| (3) | Adjusted for initial maximum sales charge of 4.25%. |
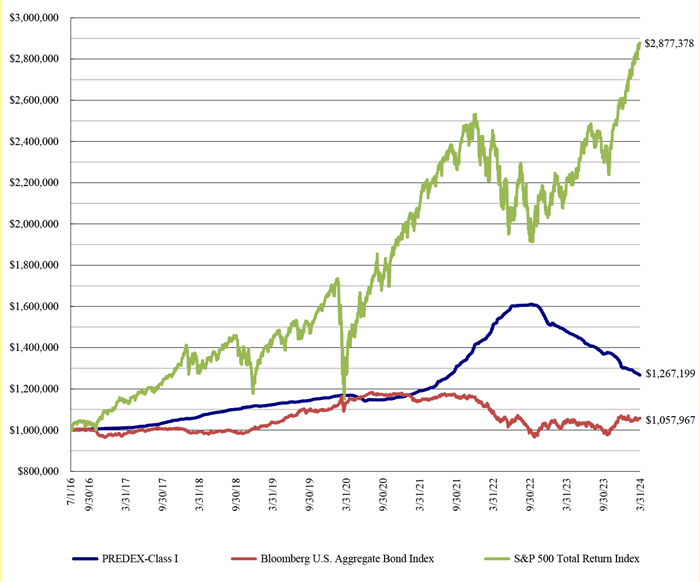
The Bloomberg U.S. Aggregate Bond Index is an unmanaged index which represents the U.S. investment-grade fixed-rate bond market (including government and corporate securities, mortgage pass-through securities, and asset-backed securities). The S&P 500 Total Return Index is an unmanaged market capitalization-weighted index which is comprised of 500 of the largest U.S. domiciled companies and includes the reinvestment of all dividends. Investors cannot invest directly in an index or benchmark.
Past performance is not predictive of future results. The investment return and principal value of an investment will fluctuate. An investor’s shares, when redeemed, may be worth more or less than the original cost. Total return is calculated assuming reinvestment of all dividends and distributions. The above table does not reflect the deduction of taxes that a shareholder may have to pay on Fund distributions or the redemption of the Fund shares. For performance information current to the most recent month end, please visit www.usq.com/strategies/predex-fund or call 877-940-7202.
Class I and Class W shares are offered at net asset value. Class T shares are offered subject to a maximum load of 4.25% of the offering price. The Fund’s investment adviser has contractually agreed to reduce its fees and absorb expenses of the Fund at least through August 31, 2024 so that the annual operating expenses (including offering expenses, but excluding taxes, interest, brokerage commissions, acquired fund fees and expenses, and extraordinary expenses) will not exceed 1.10%, 1.35%, and 1.35% per annum of the average daily net assets of Class I, Class T, and Class W, respectively. Per the Fund’s most recent prospectus, the total expense ratio is 1.71%, 2.11%, and 2.11% for Class I, Class T and Class W, respectively. Please review the accompanying Financial Highlights and the Fund’s Prospectus for more details regarding the Fund’s fees and expenses.
| PREDEX |
| PORTFOLIO REVIEW (Unaudited) (Continued) |
| March 31, 2024 |
| |
Comparison of the Change in Value of a $1,000,000 Investment (since inception through March 31, 2024):
Portfolio Composition as of March 31, 2024 (Unaudited)
| | | Percent of | |
| | | Net Assets | |
| Real Estate Investment Funds | | | 108.7 | % |
| Short-Term Investments | | | 0.7 | % |
| Total Investments | | | 109.4 | % |
| Liabilities in Excess of Other Assets | | | (9.4 | )% |
| Total Net Assets | | | 100.0 | % |
See the Schedule of Investments for a more detailed account of the Fund’s holdings.
| PREDEX |
| SCHEDULE OF INVESTMENTS |
| March 31, 2024 |
| |
| Shares | | | | | Value (Note 2) | |
| | | | | REAL ESTATE INVESTMENT FUNDS (108.7%) | | | | |
| | | | | Private Investment Funds (1)(2) (106.8%) | | | | |
| | 5,624 | | | AEW Core Property (U.S.), LP | | $ | 5,952,675 | |
| | 41 | | | ARA Core Property Fund, LP | | | 4,955,413 | |
| | 37,452 | | | Barings Core Property Fund LP | | | 4,233,630 | |
| | 28,964 | | | BGO Daily Value Fund, LP | | | 359,015 | |
| | 2,220 | | | BGO Diversified US Property Fund LP | | | 5,403,893 | |
| | n/a | | | BlackRock US Core Property Fund, LP | | | 5,578,844 | |
| | 4,559,156 | | | CBRE U.S. Core Partners, LP | | | 7,323,930 | |
| | 4,103 | | | Clarion Lion Properties Fund, LP | | | 6,223,748 | |
| | n/a | | | GWL US Property Fund LP | | | 5,063,110 | |
| | 28 | | | Invesco Core Real Estate - U.S.A., LP | | | 5,128,032 | |
| | 2,172 | | | Invesco U.S. Income Fund, LP | | | 3,296,043 | |
| | 1,930 | | | Lion Industrial Trust | | | 7,067,527 | |
| | 299 | | | Prime Property Fund, LLC | | | 5,901,643 | |
| | 233,871 | | | Principal Enhanced Property Fund, LP | | | 3,009,122 | |
| | 2,391 | | | PRISA LP | | | 4,714,914 | |
| | 1,859 | | | Prologis Targeted U.S. Logistics Fund, LP | | | 5,074,112 | |
| | 42,032 | | | RREEF America II LP | | | 5,374,824 | |
| | 22,371 | | | RREEF Core Plus Industrial Fund LP | | | 4,958,219 | |
| | 59 | | | Sentinel Real Estate Fund, LP | | | 6,315,429 | |
| | 3,500 | | | Smart Markets Fund, LP | | | 6,039,215 | |
| | 4,415 | | | TA Realty Core Property Fund, LP | | | 5,646,323 | |
| | 550 | | | Trumbull Property Fund LP | | | 4,915,368 | |
| | n/a | | | US Government Building Fund | | | 5,850,954 | |
| | | | | Total Private Investment Funds (Cost $110,889,057) | | | 118,385,983 | |
| | | | | | | | | |
| | | | | Public Non-Traded Funds (1.9%) | | | | |
| | 138,007 | | | Ares Real Estate Income Trust Inc. (Class I) | | | 1,062,628 | |
| | 86,066 | | | JLL Income Property Trust, Inc. (Class M-I) | | | 1,034,512 | |
| | | | | Total Public Non-Traded Funds (Cost $1,798,498) | | | 2,097,140 | |
| | | | | TOTAL REAL ESTATE INVESTMENT FUNDS (Cost $112,687,555) | | | 120,483,123 | |
| | | | | | | | | |
| | | | | SHORT-TERM INVESTMENTS (3) (0.7%) | | | | |
| | 598,609 | | | Dreyfus Treasury Obligations Cash Management, Institutional Shares, 5.19% | | | 598,609 | |
| | 225,555 | | | Fidelity Investments Money Market Government Portfolio, Class I, 5.21% (1) | | | 225,555 | |
| | | | | TOTAL SHORT-TERM INVESTMENTS (Cost $824,164) | | | 824,164 | |
| | | | | TOTAL INVESTMENTS (109.4%) (Cost $113,511,719) | | | 121,307,287 | |
| | | | | LIABILITIES IN EXCESS OF OTHER ASSETS (-9.4%) | | | (10,438,244 | ) |
| | | | | NET ASSETS (100.0%) | | $ | 110,869,043 | |
| (1) | Pledged as collateral for borrowings under a line of credit. |
| (2) | Securities have not been registered under the of Securities Act of 1933 and are subject to restrictions on resale. |
| (3) | Money market funds; interest rate reflects seven-day effective yield on March 31, 2024. |
See Notes to Financial Statements.
| PREDEX |
| STATEMENT OF ASSETS AND LIABILITIES |
| March 31, 2024 |
| |
| ASSETS | | | | |
| Investments at value (cost $113,511,719) | | $ | 121,307,287 | |
| Cash | | | 236,348 | |
| Dividends receivable | | | 764,145 | |
| Receivable for fund shares sold | | | 100 | |
| Prepaid expenses and other assets | | | 22,809 | |
| Total Assets | | | 122,330,689 | |
| | | | | |
| LIABILITIES | | | | |
| Line of credit payable | | | 11,266,838 | |
| Accrued advisory fee | | | 78,802 | |
| Distribution fees payable | | | 28 | |
| Accrued expenses and other liabilities | | | 115,978 | |
| Total Liabilities | | | 11,461,646 | |
| Total Commitments and Contingencies (see Note 8) | | | | |
| NET ASSETS | | $ | 110,869,043 | |
| | | | | |
| COMPONENTS OF NET ASSETS | | | | |
| Paid-in capital | | $ | 86,386,050 | |
| Accumulated earnings | | | 24,482,993 | |
| NET ASSETS | | $ | 110,869,043 | |
| | | | | |
| | | | | |
| Class I | | | | |
| Net assets | | $ | 110,717,886 | |
| Shares of beneficial interest outstanding (no par value; unlimited shares authorized) | | | 4,611,647 | |
| Net asset value, offering, and redemption price per share | | $ | 24.01 | |
| | | | | |
| Class T | | | | |
| Net assets | | $ | 56,361 | |
| Shares of beneficial interest outstanding (no par value; unlimited shares authorized) | | | 2,338 | |
| Net asset value and redemption price per share | | $ | 24.11 | |
| Maximum offering price per share (maximum sales charge of 4.25%) | | $ | 25.18 | |
| | | | | |
| Class W | | | | |
| Net assets | | $ | 94,796 | |
| Shares of beneficial interest outstanding (no par value; unlimited shares authorized) | | | 3,932 | |
| Net asset value, offering, and redemption price per share | | $ | 24.11 | |
See Notes to Financial Statements.
| PREDEX |
| STATEMENTS OF OPERATIONS |
| |
| | | For the Period | | | For the Year | |
| | | Ended March | | | Ended April 30, | |
| | | 31, 2024 * | | | 2023 | |
| | | | | | | |
| INVESTMENT INCOME | | | | | | | | |
| Dividend income | | $ | 3,239,299 | | | $ | 3,698,632 | |
| Interest income | | | 114,270 | | | | 197,640 | |
| Total Investment Income | | | 3,353,569 | | | | 3,896,272 | |
| | | | | | | | | |
| EXPENSES | | | | | | | | |
| Investment advisory fees | | | 616,147 | | | | 847,963 | |
| Distribution fees: | | | | | | | | |
| Class T | | | 138 | | | | 317 | |
| Class W | | | 273 | | | | 387 | |
| Interest expense | | | 951,714 | | | | 914,207 | |
| Credit facility fees and expenses | | | 284,901 | | | | — | |
| Shareholder service fees | | | 166,225 | | | | 176,342 | |
| Administration fees | | | 105,288 | | | | 140,817 | |
| Transfer agent fees | | | 82,872 | | | | 86,423 | |
| Legal fees | | | 69,083 | | | | 66,872 | |
| Trustees fees | | | 58,562 | | | | 86,132 | |
| Printing fees | | | 45,000 | | | | 60,566 | |
| Fund accounting fees | | | 42,152 | | | | 49,168 | |
| Audit and tax fees | | | 41,315 | | | | 62,250 | |
| Registration fees | | | 36,532 | | | | 42,451 | |
| Professional fees | | | 35,159 | | | | 38,837 | |
| Custodian fees | | | 21,713 | | | | 19,843 | |
| Insurance fees | | | 12,841 | | | | 14,220 | |
| Miscellaneous expenses | | | 4,356 | | | | 9,464 | |
| Total Expenses | | | 2,574,271 | | | | 2,616,259 | |
| Advisory fees waived by Advisor | | | (105,681 | ) | | | (6,527 | ) |
| Net Expenses | | | 2,468,590 | | | | 2,609,732 | |
| Net Investment Income | | | 884,979 | | | | 1,286,540 | |
| | | | | | | | | |
| REALIZED AND UNREALIZED GAIN (LOSS) ON INVESTMENTS | | | | | | | | |
| Net realized gain on investments | | | 1,982,692 | | | | 1,737,951 | |
| Net change in unrealized appreciation on investments | | | (19,622,814 | ) | | | (9,943,020 | ) |
| Net Realized and Unrealized Loss on Investments | | | (17,640,122 | ) | | | (8,205,069 | ) |
| Net Decrease in Net Assets Resulting from Operations | | $ | (16,755,143 | ) | | $ | (6,918,529 | ) |
| * | For the period May 1, 2023 to March 31, 2024. |
See Notes to Financial Statements.
| PREDEX |
| STATEMENTS OF CHANGES IN NET ASSETS |
| |
| | | For the | | | For the | | | For the | |
| | | Period Ended | | | Year Ended | | | Year Ended | |
| | | March 31, 2024 * | | | April 30, 2023 | | | April 30, 2022 | |
| | | | | | | | | | |
| INCREASE (DECREASE) IN NET ASSETS FROM OPERATIONS | | | | | | | | | | | | |
| Net investment income | | $ | 884,979 | | | $ | 1,286,540 | | | $ | 1,554,167 | |
| Net realized gain on investments | | | 1,982,692 | | | | 1,737,951 | | | | 8,224,092 | |
| Net change in unrealized appreciation on investments | | | (19,622,814 | ) | | | (9,943,020 | ) | | | 30,423,723 | |
| Net Increase (Decrease) in Net Assets Resulting from Operations | | | (16,755,143 | ) | | | (6,918,529 | ) | | | 40,201,982 | |
| | | | | | | | | | | | | |
| DISTRIBUTIONS TO SHAREHOLDERS | | | | | | | | | | | | |
| Class I: | | | | | | | | | | | | |
| From distributable earnings | | | (3,787,762 | ) | | | (3,136,942 | ) | | | (1,243,192 | ) |
| From return of capital | | | (1,407,801 | ) | | | (3,465,318 | ) | | | (5,529,073 | ) |
| Class T: | | | | | | | | | | | | |
| From distributable earnings | | | (1,872 | ) | | | (2,437 | ) | | | (596 | ) |
| From return of capital | | | (695 | ) | | | (2,842 | ) | | | (3,793 | ) |
| Class W: | | | | | | | | | | | | |
| From distributable earnings | | | (3,688 | ) | | | (2,954 | ) | | | (782 | ) |
| From return of capital | | | (1,360 | ) | | | (3,470 | ) | | | (4,942 | ) |
| Total Distributions to Shareholders | | | (5,203,178 | ) | | | (6,613,963 | ) | | | (6,782,378 | ) |
| | | | | | | | | | | | | |
| BENEFICIAL INTEREST TRANSACTIONS | | | | | | | | | | | | |
| Class I: | | | | | | | | | | | | |
| Proceeds from shares issued | | | 7,326,234 | | | | 16,766,266 | | | | 21,118,782 | |
| Distributions reinvested | | | 596,874 | | | | 1,016,165 | | | | 1,047,361 | |
| Payments for shares redeemed | | | (6,593,791 | ) | | | (30,573,037 | ) | | | (64,394,457 | ) |
| Class T: | | | | | | | | | | | | |
| Distributions reinvested | | | 2,567 | | | | 5,279 | | | | 4,389 | |
| Payments for shares redeemed | | | — | | | | (55,785 | ) | | | — | |
| Class W: | | | | | | | | | | | | |
| Distributions reinvested | | | 754 | | | | 1,465 | | | | 1,442 | |
| Payments for shares redeemed | | | (27,955 | ) | | | — | | | | (8,372 | ) |
| Total Beneficial Interest Transactions | | | 1,304,683 | | | | (12,839,647 | ) | | | (42,230,855 | ) |
| Decrease in Net Assets | | | (20,653,638 | ) | | | (26,372,139 | ) | | | (8,811,251 | ) |
| | | | | | | | | | | | | |
| NET ASSETS | | | | | | | | | | | | |
| Beginning of period | | | 131,522,681 | | | | 157,894,820 | | | | 166,706,071 | |
| End of period | | $ | 110,869,043 | | | $ | 131,522,681 | | | $ | 157,894,820 | |
| | | | | | | | | | | | | |
| SHARE ACTIVITY | | | | | | | | | | | | |
| Class I: | | | | | | | | | | | | |
| Shares issued | | | 273,702 | | | | 530,056 | | | | 754,449 | |
| Shares reinvested | | | 22,592 | | | | 32,605 | | | | 38,382 | |
| Shares redeemed | | | (254,333 | ) | | | (981,884 | ) | | | (2,312,762 | ) |
| Net increase (decrease) in shares of beneficial interest outstanding | | | 41,961 | | | | (419,223 | ) | | | (1,519,931 | ) |
| Class T: | | | | | | | | | | | | |
| Shares reinvested | | | 98 | | | | 169 | | | | 157 | |
| Shares redeemed | | | — | | | | (1,924 | ) | | | — | |
| Net increase (decrease) in shares of beneficial interest outstanding | | | 98 | | | | (1,755 | ) | | | 157 | |
| Class W: | | | | | | | | | | | | |
| Shares reinvested | | | 28 | | | | 47 | | | | 52 | |
| Shares redeemed | | | (1,053 | ) | | | — | | | | (282 | ) |
| Net increase (decrease) in shares of beneficial interest outstanding | | | (1,025 | ) | | | 47 | | | | (230 | ) |
| * | For the period May 1, 2023 to March 31, 2024 |
See Notes to Financial Statements.
| PREDEX |
| STATEMENTS OF CASH FLOWS |
| |
| | | For the Period | | | For the Year | |
| | | Ended March | | | Ended April | |
| | | 31, 2024 * | | | 30, 2023 | |
| | | | | | | |
| Cash Flows from Operating Activities | | | | | | | | |
| Net decrease in net assets resulting from operations | | $ | (16,755,143 | ) | | $ | (6,918,529 | ) |
| Adjustments to reconcile net decrease in net assets resulting from operations to net cash provided by (used in) operating activities: | | | | | | | | |
| Purchases of real estate investments | | | (3,137,597 | ) | | | (10,397,377 | ) |
| Proceeds from sales | | | 10,727,816 | | | | 8,060,758 | |
| Long term capital gain distributions received | | | 129,632 | | | | 264,907 | |
| Return of capital distributions received | | | 197,571 | | | | 241,896 | |
| Net sales of short term investments | | | 7,760,207 | | | | (3,254,572 | ) |
| Net realized gain on investments | | | (1,982,692 | ) | | | (1,737,951 | ) |
| Net change in unrealized appreciation on investments | | | 19,622,814 | | | | 9,943,020 | |
| (Increase)/Decrease in assets: | | | | | | | | |
| Dividends and interest receivable | | | (367,374 | ) | | | (52,127 | ) |
| Prepaid expenses and other assets | | | 3,339 | | | | (2,670 | ) |
| Increase/(Decrease) in liabilities: | | | | | | | | |
| Accrued advisory fee | | | 23,962 | | | | (16,506 | ) |
| Distribution fees payable | | | (20 | ) | | | (5 | ) |
| Accrued expenses and other liabilities | | | (17,619 | ) | | | (16,100 | ) |
| Net cash provided by (used in) operating activities | | | 16,204,896 | | | | (3,885,256 | ) |
| | | | | | | | | |
| Cash Flows from Financing Activities | | | | | | | | |
| Proceeds from shares issued (net of change in receivable for fund shares sold) | | | 7,343,169 | | | | 16,751,306 | |
| Payments for shares redeemed | | | (6,621,746 | ) | | | (30,628,822 | ) |
| Proceeds from line of credit (including accrued interest) | | | 19,351,714 | | | | 28,714,207 | |
| Repayment of borrowings | | | (31,799,083 | ) | | | (5,000,000 | ) |
| Distributions paid (net of reinvestments) | | | (4,602,983 | ) | | | (5,591,054 | ) |
| Net cash provided by (used in) financing activities | | | (16,328,929 | ) | | | 4,245,637 | |
| | | | | | | | | |
| Net increase (decrease) in cash | | | (124,033 | ) | | | 360,381 | |
| Cash at beginning of period | | | 360,381 | | | | — | |
| Cash at end of period | | $ | 236,348 | | | $ | 360,381 | |
| | | | | | | | | |
| Supplemental Disclosure of Cash Flow Information | | | | | | | | |
| Non-cash financing activities not included herein consists of reinvestment of distributions | | $ | 600,195 | | | $ | 1,022,909 | |
| Cash paid for interest | | $ | 951,714 | | | $ | 914,207 | |
| * | For the period May 1, 2023 to March 31, 2024 |
See Notes to Financial Statements.
| PREDEX |
| FINANCIAL HIGHLIGHTS |
| |
The table below sets forth financial data for one share of capital stock outstanding throughout each period presented.
| | | Class I | |
| | | For the | | | For the | | | For the | | | For the | | | For the | | | For the | |
| | | Period Ended | | | Year Ended | | | Year Ended | | | Year Ended | | | Year Ended | | | Year Ended | |
| | | March 31, | | | April 30, | | | April 30, | | | April 30, | | | April 30, | | | April 30, | |
| | | 2024* | | | 2023 | | | 2022 | | | 2021 | | | 2020 | | | 2019 | |
| Net Asset Value, Beginning of Period | | $ | 28.74 | | | $ | 31.59 | | | $ | 25.58 | | | $ | 26.07 | | | $ | 26.28 | | | $ | 26.10 | |
| From Operations: | | | | | | | | | | | | | | | | | | | | | | | | |
| Net investment income (a) | | | 0.19 | | | | 0.26 | | | | 0.27 | | | | 0.30 | | | | 0.41 | | | | 0.48 | |
| Net gain (loss) from investments (both realized and unrealized) | | | (3.80 | ) | | | (1.77 | ) | | | 6.93 | | | | 0.29 | | | | 0.49 | | | | 0.80 | |
| Total from operations | | | (3.61 | ) | | | (1.51 | ) | | | 7.20 | | | | 0.59 | | | | 0.90 | | | | 1.28 | |
| | | | | | | | | | | | | | | | | | | | | | | | | |
| Less Distributions: | | | | | | | | | | | | | | | | | | | | | | | | |
| From distributable earnings | | | (0.82 | ) | | | (0.64 | ) | | | (0.22 | ) | | | (0.45 | ) | | | (0.19 | ) | | | (0.02 | ) |
| From return of capital | | | (0.30 | ) | | | (0.70 | ) | | | (0.97 | ) | | | (0.63 | ) | | | (0.92 | ) | | | (1.08 | ) |
| Total distributions | | | (1.12 | ) | | | (1.34 | ) | | | (1.19 | ) | | | (1.08 | ) | | | (1.11 | ) | | | (1.10 | ) |
| Net Asset Value, End of Period | | $ | 24.01 | (b) | | $ | 28.74 | | | $ | 31.59 | | | $ | 25.58 | | | $ | 26.07 | | | $ | 26.28 | |
| | | | | | | | | | | | | | | | | | | | | | | | | |
| Total Return (c) | | | (12.81 | )% (b)(g) | | | (5.05 | )% | | | 28.88 | % | | | 2.40 | % | | | 3.48 | % | | | 5.01 | % |
| | | | | | | | | | | | | | | | | | | | | | | | | |
| Ratios/Supplemental Data: | | | | | | | | | | | | | | | | | | | | | | | | |
| Net assets, end of period (in 000’s) | | $ | 110,718 | | | $ | 131,315 | | | $ | 157,612 | | | $ | 166,475 | | | $ | 213,397 | | | $ | 183,803 | |
| Ratio of expenses to average net assets, including interest expense (d): | | | | | | | | | | | | | | | | | | | | | | | | |
| before reimbursement/recoupment | | | 2.31 | % (f) | | | 1.70 | % | | | 1.32 | % | | | 1.33 | % | | | 1.02 | % | | | n/a | |
| after reimbursement/recoupment | | | 2.21 | % (f) | | | 1.69 | % | | | 1.32 | % | | | 1.43 | % | | | 1.16 | % | | | n/a | |
| Ratio of expenses to average net assets, excluding interest expense (d): | | | | | | | | | | | | | | | | | | | | | | | | |
| before reimbursement/recoupment | | | 1.20 | % (f) | | | 1.11 | % | | | 1.08 | % | | | 1.00 | % | | | 0.97 | % | | | 1.10 | % |
| after reimbursement/recoupment | | | 1.10 | % (f) | | | 1.10 | % | | | 1.08 | % | | | 1.10 | % | | | 1.11 | % | | | 1.16 | % |
| Ratio of net investment income to average net assets (d)(e) | | | 0.79 | % (f) | | | 0.84 | % | | | 0.98 | % | | | 1.18 | % | | | 1.57 | % | | | 1.81 | % |
| Portfolio turnover rate | | | 2 | % (g) | | | 5 | % | | | 3 | % | | | 11 | % | | | 5 | % | | | 0 | % |
| * | For the period May 1, 2023 to March 31, 2024. |
| (a) | Per share amounts calculated using the average shares method, which more appropriately presents the per share data for the period. |
| (b) | Includes adjustments in accordance with accounting principles generally accepted in the United States and, consequently, the net asset value for financial reporting purposes and returns based upon these net asset values may differ from the net asset values and returns for shareholder transactions. |
| (c) | Total returns are historical in nature and assume changes in share price, reinvestment of dividends, and capital gain distributions, if any. Had the advisor not recouped historically waived fees or absorbed a portion of the expenses, total return would have been higher and lower, respectively. |
| (d) | Does not include expenses of investment companies in which the Fund invests. The Fund’s Total Return is reported net of all fees and expenses. |
| (e) | Recognition of net investment income by the Fund is affected by the timing and declaration of dividends by the investment companies in which the Fund invests. |
See Notes to Financial Statements.
| PREDEX |
| FINANCIAL HIGHLIGHTS (Continued) |
| |
The table below sets forth financial data for one share of capital stock outstanding throughout each period presented.
| | | Class T | |
| | | For the | | | For the | | | For the | | | For the | | | For the | | | For the | |
| | | Period Ended | | | Year Ended | | | Year Ended | | | Year Ended | | | Year Ended | | | Year Ended | |
| | | March 31, | | | April 30, | | | April 30, | | | April 30, | | | April 30, | | | April 30, | |
| | | 2024* | | | 2023 | | | 2022 | | | 2021 | | | 2020 | | | 2019 | |
| Net Asset Value, Beginning of Period | | $ | 28.91 | | | $ | 31.78 | | | $ | 25.70 | | | $ | 26.14 | | | $ | 26.29 | | | $ | 26.09 | |
| From Operations: | | | | | | | | | | | | | | | | | | | | | | | | |
| Net investment income (a) | | | 0.14 | | | | 0.22 | | | | 0.24 | | | | 0.29 | | | | 0.41 | | | | 0.58 | |
| Net gain (loss) from investments (both realized and unrealized) | | | (3.81 | ) | | | (1.79 | ) | | | 6.97 | | | | 0.29 | | | | 0.48 | | | | 0.66 | |
| Total from operations | | | (3.67 | ) | | | (1.57 | ) | | | 7.21 | | | | 0.58 | | | | 0.89 | | | | 1.24 | |
| | | | | | | | | | | | | | | | | | | | | | | | | |
| Less Distributions: | | | | | | | | | | | | | | | | | | | | | | | | |
| From distributable earnings | | | (0.83 | ) | | | (0.60 | ) | | | (0.16 | ) | | | (0.39 | ) | | | (0.12 | ) | | | (0.02 | ) |
| From return of capital | | | (0.30 | ) | | | (0.70 | ) | | | (0.97 | ) | | | (0.63 | ) | | | (0.92 | ) | | | (1.02 | ) |
| Total distributions | | | (1.13 | ) | | | (1.30 | ) | | | (1.13 | ) | | | (1.02 | ) | | | (1.04 | ) | | | (1.04 | ) |
| Net Asset Value, End of Period | | $ | 24.11 | (b) | | $ | 28.91 | | | $ | 31.78 | | | $ | 25.70 | | | $ | 26.14 | | | $ | 26.29 | |
| | | | | | | | | | | | | | | | | | | | | | | | | |
| Total Return (c) | | | (12.96 | )% (b)(g) | | | (5.18 | )% | | | 28.72 | % | | | 2.35 | % | | | 3.46 | % | | | 4.84 | % |
| | | | | | | | | | | | | | | | | | | | | | | | | |
| Ratios/Supplemental Data: | | | | | | | | | | | | | | | | | | | | | | | | |
| Net assets, end of period (in 000’s) | | $ | 56 | | | $ | 65 | | | $ | 127 | | | $ | 99 | | | $ | 96 | | | $ | 93 | |
| Ratio of expenses to average net assets, including interest expense (d): | | | | | | | | | | | | | | | | | | | | | | | | |
| before reimbursement | | | 2.41 | % (f) | | | 1.85 | % | | | 1.46 | % | | | 1.48 | % | | | 1.16 | % | | | n/a | |
| after reimbursement | | | 2.41 | % (f) | | | 1.85 | % | | | 1.46 | % | | | 1.48 | % | | | 1.16 | % | | | n/a | |
| Ratio of expenses to average net assets, excluding interest expense (d): | | | | | | | | | | | | | | | | | | | | | | | | |
| before reimbursement | | | 1.30 | % (f) | | | 1.24 | % | | | 1.22 | % | | | 1.15 | % | | | 1.11 | % | | | 1.20 | % |
| after reimbursement | | | 1.30 | % (f) | | | 1.24 | % | | | 1.22 | % | | | 1.15 | % | | | 1.11 | % | | | 1.19 | % |
| Ratio of net investment income to average net assets (d)(e) | | | 0.59 | % (f) | | | 0.69 | % | | | 0.84 | % | | | 1.13 | % | | | 1.57 | % | | | 2.19 | % |
| Portfolio turnover rate | | | 2 | % (g) | | | 5 | % | | | 3 | % | | | 11 | % | | | 5 | % | | | 0 | % |
| * | For the period May 1, 2023 to March 31, 2024. |
| (a) | Per share amounts calculated using the average shares method, which more appropriately presents the per share data for the period. |
| (b) | Includes adjustments in accordance with accounting principles generally accepted in the United States and, consequently, the net asset value for financial reporting purposes and returns based upon these net asset values may differ from the net asset values and returns for shareholder transactions. |
| (c) | Total returns are historical in nature and assume changes in share price, reinvestment of dividends, and capital gain distributions, if any. Had the advisor not absorbed a portion of the expenses, total return would have been lower. |
| (d) | Does not include expenses of investment companies in which the Fund invests. The Fund’s Total Return is reported net of all fees and expenses. |
| (e) | Recognition of net investment income by the Fund is affected by the timing and declaration of dividends by the investment companies in which the Fund invests. |
See Notes to Financial Statements.
| PREDEX |
| FINANCIAL HIGHLIGHTS (Continued) |
| |
The table below sets forth financial data for one share of capital stock outstanding throughout each period presented.
| | | Class W | |
| | | For the | | | For the | | | For the | | | For the | | | For the | | | For the | |
| | | Period Ended | | | Year Ended | | | Year Ended | | | Year Ended | | | Year Ended | | | Year Ended | |
| | | March 31, | | | April 30, | | | April 30, | | | April 30, | | | April 30, | | | April 30, | |
| | | 2024* | | | 2023 | | | 2022 | | | 2021 | | | 2020 | | | 2019 | |
| Net Asset Value, Beginning of Period | | $ | 28.91 | | | $ | 31.78 | | | $ | 25.70 | | | $ | 26.14 | | | $ | 26.29 | | | $ | 26.09 | |
| From Operations: | | | | | | | | | | | | | | | | | | | | | | | | |
| Net investment income (a) | | | 0.15 | | | | 0.22 | | | | 0.24 | | | | 0.29 | | | | 0.39 | | | | 0.47 | |
| Net gain (loss) from investments (both realized and unrealized) | | | (3.82 | ) | | | (1.79 | ) | | | 6.97 | | | | 0.29 | | | | 0.50 | | | | 0.77 | |
| Total from operations | | | (3.67 | ) | | | (1.57 | ) | | | 7.21 | | | | 0.58 | | | | 0.89 | | | | 1.24 | |
| | | | | | | | | | | | | | | | | | | | | | | | | |
| Less Distributions: | | | | | | | | | | | | | | | | | | | | | | | | |
| From distributable earnings | | | (0.83 | ) | | | (0.60 | ) | | | (0.16 | ) | | | (0.39 | ) | | | (0.12 | ) | | | (0.02 | ) |
| From return of capital | | | (0.30 | ) | | | (0.70 | ) | | | (0.97 | ) | | | (0.63 | ) | | | (0.92 | ) | | | (1.02 | ) |
| Total distributions | | | (1.13 | ) | | | (1.30 | ) | | | (1.13 | ) | | | (1.02 | ) | | | (1.04 | ) | | | (1.04 | ) |
| Net Asset Value, End of Period | | $ | 24.11 | (b) | | $ | 28.91 | | | $ | 31.78 | | | $ | 25.70 | | | $ | 26.14 | | | $ | 26.29 | |
| | | | | | | | | | | | | | | | | | | | | | | | | |
| Total Return (c) | | | (12.96 | )% (b)(g) | | | (5.18 | )% | | | 28.72 | % | | | 2.35 | % | | | 3.46 | % | | | 4.84 | % |
| | | | | | | | | | | | | | | | | | | | | | | | | |
| Ratios/Supplemental Data: | | | | | | | | | | | | | | | | | | | | | | | | |
| Net assets, end of period (in 000’s) | | $ | 95 | | | $ | 143 | | | $ | 156 | | | $ | 132 | | | $ | 136 | | | $ | 26 | |
| Ratio of expenses to average net assets, including interest expense (d): | | | | | | | | | | | | | | | | | | | | | | | | |
| before reimbursement | | | 2.43 | % (f) | | | 1.85 | % | | | 1.46 | % | | | 1.49 | % | | | 1.18 | % | | | n/a | |
| after reimbursement | | | 2.43 | % (f) | | | 1.85 | % | | | 1.46 | % | | | 1.49 | % | | | 1.18 | % | | | n/a | |
| Ratio of expenses to average net assets, excluding interest expense (d): | | | | | | | | | | | | | | | | | | | | | | | | |
| before reimbursement | | | 1.30 | % (f) | | | 1.24 | % | | | 1.22 | % | | | 1.15 | % | | | 1.12 | % | | | 1.32 | % |
| after reimbursement | | | 1.30 | % (f) | | | 1.24 | % | | | 1.22 | % | | | 1.15 | % | | | 1.12 | % | | | 1.29 | % |
| Ratio of net investment income to average net assets (d)(e) | | | 0.60 | % (f) | | | 0.69 | % | | | 0.84 | % | | | 1.13 | % | | | 1.49 | % | | | 1.77 | % |
| Portfolio turnover rate | | | 2 | % (g) | | | 5 | % | | | 3 | % | | | 11 | % | | | 5 | % | | | 0 | % |
| * | For the period May 1, 2023 to March 31, 2024. |
| (a) | Per share amounts calculated using the average shares method, which more appropriately presents the per share data for the period. |
| (b) | Includes adjustments in accordance with accounting principles generally accepted in the United States and, consequently, the net asset value for financial reporting purposes and returns based upon these net asset values may differ from the net asset values and returns for shareholder transactions. |
| (c) | Total returns are historical in nature and assume changes in share price, reinvestment of dividends, and capital gain distributions, if any. Had the advisor not absorbed a portion of the expenses, total return would have been lower. |
| (d) | Does not include expenses of investment companies in which the Fund invests. The Fund’s Total Return is reported net of all fees and expenses. |
| (e) | Recognition of net investment income by the Fund is affected by the timing and declaration of dividends by the investment companies in which the Fund invests. |
See Notes to Financial Statements.
| PREDEX |
| NOTES TO FINANCIAL STATEMENTS |
| March 31, 2024 |
PREDEX (the “Fund”) is registered under the Investment Company Act of 1940, as amended (the “1940 Act”), as a closed-end management investment company. The Fund is non-diversified, engages in a continuous offering of shares and operates as an interval fund that offers to make quarterly repurchases of shares at net asset value. The primary investment objective of the Fund is to seek consistent current income while secondarily seeking long-term capital appreciation with moderate volatility. The Fund is a “fund of funds”, in that the Fund will generally invest in other investment funds.
The Fund was organized as a statutory trust on February 5, 2013 under the laws of the State of Delaware. On August 1, 2022, Union Square Capital Partners, LLC commenced service as the Fund’s investment advisor (the “Advisor”). PREDEX Capital Management, LLC (the “Prior Advisor”) previously served as the investment advisor since the Fund’s inception.
The Fund currently offers Class I, Class T, and Class W shares. The Fund commenced operations July 1, 2016 with a single class of shares which was renamed Class I on March 1, 2018. Class T and Class W shares commenced operations on March 1, 2018. Class T shares are offered at net asset value plus a maximum sales charge of 4.25%. Class I and Class W shares are offered at net asset value. Each class represents an interest in the same assets of the Fund and classes are identical except for differences in their sales charge structures and ongoing service and distribution charges. All classes of shares have equal voting privileges except that each class has exclusive voting rights with respect to its service and/or distribution plans. The Fund’s income, expenses (other than class specific distribution fees), and realized and unrealized gains and losses are allocated proportionately each day based upon the relative net assets of each class.
Effective July 25, 2023, the Fund approved changing its fiscal year-end from April 30 to March 31 for operational efficiencies.
| (2) | SIGNIFICANT ACCOUNTING POLICIES |
The following is a summary of significant accounting policies followed by the Fund in preparation of its financial statements. These policies are in conformity with accounting principles generally accepted in the United States of America (“GAAP”). The Fund is an investment company and accordingly follows the investment company accounting and reporting guidance of the Financial Accounting Standards Board (“FASB”) Accounting Standard Codification (“ASC”) Topic 946 “Financial Services Investment Companies” including FASB Accounting Standard Update ASU 2013-08. The preparation of financial statements requires management to make estimates and assumptions that affect the reported amounts of assets and liabilities and disclosure of contingent assets and liabilities at the date of the financial statements and the reported amounts of income and expenses for the period. Actual results could differ from those estimates.
Security Valuation – The Board of Trustees (the “Board”) has adopted procedures pursuant to which the Fund will value its portfolio investments (the “Valuation Procedures”). In accordance with the Valuation Procedures, the Fund’s securities for which market quotations are readily available are valued at market value. Other securities are valued at fair value as determined in good faith pursuant to Rule 2a-5 under the 1940 Act. As permitted by Rule 2a-5 under the 1940 Act, the Board has designated the Adviser as the Fund’s valuation designee to perform fair value determinations relating to all portfolio investments. The Fund uses fair valuation procedures to value a substantial portion of its assets. The Fund uses the fair value of a security to calculate its net asset value (“NAV”) when, for example (1) a portfolio security is not traded in a public market or the principal market in which the security trades is closed; (2) trading in a portfolio security is suspended and not resumed prior to the normal market close; (3) a portfolio security is not traded
| PREDEX |
| NOTES TO FINANCIAL STATEMENTS (Continued) |
| March 31, 2024 |
in significant volume for a substantial period; or (4) the Advisor determines that the quotation or price for a portfolio security provided by a broker-dealer or independent pricing service is inaccurate.
Valuation of Private Investment Funds – The Fund invests a significant portion of its assets in Private Investment Funds (each a “Private Fund,” and collectively, the “Private Funds”). The Private Funds measure their real estate investments at fair value, which is equivalent to investment company reporting, and report a NAV per share on typically a calendar quarter basis. Each day the Fund estimates the fair value of each Private Fund by adjusting the most recent NAV for each Private Fund by the change in a proprietary benchmark, based upon publicly available data that is not internally developed, that the Fund has deemed to be representative of the entire Private Fund market. Further refinement may be made to the fair value of a Private Fund which either provides insight into its daily valuation or demonstrates persistently different performance. If an underlying fund manager reports the NAV per share (or its equivalent) to the Fund on a daily basis, then that unadjusted NAV per share is used to value the investment. Use of a NAV per share is commonly used as an acceptable valuation technique for investments in private investment companies and funds, and is referred to as the “practical expedient” by ASC 820 Fair Value Measurement.
Commencing March 31, 2024, the Fund has elected to more broadly apply the practical expedient to value its investments in all Private Funds at their respective NAV per share (or its equivalent) for financial statement reporting purposes at each quarter-end.
Fair Value Process – The “fair value” of securities may be difficult to determine and thus judgment plays a greater role in the valuation process. The fair valuation methodology may include or consider the following guidelines, as appropriate: (1) evaluation of all relevant factors, including but not limited to, pricing history, current market level, supply and demand of the respective security; (2) comparison to the values and current pricing of securities that have comparable characteristics; (3) knowledge of historical market information with respect to the security; (4) other factors relevant to the security which would include, but not be limited to, duration, yield, fundamental analytical data, and credit quality.
The values assigned to fair valued investments will be based on available information and will not necessarily represent amounts that might ultimately be realized, since such amounts depend on future developments inherent in long-term investments. Changes in the fair valuation of portfolio securities may be less frequent and of greater magnitude than changes in the price of portfolio securities valued at their last sale price, by an independent pricing service, or based on market quotations. Imprecision in estimating fair value can also impact the amount of unrealized appreciation or depreciation recorded for a particular portfolio security and differences in the assumptions used could result in a different determination of fair value, and those differences could be material.
The Fund utilizes various methods to measure the fair value of its investments on a recurring basis. GAAP establishes a hierarchy that prioritizes inputs to valuation methods. The three levels of input are:
Level 1 – Unadjusted quoted prices in active markets for identical assets and liabilities that the Fund has the ability to access.
Level 2 – Observable inputs other than quoted prices included in Level 1 that are observable for the asset or liability, either directly or indirectly. These inputs may include quoted prices for the identical instrument on an inactive market, prices for similar instruments, interest rates, prepayment speeds, credit risk, yield curves, default rates, and similar data.
Level 3 – Unobservable inputs for the asset or liability, to the extent relevant observable inputs are not available, representing the Fund’s own assumptions about the assumptions a market participant would use in valuing the asset or liability, and would be based on the best information available.
| PREDEX |
| NOTES TO FINANCIAL STATEMENTS (Continued) |
| March 31, 2024 |
The availability of observable inputs can vary from security to security and is affected by a wide variety of factors, including, for example, the type of security, whether the security is new and not yet established in the marketplace, the liquidity of markets, and other characteristics particular to the security. To the extent that valuation is based on models or inputs that are less observable or unobservable in the market, the determination of fair value requires more judgment. Accordingly, the degree of judgment exercised in determining fair value is greatest for instruments categorized in Level 3.
The inputs used to measure fair value may fall into different levels of the fair value hierarchy. In such cases, for disclosure purposes, the level in the fair value hierarchy within which the fair value measurement falls in its entirety, is determined based on the lowest level input that is significant to the fair value measurement in its entirety.
The inputs or methodology used for valuing securities are not necessarily an indication of the risk associated with investing in those securities. The following tables summarize the inputs used as of March 31, 2024 for the Fund’s assets and liabilities measured at fair value. Real estate investment funds with a combined total value of $119,448,611 are valued using the NAV per share (or its equivalent) practical expedient and are listed in a separate column.
| | | | | | | | | | | | Investments | | | | |
| | | | | | | | | | | | Valued at Net | | | | |
| Investments* | | Level 1 | | | Level 2 | | | Level 3 | | | Asset Value** | | | Total Value | |
| Real Estate Investment Funds | | $ | 1,034,512 | | | $ | — | | | $ | — | | | $ | 119,448,611 | | | $ | 120,483,123 | |
| Short-Term Investments | | | 824,164 | | | | — | | | | — | | | | — | | | | 824,164 | |
| | | $ | 1,858,676 | | | $ | — | | | $ | — | | | $ | 119,448,611 | | | $ | 121,307,287 | |
| * | Refer to the Schedule of Investments for a more detailed account of the Fund’s holdings. |
| ** | Investments valued using the NAV per share practical expedient. In accordance with Topic 820, these investments are excluded from the fair value hierarchy. |
It is the Fund’s policy to recognize transfers into or out of Level 1, Level 2, or Level 3 at the end of the reporting period.
The following is a reconciliation of assets in which Level 3 inputs were used in determining fair value:
| | | Level 3 | |
| | | Investments | |
| Beginning balance | | $ | 129,340,194 | |
| Cost of purchases | | | 2,883,135 | |
| Change in unrealized appreciation | | | (17,732,352 | ) |
| Proceeds from sales | | | (9,181,919 | ) |
| Realized gain (loss) | | | 1,741,694 | |
| Net transfers out of Level 3 | | | (107,050,752 | ) |
| Ending balance | | $ | — | |
Security Transactions and Investment Income – Investment security transactions are accounted for on a trade date basis. Cost is determined and gains and losses are based upon the specific identification method for both financial statement and federal income tax purposes. Dividend income is recorded on the ex-dividend date and interest income is recorded on the accrual basis. Purchase discounts and premiums on securities are accreted and amortized over the life of the respective securities.
| PREDEX |
| NOTES TO FINANCIAL STATEMENTS (Continued) |
| March 31, 2024 |
Federal Income Taxes – The Fund intends to continue to qualify as a “regulated investment company” under Subchapter M of the Internal Revenue Code of 1986, as amended, and, if so qualified, will not be liable for federal income taxes to the extent earnings are distributed to shareholders on a timely basis. Accordingly, no provision for Federal income taxes is required in the financial statements.
As of the Fund’s most recent tax year ended April 30, 2023, the Fund had no uncertain tax positions that would require financial statement recognition, de-recognition or disclosure. Management has analyzed the Fund’s tax positions and has concluded that no liability for unrecognized tax benefits should be recorded related to uncertain tax positions for open tax years ended 2020 through 2022 or expected to be taken in the Fund’s April 30, 2023 year-end tax return. The Fund’s federal tax returns are subject to examination by the Internal Revenue Service for a period of three years after filing.
Distributions to Shareholders – Distributions from investment income, if any, are declared and paid quarterly. Distributions from net realized capital gains, if any, are declared and paid annually and are recorded on the ex-dividend date. The character of income and gains to be distributed is determined in accordance with income tax regulations, which may differ from GAAP.
Indemnification – The Fund indemnifies its officers and trustees for certain liabilities that may arise from the performance of their duties to the Fund. Additionally, in the normal course of business, the Fund enters into contracts that contain a variety of representations and warranties which provide general indemnities. The Fund’s maximum exposure under these arrangements is unknown, as this would involve future claims that may be made against the Fund that have not yet occurred. However, the Fund expects the risk of loss due to these warranties and indemnities to be remote.
| (3) | INVESTMENT ADVISORY AGREEMENT AND TRANSACTIONS WITH RELATED PARTIES |
Advisory Fees – Pursuant to a management agreement with the Fund (the “Advisory Agreement”), investment advisory services are provided to the Fund by the Advisor. Under the terms of the Advisory Agreement, the Advisor receives monthly fees calculated at an annual rate of 0.55% of the average daily net assets of the Fund. For the period May 1, 2023, through March 31, 2024, the Advisor earned advisory fees of $616,147. For period August 1, 2022, through April 30, 2023, the Advisor earned advisory fees of $620,792. For the period May 1, 2022, through July 31, 2022, the Prior Advisor, pursuant to a similar management agreement, earned advisory fees of $227,171.
The Advisor, pursuant to an Expense Limitation Agreement (the “Agreement”) has contractually agreed to reduce its fees and/or absorb expenses of the Fund at least through August 31, 2024 so that Net Annual Operating Expenses (including organizational and offering expenses, but excluding interest, brokerage commissions, acquired fund fees and expenses, and extraordinary expenses) will not exceed 1.10%, 1.35%, and 1.35% per annum of the average daily net assets of Class I, Class T, and Class W, respectively.
The Agreement allows the Advisor to recover amounts previously reimbursed for operating expenses to the Fund to the extent that the Fund’s expense ratio falls below the expense limitation at that time. The amount that can be recovered will be limited to the difference between the actual expense ratio and the amount of the expense limitation. Under the Agreement, the Advisor can only recover such amounts for a period of up to three years subsequent to the time fees were waived or reimbursed by the Advisor. As of March 31, 2024, the amount recoverable by the Advisor under the Agreement was $112,208 which consists of $6,527 and $105,681 that are recoverable by April 30, 2026, and March 31, 2027, respectively. No amounts are recoverable by the Prior Advisor in future periods.
| PREDEX |
| NOTES TO FINANCIAL STATEMENTS (Continued) |
| March 31, 2024 |
Northern Lights Distributors, LLC (the “Distributor”) is serving as the Fund’s principal underwriter and acts as the distributor of the Fund’s shares on a reasonable-efforts basis, subject to various conditions. The Fund’s Board of Trustees (the “Board”) has adopted, on behalf of the Fund, a Shareholder Services Plan (the “Plan”), under which the Fund may compensate financial industry professionals for providing ongoing services in respect of clients with whom they have distributed shares of the Fund. Under the Plan, the Fund may pay 0.25% per year of its average daily net assets attributed to Class I, Class T, and Class W shares, respectively, for such services. The Fund incurred shareholder servicing fees for Class I totaling $176,342 for the year ended April 30, 2023, and $166,225 for the eleven months ended March 31, 2024. The Class T and Class W shares pay to the Distributor a distribution fee, payable under distribution plans adopted by the Board (“Distribution Plans”), for certain activities relating to the distribution of shares to investors and maintenance of shareholder accounts. These activities include marketing and other activities to support the distribution of the Class T and Class W shares. Under the Distribution Plans, the Fund pays 0.25% per year of its average daily net assets for such services for Class T and Class W shares, respectively. For the eleven-month period ended March 31, 2024, the Fund incurred distribution fees of $138 and $273 for Class T and Class W shares, respectively. For the year ended April 30, 2023, the Fund incurred distribution fees of $317 and $387 for Class T and Class W shares, respectively.
In addition, certain affiliates of the Distributor provide services to the Fund as follows:
Ultimus Fund Solutions, LLC (“UFS”) – UFS, an affiliate of the Distributor, provides administration, fund accounting, and transfer agent services to the Trust. Pursuant to a separate servicing agreement with UFS, the Fund pays UFS customary fees for providing administration, fund accounting, and transfer agency services to the Fund. Certain officers of the Fund are also officers of UFS and are not paid any fees directly by the Fund for servicing in such capacities.
Northern Lights Compliance Services, LLC (“NLCS”) – NLCS, an affiliate of UFS and the Distributor, provides a Chief Compliance Officer to the Fund, as well as related compliance services, pursuant to a consulting agreement between NLCS and the Fund. Under the terms of such agreement, NLCS receives customary fees from the Fund.
Blu Giant, LLC (“Blu Giant”) – Blu Giant, an affiliate of UFS and the Distributor, provides EDGAR conversion and filing services as well as print management services for the Fund on an ad-hoc basis. For the provision of these services, Blu Giant receives customary fees from the Fund.
| (4) | INVESTMENT TRANSACTIONS |
The cost of purchases and proceeds from the sale of securities, other than short-term securities, for the eleven-month period ended March 31, 2024 amounted to $3,137,597 and $10,727,816, respectively, and $10,397,377 and $8,060,758, respectively, for the year ended April 30, 2023.
| (5) | AGGREGATE UNREALIZED APPRECIATION AND DEPRECIATION – TAX BASIS |
The identified cost of investments for federal income tax purposes, and its respective unrealized appreciation and depreciation at fiscal period ended March 31, 2024, were as follows:
| | | | Gross Unrealized | | | Gross Unrealized | | | Net Unrealized | |
| Tax Cost | | | Appreciation | | | (Depreciation) | | | Appreciation | |
| $ | 94,449,686 | | | $ | 31,544,383 | | | $ | (4,686,782 | ) | | $ | 26,857,601 | |
| PREDEX |
| NOTES TO FINANCIAL STATEMENTS (Continued) |
| March 31, 2024 |
| (6) | DISTRIBUTIONS TO SHAREHOLDERS AND TAX COMPONENTS OF CAPITAL |
The tax character of distributions paid for the tax years ended April 30, 2023 and April 30, 2022 were as follows:
| | | Tax Year Ended | | | Tax Year Ended | |
| | | April 30, 2023 | | | April 30, 2022 | |
| Long-Term Capital Gain | | $ | 3,142,333 | | | $ | 1,244,570 | |
| Return of Capital | | | 3,471,630 | | | | 5,537,808 | |
| | | $ | 6,613,963 | | | $ | 6,782,378 | |
As of the tax year ended April 30, 2023, the components of accumulated earnings on a tax basis were as follows:
| Undistributed | | | Post October | | | | | | | | | Total | |
| Long-Term | | | Loss and Late | | | Other Book/Tax | | | Net Unrealized | | | Accumulated | |
| Gains | | | Year Loss | | | Differences | | | Appreciation | | | Earnings | |
| $ | 1,919,940 | | | $ | (733,771 | ) | | $ | (47,743 | ) | | $ | 43,893,032 | | | $ | 45,031,458 | |
The difference between book basis and tax basis accumulated net investment income/loss and unrealized appreciation from investments is primarily attributable to the tax adjustments for partnerships and amortization of certain organization costs for tax purposes.
Late year losses incurred after December 31 within the tax year are deemed to arise on the first business day of the following tax year for tax purposes. The Fund incurred and elected to defer such late year losses of $733,771 for tax year ended April 30, 2023.
For the tax year ended April 30, 2023, the following reclassifications, which had no impact on results of operations or net assets, were recorded to reflect tax character.
| Paid-in Capital | | | Accumulated Earnings | |
| $ | (1,183,284 | ) | | $ | 1,183,284 | |
Pursuant to Rule 23c-3 under the Investment Company Act of 1940, as amended, the Fund offers shareholders on a quarterly basis the option of redeeming shares, at net asset value, of no less than 5% and no more than 25% of the shares outstanding. There is no guarantee that shareholders will be able to sell all of the shares they desire in a quarterly repurchase offer, although each shareholder will have the right to require the Fund to purchase up to and including 5% of such shareholder’s shares in each quarterly repurchase. Liquidity will be provided to shareholders only through the Fund’s quarterly repurchases.
| PREDEX |
| NOTES TO FINANCIAL STATEMENTS (Continued) |
| March 31, 2024 |
During the eleven month period ended March 31, 2024, the Fund completed three repurchase offers. In each offer, the Fund offered to repurchase at least 5% (and an additional 2% at the Fund’s discretion) of the number of its outstanding shares as of the Repurchase Pricing Date. The result of the repurchase offers were as follows:
| | | Repurchase | | | Repurchase | | | Repurchase | |
| | | Offer # 1 | | | Offer # 2 | | | Offer # 3 | |
| Commencement Date | | | 6/29/2023 | | | | 9/29/2022 | | | | 12/28/2023 | |
| Repurchase Request Deadline | | | 7/21/2023 | | | | 10/20/2023 | | | | 1/23/2024 | |
| Repurchase Pricing Date | | | 7/21/2023 | | | | 10/20/2023 | | | | 1/23/2024 | |
| Amount Repurchased: | | | | | | | | | | | | |
| Class I | | $ | 2,315,717 | | | $ | 1,239,578 | | | $ | 3,038,496 | |
| Class T | | | — | | | | — | | | | — | |
| Class W | | | — | | | | 27,955 | | | | — | |
| (8) | COMMITMENTS AND CONTINGENCIES |
As of March 31, 2024, the Fund had no unfunded commitment amount which had not yet been called for investment.
| Initial | | | | | | | | | | |
| Acquisition | | | | | | | Redemption | | Unfunded | |
| Date | | Value | | | Real Estate Investment Funds | | Frequency | | Commitments | |
| 7/01/2016 | | $ | 5,952,675 | | | AEW Core Property (U.S.), LP | | Quarterly | | | — | |
| 8/01/2016 | | | 4,955,413 | | | ARA Core Property Fund, LP | | Quarterly | | | — | |
| 10/02/2017 | | | 1,062,628 | | | Ares Real Estate Income Trust Inc. | | Monthly | | | — | |
| 7/01/2016 | | | 4,233,630 | | | Barings Core Property Fund LP | | Quarterly | | | — | |
| 10/01/2018 | | | 359,015 | | | BGO Daily Value Fund, LP | | Daily | | | — | |
| 4/01/2017 | | | 5,403,893 | | | BGO Diversified US Property Fund LP | | Quarterly | | | — | |
| 4/01/2017 | | | 5,578,844 | | | BlackRock US Core Property Fund, LP | | Quarterly | | | — | |
| 7/01/2017 | | | 7,323,930 | | | CBRE U.S. Core Partners, LP | | Quarterly | | | — | |
| 4/01/2017 | | | 6,223,748 | | | Clarion Lion Properties Fund, LP | | Quarterly | | | — | |
| 4/01/2017 | | | 5,063,110 | | | GWL US Property Fund LP | | Quarterly | | | — | |
| 4/01/2017 | | | 5,128,032 | | | Invesco Core Real Estate - U.S.A., LP | | Quarterly | | | — | |
| 4/01/2019 | | | 3,296,043 | | | Invesco U.S. Income Fund, LP | | Quarterly | | | — | |
| 8/02/2016 | | | 1,034,512 | | | JLL Income Property Trust, Inc. | | Daily | | | — | |
| 7/01/2020 | | | 7,067,527 | | | Lion Industrial Trust | | Quarterly | | | — | |
| 7/01/2019 | | | 5,901,643 | | | Prime Property Fund, LLC | | Quarterly | | | — | |
| 7/01/2019 | | | 3,009,122 | | | Principal Enhanced Property Fund, LP | | Quarterly | | | — | |
| 4/01/2017 | | | 4,714,914 | | | PRISA LP | | Quarterly | | | — | |
| 4/01/2017 | | | 5,074,112 | | | Prologis Targeted U.S. Logistics Fund, LP | | Quarterly | | | — | |
| 7/01/2017 | | | 5,374,824 | | | RREEF America II LP | | Quarterly | | | — | |
| 10/01/2018 | | | 4,958,219 | | | RREEF Core Plus Industrial Fund LP | | Quarterly | | | — | |
| 4/11/2017 | | | 6,315,429 | | | Sentinel Real Estate Fund, LP | | Daily | | | — | |
| 4/01/2017 | | | 6,039,215 | | | Smart Markets Fund, LP | | Quarterly | | | — | |
| 7/01/2022 | | | 5,646,323 | | | TA Realty Core Property Fund, LP | | Quarterly | | | — | |
| 4/01/2017 | | | 4,915,368 | | | Trumbull Property Fund LP | | Quarterly | | | — | |
| 4/01/2017 | | | 5,850,954 | | | US Government Building Fund | | Quarterly | | | — | |
| | | $ | 120,483,123 | | | | | | | $ | 0 | |
| PREDEX |
| NOTES TO FINANCIAL STATEMENTS (Continued) |
| March 31, 2024 |
While redemptions can be requested at the frequency listed in the above table, there is no guarantee the Fund will be paid all or any of a redemption amount at the time requested. Each of the above investment funds can suspend redemptions if its respective board deems it in the best interest of its shareholders.
| (9) | REVOLVING CREDIT FACILITIES |
Effective September 30, 2022, the Fund renewed a secured $25 million line of credit through Credit Suisse for the purpose of liquidity subject to the limitations of the 1940 Act for borrowings. Borrowings under the arrangement bore interest at the 3-month SOFR plus 2.35% at the time of borrowing. Borrowings under the arrangement previously bore interest at the 3-month LIBOR plus 2.35%. An unused commitment fee rate equal to 0.775% remained unchanged. As collateral for borrowings under the line of credit, the Fund granted Credit Suisse a first position security interest in and lien on the securities held by the Fund in a collateral account.
Effective May 5, 2023, the Fund entered into a secured $25 million line of credit with Royal Bank of Canada (“RBC”). Borrowings under the arrangement bear interest at the 3-month SOFR plus 1.75% at the time of borrowing. As collateral for borrowings under the line of credit, the Fund grants RBC a first position security interest in and lien on the securities held by the Fund in a collateral account. The Fund’s credit facility with Credit Suisse was terminated that day in conjunction therewith. The Fund no longer has any outstanding obligations under the Credit Suisse arrangement as of the date of termination. As of March 31, 2024, all the Fund’s Private Investment Funds with a total value of $118,385,983 were pledged as collateral. The revolving credit facility with RBC has a maturity of May 3, 2024.
During the eleven-month period ended March 31, 2024, the Fund incurred $1,236,615 of interest and borrowing expenses. Average borrowings and the average interest rate for the days the line of credit was outstanding during the eleven-month period ended March 31, 2024 were $14,563,889 and 7.07%, respectively. As of March 31, 2024, the Fund had $11,266,838 in outstanding borrowings with an effective interest rate of 7.08%. The largest amount outstanding during the eleven-month period ended March 31, 2024 was $23,734,481.
The beneficial ownership, either directly or indirectly, of more than 25% of the voting securities of a fund creates presumption of control of the fund, under Section 2(a)(9) of the 1940 Act. As of March 31, 2024, National Financial Services LLC accounts holding shares for the benefit of others in nominee name, held approximately 64% of the voting securities of the Fund. The Fund has no evidence that any beneficial owner included in these nominee accounts holds more than 25% of the voting shares.
Effective April 17, 2024, the Fund extended its revolving credit facility with RBC through May 2, 2025. The terms of the credit agreement remain unchanged.
Effective April 23, 2024, the Fund completed a quarterly repurchase offer which resulted in 117,324 Fund shares being repurchased for $2,811,072.
Subsequent events after the date of the Statement of Assets and Liabilities have been evaluated through the date the financial statements were issued. Management has determined that no other subsequent events or transactions occurred requiring adjustment or disclosure in these financial statements.

REPORT OF INDEPENDENT REGISTERED PUBLIC ACCOUNTING FIRM
To the Shareholders and Board of Trustees of
PREDEX
Opinion on the Financial Statements
We have audited the accompanying statement of assets and liabilities, including the schedule of investments, of PREDEX (the “Fund”) as of March 31, 2024, the related statements of operations, cash flows and changes in net assets, the related notes, and the financial highlights for the period May 1, 2023 through March 31, 2024 (collectively referred to as the “financial statements”). In our opinion, the financial statements present fairly, in all material respects, the financial position of the Fund as of March 31, 2024, the results of its operations, cash flows, the changes in net assets and the financial highlights for the period indicated above, in conformity with accounting principles generally accepted in the United States of America.
The Fund’s financial statements and financial highlights for the years ended April 30, 2023, and prior, were audited by other auditors whose report dated June 29, 2023, expressed an unqualified opinion on those financial statements and financial highlights.
Basis for Opinion
These financial statements are the responsibility of the Fund’s management. Our responsibility is to express an opinion on the Fund’s financial statements based on our audit. We are a public accounting firm registered with the Public Company Accounting Oversight Board (United States) (“PCAOB”) and are required to be independent with respect to the Fund in accordance with the U.S. federal securities laws and the applicable rules and regulations of the Securities and Exchange Commission and the PCAOB.
We conducted our audit in accordance with the standards of the PCAOB. Those standards require that we plan and perform the audit to obtain reasonable assurance about whether the financial statements are free of material misstatement whether due to error or fraud.
Our audit included performing procedures to assess the risks of material misstatement of the financial statements, whether due to error or fraud, and performing procedures that respond to those risks. Such procedures included examining, on a test basis, evidence regarding the amounts and disclosures in the financial statements. Our procedures included confirmation of securities owned as of March 31, 2024, by correspondence with the custodians and underlying fund administrators. Our audit also included evaluating the accounting principles used and significant estimates made by management, as well as evaluating the overall presentation of the financial statements. We believe that our audit provides a reasonable basis for our opinion.
We have served as the auditor of one or more investment companies advised by Union Square Capital Partners, LLC since 2017.

COHEN & COMPANY, LTD.
Cleveland, Ohio
May 30, 2024
COHEN & COMPANY, LTD.
800.229.1099 | 866.818.4538 fax | cohencpa.com
Registered with the Public Company Accounting Oversight Board
| PREDEX |
| ADDITIONAL INFORMATION (Unaudited) |
| March 31, 2024 |
Change in Independent Registered Public Accounting Firm
On July 25, 2023, RSM US LLP (“RSM”) was not re-appointed as the independent registered public accounting firm of PREDEX (the “Fund”). The Audit Committee of the Board of Trustees approved the replacement of RSM in order to consolidate audit providers across the family of funds.
The report of RSM on the financial statements of the Fund for the two fiscal years ended April 30, 2023 did not contain an adverse opinion or a disclaimer of opinion, and were not qualified or modified as to uncertainties, audit scope or accounting principles. During the fiscal year ended April 30, 2023 and during the subsequent interim period through June 29, 2023: (i) there were no disagreements between the registrant and RSM on any matter of accounting principles or practices, financial statement disclosure, or auditing scope or procedure, which disagreements, if not resolved to the satisfaction of RSM, would have caused it to make reference to the subject matter of the disagreements in its report on the financial statements of the Fund for such years or interim period; and (ii) there were no “reportable events,” as defined in Item 304(a)(1)(v) of Regulation S-K under the Securities Exchange Act of 1934, as amended.
The registrant requested that RSM furnish it with a letter addressed to the U.S. Securities and Exchange Commission stating that it agrees with the above statements. A copy of such letter is filed as an exhibit to Form N-CSR.
On July 25, 2023, the Audit Committee of the Board of Trustees also approved the appointment of Cohen & Company, Ltd. (“Cohen”) as the Fund’s independent registered public accounting firm for the 2024 fiscal year.
During the two fiscal years ended April 30, 2023, and during the subsequent interim period through July 25, 2023, neither the registrant, nor anyone acting on its behalf, consulted with Cohen on behalf of the Fund regarding the application of accounting principles to a specified transaction (either completed or proposed), the type of audit opinion that might be rendered on the Fund’s financial statements, or any matter that was either: (i) the subject of a “disagreement,” as defined in Item 304(a)(1)(iv) of Regulation S-K and the instructions thereto; or (ii) “reportable events,” as defined in Item 304(a)(1)(v) of Regulation S-K.
| PREDEX |
| SUPPLEMENTAL INFORMATION (Unaudited) |
| March 31, 2024 |
Following is a list of the Trustees and executive officers of the Trust and their principal occupation over the last five years. Unless otherwise noted, the address of each Trustee and Officer is c/o PREDEX, 4221 North 203rd Street, Suite 100, Elkhorn, Nebraska 68022.
Independent Trustees
Name,
Year of Birth | Position/
Term of Office* | Principal Occupation
During the Past Five Years | Number of
Portfolios in
Fund
Complex**
Overseen by
Trustee | Other
Directorships
held by
Trustee |
Gregory B.
Fairchild (1963) | Trustee since July 2022 | Dr. Fairchild is Professor at the University of Virginia, Darden GSBA (2001 to present). Dean and CEO, UVA | Northern Virginia (2021 to present). | 2 | None |
Havilah Mann,
CPA (1975) | Trustee since July 2022 | Ms. Mann is Fractional Chief Financial Officer and Business Development Advisor of HSM Resources (accounting infrastructure and internal control consulting services). | 2 | None |
Edward P.
Mooney, Jr.
(1970) | Trustee since July 2022 | Mr. Mooney is COO of Saint Francis de Sales Seminary (January 2023 to present), a private investor and a Limited Partner of Golden Angels Investors LLC (since 2018). Previously, Mr. Mooney was a Managing Director with Artisan Partners Limited Partnership (investment management) until his retirement in 2014. | 2 | Christian Brothers Investment Services (2016 to present) |
Officers
Name,
Year of Birth | Position/
Term of Office* | Principal Occupation
During the Past Five Years |
Thomas E. Miller
(1983) | President since August 2022 | Chief Executive Officer since 2021 and Chief Investment Officer, Union Square Capital Partners, LLC, Feb. 2017 to present. |
Michael D. Achterberg
(1963) | Treasurer since July 2013 | Senior Portfolio Manager, Union Square Capital Partners, LLC, Aug. 2022 to present. President, PREDEX Capital Management, LLC (“PCM”), June 2018 to July 2022; Chief Operating Officer, PCM, March 2013 to May 2018. |
George K. Downing
(1972) | Secretary since August 2022 | Chief Operating Officer, Union Square Capital Partners, LLC, Feb. 2017 to present |
William Kimme
(1962) | Chief Compliance Officer since March 2013 | Senior Compliance Officer of Northern Lights Compliance Services, LLC (since 2011) |
| * | The term of office for each Trustee and officer listed above will continue indefinitely. |
| ** | The term “Fund Complex” refers to the Fund and USQ Core Real Estate Fund. |
The Fund’s Statement of Additional Information (“SAI”) includes additional information about the Trustees and is available free of charge, upon request, by calling toll-free at 1-877-940-7202.
| PRIVACY NOTICE |
| |
| FACTS | WHAT DOES PREDEX DO WITH YOUR PERSONAL INFORMATION? |
| | |
| Why? | Financial companies choose how they share your personal information. Federal law gives consumers the right to limit some but not all sharing. Federal law also requires us to tell you how we collect, share, and protect your personal information. Please read this notice carefully to understand what we do. |
| | |
| What? | The types of personal information we collect and share depend on the product or service you have with us. This information can include: |
| | ■ Social Security number ■ Assets ■ Retirement Assets ■ Transaction History ■ Checking Account Information | ■ Purchase History ■ Account Balances ■ Account Transactions ■ Wire Transfer Instructions |
| | | |
| | When you are no longer our customer, we continue to share your information as described in this notice. |
| | |
| How? | All financial companies need to share customers’ personal information to run their everyday business. In the section below, we list the reasons financial companies can share their customers’ personal information; the reasons PREDEX chooses to share; and whether you can limit this sharing. |
| | | |
| Reasons we can share your personal information | Does PREDEX
share? | Can you limit this
sharing? |
For our everyday business purposes –
such as to process your transactions, maintain your account(s), respond to court orders and legal investigations, or report to credit bureaus | Yes | No |
For our marketing purposes –
to offer our products and services to you | No | We don’t share |
| For joint marketing with other financial companies | No | We don’t share |
For our affiliates’ everyday business purposes –
information about your transactions and experiences | No | We don’t share |
For our affiliates’ everyday business purposes –
information about your creditworthiness | No | We don’t share |
| For nonaffiliates to market to you | No | We don’t share |
| Questions? | Call 1-877-940-7202 |
| Who we are |
| Who is providing this notice? | PREDEX |
| What we do |
| How does PREDEX protect my personal information? | To protect your personal information from unauthorized access and use, we use security measures that comply with federal law. These measures include computer safeguards and secured files and buildings. Our service providers are held accountable for adhering to strict policies and procedures to prevent any misuse of your nonpublic personal information. |
| How does PREDEX collect my personal information? | We collect your personal information, for example, when you ■ Open an account ■ Provide account information ■ Give us your contact information ■ Make deposits or withdrawals from your account ■ Make a wire transfer ■ Tell us where to send the money ■ Tells us who receives the money ■ Show your government-issued ID ■ Show your driver’s license We also collect your personal information from other companies. |
| Why can’t I limit all sharing? | Federal law gives you the right to limit only ■ Sharing for affiliates’ everyday business purposes – information about your creditworthiness ■ Affiliates from using your information to market to you ■ Sharing for nonaffiliates to market to you State laws and individual companies may give you additional rights to limit sharing. |
| Definitions |
| Affiliates | Companies related by common ownership or control. They can be financial and nonfinancial companies. ■ PREDEX does not share with our affiliates. |
| Nonaffiliates | Companies not related by common ownership or control. They can be financial and nonfinancial companies ■ PREDEX does not share with nonaffiliates so they can market to you. |
| Joint marketing | A formal agreement between nonaffiliated financial companies that together market financial products or services to you. ■ PREDEX doesn’t jointly market. |
| Investment Advisor |
| Union Square Capital Partners, LLC |
| 235 Whitehorse Lane, Suite 200 |
| Kennett Square, PA 19348 |
| |
| |
| Distributor |
| Northern Lights Distributors, LLC |
| 4221 North 203rd Street, Suite 100 |
| Elkhorn, NE 68022-3474 |
| |
| |
| Legal Counsel |
| Thompson Hine LLP |
| 41 South High Street, Suite 1700 |
| Columbus, OH 43215 |
| |
| |
| Independent Registered Public Accounting Firm |
| Cohen & Company, Ltd. |
| 1350 Euclid Avenue, Suite 800 |
| Cleveland, OH 44115 |
| |
| |
| |
| |
| |
| |
| |
| |
| |
| |
| |
| |
| |
| |
| |
| |
How to Obtain Proxy Voting Information
Information regarding how the Fund voted proxies relating to portfolio securities for the 12 month period ended June 30th as well as a description of the policies and procedures that the Fund used to determine how to vote proxies is available without charge, upon request, by calling (877) 940-7202 or by referring to the Securities and Exchange Commission’s (“SEC”) website at http://www.sec.gov.
How to Obtain 1st and 3rd Fiscal Quarter Portfolio Holdings
The Fund files its complete schedule of portfolio holdings with the SEC for the first and third quarters of each fiscal year as an exhibit to its reports on Form N-PORT, within sixty days after the end of the period. Form N-PORT reports are available on the SEC’s website at http://www.sec.gov. The information on Form N-PORT is available without charge, upon request, by calling (877) 940-7202.

(b) Not applicable.
Item 2. Code of Ethics. Attached
(a) As of the end of the period covered by this report, the registrant has adopted a code of ethics that applies to the registrant's principal executive officer, principal financial officer, principal accounting officer or controller, or persons performing similar functions, regardless of whether these individuals are employed by the registrant or a third party.
(b) For purposes of this item, “code of ethics” means written standards that are reasonably designed to deter wrongdoing and to promote:
| (1) | Honest and ethical conduct, including the ethical handling of actual or apparent conflicts of interest between personal and professional relationships; |
| (2) | Full, fair, accurate, timely, and understandable disclosure in reports and documents that a registrant files with, or submits to, the Commission and in other public communications made by the registrant; |
(3) Compliance with applicable governmental laws, rules, and regulations;
| (4) | The prompt internal reporting of violations of the code to an appropriate person or persons identified in the code; and |
(5) Accountability for adherence to the code.
(c) Amendments: During the period covered by the report, there have not been any amendments to the provisions of the code of ethics.
(d) Waivers: During the period covered by the report, the registrant has not granted any express or implicit waivers from the provisions of the code of ethics.
(e) The Code of Ethics is not posted on Registrant’s website.
(f) A copy of the Code of Ethics is attached as an exhibit.
Item 3. Audit Committee Financial Expert.
(a) The Registrant’s board of trustees has determined that Havilah Mann is an audit committee financial expert, as defined in Item 3 of Form N-CSR. Havilah Mann is independent for purposes of this Item.
Item 4. Principal Accountant Fees and Services.
2024 - $30,000
2023 - $52,750
2024 - $0
2023 - $0
2024 - $5,250
2023 - $7,250
Preparation of Federal & State income tax returns, assistance with calculation of required income, capital gain and excise distributions and preparation of Federal excise tax returns.
2024 - $0
2023 - $0
| (e) | (1) Audit Committee’s Pre-Approval Policies |
The registrant’s Audit Committee is required to pre-approve all audit services and, when appropriate, any non-audit services (including audit-related, tax and all other services) to the registrant. The registrant’s Audit Committee also is required to pre-approve, when appropriate, any non-audit services (including audit-related, tax and all other services) to its adviser (Union Square Capital Partners, LLC (“Adviser”)), or any entity controlling, controlled by or under common control with the adviser that provides ongoing services to the registrant, to the extent that the services may be determined to have an impact on the operations or financial reporting of the registrant. Services are reviewed on an engagement by engagement basis by the Audit Committee.
| (2) | Percentages of Services Approved by the Audit Committee |
| | | | 2024 | | | | 2023 | |
| Audit-Related Fees: | | | 0.00 | % | | | 0.00 | % |
| Tax Fees: | | | 0.00 | % | | | 0.00 | % |
| All Other Fees: | | | 0.00 | % | | | 0.00 | % |
| (f) | During the audit of registrant's financial statements for the most recent fiscal year, less than 50 percent of the hours expended on the principal accountant's engagement were attributed to work performed by persons other than the principal accountant's full-time, permanent employees. |
| (g) | The aggregate non-audit fees billed by the registrant's accountant for services rendered to the registrant, and rendered to the registrant's investment adviser (not including any sub-adviser whose role is primarily portfolio management and is subcontracted with or overseen by another investment adviser), and any entity controlling, controlled by, or under common control with the adviser that provides ongoing services to the registrant: |
| | | Registrant | | Adviser | |
| | 2024- | | | $ | 5,250 | | | $ | 0 | |
| | 2023- | | | $ | 7,250 | | | $ | 0 | |
(h) The registrant's audit committee has considered whether the provision of non-audit services to the registrant's investment adviser (not including any sub-adviser whose role is primarily portfolio management and is subcontracted with or overseen by another investment adviser), and any entity controlling, controlled by, or under common control with the investment adviser that provides ongoing services to the registrant, that were not pre-approved pursuant to paragraph (c)(7)(ii) of Rule 2-01 of Regulation S-X, is compatible with maintaining the principal accountant's independence.
(i) Not applicable.
(j) Not applicable.
Item 5. Audit Committee of Listed Companies. Not applicable
Item 6. Schedule of Investments. Schedule of investments in securities of unaffiliated issuers is included under Item 1.
Item 7. Disclosure of Proxy Voting Policies and Procedures for Closed-End Funds.
A copy of the proxy voting policies and procedures is attached as an exhibit.
Item 8. Portfolio Managers of Closed-End Management Investment Companies.
The management of the Registrant’s investment portfolio will be the responsibility of the Adviser and its Co-Portfolio Managers Thomas Miller and Michael Achterberg.
Thomas E. Miller, CFA
Thomas Miller has served as Chief Executive Officer since 2021 and Chief Investment Officer of the Adviser since 2017.
Michael Achterberg, CAIA
Michael Achterberg has served as Senior Portfolio Manager of the Adviser since August 2022. Previously, Mr. Achterberg served as President of Predex Capital Management, LLC from 2018 to July 2022; as well as Portfolio Manager since the Fund’s inception in July 2016.
Other accounts managed by Portfolio Managers as of March 31, 2024:
| | | | | |
| Other Accounts By Type | Total Number of Accounts by Account Type | Total Assets By Account Type | Number of Accounts by Type Subject to a Performance Fee | Total Assets By Account Type Subject to a Performance Fee |
| Registered Investment Companies | 1 | $152,506,264 | 0 | $0 |
| Other Pooled Investment Vehicles | 0 | $0 | 0 | $0 |
| Other Accounts | 0 | $0 | 0 | $0 |
The portfolio managers receive their compensation from the Adviser in the form of salary, bonus, retirement plan benefits, and restricted stock. Each portfolio manager’s bonus is variable and generally is based on (1) an evaluation of the portfolio manager’s ability to remain compliant with investment management guidelines and regulatory requirements, and (2) the results of a peer and/or management review of the portfolio manager, which takes into account skills and attributes such as team participation, investment process, communication and professionalism. In evaluating investment performance, the Adviser generally considers the performance of mutual funds and other accounts managed by the portfolio manager, if any, relative to the benchmarks and peer groups
The size of the overall bonus pool each year is determined by the Adviser and depends on, among other factors, the levels of compensation generally in the investment management industry (based on market compensation data) and the Adviser’s profitability for the year, which is largely determined by assets under management. Part of the bonus is based on a qualitative assessment of an individual’s contribution to the management of the fund in addition to compliance with investment guidelines and regulatory mandates..
As of March 31, 2024, the Portfolio Managers’ ownership of the Fund was as follows:
| Portfolio Manager | Dollar Range of Shares Owned |
| Thomas Miller | $10,001-$50,000 |
| Michael Achterberg | over $100,000 |
Item 9. Purchases of Equity Securities by Closed-End Funds. Not applicable
Item 10. Submission of Matters to a Vote of Security Holders. None
Item 11. Controls and Procedures.
(a) Based on an evaluation of the Registrant’s disclosure controls and procedures as of a date within 90 days of filing date of this Form N-CSR, the principal executive officer and principal financial officer of the Registrant have concluded that the disclosure controls and procedures of the Registrant are reasonably designed to ensure that the information required in filings on Form N-CSR is recorded, processed, summarized, and
reported by the filing date, including that information required to be disclosed is accumulated and communicated to the Registrant’s management, including the Registrant’s principal executive officer and principal financial officer, as appropriate to allow timely decisions regarding required disclosure.
(b) There were no significant changes in the Registrant’s internal control over financial reporting that occurred during the period covered by this report that have materially affected, or are reasonably likely to materially affect, the Registrant’s internal control over financial reporting.
Item 12. Disclosure of Securities Lending Activities for Closed-End Management Investment Companies. Not applicable.
Item 13. Exhibits.
(a)(1) Code of Ethics filed herewith.
(a)(2) Certifications required by Section 302 of the Sarbanes-Oxley Act of 2002 (and Item 11(a)(2) of Form N-CSR) are filed herewith.
(a)(3) Not applicable.
(a)(4) Ex-99. Change in Registrant’s Independent Public Accountant.
(b) Certifications required by Section 906 of the Sarbanes-Oxley Act of 2002 (and Item 11(b) of Form N-CSR) are filed herewith.
SIGNATURES
Pursuant to the requirements of the Securities Exchange Act of 1934 and the Investment Company Act of 1940, the registrant has duly caused this report to be signed on its behalf by the undersigned, thereunto duly authorized.
(Registrant) PREDEX
By (Signature and Title)
/s/ Thomas E. Miller
Thomas E. Miller, Principal Executive Officer/President
Date 6/5/24
Pursuant to the requirements of the Securities Exchange Act of 1934 and the Investment Company Act of 1940, this report has been signed below by the following persons on behalf of the registrant and in the capacities and on the dates indicated.
By (Signature and Title)
/s/ Thomas E. Miller
Thomas E. Miller, Principal Executive Officer/President
Date 6/5/24
By (Signature and Title)
/s/ Michael D. Achterberg
Michael D. Achterberg, Principal Financial Officer/Treasurer
Date 6/5/24