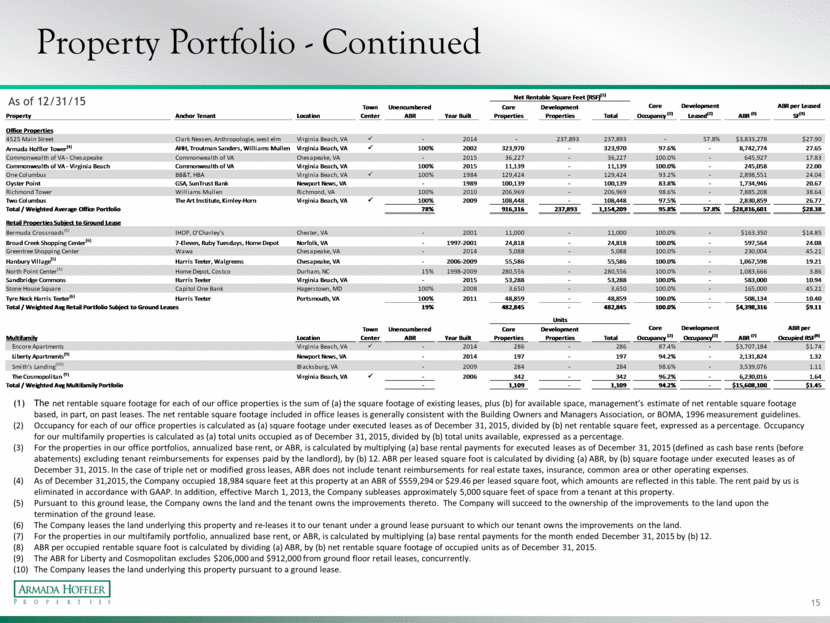
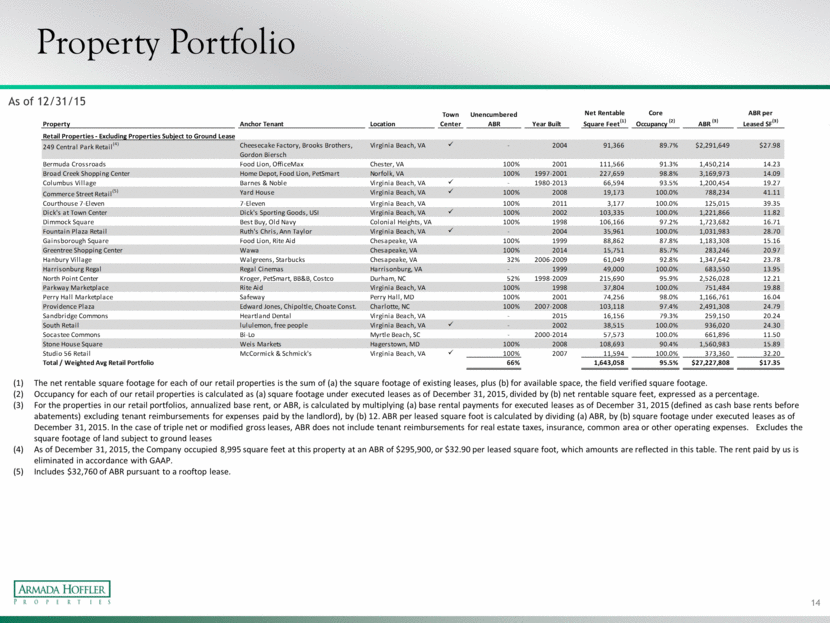
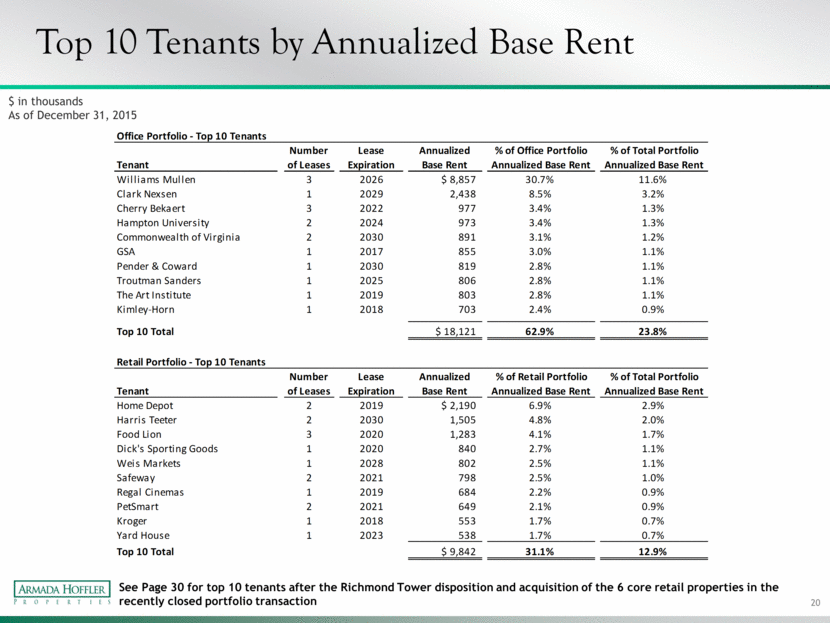
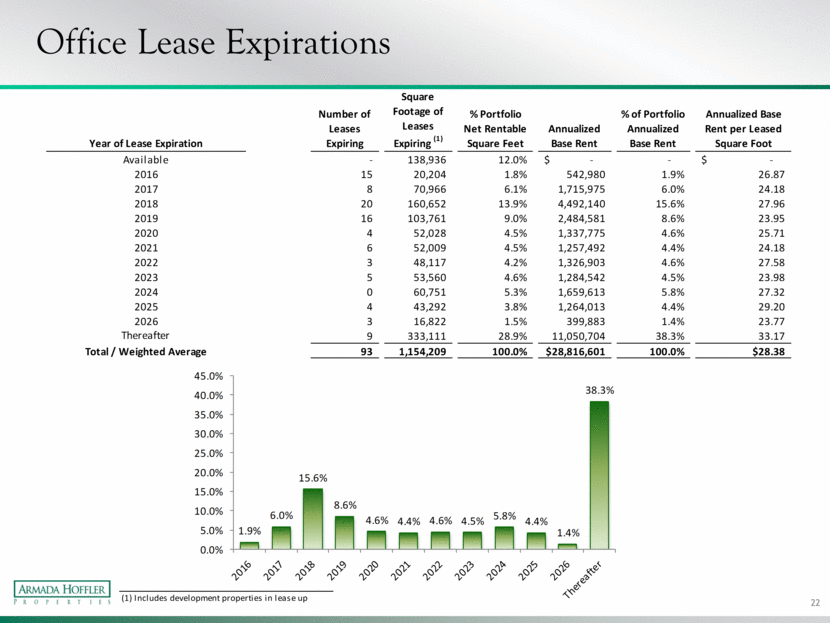
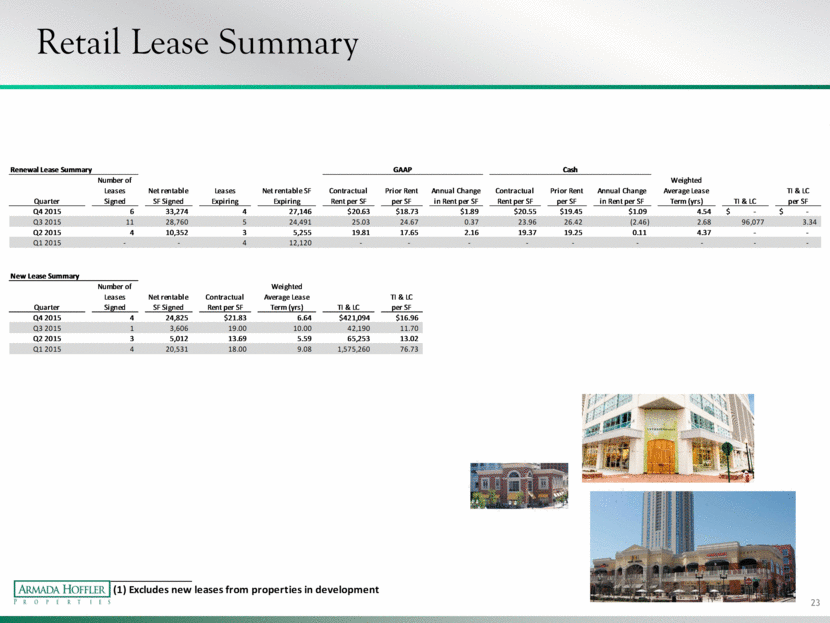
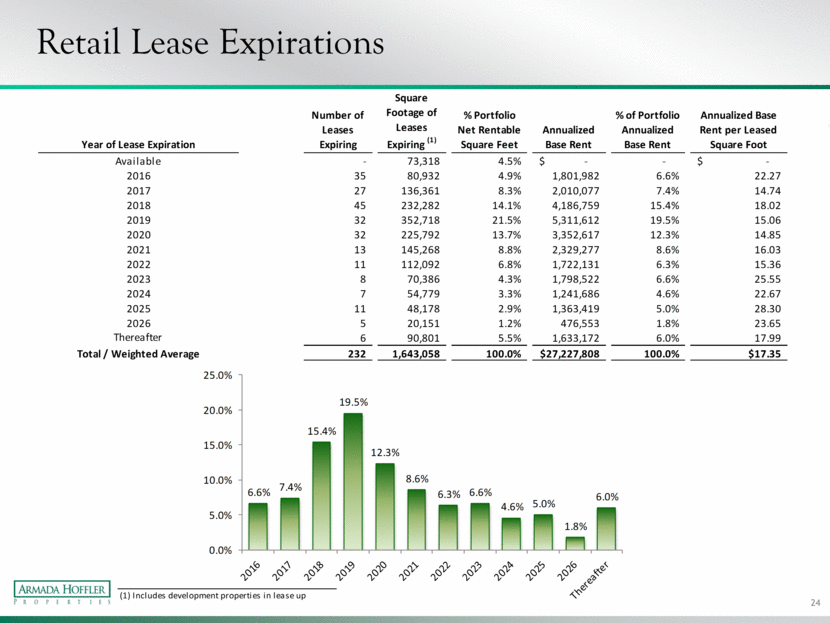
Property Portfolio - Continued As of 12/31/15 The net rentable square footage for each of our office properties is the sum of (a) the square footage of existing leases, plus (b) for available space, management’s estimate of net rentable square footage based, in part, on past leases. The net rentable square footage included in office leases is generally consistent with the Building Owners and Managers Association, or BOMA, 1996 measurement guidelines. Occupancy for each of our office properties is calculated as (a) square footage under executed leases as of December 31, 2015, divided by (b) net rentable square feet, expressed as a percentage. Occupancy for our multifamily properties is calculated as (a) total units occupied as of December 31, 2015, divided by (b) total units available, expressed as a percentage. For the properties in our office portfolios, annualized base rent, or ABR, is calculated by multiplying (a) base rental payments for executed leases as of December 31, 2015 (defined as cash base rents (before abatements) excluding tenant reimbursements for expenses paid by the landlord), by (b) 12. ABR per leased square foot is calculated by dividing (a) ABR, by (b) square footage under executed leases as of December 31, 2015. In the case of triple net or modified gross leases, ABR does not include tenant reimbursements for real estate taxes, insurance, common area or other operating expenses. As of December 31,2015, the Company occupied 18,984 square feet at this property at an ABR of $559,294 or $29.46 per leased square foot, which amounts are reflected in this table. The rent paid by us is eliminated in accordance with GAAP. In addition, effective March 1, 2013, the Company subleases approximately 5,000 square feet of space from a tenant at this property. Pursuant to this ground lease, the Company owns the land and the tenant owns the improvements thereto. The Company will succeed to the ownership of the improvements to the land upon the termination of the ground lease. The Company leases the land underlying this property and re-leases it to our tenant under a ground lease pursuant to which our tenant owns the improvements on the land. For the properties in our multifamily portfolio, annualized base rent, or ABR, is calculated by multiplying (a) base rental payments for the month ended December 31, 2015 by (b) 12. ABR per occupied rentable square foot is calculated by dividing (a) ABR, by (b) net rentable square footage of occupied units as of December 31, 2015. The ABR for Liberty and Cosmopolitan excludes $206,000 and $912,000 from ground floor retail leases, concurrently. The Company leases the land underlying this property pursuant to a ground lease. 15 Net Rentable Square Feet (RSF) (1) Property Anchor Tenant Location Town Center Unencumbered ABR Year Built Core Properties Development Properties Total Core Occupancy (2) Development Leased (2) ABR (3) ABR per Leased SF (3) Office Properties 4525 Main Street Clark Nexsen, Anthropologie, west elm Virginia Beach, VA ü - 2014 - 237,893 237,893 - 57.8% $3,833,278 $27.90 Armada Hoffler Tower (4) AHH, Troutman Sanders, Williams Mullen Virginia Beach, VA ü 100% 2002 323,970 - 323,970 97.6% - 8,742,774 27.65 Commonwealth of VA - Chesapeake Commonwealth of VA Chesapeake, VA - 2015 36,227 - 36,227 100.0% - 645,927 17.83 Commonwealth of VA - Virginia Beach Commonwealth of VA Virginia Beach, VA 100% 2015 11,139 - 11,139 100.0% - 245,058 22.00 One Columbus BB&T, HBA Virginia Beach, VA ü 100% 1984 129,424 - 129,424 93.2% - 2,898,551 24.04 Oyster Point GSA, SunTrust Bank Newport News, VA - 1989 100,139 - 100,139 83.8% - 1,734,946 20.67 Richmond Tower Williams Mullen Richmond, VA 100% 2010 206,969 - 206,969 98.6% - 7,885,208 38.64 Two Columbus The Art Institute, Kimley-Horn Virginia Beach, VA ü 100% 2009 108,448 - 108,448 97.5% - 2,830,859 26.77 Total / Weighted Average Office Portfolio 78% 916,316 237,893 1,154,209 95.8% 57.8% $28,816,601 $28.38 Retail Properties Subject to Ground Lease Bermuda Crossroads (5) IHOP, O'Charley's Chester, VA - 2001 11,000 - 11,000 100.0% - $163,350 $14.85 Broad Creek Shopping Center (6) 7-Eleven, Ruby Tuesdays, Home Depot Norfolk, VA - 1997-2001 24,818 - 24,818 100.0% - 597,564 24.08 Greentree Shopping Center Wawa Chesapeake, VA - 2014 5,088 - 5,088 100.0% - 230,004 45.21 Hanbury Village (5) Harris Teeter, Walgreens Chesapeake, VA - 2006-2009 55,586 - 55,586 100.0% - 1,067,598 19.21 North Point Center (5) Home Depot, Costco Durham, NC 15% 1998-2009 280,556 - 280,556 100.0% - 1,083,666 3.86 Sandbridge Commons Harris Teeter Virginia Beach, VA - 2015 53,288 - 53,288 100.0% - 583,000 10.94 Stone House Square Capitol One Bank Hagerstown, MD 100% 2008 3,650 - 3,650 100.0% - 165,000 45.21 Tyre Neck Harris Teeter (6) Harris Teeter Portsmouth, VA 100% 2011 48,859 - 48,859 100.0% - 508,134 10.40 Total / Weighted Avg Retail Portfolio Subject to Ground Leases 19% 482,845 - 482,845 100.0% - $4,398,316 $9.11 Units Multifamily Location Town Center Unencumbered ABR Year Built Core Properties Development Properties Total Core Occupancy (2) Development Occupancy (2) ABR (7) ABR per Occupied RSF (8) Encore Apartments Virginia Beach, VA ü - 2014 286 - 286 87.4% - $3,707,184 $1.74 Liberty Apartments (9) Newport News, VA - 2014 197 - 197 94.2% - 2,131,824 1.32 Smith's Landing (10) Blacksburg, VA - 2009 284 - 284 98.6% - 3,539,076 1.11 The Cosmopolitan (9) Virginia Beach, VA ü - 2006 342 - 342 96.2% - 6,230,016 1.64 Total / Weighted Avg Multifamily Portfolio - 1,109 - 1,109 94.2% - $15,608,100 $1.45
