 KCG Holdings, Inc. (NYSE: KCG) Wells Fargo Asset Managers, Brokers & Exchanges Conference March 19, 2014 Exhibit 99.1 |
 Safe Harbor Certain statements contained herein may constitute "forward-looking statements" within the meaning of the safe harbor provisions of the U.S. Private Securities Litigation Reform Act of 1995. Forward-looking statements are typically identified by words such as "believe," "expect," "anticipate," "intend," "target," "estimate," "continue," "positions," "prospects" or "potential," by future conditional verbs such as "will," "would," "should," "could" or "may," or by variations of such words or by similar expressions. These "forward-looking statements" are not historical facts and are based on current expectations, estimates and projections about KCG's industry, management’s beliefs and certain assumptions made by management, many of which, by their nature, are inherently uncertain and beyond our control. Any forward-looking statement contained herein speaks only as of the date on which it is made. Accordingly, readers are cautioned that any such forward-looking statements are not guarantees of future performance and are subject to certain risks, uncertainties and assumptions that are difficult to predict including, without limitation, risks associated with: (i) the strategic business combination (the “Mergers”) of Knight Capital Group, Inc. ("Knight") and GETCO Holding Company, LLC ("GETCO"), including, among other things, (a) difficulties and delays in integrating the Knight and GETCO businesses or fully realizing cost savings and other benefits, (b) the inability to sustain revenue and earnings growth, and (c) customer and client reactions to the Mergers; (ii) the August 1, 2012 technology issue that resulted in Knight's broker-dealer subsidiary sending numerous erroneous orders in NYSE-listed and NYSE Arca securities into the market and the impact to Knight's capital structure and business as well as actions taken in response thereto and consequences thereof; (iii) the costs and risks associated with the sale of Knight's institutional fixed income sales and trading business, the sale of KCG's reverse mortgage origination and securitization business and the departure of the managers of KCG's listed derivatives group; (iv) changes in market structure, legislative, regulatory or financial reporting rules; (v) past or future changes to organizational structure and management; (vi) KCG's ability to develop competitive new products and services in a timely manner and the acceptance of such products and services by KCG's customers and potential customers; (vii) KCG's ability to keep up with technological changes; (viii) KCG's ability to effectively identify and manage market risk, operational and technology risk, legal risk, liquidity risk, reputational risk, counterparty and credit risk, international risk, regulatory risk, and compliance risk; (ix) the cost and other effects of material contingencies, including litigation contingencies, and any adverse judicial, administrative or arbitral rulings or proceedings; and (x) the effects of increased competition and KCG's ability to maintain and expand market share. The list above is not exhaustive. Readers should carefully review the risks and uncertainties disclosed in KCG's reports with the SEC, including, without limitation, those detailed under “Risk Factors" in KCG’s Annual Report on Form 10-K for the year-ended December 31, 2013, and in other reports or documents KCG files with, or furnishes to, the SEC from time to time. For additional disclosures, please see https://www.kcg.com/legal/global-disclosures. |
 About KCG KCG helps retail and institutional investors efficiently deploy capital in the secondary market. 1 An independent, pure-play trading firm created in mid-2013 through the merger of leading market makers GETCO and Knight Core capabilities in market making, agency execution and trading venues An active participant on global cash, futures and options markets across equities, fixed income, foreign currencies and commodities A focus on delivering best executions for clients and providing best prices on public and private markets |
 Investment Rationale 1. A better model for the emerging competitive landscape 2. A market leader in U.S. equities and developer of advanced technologies driving the shift in trading from analog to digital across asset classes 3. Merger- and integration-related synergies still to be realized plus additional savings from debt reduction 4. Prospects for multiyear organic growth directly from core capabilities 5. Additional anticipated opportunities within core capabilities from the implementation of regulations instituted in response to the global financial crisis of 2008 2 |
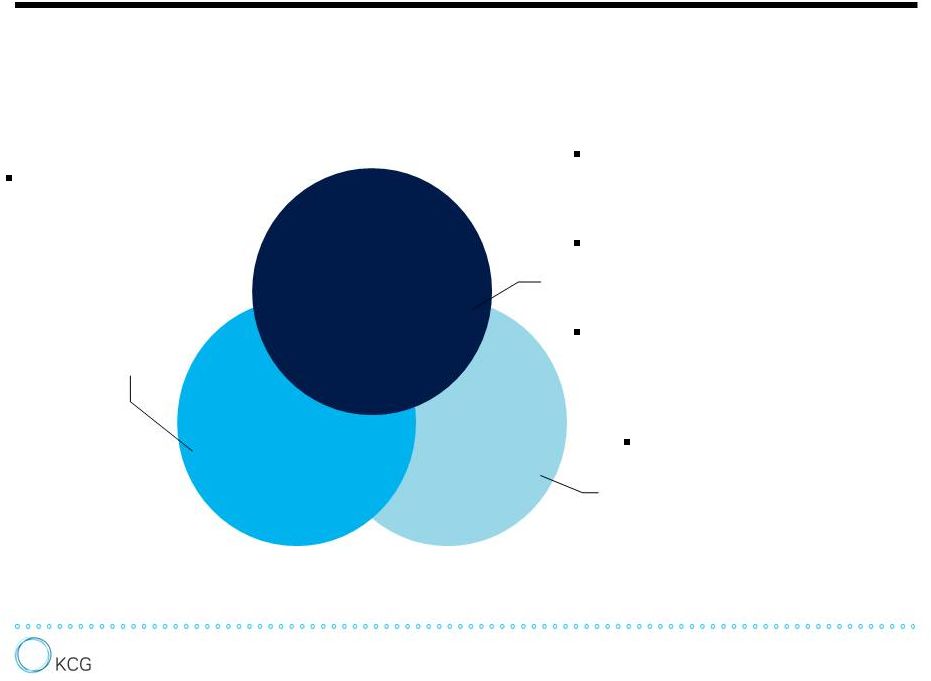
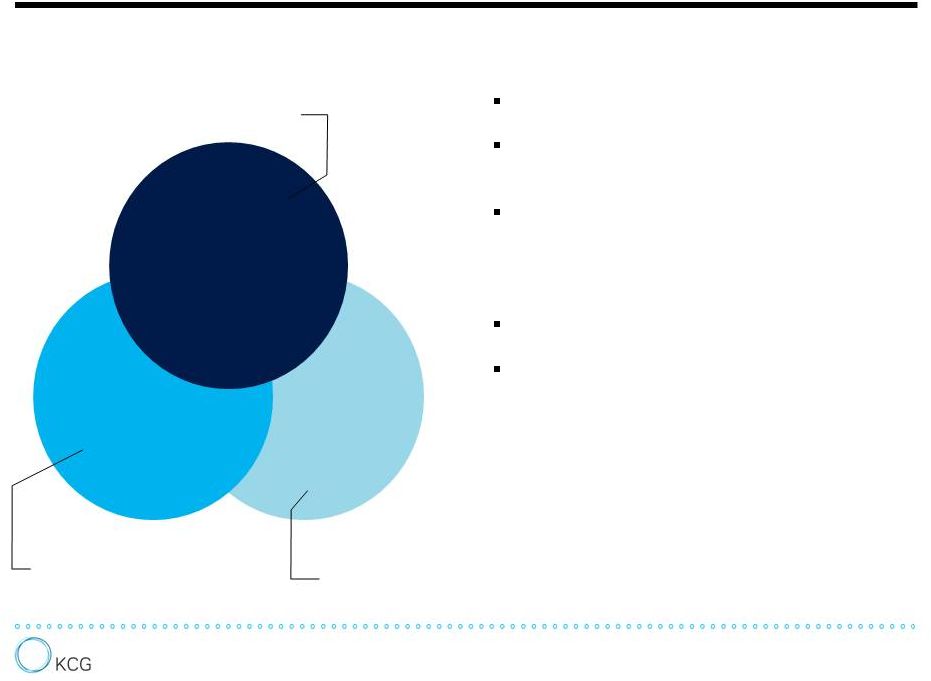 A Better Model Trading Venues Agency Execution Market Making A non-bank execution-only trading firm A broad client network of brokers, institutions and banks Complementary core capabilities across market making, agency execution and trading venues allow for the sharing of intellectual capital, trading technologies and support costs Agile, scalable and well capitalized Well positioned for a coming period of industry transformation driven by competition, technology and further regulation – Greater adoption of electronic trading to enhance price discovery, liquidity, spreads and trading costs – Implementation of rules designed to minimize risks by increasing the accessibility and transparency of certain securities markets and use of clearing corporations Direct-to-client market making and proprietary trading Agency-based algorithms, execution management system (EMS) and equity sales traders FX electronic communications network (ECN), fixed income ECN and alternative trading systems (ATSs) 3 |
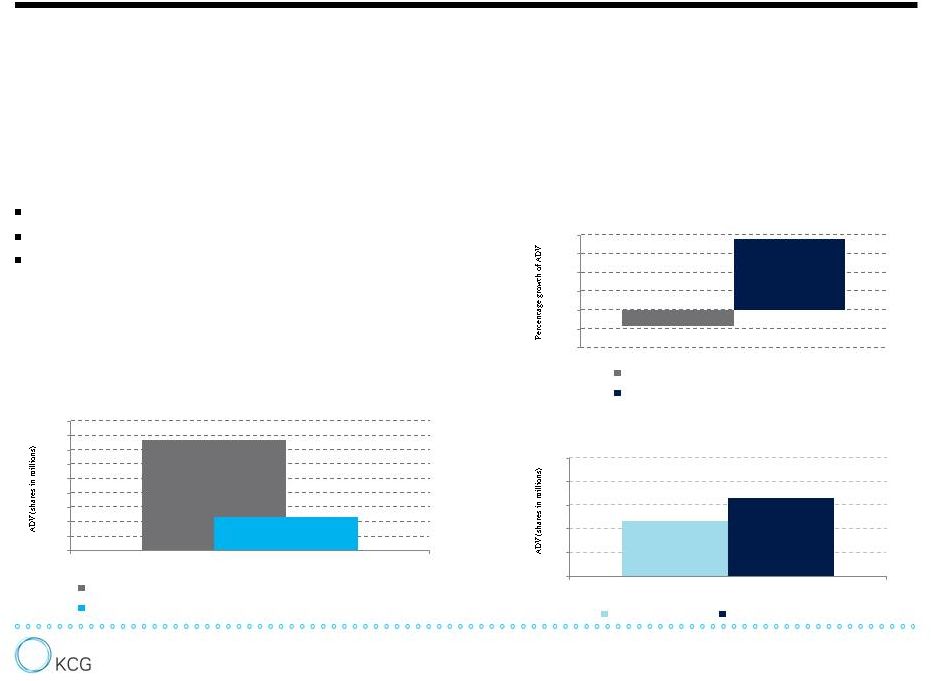 KCG is a market leader in U.S. equities, the most accessible, competitive, technologically-advanced and liquid segment of the global securities markets. KCG participates in the market in three ways: KCG’s technologies drive enhancements in terms of the client offering, market coverage, available liquidity, execution quality, anonymity, trading costs and service. A Technology-Driven Leader in U.S. Equities 4 3.9% 5.5% 0 15 30 45 60 75 2013 KCG ADV and market share of dark pool volume GETMatched (ATS) Knight Match (ATS) 30.1% 0 100 200 300 400 500 600 700 800 900 2013 KCG market making ADV and market share of retail U.S. equity volume Total SEC Rule 605-eligible U.S. equity volume KCG market making SEC Rule 605-eligible U.S. equity volume -4.2% 18.8% -10% -5% 0% 5% 10% 15% 20% Year-over-year growth in ADV from KCG algorithms and EMS Consolidated U.S. equity share volume KCG algorithms and EMS share volume 2013 KCG develops advanced trading technologies in- house for greater connectivity, efficiency and scale. Agency-based trading between principals to transactions Proprietary trading as a liquidity provider Principal trading in a market making capacity Sources: KCG, VistaOne Solutions, BATS Global Markets, Rosenblatt Securities; Trade volumes prior to July 1, 2013 represent combined activity from affiliated broker dealers of GETCO Holding Company, LLC and Knight Capital Group, Inc. |
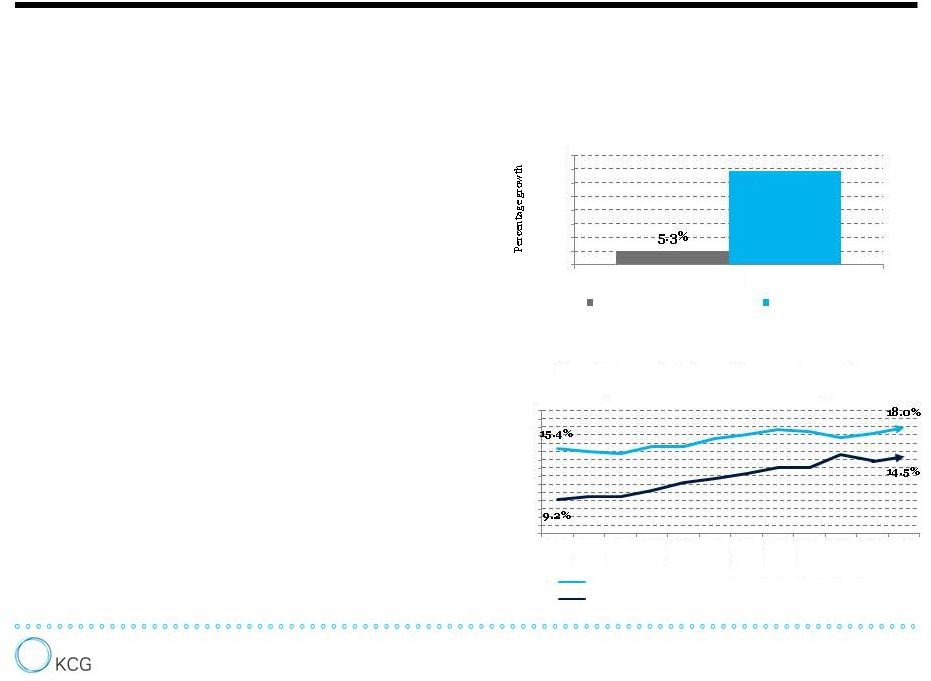 A Growing Presence in Strategic Asset Classes KCG is an active participant in all major global markets for equities, futures, options, fixed income, foreign currencies and commodities. Advanced trading technologies allow KCG to engage in direct-to-client market making and proprietary trading in attractive segments of the global securities market in an efficient manner. KCG Europe deploys the full core capabilities in a region undergoing significant change from market and regulatory forces. Trading venues KCG Hotspot and KCG BondPoint offer clients centralized liquidity, efficient price discovery and cost-effective trading in asset classes that are still-outmoded in terms of technology. KCG intends to continue aggressively seeking opportunities in segments of the market that are predominantly electronic, reasonably liquid and centrally cleared. Sources: KCG, BATS Chi-X Europe, EBS, Reuters, TRACE; Trade volumes prior to July 1, 2013 represent combined activity from affiliated broker dealers of GETCO Holding Company, LLC and Knight Capital Group, Inc. 5 5% 6% 7% 8% 9% 10% 11% 12% 13% 14% 15% 16% 17% 18% 19% 20% Jan 2013 Feb 2013 Mar 2013 Apr 2013 May 2013 Jun 2013 Jul 2013 Aug 2013 Sep 2013 Oct 2013 Nov 2013 Dec 2013 Growth in market share of agency transactions in corporate bonds and institutional spot FX KCG BondPoint market share of corporate bond transactions under 250 bonds KCG Hotspot market share of institutional spot FX volume among reporting venues 34.5% 0% 5% 10% 15% 20% 25% 30% 35% 40% 2013 Year-over-year growth in European equity notional value traded (inUSD) Pan-European Stock Exchanges KCG Europe |
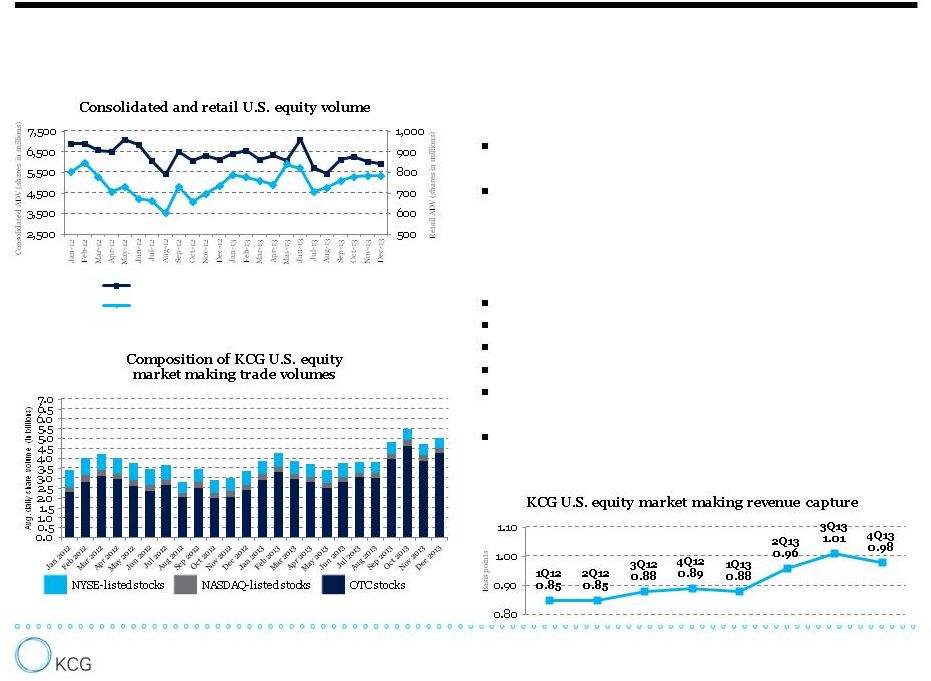 Drivers of Financial Results Sources: KCG, BATS Global Markets, VistaOne Solutions; Trade volumes and revenue capture prior to July 1, 2013 represent combined activity from affiliated broker dealers of GETCO Holding Company, LLC and Knight Capital Group, Inc.; For historical KCG U.S. equity market making trade volumes, go to: https://www.kcg.com/access-performance/liquidity. 6 KCG’s financial results are influenced by a number of factors primarily: clearance fees and payments for order flow Transaction costs including execution and trading strategies The performance of mid- and high-frequency The composition of order flow executed Realized volatility Retail SEC Rule 605-eligible volume Consolidated U.S. equity volume The competitiveness of the client offering and effectiveness of trading strategies For example, factors in KCG’s core U.S. equities market making include: Overall market volumes and related volatility in asset classes in which KCG is an active participant Consolidated U.S equity volume Retail SEC Rule 605-eligible U.S equity volume |
 KCG Risk Management Adverse change in the market value of portfolios and financial instruments caused by a change in market prices, spread, or rates Financial or other loss derived through failure, non-performance or underperformance of a counterparty Risk of loss resulting from inadequate or failed internal processes, systems, human error or external events; includes legal risk and reputational risk that materialize as a consequence of an event Risk of loss resulting from high-speed intra-day activities managed by real-time risk processes and controls including: KCG’s risk management framework provides comprehensive controls and processes for ongoing management and monitoring of the major risks associated with the firm's daily business activities. 7 An Emergency Response Center creating transparency around and managing responses to operational incidents and technology changes during global trading hours Edge controls and kill switches designed to prevent erroneous orders from being submitted to exchanges and ATSs Position limits to control the amount of intra-day as well as end-of-day risk Operational Risk Real-Time Risk Credit Risk Market Risk |
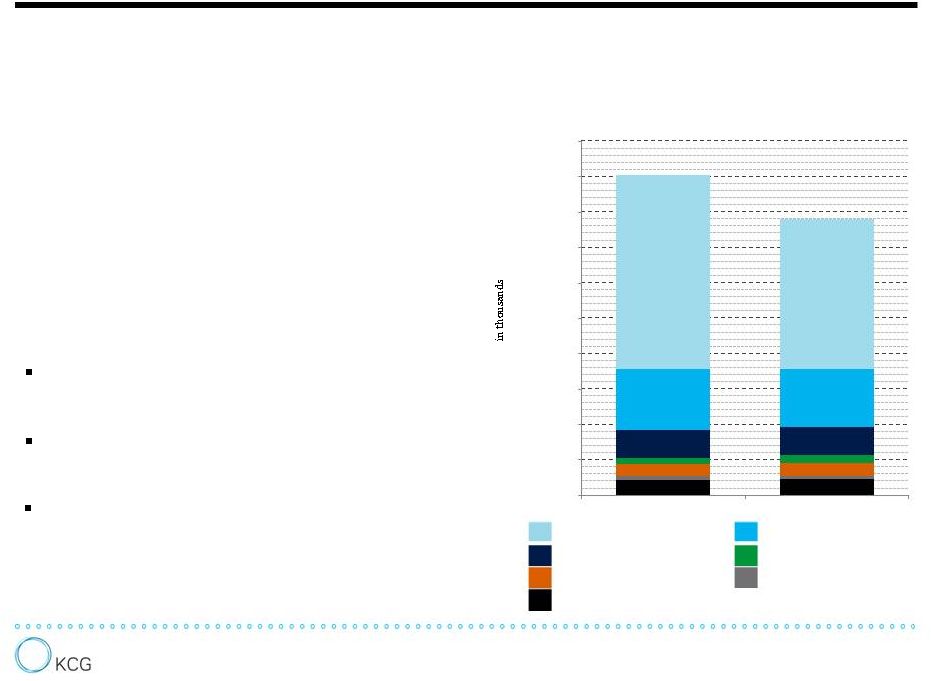 Merger- and Integration-Related Synergies KCG exceeded the upper range of the projected $90 to $110 million in cost synergies on an annualized, run-rate basis by the end of 2013. Additionally, KCG reduced the annual run-rate expense from communications and data processing at the end of the year by more than $20 million to $150 million. Further reductions on a run-rate basis are expected by the end of 2014. The integration of core revenue-generating activities is demonstrating promise: 8 Compensation and benefits Communications and data processing Depreciation and amortization Professional fees Occupancy and equipment rentals Business development Other $0 $50,000 $100,000 $150,000 $200,000 $250,000 $300,000 $350,000 $400,000 $450,000 $500,000 1H13 2H13 KCG Non-GAAP Operating Expenses* (Excluding execution and clearance fees, payments for order flow and interest) In U.S. equity market making, KCG is at work on generating greater revenue opportunities, increasing internalization rates and lowering execution and clearance fees on a relative basis In Europe, KCG completed a restructuring, combined the product portfolios and integrated sales In agency-based algorithms, KCG combined the product portfolios and fully integrated sales with institutional equity sales trading * Operating expenses prior to July 1, 2013 represent consolidated financial results from GETCO Holding Company, LLC and Knight Capital Group, Inc. See Addendum for a reconciliation of GAAP to non-GAAP financial results. |
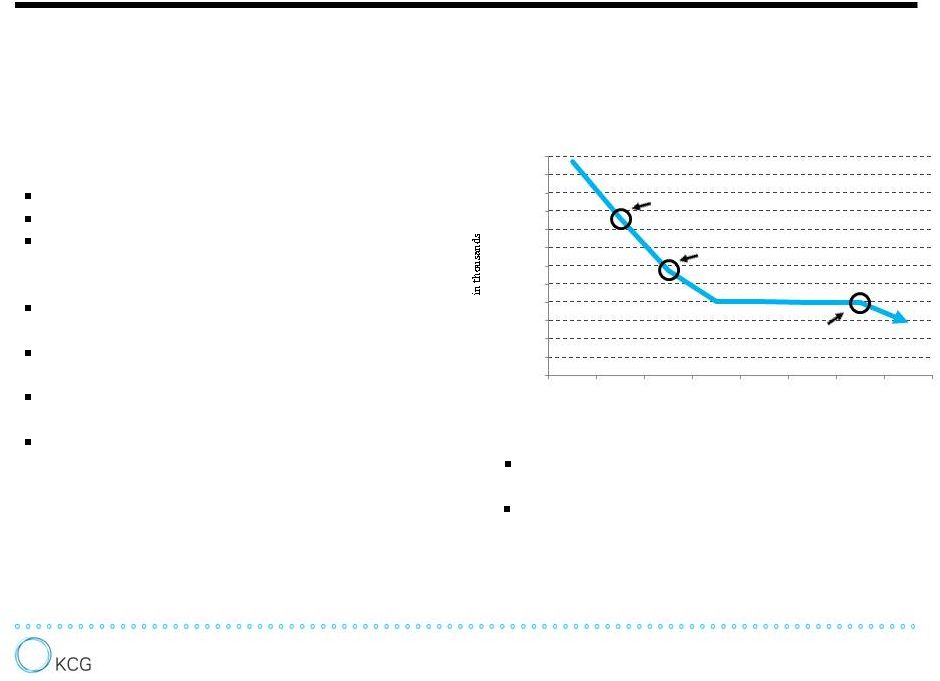 Additional Savings from Debt Reduction Aggregate long- and short-term debt of approximately $957 million as of September 30, 2013 consisting of: $535 million term credit agreement $305 million senior secured notes $117 million legacy Knight convertible notes Subsequent repayments: $200 million repayment of the term credit agreement on October 23, 2013 $100 million repayment of term credit agreement on December 4, 2013 $100 million repayment of term credit agreement on January 22, 2014 $85 million repayment of term credit agreement on March 19, 2014 Future dates to note: $300mn in repayments in 4Q13 Convertible notes mature $185mn in repayments in 1Q14 9 $4,000 $5,000 $6,000 $7,000 $8,000 $9,000 $10,000 $11,000 $12,000 $13,000 $14,000 $15,000 $16,000 3Q13 4Q13 1Q14 2Q14 3Q14 4Q14 1Q15 2Q15 Indicative quarterly interest expense from long- and short-term debt (as of March 19, 2014 assuming no further repayments) 2-year non call on senior secured notes expires June 5, 2015 Legacy Knight convertible notes mature March 15, 2015 |
 Prospects for Growth from Core Capabilities Trading Venues Agency Execution Market Making Generating added revenue opportunities in U.S. equities while increasing internalization rates and lowering execution fees Growing direct-to-client market making in European equities by providing outsourced trade execution to banks Developing, refining and expanding proprietary trading in global equities, fixed income, currencies and commodities Capitalizing on the adoption of electronic trading in markets – including FX and fixed income – that remain largely manual, non- transparent and illiquid Increasing penetration of agency-based algorithms among institutions through continued product innovation and coordinated sales efforts In addition, pursuing new prospects available to a non bank created by the implementation of regulations designed to reduce risk and increase competition in certain securities markets. 10 KCG’s core capabilities offer prospects for multiyear organic growth from both near-term strategic initiatives and medium- to long-term industry trends. |
 Addendum |
 Regulation G Reconciliation of Non-GAAP Financial Measures (Continuing Operations) 6 months ended June 30, 2013 GETCO Knight Discontinued operations** Adjustments for non-GAAP presentation* KCG pro forma Incremental debt and deal costs*** KCG adjusted, normalized pro forma expenses Reconciliation of pro forma GAAP expenses to normalized pro forma non-GAAP expenses: Employee compensation and benefits 108,761 243,070 (15,706) (61,853) 274,272 — 274,272 Execution and clearance fees 86,908 101,881 (5,128) — 183,661 — 183,661 Communications and data processing 41,873 45,377 (412) — 86,838 — 86,838 Interest 2,645 26,325 (2,156) (19) 26,795 12,608 39,403 Depreciation and amortization 15,913 19,632 (1,115) — 34,430 4,444 38,874 Payments for order flow 1,701 64,592 (21,084) — 45,209 — 45,209 Professional fees 30,264 35,438 (945) (55,525) 9,232 — 9,232 Occupancy and equipment rentals 8,184 10,682 (2,495) — 16,371 — 16,371 Business development — 7,730 (1,389) (306) 6,035 — 6,035 Writedown of assets and lease loss accrual 3,697 17,787 (17,787) (3,697) — — — Other 15,039 30,491 (2,351) (23,228) 19,951 1,461 21,412 Total expenses $ 314,985 $ 603,005 $ (70,568) $ (144,628) $ 702,794 $ 18,512 $ 721,306 * Operating expenses prior to July 1, 2013 represent combined financial results from GETCO Holding Company, LLC and Knight Capital Group, Inc. The non-GAAP adjustments incorporate the effects of professional fees related to the Mergers and fees related to Knight's August 1, 2012 technology issue; the acceleration of compensation expense related to certain unit-based awards that vested upon the Mergers; compensation expense related to a reduction in workforce; writedowns of assets and lease loss accrual primarily related to office consolidations. ** In addition to discontinued operations, includes line items reclassifications to adhere to current presentation. *** Incremental debt and deal costs are added in to normalize the comparison to first half results as though the Merger and debt raise occurred on January 1, 2013. Totals may not add due to rounding. 11 |
 Regulation G Reconciliation of Non-GAAP Financial Measures (Continuing Operations) * The non-GAAP adjustments incorporate the effects of professional fees related to the Mergers and fees related to Knight's August 1, 2012 technology issue; compensation expense related to a reduction in workforce and the departure of the ETF management team; writedowns of assets and lease loss accrual primarily related to office consolidations; writedown of capitalized debt costs related to early repayment of debt. Totals may not add due to rounding. 12 6 months ended December 31, 2013 KCG Adjustments for non-GAAP presentation* KCG pro forma Reconciliation of pro forma GAAP expenses to normalized pro forma non-GAAP expenses: Employee compensation and benefits 241,840 (28,851) 212,989 Execution and clearance fees 159,506 — 159,506 Communications and data processing 81,558 — 81,558 Interest 42,140 (2,982) 39,158 Depreciation and amortization 39,657 — 39,657 Payments for order flow 34,674 34,674 Professional fees 16,811 (5,718) 11,093 Occupancy and equipment rentals 18,256 — 18,256 Business development 4,567 (597) 3,970 Writedown of capitalized debt costs 13,209 (13,209) — Writedown of assets and lease loss accrual 11,436 (11,436) — Other 24,384 (756) 23,628 Total expenses $ 688,038 $ (63,550) $ 624,488 — |
 |