 KCG Holdings, Inc. (NYSE: KCG) Sandler O’Neill Global Exchange & Brokerage Conference June 4, 2014 Exhibit 99.1 |
 Safe Harbor Certain statements contained herein may constitute "forward-looking statements" within the meaning of the safe harbor provisions of the U.S. Private Securities Litigation Reform Act of 1995. Forward-looking statements are typically identified by words such as "believe," "expect," "anticipate," "intend," "target," "estimate," "continue," "positions," "prospects" or "potential," by future conditional verbs such as "will," "would," "should," "could" or "may," or by variations of such words or by similar expressions. These "forward-looking statements" are not historical facts and are based on current expectations, estimates and projections about KCG's industry, management’s beliefs and certain assumptions made by management, many of which, by their nature, are inherently uncertain and beyond our control. Any forward-looking statement contained herein speaks only as of the date on which it is made. Accordingly, readers are cautioned that any such forward-looking statements are not guarantees of future performance and are subject to certain risks, uncertainties and assumptions that are difficult to predict including, without limitation, risks associated with: (i) the strategic business combination (the “Mergers”) of Knight Capital Group, Inc. ("Knight") and GETCO Holding Company, LLC ("GETCO"), including, among other things, (a) difficulties and delays in integrating the Knight and GETCO businesses or fully realizing cost savings and other benefits, (b) the inability to sustain revenue and earnings growth, and (c) customer and client reactions to the Mergers; (ii) the August 1, 2012 technology issue that resulted in Knight's broker-dealer subsidiary sending numerous erroneous orders in NYSE-listed and NYSE Arca securities into the market and the impact to Knight's capital structure and business as well as actions taken in response thereto and consequences thereof; (iii) the costs and risks associated with the sale of Knight's institutional fixed income sales and trading business, the sale of KCG's reverse mortgage origination and securitization business and the departure of the managers of KCG's listed derivatives group; (iv) changes in market structure, legislative, regulatory or financial reporting rules, including the increased focus by regulators, the New York Attorney General, Congress and the media on market structure issues, and in particular, the scrutiny of high frequency trading, market fragmentation, colocation, access to market data feeds, and remuneration arrangements such as payment for order flow and exchange fee structures; (v) past or future changes to organizational structure and management; (vi) KCG's ability to develop competitive new products and services in a timely manner and the acceptance of such products and services by KCG's customers and potential customers; (vii) KCG's ability to keep up with technological changes; (viii) KCG's ability to effectively identify and manage market risk, operational and technology risk, legal risk, liquidity risk, reputational risk, counterparty and credit risk, international risk, regulatory risk, and compliance risk; (ix) the cost and other effects of material contingencies, including litigation contingencies, and any adverse judicial, administrative or arbitral rulings or proceedings; and (x) the effects of increased competition and KCG's ability to maintain and expand market share. The list above is not exhaustive. Readers should carefully review the risks and uncertainties disclosed in KCG's reports with the SEC, including, without limitation, those detailed under "Risk Factors" in KCG’s Annual Report on Form 10-K for the year-ended December 31, 2013, and other reports or documents KCG files with, or furnishes to, the SEC from time to time. For additional disclosures, please see https://www.kcg.com/legal/global-disclosures. |
 Investment Rationale 1. A better model for the emerging competitive landscape – agile, scalable, pure-play, execution-only, non-bank 2. A developer of advanced technologies driving the shift in trading from analog to digital across asset classes, creating efficiencies for all market participants 3. Additional integration-related revenue and cost synergies yet to be realized 4. Prospects for multiyear organic growth directly from core capabilities 5. Further growth opportunities from the implementation of regulations instituted in response to the global financial crisis of 2008 1 |
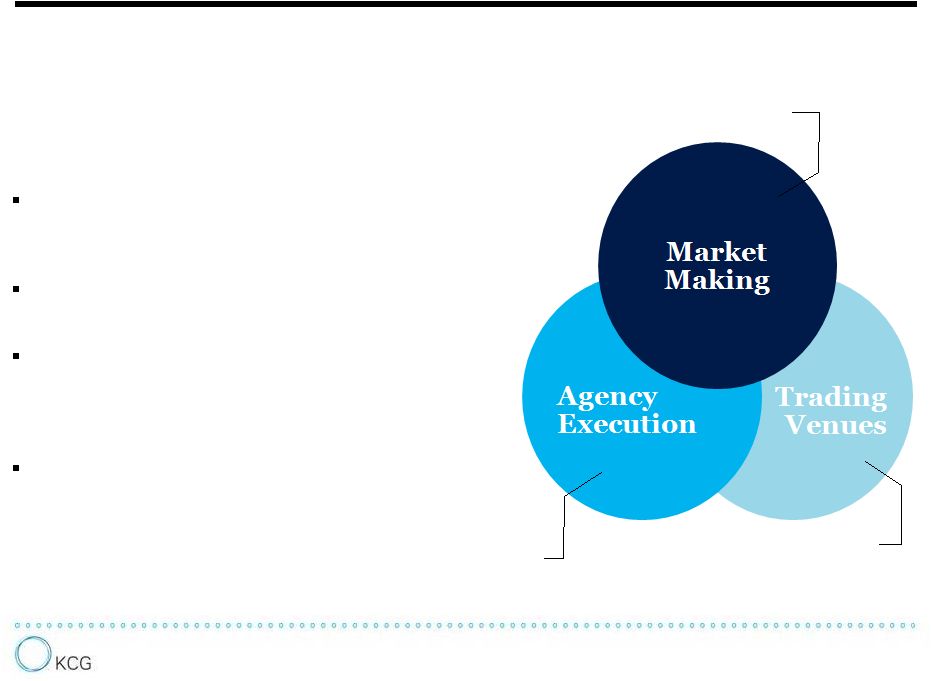 KCG helps retail and institutional investors efficiently deploy capital in the secondary market. An independent securities firm created in mid- 2013 through the merger of leading market makers GETCO and Knight Complementary core capabilities in market making, agency execution and trading venues A market leader in U.S. equities and active in cash, futures and options markets across global equities, fixed income, currencies and commodities A focus on delivering best executions for clients and providing best prices on public and private markets The KCG Model Direct-to-client and non-client, exchange-based market making Agency-based trading on behalf of clients Agency-based trading between principals to transactions 2 |
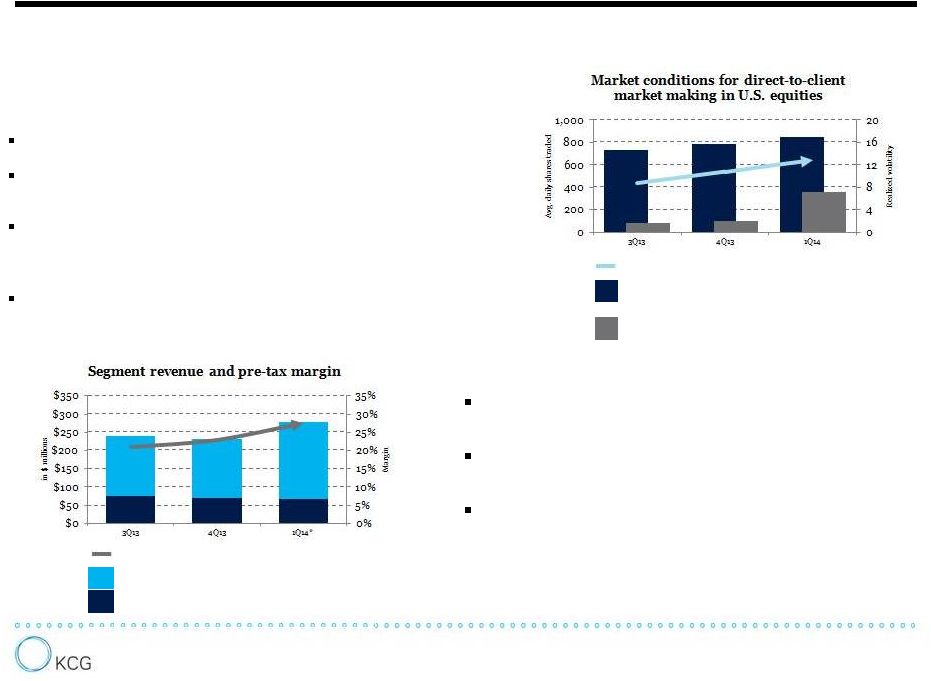 The Market Making Segment Direct-to-client market making A leading wholesale market maker in U.S. equities Primary clients include retail brokers, banks and bulge brackets Offer immediate, high-quality trade executions across the U.S. equity market as well as in listed options, European equities, U.S. Treasuries and FX (beta testing) Anticipated future growth in European equities by providing banks with outsourced trade execution Non-client, exchange-based market making A provider of best prices for buy and sell orders on market centers Active globally in select asset classes that are largely electronic, fairly liquid and centrally cleared Anticipated future growth from the modernization of markets for global equities, fixed income, currencies and commodities Sources: KCG, VistaOne Solutions, OTC Markets, Bloomberg; See addendum for a reconciliation of GAAP to non-GAAP financial results; * Results for the Market Making segment in 1Q14 include a debt interest charge of $7.2 million which represents a portion of aggregate corporate debt interest that had not been allocated to the segment in previous quarters 3 Pre-tax margin Market Making revenue from U.S. equities Market making revenue from global equities, options, futures, fixed income, currencies and commodities Realized volatility for the S&P 500 SEC Rule 605-eligible retail exchange-listed volume (in millions) OTC market volume (in billions) |
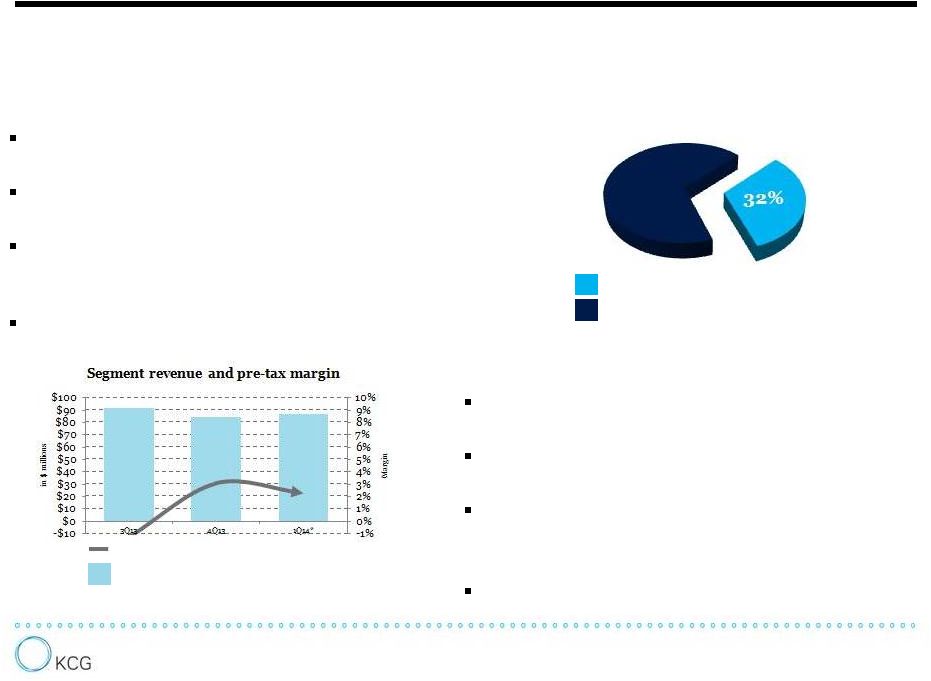 The Global Execution Services Segment Sources: KCG, Greenwich Associates, McLagan’s, TABB Group; See addendum for a reconciliation of GAAP to non-GAAP financial results; * Results for the Global Execution Services segment in 1Q14 include a debt interest charge of $2.4 million which represents a portion of aggregate corporate debt interest that had not been allocated to the segment in previous quarters; † KCG’s strategic investment in BATS Global Markets, Inc. is contained in the Corporate and Other segment Agency execution An institutional, agency-based, execution-only broker in global equities Primary clients include mutual funds, hedge funds and pension funds Offer self-directed trading through algorithms and an EMS as well as access to sales traders for complex trades Anticipated future growth from increasing usage of KCG algorithms among the leading asset managers Trading venues An operator of multi-asset class marketplaces in global equities, FX and fixed income Offer market access, broad coverage, effective price discovery, liquidity and cost effective trading Anticipated future growth from the modernization of markets – in particular FX and fixed income – that remain manual, non-transparent and illiquid A 16.7% stake in global exchange BATS † 4 Pre-tax margin Global Execution Services revenue Estimated allocation of projected $11b in institutional U.S. equity commissions in 2014 Execution only Research, capital commitment, commission sharing agreements, commission recapture and other |
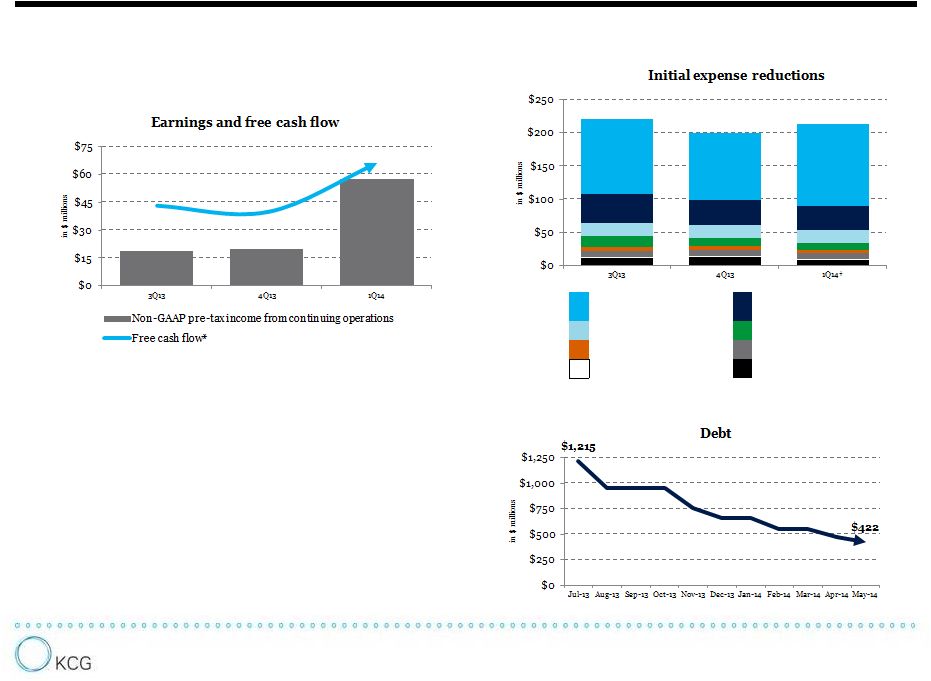 KCG balance sheet (in $ millions) As of March 31, 2014 Cash and cash equivalents 651.1 Liquidity buffer ‡ 350.0 Debt ‡‡ 472.3 Stockholders’ equity 1,566.2 --- Debt-to-tangible equity ratio 0.35 --- Book value per share $12.46 Tangible book value per share $10.85 See addendum for a reconciliation of GAAP to non-GAAP financial results; * Free cash flow represents income from continuing operations less capital expenditures plus non-cash items such as depreciation and amortization, stock-based compensation and non-GAAP adjustments included in the Regulation G tables; Expenses for 3Q13, 4Q13 and 1Q14 exclude items contained in the Regulation G tables; ‡ The liquidity buffer is a targeted amount that represents cash and other highly liquid instruments held within the holding company and our domestic broker-dealer to support financial obligations in normal and strained funding environments; ‡‡ Subsequent to the first quarter of 2014, KCG completed an additional $50 million principal repayment on the $535 million first lien term loan entered into on July 1, 2013 to fully repay the loan and terminate the facility ahead of the December 5, 2017 maturity date Consolidated Financials 5 Compensation and benefits Communications and data processing Depreciation and amortization Debt interest expense Professional fees Occupancy and equipment rentals Business development Other † An increase in compensation from 4Q13 to 1Q14 was driven by higher revenues and seasonal expenses. Excluding compensation and execution-based costs, all other expenses declined to $90.4 million in 1Q14 from $99.3 million in 4Q13 and $108.2 million in 3Q13. |
 |
 Addendum |
 3 months ended March 31, 2014 Market Making Global Execution Services Corporate and Other Consolidated Reconciliation of GAAP pre-tax to non-GAAP pre-tax: GAAP income (loss) from continuing operations before income taxes $ 76,032 $ 2,016 $ (18,664) $ 59,384 Writedown of capitalized debt costs - - 7,557 7,557 Income resulting from the merger of BATS and Direct Edge, net - - (9,644) (9,644) Writedown of assets and lease loss accrual, net 359 - (93) 266 Non-GAAP income (loss) from continuing operations before income taxes $ 76,391 $ 2,016 $ (20,844) $ 57,563 3 months ended December 31, 2013 Market Making Global Execution Services Corporate and Other Consolidated Reconciliation of GAAP pre-tax to non-GAAP pre-tax: GAAP income (loss) from continuing operations before income taxes $ 47,951 $ (4,491) $ (60,159) $ (16,699) Compensation and other expenses related to reduction in workforce 5,254 5,447 708 11,409 Professional and other fees related to Mergers and August 1 technology issue - - 2,785 2,785 Writedown of capitalized debt costs - - 13,209 13,209 Gain on strategic asset - - (1,359) (1,359) Writedown of assets and lease loss accrual - 1,681 8,819 10,500 Non-GAAP income (loss) from continuing operations before income taxes $ 53,205 $ 2,637 $ (35,997) $ 19,845 Regulation G Reconciliation of Non-GAAP Financial Measures (Continuing Operations) st |
 3 months ended September 30, 2013 Market Making Global Execution Services Corporate and Other Consolidated Reconciliation of GAAP pre-tax to non-GAAP pre-tax: GAAP income (loss) from continuing operations before income taxes $ 47,853 $ (16,354) $ 89,874 $ 121,373 Gain on investment in Knight Capital Group, Inc. - - (127,972) (127,972) Compensation and other expenses related to reduction in workforce 2,309 15,132 - 17,441 Professional and other fees related to Mergers and August 1 technology issue - - 7,269 7,269 Writedown of assets and lease loss accrual, net 108 - 828 936 Non-GAAP income (loss) from continuing operations before income taxes $ 50,270 $ (1,222) $ (30,001) $ 19,048 Regulation G Reconciliation of Non-GAAP Financial Measures (Continuing Operations) st |
 3 months ended March 31, 2014 GAAP Adjustments for non-GAAP presentation KCG adjusted, normalized expenses Reconciliation of pro forma GAAP expenses to normalized pro forma non-GAAP expenses: Employee compensation and benefits 122,319 - 122,319 Communications and data processing 36,796 - 36,796 Depreciation and amortization 20,103 - 20,103 Debt interest expense 9,524 - 9,524 Professional fees 5,402 - 5,402 Occupancy and equipment rentals 8,285 - 8,285 Business development 1,683 - 1,683 Writedown of assets, lease loss accrual and capitalized deal costs 7,823 7,823 - Other 8,643 - 8,643 Total expenses $ 220,578 $ 7,823 $ 212,755 Regulation G Reconciliation of Non-GAAP Financial Measures (Continuing Operations) |
 Regulation G Reconciliation of Non-GAAP Financial Measures (Continuing Operations) 3 months ended December 31, 2013 GAAP Adjustments for non-GAAP presentation KCG adjusted, normalized expenses Reconciliation of pro forma GAAP expenses to normalized pro forma non-GAAP expenses: Employee compensation and benefits 112,209 11,409 100,800 Communications and data processing 37,512 - 37,512 Depreciation and amortization 19,566 - 19,566 Debt interest expense 12,943 - 12,943 Professional fees 7,734 2,491 5,243 Occupancy and equipment rentals 9,358 - 9,358 Business development 1,923 - 1,923 Writedown of assets, lease loss accrual and capitalized deal costs 23,709 23,709 - Other 13,066 294 12,772 Total expenses $ 238,020 $ 37,903 $ 200,117 |
 Regulation G Reconciliation of Non-GAAP Financial Measures (Continuing Operations) 3 months ended September 30, 2013 GAAP Adjustments for non-GAAP presentation KCG adjusted, normalized expenses Reconciliation of pro forma GAAP expenses to normalized pro forma non-GAAP expenses: Employee compensation and benefits 129,631 17,441 112,190 Communications and data processing 44,046 - 44,046 Depreciation and amortization 20,091 - 20,091 Debt interest expense 19,350 2,982 16,368 Professional fees 9,077 4,087 4,990 Occupancy and equipment rentals 8,898 - 8,898 Business development 2,644 200 2,444 Writedown of assets, lease loss accrual and capitalized deal costs 936 936 - Other 11,318 - 11,318 Total expenses $ 245,991 $ 25,647 $ 220,345 |
 |