![]() KCG Holdings, Inc. (NYSE: KCG) 2 Quarter 2014 Earnings Presentation August 1, 2014 nd Exhibit 99.2 |
![]() Safe Harbor Certain statements contained herein may constitute “forward-looking statements” within the meaning of the safe harbor provisions of the U.S. Private Securities Litigation Reform Act of 1995. Forward-looking statements are typically identified by words such as “believe,” “expect,” “anticipate,” “intend,” “target,” “estimate,” “continue,” “positions,” “prospects” or “potential,” by future conditional verbs such as “will,” “would,” “should,” “could” or “may,” or by variations of such words or by similar expressions. These “forward-looking statements” are not historical facts and are based on current expectations, estimates and projections about KCG’s industry, management’s beliefs and certain assumptions made by management, many of which, by their nature, are inherently uncertain and beyond our control. Any forward-looking statement contained herein speaks only as of the date on which it is made. Accordingly, readers are cautioned that any such forward-looking statements are not guarantees of future performance and are subject to certain risks, uncertainties and assumptions that are difficult to predict including, without limitation, risks associated with: (i) the strategic business combination (the “Mergers”) of Knight Capital Group, Inc. (“Knight”) and GETCO Holding Company, LLC (“GETCO”), including, among other things, (a) difficulties and delays in integrating the Knight and GETCO businesses or fully realizing cost savings and other benefits, (b) the inability to sustain revenue and earnings growth, and (c) customer and client reactions to the Mergers; (ii) the August 1, 2012 technology issue that resulted in Knight’s broker-dealer subsidiary sending numerous erroneous orders in NYSE-listed and NYSE Arca securities into the market and the impact to Knight’s capital structure and business as well as actions taken in response thereto and consequences thereof; (iii) the sale of KCG’s reverse mortgage origination and securitization business and the departure of the managers of KCG’s listed derivatives group; (iv) changes in market structure, legislative, regulatory or financial reporting rules, including the increased focus by regulators, the New York Attorney General, Congress and the media on market structure issues, and in particular, the scrutiny of high frequency trading, alternative trading systems, market fragmentation, colocation, access to market data feeds, and remuneration arrangements such as payment for order flow and exchange fee structures; (v) past or future changes to organizational structure and management; (vi) KCG’s ability to develop competitive new products and services in a timely manner and the acceptance of such products and services by KCG’s customers and potential customers; (vii) KCG’s ability to keep up with technological changes; (viii) KCG’s ability to effectively identify and manage market risk, operational and technology risk, legal risk, liquidity risk, reputational risk, counterparty and credit risk, international risk, regulatory risk, and compliance risk; (ix) the cost and other effects of material contingencies, including litigation contingencies, and any adverse judicial, administrative or arbitral rulings or proceedings; and (x) the effects of increased competition and KCG’s ability to maintain and expand market share. The list above is not exhaustive. Readers should carefully review the risks and uncertainties disclosed in KCG’s reports with the SEC, including, without limitation, those detailed under “Risk Factors” in KCG’s Annual Report on Form 10-K for the year-ended December 31, 2013, under “Certain Factors Affecting Results of Operations” in KCG’s Quarterly Report on Form 10-Q for the period ended March 31, 2014, and other reports or documents KCG files with, or furnishes to, the SEC from time to time. For additional disclosures, please see https://www.kcg.com/legal/global-disclosures. |
![]() 2nd Quarter 2014 Summary KCG financial results affected by the deterioration in market conditions across asset classes Strong revenue capture per U.S. equity dollar value traded in market making despite the market conditions Modest market share gains across market making, agency execution and trading venues Added quantitative-based trading strategy and analysis to the client offering Combined primary U.K. broker dealers Named Phil Allison CEO of KCG Europe Limited* Completed an additional $50 million debt repayment Repurchased 4.5 million shares for $52.9 million 1 * Employment commences September 22, 2014 |
![]() Market Conditions 2 Market conditions reflect the continuing after effects of the 2008 financial crisis Sources: BATS Global Markets, VistaOne Solutions, OCC, CSI, Bloomberg, Reuters, EBS, SIFMA, TRACE, MSRB; * 2Q14 SEC Rule 605 share volume includes an estimate of June 2014 data based on proprietary information - Reduced trading activity among global banks in response to the implementation of new regulations - Dampened volatility from more than four years of near zero interest rates - Avg. daily consolidated U.S. equity volume declined 13% while retail share volume fell approximately 20% and realized volatility for the S&P 500 averaged just 9.2 In 2Q14, global markets posted sequential declines across several major asset classes Avg. daily volume in select securities markets 2Q13 3Q13 4Q13 1Q14 2Q14 Consolidated U.S. equity dollar volume $232.4 bn $207.8 bn $229.8 bn $275.8 bn $242.8 bn Consolidated U.S. equity share volume 6.5 bn 5.8 bn 6.1 bn 6.9 bn 6.1 bn SEC Rule 605 “retail” U.S. equity share volume* 801.1 mn 730.2 mn 783.0 mn 854.1 mn 686.3 mn U.S. equity futures contracts 3.6 mn 2.7 mn 2.2 mn 2.9 mn 2.3 mn U.S. options contracts 17.5 mn 15.0 mn 16.2 mn 17.9 mn 15.8 mn European equity notional value traded (USD) $950 bn $906 bn $944 bn $1,197 bn $1,080 bn Asian equity share volume 8.9 bn 7.9 bn 7.2 bn 7.4 bn 6.1 bn FX notional value traded (USD) among reporting venues $264.3 bn $222.0 bn $202.5 bn $232.2 bn $189.4 bn U.S. Treasuries $583.4 bn $520.9 bn $520.7 bn $522.1 bn $490.7 bn U.S. corporate bonds $19.2 bn $16.5 bn $17.1 bn $20.8 bn $20.2 bn Transactions under 250 bonds 14,653 13,578 13,011 13,334 12, 372 Market conditions in U.S. equities 15,000 12,500 10,000 7,500 5,000 2,500 90 75 60 45 30 15 0 Realized volatility for the S&P 500 Consolidated U.S. equity share volume 0 |
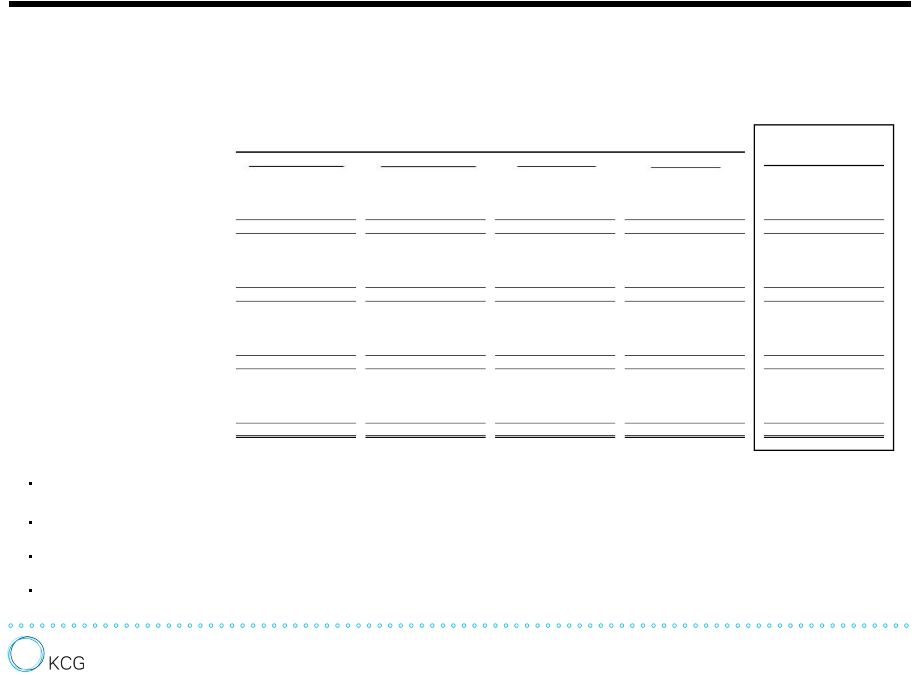
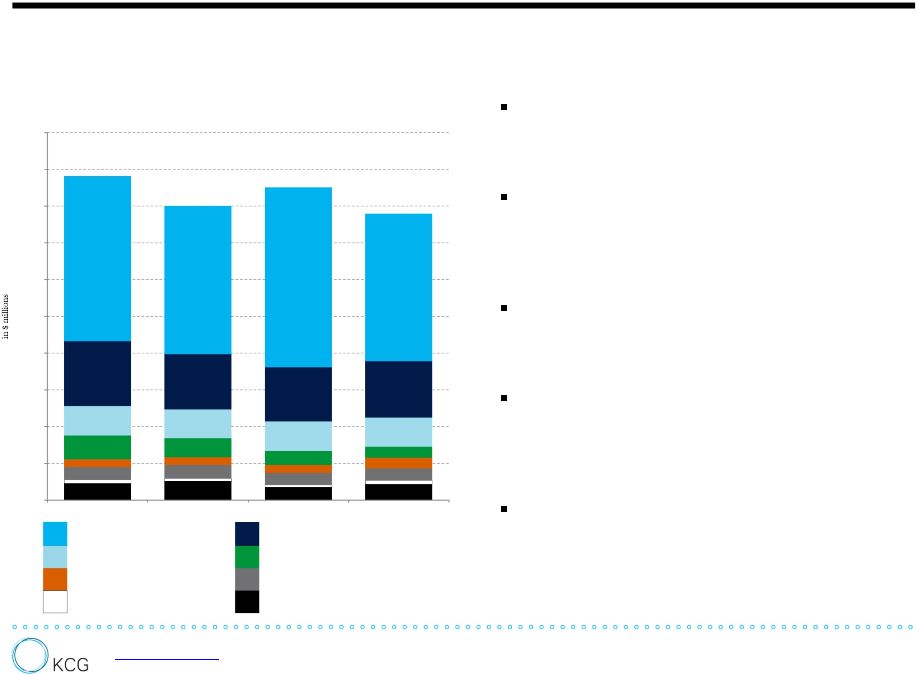
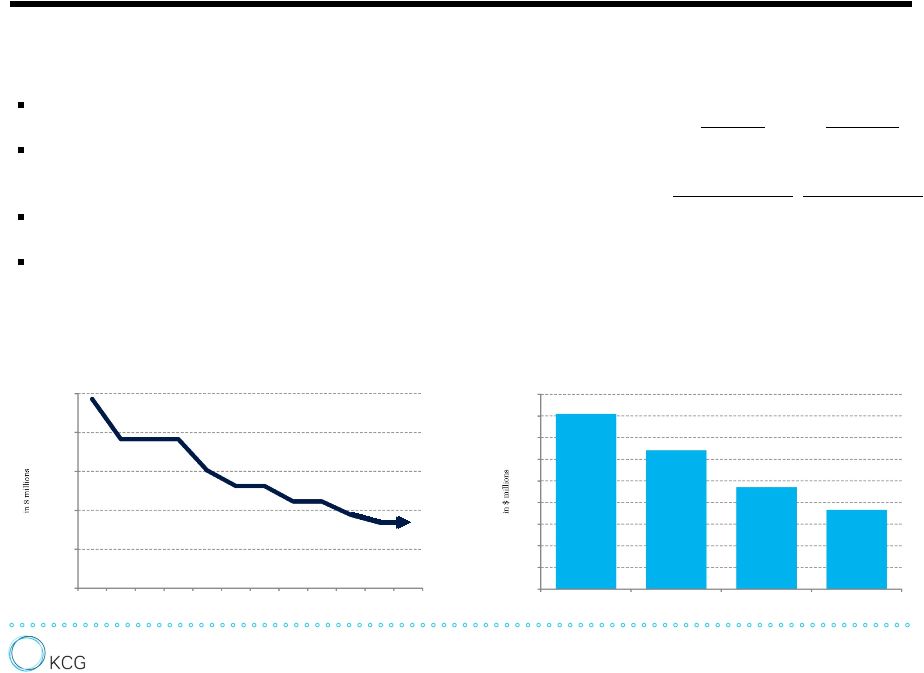
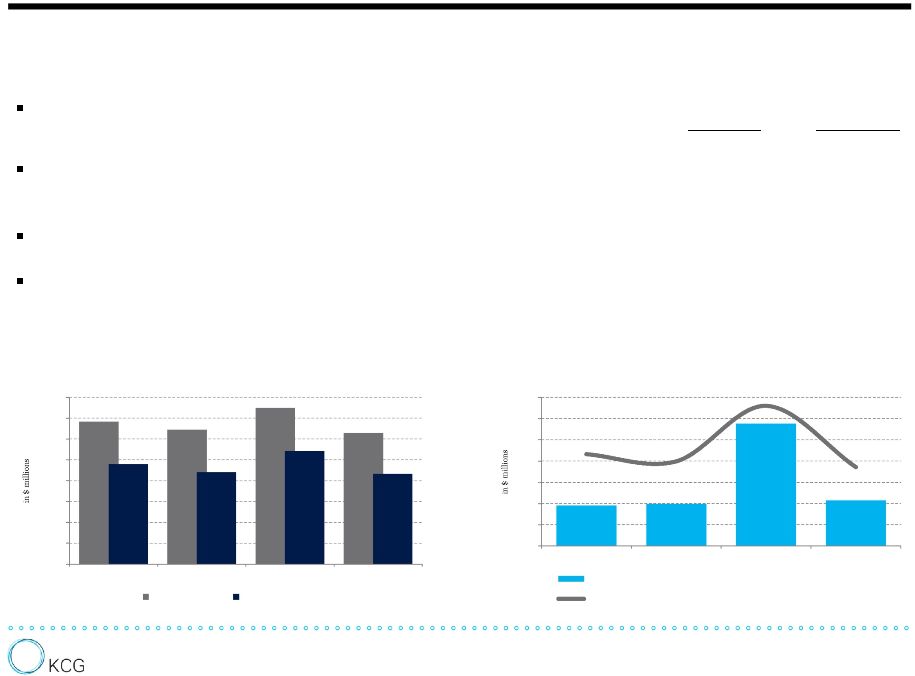
![]() KCG Financial Results Pre-Tax Earnings (Loss) from Continuing Operations By Business Segment (in thousands) (unaudited) Market Making Revenues Expenses Pre-tax earnings Global Execution Services Revenues Expenses Pre-tax earnings Corporate and Other Revenues Expenses Pre-tax earnings Consolidated Revenues Expenses Pre-tax earnings 3 For the three months ended December 31, 2013 March 31, 2014 For the trailing four quarters ended June 30, 2014 240,110 192,257 47,853 $ 91,366 107,720 (16,354) 137,862 47,988 89,874 469,338 347,965 121,373 $ 232,519 47,951 84,065 88,557 (4,491) 6,790 66,949 (60,159) 323,374 340,075 (16,699) 184,569 $ $ 277,346 76,032 87,220 85,204 2,016 19,091 37,755 (18,664) 383,657 324,273 59,384 201,314 $ $ 218,446 36,004 85,903 85,167 736 9,784 (22,233) 314,133 299,626 14,507 182,442 32,017 $ $ 968,421 207,840 348,554 366,648 (18,093) 173,527 184,709 (11,182) 1,490,502 1,311,939 178,563 760,582 $ $ 3rd quarter 2013 results include a gain of $128.0 million on GETCO’s investment in Knight as well as expenses of $25.6 million related to the merger, integration and reduction in workforce 4th quarter 2013 results include a gain of $1.4 million on a strategic asset as well as expenses of $37.9 million related to the merger, integration, reduction in workforce and debt reduction 1st quarter 2014 results include a gain of $9.6 million from the merger of BATS and Direct Edge as well as expenses of $7.8 million related to the merger, integration and debt reduction 2nd quarter 2014 results include expenses of $7.0 million related to the integration, reduction in workforce and debt reduction June 30, 2014 September 30, 2013 Notes: |
![]() Market Making U.S. equities Non-U.S. equities Market Making revenue distribution (trailing four quarters ended June 30, 2014) 4 Sources: KCG, SEC, VistaOne Solutions; KCG dollar volume and revenue capture prior to July 1, 2013 represent combined activity from affiliated broker dealers of GETCO Holding Company, LLC and Knight Capital Group, Inc. 0 4 8 12 16 20 0 200 400 600 800 1,000 2Q13 3Q13 4Q13 1Q14 2Q14 Retail trading activity and realized volatility SEC Rule 605 -eligible "retail" U.S equity share volume Realized volatility for the S&P 500 0.85 0.85 0.88 0.89 0.88 0.96 1.01 0.98 1.26 1.07 0.50 0.60 0.70 0.80 0.90 1.00 1.10 1.20 1.30 1.40 $0 $5 $10 $15 $20 $25 $30 $35 $40 $45 1Q12 2Q12 3Q12 4Q12 1Q13 2Q13 3Q13 4Q13 1Q14 2Q14 KCG dollar volume and revenue capture Avg. daily dollar volume Avg. revenue capture per dollar value traded 73% 27% KCG performed well in 2Q14 despite the abrupt market wide decline qoq in retail U.S. equity market volume as well as realized volatility - KCG dollar volume declined 8% qoq compared to a 12% decrease for the consolidated U.S. equity market - Avg. revenue capture per dollar value traded remained strong despite the market conditions - Modest market share gains in both retail and consolidated U.S. equity volume Contributions from market making in global equities and FICC negatively affected by the market conditions |
![]() Global Execution Services KCG revenue from agency execution and trading venues in 2Q14 largely static qoq despite the deterioration in market conditions Adjustments and enhancements to institutional equities are demonstrating results 5 Sources: KCG, BATS Global Markets, Reuters, EBS, TRACE, MSRB; KCG algorithmic services ADV and market share prior to July 1, 2013 represent combined activity from affiliated broker dealers of GETCO Holding Company, LLC and Knight Capital Group, Inc. 4.22% 4.68% 4.20% 4.05% 4.38% 3.50% 3.65% 3.80% 3.95% 4.10% 4.25% 4.40% 4.55% 4.70% 4.85% 5.00% 200 220 240 260 280 300 2Q13 3Q13 4Q13 1Q14 2Q14 KCG algorithmic services ADV and market share Avg. daily U.S. equity share volume Pct. (%) of consolidated U.S. equity volume - More effective alignment of institutional equity sales - Improved performance of global ETF team - KCG algorithmic services gained market share in U.S. and European equities KCG BondPoint continued to steadily gain market share in corporates and munis KCG Hotspot ADV and market share KCG BondPoint ADV and market share 17% 15% 13% 11% 9% 7% 2Q13 3Q13 4Q13 1Q14 2Q14 Avg. daily notional FX dollar volume 2Q13 3Q13 4Q13 1Q14 2Q14 $20 $24 $28 $32 $36 $40 $0 $8 $12 $16 $4 Market share of notional FX dollar volume among reporting venues Market share of muni bond transactions under 250 bonds Market share of corporate bond transactions under 250 bonds Avg. daily fixed income par value traded 11.11% 12.82% 14.33% 13.88% 13.83% $90 $105 $120 $135 $150 $165 2.5% 5.0% 12.5% 15.0% 17.5% 25.0% 22.5% 20.0% 10.0% 7.5% 0.0% 15.9% 17.4% 17.3% 18.2% 18.6% 3.8% 4.6% 4.9% 5.8% 6.4% |
![]() International KCG is well positioned for adjacent growth in Europe where the firm is underpenetrated A rapidly shifting landscape in Europe presents numerous opportunities aligned with KCG strengths 6 Global revenue distribution (trailing four quarters ended June 30, 2014) Pct. growth of KCG algorithmic services European equity notional value traded 0% 50% 100% 150% 200% 250% 2Q13 3Q13 4Q13 1Q14 2Q14 87% 9% 4% Americas Europe Asia – Redrew reporting lines, consolidated European equities sales, moved into the top 15 broker ranking in 2H13 and recently named a CEO for the region* – In discussions with banks to provide outsourced trade execution in U.S. and European equities – European institutions increasing usage of algorithms to execute orders First half 2014 broker ranking in the Stoxx Europe 600 Index Rank Broker Pct. (%) of notional value traded 1 Credit Suisse 12.3% 2 Morgan Stanley 11.1% 3 Deutsche Bank 9.2% 4 Merrill Lynch 7.7% 5 JP Morgan 7.6% 6 Barclays Capital 7.0% 7 Citigroup 6.6% 8 Société Général 6.1% 9 UBS 4.8% 10 Instinet 3.9% 11 Goldman Sachs 3.7% 12 HSBC 2.1% 13 KCG 1.7% 14 Exane 1.4% 15 RBC 1.0% Sources: Bloomberg, KCG; KCG algorithmic services ADV and market share prior to July 1, 2013 represent combined activity from affiliated broker dealers of GETCO Holding Company, LLC and Knight Capital Group, Inc.; * Employment commences September 22, 2014 |
![]() Consolidated Expenses Decrease in compensation and benefits driven by a nearly 14% reduction in headcount in the first year of operation Initial reduction in communications and data processing of approximately $23.5 million* on an annualized run-rate basis since the merger close Cut the quarterly debt interest expense by more than 50% as a result of a series of debt repayments Decline in occupancy and equipment rentals expense of 10% from 2H13 to 1H14 attributable to the consolidation of offices in Chicago and London Other expenses can vary based on corporate insurance costs, recruiting fees, moving costs and general office expenses 7 Compensation and benefits Communications and data processing Depreciation and amortization Debt interest expense Professional fees Occupancy and equipment rentals Business development Other $0 $25 $50 $75 $100 $125 $150 $175 $200 $225 $250 3Q13 4Q13 1Q14 2Q14 First year expense trends See addendum for a reconciliation of GAAP to non-GAAP financial results. * In an investor presentation dated November 19, 2013 available at http://investors.kcg.com, the pre-merger pro forma 1H13 expense from communications and data processing was $86.8 million. In comparison to the 1H14 actual combined expense from communications and data processing, the annualized savings on a run-rate basis amounts to $23.5 million. |
![]() Debt Interest Expense (in $ millions) July 1, 2013 June 30, 2014 3.50% convertible notes * 375 117 5.75% term credit agreement 535 0 8.25% senior secured notes † 305 305 Total debt 1,215 422 * The convertible notes mature on March 15, 2015 † The senior secured notes mature on June 15, 2018; certain restrictions governing redemptions expire on June 15, 2015 KCG aggressively paid down debt in the first year of operation The firm fully retired the term credit agreement ahead of the December 2017 maturity date saving $66 million in future interest expense KCG substantially achieved its target capital structure The convertible notes are due to mature in March 2015 8 Source: KCG $1,215 $422 $250 $500 $750 $1,000 $1,250 Jul -13 Aug-13 Sep-13 Oct-13 Nov-13 Dec-13 Jan -14 Feb-14 Mar-14 Apr-14 May-14 Jun -14 Debt $16.2mn $12.8mn $9.4mn $7.3mn $2 $4 $6 $8 $10 $12 $14 $16 $18 3Q13 4Q13 1Q14 2Q14 Quarterly debt interest expense $0 $0 |
![]() Additional Financials (in $ millions) June 30, 2014 March 31, 2014 Cash and cash equivalents $ 600.9 $ 651.1 Debt 422.3 472.3 Stockholders’ equity 1,533.7 1,566.2 ----- Debt-to-tangible equity ratio 0.32 0.35 Tangible book value per share $11.04 $10.85 Book value per share $12.66 $12.46 Conservative management of the balance sheet Released $200 million in excess capital from the integration of the predecessor firms and sale of assets in the first year of operation Generated $186.5 million in free cash flow from operating income over the past four quarters In 2Q14 began to return capital to stockholders through share repurchases See addendum for a reconciliation of GAAP to non-GAAP financial results. Net revenues represent total revenues less execution and clearance fees, payment for order flow and collateralized financing interest as well as any one-time gains. Free cash flow represents income from continuing operations less capital expenditures plus non-cash items such as depreciation and amortization, stock-based compensation and non-GAAP adjustments included in the Regulation G tables. 9 3Q13 4Q13 1Q14 2Q14 Total revenues Net revenues $0 $50 $150 $200 $250 $300 $350 $400 $100 $0 $10 $20 $30 $40 $50 $60 $70 3Q13 4Q13 1Q14 2Q14 Non- GAAP pre-tax income from continuing operations Free cash flow from operating income Total revenues and net revenues Earnings and free cash flow – Liquidity buffer of $350 million – Regular stress tests for extreme scenarios |
![]() Summary of First Year Activities Integrated direct-to-client and non-client, exchange-based U.S. equity market making Combined overlapping units including algorithmic services, options market making, DMM and LMM Restructured the institutional ETF desk Consolidated European equity sales Combined offices in Chicago and London Recruited Charles Haldeman to serve as Non- Executive Chairman of the Board of Directors Added quantitative-based trading strategy and analysis to the client offering Reduced overall headcount nearly 14% Reduced debt by $793 million Consolidated institutional U.S. equity sales Recruited Global Head of FICC Trading, Co- Head of Global Execution Services and Platforms, and CEO of KCG Europe Ltd.* Combined support functions including Technology, Finance, Legal, Compliance, Risk, HR and Facilities Brought all U.S. equity clearing in house Consolidated broker-dealers in the U.S. (KCG Americas LLC) and U.K. (KCG Europe Limited) Sold Urban Financial of America Established a share repurchase program 10 * Employment commences September 22, 2014 |
![]() SEC Market Structure Priorities Equity Markets Market Instability High Frequency Trading - Require certain market participants to register as dealers and members of FINRA - Develop rules to eliminate disruptive trading practices - Update market making requirements by developing affirmative or negative trading obligations Market Transparency - Develop rules to increase transparency around ATSs and determine whether rules are necessary to reduce fragmentation Broker Conflicts - Enhance order routing disclosures - Require Exchanges to review of order types Liquidity for smaller companies - Proposed tick size pilot for stocks of smaller companies 11 Fixed Income Markets Price quality and transparency - Develop a workable best execution rule for both the corporate and municipal bond markets - Develop rules regarding disclosure of markups in “riskless principal” transactions for both corporate and municipal bonds - Focus on regulatory initiatives to enhance the public availability of pre-trade pricing information in the fixed income markets, particularly with respect to smaller retail-size orders - Proposed Reg SCI |
![]() KCG Stockholder Base General Atlantic Jefferies Insiders Institutional (active) Index / ETF (passive) Retail A legacy investor in GETCO, General Atlantic increased its stake in the combined firm at the merger close A legacy investor in Knight, Jefferies increased its stake in the combined firm in the year since the merger close ‘Insiders’ is comprised of members of the KCG Management Committee and Board of Directors, excluding representatives of General Atlantic As a category, ‘Retail’ includes current KCG employees as well as former management and employees of the predecessor firms Estimated ownership breakdown based on the weighted average shares outstanding of 117.6 million during the second quarter of 2014. Excludes outstanding warrants. 12 24.2% 19.1% 16.9% 16.3% 9.4% 14.1% |
![]() |
![]() Regulation G Reconciliation of Non-GAAP Financial Measures (Continuing Operations) 13 3 months ended June 30, 2014 Market Making Global Execution Services Corporate and Other Consolidated Reconciliation of GAAP pre-tax to non-GAAP pre-tax: GAAP income (loss) from continuing operations before income taxes $ 36,004 $ 736 $ (22,233) $ 14,507 Writedown of capitalized debt costs - - 1,995 1,995 Compensation related to reduction in workforce 383 1,886 800 3,069 Writedown of assets and lease loss accrual, net 452 - 1,489 1,941 $ 36,839 $ 2,622 $ (17,949) $ 21,512 3 months ended March 31, 2014 Market Making Global Execution Services Corporate and Other Consolidated Reconciliation of GAAP pre-tax to non-GAAP pre-tax: GAAP income (loss) from continuing operations before income taxes $ 76,032 $ 2,016 $ (18,664) $ 59,384 Writedown of capitalized debt costs - - 7,557 7,557 Income resulting from the merger of BATS and Direct Edge, net - - (9,644) (9,644) Writedown of assets and lease loss accrual, net 359 - (93) 266 Non-GAAP income (loss) from continuing operations before income taxes $ 76,391 $ 2,016 $ (20,844) $ 57,563 Non-GAAP income (loss) from continuing operations before income taxes |
![]() 3 months ended September 30, 2013 Market Making Global Execution Services Corporate and Other Consolidated Reconciliation of GAAP pre-tax to non-GAAP pre-tax: GAAP income (loss) from continuing operations before income taxes $ 47,853 $ (16,354) $ 89,874 $ 121,373 Gain on investment in Knight Capital Group, Inc. - - (127,972) (127,972) Compensation and other expenses related to reduction in workforce 2,309 15,132 - 17,441 Professional and other fees related to Mergers and August 1 st technology issue - - 7,269 7,269 Writedown of assets and lease loss accrual, net 108 - 828 936 Non-GAAP income (loss) from continuing operations before income taxes $ 50,270 $ (1,222) $ (30,001) $ 19,048 Regulation G Reconciliation of Non-GAAP Financial Measures (Continuing Operations) 3 months ended December 31, 2013 Market Making Global Execution Services Corporate and Other Consolidated Reconciliation of GAAP pre-tax to non-GAAP pre-tax: GAAP income (loss) from continuing operations before income taxes $ 47,951 $ (4,491) $ (60,159) $ (16,699) Compensation and other expenses related to reduction in workforce 5,254 5,447 708 11,409 - - 2,785 2,785 Writedown of capitalized debt costs - - 13,209 13,209 Gain on strategic asset - - (1,359) (1,359) Writedown of assets and lease loss accrual - 1,681 8,819 10,500 Non-GAAP income (loss) from continuing operations before income taxes $ 53,205 $ 2,637 $ (35,997) $ 19,845 14 Professional and other fees related to Mergers and August 1 st technology issue |
![]() 3 months ended June 30, 2014 GAAP Adjustments for non-GAAP presentation KCG adjusted, normalized expenses Employee compensation and benefits 103,430 3,069 100,361 Communications and data processing 38,279 - 38,279 Depreciation and amortization 19,823 - 19,823 Debt interest expense 7,497 - 7,497 Professional fees 7,337 - 7,337 Occupancy and equipment rentals 8,235 - 8,235 Business development 2,609 - 2,609 Writedown of assets, lease loss accrual and capitalized debt costs 3,936 3,936 - Other 10,767 - 10,767 Total expenses $ 201,913 $ 7,005 $ 194,908 Regulation G Reconciliation of Non-GAAP Financial Measures (Continuing Operations) 15 Reconciliation of GAAP expenses to normalized non-GAAP expenses: |
![]() 3 months ended March 31, 2014 GAAP Adjustments for non-GAAP presentation KCG adjusted, normalized expenses Reconciliation of GAAP expenses to normalized non-GAAP expenses: Employee compensation and benefits 122,319 - 122,319 Communications and data processing 36,796 - 36,796 Depreciation and amortization 20,103 - 20,103 Debt interest expense 9,524 - 9,524 Professional fees 5,402 - 5,402 Occupancy and equipment rentals 8,285 - 8,285 Business development 1,683 - 1,683 Writedown of assets, lease loss accrual and capitalized debt costs 7,823 7,823 - Other 8,643 - 8,643 Total expenses $ 220,578 $ 7,823 $ 212,755 Regulation G Reconciliation of Non-GAAP Financial Measures (Continuing Operations) 16 |
![]() Regulation G Reconciliation of Non-GAAP Financial Measures (Continuing Operations) 17 3 months ended December 31, 2013 GAAP Adjustments for KCG adjusted, normalized expenses Reconciliation of GAAP expenses to normalized non-GAAP expenses: Employee compensation and benefits 112,209 11,409 100,800 Communications and data processing 37,512 - 37,512 Depreciation and amortization 19,566 - 19,566 Debt interest expense 12,943 - 12,943 Professional fees 7,734 2,491 5,243 Occupancy and equipment rentals 9,358 - 9,358 Business development 1,923 - 1,923 Writedown of assets, lease loss accrual and capitalized debt costs 23,709 23,709 - Other 13,066 294 12,772 Total expenses $ 238,020 $ 37,903 $ 200,117 non-GAAP presentation |
![]() Regulation G Reconciliation of Non-GAAP Financial Measures (Continuing Operations) 3 months ended September 30, 2013 GAAP Adjustments for non-GAAP presentation KCG adjusted, normalized expenses Reconciliation of GAAP expenses to normalized non-GAAP expenses: Employee compensation and benefits 129,631 17,441 112,190 Communications and data processing 44,046 - 44,046 Depreciation and amortization 20,091 - 20,091 Debt interest expense 19,350 2,982 16,368 Professional fees 9,077 4,087 4,990 Occupancy and equipment rentals 8,898 - 8,898 Business development 2,644 200 2,444 Writedown of assets and lease loss accrual, net 936 936 - Other 11,318 - 11,318 Total expenses $ 245,991 $ 25,647 $ 220,345 18 |
![]() |