UNITED STATES
SECURITIES AND EXCHANGE COMMISSION
Washington, D.C. 20549
FORM 10-K
(Mark One)
| |
☒ | ANNUAL REPORT PURSUANT TO SECTION 13 OR 15(d) OF THE SECURITIES EXCHANGE ACT OF 1934 |
For the fiscal year ended December 31, 2024
OR
| |
☐ | TRANSITION REPORT PURSUANT TO SECTION 13 OR 15(d) OF THE SECURITIES EXCHANGE ACT OF 1934 |
FOR THE TRANSITION PERIOD FROM to
Commission file number: 001-38388

Victory Capital Holdings, Inc.
(Exact name of registrant as specified in its charter)
| |
Delaware | 32-0402956 |
(State or other jurisdiction of incorporation or organization) | (I.R.S. Employer Identification No.) |
| |
15935 La Cantera Parkway, San Antonio, Texas (Address of principal executive offices) | 78256 (Zip Code) |
(216) 898-2400
(Registrant's telephone number, including area code)
Securities registered pursuant to Section 12(b) of the Act:
| | |
| | |
Title of each class | Trading Symbol(s) | Name of each exchange on which registered |
Common Stock, $0.01 Par Value | VCTR | The Nasdaq Stock Market LLC |
Securities registered pursuant to section 12(g) of the Act: None
Indicate by check mark if the registrant is a well-known seasoned issuer, as defined in Rule 405 of the Securities Act. Yes ☒ No ☐
Indicate by check mark if the registrant is not required to file reports pursuant to Section 13 or 15(d) of the Act. Yes ☐ No ☒
Indicate by check mark whether the registrant: (1) has filed all reports required to be filed by Section 13 or 15(d) of the Securities Exchange Act of 1934 during the preceding 12 months (or for such shorter period that the registrant was required to file such reports), and (2) has been subject to such filing requirements for the past 90 days. Yes ☒ No ☐
Indicate by check mark whether the registrant has submitted electronically every Interactive Data File required to be submitted pursuant to Rule 405 of Regulation S-T (§ 232.405 of this chapter) during the preceding 12 months (or for such shorter period that the registrant was required to submit such files). Yes ☒ No ☐
Indicate by check mark whether the registrant is a large accelerated filer, an accelerated filer, a non-accelerated filer, a smaller reporting company, or an emerging growth company. See the definitions of "large accelerated filer," "accelerated filer," "smaller reporting company," and "emerging growth company" in Rule 12b-2 of the Exchange Act.
| | | | |
Large accelerated filer | ☒ | | Accelerated filer | ☐ |
Non-accelerated filer | ☐ | | Smaller reporting company | ☐ |
| | | Emerging growth company | ☐ |
If an emerging growth company, indicate by check mark if the registrant has elected not to use the extended transition period for complying with any new or revised financial accounting standards provided pursuant to Section 13(a) of the Exchange Act. ☐
Indicate by check mark whether the registrant has filed a report on and attestation to its management’s assessment of the effectiveness of its internal control over financial reporting under Section 404(b) of the Sarbanes-Oxley Act (15 U.S.C. 7262(b)) by the registered public accounting firm that prepared or issued its audit report. Act. ☒
If securities are registered pursuant to Section 12(b) of the Act, indicate by check mark whether the financial statements of the registrant included in the filing reflect the correction of an error previously issued financial statements. ☐
Indicate by check mark whether any of those error corrections are restatements that required a recovery analysis of incentive-based compensation received by any of the registrant’s executive officers during the relevant recovery period pursuant to §240.10D-1(b). ☐
Indicate by check mark whether the registrant is a shell company (as defined in Rule 12b-2 of the Exchange Act). Yes ☐ No ☒
Aggregate market value of Common Stock held by non-affiliates of the registrant as of June 30, 2024 was approximately $2.3 billion.
The number of outstanding shares of the registrant's Common Stock, par value $0.01 per share as of February 19, 2025 was 63,661,988.
DOCUMENTS INCORPORATED BY REFERENCE
Portions of the registrant’s proxy statement related to its 2025 Annual Stockholders’ Meeting to be filed within 120 days of the end of the fiscal year ended December 31, 2024, are incorporated by reference into Part III hereof. Except with respect to information specifically incorporated by reference in this Annual Report on Form 10-K, the registrant’s proxy statement is not deemed to be filed as part hereof.
Auditor’s PCAOB ID Number: 42 Auditor Name: Ernst & Young LLP Auditor Location: Cleveland, Ohio
TABLE OF CONTENTS
Forward‑Looking Statements
This Annual Report on Form 10-K contains forward‑looking statements within the meaning of federal securities law. The forward‑looking statements may include, without limitation, statements concerning our current expectations, estimates, assumptions, and beliefs concerning future events, conditions, plans, and strategies that are not historical fact. Any statement that is not historical in nature is a forward-looking statement and may be identified by the use of words and phrases such as “may,” “believes,” “intends,” “seeks,” “anticipates,” “plans,” “estimates,” “expects,” “should,” “assumes,” “continues,” “could,” “will,” “future” or similar meaning or the negative thereof and include, but are not limited to, statements regarding the proposed transaction and the outlook for Victory Capital’s or Amundi’s future business and financial performance. Such forward-looking statements involve known and unknown risks, uncertainties and other important factors beyond Victory Capital’s and Amundi’s control and could cause Victory Capital’s and Amundi’s actual results, performance or achievements to be materially different from the expected results, performance or achievements expressed or implied by such forward-looking statements.
Forward‑looking statements reflect our current expectations regarding future events, results or outcomes. These expectations may or may not be realized. Although we believe the expectations reflected in the forward‑looking statements are reasonable, we can give no assurance that these expectations will prove to have been correct. Some of these expectations may be based upon assumptions, data or judgments that prove to be incorrect. Such forward-looking statements can be affected by inaccurate assumptions we might make or by known or unknown risks and uncertainties.
Many factors mentioned in “Item 1A. Risk Factors” will be important in determining future results. Should one or more of these risks or assumptions materialize, or should the underlying assumptions prove incorrect, actual results may vary materially from those anticipated, estimated or projected. You are advised, however, to consult any further disclosures we make on related subjects in the quarterly, periodic and annual reports we file with the United States Securities and Exchange Commission (the “SEC”). All forward‑looking statements speak only as of the date made and we undertake no obligation to update or revise publicly any forward‑looking statements, whether as a result of new information, future events or otherwise.
The following text is qualified in its entirety by reference to the more detailed information and consolidated financial statements (including the notes thereto) appearing elsewhere in this Annual Report on Form 10-K. Unless the context otherwise requires, references in this Annual Report to “we,” “our,” “us,” “Victory” or the “Company” shall mean Victory Capital Holdings, Inc., (“VCH”) a Delaware corporation, and its wholly-owned subsidiaries. All references to years, unless otherwise noted, refer to our fiscal year which ends on December 31.
Note Regarding Third-Party Information
This Annual Report on Form 10-K includes certain market and industry data and forecasts related thereto that we rely on and refer to. We obtained this information and these statistics from sources other than us, which we have supplemented where necessary with information from publicly available sources and our own internal estimates. We use these sources and estimates and believe them to be reliable, but we cannot give any assurance that any of the projected results will be achieved.
Item 1. Business
Overview
We are a diversified global asset management firm with total assets under management (“AUM”) of $171.9 billion, and $176.1 billion in total client assets, as of December 31, 2024. Our differentiated business model combines boutique investment qualities with the benefits of an integrated, centralized (not standardized) operating and distribution platform.
Victory Capital provides specialized investment strategies to institutions, intermediaries, retirement platforms and individual investors. With 11 autonomous Investment Franchises and a Solutions Platform, Victory Capital offers a wide array of investment products, including actively and passively managed mutual funds, rules-based and active exchange traded funds (“ETFs”), institutional separate accounts, variable insurance products (“VIPs”), alternative investments, private closed end funds, and a 529 Education Savings Plan. Victory Capital’s strategies are also offered through third-party investment products, including mutual funds, third-party ETF
model strategies, retail separately managed accounts (“SMAs”) and unified managed accounts (“UMAs”) through wrap account programs, Collective Investment Trusts (“CITs”), and undertakings for the collective investment in transferable securities (“UCITS”). As of December 31, 2024, our Franchises and our Solutions Platform collectively managed a diversified set of 124 investment strategies.
Our design logos and the marks “Victory Capital,” “Victory Capital Management,” “Victory Funds,” “VictoryShares,” “Victory Capital inVest,” “Victory Capital Solutions,” “inVest,” “Munder,” “Munder Capital Management,” “New Energy Capital,” “THB,” “The Road to Victory,” “RS Investments,” “Sycamore Capital,” “Trivalent Investments,” “Victory Income Investors”, “USAA 529 Education Savings Plan,” and “WestEnd Advisors,” are pending, owned, or licensed for a period of time by us or one of our subsidiaries. All other trademarks, service marks and trade names appearing in this report are the property of their respective owners.
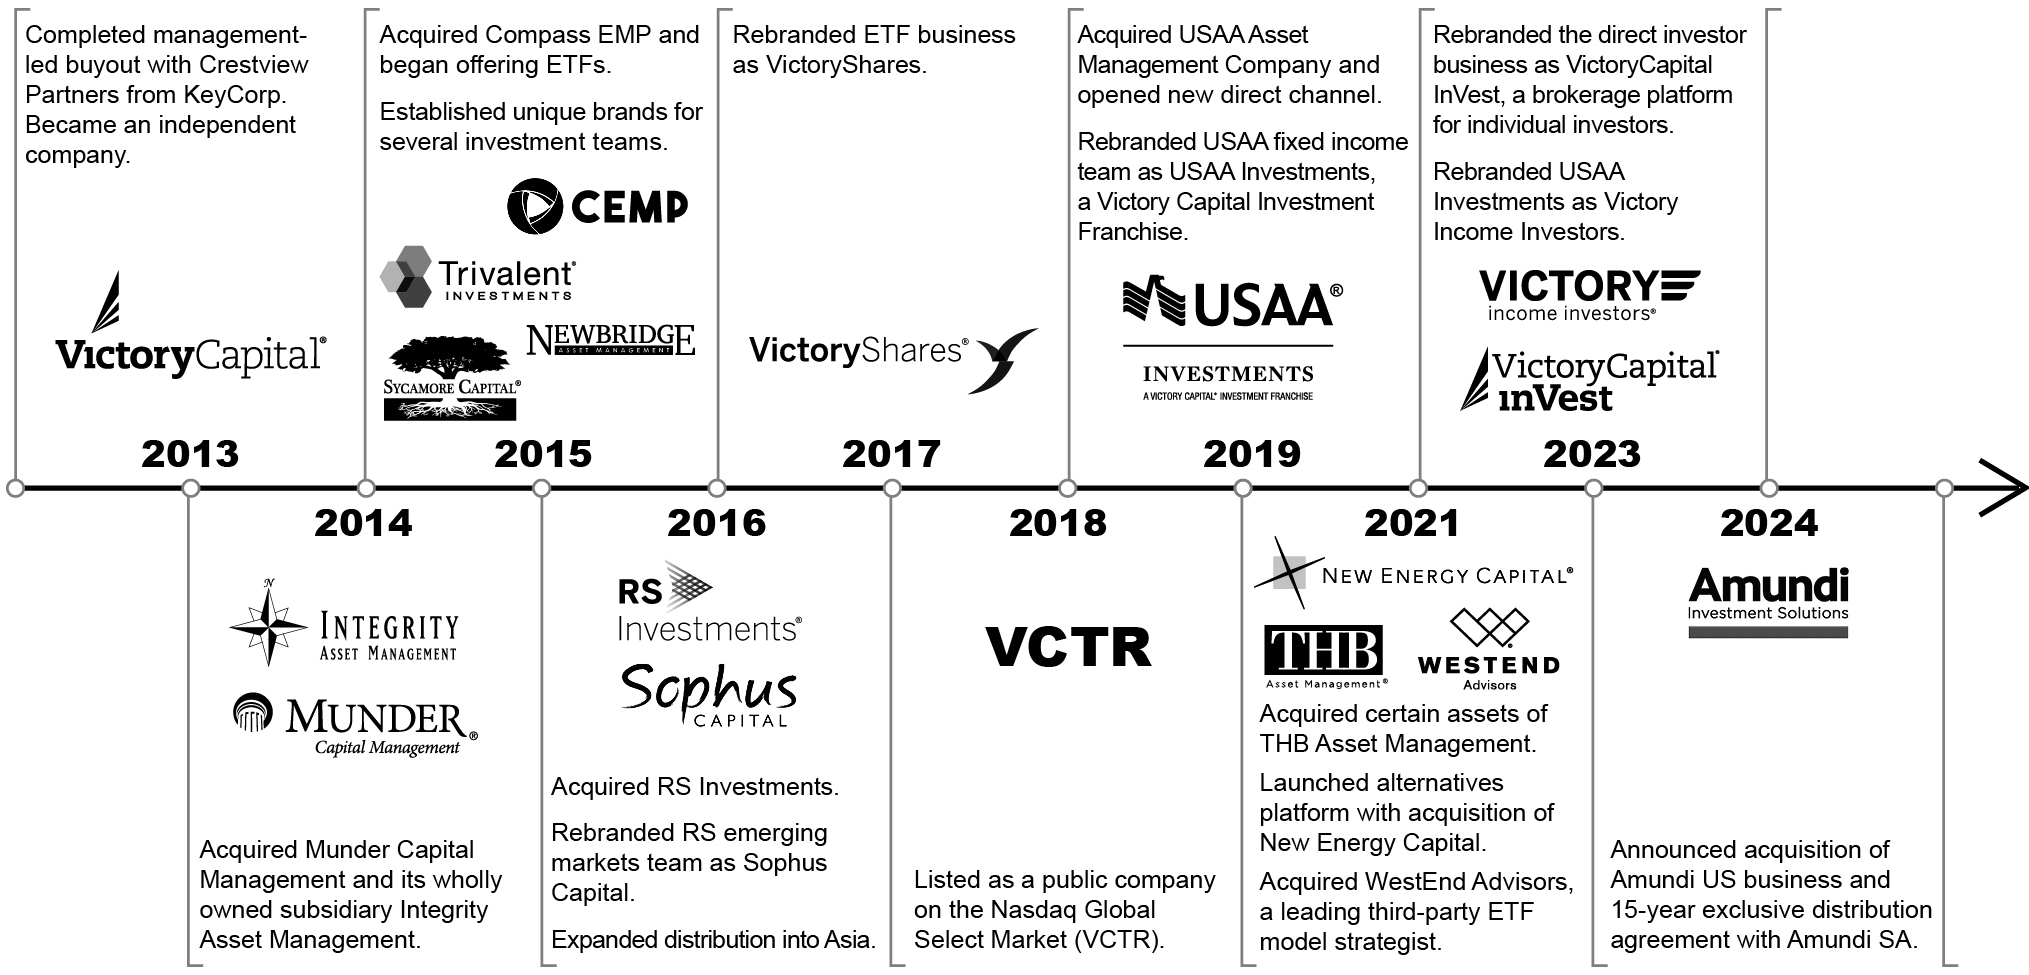
Business History and Organization
Victory Capital Holdings, Inc. was formed in 2013 for the purpose of acquiring Victory Capital Management (“VCM”) and Victory Capital Services, Inc. (“VCS”) from KeyCorp. VCM is a U.S. registered investment adviser (“RIA”) managing assets through open-end mutual funds, institutional separate accounts, CITs, wrap account programs, UCITS, private funds, and ETFs. VCM also provides mutual fund administrative services for the Victory Portfolios, Victory Variable Insurance Funds, two mutual fund series named the Victory Portfolios II and Victory Portfolios III (collectively, the “Victory Funds”), that are families of open-end mutual funds; VictoryShares (the Company’s ETF brand), and the USAA 529 Education Savings Plan. In 2021, the Company acquired WestEnd Advisors (WestEnd”), which maintains its own RIA, which is an affiliate RIA that receives certain services from VCM. VCM employs all of the Company’s United States investment professionals across all 11 Franchises and its Solutions Platform.
VCM’s wholly owned subsidiaries include RS Investment Management (Singapore) Pte. Ltd., and RS Investments (UK) Limited, and NEC Pipeline LLC. VCS is registered with the SEC as an introducing broker-dealer and serves as distributor and underwriter for certain Victory Funds and for municipal fund securities issued by the Nevada College Savings Trust Fund under the USAA 529 Education Savings Plan. VCS also serves as the placement agent for certain private funds managed by VCM. In April of 2023, the Direct Investor Business was expanded to include brokerage capabilities through VCS and this channel was rebranded Victory Capital inVest. VCH indirectly owns Victory Capital Transfer Agency, Inc. (“VCTA”), a transfer agent registered with the SEC that acts as transfer agent for the Victory Portfolio III series of mutual funds.
Our Growth Strategy
We have a purposeful strategy designed to achieve lasting profitable growth and success for our clients, our employees, and our shareholders. The growth we pursue is both organic and inorganic.
Organic Growth – We seek to grow organically by offering strategies that are value-added, and solution oriented to investment portfolios with strong risk-adjusted performance track records over the long term. A key driver of our growth strategy lies in enhancing the strength of our existing Franchises. We primarily do this by providing them with access to our operating platform, technology, distribution, marketing, and other support functions. Largely unencumbered by the burdens of administrative and operational tasks, our investment professionals can focus on delivering investment excellence and maintaining strong client relationships. We also help our Franchises through new product development and product packaging. We believe we are well positioned to help our Franchises grow their product offerings and diversify their client base, with the ability to offer their strategies in multiple investment vehicles to meet the unique needs of diverse clients.
We continually evaluate and make investments to improve our operating platform. Recent initiatives include investments in artificial intelligence (AI), data and analytics, technology, distribution, and marketing to enhance organic growth in our business and increase the effectiveness of our distribution channels.
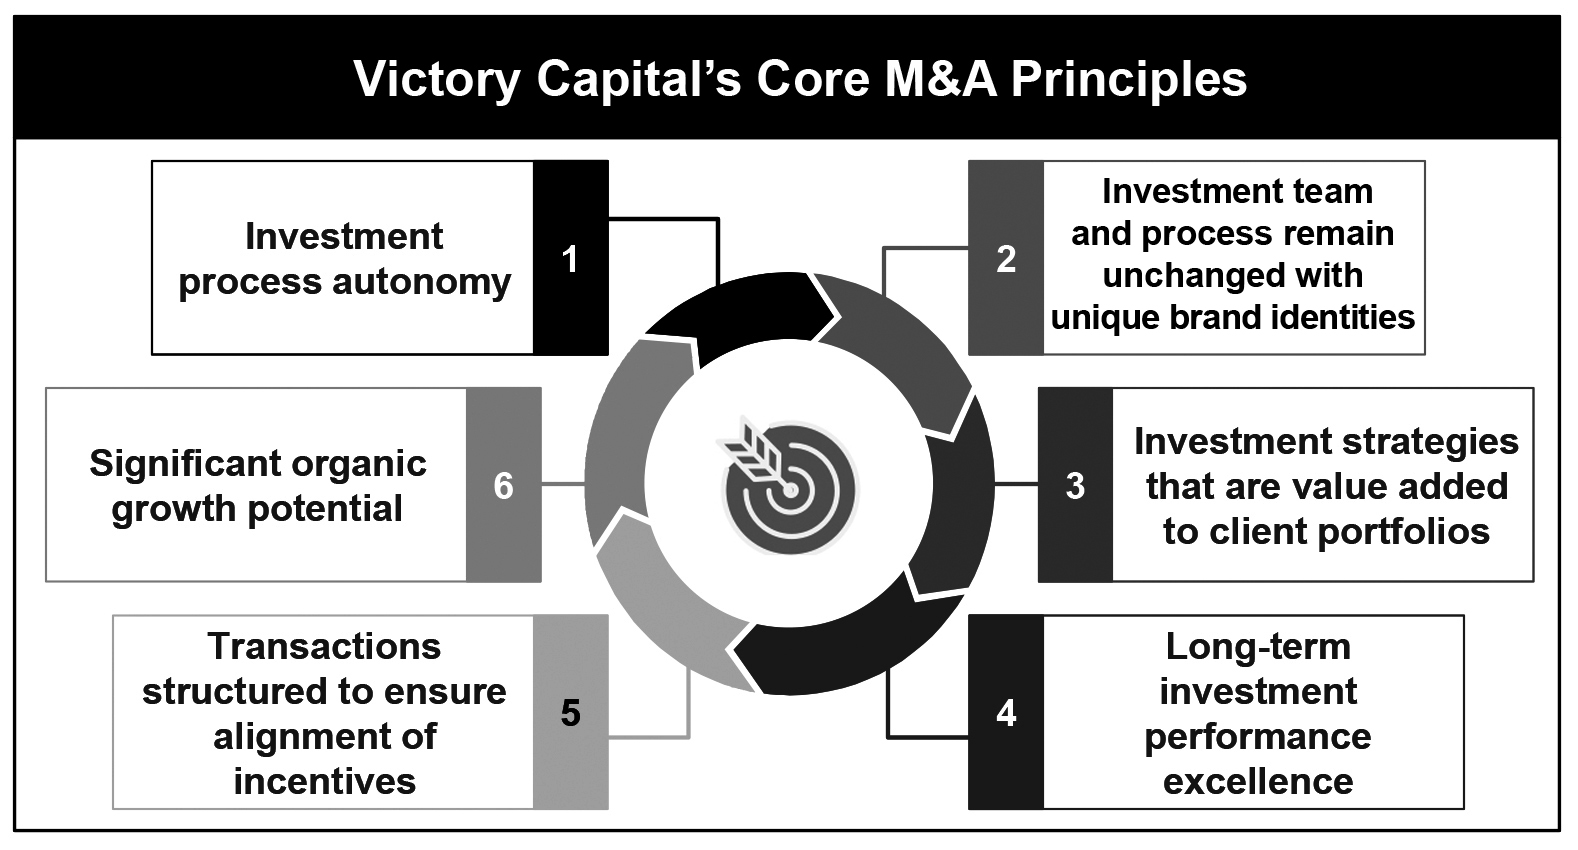
Inorganic Growth – We complement our organic growth through strategic acquisitions. We primarily seek to acquire investment management firms that will add high quality investment teams, enhance our growth and financial profile, improve our diversification by asset class and investment capability, achieve our integration and synergy expectations, and expand our distribution capabilities.
One of our key advantages in a competitive merger and acquisition environment is our ability to provide access to multiple distribution channels. Our distribution and marketing platforms drive organic growth at our acquired Franchises both by opening new distribution channels and penetrating deeper into existing ones. This support
received from our sales and marketing professionals allows our investment professionals to focus primarily on delivering investment excellence.
Since our management‑led buyout with Crestview Partners II GP, L.P. (“Crestview GP”) from KeyCorp in 2013, we have successfully closed seven acquisitions, made, and exited two minority investments, and through December 31, 2024, grown our Total Client Assets 884% from $17.9 billion to $176.1 billion. We understand the need to execute transactions while minimizing disruption to the investment teams and to the client experience. Our team is very experienced and has a history of success in meeting those objectives. Previous acquisitions have evolved and diversified our products resulting in a mix of compelling investment strategies in asset classes where we can be successful and earn sustainable management fees.
During 2024, we entered into a definitive agreement with Amundi SA (“Amundi”) to combine their US operations (“Amundi US”) into Victory Capital, to establish long-term global distribution agreements, and Amundi to become a strategic shareholder of Victory Capital. The addition of Amundi US as Victory Capital’s largest Investment Franchise would meaningfully enhance Victory Capital’s scale, expand its global client base, and further diversify its investment capabilities, given Amundi US’ broad investment capabilities and strong long-term investment performance.
We regularly evaluate potential acquisition candidates and maintain a strong network of industry participants and advisors who provide opportunities to establish potential target relationships and source transactions. Our management team leads and participates in our acquisition strategy, leveraging their many years of experience actively operating our Company on a day‑to‑day basis to successfully source, execute, integrate, and ultimately operate acquired businesses.
Based on our successful acquisition track record, we believe that there is a significant opportunity for us to continue to profitably grow through additional acquisitions, as industry dynamics have expanded the universe of potential acquisition targets.
Alternative Investments – We launched our alternative investments platform with the acquisition of New Energy Capital (“NEC”). We offer both open-end liquid alternative investments as well as closed-end private funds. Given our multi-faceted distribution channels, combined with our ability to develop investment vehicles to deliver these strategies, we are ideally situated to play a role in democratizing access to alternative investments for retail investors.
With attractive fee rates, margins, longer capital commitments compared with our liquid products, and less likelihood of being disintermediated by non-active strategies, we remain interested in adding additional alternative investment capabilities. We are committed to maintaining the same guiding principles with alternative Investment Franchises that led to success with our traditional Investment Franchises.
Diversification Strategy
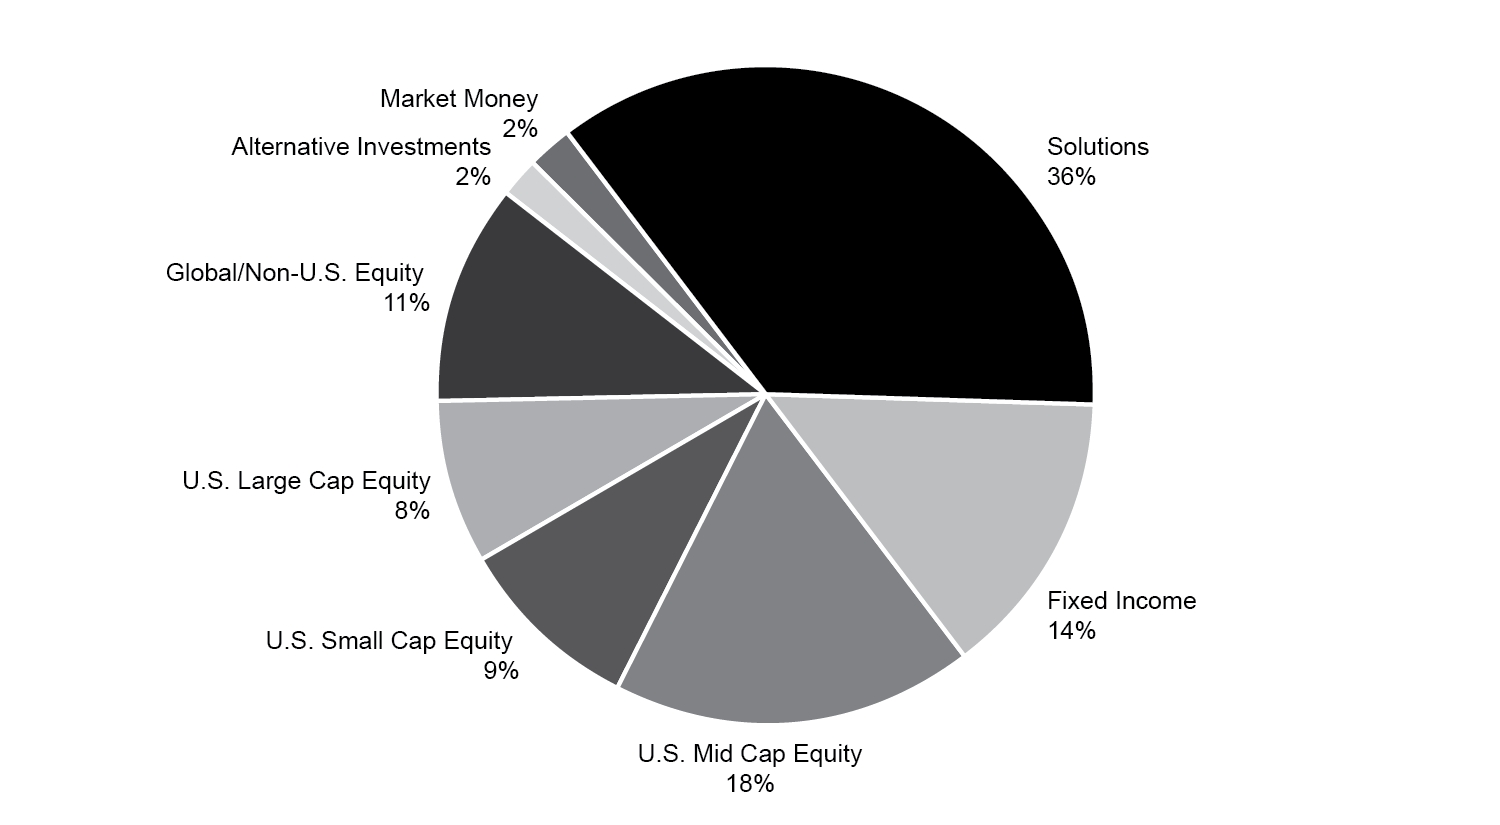
We offer an array of equity, fixed income, investment models, alternative investments, closed end private funds, and solutions strategies that encompass a diverse spectrum of market capitalization segments, industry sectors, investment styles and approaches. We believe that these strategies are positioned to attract positive net flows and sustainable fee rates over the long term and provide us with a next generation investment management platform. As illustrated below, as of December 31, 2024, our current business is well diversified from multiple perspectives, including by asset class, by investment vehicle, and by Investment Franchise and our Solutions Platform.
Asset Class Mix
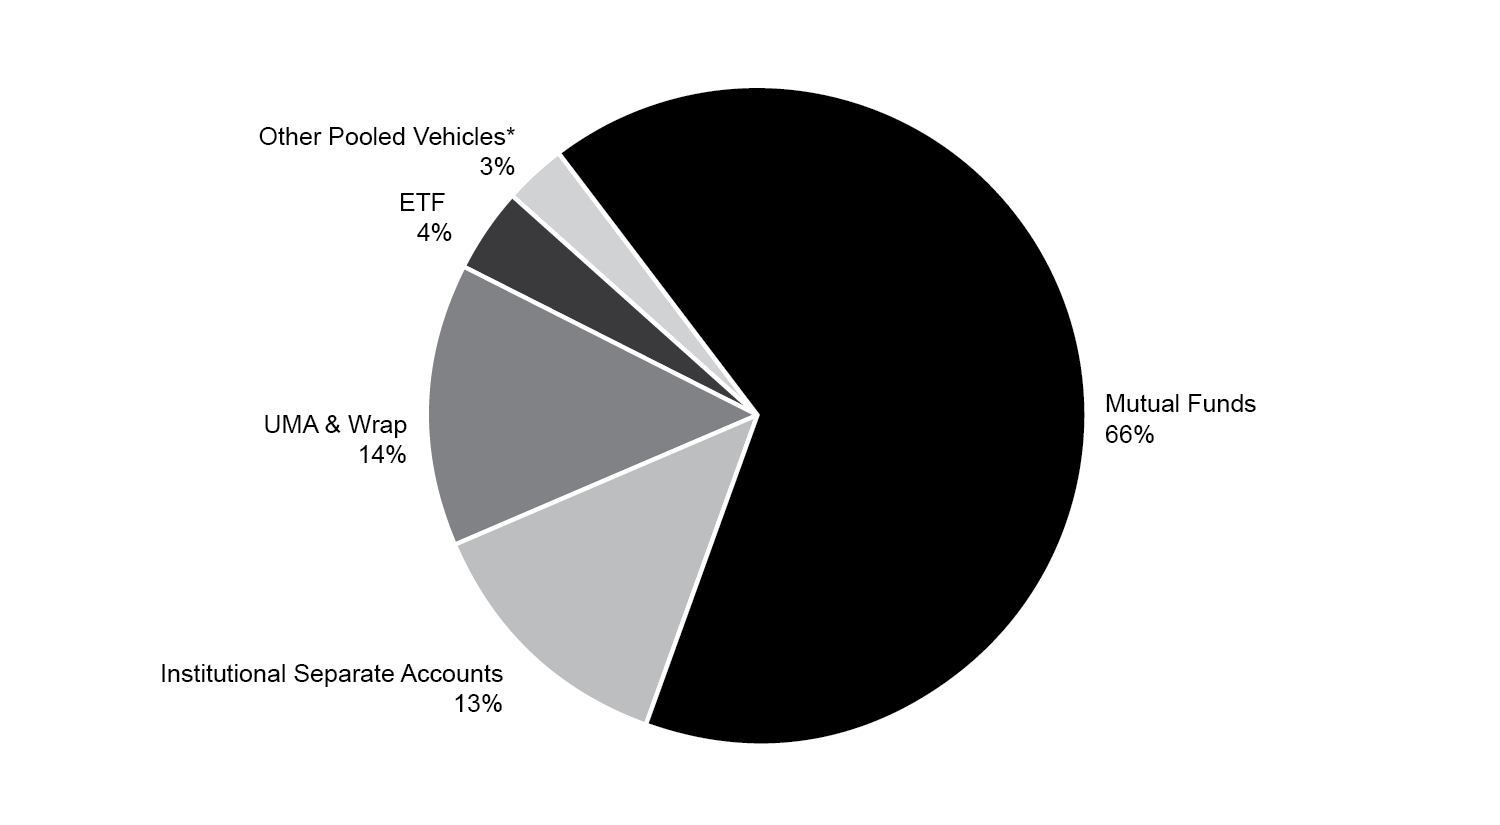
Vehicle Mix
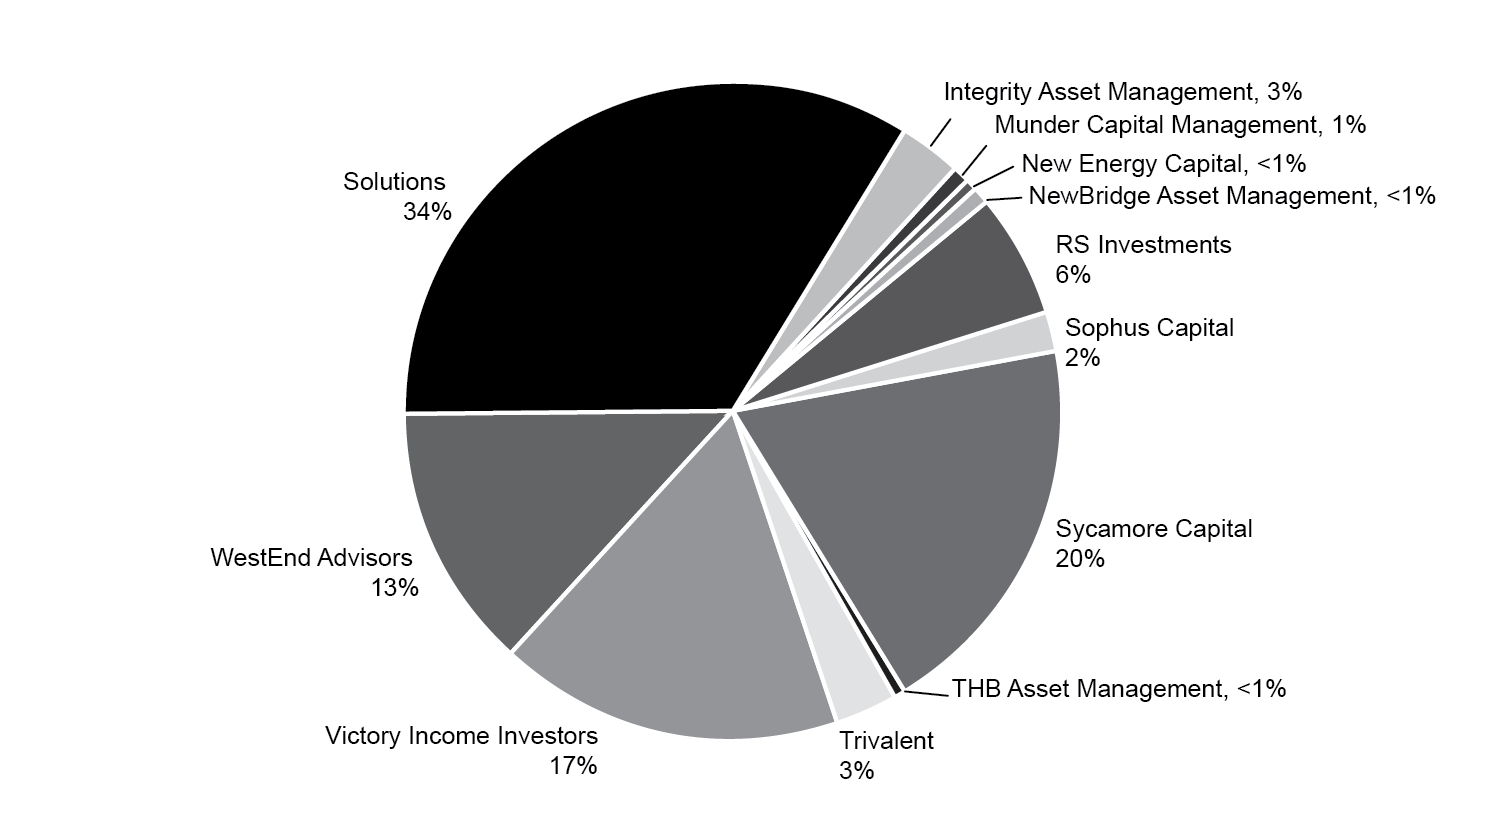
Franchise / Platform Mix
*Includes CITs, UCITS, private funds, and non-U.S. domiciled pooled vehicles.
All pie chart data is as of December 31, 2024, values may not total 100% due to rounding.
Within individual asset classes and strategies, our Franchises employ different investment approaches. This diversification reduces the correlation between investment return streams generated by multiple Franchises investing within the same asset class. For example, we have two Franchises (Trivalent and Sophus) focused on Emerging Markets within global/non‑U.S. equity, each with a different investment approach. Trivalent’s investment team primarily focuses on quantitative analysis for stock selection, combined with some fundamental analysis. Sophus employs a front‑end quantitative screen to first rank stocks, then further applies fundamental research to make its investment decisions. Due to the differences in investment approaches, each Franchise has a different return profile for investors in different market environments while maintaining desired asset class exposure.
Our multi‑channel distribution capabilities provide another degree of diversification, with approximately 41% of our Total AUM from retail and retirement clients, 35% from direct investor clients, 24% from institutional clients, as of December 31, 2024. Within these channels, clients are further diversified among intermediary (broker dealer and RIAs) platforms, sub advisory relationships, corporate and public entities, insurance companies, 529 Education Saving Plan participants, Taft-Hartley plans, endowments, and Family Offices. We believe this broad diversification of customers has a stabilizing effect on revenue, as various types of investors have unique demand patterns and respond differently to trends and market cycles.
Our Investment Franchises
Our 11 Investment Franchises and Solutions Platform are not separate legal entities. Their distinct names and brands are designed to embody and reinforce their respective autonomy and investment processes in the market. With the exception of our Solutions platform, no Investment Franchise accounts for more than 20% of total AUM, we are well diversified across asset classes and investment approaches. Our Investment Franchises are independent from one another from an investment process perspective, maintain their own separate brands and logos, which have been built over time, and are led by dedicated Chief Investment Officers (“CIOs”) or a dedicated management team. We customize each Franchise’s integration with our operating platform to optimize their investment processes.
Integrity Asset Management – Integrity Asset Management utilizes a dynamic value‑oriented approach to U.S. mid‑ and small‑capitalization companies. Integrity conducts fundamental stock research to find attractive companies that have compelling discounts to the prevailing market conditions. Integrity is based in Rocky River, OH, and managed $5.8 billion in AUM as of December 31, 2024. Our Integrity Investment Franchise includes 10 investment professionals with average industry experience of approximately 25 years.
Munder Capital Management – Munder Capital Management has an experienced team utilizing a Growth‑at‑a‑Reasonable‑Price “GARP” strategy in the U.S. equity markets designed to generate consistently strong performance over a market cycle. Munder performs extensive fundamental research in order to find attractive growth companies that it expects will exceed market expectations. Of the companies with independently determined growth attributes, valuation is applied to find the most inexpensive growth companies. Munder is based in Birmingham, MI, and managed $1.5 billion in AUM as of December 31, 2024. Our Munder Investment Franchise includes four investment professionals with an average industry experience of approximately 24 years.
New Energy Capital – NEC manages alternative investments in private closed end funds, with investment periods ranging between five and 10 years. NEC was one of the first investors to focus on clean energy and infrastructure investments of small-and mid-sized clean energy infrastructure projects and companies. NEC’s investments provide growth capital in all forms across the capital structure from credit to equity, as well as hybrid financing arrangements. Based in Hanover, NH, our NEC Investment Franchise includes five investment professionals with average industry experience of approximately 18 years.
NewBridge Asset Management – NewBridge Asset Management applies a high conviction growth‑oriented strategy focusing on U.S. large‑capitalization companies experiencing superior long‑term growth rates with strong management teams. Most of NewBridge’s team have worked together since 1996 doing fundamental research on high growth companies. NewBridge portfolios usually holds between 25 and 35 securities. NewBridge is based in New York, NY. Our NewBridge Investment Franchise includes four investment professionals with average industry experience of approximately 27 years.
RS Investments – RS Investments is made up of three distinct investment teams each with its own CIO: (i) RS Value, (ii) RS Growth and (iii) RS Global. RS Value and RS Growth apply an original and proprietary fundamental approach to investing in value and growth‑oriented U.S. equity strategies. RS Global utilizes a highly disciplined quantitative approach to managing core‑oriented global and international equity strategies. RS Investments is based in San Francisco, CA, and managed $9.7 billion in AUM as of December 31, 2024. Our RS Investments Investment Franchise teams total 23 members including 18 investment professionals with average industry experience of approximately 23 years.
Sophus Capital – Sophus Capital utilizes a disciplined quantitative process that accesses market conditions in emerging equity markets and rank orders attractive companies that are further researched from a fundamental basis. Sophus is based in Des Moines, IA, with employees in Europe and Asia, and managed $3.3 billion in AUM as of December 31, 2024. Our Sophus Investments Franchise includes nine investment professionals with average industry experience of approximately 22 years.
Sycamore Capital – Sycamore Capital applies a quality value‑oriented approach to U.S. mid‑ and small‑ capitalization companies. Sycamore conducts fundamental research to find companies with strong high‑quality balance sheets that are undervalued versus comparable high-quality companies. Sycamore is based in Cincinnati, OH, and managed $33.6 billion in AUM as of December 31, 2024. Our Sycamore Investment Franchise has a team of 16 including 12 investment professionals with average industry experience of approximately 17 years.
THB Asset Management – Founded in 1982, and formerly known as Thomson, Hortsmann & Bryant, THB Asset Management (“THB”) manages equity assets in capacity constrained, micro-cap, small-cap, and mid-cap asset classes, including strategies managing U.S., international and global portfolios. THB serves clients in the U.S. and in Europe and Australia. Based in Norwalk, CT, our THB Investments Franchise includes eight investment professionals with an average industry experience of approximately 15 years.
Trivalent Investments – Trivalent Investments utilizes a disciplined approach to stock selection across large to small companies in the international and emerging markets space. Trivalent’s investment strategy is primarily a proprietary quantitative process that drives stock selection across various countries. Trivalent frequently conducts reviews of stock selection rankings within a portfolio construction and risk management context in order to isolate performance to stock selection. Trivalent is based in Boston, MA, and managed $5.3 billion in AUM as of December 31, 2024. Our Trivalent Investment Franchise includes seven investment professionals with average industry experience of approximately 28 years.
Victory Income Investors – Victory Income Investors utilizes a rigorous process rooted in a team-oriented approach among portfolio managers, research analysts and traders. Their taxable and tax-exempt portfolios are built bond by bond using a fundamental, bottom up, credit and yield-focused analysis. Victory Income Investors is based in San Antonio, TX, and managed $29.8 billion in AUM as of December 31, 2024. Our Victory Income Investors Investment Franchise has a team of 40 including 30 investment professionals with an average industry experience of approximately 23 years.
WestEnd Advisors – WestEnd is a third-party ETF model strategist providing turnkey, core model allocation strategies serving as holistic solutions and complementary sources of alpha. WestEnd is based in Charlotte, NC, and had assets under advisement (“AUA”) and AUM totaling $22.8 billion as of December 31, 2024. Our WestEnd Investment Franchise has a team of 28 including seven investment professionals averaging approximately 14 years of industry experience.
Solutions Platform
Our Solutions Platform consists of multi‑asset, multi-manager, quantitative, rules-based, factor-based, and customized portfolios. These strategies are designed to achieve specific return characteristics, with products that include values-based and thematic outcomes and exposures. We offer our Solutions Platform through a variety of vehicles, including separate accounts, mutual funds, UMA accounts, and rules-based and active ETFs under our VictoryShares ETF brand. Like our Investment Franchises, our Solutions Platform is operationally integrated and supported by our centralized distribution, marketing, and operational support functions. Our Solutions Platform is based in San Antonio, TX, and managed $58.6 billion in AUM as of December 31, 2024. The Solutions Platform team of 14 includes 13 investment professionals with average industry experience of approximately 17 years.
Our Products and Investment Performance
As of December 31, 2024, our 11 Franchises and Solutions Platform offered 124 investment strategies with the majority consisting of fixed income, U.S. small‑ and mid‑cap equities, global/non‑U.S. equities, model portfolios and solutions. These asset classes collectively comprised 88% of our $171.9 billion of total AUM, and 90% of long-term AUM, as of December 31, 2024.
Product Mix – Our investment strategies are offered through actively and passively managed mutual funds, rules-based and active ETFs, institutional separate accounts, VIPs, alternative investments, private closed end funds, and a 529 Education Savings Plan. Victory Capital’s strategies are sold directly to investors as well as through third-party investment products, including mutual funds, third-party ETF model strategies, retail SMAs and UMAs through wrap account programs, CITs, and UCITS. Our product mix could expand, as we can add investment vehicles to strategies offered by our Investment Franchises.
Investment Performance – Our Investment Franchises have established a long track record of benchmark‑relative outperformance, including prior to their acquisition by us. As of December 31, 2024, 79%
of our strategies by AUM had returns in excess of their respective benchmarks over a ten‑year period, 73% over a five‑year period, 59% over a three‑year period, and 47% over a one-year period. On an equally weighted basis, 65% of our strategies outperformed their benchmarks over a ten‑year period, 58% over a five‑year period, 58% over a three‑year period, and 53% over a one-year period. We consider both the AUM‑weighted and equal‑weighted metrics in evaluating our investment performance. The advantage of the AUM‑weighted metric is that it reflects the investment performance of our Company as a whole, indicating whether we tend to outperform our benchmarks for the assets we manage. The disadvantage is that the metric fails to capture the overall effectiveness of our individual investment strategies; it does not capture whether most of our strategies tend to outperform their respective benchmarks. Conversely, the equal‑weighted metric reflects the overall effectiveness of our individual investment strategies but fails to capture the investment performance of our Company as a whole.
The table below sets forth our 10 largest strategies by assets as of December 31, 2024, and their average annual total returns compared to their respective benchmark index over the one‑, three‑, five‑ and 10‑year periods ended December 31, 2024. These strategies represented approximately 50% of our Total Assets as of December 31, 2024.
| | | | | | | | |
Strategy/Benchmark Index | 1 year |
| 3 years |
| 5 years |
| 10 years |
|
Sycamore Mid Cap Value | 10.78 | % | 6.42 | % | 11.70 | % | 11.44 | % |
Russell MidCap Value | 13.07 | % | 3.88 | % | 8.59 | % | 8.10 | % |
Excess Return | (2.29) | % | 2.54 | % | 3.11 | % | 3.34 | % |
|
|
|
|
|
|
|
|
|
Victory S&P 500 Index | 25.31 | % | 9.08 | % | 14.61 | % | 13.15 | % |
S&P 500 | 25.02 | % | 8.94 | % | 14.53 | % | 13.10 | % |
Excess Return | 0.29 | % | 0.14 | % | 0.08 | % | 0.05 | % |
|
|
|
|
|
|
|
|
|
Sycamore Small Cap Value | 6.44 | % | 4.09 | % | 8.60 | % | 10.31 | % |
Russell 2000 Value | 8.05 | % | 1.94 | % | 7.29 | % | 7.14 | % |
Excess Return | (1.61) | % | 2.15 | % | 1.31 | % | 3.17 | % |
|
|
|
|
|
|
|
|
|
WestEnd Global Balanced | 8.82 | % | 0.77 | % | 6.66 | % | 7.08 | % |
Global Balanced Benchmark | 11.57 | % | 2.71 | % | 6.62 | % | 6.69 | % |
Excess Return | (2.75) | % | (1.94) | % | 0.04 | % | 0.39 | % |
|
|
|
|
|
|
|
|
|
Victory NASDAQ-100 | 25.94 | % | 9.70 | % | 20.18 | % | 18.53 | % |
NASDAQ-100 | 25.88 | % | 9.71 | % | 20.18 | % | 18.53 | % |
Excess Return | 0.06 | % | (0.01) | % | 0.00 | % | 0.00 | % |
|
|
|
|
|
|
|
|
|
WestEnd US Sector | 20.03 | % | 5.26 | % | 14.03 | % | 13.34 | % |
S&P 500 | 25.02 | % | 8.94 | % | 14.53 | % | 13.10 | % |
Excess Return | (4.99) | % | (3.68) | % | (0.50) | % | 0.24 | % |
|
|
|
|
|
|
|
|
|
WestEnd Global Equity | 14.35 | % | 3.61 | % | 10.82 | % | 10.47 | % |
MSCI ACWI (ND) | 17.49 | % | 5.44 | % | 10.06 | % | 9.23 | % |
Excess Return | (3.14) | % | (1.83) | % | 0.76 | % | 1.24 | % |
|
|
|
|
|
|
|
|
|
Victory Income investors – Core Plus Fixed Income | 3.42 | % | (0.69) | % | 1.80 | % | 3.19 | % |
Bloomberg US Aggregate | 1.25 | % | (2.41) | % | (0.33) | % | 1.35 | % |
Excess Return | 2.17 | % | 1.72 | % | 2.13 | % | 1.84 | % |
| | | | | | | | |
|
|
|
|
|
|
|
|
|
Trivalent International Small-Cap Equity | 6.00 | % | (1.30) | % | 4.86 | % | 7.12 | % |
S&P Dev ex-US SmallCap (ND) | (0.14) | % | (3.96) | % | 1.94 | % | 4.79 | % |
Excess Return | 6.14 | % | 2.66 | % | 2.92 | % | 2.33 | % |
|
|
|
|
|
|
|
|
|
Victory Income investors – Income | 3.87 | % | (0.89) | % | 1.30 | % | 2.86 | % |
Bloomberg US Aggregate | 1.25 | % | (2.41) | % | (0.33) | % | 1.35 | % |
Excess Return | 2.62 | % | 1.52 | % | 1.63 | % | 1.51 | % |
A high percentage of our mutual fund and ETF assets have four- or five-star Morningstar ratings. As of December 31, 2024, 45 of our Victory Capital mutual funds and ETFs, with Morningstar overall ratings, earned ratings of four or five stars overall and 66% of our mutual fund and ETF AUM were rated four or five stars overall by Morningstar. Over a three‑year and five‑year basis, 62% and 59% of our fund AUM achieved four- or five-star ratings, respectively.
Competitive Strengths
We believe we have significant competitive strengths that position us for sustained growth and shareholder value creation over the long term.
Integrated Platform Providing Centralized Distribution, Marketing, and Support Functions to Investment Franchises, which maintain complete Investment Autonomy – Our highly integrated centralized operating and distribution platform allows us to achieve benefits from both our substantial scale and the focus of our specialized investment managers. Our Investment Franchises retain investment autonomy while benefiting from our centralized operating platform that can be tailored to meet their specific needs. We have demonstrated an ability to incorporate our Franchises onto our flexible infrastructure without significantly increasing incremental fixed costs, which is a key component to the scalability of our business model. This structure enables our Franchises to focus their efforts on the investment process, providing them with a scaled platform to enhance their investment performance and consequently their growth prospects. Centralized operations allow our Franchises to customize their desired investment support functions in ways that are best suited for their investment workflow. Through our unified distribution platform, our Franchises can efficiently sell their products to institutional investors, retirement plans, wealth managers, directly to individual investors, as well as through retail and retirement intermediaries of all sizes, where it can be challenging for smaller managers to gain access.
Within our model, each Franchise retains its own brand and logo, which has been built over time. Unlike other models with unified branding, there is no requirement for newly acquired Franchises to adjust their product set due to pre‑existing products on our platform; they are marketed under their own brand as they were previously. Because of this dynamic, we have the flexibility to add new Franchises either to gain greater exposure to certain asset classes or increase capacity in places where we already have exposure.
Proven Acquirer with Compelling Value Proposition– We believe our platform allows us to continue to be a strategic acquirer within the investment management industry, providing us with an opportunity to further grow and scale our business, expand our distribution capabilities, that optimize our operating platform and achieve our integration and synergy expectations. Through numerous transactions and our recent announcement to acquire Amundi, we have demonstrated an ability to successfully source, execute, and integrate new Franchises.
We believe our unique business model is attractive for potential acquisition prospects. Under our model, Franchises retain the brands they have built as well as autonomy over their investment decisions, while simultaneously benefiting from the ability to leverage our centralized distribution, marketing, and operations platform. Our model reduces the administrative burdens borne by our Investment Franchises and allows them to focus on the investment process, which we believe can enhance their investment performance. By offering a platform on which Franchises can focus on their core competencies, grow their client base faster and participate in a revenue share program, we believe we are providing a compelling proposition. Furthermore, we believe equity ownership by our investment professionals and other employees reinforces our ownership culture by sharing in the potential upside of the entirety of our diversified investment management business.
Making us an even more attractive partner to investment firms seeking non-US distribution, is our 15-year exclusive global distribution agreement with Amundi which is scheduled to commence upon closing of the transaction in 2025. Through this agreement, we will have access to a broad and deep distribution and joint venture network around the globe.
Because we integrate a significant portion of most of our Franchises’ distribution, operational and administrative functions, we have been able to extract significant expense synergies from certain acquisitions, enabling us to create greater value from transactions.
We will seek to continue to augment our differentiated investment management platform by focusing on acquisition candidates that can make our investment platform better, that expand our distribution or investment capabilities, which optimize our operating platform and/or achieve our integration and synergy expectations.

Portfolio of Investment Strategies with Potential for Outperformance – In assembling our portfolio of Franchises, we have selected investment managers offering strategies in asset classes where active managers have shown an established track record of outperformance relative to benchmarks through security and sector selection, and portfolio construction. We continue to build our platform to address the needs of clients who would like exposure to asset classes that have potential for alpha generation. We find that macro industry trends of asset flows moving from actively managed strategies to passive ones are less pronounced in certain asset classes and seek to concentrate our business development efforts in these areas.
Diversified Platform Across Investment Strategies, Franchises and Client Type – We have strategically built an investment platform that is diversified by investment strategy, Franchise, and client type. Within each asset class, Franchises with overlapping investment mandates still contribute to our diversification by pursuing different investment philosophies and/or processes. For example, U.S. mid cap equities, which accounted for approximately 17% of Total AUM as of December 31, 2024, consists of five Franchises, each following a different investment strategy. We believe the diversity in investment styles reduces the correlation between the return profiles of strategies within the same asset class and consequently provides an additional layer of diversification of AUM and revenue stability.
Our AUM is also well diversified at the Franchise level, with no Franchise accounting for more than 20% of total AUM. Furthermore, we believe our Franchises’ brand independence reduces the impact of each individual Franchise’s performance on clients’ perceptions of the other Franchises. The distribution of AUM by Franchise and the number of Franchises, as well as succession planning, mitigates the level of key person risk typically associated with investment management businesses.
We believe our client base serves as another important diversifying element, as different client segments have shown to have distinct characteristics, including asset class and product preferences, sales and redemptions trends, and exposure to secular trends. We strive to maintain a balance between direct investors, retail clients, and institutional clients with 35%, 41% and 24% of our Total AUM as of December 31, 2024, in each of these channels, respectively. We also have the capability to deliver our strategies in investment vehicles designed to
meet the needs and preferences of investors in each channel. These investment vehicles include actively and passively managed open-end mutual funds with channel‑specific share classes, rules-based and active ETFs, third-party ETF model strategies, SMAs, UMAs, VIPs, CITs, wrap account programs, UCITS, alternative investments, private closed end funds, and a 529 Education Savings Plan. If a strategy is currently not offered in the wrapper of choice for a client, we have the infrastructure and ability to create a new investment vehicle, which helps our Franchises further diversify their client base.
Attractive Financial Profile – Our revenues are recurring in nature, as they are based on the level of client assets we manage. Most of our strategies are in asset classes that require specialized skill, are in demand, and typically command attractive fee rates. With the growth of our Solutions Platform and third-party ETF model strategies, our average fee rate is likely to decline as those businesses continue to grow and represent an increasing proportion of our total AUM. Despite their lower average fee rates, by managing these competitively priced strategies on our integrated platform we can earn margins in excess of our average consolidated margin on these products.
Because we largely outsource our middle‑ and back‑office functions, as well as certain aspects of technological support, we have relatively minimal capital expenditure requirements. Our integrated platform allows us the ability to make investments that can benefit each Franchise and our Solutions Platform. Approximately two‑thirds of our operating expenses are variable in nature, consisting of the incentive compensation pool for employees, sales commissions, third‑party distribution costs, sub‑advising and the fees we pay to certain vendors. This automatic flexing of our operating expense base helps to support profitability throughout various market cycles.
We have identified three primary net income growth drivers; (i) we grow our AUM organically through inflows into our strategies and the market appreciation of those strategies; (ii) we have a proven ability to grow via strategic and synergistic acquisitions; and (iii) we have constructed a scalable and efficient platform.
Economic and Structural Alignment of Interests Promotes Ownership Culture – Through our revenue share compensation model for our Franchises and broad employee ownership, we have structurally aligned our employees’ long-term interests with those of our clients and shareholders and have created an ownership culture that encourages employees to act in the best interests of clients and our Company shareholders. We believe the high percentage of employee ownership creates a collective alignment with our success. Additionally, our employees invest in products managed by our Franchises and Solutions Platform, providing direct alignment with the interests of our clients. As of December 31, 2024, 81% of our employees held 13% of the equity in our Company. In addition to being aligned with our financial success through their equity ownership, our current employees collectively have invested approximately $240 million in the products we manage as of December 31, 2024.
We directly align the compensation paid to our investment teams with the performance of their respective Franchises by structuring formula‑based revenue sharing on the products they manage. We believe that compensation based on revenue rather than profits incentivizes investment professionals to focus their attention on investment performance, while encouraging them to focus on client retention, provide excellent client service, and attract new assets. We believe the formula‑based, client‑aligned nature of our revenue sharing reduces complexity and fosters a culture of transparency where Franchises understand how, and on what terms, they are being measured to earn compensation.
Integrated Distribution, Marketing and Operations
The centralization of our distribution, marketing and operational functions is a key component in our model, allowing our Franchises to focus on their core competencies of security and sector selection, portfolio construction, and client service. In addition, we believe it provides our Franchises with the benefits of operating at scale, providing them with access to a larger number of clients as well as a more streamlined cost structure. As of December 31, 2024, we had 460 full-time employees with 158 in investment management, 191 in sales and marketing roles and 111 in management and support functions.
Our centralized distribution and marketing functions lead the sales effort for our institutional, retail intermediary, and direct investor channels. Our sales teams are staffed with accomplished professionals that are given specific training on how to position each of our strategies. Our distribution teams have historically focused on developing strategic long-term relationships with institutional consultants, institutional asset owners, retail and retirement intermediaries, RIAs, Family Offices, the Direct Channel, and bank trust departments. Complementing these relationships, we use data extensively to enhance the effectiveness of our distribution
teams. Investments in data packs from intermediaries, artificial intelligence initiatives, and predictive analytics — used to determine specific financial advisors’ propensities to buy or sell products — further enhance efficiencies.
These relationships can enhance our platform’s overall reach and allow our Franchises and Solutions Platform to access more clients. To ensure high levels of client service, our sales teams liaise regularly with product specialists at our Franchises. The specialists are tasked with responding to institutional client and retail inquiries on product performance and educating prospective investors and retail partners in coordination with the relevant internal sales team members. Our distribution and marketing professionals collaborate closely with our Franchises’ product specialists to attract new clients while also servicing and generating additional sales from existing clients.
Direct Investor Business – In 2020, we launched a digital platform to directly serve investors which features a client-centric modern design. Visitors to the site are presented with channel-specific content, useful investment tools and calculators, and timely investment insights from the Company’s investment experts. At our direct investor business contact center, we have approximately 75 sales and service professionals focused on assisting our direct investors (the “Investors”). They engage with thousands of Investors every week via phone, chat or email depending on the Investor’s preference. We also have a mobile application that streamlines service for Investors and enhances internal efficiency. Through these interactions we provide Investors with account servicing, portfolio reviews, college planning assistance and investment guidance at no additional cost to the Investor. Many of our direct investor business contact center professionals are Financial Industry Regulatory Authority (“FINRA”) licensed, so they are professionally qualified to serve the Investors’ investment needs. In 2023, the Direct Investor Business was expanded to include brokerage capabilities through our broker-dealer entity VCS. Investors can now leverage our open architecture brokerage option and establish brokerage accounts to invest in mutual funds and ETFs from our platform along with individual stocks and products managed by third-party providers.
Institutional Sales – Our institutional sales team attracts and builds relationships with institutional clients, a wide range of institutional consultants and mutual fund complexes and other organizations seeking sub‑advisers. Our institutional clientele includes more than 400 corporations, public funds, non‑profit organizations, Taft‑Hartley plans, sub‑advisory clients, international clients, sovereign wealth funds, and insurance companies. Our institutional sales and client‑service professionals manage existing client relationships, serve consultants and prospects, and/or focus on specific segments. They have extensive experience and a comprehensive understanding of our investment activities. Our client‑facing institutional sales professionals have an average of more than 20 years of industry tenure, and they are supported by a separate team dedicated to handling requests for proposals, or RFPs, from prospective clients.
Retail Sales – Our retail sales team includes regional external wholesalers, retirement specialists, RIA specialists, national account specialists, and ETF sales specialists, all of whom are supported by an internal sales desk. We also have a team of distribution professionals specializing in the sale of third-party ETF model strategies. Additionally, we have a growing team focused on RIA, Bank Trust & Multi Family Offices with exceptional product knowledge to enhance the growth in this sub-channel within our retail sales. In the retail channel, we focus on gathering assets through intermediaries, such as banks, broker‑dealers, wirehouses, retirement platforms and RIA networks. We offer mutual funds, ETFs, third-party ETF models, and separately managed wrap and unified managed accounts on intermediary and retirement platforms. We have agreements with many of the largest platforms in our retail channel, which has provided an opportunity to place our retail products on those platforms. Further, to enhance our presence on large distribution platforms, we have focused our efforts on servicing intermediary home offices and research departments. These efforts have led to strong growth in platform penetration, as measured by investment products on approved and recommended lists, as well as our inclusion in model portfolios. This penetration provides the opportunity for us to sell more products through distribution platforms. We have several products on the research recommended/model portfolios of the top U.S. intermediary platforms. We also have several products on the recommended list of the top retirement platforms.
Marketing – Our distribution efforts are supplemented by our marketing function, which is primarily responsible for enhancing the visibility and quality of our portfolio of brands. They are specifically tasked with managing corporate, Franchise and Solutions Platform branding efforts, the development of marketing materials, our website, digital marketplace, digital marketing, and social media efforts.
Operations – Our highly centralized operations functions provide our Franchises and Solutions Platform with the support they need so that they can focus on their investment processes. Our Investment Franchises share operating functions such as trading platforms, risk and compliance, middle- and back‑office support, technology, data and analytics, finance, human resources, accounting, and legal. Although our operations are highly centralized, we allow our Franchises a degree of customization with respect to their desired investment support functions, which we believe helps them maintain their unique investment processes and minimize disruptions.
We outsource certain middle‑ and back‑office activities, such as sub-transfer agent, trade settlement, portfolio analytics, custodian reconciliation, portfolio accounting, corporate action processing, performance calculation and client reporting, to scaled, recognized service providers, who provide their services to us on a variable‑cost basis. Systems and processes are customized as necessary to support our investment processes and operations. We maintain relationships with multiple vendors for most of our outsourced functions, which we believe mitigates vendor‑specific risk. We also have cyber and information security, business continuity and data privacy programs in place to help mitigate risk.
Outsourcing these functions enables us to grow our AUM, both organically and through acquisitions, without the incremental capital expenditures and working capital that would typically be needed. Under our direction and oversight, our outsourced model enhances our ability to integrate our acquisitions, as we are experienced in working with our vendors to efficiently bring additional Franchises onto our platform in a cost‑efficient manner.
We believe both the scalability of our business and our cost structure, in which approximately two‑thirds of our operating expenses are variable, drives industry-leading margins and facilitates free cash flow conversion. Additionally, we believe having most of our expenses tied to AUM and the number of client accounts provides downside margin protection should there be sustained net outflows or adverse market conditions.
Competition
Our investment products are sold in the traditional institutional channels, through intermediary and retirement distribution platforms, and directly to investors. We face competition with other investment firms in attracting and retaining client assets. Additionally, we compete with other acquirers of investment management firms, including independent, integrated investment management firms and multi‑boutique businesses, insurance companies, banks, and other financial institutions.
We compete with other managers offering similar strategies. Some of these organizations have greater financial resources and capabilities than we can offer and have strong performance track records. We effectively compete with other investment management firms for client assets based on the following primary factors: (i) our investment performance track record of delivering alpha; (ii) the specialized nature of our investment strategies; (iii) fees charged; (iv) access to distribution channels; (v) client service; and (vi) our employees’ alignment of interests with investors.
We compete with other potential acquirers of investment management firms primarily on the basis of the following factors: (i) the strength of our distribution relationships; (ii) the value we add through our shared distribution, marketing and operations platforms as well as our uncapped revenue sharing arrangements; (iii) the investment autonomy Franchises retain post-acquisition; (iv) the tenure and continuity of our management and investment professionals; and (v) the value that can be delivered to the seller through realization of synergies created by the combination of the businesses.
Our ability to continue to compete effectively will also depend upon our ability to retain our current investment professionals and employees and to attract highly qualified new investment professionals and employees. For additional information concerning the competitive risks that we face, refer to “Risk Factors — Industry Risks — The investment management industry is intensely competitive.”
Human Capital
We have created strong alignment of interests with clients and shareholders through employee ownership, our Franchise revenue share structure, and employee investments in our products. Notably, a significant number of our employee shareholders acquired their equity in 2013 in connection with the management‑led buyout with Crestview GP from KeyCorp, as well as in connection with the acquisitions of Munder, RS Investments, and USAA Asset Management Company. We believe the opportunity to own equity in a well‑diversified investment management company promotes long-term thinking and client alignment and is attractive, both to existing employees and those who join as part of acquisitions. We principally compensate our investment professionals
through a revenue share program, which we believe further incentivizes our investment professionals to focus on investment performance and client retention, while simultaneously minimizing potential distractions from an expense allocation process that would be involved in a profit‑sharing program. We believe the combination of these mechanisms promotes long‑term thinking and enhances both the client experience and the creation of value for our shareholders.
Our senior management team, Franchises’ CIOs and sales leaders are highly experienced in the industry, each bringing significant expertise to his or her role, having tenures on average of more than 20 years.
As an asset management firm, we are in the human capital business. As such, we value and appreciate our most important asset—our people. We employ “owners,” not employees. Accordingly, we strive to offer competitive compensation and employee benefits to all employees. We want them to own their contribution to Victory Capital’s success. In recognition of this mission, Victory Capital has established an equity awards program, in which most employees participate. As of December 31, 2024, we had 460 employees, with 81% holding ownership interests in our Company that totaled 13% of the equity in our firm. At year-end, our employees also had approximately $240 million of their personal assets invested in our investment products at their own discretion.
We believe that doing our part to maintain the health and welfare of our employees is a critical element for achieving commercial success. As such, we provide our employees with comprehensive health benefits and offer a wellness program which focuses on employee health strategies and includes a discount to employee medical premiums for the completion of certain wellness initiatives. In addition, we offer employee assistance programs, including confidential assistance for financial, mental, and physical well-being. Finally, the well-being of our employees is enhanced when they can give back to their local communities or charities and we have programs that encourage our employees to give back to their local communities.
We recognize and appreciate the importance of creating an environment in which all employees feel valued, included, and empowered to do their best work and as a result our Diversity, Inclusion, Engagement, and Belonging Committee is charged with driving best practices to cultivate a culture of belonging. This Committee’s mission is to foster an environment that attracts the best talent, values diversity of life experiences and perspectives, and encourages innovation and excellence. We also support a number of Employee Groups which are employee-driven and provide support, leadership, and connections to our diverse marketplace.
We encourage you to review our Responsible Business Report (located on our website) for more detailed information regarding our human capital programs and initiatives. Nothing on our website is deemed incorporated by reference into this Report.
Regulatory Environment and Compliance
Our business is subject to extensive regulation in the United States at the federal level and, to a lesser extent, the state level, as well as regulation by self‑regulatory organizations, and outside the United States. Under these laws and regulations, agencies that regulate investment advisers have broad administrative powers, including the power to limit, restrict or prohibit an investment adviser from carrying on its business in the event that it fails to comply with such laws and regulations. Possible sanctions that may be imposed include the suspension of individual employees, limitations on engaging in certain lines of business for specified periods of time, revocation of investment adviser registration and other registrations, censures, and fines.
SEC Investment Adviser and Investment Company Registration / Regulation – VCM and WestEnd are both registered with the SEC as investment advisers under the Investment Advisers Act of 1940, as amended (the “Advisers Act”), and the Victory Funds, Victory Portfolios III, VictoryShares and several of the investment companies we sub‑advise are registered under the Investment Company Act of 1940, as amended (the “1940 Act”). The Advisers Act and the 1940 Act, together with the SEC’s regulations and interpretations thereunder, impose substantive and material restrictions and requirements on the operations of advisers and registered funds. The SEC is authorized to institute proceedings and impose sanctions for violations of the Advisers Act and the 1940 Act, ranging from fines and censures to termination of an adviser’s registration. As an investment adviser, we have a fiduciary duty to our clients. The SEC has interpreted that duty to impose standards, requirements, and limitations on, among other things: trading for proprietary, personal and client accounts; allocations of investment opportunities among clients; our use of soft dollars; execution of transactions; and recommendations to clients. We manage accounts for clients on a discretionary basis, with authority to buy and sell securities for each portfolio, select broker‑dealers to execute trades and negotiate brokerage commission rates. In connection with certain of these transactions, we receive soft dollar credits from broker‑dealers that have the effect of reducing certain of our expenses. All our soft dollar arrangements are intended to be within
the safe harbor provided by Section 28(e) of the Exchange Act. If our ability to use soft dollars were reduced or eliminated as a result of the implementation of statutory amendments or new regulations, our operating expenses would increase. In addition, we also advise clients on a non-discretionary basis where we provide actively managed models. This is often referred to as assets under advisement.
As registered investment advisers, VCM and WestEnd are subject to many additional requirements that cover, among other things: disclosure of information about our business to clients; maintenance of written policies and procedures; maintenance of extensive books and records; restrictions on the types of fees we may charge; custody of client assets; client privacy; and advertising. The SEC has authority to inspect any investment adviser and typically inspects a registered adviser periodically to determine whether the adviser is conducting its activities (i) in accordance with applicable laws, (ii) in a manner that is consistent with disclosures made to clients and (iii) with adequate systems and procedures to ensure compliance.
For the year ended December 31, 2024, 78% of our total revenues were derived from our services to investment companies registered under the 1940 Act – i.e., mutual funds and ETFs. The 1940 Act imposes significant requirements and limitations on a registered fund, including with respect to its capital structure, investments, and transactions. While we exercise broad discretion over the day‑to‑day management of the business and affairs of the Victory Funds, Victory Portfolios III, VictoryShares and the investment portfolios of the Victory Funds, Victory Portfolios III, and VictoryShares and the funds we sub‑advise, the funds are subject to oversight of and governance by each fund’s board of directors. Under the 1940 Act, a majority of the directors of our registered funds must not be “interested persons” with respect to us (sometimes referred to as the “independent director” requirement) in order to rely on certain exemptive rules under the 1940 Act relevant to the operation of registered funds. The responsibilities of the fund’s board include, among other things: approving our investment advisory agreement with the fund (or, for sub‑advisory arrangements, our sub‑advisory agreement with the fund’s investment adviser); approving other service providers; determining the method of valuing assets; and monitoring transactions involving affiliates. Our investment advisory agreements with these funds may be terminated by the funds on not more than 60 days’ notice and are subject to annual renewal by the fund’s board after the initial term of one to two years. The 1940 Act also imposes on investment advisers, or sub‑advisers, to a registered fund a fiduciary duty with respect to the receipt of the advisers’ investment management fees or the sub-advisers’ sub‑advisory fees. That fiduciary duty may be enforced by the SEC, by administrative action or by litigation by investors in the fund pursuant to a private right of action.
As required by the Advisers Act, our investment advisory agreements may not be assigned without the client’s consent. Under the 1940 Act, investment advisory agreements with registered funds (such as the mutual funds and ETFs we manage) terminate automatically upon assignment. The term “assignment” is broadly defined and includes direct assignments as well as assignments that may be deemed to occur upon the transfer, directly or indirectly, of a “controlling block” of our outstanding voting securities. Refer to “Risk Factors—Business Risks—An assignment could result in termination of our investment advisory agreements to manage SEC‑registered funds and could trigger consent requirements in our other investment advisory agreements.”
SEC Broker‑Dealer Registration / FINRA Regulation– VCS is subject to regulation by the SEC, FINRA and various states. In addition, certain of our employees are registered with FINRA and such states and subject to SEC, state and FINRA regulation. The failure of these companies and/or employees to comply with relevant regulations could have a material adverse effect on our business.
SEC Transfer Agent Registration – VCTA is a SEC-registered transfer agent. Our registered transfer agent is subject to the 1934 Act and the rules and regulations promulgated thereunder. These laws and regulations generally grant the SEC and other supervisory bodies broad administrative powers to address non-compliance with regulatory requirements.
ERISA‑Related Regulation – We are a fiduciary under Employee Retirement Income Security Act (“ERISA”) with respect to assets that we manage for benefit plan clients subject to ERISA. ERISA, the regulations promulgated thereunder, and applicable provisions of the Internal Revenue Code impose certain duties on persons who are fiduciaries under ERISA, prohibit certain transactions involving ERISA plan clients and impose monetary penalties for violations of these prohibitions. The duties under ERISA require, among other obligations, that fiduciaries perform their duties solely in the interests of ERISA plan participants and beneficiaries.
CFTC Regulation – VCM is registered as both a commodity pool operator and commodity trading advisor with the CFTC and a member of the National Futures Association (“NFA”). In addition, certain VCM employees are registered with the CFTC and are also members of the NFA. Both the CFTC and NFA administer comparable
regulatory systems covering futures contracts and various other financial instruments, including swaps. Registration with the CFTC and NFA membership subjects VCM to regulation by the CFTC and the NFA including, but not limited to, reporting, recordkeeping, disclosure, self‑examination, and training requirements. Registration with CFTC also subjects VCM to periodic on‑site audits. Each of the CFTC and NFA is authorized to institute proceedings and impose sanctions for violations of applicable regulations.
Non‑U.S. Regulation – In addition to the extensive regulation to which we are subject in the United States, we are subject to regulation internationally. Our business is also subject to the rules and regulations of the countries in which we market our funds or services and conduct investment activities.
In Singapore, we are subject to, among others, the Securities and Futures Act (“SFA”), the Financial Advisers Act (“FAA”), and the subsidiary legislation promulgated pursuant to these acts, which are administered by the Monetary Authority of Singapore (“MAS”). We and our employees conducting regulated activities specified in the SFA and/or the FAA are required to be licensed with the MAS. Failure to comply with applicable laws, regulations, codes, directives, notices, and guidelines issued by the MAS may result in penalties including fines, censures and the suspension or revocation of licenses granted by the MAS.
VCM is cleared by the Central Bank of Ireland, which regulates our Irish business activities, to act as an investment manager to Irish UCITS funds.
VCM is also licensed as an Australian Financial Services Licensee pursuant to section 913B of the Corporations Act 2001 subject to certain conditions and restrictions prescribed and contained within the license.
In connection with the proposed acquisition of Amundi Asset Management US, Inc., VCM and its affiliates applied for registration and/or exemptions in the following non-US jurisdictions:
•In the United Kingdom, RS Investments (UK) Limited (“RSUK”) applied to the Financial Conduct Authority (“FCA”) for authorization to conduct asset management activities in the United Kingdom. The application was approved by the FCA on January 27, 2025. Authorization by the FCA is required to conduct asset management and certain related activities under the Financial Services and Markets Act 2000 (the “FSMA”). The FCA’s rules adopted under the FSMA govern the majority of RSUK’s capital and liquidity resources requirements, senior management arrangements, conduct of business requirements, interaction with clients, and systems and controls, Breaches of the FCA’s rules may result in a wide range of disciplinary actions against RSUK and/or its employees;
•In Canada, VCM applied to the Ontario Securities Commission (“OSC”) to act as sub-adviser for OTC derivatives and to act as adviser with respect to “foreign contracts” as defined in OSC Rule 32-506. The application was approved under the international adviser and dealer exemptions on December 17, 2024; and
•In South Africa, VCM applied to the Financial Sector Conduct Authority (“FSCA”) for registration as a juristic representative. If appointed as a juristic representative VCM will be subject to certain fitness and propriety requirements imposed by the FSCA.
Compliance – Our legal and compliance functions consist of 15 professionals as of December 31, 2024. This group is responsible for all legal and regulatory compliance matters, as well as for monitoring adherence to client investment guidelines. Our legal and compliance teams work through a well‑established reporting and communication structure to ensure we have a consistent and holistic program for legal and regulatory compliance. Senior management also is involved at various levels in all these functions. We cannot assure that our legal and compliance functions will be effective in preventing all losses. Refer to “Item 1A. Risk Factors— General Risks — If our techniques for managing risk are ineffective, we may be exposed to material unanticipated losses.”
For more information about our regulatory environment, refer to “Risk Factors — Legal and Regulatory Risks — As an investment management firm, we are subject to extensive regulation” and “Risk Factors — Legal and Regulatory Risks —The regulatory environment in which we operate is subject to continual change and regulatory developments designed to increase oversight may materially adversely affect our business.”
Available Information
We routinely file annual, quarterly and current reports, proxy statements and other information required by the SEC. Our SEC filings are available to the public from the SEC’s public internet site at https://www.sec.gov.
We maintain a public internet site at ir.vcm.com and make available free of charge through this site our Annual Reports on Form 10-K, Quarterly Reports on Form 10-Q, Current Reports on Form 8-K, Proxy Statements and Forms 3, 4 and 5 filed on behalf of directors and executive officers, as well as any amendments to those reports filed or furnished pursuant to the Exchange Act, as soon as reasonably practicable after we electronically file such material with, or furnish it to, the SEC. We also post on our website the charters for our board of directors’ Audit Committee, Nominating, Governance and Sustainability Committee and Compensation Committee, as well as our Corporate Governance Guidelines, our Corporate Responsibility Statement, and our Code of Business Conduct and Ethics governing our directors, officers, and employees. The information on our website is not incorporated by reference into this annual report.
Item 1A. Risk Factors.
The risks described below are not the only ones facing us. The occurrence of any of the following risks or additional risks and uncertainties not presently known to us or that we currently believe to be immaterial could materially and adversely affect our business, financial condition or results of operations. In such case the trading price of our common stock could decline. This report also contains forward‑looking statements and estimates that involve risks and uncertainties. Our actual results could differ materially from those anticipated in the forward‑looking statements as a result of specific factors, including the risks and uncertainties described below.
Risk Factors Summary
The following is a summary of risks and uncertainties that affect our business, financial condition or results of operations. We are providing the following summary of risk factors to enhance readability of our risk factor disclosure. Material risks that may adversely affect our business, financial condition or results of operations include, but are not limited to, the following:
Market and Investment Performance Risks
•We earn substantially all of our revenues based on AUM, and any reduction in AUM would reduce our revenues and profitability.
•The ongoing conflicts in Ukraine and Israel have, and will likely continue to, negatively impact the global economy.
•We are exposed to risks arising from our International Activities.
•If our strategies perform poorly, clients could redeem their assets and we could suffer a decline in our AUM, which would reduce our earnings.
•The historical returns of our strategies may not be indicative of their future results or of the strategies we may develop in the future.
•We may support our money market funds to maintain their stable net asset values, or other products we manage, which could affect our revenues or operating results.
•The performance of our strategies or the growth of our AUM may be constrained by unavailability of appropriate investment opportunities.
Business Risks
•Pandemics have, and will likely continue to have, a negative impact on the global economy and interrupt normal business activity.
•The loss of key investment professionals or members of our senior management team could have a material adverse effect on our business.
•We derive substantially all of our revenues from contracts and relationships that may be terminated upon short or no notice.
•Investors in certain funds that we advise can redeem their assets from those funds at any time without prior notice.
•Investment recommendations provided to our direct investor channel may not be suitable or fulfill regulatory requirements; representatives may not disclose or address conflicts of interest, conduct
inadequate due diligence, provide inadequate disclosure; transactions may be subject to human error or fraud.
•The significant growth we have experienced over the past few years may be difficult to sustain and our growth strategy is dependent in part upon our ability to make and successfully integrate new strategic acquisitions.
•Our expenses are subject to fluctuations that could materially impact our results of operations.
•A significant proportion of our existing AUM is managed in long‑only investments.
•Our efforts to establish and develop new teams and strategies may be unsuccessful and could negatively impact our results of operations and could negatively impact our reputation and culture.
•An assignment could result in termination of our investment advisory agreements to manage SEC‑registered funds and could trigger consent requirements in our other investment advisory agreements.
•Our failure to comply with investment guidelines set by our clients, including the boards of registered funds, and limitations imposed by applicable law, could result in damage awards against us and a loss of AUM, either of which could adversely affect our results of operations or financial condition.
•We provide a broad range of services to the Victory Funds, VictoryShares and sub‑advised mutual funds which may expose us to liability.
•Potential impairment of goodwill and intangible assets could result in not realizing the value of these assets.
•If we were deemed an investment company required to register under the Investment Company Act of 1940 (the “Investment Company Act”), we would become subject to burdensome regulatory requirements and our business activities could be restricted.
Merger and Acquisition Risks
•We may not realize the benefits we expect from mergers and acquisitions because of integration difficulties and other challenges.
•Certain liabilities resulting from acquisitions are estimated and could lead to a material impact on earnings.
•Draft Merger Guidelines which is the framework that the Department of Justice and Federal Trade Commission utilize when reviewing mergers and acquisitions may impact our ability to execute on our corporate strategy.
Indebtedness Risks
•Our substantial indebtedness may expose us to material risks.
Capital Structure and Public Company Risks
•If a relatively large percentage of our common stock is concentrated with a small number of shareholders, it could increase the volatility in our stock trading and affect our share price.
•The market price of our common stock is likely to be volatile and could decline.
•Future sales of shares by shareholders could cause our stock price to decline.
•If securities or industry analysts publish misleading or unfavorable research about our business, our stock price and trading volume could decline.
•The requirements of being a public company may strain our resources and distract our management, which could make it difficult to manage our business.
•Failure to maintain effective internal control over financial reporting could have a material adverse effect on our business, operating results and stock price.
•Our ability to pay regular dividends is subject to our Board’s discretion and Delaware law.
•Future offerings of debt or equity securities may rank senior to our common stock.
•Provisions in our charter documents could discourage a takeover that shareholders may consider favorable.
•Our amended and restated certificate of incorporation provides that the Court of Chancery of the State of Delaware is the exclusive forum for substantially all disputes between us and our shareholders, which could limit our shareholders’ ability to obtain a favorable judicial forum for disputes with us or our directors, officers or employees.
Legal and Regulatory Risks
•As an investment management firm and brokerage firm, we are subject to extensive regulation.
•The regulatory environment in which we operate is subject to continual change and regulatory developments designed to increase oversight and may materially adversely affect our business.
Industry Risks
•Recent trends in the investment management industry could reduce our AUM, revenues and net income.
•The investment management industry is intensely competitive.
•Failure to address the increased transformative pressures affecting the asset management industry could negatively impact our business.
Third Party Risks
•We depend primarily on third parties to market Victory Funds and VictoryShares.
•We rely on third parties to provide products or services for the operation of our business, and a failure or inability by such parties to provide these products or services could materially adversely affect our business.
Operational and Cybersecurity Risks
•Operational risks may disrupt our business, result in losses or limit our growth.
•Failure to implement effective information and cyber security policies, procedures and capabilities could disrupt operations and cause financial losses.
•Disruption to the operations of third parties whose functions are integral to our ETF platform may adversely affect the prices at which VictoryShares trade, particularly during periods of market volatility.
General Risks
•Reputational harm could result in a loss of AUM and revenues.
•If our techniques for managing risk are ineffective, we may be exposed to material unanticipated losses.
•Certain of our strategies invest principally in the securities of non‑U.S. companies, which involve foreign currency exchange, tax, political, social and economic uncertainties and risks.
•The expansion of our business outside of the United States raises tax and regulatory risks, may adversely affect our profit margins and places additional demands on our resources and employees.
•Failure to properly address conflicts of interest could harm our reputation, business and results of operations.
•Our contractual obligations may subject us to indemnification obligations to third parties.
•Insurance may not be available on a cost-effective basis to protect us from liability.
•Failure to protect our intellectual property may negatively impact our business.
•Climate change may adversely affect our office locations.
Market and Investment Performance Risks
We earn substantially all of our revenues based on AUM, and any reduction in AUM would reduce our revenues and profitability. AUM fluctuates based on many factors, including investment performance, client withdrawals and difficult market conditions.
We earn substantially all of our revenues from asset‑based fees from investment management products and services to individuals and institutions. Therefore, if our AUM declines, our fee revenue will decline, which will reduce our profitability as certain of our expenses are fixed. There are several reasons that AUM could decline:
•The performance of our investment strategies is critical to our business, and any real or perceived negative absolute or relative performance could negatively impact the maintenance and growth of AUM. Net flows related to our strategies can be affected by investment performance relative to other competing strategies or to established benchmarks. Our investment strategies are rated, ranked, recommended or assessed by independent third parties, distribution partners, and industry periodicals and services. These assessments may influence the investment decisions of our clients. If the performance or assessment of our strategies is seen as underperforming relative to peers, it could result in an increase in the withdrawal of assets by existing clients and the inability to attract additional commitments from existing and new clients. In addition, certain of our strategies have or may have capacity constraints, as there is a limit to the number of securities available for the strategy to operate effectively. In those instances, we may choose to limit access to those strategies to new or existing investors, such as we have done for two mutual funds managed by the Sycamore Capital Franchise which had an aggregate of $24.9 billion in AUM as of December 31, 2024.
•General domestic and global economic and political conditions can influence AUM. Changes in interest rates, the availability and cost of credit, inflation rates, economic uncertainty, changes in laws, trade barriers, tariffs, commodity prices, currency exchange rates and controls and national and international political circumstances such as the increased tension between the U.S. and China (including wars (such as the military conflict between Russia and Ukraine and the conflict in Israel), pandemics, terrorist acts and security operations) and other conditions may impact the equity and credit markets, which may influence our AUM. If the security markets decline or experience volatility, our AUM and our revenues could be negatively impacted. In addition, diminishing investor confidence in the markets and/or adverse market conditions could result in a decrease in investor risk tolerance. Such a decrease could prompt investors to reduce their rate of commitment or to fully withdraw from markets, which could lower our overall AUM.
•Capital and credit markets can experience substantial volatility. The significant volatility in the markets in the recent past has highlighted the interconnection of the global markets and demonstrated how the deteriorating financial condition of one institution may materially adversely impact the performance of other institutions. In the event of extreme circumstances, including economic, political or business crises, such as a widespread systemic failure in the global financial system or failures of firms that have significant obligations as counterparties, we may suffer significant declines in AUM and severe liquidity or valuation issues.
•Changes in interest rates can have adverse effects on our AUM. Increases in interest rates may adversely affect the net asset values of our AUM. Furthermore, increases in interest rates may result in reduced prices in equity markets. Conversely, decreases in interest rates could lead to outflows in fixed income assets that we manage as investors seek higher yields.
Any of these factors could reduce our AUM and revenues and, if our revenues decline without a commensurate reduction in our expenses, would lead to a reduction in our net income.
Continued geopolitical uncertainty such as the ongoing conflicts in Ukraine and Israel and tension between the U.S., China, North Korea, Iran and Russia has, and will likely continue to, negatively impact the global economy.
Continued geopolitical uncertainty such as the ongoing conflicts in Ukraine and Israel and tension between the U.S. and China, North Korea, Iran and Russia has created significant volatility, uncertainty and economic disruption. While it has not had a material adverse effect on our business, operations and financial results, the extent to which the geopolitical uncertainty and conflicts impact our business, operations and financial results going forward will depend on numerous evolving factors that we may not be able to accurately predict, including:
the duration and scope of the uncertainty and conflicts; governmental and business actions that have been and continue to be taken in response, and the impact on economic activity.
We are exposed to risks arising from our International Activities
In addition to having an office Singapore and UK subsidiary, we provide investment management services in a number of jurisdictions outside of the United States. Our international operations require us to comply with the legal and regulatory requirements of various foreign jurisdictions and expose us to political environments and risks that can compare less favorably than those in the United States.
Our foreign business operations and services are also subject to the following risks:
•difficulty in managing, operating, and marketing our international service;
•the inability to transact in various investments or to repatriate the proceeds from our investments from countries outside the U.S.; and
•the potential nationalization of our property or that of the companies in our investment portfolios;
•significant adverse changes in international legal and regulatory environments.
If our strategies perform poorly, clients could redeem their assets and we could suffer a decline in our AUM, which would reduce our earnings.
The performance of our strategies is critical in retaining existing client assets as well as attracting new client assets. If our strategies perform poorly for any reason, our earnings could decline because:
•our existing clients may redeem their assets from our strategies or terminate their relationships with us;
•the Morningstar and Lipper ratings and rankings of mutual funds and ETFs we manage may decline, which may adversely affect the ability of those funds to attract new or retain existing assets; and
•third‑party financial intermediaries, advisors or consultants may remove our investment products from recommended lists due to poor performance or for other reasons, which may lead our existing clients to redeem their assets from our strategies or reduce asset inflows from these third parties or their clients.
Our strategies can perform poorly for a number of reasons, including: general market conditions; investor sentiment about market and economic conditions; investment styles and philosophies; investment decisions; global events; the performance of the companies in which our strategies invest and the currencies in which those investment are made; the fees we charge; the liquidity of securities or instruments in which our strategies invest; and our inability to identify sufficient appropriate investment opportunities for existing and new client assets on a timely basis. In addition, while we seek to deliver long‑term value to our clients, volatility may lead to under‑performance in the short term, which could adversely affect our results of operations.
In addition, when our strategies experience strong results relative to the market, clients’ allocations to our strategies typically increase relative to their other investments and we sometimes experience withdrawals as our clients rebalance their investments to fit their asset allocation preferences despite our strong results.
While clients do not have legal recourse against us solely on the basis of poor investment results, if our strategies perform poorly, we are more likely to become subject to litigation brought by dissatisfied clients. In addition, to the extent clients are successful in claiming that their losses resulted from fraud, negligence, willful misconduct, breach of contract or other similar misconduct, these clients may have remedies against us, the mutual funds and other pooled investment vehicles we advise and/or our investment professionals under various U.S. and non‑U.S. laws.
The historical returns of our strategies may not be indicative of their future results or of the strategies we may develop in the future.
The historical returns of our strategies and the ratings and rankings we or the mutual funds, ETFs and other pooled investment vehicles that we advise have received in the past should not be considered indicative of the future results of these strategies or of any other strategies that we may develop in the future. The investment performance we achieve for our clients varies over time and the variance can be wide. The ratings and rankings we or the mutual funds, ETFs and other pooled investment vehicles that we advise have received are typically
revised monthly. Our strategies’ returns have benefited during some periods from investment opportunities and positive economic and market conditions. In other periods, general economic and market conditions have negatively affected investment opportunities and our strategies’ returns. These negative conditions may occur again, and in the future, we may not be able to identify and invest in profitable investment opportunities within our current or future strategies.
New strategies that we launch or acquire in the future may present new and different investment, regulatory, operational, distribution and other risks than those presented by our current strategies. New strategies may invest in instruments with which we have no or limited experience, create portfolios that present new or different risks or have higher performance expectations that are more difficult to meet. Any real or perceived problems with future strategies or vehicles could cause a disproportionate negative impact on our business and reputation.
We may support our money market funds to maintain their stable net asset values, or other products we manage, which could affect our revenues or operating results.
Approximately 2% of our AUM as of December 31, 2024, consisted of assets in money market funds. Money market funds seek to preserve a stable net asset value. Market conditions could lead to severe liquidity or security pricing issues, which could impact the NAV of money market funds. If the NAV of a money market fund managed by our asset managers were to fall below its stable net asset value, we would likely experience significant redemptions in AUM and reputational harm, which could have a material adverse effect on our revenues or net income. If a money market fund's stable NAV comes under pressure, we may elect, to provide credit, liquidity, or other support to the fund. We may also elect to provide similar or other support, including by providing liquidity to a fund, to other products we manage for any number of reasons. If we elect to provide support, we could incur losses from the support we provide and incur additional costs, including financing costs, in connection with the support. These losses and additional costs could be material and could adversely affect our earnings. In addition, certain proposed regulatory reforms could adversely impact the operating results of our money market funds.
The performance of our strategies or the growth of our AUM may be constrained by unavailability of appropriate investment opportunities.
The ability of our investment teams to deliver strong investment performance depends in large part on their ability to identify appropriate investment opportunities in which to invest client assets. If the investment team for any of our strategies is unable to identify sufficient appropriate investment opportunities for existing and new client assets on a timely basis, the investment performance of the strategy could be adversely affected. In addition, if we determine that sufficient investment opportunities are not available for a strategy, we may choose to limit the growth of the strategy by limiting the rate at which we accept additional client assets for management under the strategy, closing the strategy to all or substantially all new investors or otherwise taking action to limit the flow of assets into the strategy. If we misjudge the point at which it would be optimal to limit access to or close a strategy, the investment performance of the strategy could be negatively impacted. The risk that sufficient appropriate investment opportunities may be unavailable is influenced by a number of factors, including general market conditions, but is particularly acute with respect to our strategies that focus on small‑ and mid‑cap equities, and is likely to increase as our AUM increases, particularly if these increases occur very rapidly. By limiting the growth of strategies, we may be managing the business in a manner that reduces the total amount of our AUM and our investment management fees over the short term.
Business Risks
Pandemics have, and will likely continue to have, a negative impact on the global economy and interrupt normal business activity.
The extent to which pandemics impact our business, operations and financial results will depend on numerous factors that we may not be able to accurately predict, including: the duration and scope of the pandemic; governmental, business and individuals’ actions taken in response to the pandemic; the impact of the pandemic on economic activity and actions taken in response; and the effect on our ability to sell and provide our services.
The loss of key investment professionals or members of our senior management team could have a material adverse effect on our business.
We depend on the skills and expertise of our portfolio managers and other investment professionals and our success depends on our ability to retain the key members of our investment teams, who possess substantial
experience in investing and have been primarily responsible for the historical investment performance we have achieved.
Because of the tenure and stability of our portfolio managers, our clients may attribute the investment performance we have achieved to these individuals. The departure of a portfolio manager could cause clients to withdraw assets from the strategy, which would reduce our AUM, investment management fees and our net income. The departure of a portfolio manager also could cause consultants and intermediaries to stop recommending a strategy, clients to refrain from allocating additional assets to the strategy or delay such additional assets until a sufficient new track record has been established and could also cause the departure of other portfolio managers or investment professionals. We have instituted succession planning at our Franchises in an attempt to minimize the disruption resulting from these potential changes, but we cannot predict whether such efforts will be successful.
We also rely upon the contributions of our senior management team to establish and implement our business strategy and to manage the future growth of our business. The loss of any of the senior management team could limit our ability to successfully execute our business strategy or adversely affect our ability to retain existing and attract new client assets and related revenues.
Any of our investment or management professionals may resign at any time, join our competitors or form a competing company. Although many of our portfolio managers and each of our named executive officers are subject to post‑employment non‑compete obligations, these non‑competition provisions may not be enforceable or may not be enforceable to their full extent. In addition, we may agree to waive non‑competition provisions or other restrictive covenants applicable to former investment or management professionals in light of the circumstances surrounding their relationship with us. Although we may pursue legal actions for alleged breaches of non-compete or other restrictive covenants, such legal actions may not be effective in preventing such breaches. In addition, the Federal Trade Commission (FTC) proposed a rule in April 2024 that would prevent employers from entering into non-competes with employees and require employers to rescind existing non-competes. The FTC's rule has been the subject of legal challenges and certain courts have issued nationwide injunctions preventing enforcement of the rule. The FTC is appealing these decisions so enforceability of non-compete agreements continues to remail uncertain. Furthermore, certain states like Minnesota, North Dakota and Oklahoma have implemented comparable or more stringent regulations, while California has broadened the scope of its longstanding restrictions on non-competes. If this rule goes into effect, more states adopt similar rules. We do not generally carry “key man” insurance that would provide us with proceeds in the event of the death or disability of any of the key members of our investment or management teams.
Competition for qualified investment and management professionals is intense and we may fail to successfully attract and retain qualified personnel in the future. Our ability to attract and retain these personnel will depend heavily on the amount and structure of compensation and opportunities for equity ownership we offer. Any cost‑reduction initiative or adjustments or reductions to compensation or changes to our equity ownership culture could cause instability within our existing investment teams and negatively impact our ability to retain key personnel. In addition, changes to our management structure, corporate culture and corporate governance arrangements could negatively impact our ability to retain key personnel.
We derive substantially all of our revenues from contracts and relationships that may be terminated upon short or no notice.
We derive substantially all of our revenues from investment advisory and sub‑advisory agreements as well as fund administration and accounting, agreements with the Victory Funds and VictoryShares and transfer agency agreements with the Victory Portfolios III (the “Victory Funds III”), all of which are terminable by clients or our funds’ boards upon short notice or no notice.
Our investment advisory agreements with registered funds, which are funds registered under the Investment Company Act of 1940, as amended, or the 1940 Act, including mutual funds and ETFs, are generally terminable by the funds’ boards or a vote of a majority of the funds’ outstanding voting securities on not more than 60 days’ written notice, as required by law. After an initial term (not to exceed two years), each registered fund’s investment advisory agreement must be approved and renewed annually by that fund’s board, including by its independent members. We maintain a long history of renewing these agreements. In addition, all of our separate account clients and certain of the mutual funds that we sub‑advise have the ability to re‑allocate all or any portion of the assets that we manage away from us at any time with little or no notice. When a sub‑adviser terminates its sub‑advisory agreement to manage a fund that we advise there is a risk that investors in the fund
could redeem their assets in the fund, which would cause our AUM to decrease. Similarly, our fund administration, accounting, and transfer agency agreements are subject to annual fund board approval.
These investment advisory and other agreements and client relationships may be terminated or not renewed for any number of reasons. The decrease in revenues that could result from the termination of a material client relationship or group of client relationships could have a material adverse effect on our business.
Investors in certain funds that we advise can redeem their assets from those funds at any time without prior notice.
Investors in the mutual funds and certain other pooled investment vehicles that we advise or sub‑advise may redeem their assets from those funds at any time on fairly limited or no prior notice, thereby reducing our AUM. These investors may redeem for any number of reasons, including general financial market conditions, global events, the absolute or relative investment performance we have achieved, or their own financial conditions and requirements. In a declining stock market, the pace of redemptions could accelerate. Poor investment performance relative to other funds tends to result in decreased client commitments and increased redemptions. For the year ended December 31, 2024, we generated approximately 84% of our total revenues from mutual funds and other pooled investment vehicles that we advise (including our proprietary mutual funds, or the Victory Funds, VictoryShares, and other entities for which we are adviser or sub‑adviser). The redemption of assets from those funds could adversely affect our revenues and have a material adverse effect on our earnings.
Investment recommendations provided to our direct investor channel may not be suitable or fulfill regulatory requirements; representatives may not disclose or address conflicts of interest, conduct inadequate due diligence, provide inadequate disclosure; transactions subject to human error or fraud.
The direct channel serves existing or potential individual investors who invest in our proprietary mutual funds, ETFs and the USAA 529 Education Savings Plan. Investors also have the ability to invest in third party mutual funds, third party ETFs and individual equity securities listed on major U.S. exchanges on a self-directed basis. Our broker-dealer subsidiary has a dedicated retail investor-facing sales team who discuss the merits of investing in our proprietary products. The sales team provides recommendations based on the investor’s needs to aid them in their decision making. Our sales team’s recommendations may not fulfill regulatory requirements as a result of their failing to collect sufficient information about an investor or failing to understand the investor’s needs or risk tolerances. Risks associated with providing recommendations also include those arising from how we disclose and address actual or potential conflicts of interest, inadequate due diligence, inadequate disclosure, human error and fraud. In addition, Regulation Best Interest imposes heightened conduct standards, suitability analysis and disclosure requirements when we provide recommendations to retail investors. To the extent that we fail to satisfy regulatory requirements, fail to know our investors, improperly advise these investors, or risks associated with providing investment recommendations otherwise materialize, we could be found liable for losses suffered by such investors, or could be subject to regulatory fines, and penalties, any of which could harm our reputation and business.
We may be subject to claims of unsuitable investments. If individual investors suffer losses on their investment they may seek compensation from us on the basis of allegations that their investments were not suitable or that the fund prospectuses or other marketing materials contained material errors or were misleading. Despite the controls relating to disclosure in fund prospectuses and marketing materials, it is possible that such action may be successful, which in turn could adversely affect the business, financial condition and results of operations.
The significant growth we have experienced over the past few years may be difficult to sustain and our growth strategy is dependent in part upon our ability to make and successfully integrate new strategic acquisitions.
Our total client assets has increased from $17.9 billion following our 2013 management‑led buyout with Crestview GP from KeyCorp to $176.1 billion as of December 31, 2024, primarily as a result of acquisitions. The absolute measure of our AUM represents a significant rate of growth that may be difficult to sustain. The continued long‑term growth of our business will depend on, among other things, successfully making new acquisitions, achieving our synergies, retaining key investment professionals, maintaining existing strategies and selectively developing new, value‑added strategies. There is no certainty that we will be able to identify suitable candidates for acquisition at prices and terms we consider attractive, consummate any such acquisition on acceptable terms, have sufficient resources to complete an identified acquisition or that our strategy for pursuing acquisitions will be effective. In addition, any acquisition can involve a number of risks, including the
existence of known, unknown or contingent liabilities. An acquisition may impose additional demands on our staff that could strain our operational resources and require expenditure of substantial legal, investment banking and accounting fees. We may be required to issue additional shares of common stock or spend significant cash to consummate an acquisition, resulting in dilution of ownership or additional debt leverage, or spend additional time and money on facilitating the acquisition that otherwise would be spent on the development and expansion of our existing business.
We may not be able to successfully manage the process of integrating an acquired company’s people and other applicable assets to extract the value and synergies projected to be realized in connection with the acquisition. The process of integrating operations could cause an interruption of, or loss of momentum in, the activities of one or more of our combined businesses and the possible loss of key personnel and AUM. The diversion of management’s attention and any delays or difficulties encountered in connection with acquisitions and the integration of an acquired company’s operations could have an adverse effect on our business.
Our business growth will also depend on our success in achieving superior investment performance from our strategies, as well as our ability to maintain and extend our distribution capabilities, to deal with changing market and industry conditions, to maintain adequate financial and business controls and to comply with new legal and regulatory requirements arising in response to both the increased sophistication of the investment management industry and the significant market and economic events of the last decade.
We may not be able to manage our growing business effectively or be able to sustain the level of growth we have achieved historically.
Our expenses are subject to fluctuations that could materially impact our results of operations.
Our results of operations are dependent upon the level of our expenses, which can vary from period to period. We have certain fixed expenses that we incur as a going concern, and some of those expenses are not subject to adjustment. If our revenues decrease, without a corresponding decrease in expenses, our results of operations would be negatively impacted. While a majority of our expenses are variable, and we attempt to project expense levels in advance, there is no guarantee that an unforeseen expense will not arise or that we will be able to adjust our variable expenses quickly enough to match a declining revenue base. Consequently, either event could have either a temporary or permanent negative impact on our results of operations.
A significant proportion of our existing AUM is managed in long‑only investments.
As of December 31, 2024, approximately 82% of our AUM was invested in U.S. and international equity. Under market conditions in which there is a general decline in the value of equity securities, the AUM in each of our equity strategies is likely to decline. Unlike some of our competitors, we do not currently offer strategies that invest in privately held companies or take short positions in equity securities, which could offset some of the poor performance of our long‑only equity strategies under such market conditions. Even if our investment performance remains strong during such market conditions relative to other long‑only equity strategies, investors may choose to withdraw assets from our management or allocate a larger portion of their assets to non‑long‑only or non‑equity strategies. In addition, the prices of equity securities may fluctuate more widely than the prices of other types of securities, making the level of our AUM and related revenues more volatile.
As of December 31, 2024, of the 82% of our AUM invested in U.S. and international equity approximately 26% of the AUM was concentrated in U.S. small‑ and mid‑cap equities. As a result, a substantial portion of our operating results depends upon the performance of those investments, and our ability to retain client assets in those investments. If a significant portion of the investors in such investments decided to withdraw their assets or terminate their investment advisory agreements for any reason, including poor investment performance or adverse market conditions, our revenues from those investments would decline, which would have a material adverse effect on our earnings and financial condition.
As of December 31, 2024, approximately 17% of our total AUM was invested in U.S. taxable and tax-exempt fixed-income and money market securities. While fixed-income is typically considered less volatile than the equity markets, it does exhibit different types of risks such as interest rate risk, credit risk, and over-the-counter liquidity risk. Also, retention of fixed income AUM depends upon the performance of those investments, and our ability to retain client assets in those investments. If a significant portion of the investors in such investments decided to withdraw their assets or terminate their investment advisory agreements for any reason, including poor investment performance or adverse market conditions, our revenues from those investments would decline, which would have a material adverse effect on our earnings and financial condition. Money market securities are about 2% of total AUM and are considered a low risk asset category.
In addition, we have historically derived substantially all of our revenue from clients in the United States. If economic conditions weaken or slow, particularly in the United States, this could have a substantial adverse impact on our results of operations.
New lines of business or new products and services may subject us to additional risk.
From time to time, we may implement new lines of business or offer new products and services within existing lines of business. There are substantial risks and uncertainties associated with these efforts, particularly in instances where the markets are not fully developed. In developing and marketing new lines of business and/or new products and services, we may invest significant time and resources and price and profitability targets may not prove feasible. External factors, such as competitive alternatives and shifting market preferences, may also impact the successful implementation of a new line of business and/or a new product or service. Furthermore, strategic planning remains important as we adopt innovative products, services, and processes in response to the evolving demands for financial services and the entrance of new competitors. Any new line of business and/or new product or service could have a significant impact on the effectiveness of our system of internal controls, so we must responsibly innovate in a manner that is consistent with sound risk management and is aligned with the overall business strategies. Failure to successfully manage these risks in the development and implementation of new lines of business and/or new products or services could have a material adverse effect on our business, results of operations and financial condition.
Our efforts to establish and develop new teams and strategies may be unsuccessful and could negatively impact our results of operations and could negatively impact our reputation and culture.
We seek to add new investment teams that invest in a way that is consistent with our philosophy of offering high value‑added strategies. We also look to offer new strategies managed by our existing teams. We expect the costs associated with establishing a new team and/or strategy initially to exceed the revenues generated, which will likely negatively impact our results of operations. If new strategies, whether managed by a new team or by an existing team, invest in instruments, or present operational issues and risks, with which we have little or no experience, it could strain our resources and increase the likelihood of an error or failure.
In addition, the historical returns of our existing strategies may not be indicative of the investment performance of any new strategy, and the poor performance of any new strategy could negatively impact the reputation of our other strategies.
We may support the development of new strategies by making one or more seed investments using capital that would otherwise be available for our general corporate purposes and acquisitions. Making such a seed investment could expose us to potential capital losses.
An assignment could result in termination of our investment advisory agreements and could trigger consent requirements in our other investment advisory agreements.
Under the 1940 Act, each of the investment advisory agreements between registered funds and our subsidiary, VCM, and investment sub‑advisory agreements between the investment adviser to a registered fund and VCM, will terminate automatically in the event of its assignment, as defined in the 1940 Act.
Assignment, as generally defined under the 1940 Act and the Investment Advisers Act of 1940, as amended, or the Advisers Act, includes direct assignments as well as assignments that may be deemed to occur, under certain circumstances, upon the direct or indirect transfer of a “controlling block” of our outstanding voting securities. A transaction is not an assignment under the 1940 Act or the Advisers Act if it does not result in a change of actual control or management of VCM.
Upon the occurrence of such an assignment, VCM could continue to act as adviser or sub‑adviser to any such registered fund only if that fund’s board and shareholders approved a new investment advisory agreement, except in the case of certain of the registered funds that we sub‑advise for which only board approval would be necessary pursuant to a manager‑of‑managers SEC exemptive order. In addition, as required by the Advisers Act, each of the investment advisory agreements for the separate accounts and pooled investment vehicles we manage provides that it may not be assigned, as defined in the Advisers Act, without the consent of the client. In addition, the investment advisory agreements for certain pooled investment vehicles we manage outside the U.S. contain provisions requiring board approval and or client consent before they can be assigned. If an assignment were to occur, we cannot be certain that we would be able to obtain the necessary approvals from the boards and shareholders of the registered funds we advise or the necessary consents from our separate account or pooled investment vehicle clients.
If an assignment of an investment advisory agreement is deemed to occur, and our clients do not consent to the assignment or enter into a new agreement, our results of operations could be materially and adversely affected.
Our failure to comply with investment guidelines set by our clients, including the boards of registered funds, and limitations imposed by applicable law, could result in damage awards against us and a loss of AUM, either of which could adversely affect our results of operations or financial condition.
When clients retain us to manage assets on their behalf, they generally specify certain guidelines regarding investment allocation and strategy that we are required to follow in managing their assets. The boards of registered funds we manage generally establish similar guidelines regarding the investment of assets in those funds. We are also required to invest the registered funds’ assets in accordance with limitations under the 1940 Act and applicable provisions of the Internal Revenue Code of 1986, as amended, or the Internal Revenue Code. Other clients, such as plans subject to the Employee Retirement Income Security Act of 1974, as amended, or ERISA, or non‑U.S. funds and pooled investment vehicles, require us to invest their assets in accordance with applicable law. Our failure to comply with any of these guidelines and other limitations could result in losses to clients or investors in a fund which, depending on the circumstances, could result in our obligation to make clients or fund investors whole for such losses. If we believed that the circumstances did not justify a reimbursement, or clients and investors believed the reimbursement we offered was insufficient, they could seek to recover damages from us or could withdraw assets from our management or terminate their investment advisory agreement with us. Any of these events could harm our reputation and materially adversely affect our business.
We provide a broad range of services to the Victory Funds, VictoryShares and sub‑advised mutual funds which may expose us to liability.
We provide a broad range of administrative services to the Victory Funds and VictoryShares, including providing personnel to the Victory Funds and VictoryShares to serve as directors and officers, the preparation or supervision of the preparation of the Victory Funds' and VictoryShares’ regulatory filings, maintenance of board calendars and preparation or supervision of the preparation of board meeting materials, management of compliance and regulatory matters, provision of shareholder services and communications, accounting services, including the supervision of the activities of the Victory Funds’ and VictoryShares’ accounting services provider in the calculation of the funds’ net asset values, supervision of the preparation of the Victory Funds’ and VictoryShares’ financial statements and coordination of the audits of those financial statements, tax services, including calculation of dividend and distribution amounts and supervision of tax return preparation, supervision of the work of the Victory Funds’ and VictoryShares’ other service providers, VCTA acting as transfer agent to the Victory Funds III and VCS acting as a distributor for the Victory Funds. If we make a mistake in the provision of those services, the Victory Funds or VictoryShares could incur costs for which we might be liable. In addition, if it were determined that the Victory Funds or VictoryShares failed to comply with applicable regulatory requirements as a result of action or failure to act by our employees, we could be responsible for losses suffered or penalties imposed. In addition, we could have penalties imposed on us, be required to pay fines or be subject to private litigation, any of which could decrease our future income or negatively affect our current business or our future growth prospects. Although less extensive than the range of services we provide to the Victory Funds and VictoryShares, we also provide a limited range of services, in addition to investment management services, to sub‑advised mutual funds.
In addition, we from time to time provide information to the funds for which we act as sub‑adviser (or to a person or entity providing administrative services to such a fund), and to the UCITS, for which we act as investment manager (or to the promoter of the UCITS or a person or entity providing administrative services to such a UCITS), which is used by those funds or UCITS in their efforts to comply with various regulatory requirements. If we make a mistake in the provision of those services, the sub‑advised fund or UCITS could incur costs for which we might be liable. In addition, if it were determined that the sub‑advised fund or UCITS failed to comply with applicable regulatory requirements as a result of action or failure to act by our employees, we could be responsible for losses suffered or penalties imposed. In addition, we could have penalties imposed on us, be required to pay fines or be subject to private litigation, any of which could decrease our future income or negatively affect our current business or our future growth prospects.
Potential impairment of goodwill and intangible assets could result in not realizing the value of these assets.
As of December 31, 2024, our goodwill and intangible assets totaled $2.2 billion. The value of these assets may not be realized for a variety of reasons, including, but not limited to, significant redemptions, loss of clients, damage to brand name and unfavorable economic conditions. In accordance with the guidance under Financial Accounting Standards Board, or FASB, ASC 350‑20, Intangibles—Goodwill and Other, we review the carrying value of goodwill and intangible assets not subject to amortization on an annual basis, or more frequently if indications exist suggesting that the fair value of our intangible assets may be below their carrying value. Determining goodwill and intangible assets, and evaluating them for impairment, requires significant management estimates and judgment, including estimating value and assessing useful life in connection with the allocation of purchase price in the acquisition creating them. We evaluate the value of intangible assets subject to amortization on an annual basis and whenever events or changes in circumstances indicate that the carrying amount of an asset may not be recoverable. Should such reviews indicate impairment, a reduction of the carrying value of the intangible asset could occur.
If we were deemed an investment company required to register under the 1940 Act, we would become subject to burdensome regulatory requirements and our business activities could be restricted.
Generally, a company is an “investment company” required to register under the 1940 Act if, absent an applicable exception or exemption, it (i) is, or holds itself out as being, engaged primarily, or proposes to engage primarily, in the business of investing, reinvesting or trading in securities; or (ii) engages, or proposes to engage, in the business of investing, reinvesting, owning, holding or trading in securities and owns or proposes to acquire “investment securities” having a value exceeding 40% of the value of its total assets (exclusive of U.S. government securities and cash items) on an unconsolidated basis.
We hold ourselves out as an investment management firm and do not propose to engage primarily in the business of investing, reinvesting or trading in securities. We believe we are engaged primarily in the business of providing investment management services and not in the business of investing, reinvesting or trading in securities. We also believe our primary source of income is properly characterized as income earned in exchange for the provision of services. We believe less than 40% of our total assets (exclusive of U.S. government securities and cash items) on an unconsolidated basis comprise assets that could be considered investment securities.
We intend to conduct our operations so that we will not be deemed an investment company required to register under the 1940 Act. However, if we were to be deemed an investment company required to register under the 1940 Act, restrictions imposed by the 1940 Act, including limitations on our capital structure and our ability to transact with our affiliates, could make it impractical for us to continue our business as currently conducted and could have a material adverse effect on our financial performance and operations.
Merger and Acquisition Risks
We may not realize the benefits we expect from mergers and acquisitions because of integration difficulties and other challenges.
We regularly review, and from time to time have discussions on and engage in, potential transactions, including potential acquisitions of other asset managers or their assets, consolidations, equity method investments or similar transactions, some of which may be material. The success of these transactions will depend in large part on the success of integrating the personnel, operations, strategies, technologies and other components of the businesses following the completion of the transaction. The Company may fail to realize some or all of the anticipated benefits if the integration process takes longer than expected or is more costly than expected. The failure of the Company to meet the challenges involved in successfully integrating the operations or to otherwise realize any of the anticipated benefits could impair the operations of the Company. Potential difficulties that we may encounter in the integration process include the following:
•the integration of personnel, operations, strategies, technologies and support services;
•the disruption of ongoing businesses and distraction of their respective personnel from ongoing business concerns;
•the retention of the existing clients;
•the retention of key intermediary distribution relationships;
•the integration of corporate cultures and maintenance of employee morale;
•the retention of key employees;
•the creation of uniform standards, controls, procedures, policies and information systems;
•the reduction of the costs associated with combining operations;
•the consolidation and rationalization of information technology platforms and administrative infrastructures; and
•potential unknown liabilities;
The anticipated benefits and synergies include the elimination of duplicative personnel, realization of efficiencies in consolidating duplicative corporate, business support functions and amortization of purchased intangibles for tax purposes. However, these anticipated benefits and synergies assume a successful integration and are based on projections, which are inherently uncertain, and other assumptions. Even if integration is successful, anticipated benefits and synergies may not be achieved.
Certain liabilities resulting from acquisitions are estimated and could lead to a material impact on earnings.
Through our acquisition activities, we may record liabilities for future contingent earnout payments that are to be settled in cash. The fair value of these liabilities is assessed on a quarterly basis and changes in assumptions used to determine the amount of the liability could lead to an adjustment that may have a material impact, favorable or unfavorable, on our results of operations.
Draft Merger Guidelines may impact our Ability to Execute on our Corporate Strategy
On July 19, 2023, the Department of Justice (“DoJ”) and the Federal Trade Commission (“FTC”) jointly released the 2023 Draft Merger Guidelines which describe factors and frameworks the agencies utilize when reviewing mergers and acquisitions. The Draft Merger Guidelines provide that, under a variety of circumstances, the DoJ and FTC may challenge transactions that may not have been challenged under the current guidelines and this could have a material impact on our ability to execute on our corporate strategy. On October 10, 2024, the Federal Trade Commission (FTC) unanimously approved changes to the premerger filings required under the Hart-Scott-Rodino (HSR) Act. HSR filings will need to comply with the new rules beginning in mid- to late January 2025. The changes will require a dramatic increase in the information and documents to be submitted with most HSR filings, leading to a corresponding increase in the time, burden and expense of preparing these filings and may have an impact on transaction timelines.
Indebtedness Risks
Our substantial indebtedness may expose us to material risks.
As of December 31, 2024, we had approximately $972 million of outstanding debt that consisted of (i) an existing term loan balance of $625 million and (ii) incremental term loans in an aggregate principal amount of $347 million. In addition, we maintain a $100 million revolving credit facility, though no amounts were outstanding as of December 31, 2024.
Our substantial indebtedness may make it more difficult for us to withstand or respond to adverse or changing business, regulatory and economic conditions or to take advantage of new business opportunities or make necessary capital expenditures. In addition, the 2019 Credit Agreement contains financial and operating covenants that may limit our ability to conduct our business. While we are currently in compliance in all material respects with the financial and operating covenants under the 2019 Credit Agreement, we cannot assure that at all times in the future we will satisfy all such financial and operating covenants (or any such covenants applicable at the time) or obtain any required waiver or amendment, in which event all outstanding indebtedness could become immediately due and payable. This could result in a substantial reduction in our liquidity and could challenge our ability to meet future cash needs of the business.
To the extent we service our debt from our cash flow, such cash will not be available for our operations or other purposes. Because of our significant debt service obligations, the portion of our cash flow used to service those obligations could be substantial if our revenues decline, whether because of market declines or for other reasons. Any substantial decrease in net operating cash flows or any substantial increase in expenses could make it difficult for us to meet our debt service requirements or force us to modify our operations. Our ability to repay the principal amount of any outstanding loans under the 2019 Credit Agreement, to refinance our debt or
to obtain additional financing through debt or the sale of additional equity securities will depend on our performance, as well as financial, business and other general economic factors affecting the credit and equity markets generally or our business in particular, many of which are beyond our control. Any such alternatives may not be available to us on satisfactory terms or at all.
2021 Debt Refinancing
On February 18, 2021, we entered into the Second Amendment (the “Second Amendment”) to the 2019 Credit Agreement (as amended by the First Amendment to the Credit Agreement dated as of January 17, 2020, the “2020 Term Loans”) with the other loan parties thereto, Barclays Bank PLC, as administrative agent and collateral agent, the Royal Bank of Canada as fronting bank, and the lenders party thereto from time to time. Pursuant to the Second Amendment, the Company refinanced the 2020 Term Loans with replacement term loans in an aggregate principal amount of $755.7 million (the “Repriced Term Loans”). The Repriced Term Loans provide for substantially the same terms as the Existing Term Loans, including the same maturity date of July 1, 2026, except that the Repriced Term Loans provide for a reduced applicable margin on LIBOR of 25 basis points. The applicable margin on LIBOR under the Repriced Term Loans is 2.25%, compared to 2.50% under the Existing Term Loans.
2021 Incremental Term Loans
On December 31, 2021, we entered into the Third Amendment (the “Third Amendment”) to the 2019 Credit Agreement with the guarantors party thereto, Barclays Bank PLC, as administrative agent, and the lenders party thereto from time to time. Pursuant to the Third Amendment, the Company obtained incremental term loans (the “2021 Incremental Term Loans”) in an aggregate principal amount of $505.0 million and used the proceeds to fund the acquisition of 100% of the equity interest of WestEnd Advisors, LLC and to pay fees and expenses incurred in connection therewith. The 2021 Incremental Term Loans will mature in December 2028 and will bear interest at an annual rate equal to, at the option of the Company, either LIBOR (adjusted for reserves and subject to a 50 basis point floor) plus a margin of 2.25% or an alternate base rate plus a margin of 1.25%.
2022 LIBOR to Term SOFR Rate Transition
On September 23, 2022, the Company entered into the Fourth Amendment (the “Fourth Amendment”) to the 2019 Credit Agreement to change the interest rate on its debt from LIBOR to a rate based on the secured overnight financing rate (“SOFR”) plus a ten-basis point credit spread adjustment. There was no change to the applicable margin on the referenced rate as a result of the Fourth Amendment.
The LIBOR rate loans outstanding as of the Fourth Amendment’s effective date continued as LIBOR rate loans until the end of their current interest periods. The 2021 Incremental Term Loans converted into Term SOFR loans on September 30, 2022, while the Repriced Term Loans converted into Term SOFR loans on October 6, 2022. Also on October 6, 2022, the interest periods for the Repriced Term Loans and 2021 Incremental Term Loans were aligned and the three-month Term SOFR rate was elected for all the Company’s term loans.
Fifth Amendment
On June 7, 2024, the Company entered into the Fifth Amendment to the 2019 Credit Agreement, extending the maturity date of the $100.0 million senior secured first lien revolving facility from July 1, 2024 to March 31, 2026, and decreasing the drawn interest rate margin by 0.50% per annum. The revolving facility otherwise remains subject to substantially the same terms as those set forth in the 2019 Credit Agreement.
On July 1, 2024, the Company executed an agency succession agreement, by and among Barclays Bank PLC as the resigning administrative agent and collateral agent under the 2019 Credit Agreement and Royal Bank of Canada, as the successor administrative agent and collateral agent.
Capital Structure and Public Company Risks
If a relatively large percentage of our Common Stock was concentrated with a small number of shareholders, it could increase the volatility in our stock trading and affect our share price.
If a large percentage of our common stock was held by a limited number of shareholders, our larger shareholders could decide to liquidate their positions, which could cause significant fluctuation in the share price of our common stock. Public companies with a relatively concentrated level of institutional shareholders, often have difficulty generating trading volume in their stock, which may increase the volatility in the price of the common stock.
Crestview GP owns a significant amount of our common stock and its interests may conflict with ours or other shareholders’ in the future.
Crestview GP does not hold any of our common stock, but beneficially owns 12.0% of our common stock as of December 31, 2024. As a result, Crestview GP has the ability to elect members of our board of directors and thereby significantly influence our policies and operations, including the appointment of management, future issuances of our common stock or other securities, the payment of dividends, if any, on our common stock, the incurrence of debt by us, amendments to our amended and restated certificate of incorporation and amended and restated bylaws, and the entering into of extraordinary transactions. Crestview GP may also be able to significantly influence all matters requiring shareholder approval including without limitation a change in control of us or a change in the composition of our board of directors and or precluding any acquisition of us. This significant voting control could deprive other shareholders of an opportunity to receive a premium for shares of their common stock as part of a sale of us and ultimately might affect the market price of our common stock. Further, the interests of Crestview GP may not in all cases be aligned with other shareholders’ interests.
In addition, Crestview GP may have an interest in pursuing acquisitions, divestitures and other transactions that, in its judgment, could enhance its investment, even though such transactions might involve risks to other shareholders. For example, Crestview GP could influence us to make acquisitions that increase our indebtedness or sell revenue‑generating assets. Crestview GP is in the business of making investments in companies and may from time to time acquire and hold interests in businesses that compete directly or indirectly with us. Our amended and restated certificate of incorporation provides that none of Crestview GP or any of their respective affiliates will have any duty to refrain from engaging, directly or indirectly, in the same business activities or similar business activities or lines of business in which we operate. Crestview GP may pursue acquisition opportunities that may be complementary to our business, and, as a result, those acquisition opportunities may not be available to us, which could have an adverse effect on our growth prospects.
The market price of our Common Stock is likely to be volatile and could decline.
The stock market in general has been highly volatile. As a result, the market price and trading volume for our Common Stock may also be highly volatile, and investors our Common Stock may experience a decrease in the value of their shares, including decreases unrelated to our operating performance or prospects. Factors that could cause the market price of our Common Stock to fluctuate significantly include:
•our operating and financial performance and prospects and the performance of other similar companies;
•our quarterly or annual earnings or those of other companies in our industry;
•conditions that impact demand for our products and services;
•the public’s reaction to our press releases, financial guidance and other public announcements, and filings with the SEC;
•changes in earnings estimates or recommendations by securities or research analysts who track our Common Stock;
•market and industry perception of our level of success in pursuing our growth strategy;
•strategic actions by us or our competitors, such as acquisitions or restructurings;
•changes in government and other regulations; changes in accounting standards, policies, guidance, interpretations or principles;
•departure of key personnel;
•the number of shares publicly traded;
•sales of our Common Stock by us, our investors or members of our management team; and
•changes in general market, economic and political conditions in the U.S. and global economies or financial markets, including those resulting from natural disasters, telecommunications failures, cyber‑attacks, civil unrest in various parts of the world, acts of war, terrorist attacks or other catastrophic events.
Any of these factors may result in large and sudden changes in the trading volume and market price of our Common Stock.
Following periods of volatility in the market price of a company’s securities, shareholders often file securities class‑action lawsuits against such company. Our involvement in a class‑action lawsuit could divert our senior management’s attention and, if adversely determined, could have a material and adverse effect on our business, financial condition and results of operations.
Future sales of shares by shareholders could cause our stock price to decline.
Sales of substantial amounts of our Common Stock in the public market, or the perception that these sales could occur, could cause the market price of our Common Stock to decline. As of February 19, 2025, 63,661,988 shares of our Common Stock are outstanding. Shares of our Common Stock are freely tradable without restriction under the Securities Act, unless purchased by our “affiliates,” as that term is defined in Rule 144 under the Securities Act.
In the future, we may issue additional shares of common stock or other equity or debt securities convertible into common stock in connection with a financing, acquisition or employee arrangement, or in certain other circumstances. Any of these issuances could result in substantial dilution to our existing shareholders and could cause the trading price of our Common Stock to decline.
If securities or industry analysts publish misleading or unfavorable research about our business, our stock price and trading volume could decline.
The trading market for our Common Stock will depend in part on the research and reports that securities or industry analysts publish about us or our business. If one or more of these analysts downgrades our shares or publishes misleading or unfavorable research about our business, our stock price would likely decline. If one or more of these analysts ceases coverage of us or fails to publish reports on us regularly, demand for our shares could decrease, which could cause our stock price or trading volume to decline.
The requirements of being a public company may strain our resources and distract our management, which could make it difficult to manage our business.
Prior to February 2018, we operated as a private company and had not been subject to the same financial and other reporting and corporate governance requirements of a public company. As a public company, we are required to file annual, quarterly and other reports with the SEC. We need to prepare and timely file financial statements that comply with SEC reporting requirements. We also are subject to other reporting and corporate governance requirements under the listing standards of NASDAQ and the Sarbanes‑Oxley Act, which impose significant compliance costs and obligations upon us. Being a public company requires a significant commitment of additional resources and management oversight, which add to operating costs. These changes place significant additional demands on our compliance, finance and accounting staff, which may not have prior public company experience or experience working for a public company, and on our financial accounting and information systems, and we may need to, in the future, hire additional accounting and financial staff with appropriate public company reporting experience and technical accounting knowledge. Other expenses associated with being a public company include increases in auditing, accounting, compliance and legal fees and expenses, investor relations expenses, increased directors’ fees and director and officer liability insurance costs, registrar and transfer agent fees and listing fees, as well as other expenses. As a public company, we are required, among other things, to:
•prepare and file periodic reports, and distribute other shareholder communications, in compliance with the federal securities laws and the NASDAQ rules;
•define and expand the roles and the duties of our board of directors and its committees;
•institute more comprehensive compliance, investor relations and internal audit functions; and
•evaluate and maintain our system of internal control over financial reporting, and report on management’s assessment thereof, in compliance with rules and regulations of the SEC.
In particular, the Sarbanes‑Oxley Act requires us to document and test the effectiveness of our internal control over financial reporting in accordance with an established internal control framework, and to report on our conclusions as to the effectiveness of our internal controls. In addition, we are required under the Exchange Act to maintain disclosure controls and procedures and internal control over financial reporting. Any failure to
implement required new or improved controls, or difficulties encountered in their implementation, could harm our operating results or cause us to fail to meet our reporting obligations. If we are unable to conclude that we have effective internal control over financial reporting, investors could lose confidence in the reliability of our financial statements. This could result in a decrease in the value of our Common Stock. Failure to comply with the Sarbanes‑Oxley Act could potentially subject us to sanctions or investigations by the SEC or other regulatory authorities.
In addition, the SEC recently adopted certain rules and is engaged in considering other rules that will increase our public reporting and disclosure requirements, key initiatives and rules likely to impact our business.
Executive Compensation Clawback Rules
In October 2023, the Company adopted an executive compensation clawback policy in order to comply with new Section 10D and Rule 10D-1 of the Exchange Act, and the listing standards of NASDAQ, providing for the repayment or forfeiture of certain excess compensation following an applicable accounting restatement from persons who served as an executive officer of VCH at any time during the performance period for such incentive-based compensation and who received such compensation during the three fiscal years preceding the date on which VCH is required to prepare an accounting restatement.
Issuer Share Repurchase Plan Disclosure
In May 2023, the SEC adopted final rules requiring additional disclosure of issuer share repurchases, requiring expanded quarterly reporting in tabular format of detailed information regarding share repurchases made by or on behalf of an issuer during the quarter as well as narrative disclosure regarding issuer share repurchase programs and policies. The rules also require new quarterly disclosure of whether a U.S. issuer has adopted or terminated a Rule 10b5-1 trading plan during the quarter, similar to the required disclosure of the adoption and termination of such plans by an issuer’s directors and officers. We are now subject to the new issuer disclosure requirements in our quarterly reports.
Cybersecurity Disclosure
In July 2023, the SEC adopted amendments to its rules to require disclosure which became effective in December 2023 regarding cybersecurity risk management, strategy, governance and incident reporting by public companies. The SEC’s adopted amendments require public companies to (i) disclose, on a current basis, any cybersecurity incident it deems to be material within four business days on a Form 8-K; (ii) describe, on a periodic basis, the company’s processes, if any, for the assessment, identification and management of material risks from cybersecurity threats, as well as whether any risks from cybersecurity threats have materially affected or are reasonably likely to materially affect their business strategy, results of operations or financial condition; and (iii) describe, on a periodic basis, the board’s oversight of risks from cybersecurity threats and management’s role in assessing and managing those risks. We have complied with our disclosure requirements, however the amendments will require ongoing evaluation and analysis of possible changes in our applicable processes and procedures, including regarding cyber incident response plans and procedures, disclosure analysis framework, risk management processes, and board oversight structure.
Responsible Investing and Climate-Related Disclosure
Responsible investing (including the integration of ESG factors) continue to be the focus of increased regulatory and legal scrutiny across jurisdictions. In the U.S., the SEC adopted, but subsequently stayed implementation of, climate disclosure rules to require public issuers to include enhanced disclosure and financial metrics regarding corporate climate- related information in their periodic reports and registration statements, and these rules remain subject to applicable legal challenges. In addition, state laws and regulations regarding these topics continue to evolve and impose further requirements. For example, in October 2023, California enacted a new climate accountability package pursuant to its Climate Corporate Data Accountability Act that requires annual disclosure of certain greenhouse gas emissions and Climate-Related Financial Risk Act that requires biennial disclosure of certain climate-related financial risks and mitigation measures, each beginning in 2026, subject to applicable implementing regulations and rulemaking that may impact final scope and compliance timing. Also, the SEC has increased its focus on disclosure and compliance related to Responsible Investment strategies of investment advisers and funds. Globally, the International Sustainability Standards Board and applicable sustainability disclosure standards impact how
national regulators and governance bodies approach these and related topics.
Failure to maintain effective internal control over financial reporting could have a material adverse effect on our business, operating results and stock price.
Section 404 of the Sarbanes-Oxley Act and related SEC rules require that we perform an annual management assessment of the design and effectiveness of our internal control over financial reporting. Our assessment concluded that our internal control over financial reporting was effective as of December 31, 2024; however, there can be no assurance that we will be able to maintain the adequacy of our internal control over financial reporting, as such standards are modified, supplemented or amended from time to time in future periods. Accordingly, we cannot assure that we will be able to conclude on an ongoing basis that we have effective internal control over financial reporting in accordance with Section 404 of the Sarbanes-Oxley Act. Moreover, effective internal control is necessary for us to produce reliable financial reports and is important to help prevent financial fraud. If we cannot provide reliable financial reports or prevent fraud, our business and operating results could be harmed, investors could lose confidence in our reported financial information, and the trading price of our Common Stock could drop significantly.
Our ability to pay regular dividends is subject to our Board’s discretion and Delaware law.
We intend to pay dividends to holders of our Common Stock as described in “Dividend Policy.” Our board of directors may, in its sole discretion, change the amount or frequency of dividends or discontinue the payment of dividends entirely. In making decisions regarding our quarterly dividends, we consider general economic and business conditions, our strategic plans and prospects, our businesses and investment opportunities, our financial condition and operating results, working capital requirements and anticipated cash needs, contractual restrictions (including under the terms of our Fifth Amendment to the 2019 Credit Agreement) and legal, tax, regulatory and such other factors as we may deem relevant.
Future offerings of debt or equity securities may rank senior to our Common Stock.
If we decide to issue debt securities in the future, which would rank senior to shares of our common stock, it is likely that they will be governed by an indenture or other instrument containing covenants restricting our operating flexibility. We and, indirectly, our shareholders will bear the cost of issuing and servicing such securities. We may also issue preferred equity, which will have superior rights relative to our common stock, including with respect to voting and liquidation.
Furthermore, if our future access to public markets is limited or our performance decreases, we may need to carry out a private placement or public offering of our Common Stock at a lower price than the price at which investors purchased their shares.
Because our decision to issue debt, preferred or other equity or equity‑linked securities in any future offering will depend on market conditions and other factors beyond our control, we cannot predict or estimate the amount, timing or nature of our future offerings. Thus, holders of our Common Stock will bear the risk of our future offerings reducing the market price of our Common Stock and diluting the value of their shareholdings in us.
Provisions in our charter documents could discourage a takeover that shareholders may consider favorable.
Certain provisions in our governing documents could make a merger, tender offer or proxy contest involving us difficult, even if such events would be beneficial to the interests of our shareholders. Among other things, these provisions:
•permit our board of directors to establish the number of directors and fill any vacancies and newly created directorships;
•authorize the issuance of “blank check” preferred stock that our board of directors could use to implement a shareholder rights plan;
•provide that our board of directors is expressly authorized to amend or repeal any provision of our bylaws;
•restrict the forum for certain litigation against us to Delaware;
•establish advance notice requirements for nominations for election to our board of directors or for proposing matters that can be acted upon by shareholders at annual shareholder meetings;
•establish a classified board of directors with three classes of directors and the removal of directors only for cause;
•require that actions to be taken by our shareholders be taken only at an annual or special meeting of our shareholders, and not by written consent;
•establish certain limitations on convening special shareholder meetings; and
•restrict business combinations with interested shareholders.
These provisions may delay or prevent attempts by our shareholders to replace members of our management by making it more difficult for shareholders to replace members of our board of directors, which is responsible for appointing the members of our management. Anti‑takeover provisions could depress the price of our common stock by acting to delay or prevent a change in control of us.
Our amended and restated certificate of incorporation provides that the Court of Chancery of the State of Delaware is the exclusive forum for substantially all disputes between us and our shareholders, which could limit our shareholders’ ability to obtain a favorable judicial forum for disputes with us or our directors, officers or employees.
Our amended and restated certificate of incorporation provides that the Court of Chancery of the State of Delaware is the exclusive forum for any derivative action or proceeding brought on our behalf, any action asserting a breach of fiduciary duty, any action asserting a claim against us arising pursuant to the Delaware General Corporation Law, our amended and restated certificate of incorporation or our amended and restated bylaws or any action asserting a claim against us that is governed by the internal affairs doctrine. This choice of forum provision may limit a shareholder’s ability to bring a claim in a judicial forum that it finds favorable for disputes with us or our directors, officers or other employees and may discourage these types of lawsuits.
Legal and Regulatory Risks
As an investment management and brokerage firm, we are subject to extensive regulation.
Investment management firms are subject to extensive regulation in the United States, primarily at the federal level, including regulation by the SEC under the 1940 Act and the Advisers Act, by the U.S. Department of Labor, or the DOL, under ERISA, by the Commodity Futures Trading Commission, or the CFTC, by the National Futures Association, or NFA, under the Commodity Exchange Act, and by the Financial Industry Regulatory Authority, Inc., or FINRA. The U.S. mutual funds and ETFs we manage are registered with and regulated by the SEC as investment companies under the 1940 Act. The Advisers Act imposes numerous obligations on investment advisers, including recordkeeping, advertising, compliance and operating requirements, conflict of interest and supervision requirements, disclosure obligations and prohibitions on fraudulent activities. The 1940 Act imposes similar obligations, as well as additional detailed operational requirements, on registered funds, which must be adhered to by their investment advisers. Investment advisers also are subject to certain state securities laws and regulations. Non-compliance with the Advisers Act, the 1940 Act or other federal and state securities laws and regulations could result in investigations, sanctions, disgorgement, fines, reputational damage, or loss of registration to conduct advisory business.
Trading and investment activities conducted by the investment adviser for its client accounts are regulated under the Exchange Act, as well as the rules of various securities exchanges and self-regulatory organizations, including laws governing trading on inside information, market manipulation and a broad number of technical requirements (e.g., short sale limits, volume limitations and reporting obligations) and market regulation policies. Violation of any of these laws and regulations could result in fines or sanctions, as well as restrictions on the investment management firm’s activities and damage to its reputation.
Certain client accounts subject the investment adviser to the Employee Retirement Income Security Act of 1974, as amended (“ERISA”), and to regulations promulgated thereunder by the DOL, since we act as a “fiduciary” under ERISA with respect to benefit plan clients that are subject to ERISA. ERISA and applicable provisions of the Internal Revenue Code impose certain duties on persons who are fiduciaries under ERISA,
require the investment adviser to carry bonds insuring against losses caused by fraud or dishonesty, prohibit certain transactions involving ERISA plan clients and impose excise taxes for violations of these prohibitions, and mandate certain required periodic reporting and disclosures. ERISA also imposes additional compliance, reporting and operational requirements on investment advisers that otherwise are not applicable to clients that are not subject to ERISA.
The Direct Investor Business allows Investors to leverage our open architecture brokerage option and establish brokerage accounts to invest in mutual funds and ETFs from our platform along with individual stocks and products managed by third-party providers including cash management capabilities, these brokerage activities are likely to result in increased focus from FINRA as we will have to comply with extensive regulations imposed by FINRA.
We have also expanded our distribution effort into non‑U.S. markets through partnered distribution efforts and product offerings, including Australia, Europe, Japan, Canada, and Singapore. In the future, we may further expand our business outside of the United States in such a way or to such an extent that we may be required to register with additional foreign regulatory agencies or otherwise comply with additional non‑U.S. laws and regulations that do not currently apply to us and with respect to which we do not have compliance experience. Our lack of experience in complying with any such non‑U.S. laws and regulations may increase our risk of being subject to regulatory actions and becoming party to litigation in such non‑U.S. jurisdictions, which could be more expensive. Moreover, being subject to regulation in multiple jurisdictions may increase the cost, complexity and time required for engaging in transactions that require regulatory approval.
Accordingly, we face the risk of significant intervention by regulatory authorities, including extended investigation and surveillance activity, adoption of costly or restrictive new regulations and judicial or administrative proceedings that may result in substantial penalties. Among other things, we could be fined, lose our licenses or be prohibited or limited from engaging in some of our business activities or corporate transactions. The requirements imposed by our regulators are designed to ensure the integrity of the financial markets and to protect clients and other third parties who deal with us and are not designed to protect our shareholders. Consequently, these regulations often serve to limit our activities, including through net capital, client protection and market conduct requirements.
The regulatory environment in which we operate is subject to continual change and regulatory developments designed to increase oversight may materially adversely affect our business.
We operate in a legislative and regulatory environment that is subject to continual change, the nature of which we cannot predict. We may be adversely affected as a result of new or revised legislation or regulations imposed by the SEC, other U.S. or non‑U.S. governmental regulatory authorities or self‑regulatory organizations that supervise the financial markets or the investment products that we offer. The SEC and its staff are currently engaged in various initiatives and reviews that seek to improve and modernize the regulatory structure governing the asset management industry, and registered investment companies in particular. In addition, more recently the SEC has also adopted rules, many of which are currently in an implementation period, and is contemplating and drafting others which will increase our public reporting and disclosure requirements, which could be costly and may impede the Company’s growth.
In the U.S., the new presidential administration may shift enforcement priorities under existing regulations, alter existing regulations, or pursue additional rulemaking impacting the financial services industry, whereas certain state and other governmental entities may seek to maintain existing, or implement potentially more rigorous, regulatory requirements in response, which, coupled with legal challenges to a number of significant regulations and judicial decisions regarding administrative law, may create uncertainty or lead to divergent interpretations of law, or change the requirements applicable to our and our affiliates’ businesses.
Key initiatives and rules that the SEC is contemplating that are likely to impact our business include:
Form N-PORT and Form N-CEN Reporting; Guidance on Open-End Fund Liquidity Risk
On August 28, 2024, the SEC adopted amendments to reporting requirements on Forms N-PORT and N-CEN that apply to certain registered investment companies. The amendments require more frequent reporting of
monthly portfolio holdings and related information to the Commission and the public, amend certain reporting requirements, and require open-end funds to report information about service providers used to comply with liquidity risk management program requirements.
This rule, as adopted, has created additional operational complexities and increase Victory Capital’s administrative burden and costs.
Anti-Money Laundering/Countering the Financing of Terrorism Program and Suspicious Activity Report Filing Requirements for Registered Investment Advisers
On September 4, 2024, FinCEN issued a final rule to include certain investment advisers in the definition of “Financial Institution” under the Bank Secrecy Act (BSA).
This rule, as adopted, subjects investment advisers to similar requirements applicable to other Victory entities and will increase administrative burdens and costs.
U.S. Department of Labor ("DOL") Reforms
The DOL’s 2024 amended fiduciary rule broadening the definition of who is considered an “investment advice fiduciary” to a retirement investor, and adding significant restrictions and requirements for the use of prohibited transaction exemptions typically relied upon by investment firms such as ours, remains subject to applicable legal challenges. Under the new rule, a financial services provider that provides one-time advice to a retirement investor may become subject to the Employee Retirement Income Security Act (ERISA) fiduciary standard. In addition to the 2024 fiduciary rule, the DOL amended the Qualified Professional Asset Manager (QPAM) exemption as of June 2024, which many investment firms have relied upon when providing services to and engaging in transactions on behalf of applicable retirement plans, individual retirement accounts (IRAs) and/or certain commingled investment vehicles that have retirement plan investors. The QPAM amendment makes material changes and imposes additional conditions and affirmative requirements for the ongoing use of such exemption.
Customer Identification Programs for Registered Investment Advisers and Exempt Reporting Advisers
On May 13, 2024, FinCEN and the SEC jointly issued a proposed rule that would require investment advisers to have reasonable procedures to verify the identity of their customers.
The rule, as proposed, will subject investment advisers to similar requirements to other Victory entities and will increase administrative burdens and costs.
Regulation S-P: Privacy of Consumer Financial Information and Safeguarding Customer Information
Privacy and Data Protection. There continues to be an increased regulatory and enforcement focus with respect to the protection of individuals’ privacy and personal data around the world, and the ongoing need to secure and ensure only appropriate collection and use of sensitive customer, personnel, and others’ personal data. A majority of the jurisdictions where we operate are covered, or we expect will be covered, by stringent privacy and data protection laws and regulations.
On May 16, 2024, the SEC adopted amendments to Regulation S-P to require certain firms to adopt written policies and procedures for incident response policies to address unauthorized access to or use of customer information, including procedures for timely notification to individuals impacted by an incident.
As the regulatory focus on privacy continues to intensify and laws and regulations concerning the management of personal data continue to expand, risks related to the handling of privacy obligations and personal data collection across our business will increase. For example, in addition to international data protection and privacy laws and regulations like the EU’s GDPR, we are, and expect to continue to be, subject to and affected by existing, new and evolving country, federal and state laws, regulations and guidance around the world impacting consumer and personnel privacy, and various other U.S. state consumer privacy laws that provide for enhanced consumer protections for their residents and impose requirements for the handling, disclosure and deletion of personal information of their residents.
Investment Company Names Rule
On September 20, 2023, the SEC adopted amendments to Rule 35d-1 under the Investment Company Act of 1940, the fund “Names Rule.” The final amendments among other things:
•Improve and expand the current requirement for certain registered funds to adopt a policy to invest at least 80 percent of their assets in accordance with the investment focus the fund’s name suggests;
•Providing new enhanced disclosure and reporting requirements; and
•Define a time for funds that deviate from their 80% Investment Policy to come back into compliance.
This rule, as passed, will significantly increase registered funds disclosures and compliance obligations, and create additional operational complexities for the Victory Funds.
Shortening the Securities Transaction Settlement Cycle
On February 15, 2023, the SEC adopted rules to shorten the settlement cycle for most securities transactions from two business days after trade date (T+2) to one (T+1). This rule, as adopted, may present additional operational burdens and settlement risk for the Company.
SEC Proposed Enhancements to Custody Rule
In February 2023, the SEC proposed amendments to and a redesignation of the current custody rule, currently designated as Rule 206(4)-2. The proposal redesignates the custody rule as rule 223-1 and would enhance the rule’s protections and subject a broader array of client assets and advisory activities to the enhanced protections. If such proposal is passed, this rule could introduce operational complexity and additional costs to Victory Capital and its advisory clients.
Industry Risks
Recent trends in the investment management industry could reduce our AUM, revenues and net income.
Certain passive products and asset classes, such as index and certain types of ETFs, are becoming increasingly popular with investors, including institutional investors. In recent years, across the investment management industry, passive products have experienced inflows and traditional actively managed products have experienced outflows, in each case, in the aggregate. In order to maintain appropriate fee levels in a competitive environment, we must be able to continue to provide clients with investment products and services that are viewed as appropriate in relation to the fees charged, which may require us to demonstrate that our strategies can outperform such passive products. If our clients, including our funds’ boards, were to view our fees as being high relative to the market or the returns provided by our investment products, we may choose to reduce our fee levels or existing clients may withdraw their assets in order to invest in passive products, and we may be unable to attract additional commitments from existing and new clients, which would lead to a decline in our AUM and market share. To the extent we offer such passive products, we may not be able to compete with other firms offering similar products.
Our revenues and net income are dependent on our ability to maintain current fee levels for the products and services we offer. The competitive nature of the investment management industry has led to a trend toward lower fees in certain segments of the investment management market. Our ability to sustain fee levels depends on future growth in specific asset classes and distribution channels. These factors, as well as regulatory changes, could further inhibit our ability to sustain fees for certain products. A reduction in the fees charged by us could reduce our revenues and net income.
Our fees vary by asset class and produce different revenues per dollar of AUM based on factors such as the type of assets being managed, the applicable strategy, the type of client and the client fee schedule. Institutional clients may have significant negotiating leverage in establishing the terms of an advisory relationship, particularly with respect to the level of fees paid, and the competitive pressure to attract and retain institutional clients may impact the level of fee income earned by us. We may decline to manage assets from potential clients who demand lower fees even though such assets would increase our revenue and AUM in the short term.
The investment management industry is intensely competitive.
The investment management industry is intensely competitive, with competition based on a variety of factors, including investment performance, fees, continuity of investment professionals and client relationships, the quality of services provided to clients, corporate positioning and business reputation, continuity of selling arrangements with intermediaries and differentiated products. A number of factors, including the following, serve to increase our competitive risks:
•a number of our competitors have greater financial, technical, marketing and other resources, more comprehensive name recognition and more personnel than we do;
•potential competitors have a relatively low cost of entering the investment management industry;
•certain investors may prefer to invest with an investment manager that is not publicly traded based on the perception that a publicly traded asset manager may focus on the manager’s own growth to the detriment of investment performance for clients;
•other industry participants, hedge funds and alternative asset managers may seek to recruit our investment professionals; and
•certain competitors charge lower fees for their investment management services than we do.
Additionally, intermediaries through which we distribute our funds may also sell their own proprietary funds and investment products, which could limit the distribution of our strategies. If we are unable to compete effectively, our earnings could be reduced and our business could be materially adversely affected.
Failure to address the increased transformative pressures affecting the asset management industry could negatively impact our business.
The asset management industry is facing transformative pressures and trends from a variety of different sources including increased fee pressure; a continued shift away from actively managed core equities and fixed income strategies towards alternative, passive and smart beta strategies; increased demands from clients and distributors for client engagement and services; a trend towards institutions developing fewer relationships and partners and reducing the number of investment managers they work with; increased regulatory activity and scrutiny of many aspects of the asset management industry, including ESG practices and related matters, transparency/unbundling of fees, inducements, conflicts of interest, capital, liquidity, solvency, leverage, operational risk management, controls and compensation; advances in technology and digital wealth and distribution tools and increasing client interest in interacting digitally with their investment portfolios; and growing digital asset markets that remain subject to substantial volatility and significant regulatory uncertainty. As a result of the trends and pressures discussed above, the asset management industry is facing an increased level of disruption. If we are unable to adapt our strategy and business to address adequately these trends and pressures, we may be unable to meet client needs satisfactorily, our competitive position may weaken, and our business results and operations may be adversely affected.
Third Party Risks
We depend primarily on third parties to market and sell our products.
Our ability to attract additional assets to manage in the United States is highly dependent on our access to third‑party intermediaries. We gain access to investors in the Victory Funds and VictoryShares primarily through consultants, 401(k) platforms, broker‑dealers, financial advisors and mutual fund platforms through which shares of the funds are sold. We have relationships with certain third‑party intermediaries through which we access clients in multiple distribution channels.
We compensate most of the intermediaries through which we gain access to investors in the Victory Funds and VictoryShares by paying fees, most of which are a percentage of assets invested in the Victory Funds and VictoryShares through that intermediary and with respect to which that intermediary provides shareholder and administrative services. The allocation of such fees between us and the Victory Funds and VictoryShares is determined by the board of the Victory Funds and VictoryShares, based on information and a recommendation from us, with the intent of allocating to us all costs attributable to marketing and distribution of (i) shares of the Victory Funds otherwise covered by distribution fees paid pursuant to a distribution and service plan adopted in accordance with Rule 12b‑1 under the 1940 Act and (ii) VictoryShares.
In the future, our expenses in connection with those intermediary relationships could increase if the portion of those fees determined to be in connection with marketing and distribution, or otherwise allocated to us,
increased. Clients of these intermediaries may not continue to be accessible to us on terms we consider commercially reasonable, or at all. The absence of such access could have a material adverse effect on our results of operations.
We access institutional clients primarily through consultants. Our institutional business is dependent upon referrals from consultants. Many of these consultants review and evaluate our products and our firm from time to time. Poor reviews or evaluations of either a particular strategy or us as an investment management firm may result in client withdrawals or may impair our ability to attract new assets through these consultants.
In connection with the Amundi transaction, the Amundi Parties, the Company and VCM, have entered into an Off-Shore Master Distribution and Services Agreement and an On-Shore Master Distribution and Services Agreement (the “Distribution and Services Agreements”) which will become effective on closing of the transaction.
We will depend on the Amundi parties to distribute Victory products outside the United States and create investment vehicles to provide investment management services with respect to any US active asset management products
Under the Distribution Agreements, (1) the Amundi Parties will have the exclusive right, subject to certain exceptions, to distribute Victory’s products outside of the United States; (2) Victory will have the exclusive right, subject to certain exceptions, to provide investment management services with respect to any US active asset management products to the Amundi Parties for distribution outside the United States; (3) Victory will have the exclusive right, subject to certain exceptions, to distribute the Amundi Parties’ products in the United States; and (4) the Amundi Parties will have the exclusive right, subject to certain exceptions, to provide investment advisory or investment management services with respect to any non-US active asset management products to Victory for distribution in the United States. Victory will be entitled to a percentage of fee revenues derived from Victory’s products that the Amundi Parties distribute outside the United States, and the Amundi Parties will be entitled to a percentage of fee revenues derived from the Amundi Parties’ products that Victory distributes in the United States. The Distribution and Services Agreements will continue until the 15th anniversary of the date of the closing of the Amundi transaction, and automatically renew thereafter and remain effective for successive five-year terms. The Distribution and Services Agreements may be terminated under certain limited circumstances. Given the exclusive distribution arrangement with the Amundi Parties, outside the United States we will be dependent on Amundi’s distribution and sales channels to sell our products, and we do not control the ultimate investment recommendations given by them to clients. In addition, we will be dependent on Amundi to create investment vehicles to provide investment management services with respect to any US active asset management products
We rely on third parties to provide products or services for the operation of our business, and a failure or inability by such parties to provide these products or services could materially adversely affect our business.
We have determined, based on an evaluation of various factors, that it is more efficient to use third parties for certain functions and services. As a result, we have contracted with a limited number of third parties to provide critical operational support, such as middle‑ and back‑office functions, information technology services and various fund administration and accounting roles, and the funds contract with third parties in custody, transfer agent and sub transfer agent roles. The third parties with which we do business may also be sources of cybersecurity or other technological risks. While we engage in certain actions to reduce the exposure, such as collaborating to develop secure transmission capabilities, performing security control assessments and limiting third party access to the least privileged level necessary to perform job functions, our business would be disrupted if key service providers become unable to continue to perform the services upon which we depend or fail to protect against or respond to cyber-attacks, data breaches or other incidents. Moreover, to the extent our third‑party providers increase their pricing, our financial performance will be negatively impacted. In addition, upon termination of a third‑party contract, we may encounter difficulties in replacing the third‑party on favorable terms, transitioning services to another vendor, or in assuming those responsibilities ourselves, which may have a material adverse effect on our business.
Operational and Cybersecurity Risks
Operational risks may disrupt our business, result in losses or limit our growth.
We are heavily dependent on the capacity and reliability of the communications, information and technology systems supporting our operations, whether developed, owned and operated by us or by third parties. We also rely on manual workflows and a variety of manual user controls. Operational risks such as trading or other operational errors or interruption of our financial, accounting, trading, compliance and other data processing systems, whether caused by human error, fire, other natural disaster or pandemic, power or telecommunications failure, cyberattack or viruses, act of terrorism or war or otherwise, could result in a disruption of our business, liability to clients, regulatory intervention or reputational damage, and thus materially adversely affect our business. The potential for some types of operational risks, including, for example, trading errors, may be increased in periods of increased volatility, which can magnify the cost of an error. Insurance and other safeguards might not be available or might only partially reimburse us for our losses.
Although we have backup systems in place, our backup procedures and capabilities in the event of a failure or interruption may not be adequate. As our client base, number and complexity of strategies and client relationships increase, developing and maintaining our operational systems and infrastructure may become increasingly challenging. We may also suffer losses due to employee negligence, fraud or misconduct. Non‑compliance with policies, employee misconduct, negligence or fraud could result in legal liability, regulatory sanctions and serious reputational or financial harm. It is not always possible to deter or detect employee misconduct and the precautions we take to prevent and detect this activity may not always be effective. Employee misconduct could have a material adverse effect on our business.
Failure to implement effective information and cyber security policies, procedures and capabilities could disrupt operations and cause financial losses.
We electronically receive, process, store and transmit sensitive information of our clients including personal data, such as, without limitation, names, addresses, social security numbers, and driver's license numbers, which may be necessary to support our clients’ investment transactions. The uninterrupted operation of our information systems, as well as the confidentiality of the customer information that resides on such systems, is critical to our successful operation. Bad actors may attempt to harm us by gaining access to confidential or proprietary client information, often with the intent of stealing from or defrauding us or our clients. In some cases, they seek to disrupt our ability to conduct our business, including by destroying information maintained by us. As a financial services provider, cybersecurity represents one of our principal operational risks. Our operations depend on effective information and cybersecurity policies, procedures and capabilities to provide secure processing, storage and transmission of confidential and other information across our computer systems, software, networks, and mobile devices, as well as third-party vendors. Although we maintain a system of internal controls designed to provide reasonable assurance that fraudulent activity is either prevented or detected on a timely basis and we take other protective measures and endeavor to modify them as circumstances warrant, our computer systems, software, networks and mobile devices may be vulnerable to cyberattacks, sabotage, unauthorized access, computer viruses, worms or other malicious code, and other events that have a security impact. In addition, our interconnectivity with service providers and other third parties may be adversely affected if any of them are subject to a successful cyberattack or other information security event. Although we collaborate with service providers and third parties to develop secure transmission capabilities and cyberattack protections, we cannot ensure we or any third party maintain appropriate controls to protect information confidentiality.
An externally caused information security incident, such as a cyberattack, which could include computer viruses, malware, malicious or destructive code, social engineering, phishing, denial-of-service attacks, ransomware, identity theft, or an internally caused issue, such as failure to control access to sensitive systems, could materially interrupt business operations or cause disclosure or modification of sensitive or confidential client or competitive information and could result in material financial loss, loss of competitive position, regulatory actions, breach of client contracts, reputational harm or legal liability. If one or more such events occur, it could potentially jeopardize our or our clients’, employees’ or counterparties’ confidential and other information processed and stored in, and transmitted through, our or third‑party computer systems, software, networks and mobile devices, or otherwise cause interruptions or malfunctions in our, our clients’, our counterparties’ or third parties’ operations. As a result, we could experience material financial loss, loss of
competitive position, regulatory fines and/or sanctions, breach of client contracts, reputational harm or legal liability, which, in turn, could have an adverse effect on our financial condition and results of operations.
As a provider of financial services, we are bound by the disclosure limitations and if we fail to comply with these regulations and industry security requirements, we could be exposed to damages from legal actions from clients, governmental proceedings, governmental notice requirements, and the imposition of fines or prohibitions on the services we provide. Additionally, some of our client contracts require us to indemnify clients in the event of a cyber breach if our systems do not meet minimum security standards. We may be required to spend significant additional resources to modify our protective measures or to investigate and remediate vulnerabilities or other exposures, and we may be subject to litigation and financial losses that are either not insured against fully or not fully covered through any insurance that we maintain. Further, in the event of a security breach to a service provider, we may not receive timely notice of or sufficient information about the breach to be able to exert any meaningful control or influence over how and when the breach is addressed.
Increasing government and regulatory scrutiny of the measures taken by companies to protect against cyberattacks and data privacy breaches, and have resulted in heightened security requirements, including additional regulatory expectations for oversight of vendors and service providers. If more restrictive privacy laws, rules or industry security requirements are adopted in the future on the Federal or State level, or by a specific industry body, they could have an adverse impact on us through increased costs or business restrictions.
Any inability to prevent security or privacy breaches, or the perception that such breaches may occur, could cause our existing clients to lose confidence in our systems and terminate their agreements with us, inhibit our ability to attract new clients, result in increasing regulation, or bring about other adverse consequences from the government agencies that regulate our business.
We may use artificial intelligence (“AI”) in our business, and challenges with properly managing its use could result in reputational harm, competitive harm, and legal liability, and adversely affect our results of operations. We may incorporate AI solutions into our platform, offerings, services and features, and these applications may become important in our operations over time. Our competitors or other third parties may incorporate AI into their products more quickly or more successfully than us, which could impair our ability to compete effectively and adversely affect our results of operations. Additionally, if the content, analyses, or recommendations that AI applications assist in producing are or are alleged to be deficient, inaccurate, or biased, our business, financial condition, and results of operations may be adversely affected.
The use of AI applications has resulted in, and may in the future result in, cybersecurity incidents that implicate the personal data of end users of such applications. Any such cybersecurity incidents related to our use of AI applications could adversely affect our reputation and results of operations. AI also presents emerging ethical issues and if our use of AI becomes controversial, we may experience brand or reputational harm, competitive harm, or legal liability. The rapid evolution of AI, including potential government regulation of AI, will require significant resources to develop, test and maintain our platform, offerings, services, and features to help us implement AI ethically in order to minimize unintended, harmful impact.
Disruption to the operations of third parties whose functions are integral to our ETF platform may adversely affect the prices at which VictoryShares trade, particularly during periods of market volatility.
Shares of ETFs, such as VictoryShares, trade on stock exchanges at prices at, above or below the ETF’s most recent net asset value. While ETFs utilize a creation/redemption feature and arbitrage mechanism designed to make it more likely that the ETF’s shares normally will trade at prices close to the ETF’s net asset value, exchange prices may deviate significantly from the ETF’s net asset value. ETF market prices are subject to numerous potential risks, including trading halts invoked by a stock exchange, inability or unwillingness of market makers, authorized participants, settlement systems or other market participants to perform functions necessary for an ETF’s arbitrage mechanism to function effectively, or significant market volatility. If market events lead to incidences where ETFs trade at prices that deviate significantly from an ETF’s net asset value, or trading halts are invoked by the relevant stock exchange or market, investors may lose confidence in ETF products and redeem their holdings, which may cause our AUM, revenue and earnings to decline.
General Risks
Reputational harm could result in a loss of AUM and revenues.
The integrity of our brands and reputation is critical to our ability to attract and retain clients, business partners and employees and maintain relationships with consultants. We operate within the highly regulated financial services industry and various potential scenarios could result in harm to our reputation. They include internal operational failures, failure to follow investment or legal guidelines in the management of accounts, intentional or unintentional misrepresentation of our products and services in offering or advertising materials, public relations information, litigation (whether substantiated or not), social media or other external communications, employee misconduct or investments in businesses or industries that are controversial to certain special interest groups. Any real or perceived conflict between our and our shareholders’ interests and our clients’ interests, as well as any fraudulent activity or other exposure of client assets or information, may harm our reputation. The negative publicity associated with any of these factors could harm our reputation and adversely impact relationships with existing and potential clients, third‑party distributors, consultants and other business partners and subject us to regulatory sanctions or litigation. Damage to our brands or reputation could negatively impact our standing in the industry and result in loss of business in both the short term and the long term.
Additionally, while we have ultimate control over the business activities of our Franchises, they generally have the autonomy to manage their day‑to‑day operations, and if we fail to intervene in potentially serious matters that may arise, our reputation could be damaged and our results of operations could be materially adversely affected.
If our techniques for managing risk are ineffective, we may be exposed to material unanticipated losses.
In order to manage the significant risks inherent in our business, we must maintain effective policies, procedures and systems that enable us to identify, monitor and mitigate our exposure to operational, legal and reputational risks, including from the investment autonomy of our Franchises. Our risk management methods may prove to be ineffective due to their design or implementation, or as a result of the lack of adequate, accurate or timely information or otherwise. If our risk management efforts are ineffective, we could suffer losses that could have a material adverse effect on our financial condition or operating results. Additionally, we could be subject to litigation, particularly from our clients or investors, and sanctions or fines from regulators.
Our techniques for managing operational, legal and reputational risks in client portfolios may not fully mitigate the risk exposure in all economic or market environments, including exposure to risks that we might fail to identify or anticipate. Because our clients invest in our strategies in order to gain exposure to the portfolio securities of the respective strategies, we have not adopted corporate‑level risk management policies to manage market, interest rate or exchange rate risks that could affect the value of our overall AUM.
Certain of our strategies invest principally in the securities of non‑U.S. companies, which involve foreign currency exchange, tax, political, social and economic uncertainties and risks.
As of December 31, 2024, approximately 10% of our total AUM was invested in strategies that primarily invest in securities of non‑U.S. companies and securities denominated in currencies other than the U.S. dollar. Fluctuations in foreign currency exchange rates could negatively affect the returns of our clients who are invested in these securities. In addition, an increase in the value of the U.S. dollar relative to non‑U.S. currencies is likely to result in a decrease in the U.S. dollar value of our AUM, which, in turn, would likely result in lower revenue and profits.
Investments in non‑U.S. issuers may also be affected by tax positions taken in countries or regions in which we are invested as well as political, social and economic uncertainty. Declining tax revenues may cause governments to assert their ability to tax the local gains and/or income of foreign investors (including our clients), which could adversely affect client interests in investing outside their home markets. Many financial markets are not as developed, or as efficient, as the U.S. financial markets, and, as a result, those markets may have limited liquidity and higher price volatility and may lack established regulations. Liquidity may also be adversely affected by political or economic events, government policies, and social or civil unrest within a particular country, and our ability to dispose of an investment may also be adversely affected if we increase the size of our investments in smaller non‑U.S. issuers. Non‑U.S. legal and regulatory environments, including financial accounting standards and practices, may also be different, and there may be less publicly available information about such companies. These risks could adversely affect the performance of our strategies that are invested in securities of non‑U.S. issuers and may be particularly acute in the emerging or less developed markets in
which we invest. In addition to our Trivalent and Sophus Franchises, certain of our other Franchises and Solutions Platform invest in emerging or less developed markets.
The expansion of our business outside of the United States raises tax and regulatory risks, may adversely affect our profit margins and places additional demands on our resources and employees.
We have expanded and intend to continue to expand our distribution efforts into non‑U.S. markets through partnered distribution efforts and product offerings, including Europe, Canada, Japan, Singapore, and Australia. Clients outside the United States may be adversely affected by political, social and economic uncertainty in their respective home countries and regions, which could result in a decrease in the net client cash flows that come from such clients. This expansion has required and will continue to require us to incur a number of up‑front expenses, including those associated with obtaining and maintaining regulatory approvals and office space, as well as additional ongoing expenses, including those associated with leases, the employment of additional support staff and regulatory compliance.
Non‑U.S. clients may be less accepting of the U.S. practice of payment for certain research products and services through soft dollars (“soft dollars” are a means of paying brokerage firms for their services through commission revenue, rather than through direct payments) or such practices may not be permissible in certain jurisdictions, which could have the effect of increasing our expenses. In addition, the European Commission adopted several acts under the revised Markets in Financial Instruments Directive (known as “MiFID II”) that prevent the “bundling” of the cost of research together with trading commissions. As a result, clients subject to MiFID II may be unable to use soft dollars to pay for research services in the United Kingdom and in Europe.
Our U.S.‑based employees routinely travel outside the United States as a part of our investment research process or to market our services and may spend extended periods of time in one or more non‑U.S. jurisdictions. Their activities outside the United States on our behalf may raise both tax and regulatory issues. If and to the extent we are incorrect in our analysis of the applicability or impact of non‑U.S. tax or regulatory requirements, we could incur costs or penalties or be the subject of an enforcement or other action. Operating our business in non‑U.S. markets is generally more expensive than in the United States. In addition, costs related to our distribution and marketing efforts in non‑U.S. markets generally have been more expensive than comparable costs in the United States. To the extent that our revenues do not increase to the same degree as our expenses increase in connection with our continuing expansion outside the United States, our profitability could be adversely affected. Expanding our business into non‑U.S. markets may also place significant demands on our existing infrastructure and employees.
We are also subject to a number of laws and regulations governing payments and contributions to political persons or other third parties, including restrictions imposed by the Foreign Corrupt Practices Act (the “FCPA”), as well as trade sanctions administered by the Office of Foreign Assets Control, or OFAC, the U.S. Department of Commerce and the U.S. Department of State. Similar laws in non‑U.S. jurisdictions may also impose stricter or more onerous requirements and implementing them may disrupt our business or cause us to incur significantly more costs to comply with those laws. Different laws may also contain conflicting provisions, making compliance with all laws more difficult. Any determination that we have violated the FCPA or other applicable anti‑corruption laws or sanctions could subject us to, among other things, civil and criminal penalties, material fines, profit disgorgement, injunctions on future conduct, securities litigation and a general loss of investor confidence, any one of which could adversely affect our business prospects, financial condition, or results of operations. While we have developed and implemented policies and procedures designed to ensure strict compliance by us and our personnel with the FCPA and other anti‑corruption laws or sanctions in jurisdictions in which we operate, such policies and procedures may not be effective in all instances to prevent violations.
Failure to properly address conflicts of interest could harm our reputation, business and results of operations.
As we have expanded the scope of our businesses and our client base, we must continue to address conflicts between our interests and those of our clients. In addition, the SEC and other regulators have increased their scrutiny of potential conflicts of interest. We have procedures and controls that are reasonably designed to address these issues. However, appropriately dealing with conflicts of interest is complex and difficult and if we fail, or appear to fail, to deal appropriately with conflicts of interest, we could face reputational damage, litigation or regulatory proceedings or penalties, any of which may adversely affect our revenues or net income.
Our contractual obligations may subject us to indemnification obligations to third parties.
In the ordinary course of business, we enter into contracts with third parties, including, without limitation, clients, vendors, and other service providers, that contain a variety of representations and warranties and that provide for indemnifications by us in certain circumstances. Pursuant to such contractual arrangements, we may be subject to indemnification costs and liability to third parties if, for example, we breach any material obligations under the agreements or agreed standards of care, or in the event such third parties have certain legal claims asserted against them. The terms of these indemnities vary from contract to contract, and future indemnification claims against us could negatively impact our financial condition.
Insurance may not be available on a cost-effective basis to protect us from liability.
We face the inherent risk of liability related to litigation from clients, third-party vendors or others and actions taken by regulatory agencies. To help protect against these potential liabilities, we purchase insurance in amounts, and against risks, that we consider appropriate, where such insurance is available at prices, we deem acceptable. There can be no assurance, however, that a claim or claims will be covered by insurance or, if covered, will not exceed the limits of available insurance coverage, that any insurer will remain solvent and will meet its obligations to provide us with coverage or that insurance coverage will continue to be available with sufficient limits at a reasonable cost. Insurance costs are impacted by market conditions and the risk profile of the insured and may increase significantly over relatively short periods. In addition, certain insurance coverage may not be available or may only be available at prohibitive costs. Renewals of insurance policies may expose us to additional costs through higher premiums or the assumption of higher deductibles or co-insurance liability.
Failure to protect our intellectual property may negatively impact our business.
Although we take steps to safeguard and protect our intellectual property, including but not limited to our trademarks, patents, copyrights and trade secrets, there can be no assurance that we will be able to effectively protect our rights. If our intellectual property rights were violated, we could be subject to economic and reputational harm that could negatively impact our business and competitiveness in the marketplace. Conversely, while we take efforts to avoid infringement of the intellectual property of third parties, if we are deemed to infringe on a third party’s intellectual property rights it could expose us to litigation risks, license fees, liability and reputational harm.
Climate change may adversely affect our office locations.
We face possible risks and costs associated with the effects of climate change and severe weather. We cannot predict the rate at which climate change will progress. However, the physical effects of climate change could have a material adverse effect on our operations, and business. To the extent that climate change impacts changes in weather patterns, our offices could experience severe weather, including hurricanes, severe winter storms, and coastal flooding due to increases in storm intensity and rising sea levels. Certain of our offices may be vulnerable to coastal hazards, such as sea level rise, severe weather patterns and storm surges, land erosion, and groundwater intrusion. Over time, these conditions could result in our inability to operate in these office locations at all times. Climate change and severe weather may also have indirect effects on our business by increasing the cost of, or decreasing the availability of, property insurance on terms we find acceptable, by increasing the costs of energy, maintenance, repair of water and/or wind damage, and snow removal at our properties.
None
Item 1C. Cybersecurity.
Risk Management and Strategy
Our Information Security Committee (the “ISC”) oversees and implements a cybersecurity program that seeks to assess, identify and protect against cyber security threats and detect, respond, and recover from cyber security incidents. The program is modeled upon the National Institute of Standards and Technology Cybersecurity Framework, a well-established and widely adopted framework in the financial services industry. The ISC is chaired by our Chief Information Security Officer (“CISO”) and membership includes executive and management level representation from our technology, legal, and compliance departments.
Our cybersecurity program assesses our cybersecurity risk profile through inventories of physical devices, software, and information systems, evaluations of critical third-party systems, and a catalog of security risks. Periodic assessments are conducted to ensure the risk catalog is up to date.
We protect our information systems, data, and network through technical and procedural controls and security awareness training. We deploy multiple technical controls to achieve a layered security strategy including systems access controls, firewalls, web application gateways, antivirus software, e-mail filtering, and endpoint protection. Security awareness training is mandatory for all employees and conducted at time of hire and periodically thereafter. The security awareness training program is designed to ensure employees are prepared to identify and avoid cyber risks and may cover topics such as phishing, ransomware, social engineering, public Wi-Fi risks, password security, and mobile device security. Training is supplemented by testing initiatives, including periodic phishing tests, which may result in targeted or remedial training.
We use a third-party security operations center and endpoint management and response service to continuously monitor information systems for emergent events including anomalous, suspicious, and unauthorized network activity. Detected events are immediately triaged and evaluated for threat potential and impact. We also engage third-party providers to perform penetration testing designed to identify vulnerabilities for remediation. We rotate penetration testing providers to diversify testing approaches.
No known cybersecurity threats or incidents have materially affected, or are likely to materially affect, our business strategy, results of operations, or financial condition. While we maintain robust prevention and detection measures, we cannot eliminate all cybersecurity risks or guarantee absence of undetected incidents. For further details on cybersecurity risks, see "Item 1A. Risk Factors" in this Form 10-K.
Governance
Role of the Board of Directors and Management
Our CISO and Chief Technology Officer (“CTO”) oversee the day-to-day technology and security activities. Our CISO has been with the firm since 2013 and has over 20 years of IT experience in various industries. He is a Certified Chief Information Security Officer from the Carnegie Mellon University executive education program, as well as a Certified Information Security Manager (CISM) and Certified Information Systems Security Professional (CISSP). Our CTO joined the firm in 2020 with 30 years of IT experience, including over 20 years of executive level technology experience in the asset management industry. Both the CISO and CTO serve on the ISC.
The Audit Committee of the Board of Directors oversees our enterprise risk management, which includes cybersecurity. The ISC provides a report on our cybersecurity program to our Board at least annually.
Other key functions of the ISC are to align the overall security strategy with business objectives and to oversee the cataloging of cybersecurity risks and assessments. Additional review and oversight is provided by the Enterprise Risk Committee where cybersecurity risk is vetted against other risk categories. Management also maintains a Vendor Oversight Committee which governs the use of third-party vendors and assesses cybersecurity risk related to those vendors. The Enterprise Risk Committee and the Vendor Oversight Committee report their activities to the Audit Committee at least annually.
The third-party security operations center, the endpoint managed detection and response service, and third-party penetration testing vendors are overseen by the CISO.
In the event of a potential cybersecurity incident, the third-party security operations center is authorized to take preemptive action to address the incident and must promptly notify a member of the ISC. The ISC coordinates the response to and communication of an incident in accordance with our Incident Response Plan (“IRP”) and applicable law. The IRP is designed to provide guidance for effective, efficient, and orderly response to a variety of cybersecurity incidents. The ISC is responsible for communication escalation as necessary up to and including to the Board of Directors. The IRP is periodically exercised through tabletop exercises.
Item 2. Properties.
The Company leases its principal executive offices, which are located in San Antonio, TX. In the United States, the Company also leases office space in Brooklyn, OH; Birmingham, MI; Boston, MA; Rocky River, OH; Cincinnati, OH; Charlotte, NC; Denver, CO; Clive, IA; Hanover, NH; New York, NY; Norwalk, CT; and San Francisco, CA. Outside the United States, the Company leases office space in Singapore. The Company believes its existing facilities are adequate to meet its current and future business requirements.
Item 3. Legal Proceedings.
On August 20, 2024, Victory filed with the SEC the Preliminary Proxy Statement, and on September 6, 2024, Victory filed with the SEC the Proxy Statement in relation to Amundi contributing to Victory all of the shares of Amundi US, resulting in Victory acquiring Amundi US and Amundi US becoming a wholly owned subsidiary of Victory. As of December 31, 2024, two complaints have been filed in the Supreme Court of the State of New York, New York County by purported Victory stockholders against Victory and the members of the Victory board of directors (the “Board”) in connection with the Contribution: Kent v. Victory Capital Holdings, Inc., et al., Index No. 654929/2024 (filed September 19, 2024) and Lawrence v. Victory Capital Holdings, Inc., et al., Index No. 654920/2024 (filed September 19, 2024) (collectively, the “Stockholder Litigation”). The complaints in the Stockholder Litigation include allegations that, among other things, the defendants caused to be filed a materially incomplete and misleading Proxy Statement with the SEC relating to the proposed Contribution and assert claims for alleged negligent misrepresentation and concealment and negligence under New York common law. Additionally, since the filing of the Preliminary Proxy Statement, Victory received five demand letters from purported Victory stockholders alleging similar insufficiencies in the disclosures in the Preliminary Proxy Statement and/or the Proxy Statement (such letters, the “Demand Letters,” and together with the Stockholder Litigation, the “Litigation Matters”).
The plaintiffs in the Stockholder Litigation seek various remedies, which include, among other things: (i) enjoining the defendants from consummating the proposed Contribution until the defendants disclose certain allegedly material information that was allegedly omitted from the Proxy Statement; (ii) in the event that the proposed Contribution is consummated, rescinding it or awarding actual and punitive damages to the plaintiffs; (iii) awarding the plaintiffs fees and expenses in connection with the Stockholder Litigation, including reasonable attorneys’ and experts’ fees and expenses; and (iv) granting such other and further relief as the court may deem just and proper.
Victory believes that the disclosures in the Proxy Statement comply with applicable laws, and that no further disclosures are required to supplement the Proxy Statement under applicable laws. Victory specifically denies all allegations in the Litigation Matters.
We cannot predict the outcome of the above matters or estimate the possible loss or range of possible loss, if any. Although the proceedings are subject to uncertainties inherent in the litigation process and the ultimate disposition of these proceedings is not presently determinable, we intend to vigorously defend these cases. In addition to those items disclosed above, we are, from time to time, subject to claims and lawsuits arising in the ordinary course of business.
Item 4. Mine Safety Disclosures.
Not applicable
PART II
Item 5. Market for Registrant’s Common Equity, Related Shareholder Matters and Issuer Purchases of Equity Securities.
Shares of the Company’s Common Stock are listed and trade on NASDAQ under the symbol “VCTR”. As of December 31, 2024, there were approximately 41,000 beneficial shareholders of the Company’s Common Stock.
Performance Graph
The following graph shows a comparison from December 31, 2019 through December 31, 2024 of the cumulative total return of our Common Stock, the Standard & Poor’s 500 Stock Index (S&P 500 Index) and a peer group comprised of Affiliated Managers Group, Inc., Artisan Partners Asset Management Inc., Acadian Asset Management, and Virtus Investment Partners, Inc. The graph assumes that $100 was invested at the market close on December 31, 2019 in our common stock, the S&P 500 Index and the peer group and assumes reinvestment of any dividends. The stock price performance of the following graph is not necessarily indicative of future stock price performance.
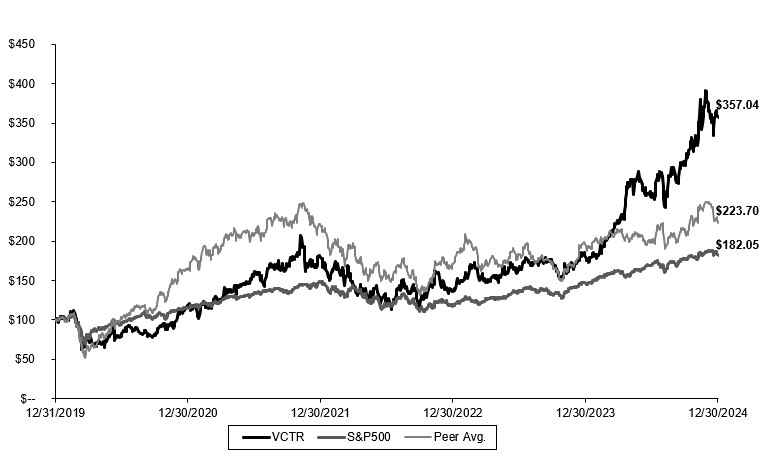
Purchases of Equity Securities by the Issuer and Affiliated Purchasers.
The following table sets out information regarding purchases of equity securities by the Company for the three months ended December 31, 2024.
| | | | | | | | | | | | | | | | |
| | Total
Number of
Shares
of
Common
Stock | | | Average
Price
Paid Per
Share
of
Common | | | Total
Number of
Shares
of
Common
Stock
Purchased
as Part of
Publicly
Announced
Plans | | | Approximate
Dollar Value
That May
Yet Be
Purchased
Under
Outstanding
Plans or
Programs | |
Period | | Purchased | | | Stock | | | or Programs | | | (in millions)(1) | |
October 1-31, 2024 | | | — | | | $ | — | | | | — | | | $ | 95.2 | |
November 1-30, 2024 | | | 1,128,240 | | | | 67.92 | | | | 1,128,240 | | | | 19.0 | |
December 1-31, 2024 | | | 275,061 | | | | 69.79 | | | | 275,061 | | | | 200.0 | |
Total | | | 1,403,301 | | | $ | 68.29 | | | | 1,403,301 | | | | |
(1)Six share repurchase programs were authorized from 2018 to 2021, each for $15.0 million of the Company’s Common Stock, that were completed in September 2019, June 2020, October 2020, May 2021, January 2022 and May 2022. In May 2022, the Company’s’ Board of Directors approved a new share repurchase program (the “2022 Share Repurchase Program”) authorizing the repurchase of up to $100.0 million of the Company’s Common Stock. The 2022 Share Repurchase Program was completed in March 2023. In March 2023, the Company’s Board of Directors approved a new share repurchase program (the “2023 Share Repurchase Program”) authorizing the repurchase of up to $100.0 million of the Company’s Common Stock through December 31, 2025. The 2023 Share Repurchase Program was completed in December 2023. In December 2023, the Company’s Board of Directors approved a new share repurchase program (the “2024 Share Repurchase Program”) authorizing the repurchase of up to $100.0 million of the Company’s Common Stock through December 31, 2025. The 2024 Share Repurchase Program was completed in December 2024. In December 2024, the Company’s Board of Directors approved a new share repurchase program (the “2025 Share Repurchase Program”) authorizing the repurchase of up to $200.0 million of the Company’s Common Stock through December 31, 2026. Under the 2025 Share Repurchase Program, which took effect in December 2024, the Company may purchase its shares from time to time in privately negotiated transactions, through block trades, pursuant to open market purchases, or pursuant to any trading plan that may be adopted in accordance with Rule 10b5-1 of the SEC. The amount and timing of purchases under the 2025 Share Repurchase Program will depend on a number of factors including the price and availability of the Company’s shares, trading volume, capital availability, Company performance and general economic and market conditions. The 2025 Share Repurchase Program can be suspended or discontinued at any time.
In 2024, the Company repurchased 1.4 million shares of Common Stock at a total cost of $95.8 million, which included $0.6 million in excise taxes payable on share repurchases, for an average price of $68.29 per share. In 2023, the Company repurchased 4.2 million shares of Common Stock at a total cost of $134.5 million, which included $1.0 million in excise taxes payable on share repurchases, for an average price of $32.33 per share. In 2022, 3.0 million shares of Common Stock were repurchased under programs authorized by the Company’s Board of Directors at a total cost of $87.3 million for an average price of $28.76 per share.
As of December 31, 2024, $200.0 million was available for future repurchases under the 2025 Share Repurchase Program, and a cumulative total of 12.7 million shares of Common Stock had been repurchased under programs authorized by the Company’s Board of Directors at a total cost of $391.6 million for an average price of $30.91 per share.
Dividend Policy
In 2019, the Company announced the initiation of cash dividends and paid its first quarterly dividend to shareholders in September of that year. Each year, since the commencement of cash dividends in 2019, the Company has increased the per-share amount of the quarterly cash dividends distributed to shareholders. During 2022, the Company’s Board declared $1.00 of cash dividends per share, an increase of $0.47, or 89%, from the $0.53 per share of cash dividends declared in 2021. During 2023, the Company’s Board declared $1.28 of cash dividends per share, an increase of $0.28, or 28%, from the $1.00 per share of cash dividends declared in 2022. During 2024, the Company’s Board declared $1.56 of cash dividends per share, an increase of $0.28, or 22%, from the $1.28 per share of cash dividends declared in 2023.
Holders of restricted stock awards on the Company’s Common Stock that are unvested at the time quarterly dividends are declared are entitled to be paid these dividends as and when the restricted stock vests. Potential future dividend payments will be at the sole discretion of our board of directors and will depend upon then‑existing conditions, including capital requirements to execute our growth strategy, results of operations, financial condition, projected cash flow, and terms associated with our current credit facility or any future financing. Potential increases to the Company’s cash dividend rate will be assessed annually.
Item 7. Management’s Discussion and Analysis of Financial Condition and Results of Operations.
The objective of this section of the Annual Report on Form 10-K is to provide a discussion and analysis, from management’s perspective, of the key performance indicators and material information necessary to assess our financial condition, results of operations, liquidity and cash flows for the year ended December 31, 2024. In addition, we also discuss the Company’s contractual obligations and off-balance sheet arrangements. This Management’s Discussion and Analysis of Financial Condition and Results of Operations should be read in conjunction with our consolidated financial statements and related notes thereto included elsewhere in this report. In addition to historical information, this discussion and analysis contains forward‑looking statements that involve risks, uncertainties and assumptions, which could cause actual results to differ materially from management’s expectations. Please refer to the sections of this report entitled “Forward‑Looking Statements” and “Risk Factors.”
Overview
Our Business – Victory is a diversified global asset management firm with total client assets of $176.1 billion, assets under management of $171.9 billion and other assets of $4.2 billion as of December 31, 2024. The Company operates a next-generation business model combining boutique investment qualities with the benefits of an integrated, centralized operating and distribution platform.
Victory Capital provides specialized investment strategies to institutions, intermediaries, retirement platforms and individual investors with 11 autonomous Investment Franchises and a Solutions Platform. Victory Capital offers a wide array of investment products, including actively and passively managed mutual funds, rules-based and active exchange traded funds (“ETFs”), institutional separate accounts, variable insurance products (“VIPs”), alternative investments, private closed end funds, and a 529 Education Savings Plan. Victory Capital’s strategies are also offered through third-party investment products, including mutual funds, third-party ETF model strategies, retail separately managed accounts (“SMAs”) and unified managed accounts (“UMAs”) through wrap account programs, Collective Investment Trusts (“CITs”), and undertakings for the collective investment in transferable securities (“UCITS”). As of December 31, 2024, our Franchises and our Solutions Platform collectively managed a diversified set of 124 investment strategies for a wide range of institutional and retail clients and direct investors.
Franchises – Our Franchises are largely operationally integrated but are separately branded and make investment decisions independently from one another within guidelines established by their respective investment mandates. Our largely integrated model creates a supportive environment in which our investment professionals, largely unencumbered by administrative and operational responsibilities, can focus on their pursuit of investment excellence. VCM employs all of our U.S. investment professionals across our Franchises, which are not separate legal entities.
Solutions – Our Solutions Platform consists of multi‑asset, multi-manager, quantitative, rules-based, factor-based, and customized portfolios. These strategies are designed to achieve specific return characteristics, with products that include values-based and thematic outcomes and exposures. We offer our Solutions Platform through a variety of vehicles, including separate accounts, mutual funds, UMA accounts, and rules-based and active ETFs under our VictoryShares ETF brand. Like our Franchises, our Solutions Platform is operationally integrated and supported by our centralized distribution, marketing, and operational support functions.
Professionals within our institutional and retail distribution channels, direct investor business and marketing organization sell our products through our centralized distribution model. Our institutional sales team focuses on cultivating relationships with institutional consultants, who account for the majority of the institutional market, as well as asset allocators seeking sub-advisers. Our retail sales team offers intermediary and retirement platform clients, including broker-dealers, retirement platforms and RIA networks, mutual funds and ETFs as well as SMAs through wrap fee programs and access to our investment models through UMAs. Our direct investor business serves the investment needs of individual clients.
We have grown our total client assets from $17.9 billion following the management-led buyout with Crestview GP in August 2013 to $176.1 billion at December 31, 2024. We attribute this growth to our success in sourcing acquisitions and evolving them into organic growers, generating strong investment returns, and developing institutional, retail, and direct investor channels with deep penetration.
WestEnd Acquisition (the “WestEnd Acquisition”) – On December 31, 2021, the Company completed the acquisition of 100% of the equity interests of WestEnd Advisors, LLC ("WestEnd") pursuant to the WestEnd purchase agreement (as amended, the “WestEnd Purchase Agreement”). Founded in 2004, and headquartered in Charlotte, NC, WestEnd is an ETF strategist advisor that provides financial advisors with a turnkey, core model allocation strategy for either a holistic solution or complementary source of alpha. The firm offers four primary ETF strategies and one large cap core strategy, all in tax efficient SMA structures. Refer to Note 4, Acquisitions, for further details on the WestEnd Acquisition.
NEC Acquisition (the “NEC Acquisition”) – On November 1, 2021, the Company completed the acquisition of 100% of the equity interests in New Energy Capital ("NEC"). Founded in 2004 and based in Hanover, NH, NEC is an alternative asset management firm focused on debt and equity investments in clean energy infrastructure projects and companies. Refer to Note 4, Acquisitions, for further details on the NEC Acquisition.
USAA AMCO Acquisition – On July 1, 2019, the Company completed the acquisition (the “USAA AMCO Acquisition”) of USAA Asset Management and Victory Capital Transfer Agency ("VCTA"), formally known as the USAA Transfer Agency Company. The acquisition expanded and diversified the Company’s investment platform and increased the Company’s size and scale. Refer to Note 4, Acquisitions, for further details on the USAA AMCO Acquisition.
Business Highlights in 2024
Assets under management:
•AUM at December 31, 2024 increased by $10.6 billion, or approximately 6.6%, to $171.9 billion from $161.3 billion at December 31, 2023, primarily driven by positive market action of $18.1 billion. Long-term gross inflows were $25.3 billion and $22.7 billion for the years ended December 31, 2024 and 2023, respectively. Long-term net outflows were $7.1 billion and $5.6 billion for the years ended December 31, 2024 and 2023, respectively. We generated $26.2 billion in gross flows and $7.4 billion in net outflows ($7.1 billion long-term, $0.3 billion short-term) for the year ended December 31, 2024, compared to $23.5 billion in gross flows and $6.0 billion in net outflows ($5.6 billion long-term, $0.4 billion short-term) for the same period in 2023.
•Within the following tables and disclosures, AUM includes both discretionary assets under management and non-discretionary assets under advisement and excludes other assets. Prior-period AUM figures have been adjusted accordingly.
Investment performance:
•45 of our total Victory Capital mutual funds and ETFs had overall Morningstar ratings of four or five stars and 66% of our fund and ETF AUM were rated four or five stars overall by Morningstar. 47% of our strategies by AUM had investment returns in excess of their respective benchmarks over a one-year period, 59% over a three-year period, 73% over a five-year period and 79% over a ten-year period. On an equal-weighted basis, 53% of our strategies have outperformed their respective benchmarks over a one-year period, 58% over a three-year period, 58% over a five-year period and 65% over a ten-year period.
Financial highlights:
•Total revenue for the year ended December 31, 2024 was $893.5 million compared to $821.0 million for the year ended December 31, 2023.
•Net income was $288.9 million and $213.2 million, respectively, for the years ended December 31, 2024 and 2023. Adjusted Net Income was $312.9 million for the year ended December 31, 2024 compared to $269.7 million for the year ended December 31, 2023. Refer to “Supplemental Non‑GAAP Financial Information” for more information about how we calculate Adjusted Net Income and a reconciliation of net income to Adjusted Net Income.
•GAAP earnings per diluted share was $4.38 for the year ended December 31, 2024 compared to $3.12 for the same period in 2023. Adjusted net income with tax benefit per diluted share was $5.36 and $4.51, respectively, for the years ended December 31, 2024 and 2023. Refer to “Supplemental
Non‑GAAP Financial Information” for more information about how we calculate Adjusted Net Income and a reconciliation of net income to Adjusted Net Income.
•Adjusted EBITDA and Adjusted EBITDA margin was $475.6 million and 53.2%, respectively, for the year ended December 31, 2024 compared to $418.0 million and 50.9%, respectively, for the year ended December 31, 2023. Refer to “Supplemental Non‑GAAP Financial Information” for more information about how we calculate Adjusted EBITDA and a reconciliation of net income to Adjusted EBITDA.
Key Performance Indicators
The following table presents the key performance indicators we focus on when reviewing our results:
| | | | | | | | | | | | | | | | |
| | Year Ended December 31, | | |
($ in millions, except for basis points and percentages) | | 2024 | | | 2023 | | | 2022 | | |
AUM at period end | | $ | | 171,930 | | | $ | | 161,322 | | | $ | | 147,762 | | |
Average AUM | | | | 169,658 | | | | | 153,455 | | | | | 158,699 | | |
Gross flows | | | | 26,167 | | | | | 23,504 | | | | | 33,637 | | |
AUM net short term flows | | | | (287 | ) | | | | (391 | ) | | | | (187 | ) | |
AUM net long term flows | | | | (7,090 | ) | | | | (5,584 | ) | | | | (2,465 | ) | |
AUM net flows | | | | (7,377 | ) | | | | (5,976 | ) | | | | (2,652 | ) | |
Total revenue | | | | 893.5 | | | | | 821.0 | | | | | 854.8 | | |
Revenue realization on average AUM | | | | 52.6 | | bps | | | 53.4 | | bps | | | 53.9 | | bps |
Net income | | | | 288.9 | | | | | 213.2 | | | | | 275.5 | | |
Adjusted EBITDA(1) | | | | 475.6 | | | | | 418.0 | | | | | 424.2 | | |
Adjusted EBITDA margin(1)(2) | | | | 53.2 | | % | | | 50.9 | | % | | | 49.6 | | % |
Adjusted Net Income(1) | | | | 312.9 | | | | | 269.7 | | | | | 293.8 | | |
Tax benefit of goodwill and acquired intangibles(3) | | | | 40.2 | | | | | 38.3 | | | | | 37.5 | | |
(1)Our management uses Adjusted EBITDA and Adjusted Net Income to measure the operating profitability of the business. These measures eliminate the impact of one‑time acquisition, restructuring and integration costs and demonstrate the ongoing operating earnings metrics of the business. These measures are explained in more detail and reconciled to net income calculated in accordance with GAAP in “Supplemental Non‑GAAP Financial Information.”
(2)Adjusted EBITDA margin represents Adjusted EBITDA as a percentage of total revenue.
(3)Represents the tax benefits associated with deductions allowed for intangible assets and goodwill generated from prior acquisitions in which we received a step‑up in basis for tax purposes. Acquired intangible assets and goodwill may be amortized for tax purposes, generally over a 15‑year period. The tax benefit from amortization on these assets is included to show the full economic benefit of deductions for all acquired intangibles with a step‑up in tax basis. Due to our acquisitive nature, tax deductions allowed on acquired intangible assets and goodwill provide us with a significant supplemental economic benefit.
The following table presents a reconciliation of our total client assets(1) as of the dates indicated:
| | | | | | | | | | | | |
| | For the Year Ended December 31, | |
(in millions) | | 2024 | | | 2023 | | | 2022 | |
Beginning AUM | | $ | 161,322 | | | $ | 147,762 | | | $ | 177,716 | |
Beginning other assets | | | 5,289 | | | | 5,190 | | | | 5,938 | |
Beginning total client assets | | | 166,611 | | | | 152,952 | | | | 183,654 | |
| | | | | | | | | |
AUM net cash flows | | | (7,377 | ) | | | (5,976 | ) | | | (2,652 | ) |
Other assets net cash flows | | | (1,627 | ) | | | (591 | ) | | | (80 | ) |
Total client assets net cash flows | | | (9,004 | ) | | | (6,567 | ) | | | (2,732 | ) |
| | | | | | | | | |
AUM market appreciation (depreciation) | | | 18,100 | | | | 21,188 | | | | (25,826 | ) |
Other assets market appreciation (depreciation) | | | 504 | | | | 690 | | | | (669 | ) |
Total client assets market appreciation (depreciation) | | | 18,604 | | | | 21,878 | | | | (26,495 | ) |
| | | | | | | | | |
AUM realizations and distributions | | | (2 | ) | | | (100 | ) | | | (376 | ) |
Acquired & divested assets / Net transfers | | | (113 | ) | | | (1,552 | ) | | | (1,100 | ) |
| | | | | | | | | |
Ending AUM | | | 171,930 | | | | 161,322 | | | | 147,762 | |
Ending other assets | | | 4,165 | | | | 5,289 | | | | 5,190 | |
Ending total client assets | | | 176,096 | | | | 166,611 | | | | 152,952 | |
Average total client assets | | | 174,542 | | | | 158,268 | | | | 164,025 | |
(1)Includes low-fee (2 to 4 bps) institutional assets, previously reported in the Solutions asset class within the by asset class table and in Separate Accounts and Other Pooled Vehicles within the by vehicle table. These assets are included as part of Victory's Regulatory Assets Under Management reported in Form ADV Part 1.
The following table presents a reconciliation of our total AUM(1) as of the dates indicated:
| | | | | | | | | | | | |
| | For the Year Ended | |
(in millions) | | 2024 | | | 2023 | | | 2022 | |
Beginning AUM | | $ | 161,322 | | | $ | 147,762 | | | $ | 177,716 | |
Gross client cash inflows | | | 26,167 | | | | 23,504 | | | | 33,637 | |
Gross client cash outflows | | | (33,545 | ) | | | (29,480 | ) | | | (36,289 | ) |
Net client cash flows | | | (7,377 | ) | | | (5,976 | ) | | | (2,652 | ) |
Market appreciation (depreciation) | | | 18,100 | | | | 21,188 | | | | (25,826 | ) |
Realizations and distributions | | | (2 | ) | | | (100 | ) | | | (376 | ) |
Acquired & divested assets / Net transfers | | | (113 | ) | | | (1,552 | ) | | | (1,100 | ) |
Ending AUM | | | 171,930 | | | | 161,322 | | | | 147,762 | |
Average AUM | | | 169,658 | | | | 153,455 | | | | 158,699 | |
(1)Total AUM includes both discretionary assets under management and non-discretionary assets under advisement and excludes other assets.
The following table presents a reconciliation of our other assets(1) as of the dates indicated:
| | | | | | | | | | | | |
| | For the Year Ended December 31, | |
(in millions) | | 2024 | | | 2023 | | | 2022 | |
Beginning other assets (institutional) | | $ | 5,289 | | | $ | 5,190 | | | $ | 5,938 | |
Gross client cash inflows | | | 467 | | | | 600 | | | | 297 | |
Gross client cash outflows | | | (2,094 | ) | | | (1,191 | ) | | | (377 | ) |
Net client cash flows | | | (1,627 | ) | | | (591 | ) | | | (80 | ) |
Market appreciation (depreciation) | | | 504 | | | | 690 | | | | (669 | ) |
Realizations and distributions | | | — | | | | — | | | | — | |
Acquired & divested assets / Net transfers | | | — | | | | — | | | | — | |
Ending other assets (institutional) | | | 4,165 | | | | 5,289 | | | | 5,190 | |
Average other assets (institutional) | | | 4,883 | | | | 4,813 | | | | 5,327 | |
(1)Includes low-fee (2 to 4 bps) institutional assets, previously reported in the Solutions asset class within the by asset class table and in Separate Accounts and Other Pooled Vehicles within the by vehicle table. These assets are included as part of Victory’s Regulatory Assets Under Management reported in Form ADV Part 1.
Assets Under Management
Our profitability is largely affected by the level and composition of our AUM (including asset class and distribution channel) and the effective fee rates on our products. The amount and composition of our AUM are, and will continue to be, influenced by a number of factors, including; (i) investment performance, including fluctuations in the financial markets and the quality of our investment decisions; (ii) client flows into and out of our various strategies and investment vehicles; (iii) industry trends toward products or strategies that we either do or do not offer; (iv) our ability to attract and retain high quality investment, distribution, marketing and management personnel; (v) our decision to close strategies or limit growth of assets in a strategy when we believe it is in the best interest of our clients or conversely to re‑open strategies in part or entirely; and (vi) general investor sentiment and confidence. Our goal is to establish and maintain a client base that is diversified by Franchise and Solutions Platform, asset class, distribution channel and vehicle.
Valuation of Assets Under Management
The fair value of assets under management of the Victory Funds and VictoryShares is primarily determined using quoted market prices or independent third-party pricing services or broker price quotes. In certain circumstances, a quotation or price evaluation is not readily available from a pricing service. In these cases, pricing is determined by management based on a prescribed valuation process that has been approved by the directors/trustees of the sponsored products. The same prescribed valuation process is used to price securities in separate accounts and the Company’s other non-alternative investment vehicles for which a quotation or price evaluation is not readily available from a pricing service.
For certain alternative investment vehicles, including the NEC funds, AUM represents limited partner capital commitments during the commitment period of the fund. Following the earlier of the termination of the commitment period and the beginning of any commitment period for a successor fund, AUM generally represents, depending on the fund, the lesser of a) the net asset value of the fund and b) the aggregated adjusted cost basis of each unrealized portfolio investment or the limited partner capital commitments reduced by the amount of capital contributions used to make portfolio investments that have been disposed. The fair value of Level III assets held by alternative investment vehicles is determined under the respective valuation policy for each fund. The valuation policies address the fact that substantially all the investments of a fund may not have readily available market information and therefore the fair value for these assets is typically determined using unobservable inputs and models that may include subjective assumptions. AUM reported by the Company for alternative investment vehicles may not necessarily equal the funds’ net asset values or the total fair value of the funds’ portfolio investments as AUM represents the basis for calculating management fees. For the periods presented, less than one percent of the Company’s total AUM were Level III assets priced without using a quoted market price, broker price quote or pricing service quotation.
AUM by Asset Class – the following table presents our AUM by asset class as of the dates indicated:
| | | | | | | | | | | | | | | | | | | | | | | | | |
| | | | | | | | | | | | | | | | | | | |
| | As of December 31, | |
(in millions) | | 2024 | | | 2023 | | | 2022 | | | 2021(1)(2) | | | 2020(2) | |
Fixed Income | | $ | | 24,402 | | | $ | | 24,355 | | | $ | | 26,353 | | | $ | | 35,154 | | | $ | | 36,639 | |
Solutions | | | | 62,593 | | | | | 54,296 | | | | | 46,317 | | | | | 54,426 | | | | | 30,524 | |
U.S. Mid Cap Equity | | | | 30,584 | | | | | 30,604 | | | | | 27,892 | | | | | 30,578 | | | | | 26,230 | |
U.S. Small Cap Equity | | | | 14,785 | | | | | 15,959 | | | | | 15,103 | | | | | 20,094 | | | | | 18,368 | |
U.S. Large Cap Equity | | | | 14,148 | | | | | 12,635 | | | | | 10,973 | | | | | 15,766 | | | | | 14,230 | |
Global / Non-U.S. Equity | | | | 19,095 | | | | | 16,772 | | | | | 14,160 | | | | | 16,050 | | | | | 14,141 | |
Alternative Investments | | | | 2,980 | | | | | 3,431 | | | | | 3,663 | | | | | 2,548 | | | | | 422 | |
Total Long-Term AUM | | $ | | 168,586 | | | $ | | 158,051 | | | $ | | 144,460 | | | $ | | 174,616 | | | $ | | 140,554 | |
Money Market / Short-Term | | | | 3,344 | | | | | 3,271 | | | | | 3,302 | | | | | 3,100 | | | | | 3,534 | |
Total AUM | | $ | | 171,930 | | | $ | | 161,322 | | | $ | | 147,762 | | | $ | | 177,716 | | | $ | | 144,088 | |
(1)Includes the impact of acquired assets from the THB, NEC and WestEnd Acquisitions, which closed on March 1, 2021, November 1, 2021 and December 31, 2021, respectively, and increased our AUM by approximately $547 million, $795 million and $19.3 billion, at closing, respectively. The WestEnd acquired assets had no economic impact on operations in 2021 and no effect on asset flows, average assets, revenues or earnings in the full-year period ended December 31, 2021.
(2)Beginning in January 2022, the Company's "Other" asset class has been categorized to Solutions, Fixed Income, Global / Non-U.S. Equity, or Alternative Investments based on the underlying investment strategy. Additionally, all assets managed using alternative investment strategies are now included in the Company's Alternative Investments asset class. Prior-period figures have been adjusted accordingly.
Asset Flows by Asset Class – the following table summarizes our asset flows by asset class for the periods indicated:
| | | | | | | | | | | | | | | | | | | | | | | | | | | | | | | | | | | | | | | | | | | | | | | | | | | | | |
(in millions) | | U.S.
Mid
Cap
Equity | | | U.S.
Small
Cap
Equity | | | Fixed
Income | | | U.S.
Large
Cap
Equity | | | Global /
Non-U.S.
Equity | | | Solutions | | | Alternative
Investments | | | | Total
Long-term | | | | Money
Market /
Short-term | | | | Total AUM(1) | |
Year Ended December 31, 2024 | | |
| | | |
| | | |
| | | |
| | | |
| | | |
| | | |
| | | | | | | | | |
| | | | |
| |
Beginning AUM | | $ | | 30,604 | | | $ | | 15,959 | | | $ | | 24,355 | | | $ | | 12,635 | | | $ | | 16,772 | | | $ | | 54,296 | | | $ | | 3,431 | | | | $ | | 158,051 | | | | $ | | 3,271 | | | | $ | | 161,322 | |
Gross client cash inflows | | | | 4,516 | | | | | 2,043 | | | | | 4,912 | | | | | 284 | | | | | 3,762 | | | | | 8,634 | | | | | 1,105 | | | | | | 25,255 | | | | | | 912 | | | | | | 26,167 | |
Gross client cash outflows | | | | (7,685 | ) | | | | (4,195 | ) | | | | (5,905 | ) | | | | (1,540 | ) | | | | (2,893 | ) | | | | (8,509 | ) | | | | (1,618 | ) | | | | | (32,345 | ) | | | | | (1,200 | ) | | | | | (33,545 | ) |
Net client cash flows | | | | (3,169 | ) | | | | (2,152 | ) | | | | (993 | ) | | | | (1,256 | ) | | | | 869 | | | | | 125 | | | | | (513 | ) | | | | | (7,090 | ) | | | | | (287 | ) | | | | | (7,377 | ) |
Market appreciation / (depreciation) | | | | 3,189 | | | | | 1,035 | | | | | 924 | | | | | 2,873 | | | | | 1,570 | | | | | 8,290 | | | | | 47 | | | | | | 17,929 | | | | | | 172 | | | | | | 18,100 | |
Realizations and distributions | | | | — | | | | | — | | | | | — | | | | | — | | | | | — | | | | | — | | | | | (2 | ) | | | | | (2 | ) | | | | | — | | | | | | (2 | ) |
Acquired & divested assets / Net transfers | | | | (40 | ) | | | | (58 | ) | | | | 116 | | | | | (104 | ) | | | | (115 | ) | | | | (118 | ) | | | | 17 | | | | | | (301 | ) | | | | | 188 | | | | | | (113 | ) |
Ending AUM | | $ | | 30,584 | | | $ | | 14,785 | | | $ | | 24,402 | | | $ | | 14,148 | | | $ | | 19,095 | | | $ | | 62,593 | | | $ | | 2,980 | | | | $ | | 168,586 | | | | $ | | 3,344 | | | | $ | | 171,930 | |
Year Ended December 31, 2023 | | |
| | | |
| | | |
| | | |
| | | |
| | | |
| | | |
| | | | | | | | | |
| | | | |
| |
Beginning AUM | | $ | | 27,892 | | | $ | | 15,103 | | | $ | | 26,353 | | | $ | | 10,973 | | | $ | | 14,160 | | | $ | | 46,317 | | | $ | | 3,663 | | | | $ | | 144,460 | | | | $ | | 3,302 | | | | $ | | 147,762 | |
Gross client cash inflows | | | | 5,090 | | | | | 2,741 | | | | | 4,024 | | | | | 284 | | | | | 2,581 | | | | | 6,337 | | | | | 1,593 | | | | | | 22,651 | | | | | | 853 | | | | | | 23,504 | |
Gross client cash outflows | | | | (5,536 | ) | | | | (3,859 | ) | | | | (6,129 | ) | | | | (1,286 | ) | | | | (2,304 | ) | | | | (7,119 | ) | | | | (2,002 | ) | | | | | (28,235 | ) | | | | | (1,245 | ) | | | | | (29,480 | ) |
Net client cash flows | | | | (446 | ) | | | | (1,117 | ) | | | | (2,105 | ) | | | | (1,002 | ) | | | | 276 | | | | | (781 | ) | | | | (409 | ) | | | | | (5,584 | ) | | | | | (391 | ) | | | | | (5,976 | ) |
Market appreciation / (depreciation) | | | | 3,153 | | | | | 1,978 | | | | | 1,595 | | | | | 2,809 | | | | | 2,431 | | | | | 8,804 | | | | | 270 | | | | | | 21,039 | | | | | | 149 | | | | | | 21,188 | |
Realizations and distributions | | | | — | | | | | — | | | | | — | | | | | — | | | | | — | | | | | — | | | | | (100 | ) | | | | | (100 | ) | | | | | — | | | | | | (100 | ) |
Acquired & divested assets / Net transfers(2) | | | | 5 | | | | | (4 | ) | | | | (1,487 | ) | | | | (145 | ) | | | | (96 | ) | | | | (43 | ) | | | | 7 | | | | | | (1,763 | ) | | | | | 211 | | | | | | (1,552 | ) |
Ending AUM | | $ | | 30,604 | | | $ | | 15,959 | | | $ | | 24,355 | | | $ | | 12,635 | | | $ | | 16,772 | | | $ | | 54,296 | | | $ | | 3,431 | | | | $ | | 158,051 | | | | $ | | 3,271 | | | | $ | | 161,322 | |
Year Ended December 31, 2022 | | |
| | | |
| | | |
| | | |
| | | |
| | | |
| | | |
| | | | | | | | | |
| | | | |
| |
Beginning AUM | | $ | | 30,578 | | | $ | | 20,094 | | | $ | | 35,154 | | | $ | | 15,766 | | | $ | | 16,050 | | | $ | | 54,426 | | | $ | | 2,548 | | | | $ | | 174,616 | | | | $ | | 3,100 | | | | $ | | 177,716 | |
Gross client cash inflows | | | | 6,859 | | | | | 3,162 | | | | | 5,524 | | | | | 406 | | | | | 4,149 | | | | | 7,872 | | | | | 5,045 | | | | | | 33,016 | | | | | | 621 | | | | | | 33,637 | |
Gross client cash outflows | | | | (6,919 | ) | | | | (5,214 | ) | | | | (9,545 | ) | | | | (1,498 | ) | | | | (3,111 | ) | | | | (5,871 | ) | | | | (3,324 | ) | | | | | (35,481 | ) | | | | | (807 | ) | | | | | (36,289 | ) |
Net client cash flows | | | | (60 | ) | | | | (2,053 | ) | | | | (4,020 | ) | | | | (1,093 | ) | | | | 1,038 | | | | | 2,001 | | | | | 1,721 | | | | | | (2,465 | ) | | | | | (187 | ) | | | | | (2,652 | ) |
Market appreciation / (depreciation) | | | | (2,641 | ) | | | | (2,965 | ) | | | | (3,345 | ) | | | | (3,328 | ) | | | | (3,153 | ) | | | | (10,218 | ) | | | | (215 | ) | | | | | (25,864 | ) | | | | | 39 | | | | | | (25,826 | ) |
Realizations and distributions | | | | — | | | | | — | | | | | — | | | | | — | | | | | — | | | | | — | | | | | (376 | ) | | | | | (376 | ) | | | | | — | | | | | | (376 | ) |
Acquired & divested assets / Net transfers | | | | 14 | | | | | 27 | | | | | (1,436 | ) | | | | (372 | ) | | | | 226 | | | | | 107 | | | | | (16 | ) | | | | | (1,450 | ) | | | | | 350 | | | | | | (1,100 | ) |
Ending AUM | | $ | | 27,892 | | | $ | | 15,103 | | | $ | | 26,353 | | | $ | | 10,973 | | | $ | | 14,160 | | | $ | | 46,317 | | | $ | | 3,663 | | | | $ | | 144,460 | | | | $ | | 3,302 | | | | $ | | 147,762 | |
(1)Total AUM includes both discretionary assets under management and non-discretionary assets under advisement and excludes other assets.
(2)Reflects the divested assets associated with the INCORE transaction.
Total AUM by Distribution Channel – the following table presents our total AUM by distribution channel as of the dates indicated:
| | | | | | | | | | | | | | | | | | | | | | | | | | | | |
| | As of December 31, | | |
| | 2024 | | | 2023 | | | 2022 | | |
(in millions) | | Amount | | | % of total | | | Amount | | | % of total | | | Amount | | | % of total | | |
Direct | | $ | | 60,949 | | | | 35 | | % | $ | | 57,840 | | | | 36 | | % | $ | | 52,551 | | | | 36 | | % |
Institutional | | | | 41,322 | | | | 24 | | % | | | 40,866 | | | | 25 | | % | | | 39,320 | | | | 26 | | % |
Retail | | | | 69,659 | | | | 41 | | % | | | 62,616 | | | | 39 | | % | | | 55,891 | | | | 38 | | % |
Total AUM(1)(2) | | $ | | 171,930 | | | | 100 | | % | $ | | 161,322 | | | | 100 | | % | $ | | 147,762 | | | | 100 | | % |
(1) The allocation of AUM by distribution channel involves the use of estimates and the exercise of judgment.
(2) Total AUM includes both discretionary assets under management and non-discretionary assets under advisement and excludes other assets.
Assets Flows by Vehicle – the following table summarizes our asset flows by vehicle for the periods indicated:
| | | | | | | | | | | | | | | | | | | | |
| | | | | | | | | | Separate Accounts | | | | | |
| | | | | | | | | | and Other | | | | | |
(in millions) | | Mutual Funds(1) | | | ETFs(2) | | | Vehicles(3) | | | Total | |
Year Ended December 31, 2024 | | |
| | | |
| | | |
| | | |
| |
Beginning AUM | | $ | | 108,802 | | | $ | | 4,970 | | | $ | | 47,551 | | | $ | | 161,322 | |
Gross client cash inflows | | | | 14,954 | | | | | 3,089 | | | | | 8,124 | | | | | 26,167 | |
Gross client cash outflows | | | | (22,408 | ) | | | | (915 | ) | | | | (10,222 | ) | | | | (33,545 | ) |
Net client cash flows | | | | (7,454 | ) | | | | 2,174 | | | | | (2,097 | ) | | | | (7,377 | ) |
Market appreciation / (depreciation) | | | | 12,561 | | | | | 404 | | | | | 5,136 | | | | | 18,100 | |
Realization and distributions | | | | — | | | | | — | | | | | (2 | ) | | | | (2 | ) |
Acquired & divested assets / Net transfers | | | | (263 | ) | | | | (40 | ) | | | | 189 | | | | | (113 | ) |
Ending AUM | | $ | | 113,645 | | | $ | | 7,508 | | | $ | | 50,777 | | | $ | | 171,930 | |
Year Ended December 31, 2023 | | |
| | | |
| | | |
| | | |
| |
Beginning AUM | | $ | | 99,447 | | | $ | | 5,627 | | | $ | | 42,688 | | | $ | | 147,762 | |
Gross client cash inflows | | | | 15,594 | | | | | 969 | | | | | 6,942 | | | | | 23,504 | |
Gross client cash outflows | | | | (21,276 | ) | | | | (1,567 | ) | | | | (6,637 | ) | | | | (29,480 | ) |
Net client cash flows | | | | (5,682 | ) | | | | (599 | ) | | | | 305 | | | | | (5,976 | ) |
Market appreciation / (depreciation) | | | | 15,114 | | | | | (56 | ) | | | | 6,130 | | | | | 21,188 | |
Realization and distributions | | | | — | | | | | — | | | | | (100 | ) | | | | (100 | ) |
Acquired & divested assets / Net transfers (4) | | | | (77 | ) | | | | (3 | ) | | | | (1,471 | ) | | | | (1,552 | ) |
Ending AUM | | $ | | 108,802 | | | $ | | 4,970 | | | $ | | 47,551 | | | $ | | 161,322 | |
Year Ended December 31, 2022 | | |
| | | |
| | | |
| | | |
| |
Beginning AUM | | $ | | 124,142 | | | $ | | 4,871 | | | $ | | 48,703 | | | $ | | 177,716 | |
Gross client cash inflows | | | | 21,198 | | | | | 2,043 | | | | | 10,395 | | | | | 33,637 | |
Gross client cash outflows | | | | (27,703 | ) | | | | (572 | ) | | | | (8,014 | ) | | | | (36,289 | ) |
Net client cash flows | | | | (6,505 | ) | | | | 1,472 | | | | | 2,381 | | | | | (2,652 | ) |
Market appreciation / (depreciation) | | | | (17,092 | ) | | | | (724 | ) | | | | (8,010 | ) | | | | (25,826 | ) |
Realization and distributions | | | | — | | | | | — | | | | | (376 | ) | | | | (376 | ) |
Acquired & divested assets / Net transfers | | | | (1,098 | ) | | | | 9 | | | | | (11 | ) | | | | (1,100 | ) |
Ending AUM | | $ | | 99,447 | | | $ | | 5,627 | | | $ | | 42,688 | | | $ | | 147,762 | |
(1)Includes institutional and retail share classes, money market and Variable Insurance Products or VIP funds.
(2)Represents only ETF assets held by third parties. Excludes ETF assets held by other Victory Capital products.
(3)Includes collective trust funds, wrap program accounts, UMAs, UCITs, private funds and non-U.S. domiciled pooled vehicles.
(4)Reflects divested assets associated with the INCORE transaction.
December 31, 2024 AUM – Our total AUM at December 31, 2024 increased by $10.6 billion, or 6.6%, to $171.9 billion from $161.3 billion at December 31, 2023, primarily driven by positive market movement of $18.1 billion, partially offset by net outflows of $7.4 billion.
Net outflows were driven by $3.2 billion in our U.S. mid cap equity strategies, $2.2 billion in our U.S. small cap equity strategies, $1.3 billion in our U.S. large cap equity strategies, $1.0 billion in fixed income strategies, $0.5 billion in our alternative investment strategies and $0.3 billion in money market and short-term strategies, partially offset by $0.9 billion in net inflows into our global/non-U.S. equity strategies and $0.1 billion in our Solutions Platform.
December 31, 2023 AUM – Our total AUM at December 31, 2023 increased by $13.5 billion, or 9.2%, to $161.3 billion from $147.8 billion at December 31, 2022, primarily driven by positive market movement of $21.2 billion, partially offset by net outflows of $6.0 billion.
Net outflows were driven by $2.1 billion in fixed income strategies, $1.1 billion in our U.S. small cap equity strategies, $1.0 billion in our U.S. large cap equity strategies, $0.8 billion in our Solutions Platform, $0.4 billion in our U.S. mid cap equity strategies, $0.4 billion in our alternative investment strategies and $0.4 billion in money market and short-term strategies, partially offset by $0.3 billion in net inflows into our global/non-U.S. equity strategies.
December 31, 2022 AUM – Our total AUM at December 31, 2022 decreased by $29.9 billion, or 16.9%, to $147.8 billion from $177.7 billion at December 31, 2021, primarily driven by negative market movement and net outflows of $25.8 billion and $2.7 billion, respectively.
Net outflows were driven by $4.0 billion in fixed income strategies, $2.1 billion our U.S. small cap equity strategies, $1.1 billion in our U.S. large cap equity strategies, and $0.2 billion in money market and short-term strategies, partially offset by $2.0 billion in net inflows into our Solutions Platform, $1.7 billion into our alternative investment strategies, and $1.0 billion into our global/non-U.S. equity strategies.
GAAP Results of Operations
Our GAAP revenues principally consist of: (i) investment management fees, which are based on our overall weighted average fee rate charged to our clients and our level of AUM and (ii) fund administration and distribution fees, which are asset‑based fees earned from open‑end mutual funds for administration and distribution services. Fund administration and fund distribution fees also include fund transfer agent fees, which are based on a contractual rate applied to average AUM or the number of accounts in these funds.
The Company has contractual arrangements with third parties to provide certain advisory, administration, transfer agent and distribution services. Management considers whether we are acting as the principal service provider or as an agent to determine whether revenue should be recorded based on the gross amount payable by the customer or net of payments to third-party service providers, respectively. Victory is considered a principal service provider if we control the service that is transferred to the customer. We are considered an agent when we arrange for the service to be provided by another party and do not control the service.
Investment Management Fees – Investment management fees are earned from managing clients’ assets. Our investment management fee revenue fluctuates based on a number of factors, including the total value of our AUM, the composition of AUM across investment strategies and vehicles, changes in the investment management fee rates on our products and the extent to which we enter into fee arrangements that differ from our standard fee schedule as well as the extent to which our fund expenses exceed fund caps. Investment management fees are earned based on a percentage of AUM as delineated in the respective investment management agreements. Our investment management fees are calculated based on daily average AUM, monthly average AUM or point in time AUM.
Fund Administration and Distribution Fees – Fund administration fees are primarily asset‑based fees earned from open‑end funds for administration services. Fund administration fees fluctuate based on the level of average open‑end fund AUM and the fee rates charged for these services.
Fund distribution fees are asset‑based fees earned from open‑end funds for distribution services. Fund distribution fees fluctuate based on the level of average open‑end fund AUM and the composition of those assets across share classes that pay varying levels of fund distribution fees.
The Company has contractual arrangements with a third party to provide certain sub-administration services. We are the primary obligor under the contracts with the Victory Funds and VictoryShares and have the ability to select the service provider and establish pricing. As a result, fund administration fees and sub-administration expenses are recorded on a gross basis. VCS has contractual arrangements with third parties to provide certain distribution services. VCS is the primary obligor under the contracts with the Victory Funds and has the ability to select the service provider and establish pricing. Substantially all of VCS’s revenue is recorded gross of payments made to third parties.
Fund transfer agent fees are earned for providing mutual fund shareholder services. Transfer agent fees fluctuate based on the level of average AUM and the number of accounts in the Victory Funds III.
The Company has contractual arrangements with a third party to provide certain sub-transfer agent services. We are the primary obligor under the transfer agency contracts with the Victory Funds III and have the ability to select the service provider and establish pricing. As a result, fund transfer agent fees and sub-transfer agent expenses are recorded on a gross basis.
GAAP Expenses
Our GAAP expenses principally consist of: (i) personnel compensation and benefits; (ii) distribution and other asset‑based expenses; (iii) general and administrative expenses; (iv) depreciation and amortization charges; and (v) acquisition‑related expenses comprising of changes in the fair value of contingent acquisition payments and restructuring and acquisition costs.
Personnel Compensation and Benefits – Personnel compensation and benefits is our most significant category of expense. Personnel compensation and benefits consists of (i) salaries, payroll related taxes and employee benefits, (ii) incentive compensation, (iii) sales‑based compensation, (iv) compensation expense related to equity awards granted to employees and directors and (v) acquisition‑related compensation in the form of cash retention bonuses and certain transaction-related compensatory payment arrangements.
Incentive compensation is the largest component of the total compensation of our employees. The aggregate amount of cash incentive compensation is funded by a pool that is based on a percentage of total Company earnings (before taking into account incentive compensation). This incentive pool is used to pay the investment teams a percentage of the revenue earned by their respective Franchise on a quarterly basis. This incentive pool is also used to pay incentive compensation to senior management and other non‑investment employees on an annual basis. Incentive compensation paid to senior management and to other non‑investment employees is discretionary and subjectively determined based on Company and individual performance and the total amount of the incentive compensation pool.
Distribution and Other Asset‑based Expenses – Distribution and other asset‑based expenses consists of: (i) broker‑dealer distribution fees and platform distribution fees and (ii) sub‑administration, sub-transfer agent, sub‑advisory expenses and middle‑office expenses.
Broker‑dealer distribution fees are paid by VCS as the broker‑dealer for the Victory Funds to third‑party distributors. The Victory Funds pay VCS for distribution services and VCS, in turn, pays third‑party distributors.
Platform distribution fees are paid by VCM as the investment adviser to the Victory Funds. Platform distribution fees are paid to financial advisors, retirement plan providers and intermediaries for servicing and administering accounts invested in shares of the Victory Funds. Distribution fees typically vary based on the level of AUM and the composition of those assets across share classes.
Sub‑administration, sub-transfer agent, sub‑advisory and middle‑office expenses consist of fees paid to our sub‑administrators of the Victory Funds and VictoryShares, fees paid to our sub-transfer agent for the Victory Funds III, fees paid to sub‑advisers on certain Victory Funds and fees paid to vendors to which we outsource middle‑office functions.
•VCM acts as the administrator to the Victory Funds and VictoryShares. VCM has hired a sub‑administrator, the fees for which are captured in sub‑administration expense. As administrator, VCM supervises the operations of the Victory Funds and VictoryShares, including the services provided by the sub‑administrators. The sub‑administrators are paid through a contractual arrangement based on a percentage of the average fund AUM.
•VCTA acts as the transfer agent to the Victory Funds III. VCTA has hired a sub-transfer agent, the fees for which are captured in sub-administration expense. As transfer agent, VCTA oversees the services provided by the sub-transfer agent. The sub-transfer agent is paid through a contractual arrangement based on a percentage of average fund AUM.
•VCM, as the investment adviser for the Victory Funds, has hired unaffiliated sub‑advisers to manage funds for which we do not have in‑house capabilities. The fees paid to the sub‑advisers are contractual based on a percentage of assets that they manage or based upon a percentage of revenue.
•We have outsourced middle‑office operations to achieve a scalable operational infrastructure that utilizes a variable‑cost model. We have selected to partner with top‑tier vendors who perform trade operations, portfolio accounting and performance measurement with oversight from our operations team. The fees paid to these vendors are variable and structured based on the number of accounts, assets and specific services performed.
General and Administrative Expenses – General and administrative expenses primarily consist of investment research and technology costs, professional and marketing fees, travel, rent and insurance expenses.
Depreciation and Amortization – Depreciation and amortization expense consists primarily of the depreciation of property and equipment as well as the amortization of acquired intangibles that have a definite life. These intangibles include customer relationships, investment advisory contracts, intellectual property and non‑compete clauses acquired in connection with a business or asset acquisition. Both depreciation and amortization are recorded ratably over the assets’ useful lives.
Acquisition‑Related Costs – Acquisition‑related costs include legal fees, advisory services, mutual fund proxy voting costs and other one‑time expenses related to acquisitions.
Restructuring and Integration Costs – Restructuring and integration costs include costs incurred in connection with business combinations, including the change in the fair value of contingent acquisition payments, asset purchases and changes in business strategy. These include severance expenses related to one‑time benefit arrangements, contract termination and other costs to integrate investment platforms, products and personnel into existing systems, processes and service provider arrangements and restructuring the business to capture operating expense synergies.
Other non‑operating items of income and expense consist of: (i) interest income and other income (expense); (ii) interest expense and other financing costs; (iii) loss on debt extinguishment; and (iv) income tax expense.
Interest Income and Other Income (Expense) – Interest income and other income (expense) consists primarily of interest income, gains (losses) on investments and dividend income on investments.
Interest Expense and Other Financing Costs – Interest expense and other financing costs consists primarily of interest expense attributable to long‑term debt. Refer to “Liquidity and Capital Resources” for more information.
Loss on Debt Extinguishment – Loss on debt extinguishment consists of the write-off of unamortized debt issuance costs and unamortized debt discount as a result of debt refinancing, the acceleration of the paydown of debt principal and debt repurchased and retired in open market transactions.
Income Tax Expense – The provision for income taxes includes U.S. federal, state and local taxes, and foreign income taxes payable by certain of our subsidiaries. The effective tax rate is primarily driven by state and local taxes and excess tax benefits on share-based compensation. The portion of the effective income tax rate attributable to state and local income taxes varies from year to year depending on amounts of income apportioned to each jurisdiction, whether we file income tax returns on a unitary or separate return basis and with changes in tax laws.
The following table presents our GAAP results of operations for the years ended December 31, 2024, 2023 and 2022 (in thousands except per share data).
| | | | | | | | | | | | | | |
| | | | | | | | |
| Year Ended December 31, | |
| 2024 | | | 2023 | | | 2022 | |
Revenue | |
| |
| |
| |
| |
| |
Investment management fees | $ | | 704,583 | | | $ | | 640,876 | | | $ | | 664,710 | |
Fund administration and distribution fees | | | 188,894 | | | | | 180,152 | | | | | 190,090 | |
Total revenue | | | 893,477 | | | | | 821,028 | | | | | 854,800 | |
| | | | | | | | | | | |
Expenses | |
| | | |
| | | |
| |
Personnel compensation and benefits | | | 217,214 | | | | | 220,992 | | | | | 238,198 | |
Distribution and other asset-based expenses | | | 146,489 | | | | | 149,596 | | | | | 161,105 | |
General and administrative | | | 56,694 | | | | | 56,287 | | | | | 52,373 | |
Depreciation and amortization | | | 30,176 | | | | | 41,647 | | | | | 43,201 | |
Change in value of consideration payable for acquisition of business | | | 2,694 | | | | | 23,236 | | | | | (40,600 | ) |
Acquisition-related costs | | | 11,285 | | | | | 217 | | | | | 534 | |
Restructuring and integration costs | | | 1,411 | | | | | 595 | | | | | 881 | |
Total operating expenses | | | 465,963 | | | | | 492,570 | | | | | 455,692 | |
Income from operations | | | 427,514 | | | | | 328,458 | | | | | 399,108 | |
| | | | | | | | | | | |
Other income (expense) | |
| | | |
| | | |
| |
Interest income and other income (expense) | | | 10,441 | | | | | 8,732 | | | | | (2,463 | ) |
Interest expense and other financing costs | | | (63,836 | ) | | | | (61,282 | ) | | | | (43,964 | ) |
Loss on debt extinguishment | | | (363 | ) | | | | — | | | | | (2,648 | ) |
Total other income (expense), net | | | (53,758 | ) | | | | (52,550 | ) | | | | (49,075 | ) |
| | | | | | | | | | | |
Income before income taxes | | | 373,756 | | | | | 275,908 | | | | | 350,033 | |
| | | | | | | | | | | |
Income tax expense | | | (84,892 | ) | | | | (62,751 | ) | | | | (74,522 | ) |
| | | | | | | | | | | |
Net income | $ | | 288,864 | | | $ | | 213,157 | | | $ | | 275,511 | |
| | | | | | | | | | | |
Earnings per share of common stock | | | | | | | | | | | |
Basic | $ | | 4.47 | | | $ | | 3.22 | | | $ | | 4.02 | |
Diluted | $ | | 4.38 | | | $ | | 3.12 | | | $ | | 3.81 | |
| | | | | | | | | | | |
Weighted average number of shares outstanding | | | | | | | | | | | |
Basic | | | 64,607 | | | | | 66,202 | | | | | 68,481 | |
Diluted | | | 65,928 | | | | | 68,214 | | | | | 72,266 | |
| | | | | | | | | | | |
Dividends declared per share of common stock | $ | | 1.555 | | | $ | | 1.28 | | | $ | | 1.00 | |
Investment Management Fees
2024 compared to 2023 – Investment management fees increased $63.7 million, or 9.9%, to $704.6 million in 2024 from $640.9 million in 2023 due to an increase in average AUM. Average AUM was $169.7 billion in 2024 compared to $153.5 billion in 2023.
2023 compared to 2022 – Investment management fees decreased $23.8 million, or 3.6%, to $640.9 million in 2023 from $664.7 million in 2022 due to decrease in average AUM. Average AUM was $153.5 billion in 2023 compared to $158.7 billion in 2022.
Fund Administration and Distribution Fees
2024 compared to 2023 – Fund administration and distribution fees increased $8.7 million, or 4.9%, to $188.9 million in 2024 compared to $180.2 million in 2023. The increase is due primarily to higher mutual fund average net assets.
2023 compared to 2022 – Fund administration and distribution fees decreased $9.9 million, or 5.2%, to $180.2 million in 2023 compared to $190.1 million in 2022. The decrease is due primarily to lower mutual fund average net assets.
Personnel Compensation and Benefits
The following table presents the components of GAAP compensation expense for the years ended December 31, 2024, 2023 and 2022:
| | | | | | | | | | | | | | | |
| | Year Ended December 31, | |
(in thousands) | | 2024 | | | 2023 | | | 2022 | |
Salaries, payroll related taxes and employee benefits | | $ | | 88,599 | | | $ | | 90,884 | | | $ | | 87,819 | |
Incentive compensation | | | | 102,712 | | | | | 87,081 | | | | | 94,511 | |
Sales-based compensation(1) | | | | 24,338 | | | | | 20,945 | | | | | 27,589 | |
Equity awards granted to employees and directors(2) | | | | 15,220 | | | | | 16,548 | | | | | 17,816 | |
Acquisition and transaction-related compensation | | | | (13,655 | ) | | | | 5,534 | | | | | 10,463 | |
Total personnel compensation and benefits expense | | $ | | 217,214 | | | $ | | 220,992 | | | $ | | 238,198 | |
(1)Represents sales‑based commissions paid to our distribution teams. Sales‑based compensation varies based on gross and net client cash flows and revenue earned on sales.
(2)Share-based compensation typically vests over several years based on service and the achievement of specific business and financial targets. The value of share-based compensation is recognized as compensation expense over the vesting period.
2024 compared to 2023 – Personnel compensation and benefits were $217.2 million in 2024, a decrease of $3.8 million, or 1.7%, from $221.0 million in 2023. Acquisition and transaction-related compensation in 2024 decreased $19.2 million from 2023 due to a non-cash, contingent payment adjustment of $13.7 million during the year ended December 31, 2024. Also contributing was a decrease in salaries, payroll related taxes and employee benefits of $2.3 million over the comparable period. These decreases were offset by higher sales-based and incentive compensation of $19.0 million during 2024 relating to an increase in operating results.
2023 compared to 2022 – Personnel compensation and benefits were $221.0 million in 2023, a decrease of $17.2 million, or 7.2%, from $238.2 million in 2022 primarily due to a decrease in variable costs such as sales-based and incentive compensation as a result of a decline in operating results. Also contributing was a decrease in acquisition and transaction-related compensation. Salaries, payroll related taxes and employee benefits were $90.9 million and $87.8 million, respectively, for the years ended December 31, 2023 and 2022. Incentive compensation and equity awards granted to employees and directors were $87.1 million and $16.5 million, respectively, for the year ended December 31, 2023, compared to $94.5 million and $17.8 million, respectively, for the same period in 2022. Sales-based compensation was $20.9 million and $27.6 million for the years ended December 31, 2023 and 2022, respectively.
Distribution and Other Asset‑based Expenses
The following table presents the components of distribution and other asset‑based expenses for the years ended December 31, 2024, 2023 and 2022:
| | | | | | | | | | | | | | | |
| | Year Ended December 31, | |
(in thousands) | | 2024 | | | 2023 | | | 2022 | |
Broker-dealer distribution fees | | $ | | 20,222 | | | $ | | 20,275 | | | $ | | 22,703 | |
Platform distribution fees | | | | 89,233 | | | | | 92,509 | | | | | 98,155 | |
Sub-administration | | | | 17,010 | | | | | 15,877 | | | | | 16,261 | |
Sub-advisory | | | | 9,152 | | | | | 10,576 | | | | | 13,573 | |
Middle-office | | | | 10,872 | | | | | 10,359 | | | | | 10,413 | |
Total distribution and other asset-based expenses | | $ | | 146,489 | | | $ | | 149,596 | | | $ | | 161,105 | |
2024 compared to 2023 – Distribution and other asset‑based expenses are primarily based on AUM. Distribution and other asset-based expenses decreased $3.1 million, or 2.1%, to $146.5 million in 2024 compared to $149.6 million in 2023, primarily due to a decrease in platform distribution fees over the comparable period.
2023 compared to 2022 – Distribution and other asset‑based expenses are primarily based on AUM. Distribution and other asset-based expenses decreased $11.5 million, or 7.1%, to $149.6 million in 2023 compared to $161.1 million in 2022, primarily due to a decrease in average AUM over the comparable period.
General and Administrative Expenses
2024 compared to 2023 – General and administrative expenses were $56.7 million in 2024 compared to $56.3 million in 2023, an increase of $0.4 million, or 0.7%.
2023 compared to 2022 – General and administrative expenses were $56.3 million in 2023 compared to $52.4 million in 2022. The increase of $3.9 million, or 7.5%, was primarily due to an increase in marketing expense as well as a one-time expense associated with the unwinding of the Company's floating-to-fixed interest rate swap transaction (“Swap”). Refer to Note 12, Derivatives, for further details on the Swap.
Depreciation and Amortization
2024 compared to 2023 – Depreciation and amortization decreased by $11.5 million, or 27.5%, to $30.2 million in 2024, from $41.6 million in 2023, primarily due to a decrease in amortization expense related to definite-lived intangible assets in connection with prior acquisitions.
2023 compared to 2022 – Depreciation and amortization decreased by $1.6 million, or 3.6%, to $41.6 million in 2023, from $43.2 million in 2022, primarily due to a decrease in amortization expense related to definite-lived intangible assets in connection with the USAA AMCO acquisition partially offset by the write down of a trade name asset primarily as a result of a change in the estimated useful life.
Change in Value of Consideration Payable for Acquisition of Business
2024 compared to 2023 - The change in value of consideration payable for acquisition of business decreased $20.5 million as a result of an increase of $2.7 million in the fair value of the contingent consideration associated with the WestEnd Acquisition for the year ended December 31, 2024, compared to increases of $8.7 million and $14.5 million associated with the USAA AMCO Acquisition and WestEnd Acquisition, respectively, for the year ended December 31, 2023. Refer to Note 4, Acquisitions, for further details on the fair value of contingent consideration payable.
2023 compared to 2022 - The change in value of consideration payable for acquisition of business increased $63.8 million as a result of increases of $8.7 million and $14.5 million in the fair value of the contingent consideration associated with the USAA AMCO and WestEnd Acquisitions, respectively, for the year ended December 31, 2023 compared to decreases of $3.6 million and $37.0 million in the fair value of the contingent
consideration associated with the USAA AMCO and WestEnd Acquisitions, respectively, for the year ended December 31, 2022. Refer to Note 4, Acquisitions, for further details on the fair value of contingent consideration payable.
Acquisition‑Related Costs
2024 compared to 2023 – Acquisition-related costs increased $11.1 million to $11.3 million for the year ended December 31, 2024 compared to $0.2 million in the prior year. The expense for the year ended December 31, 2024 was primarily due to legal and professional fees associated with the Amundi transaction.
2023 compared to 2022 – Acquisition-related costs decreased $0.3 million to $0.2 million for the year ended December 31, 2023 compared to $0.5 million in the prior year. The expense for the years ended December 31, 2023 and 2022 was primarily due to legal and professional fees.
Restructuring and Integration Costs
2024 compared to 2023 – Restructuring and integration costs increased $0.8 million to $1.4 million for the year ended December 31, 2024 compared to $0.6 million in the prior year. The expense primarily relates to personnel restructuring and the year ended December 31, 2024 also includes integration and conversion costs related to the Amundi transaction.
2023 compared to 2022 – Restructuring and integration costs decreased $0.3 million to $0.6 million for the year ended December 31, 2023 compared to $0.9 million in the prior year. The expense for the years ended December 31, 2023 and 2022 was primarily due to personnel restructuring.
Interest Income and Other Income (Expense)
2024 compared to 2023 – Interest income and other income (expense) was income of $10.4 million and $8.7 million in 2024 and 2023, respectively. The increase was due to an increase in dividend income partially offset by a decrease in the net unrealized fair value of deferred compensation plan investments over the comparable period.
2023 compared to 2022 – Interest income and other income (expense) was income of $8.7 million in 2023 compared to expense of $2.5 million in 2022. The increase was due to an increase in dividend income and an increase in the net unrealized fair value of deferred compensation plan investments in 2023 compared to a decrease in the net unrealized fair value of deferred compensation plan investments in 2022.
Interest Expense and Other Financing Costs
2024 compared to 2023 – Interest expense and other financing costs increased $2.6 million to $63.8 million in 2024 from $61.3 million in 2023 as a result of a higher average interest rate over the comparable period.
2023 compared to 2022 – Interest expense and other financing costs increased $17.3 million to $61.3 million in 2023 from $44.0 million in 2022 as a result of a higher average interest rate over the comparable period.
Loss on Debt Extinguishment
2024 compared to 2023 – For the year ended December 31, 2024, the Company had $0.4 million in losses on debt extinguishment due to repayments of term loan principal. The Company had no losses on debt extinguishment for the year ended December 31, 2023.
2023 compared to 2022 – The Company had no losses on debt extinguishment for the year ended December 31, 2023. For the year ended December 31, 2022, the Company had $2.6 million in losses on debt extinguishment due to repayments of term loan principal.
Income Tax Expense
2024 compared to 2023 – Our effective tax rate was flat at 22.7% in 2023 and 2024, respectively. Refer to Note 10, Income Taxes, to the audited financial statements for further details on income taxes.
2023 compared to 2022 – Our effective tax rate increased 1.4% from 21.3% in 2022 to 22.7% in 2023. The change in the effective tax rate was primarily due to lower excess tax benefits on share-based compensation. Refer to Note 10, Income Taxes, to the audited financial statements for further details on income taxes.
Effects of Inflation
Inflation did not have a material effect on our consolidated results of operations. Inflationary pressures can result in increases to our cost structure. Certain large expense components such as compensation and distribution expenses are predominately variable and move in tandem with revenues. To the degree that these expense increases are not recoverable or cannot be counterbalanced through price increases due to the competitive environment, our profitability could be negatively impacted. In addition, the value of the fixed income assets that we manage may be negatively impacted when inflationary expectations result in a rising interest rate environment. Declines in the values of AUM could lead to reduced revenues as investment management fees are generally earned as a percentage of AUM.
Supplemental Non‑GAAP Financial Information
We report our financial results in accordance with GAAP. Our management uses non‑GAAP performance measures to evaluate the underlying operations of our business. Non‑GAAP financial measures are used to supplement GAAP results to provide a more complete understanding of the factors and trends affecting our business than GAAP results alone. Due to our acquisitive nature, there are a number of acquisition and restructuring related expenses included in GAAP measures that we believe distort the underlying economics of our organization and we believe that many investors use this information when assessing the financial performance of companies in the investment management industry. We have included these non‑GAAP measures to provide investors with the same financial metrics used by management to assess the operating performance of our Company.
Non‑GAAP measures should be considered in addition to, and not as a substitute for, financial measures prepared in accordance with GAAP. Our non‑GAAP measures may differ from similar measures at other companies, even if similar terms are used to identify these measures. Specifically, we make use of the non‑GAAP financial measures “Adjusted EBITDA” and “Adjusted Net Income.”
The following table sets forth a reconciliation from GAAP financial measures to non‑GAAP measures for the periods indicated:
| | | | | | | | | | | | | | | |
| | Year Ended December 31, | |
(in thousands) | | 2024 | | | 2023 | | | 2022 | |
Reconciliation of non-GAAP financial measures: | | |
| | | |
| | | |
| |
Net income (GAAP) | | $ | | 288,864 | | | $ | | 213,157 | | | $ | | 275,511 | |
Income tax expense | | | | (84,892 | ) | | | | (62,751 | ) | | | | (74,522 | ) |
Income before income taxes | | $ | | 373,756 | | | $ | | 275,908 | | | $ | | 350,033 | |
Interest expense(1) | | | | 60,799 | | | | | 57,820 | | | | | 41,024 | |
Depreciation(2) | | | | 8,959 | | | | | 8,842 | | | | | 8,045 | |
Other business taxes(3) | | | | 1,525 | | | | | 1,707 | | | | | 2,118 | |
Amortization of acquisition-related intangible assets(4) | | | | 21,217 | | | | | 32,805 | | | | | 35,160 | |
Share-based compensation(5) | | | | 4,246 | | | | | 6,496 | | | | | 10,143 | |
Acquisition, restructuring and exit costs(6) | | | | 1,735 | | | | | 28,982 | | | | | (28,722 | ) |
Debt issuance costs(7) | | | | 3,385 | | | | | 5,394 | | | | | 5,620 | |
Losses from equity method investments(8) | | | | — | | | | | — | | | | | 825 | |
Adjusted EBITDA | | $ | | 475,622 | | | $ | | 417,954 | | | $ | | 424,246 | |
| | | | | | | | | | | | | | | |
| | Year Ended December 31, | |
(in thousands) | | 2024 | | | 2023 | | | 2022 | |
Reconciliation of non-GAAP financial measures: | | |
| | | |
| | | |
| |
Net income (GAAP) | | $ | | 288,864 | | | $ | | 213,157 | | | $ | | 275,511 | |
Adjustments to reflect the operating performance of the Company: | | |
| | | |
| | | |
| |
i. Other business taxes(3) | | | | 1,525 | | | | | 1,707 | | | | | 2,118 | |
ii. Amortization of acquisition-related intangible assets(4) | | | | 21,217 | | | | | 32,805 | | | | | 35,160 | |
iii. Share-based compensation(5) | | | | 4,246 | | | | | 6,496 | | | | | 10,143 | |
iv. Acquisition, restructuring and exit costs(6) | | | | 1,735 | | | | | 28,982 | | | | | (28,722 | ) |
v. Debt issuance costs(7) | | | | 3,385 | | | | | 5,394 | | | | | 5,620 | |
Tax effect of above adjustments(9) | | | | (8,028 | ) | | | | (18,847 | ) | | | | (6,080 | ) |
Adjusted Net Income | | $ | | 312,944 | | | $ | | 269,694 | | | $ | | 293,750 | |
Tax benefit of goodwill and acquired intangibles(10) | | $ | | 40,171 | | | $ | | 38,252 | | | $ | | 37,490 | |
Adjustments made to GAAP Net Income to calculate Adjusted EBITDA and Adjusted Net Income, as applicable, are:
(1)Adding back interest paid on debt and other financing costs, net of interest income.
(2)Adding back depreciation on property and equipment.
(3)Adding back other business taxes.
(4)Adding back amortization expense on acquisition‑related intangible assets.
(5)Adding back share-based compensation associated with equity awards issued from pools created in connection with the management‑led buyout and various acquisitions and as a result of equity grants related to the initial public offering (the “IPO”).
(6)Adding back direct incremental costs of acquisitions, including restructuring costs.
(7)Adding back debt issuance and Swap unwind cost expense.
(8)Adjusting for losses (earnings) on equity method investments.
(9)Subtracting an estimate of income tax expense applied to the sum of the adjustments above.
(10)Represents the tax benefits associated with deductions allowed for intangibles and goodwill generated from acquisitions in which we received a step‑up in basis for tax purposes. Acquired intangible assets and goodwill may be amortized for tax purposes, generally over a 15‑year period. The tax benefit from amortization on these assets is included to show the full economic benefit of deductions for all acquired intangibles with a step‑up in tax basis. Due to our acquisitive nature, tax deductions allowed on acquired intangible assets and goodwill provide us with a significant economic benefit.
The following table presents the components of acquisition, restructuring and exit costs for the periods indicated:
| | | | | | | | | | | | | | | |
| | Year Ended December 31, | |
(in thousands) | | 2024 | | | 2023 | | | 2022 | |
Acquisition-related costs | | $ | | 11,285 | | | $ | | 217 | | | $ | | 534 | |
Change in value of consideration payable for acquisition of business | | | | 2,694 | | | | | 23,236 | | | | | (40,600 | ) |
Restructuring and integration costs | | | | 1,411 | | | | | 595 | | | | | 881 | |
Personnel compensation and benefits | | | | (13,655 | ) | | | | 5,534 | | | | | 10,463 | |
Interest income and other (income) expense | | | | — | | | | | (600 | ) | | | | — | |
Total acquisition, restructuring and exit costs | | $ | | 1,735 | | | $ | | 28,982 | | | $ | | (28,722 | ) |
Liquidity, Capital Resources and Contractual Obligations
Sources and Uses of Cash – We generate strong cash flows from operations that allow us to meet our cash requirements. Our primary uses of cash include: (i) repayment of our debt obligations, (ii) funding of acquisitions, (iii) payment of contingent consideration for previous acquisitions, and (iv) working capital needs. Cash flows from operations also allow us to meet certain other cash uses such as quarterly cash dividends and
the repurchase of our Common Stock. We believe we have sufficient liquidity and capital resources to continue to paydown our debt obligations as well as to continue focusing on acquisition candidates.
The following table presents our liquidity position as of December 31, 2024 and 2023:
| | | | | | | | | | |
| | December 31, | | | December 31, | |
(in thousands) | | 2024 | | | 2023 | |
Cash and cash equivalents(1) | | $ | | 126,731 | | | $ | | 123,547 | |
Accounts and other receivables(2) | | | | 100,667 | | | | | 87,570 | |
Undrawn commitment on revolving credit facility(3) | | | | 100,000 | | | | | 100,000 | |
Accounts and other payables(4) | | | | (109,599 | ) | | | | (111,933 | ) |
(1)We manage our cash balances in order to fund our day-to-day operations and invest excess cash into money market funds and other short-term investments.
(2)Our accounts receivables consist primarily of investment management, fund administrative and distribution fees that have been earned but not yet received from clients. We perform a review of our receivables on a monthly basis to assess collectability.
(3)The balance at December 31, 2024 and 2023 represents the Company’s undrawn $99.9 million revolving credit facility and a $0.1 million standby letter of credit used as collateral for THB’s real estate location.
(4)Accounts and other payables consist primarily of various payables related to operations, transaction costs and interest payable on the term loan, as well as accrued compensation and benefits.
Excludes $62.7 million and $78.3 million at December 31, 2024 and 2023, respectively, related to the estimated fair value of the contingent consideration that is expected to be paid over the next twelve month period resulting from the WestEnd Acquisition.
2019 Credit Agreement
On July 1, 2019, concurrent with the USAA AMCO Acquisition, the Company entered into the 2019 Credit Agreement, repaid all indebtedness outstanding under the prior credit agreement (the “2018 Credit Agreement”), and terminated the 2018 Credit Agreement.
The 2019 Credit Agreement was entered into among Victory, as borrower, the lenders from time to time party thereto and Barclays Bank PLC, as administrative agent and collateral agent, pursuant to which the Company obtained a seven-year term loan in an aggregate principal amount of $1.1 billion (the “2019 Term Loans”) and established a five-year revolving credit facility (which was unfunded as of the closing date) with aggregate commitments of $100.0 million (with a $10.0 million sub-limit for the issuance of letters of credit).
The obligations of the Company under the 2019 Credit Agreement are guaranteed by the Company’s domestic subsidiaries (other than VCS) (the “Guarantors”) and secured by substantially all of the assets of the Company and the Guarantors, subject in each case to certain customary exceptions.
The 2019 Credit Agreement contains customary affirmative and negative covenants, including covenants that affect, among other things, the ability of the Company and its subsidiaries to incur additional indebtedness, create liens, merge or dissolve, make investments, dispose of assets, engage in sale and leaseback transactions, make distributions and dividends and prepayments of junior indebtedness, engage in transactions with affiliates, enter into restrictive agreements, amend documentation governing junior indebtedness, modify its fiscal year and modify its organizational documents, subject to customary exceptions, thresholds, qualifications and “baskets.” In addition, the 2019 Credit Agreement contains a financial performance covenant, requiring a maximum first lien leverage ratio, measured as of the last day of each fiscal quarter on which outstanding borrowings under the revolving credit facility exceed 35.0% of the commitments thereunder (excluding certain letters of credit), of no greater than 3.80 to 1.00.
As of December 31, 2024, there were no outstanding borrowings under the revolving credit facility and the Company was in compliance with its financial performance covenant.
First Amendment
Amounts outstanding under the 2019 Credit Agreement originally accrued interest at an annual rate equal to, at the option of the Company, either LIBOR (adjusted for reserves) plus a margin of 3.25% or an alternate base rate plus a margin of 2.25%.
On January 17, 2020, the Company entered into the First Amendment (the “First Amendment”) to the 2019 Credit Agreement with the other loan parties thereto, Barclays Bank PLC, as administrative agent, and the Royal Bank of Canada as fronting bank.
Pursuant to the First Amendment, the Company refinanced the 2019 Term Loans with replacement term loans in an aggregate principal amount of $952.0 million (the “2020 Term Loans”). The 2020 Term Loans provided for substantially the same terms as the 2019 Term Loans, including the same maturity date of July 1, 2026, except that the 2020 Term Loans reduced the applicable margin on LIBOR by 75 basis points, resulting in an applicable margin on LIBOR under the 2020 Term Loans of 2.50%.
Second Amendment
On February 18, 2021, the Company entered into the Second Amendment (the “Second Amendment”) to the 2019 Credit Agreement with the other loan parties thereto, Barclays Bank PLC, as administrative agent, and the Royal Bank of Canada as fronting bank. Pursuant to the Second Amendment, the Company repriced the 2020 Term Loans with replacement term loans in an aggregate principal amount of $755.7 million (the “Repriced Term Loans”). The Repriced Term Loans provided for substantially the same terms as the 2020 Term Loans, including the same maturity date of July 2026, except that the Repriced Term Loans reduced the applicable margin on LIBOR by 25 basis points, resulting in an applicable margin on LIBOR under the Repriced Term Loans of 2.25%.
Third Amendment
On December 31, 2021, the Company entered into the Third Amendment (the “Third Amendment”) to the 2019 Credit Agreement with the guarantors party thereto, Barclays Bank PLC, as administrative agent, and the lenders party thereto from time to time. Pursuant to the Third Amendment, the Company obtained incremental term loans (the “2021 Incremental Term Loans”) in an aggregate principal amount of $505.0 million and used the proceeds to fund the WestEnd Acquisition and to pay fees and expenses incurred in connection therewith.
The 2021 Incremental Term Loans will mature in December 2028 and, until the Fourth Amendment to the 2019 Credit Agreement, accrued interest at an annual rate equal to, at the option of the Company, either LIBOR (adjusted for reserves and subject to a 50 basis point floor) plus a margin of 2.25% or an alternate base rate plus a margin of 1.25%.
Original issue discount was $2.5 million for the 2021 Incremental Term Loans. The Company incurred a total of $9.1 million of other third party costs related to the 2021 Incremental Term Loans, which were recorded as term loan debt issuance costs.
Fourth Amendment
On September 23, 2022, the Company entered into the Fourth Amendment (the “Fourth Amendment”) to the 2019 Credit Agreement to change the interest rate on its debt from LIBOR to a rate based on the secured overnight financing rate (“SOFR”) plus a ten-basis point credit spread adjustment. There was no change to the applicable margin on the referenced rate from the Fourth Amendment.
The LIBOR rate loans outstanding as of the Fourth Amendment’s effective date continued as LIBOR rate loans until the end of their then current interest periods. The 2021 Incremental Term Loans converted into Term SOFR loans on September 30, 2022, while the Repriced Term Loans converted into Term SOFR loans on October 6, 2022. Also on October 6, 2022, the interest periods for the Repriced Term Loans and 2021 Incremental Term Loans were aligned and the three-month Term SOFR rate was elected for all the Company’s term loans. The Company has continued to elect the three-month Term SOFR rate for all of the term loans outstanding under the 2019 Credit Agreement since executing the Fourth Amendment.
Fifth Amendment
On June 7, 2024, the Company entered into the Fifth Amendment to the 2019 Credit Agreement, extending the maturity date of the $100.0 million senior secured first lien revolving facility from July 1, 2024 to March 31, 2026, and decreasing the drawn interest rate margin by 0.50% per annum. The revolving facility otherwise remains subject to substantially the same terms as those set forth in the 2019 Credit Agreement. The Company incurred $1.0 million in upfront fees, arranger fees and other third party costs related to the Fifth Amendment to the 2019 Credit Agreement, which were recorded to revolving credit facility debt issuance cost in other assets.
On July 1, 2024, the Company executed an agency succession agreement, by and among Barclays Bank PLC as the resigning administrative agent and collateral agent under the 2019 Credit Agreement and Royal Bank of Canada, as the successor administrative agent and collateral agent.
2020 Swap Transaction
On March 27, 2020, the Company executed the Swap to effectively fix the interest rate at 3.465% on $450 million of its outstanding Term Loan through the Term Loan maturity date of July 2026. Pursuant to the Second Amendment, the Company lowered the spread on the Term Loan by 0.25% resulting in a new fixed rate of 3.215% on the $450 million of Term Loan subject to the Swap.
On September 26, 2022, the Company and the Swap counterparty executed an amendment to the Swap (“the Swap Amendment”) to update LIBOR conventions to SOFR conventions and to modify the fixed rate for the change from three-month LIBOR to three-month Term SOFR effective on October 6, 2022. There was no change to the $450 million notional value, the July 1, 2026 expiration date, the quarterly payment frequency or the designated three-month maturity from the Swap Amendment. The interest rate effectively fixed by the Swap on $450 million of the Company’s outstanding term loan debt through July 1, 2026 changed from 3.215% to 3.149% as a result of the Swap Amendment.
On October 30, 2023, the Company monetized the gain on the Swap and entered into an agreement to terminate the Swap ("Swap Termination Agreement"). The Swap Termination Agreement was effective on October 30, 2023. Under the Swap Termination Agreement, the Swap counterparty agreed to pay the Company $43.4 million in cash, which was comprised of the $45.8 million value of the Swap on the termination date inclusive of $1.4 million of interest receivable less $2.4 million in swap unwind costs.
As a result of the Swap Termination Agreement, the Company recorded a $44.4 million deferred gain in AOCI, before tax, replacing the $44.4 million fair value of the Swap in AOCI, before tax. The deferred gain on the Swap monetization is being amortized on a straight-line basis through July 1, 2026 and is included in interest expense and other financing costs on the Consolidated Statements of Operations. For the years ended December 31, 2024 and 2023, the Company recorded $16.7 million and $2.8 million, respectively, in amortization of deferred gain on Swap monetization. As of December 31, 2024 and 2023, the unamortized deferred gain on Swap monetization was $24.9 million and $41.6 million, respectively, before tax. The Swap unwind costs of $2.4 million were recorded in general and administrative costs on the Consolidated Statement of Operations for the year ended December 31, 2023. Refer to Note 12, Derivatives, for further information on the Swap.
Contingent Consideration
At December 31, 2024 and 2023, the Company had $139.9 million and $217.2 million, respectively, in contingent consideration that is estimated to be payable over the next one to three years resulting from the WestEnd Acquisition. For the years ended December 31, 2024 and 2023, the Company recorded an increases of $2.7 million and $14.5 million, respectively in contingent payment liabilities associated WestEnd Acquisition, which is included in consideration payable for acquisition of business in the Consolidated Balance Sheets. For the years ended December 31, 2024 and 2023, the Company recorded no activity and an increase of $8.7 million, respectively, in contingent payment liabilities associated with the USAA AMCO Acquisition.
Advertising and Marketing Costs
In December 2022, the Company entered into a long-term partnership with Spurs Sports & Entertainment and executed naming rights and partnership agreements for the team’s new performance center. The agreements, which end in 2033, grant the Company exclusive naming rights, sponsorship, signage, advertising and other promotional rights and benefits for the new performance center.
Payments made under the agreements are deferred and expensed on a straight-line basis over the term of the arrangement. The related advertising and marketing expense is recorded in general and administrative expense in the Consolidated Statements of Operations. The balance of amounts paid less amortized expense are included in the Consolidated Balance Sheets in other assets when cumulative payments exceed amortized expense and in other liabilities when amortized expense exceeds cumulative payments.
Capital Requirements
VCS is a registered broker‑dealer subject to the Uniform Net Capital requirements under the Exchange Act, which requires maintenance of certain minimum net capital levels. In addition, we have certain non‑U.S.
subsidiaries that have minimum capital requirements. As a result, such subsidiaries of our Company may be restricted in their ability to transfer cash to their parents. VCS and our non‑U.S. subsidiaries were in compliance with these requirements as of and for the years ended December 31, 2024, 2023 and 2022.
Cash Flows – The following table is derived from our Consolidated Statements of Cash Flows for the years ended December 31, 2024, 2023 and 2022.
| | | | | | | | | | | | | | | |
| | Year Ended December 31, | |
(in thousands) | | 2024 | | | 2023 | | | 2022 | |
Net cash provided by operating activities | | $ | | 339,979 | | | $ | | 330,291 | | | $ | | 335,211 | |
Net cash used in investing activities | | | | (3,979 | ) | | | | (7,841 | ) | | | | (6,317 | ) |
Net cash used in financing activities | | | | (332,763 | ) | | | | (237,132 | ) | | | | (360,186 | ) |
Operating Activities
2024 compared to 2023 – Cash provided by operating activities was $340.0 million in 2024, compared to $330.3 million in 2023. The $9.7 million increase in cash provided by operating activities was due to a $75.7 million increase in net income partially offset by the combination of a $31.2 million decrease in working capital and a $34.8 million decrease in non-cash items.
2023 compared to 2022 – Cash provided by operating activities was $330.3 million in 2023, compared to $335.2 million in 2022. The $4.9 million decrease in cash provided by operating activities was due to a $62.4 million decrease in net income partially offset by the combination of a $19.2 million increase in working capital and a $38.3 million increase in non-cash items.
Investing Activities
2024 compared to 2023 – Cash used in investing activities decreased by $3.9 million to $4.0 million in 2024, from $7.8 million in 2023 primarily due to a $3.9 million decrease in purchases of property and equipment.
2023 compared to 2022 – Cash used in investing activities increased by $1.5 million to $7.8 million in 2023, from $6.3 million in 2022. The increase was primarily due to a $2.3 million increase in net trading activity.
Financing Activities
2024 compared to 2023 – Cash used in financing activities increased $95.6 million to $332.8 million in 2024 from $237.1 million in 2023. The increase was primarily due to payment of consideration for acquisition and repayment of long-term senior debt partially offset by a decrease in repurchases of Common Stock. Cash used in payment of consideration for acquisition, repurchases of our Common Stock, payment of dividends, repayment of long-term senior debt, and payment of taxes related to settlement of equity awards totaled $80.0 million, $103.6 million, $101.1 million, $29.5 million and $26.4 million, respectively, during 2024.
2023 compared to 2022 – Cash used in financing activities decreased $123.1 million to $237.1 million in 2023 from $360.2 million in 2022. The decrease was primarily due to no term loan prepayments in 2023 partially offset by increases in repurchases of Common Stock and payment of dividends. Cash used in repurchases of our Common Stock, payment of dividends and payment of taxes related to settlement of equity awards totaled $139.3 million, $85.4 million, and $18.7 million, respectively, during 2023.
Critical Accounting Policies and Estimates
The preparation of our consolidated financial statements in accordance with GAAP is based on the selection and application of accounting policies that require us to make significant estimates and assumptions that in certain circumstances affect amounts reported in the audited consolidated financial statements. In preparing these financial statements, our estimates and judgements are based on historical experience, information from third-party valuation professionals and various other assumptions, giving due consideration to materiality. We
consider the accounting policy discussed below to be critical to the understanding of our consolidated financial statements. Actual results could differ from our estimates and assumptions, and any such difference could be material to our consolidated financial statements. This significant accounting policy is described more fully in Note 2, Accounting Policies, to the audited consolidated financial statements.
Contingent Consideration Payable for Acquisition of Business – We recognize and measure contingent consideration liabilities at fair value as of the acquisition date using an option pricing model and Monte Carlo simulation. These valuations require significant estimates and judgments related to the net revenue 5 year average annual growth rate, market price of risk adjustment for revenue (continuous), revenue volatility and discount rate. The fair value of contingent consideration liabilities is remeasured at each reporting period, generally using the same methodology used to determine the acquisition date fair value. We typically utilize an independent valuation expert to assist with these valuations. Any change in the fair value estimate subsequent to the acquisition date is recorded in the earnings of that period.
Item 7A. Qualitative and Quantitative Disclosures Regarding Market Risk.
Market Risk – Substantially all of our revenues are derived from investment management, fund administration and distribution fees, which are primarily based on the market value of our AUM. Accordingly, our revenues and net income may decline as a result of our AUM decreasing due to depreciation of our investment portfolios. In addition, such depreciation could cause our clients to withdraw their assets in favor of other investment alternatives that they perceive to offer higher returns or lower risk, which could cause our revenues and net income to decline further.
The value of our AUM was approximately $172 billion at December 31, 2024. A 10% increase or decrease in the value of our AUM, if proportionately distributed over all of our strategies, products and client relationships, would cause an annualized increase or decrease in our revenues of approximately $91.2 million at our weighted-average fee rate of 53 basis points for the year ended December 31, 2024. Because of declining fee rates from larger relationships and differences in our fee rates across investment strategies, a change in the composition of our AUM, in particular, an increase in the proportion of our total AUM attributable to strategies, clients or relationships with lower effective fee rates, could have a material negative impact on our overall weighted-average fee rate. The same 10% increase or decrease in the value of our total AUM, if attributed entirely to a proportionate increase or decrease in the AUM of the Victory Funds and USAA Funds, to which we provide a range of services in addition to those provided to institutional separate accounts, would cause an annualized increase or decrease in our revenues of approximately $103.2 million at the Victory Funds’ and USAA Funds’ aggregate weighted-average fee rate of 60 basis points for the year ended December 31, 2024. If the same 10% increase or decrease in the value of our total AUM was attributable entirely to a proportionate increase or decrease in the assets of our institutional separate accounts, it would cause an annualized increase or decrease in our revenues of approximately $72.2 million at the weighted-average fee rate across all of our institutional separate accounts of 42 basis points for the year ended December 31, 2024.
As is customary in the investment management industry, clients invest in particular strategies to gain exposure to certain asset classes, which exposes their investment to the benefits and risks of those asset classes. We believe our clients invest in each of our strategies in order to gain exposure to the portfolio securities of the respective strategies and may implement their own risk management program or procedures. We have not adopted a corporate‑level risk management policy regarding client assets, nor have we attempted to hedge at the corporate level or within individual strategies the market risks that would affect the value of our overall AUM and related revenues. Some of these risks, such as sector and currency risks, are inherent in certain strategies, and clients may invest in particular strategies to gain exposure to particular risks. While negative returns in our strategies and net client cash outflows do not directly reduce the assets on our balance sheet (because the assets we manage are owned by our clients, not us), any reduction in the value of our AUM would result in a reduction in our revenues.
Exchange Rate Risk – A portion of the accounts that we advise hold investments that are denominated in currencies other than the U.S. dollar. To the extent our AUM are denominated in currencies other than the U.S. dollar, the value of that AUM will decrease with an increase in the value of the U.S. dollar or increase with a decrease in the value of the U.S. dollar. Each investment team monitors its own exposure to exchange rate risk and makes decisions on how to manage that risk in the portfolios they manage. We believe many of our clients invest in those strategies in order to gain exposure to non‑U.S. currencies, or may implement their own
hedging programs. As a result, we generally do not hedge an investment portfolio’s exposure to non‑U.S. currency.
We have not adopted a corporate-level risk management policy to manage this exchange rate risk. Assuming 11% of our AUM are invested in securities denominated in currencies other than the U.S. dollar and excluding the impact of any hedging arrangement, a 10% increase or decrease in the value of the U.S. dollar would decrease or increase the fair value of our AUM by approximately $1.9 billion, which would cause an annualized increase or decrease in revenues of approximately $10.0 million at our weighted-average fee rate for the business of 53 basis points for the year ended December 31, 2024.
We operate in several foreign countries and incur operating expenses associated with these operations. In addition, we have revenue and revenue-sharing arrangements that are denominated in non-U.S. currencies. We do not believe foreign currency fluctuations materially affect our results of operations.
Interest Rate Risk – Interest rate risk is the risk that the fair value of future cash flows of a financial instrument will fluctuate because of changes in market interest rates. On March 27, 2020, the Company executed the Swap, a floating-to-fixed interest rate swap transaction, to effectively fix the interest rate at 3.465% on $450 million of its outstanding Term Loan through the Term Loan maturity date of July 2026. On February 18, 2021, pursuant to the Second Amendment, the Company lowered the spread on the Term Loan by 0.25% resulting in a new fixed rate of 3.215% on the $450 million of Term Loan subject to the Swap. On September 26, 2022, the Company and the Swap counterparty executed an amendment to the Swap to update LIBOR conventions to SOFR conventions and to modify the fixed rate for the change from three-month LIBOR to three-month Term SOFR effective on October 6, 2022. On October 30, 2023, the Company decided to monetize the gain on the Swap and entered into an agreement to terminate the Swap, which was effective on October 30, 2023. Refer to Note 12, Derivatives, for further information on the Swap. At December 31, 2024, we were exposed to interest rate risk as a result of the amounts outstanding under the 2019 Credit Agreement, as amended. Refer to Note 11, Debt, for a description of the amounts outstanding as of such date and the applicable interest rate.
Item 8. Financial Information and Supplementary Data.
Victory Capital Holdings, Inc. and Subsidiaries
Consolidated Balance Sheets
(In thousands, except for shares)
| | | | | | | | | | |
| | December 31, 2024 | | | December 31, 2023 | |
Assets | | |
| | | |
| |
Cash and cash equivalents | | $ | | 126,731 | | | $ | | 123,547 | |
Investment management fees receivable | | | | 83,307 | | | | | 71,888 | |
Fund administration and distribution fees receivable | | | | 16,014 | | | | | 14,238 | |
Other receivables | | | | 1,346 | | | | | 1,444 | |
Prepaid expenses | | | | 8,634 | | | | | 5,785 | |
Investments in proprietary funds, at fair value | | | | 605 | | | | | 534 | |
Deferred compensation plan investments, at fair value | | | | 34,608 | | | | | 31,274 | |
Property and equipment, net | | | | 11,874 | | | | | 19,578 | |
Goodwill | | | | 981,805 | | | | | 981,805 | |
Other intangible assets, net | | | | 1,260,614 | | | | | 1,281,832 | |
Other assets | | | | 22,053 | | | | | 10,691 | |
Total assets | | $ | | 2,547,591 | | | $ | | 2,542,616 | |
| | | | | | | | |
Liabilities and stockholders' equity | | |
| | | |
| |
Accounts payable and accrued expenses | | $ | | 57,951 | | | $ | | 56,477 | |
Accrued compensation and benefits | | | | 51,648 | | | | | 55,456 | |
Consideration payable for acquisition of business | | | | 139,894 | | | | | 217,200 | |
Deferred compensation plan liability | | | | 34,608 | | | | | 31,274 | |
Deferred tax liability, net | | | | 157,120 | | | | | 128,714 | |
Other liabilities | | | | 20,871 | | | | | 11,225 | |
Long-term debt, net | | | | 963,862 | | | | | 989,269 | |
Total liabilities | | | | 1,425,954 | | | | | 1,489,615 | |
| | | | | | | | |
Stockholders' equity | | |
| | | |
| |
Common stock, $0.01 par value per share: 2024 - 600,000,000 shares authorized, 83,947,949 shares issued and 63,653,212 shares outstanding; 2023 - 600,000,000 shares authorized, 82,404,305 shares issued and 64,254,714 shares outstanding | | | | 839 | | | | | 824 | |
Additional paid-in capital | | | | 752,371 | | | | | 728,283 | |
Treasury stock, at cost: 2024 - 20,294,737 shares; 2023 - 18,149,591 shares | | | | (574,856 | ) | | | | (444,286 | ) |
Accumulated other comprehensive income | | | | 18,683 | | | | | 31,328 | |
Retained earnings | | | | 924,600 | | | | | 736,852 | |
Total stockholders' equity | | | | 1,121,637 | | | | | 1,053,001 | |
Total liabilities and stockholders' equity | | $ | | 2,547,591 | | | $ | | 2,542,616 | |
The accompanying notes are an integral part of the consolidated financial statements.
Victory Capital Holdings, Inc. and Subsidiaries
Consolidated Statements of Operations
(in thousands, except for shares)
| | | | | | | | | | | | | | |
| | | | | | | | |
| Year Ended December 31, | |
| 2024 | | | 2023 | | | 2022 | |
Revenue | |
| |
| |
| |
| |
| |
Investment management fees | $ | | 704,583 | | | $ | | 640,876 | | | $ | | 664,710 | |
Fund administration and distribution fees | | | 188,894 | | | | | 180,152 | | | | | 190,090 | |
Total revenue | | | 893,477 | | | | | 821,028 | | | | | 854,800 | |
| | | | | | | | | | | |
Expenses | |
| | | |
| | | |
| |
Personnel compensation and benefits | | | 217,214 | | | | | 220,992 | | | | | 238,198 | |
Distribution and other asset-based expenses | | | 146,489 | | | | | 149,596 | | | | | 161,105 | |
General and administrative | | | 56,694 | | | | | 56,287 | | | | | 52,373 | |
Depreciation and amortization | | | 30,176 | | | | | 41,647 | | | | | 43,201 | |
Change in value of consideration payable for acquisition of business | | | 2,694 | | | | | 23,236 | | | | | (40,600 | ) |
Acquisition-related costs | | | 11,285 | | | | | 217 | | | | | 534 | |
Restructuring and integration costs | | | 1,411 | | | | | 595 | | | | | 881 | |
Total operating expenses | | | 465,963 | | | | | 492,570 | | | | | 455,692 | |
Income from operations | | | 427,514 | | | | | 328,458 | | | | | 399,108 | |
| | | | | | | | | | | |
Other income (expense) | |
| | | |
| | | |
| |
Interest income and other income (expense) | | | 10,441 | | | | | 8,732 | | | | | (2,463 | ) |
Interest expense and other financing costs | | | (63,836 | ) | | | | (61,282 | ) | | | | (43,964 | ) |
Loss on debt extinguishment | | | (363 | ) | | | | — | | | | | (2,648 | ) |
Total other income (expense), net | | | (53,758 | ) | | | | (52,550 | ) | | | | (49,075 | ) |
| | | | | | | | | | | |
Income before income taxes | | | 373,756 | | | | | 275,908 | | | | | 350,033 | |
| | | | | | | | | | | |
Income tax expense | | | (84,892 | ) | | | | (62,751 | ) | | | | (74,522 | ) |
| | | | | | | | | | | |
Net income | $ | | 288,864 | | | $ | | 213,157 | | | $ | | 275,511 | |
| | | | | | | | | | | |
Earnings per share of common stock | | | | | | | | | | | |
Basic | $ | | 4.47 | | | $ | | 3.22 | | | $ | | 4.02 | |
Diluted | $ | | 4.38 | | | $ | | 3.12 | | | $ | | 3.81 | |
| | | | | | | | | | | |
Weighted average number of shares outstanding | | | | | | | | | | | |
Basic | | | 64,607 | | | | | 66,202 | | | | | 68,481 | |
Diluted | | | 65,928 | | | | | 68,214 | | | | | 72,266 | |
| | | | | | | | | | | |
Dividends declared per share of common stock | $ | | 1.555 | | | $ | | 1.28 | | | $ | | 1.00 | |
The accompanying notes are an integral part of the consolidated financial statements.
Victory Capital Holdings, Inc. and Subsidiaries
Consolidated Statements of Comprehensive Income (Loss)
(in thousands)
| | | | | | | | | | | | | | |
| | | | | | | | |
| Year Ended December 31, | |
| 2024 | | | 2023 | | | 2022 | |
Net income | $ | | 288,864 | | | $ | | 213,157 | | | $ | | 275,511 | |
| | | | | | | | | | | |
Other comprehensive income (loss), net of tax |
|
| | |
|
| | |
|
| |
Net unrealized income (loss) on cash flow hedges |
| | — | | |
| | (1,970 | ) | |
| | 29,719 | |
Net amortization of deferred gain on terminated cash flow hedges | | | (12,607 | ) | | | | (2,184 | ) | | | | — | |
Net unrealized income (loss) on foreign currency translation |
| | (38 | ) | |
| | 40 | | |
| | (249 | ) |
Total other comprehensive income (loss), net of tax |
| | (12,645 | ) | |
| | (4,114 | ) | |
| | 29,470 | |
| | | | | | | | | | | |
Comprehensive income | $ | | 276,219 | | | $ | | 209,043 | | | $ | | 304,981 | |
The accompanying notes are an integral part of the consolidated financial statements.
Victory Capital Holdings, Inc. and Subsidiaries
Consolidated Statements of Changes in Stockholders' Equity
(in thousands)
| | | | | | | | | | | | | | | | | | | | | | | | | | | | | | |
| | | | | | | | | | | | | Accumulated | | | | | | | | | |
| | | | | | | | | | Additional | | | Other | | | | | | | | |
| | Common Stock | | | Treasury Stock | | | Paid-In
Capital | | | Comprehensive
Income (Loss) | | | Retained Earnings | | | Total | |
Balance, December 31, 2021 | | $ | | 772 | | | $ | | (153,200 | ) | | $ | | 673,572 | | | $ | | 5,972 | | | $ | | 402,811 | | | $ | | 929,927 | |
Issuance of common stock | | | | — | | | | | — | | | | | 266 | | | | | — | | | | | — | | | | | 266 | |
Repurchase of shares | | | | — | | | | | (87,256 | ) | | | | — | | | | | — | | | | | — | | | | | (87,256 | ) |
Shares withheld related to net settlement of equity awards | | | | — | | | | | (44,969 | ) | | | | — | | | | | — | | | | | — | | | | | (44,969 | ) |
Vesting of restricted share grants | | | | 8 | | | | | — | | | | | (8 | ) | | | | — | | | | | — | | | | | — | |
Exercise of options | | | | 25 | | | | | — | | | | | 13,820 | | | | | — | | | | | — | | | | | 13,845 | |
Other comprehensive income | | | | — | | | | | — | | | | | — | | | | | 29,470 | | | | | — | | | | | 29,470 | |
Share-based compensation | | | | — | | | | | — | | | | | 17,816 | | | | | — | | | | | — | | | | | 17,816 | |
Dividends paid | | | | — | | | | | — | | | | | — | | | | | — | | | | | (69,200 | ) | | | | (69,200 | ) |
Net income | | | | — | | | | | — | | | | | — | | | | | — | | | | | 275,511 | | | | | 275,511 | |
Balance, December 31, 2022 | | | | 805 | | | | | (285,425 | ) | | | | 705,466 | | | | | 35,442 | | | | | 609,122 | | | | | 1,065,410 | |
Issuance of common stock | | | | — | | | | | — | | | | | 253 | | | | | — | | | | | — | | | | | 253 | |
Repurchase of shares | | | | — | | | | | (134,506 | ) | | | | — | | | | | — | | | | | — | | | | | (134,506 | ) |
Shares withheld related to net settlement of equity awards | | | | — | | | | | (24,355 | ) | | | | — | | | | | — | | | | | — | | | | | (24,355 | ) |
Vesting of restricted share grants | | | | 8 | | | | | — | | | | | (8 | ) | | | | — | | | | | — | | | | | — | |
Exercise of options | | | | 11 | | | | | — | | | | | 6,024 | | | | | — | | | | | — | | | | | 6,035 | |
Other comprehensive loss | | | | — | | | | | — | | | | | — | | | | | (4,114 | ) | | | | — | | | | | (4,114 | ) |
Share-based compensation | | | | — | | | | | — | | | | | 16,548 | | | | | — | | | | | — | | | | | 16,548 | |
Dividends paid | | | | — | | | | | — | | | | | — | | | | | — | | | | | (85,427 | ) | | | | (85,427 | ) |
Net income | | | | — | | | | | — | | | | | — | | | | | — | | | | | 213,157 | | | | | 213,157 | |
Balance, December 31, 2023 | | | | 824 | | | | | (444,286 | ) | | | | 728,283 | | | | | 31,328 | | | | | 736,852 | | | | | 1,053,001 | |
Issuance of common stock | | | | — | | | | | — | | | | | 291 | | | | | — | | | | | — | | | | | 291 | |
Repurchase of shares | | | | — | | | | | (95,826 | ) | | | | — | | | | | — | | | | | — | | | | | (95,826 | ) |
Shares withheld related to net settlement of equity awards | | | | — | | | | | (34,744 | ) | | | | — | | | | | — | | | | | — | | | | | (34,744 | ) |
Vesting of restricted share grants | | | | 4 | | | | | — | | | | | (4 | ) | | | | — | | | | | — | | | | | — | |
Exercise of options | | | | 11 | | | | | — | | | | | 8,581 | | | | | — | | | | | — | | | | | 8,592 | |
Other comprehensive loss | | | | — | | | | | — | | | | | — | | | | | (12,645 | ) | | | | — | | | | | (12,645 | ) |
Share-based compensation | | | | — | | | | | — | | | | | 15,220 | | | | | — | | | | | — | | | | | 15,220 | |
Dividends paid | | | | — | | | | | — | | | | | — | | | | | — | | | | | (101,116 | ) | | | | (101,116 | ) |
Net income | | | | — | | | | | — | | | | | — | | | | | — | | | | | 288,864 | | | | | 288,864 | |
Balance, December 31, 2024 | | $ | | 839 | | | $ | | (574,856 | ) | | $ | | 752,371 | | | $ | | 18,683 | | | $ | | 924,600 | | | $ | | 1,121,637 | |
The accompanying notes are an integral part of the consolidated financial statements.
Victory Capital Holdings, Inc. and Subsidiaries
Consolidated Statements of Cash Flows
(in thousands)
| | | | | | | | | | | | | | |
| Year Ended December 31, | |
| 2024 | | | 2023 | | | 2022 | |
Cash flows from operating activities | | | | | | | | | | | |
Net income | $ | | 288,864 | | | $ | | 213,157 | | | $ | | 275,511 | |
Adjustments to reconcile net income to net cash provided by operating activities: | | | | | |
| | | |
| |
Provision for deferred income taxes | | | 32,516 | | | | | 21,539 | | | | | 35,654 | |
Depreciation and amortization | | | 30,176 | | | | | 41,647 | | | | | 43,201 | |
Deferred financing costs, accretion expense and derivative gains/losses | | | (12,393 | ) | | | | 1,454 | | | | | 4,477 | |
Share-based and deferred compensation | | | 20,089 | | | | | 21,543 | | | | | 17,718 | |
Change in fair value of contingent consideration obligations | | | 2,694 | | | | | 23,236 | | | | | (40,600 | ) |
Unrealized (appreciation) depreciation on investments | | | (706 | ) | | | | (1,868 | ) | | | | 4,650 | |
Noncash lease expense | | | — | | | | | — | | | | | 212 | |
Loss on equity method investment | | | — | | | | | — | | | | | 825 | |
Loss on debt extinguishment | | | 363 | | | | | — | | | | | 2,648 | |
Loss on disposal of property and equipment due to restructuring | | | — | | | | | — | | | | | 485 | |
Changes in operating assets and liabilities: | | | | | | | | | | | |
Investment management fees receivable | | | (11,419 | ) | | | | (3,541 | ) | | | | 12,287 | |
Fund administration and distribution fees receivable | | | (1,776 | ) | | | | 141 | | | | | 2,744 | |
Other receivables | | | 76 | | | | | (266 | ) | | | | 4,815 | |
Prepaid expenses | | | (2,849 | ) | | | | 316 | | | | | (1,789 | ) |
Other assets | | | (733 | ) | | | | 47,540 | | | | | (3,342 | ) |
Accounts payable and accrued expenses | | | 1,530 | | | | | 5,666 | | | | | (10,229 | ) |
Accrued compensation and benefits | | | (4,390 | ) | | | | (2,880 | ) | | | | 4,428 | |
Deferred compensation plan liability | | | (1,534 | ) | | | | (523 | ) | | | | (3,913 | ) |
Other liabilities | | | (529 | ) | | | | (434 | ) | | | | (871 | ) |
Payment of consideration for acquisition | | | — | | | | | (36,436 | ) | | | | (13,700 | ) |
Net cash provided by operating activities | | | 339,979 | | | | | 330,291 | | | | | 335,211 | |
| | | | | | | | | | | |
Cash flows from investing activities | |
| | | |
| | | |
| |
Purchases of property and equipment | | | (1,278 | ) | | | | (5,169 | ) | | | | (5,245 | ) |
Purchases of deferred compensation plan investments | | | (13,307 | ) | | | | (13,805 | ) | | | | (24,082 | ) |
Sales of deferred compensation plan investments | | | 10,643 | | | | | 11,147 | | | | | 23,714 | |
Purchases of proprietary funds | | | (74 | ) | | | | (46 | ) | | | | (119 | ) |
Sales of proprietary funds | | | 37 | | | | | 32 | | | | | 295 | |
Acquisition of business, net of cash acquired | | | — | | | | | — | | | | | (880 | ) |
Net cash used in investing activities | | | (3,979 | ) | | | | (7,841 | ) | | | | (6,317 | ) |
| | | | | | | | | | | |
Cash flows from financing activities | |
| | | |
| | | |
| |
Issuance of common stock | | | 8,883 | | | | | 6,288 | | | | | 14,111 | |
Repurchase of common stock | | | (103,578 | ) | | | | (139,299 | ) | | | | (101,178 | ) |
Payments of taxes related to net share settlement of equity awards | | | (26,409 | ) | | | | (18,694 | ) | | | | (31,067 | ) |
Payment of debt financing fees | | | (1,024 | ) | | | | — | | | | | — | |
Repayment and repurchases of long-term senior debt | | | (29,519 | ) | | | | — | | | | | (149,052 | ) |
Payment of dividends | | | (101,116 | ) | | | | (85,427 | ) | | | | (69,200 | ) |
Payment of consideration for acquisition | | | (80,000 | ) | | | | — | | | | | (23,800 | ) |
Net cash (used in) provided by financing activities | | | (332,763 | ) | | | | (237,132 | ) | | | | (360,186 | ) |
| | | | | | | | | | | |
Effect of changes of foreign exchange rate on cash and cash equivalents | | | (53 | ) | | | | 58 | | | | | (70 | ) |
| | | | | | | | | | | |
Net increase (decrease) in cash and cash equivalents | | | 3,184 | | | | | 85,376 | | | | | (31,362 | ) |
Cash and cash equivalents, beginning of period | | | 123,547 | | | | | 38,171 | | | | | 69,533 | |
Cash and cash equivalents, end of period | $ | | 126,731 | | | $ | | 123,547 | | | $ | | 38,171 | |
| | | | | | | | | | | |
Supplemental cash flow information | |
| | | |
| | | |
| |
Cash paid for interest | $ | | 78,683 | | | $ | | 70,685 | | | $ | | 31,981 | |
Cash paid for income taxes | | | 52,253 | | | | | 38,690 | | | | | 35,725 | |
Noncash items | | | | | | | | | | | |
Operating lease right-of-use assets obtained in exchange for new operating lease liabilities | $ | | 14,519 | | | $ | | — | | | $ | | — | |
The accompanying notes are an integral part of the consolidated financial statements.
Victory Capital Holdings, Inc. and Subsidiaries
Notes to Consolidated Financial Statements
NOTE 1. Organization and Nature of Business
Victory Capital Holdings, Inc., a Delaware corporation (along with its wholly-owned subsidiaries, collectively referred to as the “Company,” “Victory,” or in the first-person notations of “we,” “us,” and “our”), was formed on February 13, 2013 for the purpose of acquiring Victory Capital Management Inc. (“VCM”) and Victory Capital Services, Inc. (“VCS”), formerly known as Victory Capital Advisers, Inc., which occurred on August 1, 2013. On February 12, 2018, the Company completed the initial public offering (the “IPO”) of its common stock, which trades on the NASDAQ under the symbol “VCTR.”
Victory provides specialized investment strategies to institutions, intermediaries, retirement platforms and individual investors. With 11 autonomous Investment Franchises and a Solutions Platform, the Company offers a wide array of investment products, including actively and passively managed mutual funds, rules-based and active exchange traded funds (“ETFs”), institutional separate accounts, variable insurance products (“VIPs”), alternative investments, private closed end funds, and a 529 Education Savings Plan. The Company’s strategies are also offered through third-party investment products, including mutual funds, third-party ETF model strategies, retail separately managed accounts (“SMAs”) and unified managed accounts (“UMAs”) through wrap account programs, Collective Investment Trusts (“CITs”), and undertakings for the collective investment in transferable securities (“UCITS").
VCM is a registered investment adviser and provides mutual fund administrative services for the Victory Portfolios, the Victory Portfolios II and Victory Portfolios III, and Victory Variable Insurance Funds (collectively, the “Victory Funds”), that are families of open-end mutual funds, VictoryShares (the Company’s ETF brand) and the USAA 529 Education Savings Plan. Additionally, VCM employs all of the Company’s United States (U.S.) investment professionals across its Franchises and Solutions, which are not separate legal entities. VCM’s wholly-owned subsidiaries include RS Investment Management (Singapore) Pte. Ltd., RS Investments (UK) Limited, and NEC Pipeline LLC. VCM’s other wholly-owned subsidiary, RS Investments (HK) Limited, ceased operations in May 2023, and was deregistered and dissolved in May 2024.
VCS is registered with the SEC as an introducing broker-dealer and serves as distributor and underwriter for the Victory Funds, and for municipal fund securities issued by the Nevada College Savings Trust Fund under the USAA 529 Education Savings Plan. VCS offers brokerage services to individual investors through an open architecture brokerage platform launched in April 2023. VCS also serves as the placement agent for certain private funds managed by VCM.
On July 1, 2019, the Company completed the acquisition (the “USAA AMCO Acquisition” or “USAA AMCO”) of USAA Asset Management Company and Victory Capital Transfer Agency, Inc. (“VCTA”), formerly known as the USAA Transfer Agency Company d/b/a USAA Shareholder Account Services. The USAA AMCO Acquisition included USAA’s mutual fund and ETF businesses and its 529 Education Savings Plan. VCTA is registered with the SEC as a transfer agent for the Victory Portfolios III.
On November 1, 2021, the Company completed the acquisition of 100% of the equity interests in New Energy Capital Partners (“NEC”). Founded in 2004 and based in Hanover, New Hampshire, NEC is an alternative asset management firm focused on debt and equity investments in clean energy infrastructure projects and companies through private closed-end funds (the “NEC Funds”).
On December 31, 2021, the Company completed the acquisition (“WestEnd Acquisition”) of 100% of the equity interests in WestEnd Advisors, LLC (“WestEnd”). Founded in 2004, and headquartered in Charlotte, North Carolina, WestEnd is an ETF strategist advisor that provides financial advisors with a turnkey, core model allocation strategy for either a holistic solution or complementary source of alpha.
On July 8, 2024, the Company entered into definitive agreements with Amundi Asset Management S.A.S ("Amundi') and certain other parties therein whereby Amundi’s U.S. business (“Amundi US” formerly Pioneer Investments) will be combined into the Company. Under the terms of the Contribution Agreement, Amundi US becomes a wholly owned subsidiary of Victory in exchange for a 26.1% economic stake in the Company composed of newly issued shares of Victory's common stock (the "Common Stock") representing 4.9% of the number of issued and outstanding shares of Common Stock, after giving effect to that issuance, and the balance in newly issued shares of the Preferred Stock (the "Preferred Stock"). The parties have also entered into reciprocal 15-year distribution agreements, which will be effective upon closing of the transaction. The closing
of the contemplated transaction, expected by the end of the first quarter of 2025, is subject to customary closing conditions and regulatory approvals. On October 11, 2024, the Company held a special meeting of its shareholders and the Company’s shareholders voted to approve the issuance of the Common Stock, the Preferred Stock and the other proposals set forth in the definitive proxy statement (the “Proxy Statement”), filed on September 6, 2024, with the Securities and Exchange Commission (the “SEC”) in each case in connection with the Contribution.
NOTE 2. Accounting Policies
Basis of Presentation
The Company prepares its consolidated financial statements on the accrual basis of accounting in accordance with accounting principles generally accepted in the United States of America (“GAAP”).
Principles of Consolidation
The consolidated financial statements include the operations of the Company and its wholly‑owned subsidiaries, after elimination of all significant intercompany transactions and balances. Certain prior year amounts have been reclassified to conform to the current year presentation.
The Company evaluates entities in which it invests and investment funds that it sponsors to determine whether the Company has a controlling financial interest in these entities and is required to consolidate them. A controlling financial interest generally exists if (i) the Company holds greater than 50% voting interest in entities controlled through voting interests or if (ii) the Company has the ability to direct significant activities of a fund not controlled through voting interests (a variable interest entity or VIE) and the obligation to absorb losses of and/or the right to receive benefits from the VIE that could potentially be significant to the VIE.
The Company’s involvement with non‑consolidated sponsored investment funds that are considered VIEs include providing investment advisory, fund administration, fund compliance, fund transfer agent, fund distribution services and other management services and/or holding a minority interest. As of December 31, 2024 and 2023, the Company's investments in and maximum risk of loss related to unconsolidated sponsored VIE investment funds totaled $35.1 million and $31.7 million, respectively which are included in investments in proprietary funds and deferred compensation plan investments in the Consolidated Balance Sheets. The Company has not provided financial support to these entities outside the ordinary course of business, which includes assuming operating expenses of funds for competitive or contractual reasons through fee waivers and fund expense reimbursements. The Company does not consolidate the sponsored investment funds in which it has an equity investment as it holds a minority interest, does not direct significant activities of these funds and does not have the right to receive benefits nor the obligation to absorb losses that could potentially be significant to these funds.
Upon the completion of the NEC Acquisition on November 1, 2021, VCM became the manager of certain general partner entities associated with the acquired NEC Funds. The Company has no equity investment in these general partner entities, which are non-consolidated VIEs, and has no share of these general partner entities’ income or losses.
The Company owned a 15% equity interest in Alderwood Partners LLP (“Alderwood”) from September 20, 2020 to July 31, 2022, when the Company retired as a member of Alderwood. The Company analyzed its investment in Alderwood under the voting interest model and determined that it did not have a controlling financial interest. The Company accounted for its Alderwood investment using the equity method of accounting. Refer to Note 13, Equity Method Investment, for additional information on Alderwood.
The Company applies the equity method of accounting to investments where it does not hold a controlling equity interest, but has the ability to exercise significant influence over operating and financial matters. In the event that management identifies an other than temporary decline in the estimated fair value of an equity method investment to an amount below its carrying value, the investment is written down to its estimated fair value.
Use of Estimates and Assumptions
The preparation of consolidated financial statements in conformity with GAAP requires management to make estimates and assumptions that affect the reported amounts and disclosures in the financial statements. Actual results may ultimately differ from those estimates and the differences may be material.
Revenue Recognition
The Company accounts for revenue in accordance with Accounting Standards Codification (“ASC”) 606, Revenue from Contracts with Customers. The Company’s revenue includes fees earned from providing investment management services, fund administration services, fund compliance, fund transfer agent services and fund distribution services.
Revenue is recognized for each distinct performance obligation identified in customer contracts when the performance obligation has been satisfied by transferring services to a customer either over time or at the point in time when the customer obtains control of the service. Revenue is recognized in the amount of variable or fixed consideration allocated to the satisfied performance obligation that Victory expects to be entitled to in exchange for transferring services to a customer. Variable consideration is included in the transaction price only when it is probable that a significant reversal of such revenue will not occur when the uncertainty associated with the variable consideration is subsequently resolved.
For further information on the Company’s various revenue streams, refer to Note 3, Revenue.
Distribution and Other Asset‑Based Expenses
Distribution and other asset‑based expenses include (i) broker dealer distribution fees, (ii) platform distribution fees, (iii) sub‑administration, third party sub-transfer agent and sub‑advisory expenses. These expenses are accrued on a monthly basis and are generally calculated as a percentage of AUM and vary as levels of AUM change from inflows, outflows and market movement and with the number of days in the month.
Also included in distribution and other asset‑based expenses are middle office expenses. Middle office expenses are accrued on a monthly basis and vary with changes in mutual fund, institutional and wrap separate account AUM levels, the number of accounts and volume of account transaction activity.
Restructuring and Integration Costs
In connection with business combinations, asset purchases and changes in business strategy, the Company incurs costs integrating investment platforms, products and personnel into existing systems, processes and service provider arrangements and restructuring the business to capture operating expense synergies.
These costs include severance‑related expenses related to one‑time benefit arrangements and contract termination costs. A liability for restructuring costs is recognized only after management has developed a formal plan to which it has committed. The costs included in the restructuring liability are those costs that are either incremental or incurred as a direct result of the plan or are the result of a continuing contractual obligation with no continuing economic benefit to the Company and include penalties incurred to cancel the contractual obligation. Severance expense is recorded when management has committed to a plan for a reduction in workforce, the plan has been communicated to employees and it is unlikely that there will be significant changes to the plan.
Contract termination liabilities are recorded for contract termination costs when the Company terminates a contract or stops using the product or service covered by the contract. Contract termination liabilities are recognized and measured at fair value. Contract termination costs are recorded in restructuring and integration costs in the Consolidated Statements of Operations.
Cash and Cash Equivalents
Cash and cash equivalents consist of cash at banks, money market accounts and funds and short‑term liquid investments with original maturities of three months or less at the time of purchase. For the Company and certain subsidiaries, cash deposits at a financial institution may exceed Federal Deposit Insurance Corporation insurance limits.
Investments
Investments in Proprietary Funds
Investments in proprietary funds include investments in affiliated mutual funds and are recorded in investments in proprietary funds, at fair value in the Consolidated Balance Sheets. Changes in fair value are recognized in
other income (expense) in the Consolidated Statements of Operations. The cost of securities sold is determined using the specific identification method. Dividend income is accrued on the declaration date and is included in other income in the Consolidated Statements of Operations. Transactions are recorded on a trade‑date basis.
The Company periodically reviews each individual security that is in an unrealized loss position to determine if the impairment is other‑than‑temporary. Factors that are considered in determining whether other‑than‑temporary declines in value have occurred include the severity and duration of the unrealized loss and the Company’s ability and intent to hold the security for a length of time sufficient to allow for recovery of such unrealized losses. Impairment charges are recorded in other income (expense) in the Consolidated Statements of Operations. No impairments were recognized as a result of such review in the years ended December 31, 2024, 2023 and 2022.
Deferred Compensation Plan Investments
Deferred compensation plan investments include investments in affiliated and third party mutual funds held in a rabbi trust under a deferred compensation plan. Deferred compensation plan investments are recorded at fair value in the Consolidated Balance Sheets. Changes in value in deferred compensation plan investments are recognized by the Company in other income (expense) in the Consolidated Statements of Operations.
The Company's investments in proprietary funds and deferred compensation plan investments are valued using quoted market prices available in an active market, which is the net asset value of the funds.
Derivative Financial Instruments
The Company does not purchase or hold any derivative instruments for trading or speculative purposes.
On March 27, 2020, the Company entered into an interest rate swap transaction (the “Swap”) to manage interest rate risk associated with a portion of its floating-rate long-term debt.
On October 30, 2023, the Company monetized the gain on the Swap and entered into an agreement to terminate the Swap effective as of that date.
The designation of a derivative instrument as a hedge and its ability to meet the hedge accounting criteria determine how the Company reflects the change in fair value of the derivative instrument. A derivative qualifies for hedge accounting treatment if, at inception, it meets defined correlation and effectiveness criteria. These criteria require that the anticipated cash flows and/or changes in fair value of the hedging instrument substantially offset those of the position being hedged. The Swap was assessed for effectiveness and continued qualification for hedge accounting on a quarterly basis. Since inception through termination, the Swap was deemed to be highly effective.
The Swap was designated as a cash flow hedge. Accordingly, through the termination date, the Swap was measured at fair value with mark-to-market gains or losses deferred and included in accumulated other comprehensive income (loss) (“AOCI”), net of tax, to the extent the hedge was determined to be effective. Upon termination of the Swap, the mark-to-market gain of $44.4 million, before tax, was replaced in AOCI by a realized gain of an equal amount. Gains and losses from the Swap are reclassified from AOCI in the same period during the which the hedged transaction affects earnings. Refer to Note 12, Derivatives, for further information.
Property and Equipment
Property and equipment is recorded at cost less accumulated depreciation. Depreciation and amortization is computed using the straight‑line method over the estimated useful lives of the related assets, generally three to ten years. Improvements to leased property are amortized on a straight‑line basis over the lesser of the useful life of the improvements or the term of the applicable lease. When assets are sold or retired, the related cost and accumulated depreciation are removed from the respective accounts and any resulting gain or loss is included in other income (expense) in the Consolidated Statements of Operations. Gains and losses resulting from the sale or disposal of assets as part of a restructuring plan are included in restructuring and integration costs in the Consolidated Statements of Operations. The cost of repairs and maintenance are expensed as incurred. Equipment and leasehold improvements are tested for impairment whenever changes in facts or circumstances indicate that the carrying amount of an asset may not be recoverable.
Leases
The Company’s leases consist primarily of real estate leases for office space. The Company determines if an arrangement is a lease at contract inception. A lease liability and a corresponding right-of-use ("ROU") asset are recognized on the commencement date for leases with terms longer than one year. Lease liabilities represent an obligation to make lease payments arising from a lease while ROU assets represent a right to use an underlying asset during the lease term. The lease liability is measured at the present value of the future lease payments over the lease term generally using the Company's incremental borrowing rate, which is determined through market sources. Lease components and non-lease components such as fixed maintenance and other costs are combined into one lease component and capitalized in lease liabilities. Variable lease payments, such as utilities and common area maintenance charges, are excluded from lease liabilities and expensed as incurred. The variable lease payments are determined based on terms in the lease contracts and primarily relate to usage of the ROU asset and services received from the lessor. A ROU asset is measured initially as the value of the lease liability plus initial direct costs and prepaid lease payments and less lease incentives received. The lease term includes periods covered by options to extend the lease when it is reasonably certain that we will exercise that option. Lease expense is recognized on a straight-line basis over the lease term and is recorded in general and administrative expenses on the Consolidated Statements of Operations.
Capitalized Service Contract Implementation Costs
The Company follows the internal-use software guidance in ASC 350-40 to determine for hosting arrangements that are service contracts which implementation costs to capitalize as assets. Costs incurred in the software application development stage such as customization, integration with Company software, coding and configuration are capitalized. Costs incurred in the preliminary project and post-implementation stages are expensed as incurred.
Capitalized service contract implementation costs are expensed over the fixed, noncancelable term of the contract plus any reasonably certain renewal periods. The estimated term of the hosting arrangement is reassessed periodically, and any change is accounted for as a change in accounting estimate, with the remaining deferred costs recognized over the rest of the revised period. Amortization begins when the related component of the arrangement is ready for its intended use, and costs are evaluated for impairment on an annual basis.
Segment Reporting
The Company operates in one business segment that provides investment management services and products to institutional, intermediary, retirement platforms and individual investors. Our determination that we had one operating segment is based on the fact that the Chief Operating Decision Maker ("CODM") reviews the Company's financial performance on an aggregate level. Refer to Note 21, Segment Reporting, for further information.
Goodwill
Goodwill represents the excess cost of the acquisition over the fair value of net assets acquired in a business combination. For goodwill impairment testing purposes, the Company has determined that there is only one reporting unit.
The Company tests goodwill for impairment on an annual basis, or more frequently if facts and circumstances indicate that goodwill may be impaired. Factors that could trigger an impairment review include underperformance relative to historical or projected future operating results, significant changes in the Company's use of the acquired assets in a business combination or strategy for the Company's overall business, significant negative industry or economic trends and significant decreases in the Company’s market capitalization. The Company conducts the annual impairment assessment as of October 1st and uses a qualitative approach to test for potential impairment of goodwill. If, after considering various factors, management determines that it is more likely than not that goodwill is impaired, the fair value of the reporting unit is compared to its carrying amount. A goodwill impairment charge is recognized for the amount by which the reporting unit’s carrying amount exceeds its fair value. The assumptions used to estimate fair value include management's estimates of future growth rates, operating cash flows, discount rates and terminal value. These assumptions and estimates can change in future periods based on market movement and factors impacting the expected business performance. Changes in assumptions or estimates could materially affect the determination of our fair value.
Intangible Assets
Intangible assets acquired in a business combination are initially recognized and measured at fair value. Intangible assets acquired by the Company outside of a business combination are initially recognized and measured based on the Company's cost to acquire the intangible assets. If a group of assets is acquired, the cost is allocated to individual assets based on their relative fair value. In valuing these assets, we make assumptions regarding useful lives and projected growth rates, and significant judgment is required.
Definite‑lived intangible assets represent the value of acquired customer relationships in or with institutional separate accounts, collective funds, intermediary wrap separate account (wrap SMA), unified managed account/model (UMA) intermediaries and private funds. Definite‑lived intangible assets also include intellectual property, advisory contracts that do not have a sufficient history of annual renewal, definite-lived trade name assets, lease-related assets and non‑competition agreements.
The Company amortizes definite‑lived identifiable intangible assets on a straight‑line basis over a period that is shorter than the asset's economic life as the pattern of economic benefit cannot be reliably determined. Management periodically evaluates the remaining useful lives and carrying values of the intangible assets to determine whether events and circumstances indicate that a change in the useful life or impairment in value may have occurred. Indicators of impairment monitored by management include a decline in the level of managed assets, changes to contractual provisions underlying certain intangible assets and reductions in underlying operating cash flows. Should there be an indication of a change in the useful life or impairment in value of the definite‑lived intangible assets, we compare the carrying value of the asset to the projected undiscounted cash flows expected to be generated from the underlying asset over its remaining useful life to determine whether impairment has occurred. If the carrying value of the asset exceeds the undiscounted cash flows, the asset is written down to its fair value determined using discounted cash flows. The Company writes off the cost and accumulated amortization balances for all fully amortized intangible assets.
Indefinite‑lived intangible assets include trade names and contracts for fund advisory, distribution and transfer agent services where the Company expects to, and has the ability to, continue to manage these funds indefinitely, the contracts have annual renewal provisions, and there is a high likelihood of continued renewal based on historical experience. Trade names are considered indefinite‑lived intangible assets when they are expected to generate cash flows indefinitely.
Indefinite‑lived intangible assets are reviewed for impairment annually as of October 1st using a qualitative approach which requires that positive and negative evidence collected as a result of considering various factors be weighed in order to determine whether it is more likely than not that an indefinite‑lived intangible asset is impaired. In addition, periodically management reconsiders whether events or circumstances continue to support an indefinite useful life. Indicators monitored by management that may indicate an indefinite useful life is no longer supported include a significant decline in the level of managed assets, changes to legal, regulatory or contractual provisions of the renewable investment advisory contracts and reductions in underlying operating cash flows.
Indefinite-lived intangible assets are combined into a single unit of accounting for purposes of testing impairment if they operate as a single asset and represent as a group the highest and best use of the assets. If the qualitative approach indicates that it is more likely than not that an indefinite-lived intangible asset is impaired, the Company estimates the fair value of the indefinite‑lived intangible asset and compares it to the book value of the asset to determine whether an impairment charge is necessary. Impairment is indicated when the carrying value of the intangible asset exceeds its fair value.
Investment Management Fees Receivable and Fund Administration and Distribution Fees Receivable
Investment management fees receivable include investment management fees due from the Victory Funds, the VictoryShares and other pooled funds sponsored by Victory and investment management fees due from non-affiliated parties. Fund administration and distribution fees receivable include administration, compliance and distribution fees due from the Victory Funds and the VictoryShares and transfer agent fees due from the Victory Portfolios III and sub-transfer agent fees due from the Victory Funds.
Provision for credit losses on these receivables is made in amounts required to maintain an adequate allowance to cover anticipated losses. All investment management fees receivable and fund administration and distribution fees receivable were determined to be collectible as of December 31, 2024, 2023 and 2022, and accordingly, no reserve for credit losses and no provision for credit losses were recognized as of and for the years ended December 31, 2024, 2023 and 2022.
Other Receivables
Other receivables primarily include income and other taxes receivable and were determined to be collectible as of December 31, 2024 and 2023.
Advertising and Marketing Costs
In December 2022, the Company entered into a long-term partnership with Spurs Sports & Entertainment and executed naming rights and partnership agreements for the team’s new performance center. The agreements, which end in 2033, grant the Company exclusive naming rights, sponsorship, signage, advertising and other promotional rights and benefits for the new performance center.
Payments made under the agreements are deferred and expensed on a straight-line basis over the term of the arrangement. The related advertising and marketing expense is recorded in general and administrative expense in the Consolidated Statements of Operations. The balance of amounts paid less amortized expense are included in the Consolidated Balance Sheets in other assets when cumulative payments exceed amortized expense and in other liabilities when amortized expense exceeds cumulative payments.
Share‑Based Compensation Arrangements
Compensation expense related to share‑based payments is measured at the grant date based on the fair value of the award. The fair value of each option granted is estimated using the Black‑Scholes option valuation model. The fair value of restricted share awards with service based vesting conditions and performance based vesting conditions is based on the market price of our stock on the date of grant. The fair value of restricted share awards subject to market conditions is estimated based on a probability-weighted expected value analysis. Compensation expense is recognized on a straight‑line basis over the total vesting period of the award for the service portion of restricted share awards and stock option awards. Compensation expense is recognized on an accelerated basis over the derived service period for awards that vest based on market conditions and on an accelerated basis over the requisite service period for awards with performance conditions if it is probable that the performance conditions will be satisfied. Compensation expense is adjusted for actual forfeitures in the period the forfeiture occurs. The corresponding credit for restricted share and stock option compensation expense is recorded to additional paid in capital.
When changes are made to the terms of an equity award that result in a change in the fair value of the equity award immediately before and after the change, the Company applies modification accounting, treating the change as an exchange of the original award for a new award. The calculation of the incremental value associated with the modified award is based on the excess of the fair value of the modified award over the fair value of the original award measured immediately before its terms are modified.
Earnings Per Share
The calculation of basic earnings per share is based on the weighted average number of shares of the Company’s Common Stock outstanding during the period. Diluted earnings per share is similar to basic earnings per share, but adjusts for the dilutive effect of the potential issuance of incremental shares of the Company’s Common Stock. The Company had vested and unvested stock options and unvested restricted stock grants outstanding during the periods presented and applies the treasury stock method to these securities in its calculation of diluted earnings per share. The treasury stock method assumes that the proceeds of exercise are used to purchase common stock at the average market price for the period. The Company does not have any participating securities that would require the use of the two‑class method of computing earnings per share.
Deferred Financing Fees
The costs of obtaining term loan financing are capitalized in long‑term debt in the Consolidated Balance Sheets and amortized to interest expense and other financing costs in the Consolidated Statements of Operations over the term of the respective financing using the effective interest method. The costs of obtaining revolving line of credit financing are capitalized in other assets in the Consolidated Balance Sheets and amortized to interest expense and other financing costs in the Consolidated Statements of Operations on a straight‑line basis over the term of the facility.
The Company expenses the portion of unamortized debt financing costs associated with paydowns of principal in excess of required loan amortization payments. Management considers this debt to be partially settled.
Deferred financing costs expensed due to partial settlements of debt are recorded in loss on debt extinguishment in the Consolidated Statements of Operations.
Debt Modification
Gains and losses on debt modifications that are considered extinguishments are recognized in current earnings. Debt modifications that are not considered extinguishments are accounted for prospectively through yield adjustments, based on the revised terms. Legal fees and other costs incurred with third parties that are directly related to debt modifications are expensed as incurred and generally are included in general and administrative expense in the Consolidated Statements of Operations. The analysis as to whether a modification of debt is an extinguishment or modification is performed on a creditor‑by‑creditor basis. Refer to Note 11, Debt, for further information on debt refinancings and modifications.
Acquisitions of treasury stock are recorded at cost. Treasury stock held is reported as a deduction from stockholders' equity in the Consolidated Balance Sheets. At the date of subsequent reissue, the treasury stock account is reduced by the cost of such stock on a specific‑identification basis. Additional paid‑in capital from treasury stock transactions is increased as the Company reissues treasury stock for more than the cost of the shares. If the Company issues treasury stock for less than its cost, additional paid‑in capital from treasury stock transactions is reduced to no less than zero. Once this account is at zero, any further required reductions are recorded to retained earnings in the Consolidated Balance Sheets.
Foreign Currency Transactions
The financial statements of the Company’s subsidiaries which operate outside of the U.S. are measured using the local currency as the functional currency. Adjustments to translate those statements into U.S. dollars are recorded in other comprehensive income (loss), which were immaterial in amount as of December 31, 2024, 2023 and 2022.
Transactions denominated in currencies other than the functional currency are recorded using the exchange rate on the date of the transaction. Exchange differences arising on the settlement of financial assets and liabilities are recorded in other income (expense) in the Consolidated Statements of Operations. Foreign exchange gains and losses for the years ended December 31, 2024, 2023 and 2022 were immaterial.
Income Taxes
Income taxes are accounted for using the assets and liability method as required by ASC 740, Income Taxes. Deferred tax assets and liabilities are recognized for the future tax consequences attributable to differences between the financial statement carrying amounts of existing assets and liabilities and their respective tax bases. Deferred tax assets and liabilities are measured using enacted tax rates expected to apply to taxable income in the years in which those temporary differences are expected to be recovered or settled. Deferred tax liabilities are generally attributable to indefinite‑lived intangible assets, goodwill, depreciation, debt issuance costs and mark-to-market gains on the Swap. Deferred tax assets are generally attributable to definite‑lived intangible assets, share-based compensation expense, deferred compensation and acquisition-related costs. The effect on deferred tax assets and liabilities of a change in tax rates is recognized in income in the period that includes the enactment date.
The Company assesses whether a valuation allowance should be established against its deferred income tax assets based on consideration of all available evidence, both positive and negative, using a more-likely-than-not standard. The assessment considers, among other matters, recent operating results, forecasts of future profitability, the duration of statutory carry back and carry forward periods and the Company's experience with tax attributes expiring unused. Changes in circumstances could cause the Company to revalue its deferred tax balances with the resulting change impacting the Consolidated Statements of Operations in the period of the change.
The Company records income tax liabilities pursuant to ASC 740, Income Taxes, which prescribes the recognition and measurement of a tax position taken or expected to be taken in a tax return. It also provides guidance on de‑recognition, classification of interest and penalties, accounting in interim periods, disclosure and transition. For tax positions meeting a more‑likely‑than‑not threshold, the amount recognized in the financial statements is the largest amount of benefit greater than 50% likely of being sustained. The more‑likely‑than‑not threshold must continue to be met in each reporting period to support continued recognition of the benefit. The
Company's accounting policy with respect to interest and penalties related to tax uncertainties is to classify these amounts as income taxes.
Loss Contingencies
The Company continuously reviews investor, client, employee or vendor complaints and pending or threatened litigation. The Company evaluates the likelihood that a loss contingency exists under the criteria of applicable accounting standards through consultation with legal counsel and records a loss contingency, inclusive of legal costs, if the contingency is probable and reasonably estimable at the date of the financial statements.
Business Combinations
The Company accounts for business combinations under the acquisition method of accounting and allocates the purchase price to the assets acquired and liabilities assumed based on their estimated fair values on the date of acquisition. The fair values are determined in accordance with the guidance in ASC 820, Fair Value Measurement, based on valuations performed by the Company and independent valuation specialists.
Asset Acquisitions
When a group of assets is acquired that does constitute a business, the Company accounts for the transaction as an asset acquisition. The cost of the acquisition, which includes transaction costs directly related to the transaction and consideration paid, is allocated on a relative fair value basis to the net assets acquired.
Contingent and Deferred Payment Arrangements
The Company periodically enters into contingent and/or deferred payment arrangements in connection with its business combinations. Liabilities under contingent and deferred payment arrangements are recorded in consideration payable for acquisition of business in the Consolidated Balance Sheets. In contingent payment arrangements, the Company agrees to pay additional consideration to the sellers based on future performance, such as future net revenue levels. The Company estimates the fair value of these potential future obligations at the time a business combination is consummated and records a liability in the Consolidated Balance Sheets at estimated fair value. In deferred payment arrangements, the Company records a liability in the Consolidated Balance Sheets at the time a business combination is consummated for the present value, which is the estimated fair value, of the future fixed dollar contractual payments.
Contingent payment obligations are remeasured at fair value each reporting date taking into consideration changes in expected payments, and the change in fair value is recorded in the current period as a gain or loss. Gains and losses resulting from changes in the fair value of contingent payment obligations are reflected in change in value of consideration payable for acquisition of business in the Consolidated Statements of Operations.
The Company accretes obligations under deferred payment arrangements to their expected payment amounts over the period covered by the arrangement.
Compensatory Payment Arrangements
In connection with business combinations, the Company evaluates whether any portion of the transaction consideration is in exchange for elements other than the acquired business and should be accounted for as a separate transaction apart from the business combination. If based on the substance of the contingent payment arrangement, the Company determines that the payments are compensation for post-acquisition employee services, the Company considers this a compensatory payment arrangement and no liability is recorded for the payments on the acquisition date. The related expense, which is the total amount of compensation management estimates will be paid, is accrued on a straight-line basis over the estimated service period, which is the time period when management determines that it is probable that the performance conditions will be achieved. At each reporting date, cumulative expense recognized under the compensatory payment arrangement will be at least equal to the cumulative dollar amount actually paid out and currently payable under the terms of the related purchase agreement. If there is a significant change in the estimated service period and/or estimated total compensation amount, management generally adjusts the amount of expense recorded on a prospective basis. Amounts recognized under compensatory payment arrangements is recorded in personnel compensation and benefits in the Consolidated Statements of Operations and the related liability is included in accrued compensation and benefits in the Consolidated Balance Sheets.
New Accounting Pronouncements
Accounting Standards Adopted in 2024
•Segment Reporting: In November 2023, the FASB issued Accounting Standards Update ("ASU") 2023-07, "Segment Reporting: Improvements to Reportable Segment Disclosures" ("ASU 2023-07"). ASU 2023-07 expands annual and interim disclosure requirements for reportable segments, primarily through enhanced disclosures about significant segment expenses. ASU 2023-07 is effective for fiscal years beginning after December 15, 2023, and for interim periods beginning after December 15, 2024. The Company adopted ASU 2023-07, and the adoption did not have a significant impact on the Company's consolidated financial statement disclosures. Refer to Note 21, Segment Reporting, for additional disclosures on the Company's segment reporting.
Recently Issued Accounting Standards
•Reporting Comprehensive Income: In November 2024, the FASB issued ASU 2024-03, “Reporting Comprehensive Income” (“ASU 2024-03”). This ASU does not change or remove current expense presentation requirements within the Consolidated Statements of Operations. However, the amendments require disclosure, on an annual and interim basis, of disaggregated information about certain income statement expense line items within the notes to the consolidated financial statements. ASU 2024-03 is effective for annual reporting periods beginning after December 15, 2026, and interim reporting periods beginning after December 15, 2027. Early adoption is permitted. We are currently evaluating the impact that ASU 2024-03 will have on the Company's consolidated financial statement disclosures.
•Income Taxes: In December 2023, the FASB issued ASU 2023-09, "Income Taxes: Improvements to Income Tax Disclosures" ("ASU 2023-09"). ASU 2023-09 revises income tax disclosures primarily related to the rate reconciliation and income taxes paid information as well as the effectiveness of certain other income tax disclosures. The new standard is effective for annual periods beginning after December 15, 2024. Early adoption is permitted. The standard should be applied on a prospective basis, but retrospective application is permitted. We are currently evaluating the impact that ASU 2023-09 will have on the Company's consolidated financial statement disclosures.
NOTE 3. Revenue
In accordance with revenue recognition standard requirements, the following table disaggregates our revenue by type and product:
| | | | | | | | | | | | | | | |
| | Year Ended December 31, | |
(in thousands) | | 2024 | | | 2023 | | | 2022 | |
Investment management fees | | | | | | | | | | | | |
Mutual funds (Victory Funds) | | $ | | 472,979 | | | $ | | 440,021 | | | $ | | 465,031 | |
ETFs (VictoryShares) | | | | 24,405 | | | | | 20,800 | | | | | 20,603 | |
Separate accounts and other vehicles | | | | 195,975 | | | | | 173,433 | | | | | 180,476 | |
Performance-based fees | | | | | | | | | | | | |
Mutual funds (Victory Funds III) | | | | 7,848 | | | | | 5,460 | | | | | (812 | ) |
Separate accounts and other vehicles | | | | 3,376 | | | | | 1,162 | | | | | (588 | ) |
Total investment management fees | | | | 704,583 | | | | | 640,876 | | | | | 664,710 | |
| | | | | | | | | | | | |
Fund administration and distribution fees | | | | | | | | | | | | |
Administration fees | | | | | | | | | | | | |
Mutual funds (Victory Funds) | | | | 108,904 | | | | | 100,174 | | | | | 104,764 | |
ETFs (VictoryShares) | | | | 3,368 | | | | | 2,881 | | | | | 2,800 | |
Distribution fees | | | | | | | | | | | | |
Mutual funds (Victory Funds) | | | | 22,522 | | | | | 22,350 | | | | | 24,971 | |
Transfer agent fees | | | | | | | | | | | | |
Mutual funds (Victory Funds III) | | | | 54,100 | | | | | 54,747 | | | | | 57,555 | |
Total fund administration and distribution fees | | | | 188,894 | | | | | 180,152 | | | | | 190,090 | |
| | | | | | | | | | | | |
Total revenue | | $ | | 893,477 | | | $ | | 821,028 | | | $ | | 854,800 | |
The following table presents balances of receivables:
| | | | | | | | | | |
(in thousands) | | December 31, 2024 | | | December 31, 2023 | |
Customer receivables | | | | | | | | |
Mutual funds (Victory Funds) | | $ | | 59,247 | | | $ | | 55,858 | |
ETFs (VictoryShares) | | | | 3,029 | | | | | 2,079 | |
Separate accounts and other vehicles | | | | 37,045 | | | | | 28,189 | |
Receivables from contracts with customers | | | | 99,321 | | | | | 86,126 | |
Non-customer receivables | | | | 1,346 | | | | | 1,444 | |
Total receivables | | $ | | 100,667 | | | $ | | 87,570 | |
| | | | | | | | |
Investment management fees receivable | | $ | | 83,307 | | | $ | | 71,888 | |
Fund administration and distribution fees receivable | | | | 16,014 | | | | | 14,238 | |
Other receivables | | | | 1,346 | | | | | 1,444 | |
Total receivables | | $ | | 100,667 | | | $ | | 87,570 | |
Revenue
The Company’s revenue includes fees earned from providing;
•investment management services,
•fund administration services,
•fund transfer agent services, and
•fund distribution services.
Revenue is recognized for each distinct performance obligation identified in customer contracts when the performance obligation has been satisfied by transferring services to a customer either over time or at the point in time when the customer obtains control of the service. Revenue is recognized in the amount of variable or fixed consideration allocated to the satisfied performance obligation that Victory expects to be entitled to in exchange for transferring services to a customer. Variable consideration is included in the transaction price only when it is probable that a significant reversal of such revenue will not occur when the uncertainty associated with the variable consideration is subsequently resolved.
Investment management, fund administration and fund distribution fees are generally considered variable consideration as they are typically calculated as a percentage of AUM. Fund transfer agent fees are also considered variable consideration as they are calculated as a percentage of AUM or based on the number of accounts in the fund. In such cases, the amount of fees earned is subject to factors outside of the Company’s control including customer or underlying investor contributions and redemptions and financial market volatility. These fees are considered constrained and are excluded from the transaction price until the asset values or number of accounts on which the customer is billed are calculated and the value of consideration is measurable.
The Company has contractual arrangements with third parties to provide certain advisory, administration, transfer agent and distribution services. Management considers whether we are acting as the principal service provider or as an agent to determine whether revenue should be recorded based on the gross amount payable by the customer or net of payments to third-party service providers, respectively. Victory is considered a principal service provider if we control the service that is transferred to the customer. We are considered an agent when we arrange for the service to be provided by another party and do not control the service.
Investment Management Fees
Investment management fees are received in exchange for investment management services that represent a series of distinct incremental days of investment management service. Control of investment management services is transferred to the customers over time as these customers receive and consume the benefits provided by these services. Investment management fees are calculated as a contractual percentage of AUM and are generally paid in arrears on a monthly or quarterly basis.
AUM represents the financial assets the Company manages for clients on either a discretionary or non-discretionary basis. In general, AUM reflects the valuation methodology that corresponds to the basis used for determining revenue such as net asset value for the Victory Funds and certain other pooled funds and account market value for separate accounts. For the NEC Funds, AUM represents limited partner capital commitments during the commitment period of the fund. Following the earlier of the termination of the commitment period and the beginning of any commitment period for a successor fund, AUM generally represents, depending on the fund, the lesser of a) the net asset value of the fund and b) the aggregated adjusted cost basis of each unrealized portfolio investment or the limited partner capital commitments reduced by the amount of capital contributions used to make portfolio investments that have been disposed.
Investment management fees are recognized as revenue using a time-based output method to measure progress. Revenue is recorded at month end or quarter end when the value of consideration is measured. The amount of investment management fee revenue varies from one reporting period to another as levels of AUM change (from inflows, outflows and market movements) and as the number of days in the reporting period change.
The Company may waive certain fees for investment management services provided to the Victory Funds, VictoryShares and other pooled investment vehicles and may subsidize certain share classes of the Victory Funds, VictoryShares and other pooled investment vehicles to ensure that specified operating expenses attributable to such share classes do not exceed a specified percentage. These waivers and reimbursements reduce the transaction price allocated to investment management services and are recognized as a reduction to investment management fees revenue. The amounts due to the Victory Funds, VictoryShares and other pooled investment vehicles for waivers and expense reimbursements represent consideration payable to customers, which is recorded in accounts payable and accrued expenses in the Consolidated Balance Sheets, and no distinct services are received in exchange for these payments.
Performance-based investment management fees, which include fees under performance fee and fulcrum fee arrangements, are included in the transaction price for providing investment management services. Performance-based investment management fees are calculated as a percentage of investment performance on a client’s account versus a specified benchmark or hurdle based on the terms of the contract with the
customer. Performance-based investment management fees are variable consideration and are recognized as revenue when and to the extent that it is probable that a significant reversal of the cumulative revenue for the contractual performance period will not occur. Performance-based investment management fees recognized as revenue in the current period may pertain to performance obligations satisfied in prior periods. Fulcrum fee arrangements include a performance fee adjustment that increases or decreases the total investment management fee depending on whether the assets being managed experienced better or worse investment performance than the index specified in the customer’s contract. The performance fee adjustment arrangement with certain equity and fixed income Victory Funds III is calculated monthly based on the investment performance of those funds relative to their specified benchmark indexes over the discrete performance period ending with that month.
Fund Administration Fees
The Company recognizes fund administration fees as revenue using a time-based output method to measure progress. Fund administration fees are determined based on the contractual rate applied to average daily net assets of the Victory Funds and VictoryShares for which administration services are provided. Revenue is recorded on a monthly basis when the value of consideration is measured using actual average daily net assets and constraints are removed. The Company’s fund administration fee revenue is recorded in fund administration and distribution fees in the Consolidated Statements of Operations.
The Company has contractual arrangements with a third party to provide certain sub-administration services. We are the primary obligor under the contracts with the Victory Funds and VictoryShares and have the ability to select the service provider and establish pricing. As a result, fund administration fees and sub-administration expenses are recorded on a gross basis.
Fund Compliance Fees
The Company has an agreement to provide compliance design, administration and oversight services for the Victory Funds and the VictoryShares in accordance with Rule 38a-1 under the Investment Company Act. The Company furnishes a VCM employee to serve as the Chief Compliance Officer and provides other compliance personnel and resources reasonably necessary to perform the services under this agreement. The Company earns a fixed annual fee for these compliance services which is recorded in fund administration and distribution fees in the Consolidated Statements of Operations.
Fund Transfer Agent Fees
The Company recognizes fund transfer agent fees using a time-based output method to measure progress. Fund transfer agent fees are determined based on the contractual rate applied to either the average daily net assets of the Victory Funds III for which transfer agent services are provided or number of accounts in the Victory Funds III. Revenue is recorded on a monthly basis when the value of consideration is measured using actual average daily net assets or actual number of accounts and constraints are removed. The Company’s fund transfer agent fee revenue is recorded in fund administration and distribution fees in the Consolidated Statements of Operations.
The Company also receives fees for sub-transfer agency services under contracts with the Victory Funds for member class shares. Sub-transfer agency fees are recognized and recorded in a manner similar to fund transfer agent fees and are recorded in fund administration and distribution fees in the Consolidated Statements of Operations.
The Company has contractual arrangements with a third party to provide certain sub-transfer agent services. As the Company is the primary obligor under the transfer agency contracts with the Victory Funds III and has the ability to select the service provider and establish pricing, fund transfer agent fees and sub-transfer agent expenses are recorded on a gross basis.
Fund Distribution Fees
The Company receives compensation for sales and sales-related services promised under distribution contracts with the Victory Funds. Revenue is measured in an amount that reflects the consideration to which the Company expects to be entitled in exchange for providing distribution services. Distribution fees are generally calculated as a percentage of average net assets in the Victory Funds. The Company’s performance obligation is satisfied at the point in time when control of the services is transferred to customers, which is upon investor subscription or redemption.
Based on the nature of the calculation, the revenue for these services is accounted for as variable consideration. The Company may recognize distribution fee revenue in the current period that pertains to performance obligations satisfied in prior periods as variable consideration is recognized only when uncertainties are resolved. The Company’s distribution fee revenue is recorded in fund administration and distribution fees in the Consolidated Statements of Operations.
The Company has contractual arrangements with third parties to provide certain distribution services. The Company is the primary obligor under the contracts with the Victory Funds and has the ability to select the service provider and establish pricing. Substantially all of the Company’s revenue is recorded gross of payments made to third parties.
Included in fund distribution fees are transaction and account-level fees paid by VCS brokerage platform customers for trade execution, cash transfer and other services.
Costs Incurred to Obtain or Fulfill Customer Contracts
The Company is required to capitalize certain costs directly related to the acquisition or fulfillment of a contact with a customer. Victory has not identified any sales-based compensation or similar costs that meet the definition of an incremental cost to acquire a contract and as such we have no intangible assets related to contract acquisitions.
Direct costs incurred to fulfill services under the Company’s distribution contracts include sales commissions paid to third party dealers for the sale of Class C Shares. The Company may pay upfront sales commissions to dealers and institutions that sell Class C shares of the participating Victory Funds at the time of such sale. Upfront sales commission payments with respect to Class C shares equal 1.00% of the purchase price of the Class C shares sold by the dealer or institution. When the Company makes an upfront payment to a dealer or institution for the sale of Class C shares, the Company capitalizes the cost of such payment, which is recorded in prepaid expenses in the Consolidated Balance Sheets and amortizes the cost over a 12-month period, the estimated period of benefit.
Valuation of AUM and fund investments
The fair value of assets under management of the Victory Funds and VictoryShares is primarily determined using quoted market prices or independent third-party pricing services or broker price quotes. In certain circumstances, a quotation or price evaluation is not readily available from a pricing service. In these cases, pricing is determined by management based on a prescribed valuation process that has been approved by the directors/trustees of the sponsored products. The same prescribed valuation process is used to price securities in separate accounts and the Company’s other non-alternative investment vehicles for which a quotation or price evaluation is not readily available from a pricing service.
The fair value of Level III assets held by alternative investment vehicles is determined under the respective valuation policy for each fund. The valuation policies address the fact that substantially all the investments of a fund may not have readily available market information and therefore the fair value for these assets is typically determined using unobservable inputs and models that may include subjective assumptions. AUM reported by the Company for alternative investment vehicles may not necessarily equal the funds’ net asset values or the total fair value of the funds’ portfolio investments as AUM represents the basis for calculating management fees.
For the periods presented, less than one percent of the Company’s total AUM were Level III assets priced without using a quoted market price, broker price quote or pricing service quotation.
NOTE 4. ACQUISITIONS
USAA AMCO Acquisition
Under the terms of the USAA AMCO Acquisition purchase agreement, a maximum of $150.0 million ($37.5 million per year) in contingent payments was payable to sellers based on the annual revenue of USAA Asset Management Company attributable to all “non-managed money”-related AUM in each of the first four years following the closing. To receive any contingent payment in respect of “non-managed money”-related assets for a given year, annual revenue from “non-managed money”-related assets was required to be at least 80% of the revenue run-rate (as calculated under the Stock Purchase Agreement) of the USAA Asset Management Company's “non-managed money”-related assets under management as of the closing date, and to achieve
the maximum contingent payment for a given year, such annual revenue was required to be at least 100% of that closing date revenue run-rate. In 2023, the Company paid $36.4 million in cash to sellers for the fourth and final earn out period payment, bringing total cumulative contingent payments to $148.9 million.
The Company recorded an increase in the liability of $8.7 million in 2023 and a decrease in the liability of $3.6 million in 2022 in change in value of consideration payable for acquisition of business in the Consolidated Statements of Operations.
NEC Acquisition
On November 1, 2021, VCM completed the acquisition of 100% of the equity interests in NEC. Founded in 2004 and based in Hanover, New Hampshire, NEC is an alternative asset management firm focused on debt and equity investments in clean energy infrastructure projects and companies through private closed-end funds (the “NEC Funds”).
The NEC Acquisition purchase price was $63.1 million, which included $62.8 million in cash paid at closing, net of cash acquired, and $0.3 million of net working capital adjustments paid to sellers in 2022. Under the terms of the NEC purchase agreement, the Company will pay up to an additional $35.0 million in cash based on NEC’s net revenue growth over a six-year period following the closing date. The purchase agreement specifies net revenue and payment targets for the 36-month, 48-month and 60-month periods beginning on November 30, 2021 (the “Start Date”) for the contingent payments. It also provides for advance payments and catch-up payments to be made based on actual NEC net management fee revenue, as defined in the purchase agreement, as measured at the end of each 12-month anniversary of the Start Date over a six year period. The maximum amount of contingent payments, less any contingent payments previously paid, is due upon the occurrence of certain specified events within a five year period following the Start Date.
The Company determined that substantially all of the contingent payments payable per the NEC purchase agreement represent compensation for post-closing services. Accordingly, these contingent payments were excluded from the purchase price for the NEC Acquisition and a liability for these contingent payments was not recorded on the acquisition date. The Company records compensation expense over the estimated service period in an amount equal to the total contingent payments currently forecasted to be paid.
As of December 31, 2024, the Company determined that the contingent payments are no longer probable of occurring and the liability for NEC contingent payments is zero. The liability for NEC contingent payments totaled $13.7 million as of December 31, 2023 which is included in accrued compensation and benefits in the Consolidated Balance Sheets
For the year ended December 31, 2024, the net impact to the Consolidated Statement of Operations relating to the NEC contingent payment compensation expense was a decrease of $13.7 million in personnel compensation and benefits. The Company recorded $5.6 million and $5.5 million in NEC contingent payment compensation expense for the years ended December 31, 2023 and 2022, respectively, which is included in personnel compensation and benefits in the Consolidated Statements of Operations.
WestEnd Acquisition
On and effective December 31, 2021, the Company completed the WestEnd Acquisition. Founded in 2004, and headquartered in Charlotte, North Carolina, WestEnd is an ETF strategist advisor that provides financial advisors with a turnkey, core model allocation strategy for either a holistic solution or complementary source of alpha.
The aggregate purchase price for the WestEnd Acquisition was $716.1 million, net of cash acquired, which includes (i) $475.8 million in cash paid at closing (the “WestEnd Closing”) net of cash acquired, (ii) the acquisition date value of contingent payments due to sellers of $239.7 million and iii) $0.6 million paid in cash to sellers in 2022 for net working capital adjustments. The contingent earn-out payments are based on net revenue of the WestEnd business during each of the first four years following the WestEnd Closing, subject to certain “catch-up” provisions over a five and one half year period following the WestEnd Closing. A maximum of $320.0 million ($80.0 million per year) in earn-out payments may be paid.
The estimated fair value for contingent consideration payable to sellers is estimated using the real options method. WestEnd net revenue growth is simulated in a risk-neutral framework to calculate expected probability-weighted earn out payments, which are then discounted from the expected payment dates at the relevant cost of debt. Significant assumptions and inputs include the WestEnd net revenue projected annual growth rate, the
market price of risk, which adjusts the projected revenue growth rate to a risk-neutral expected growth rate, revenue volatility and discount rate. The market price of risk and revenue volatility are based on data for comparable companies. As the contingent consideration represents a subordinate, unsecured claim of the Company, the Company assesses a discount rate which incorporates adjustments for credit risk and the subordination of the contingent consideration.
The estimated fair value of contingent consideration payable to sellers was $139.9 million and $217.2 million at December 31, 2024 and 2023, respectively. During 2024, the Company paid $80.0 million in cash to sellers as a catch-up payment for the first earn-out period.
Significant inputs to the valuation of contingent consideration payable to sellers as of December 31, 2024 and 2023 and the acquisition date are as follows and are approximate values:
| | | | | | | | | | | | | | | |
| | | | | | | | | | | | |
| | | December 31, 2024 | | | December 31, 2023 | | | | December 31, 2022 | | |
Net revenue 5 year average annual growth rate | | | | 12 | | % | | 22 | | % | | | 28 | | % |
Market price of risk adjustment for revenue (continuous) | | | | 5 | | % | | 7 | | % | | | 11 | | % |
Revenue volatility | | | | 21 | | % | | 21 | | % | | | 20 | | % |
Discount rate | | | | 7 | | % | | 7 | | % | | | 8 | | % |
Years remaining in earn out period | | | | 2.8 | | | | 3.8 | | | | | 4.8 | | |
Undiscounted estimated remaining earn out payments ($ in millions) | | | $152 - $240 | | | $243 - $320 | | | | $247 - $320 | | |
Amundi US Contribution
On July 8, 2024, the Company, Amundi and, solely for certain provisions thereof, Amundi S.A., (“Amundi Parent,” and together with Amundi, the “Amundi Parties”) entered into the Contribution Agreement, pursuant to which, upon the terms and subject to the conditions set forth therein, Amundi will contribute to the Company, all of the shares of Amundi US. The contribution will result in Amundi US becoming a wholly owned subsidiary of Victory.
Amundi US, based in Boston, Massachusetts, is a wholly owned subsidiary of Amundi, which is headquartered in Paris, France. Amundi US’s activities are principally conducted by its wholly owned subsidiary Amundi US, Inc. Amundi US, Inc. specializes in providing and distributing investment solutions to a wide range of clients and investors, including institutional investors, corporations, central banks, sovereign wealth funds, and individual investors through its wholly owned subsidiaries Amundi Asset Management US, Inc. and Amundi Distributor US, Inc.
At the closing of the transactions contemplated by the Contribution Agreement (the “Closing”), in exchange for the shares of Amundi US, Amundi will receive 26.1% of the Company’s fully diluted shares after giving effect to that issuance (the “Base Share Consideration”). This will be composed of newly issued shares of Victory Common Stock, par value $0.01, representing 4.9% of the number of issued and outstanding shares of Common Stock, after giving effect to that issuance, and the balance in newly issued shares of a new class of Preferred Stock.
The Base Share Consideration is subject to customary adjustments for Amundi US’s indebtedness, cash, working capital and unpaid transaction expenses. The Base Share Consideration is also subject to adjustment if Amundi does not obtain client consents relating to the assignment of investment advisory contracts or the approval of new investment advisory contracts (as applicable) (“Client Consents”) representing revenues equal to at least 93.5% of the Aggregate Base Date Revenue Run-Rate (as defined in the Contribution Agreement). The Base Share Consideration is also subject to a customary post-Closing adjustment as well as a true-up payment in respect of Client Consents obtained in the 180 days following the Closing.
At the Closing, the Company and Amundi will enter into a shareholder agreement (the “Shareholder Agreement”), pursuant to which, among other things, Amundi will be (i) granted certain resale shelf and piggyback registration rights in respect of the Common Stock and any shares of the Common Stock issuable by the Company upon the conversion of Preferred Stock, in each case, to the extent the Company Preferred Stock and the Common Stock was issued to Amundi under the Contribution Agreement (such shares of the Common Stock and Preferred Stock, the “Acquired Shares”) or acquired pursuant to Amundi’s participation rights under the Shareholder Agreement and (ii) entitled to nominate two members of the Board for so long as
it holds at least 50% of the Acquired Shares (without giving effect to certain sales by Amundi) and one member of the Board for so long as it holds at least 33% of the Acquired Shares (without giving effect to certain sales by Amundi). In addition, for a period of three years following the Closing, Amundi will be subject to a customary “lock-up” of the Acquired Shares (subject to certain exceptions) and a standstill, which among other things, prohibits Amundi from acquiring additional equity securities of the Company (subject to certain exceptions).
The Amundi Parties, the Company, and VCM have also entered into an Off-Shore Master Distribution and Services Agreement and an On-Shore Master Distribution and Services Agreement which will become effective on the date of the Closing (except with respect to certain specified provisions set forth therein, which became effective as of the entry into such agreements).
The Closing of the transaction is expected to occur by the end of first quarter of 2025 and is subject to customary closing conditions, regulatory approvals and regulatory authorizations.
Acquisition-related costs
Costs related to acquisitions of businesses and assets are summarized below and include legal and filing fees, advisory services, mutual fund proxy voting costs and other one‑time expenses related to the transactions.
Costs related to acquisitions were expensed in 2024, 2023 and 2022 and are included in acquisition‑related costs in the Consolidated Statements of Operations.
| | | | | | | | | | | | | | | |
| | Year Ended December 31, | |
(in thousands) | | | 2024 | | | 2023 | | | 2022 | |
Amundi US | | $ | | 11,240 | | | $ | | - | | | $ | | - | |
NEC | | | | - | | | | | - | | | | | 112 | |
WestEnd | | | | - | | | | | 47 | | | | | 139 | |
Other | | | | 45 | | |
| | 170 | | |
| | 283 | |
Total acquisition-related costs | | $ | | 11,285 | | | $ | | 217 | | | $ | | 534 | |
Restructuring and Integration Costs
In connection with business combinations, asset purchases and changes in business strategy, the Company incurs costs integrating investment platforms, products and personnel into existing systems, processes and service provider arrangements and restructuring the business to capture operating expense synergies.
The following table presents a rollforward of restructuring and integration liabilities, which as of December 31, 2024, 2023 and 2022 were included in accounts payable and accrued expenses on the Consolidated Balance Sheets.
| | | | | | | | | | | | | | | |
| | Year Ended December 31, | |
(in millions) | | 2024 | | | 2023 | | | 2022 | |
Liability balance, beginning of period | | $ | | 0.4 | | | $ | | 0.3 | | | $ | | 0.3 | |
Severance expense | |
| | 0.4 | | |
| | 0.6 | | |
| | 0.3 | |
Contract termination expense | |
| | — | | |
| | — | | |
| | 0.5 | |
Integration costs | |
| | 1.0 | | |
| | — | | |
| | 0.1 | |
Restructuring and integration costs | |
| | 1.4 | | |
| | 0.6 | | |
| | 0.9 | |
Settlement of liabilities | |
| | (1.6 | ) | |
| | (0.5 | ) | |
| | (0.9 | ) |
Liability balance, end of period | | $ | | 0.2 | | | $ | | 0.4 | | | $ | | 0.3 | |
NOTE 5. Fair Value Measurements
The Company determines the fair value of certain financial and nonfinancial assets and liabilities. Fair value is determined based on the price that would be received for an asset or paid to transfer a liability in an orderly transaction between market participants at the measurement date. Fair value determinations utilize a valuation hierarchy based upon the transparency of inputs used in the valuation of an asset or liability.
Classification within the fair value hierarchy contains three levels:
•Level 1—Valuation inputs are unadjusted quoted market prices for identical assets or liabilities in active markets.
•Level 2—Valuation inputs are quoted prices for identical assets or liabilities in markets that are not active, quoted market prices for similar assets and liabilities in active markets and other observable inputs directly or indirectly related to the asset or liability being measured.
•Level 3—Valuation inputs are unobservable and significant to the fair value measurement. These inputs reflect management's own assumptions about the assumptions a market participant would use in pricing the asset or liability.
The following table presents assets and liabilities measured at fair value on a recurring basis:
| | | | | | | | | | | | | | | | |
| | As of December 31, 2024 | |
(in thousands) | | Total | | | Level 1 | | | Level 2 | | | Level 3 | |
Financial assets | | | | | | | | | | | | |
Money market fund | | $ | 110,475 | | | $ | 110,475 | | | $ | — | | | $ | — | |
Investments in proprietary funds | | | 605 | | | | 605 | | | | — | | | | — | |
Deferred compensation plan investments | | | 34,608 | | | | 34,608 | | | | — | | | | — | |
Total financial assets | | $ | 145,688 | | | $ | 145,688 | | | $ | — | | | $ | — | |
Financial liabilities | | | | | | | | | | | | |
Contingent consideration arrangements | | $ | (139,894 | ) | | $ | — | | | $ | — | | | $ | (139,894 | ) |
Total financial liabilities | | $ | (139,894 | ) | | $ | — | | | $ | — | | | $ | (139,894 | ) |
| | | | | | | | | | | | |
| | As of December 31, 2023 | |
(in thousands) | | Total | | | Level 1 | | | Level 2 | | | Level 3 | |
Financial assets | | | | | | | | | | | | |
Money market fund | | $ | 109,183 | | | $ | 109,183 | | | $ | — | | | $ | — | |
Investments in proprietary funds | | | 534 | | | | 534 | | | | — | | | | — | |
Deferred compensation plan investments | | | 31,274 | | | | 31,274 | | | | — | | | | — | |
Total financial assets | | $ | 140,991 | | | $ | 140,991 | | | $ | — | | | $ | — | |
Financial liabilities | | | | | | | | | | | | |
Contingent consideration arrangements | | $ | (217,200 | ) | | $ | — | | | $ | — | | | $ | (217,200 | ) |
Total financial liabilities | | $ | (217,200 | ) | | $ | — | | | $ | — | | | $ | (217,200 | ) |
Level 1 assets consist of money market funds and open-end mutual funds. The fair values for these assets are determined utilizing quoted market prices for identical assets.
Contingent consideration arrangements represent the WestEnd earn-out payment liability which is included in consideration payable for acquisition of business in the Consolidated Balance Sheets.
Significant unobservable inputs for the option pricing model used to determine the estimated fair value of the WestEnd Acquisition earn-out payment liability include the WestEnd net revenue projected growth rate, revenue volatility, market price of risk and discount rate. An increase in the projected growth rate for revenue results in a higher fair value for the earn-out payment liability while an increase in the discount rate results in a lower fair value for the earnout payment liability. An increase in the market price of risk and revenue volatility results in a lower fair value. Refer to Note 4, Acquisitions, for further details related to the valuation of contingent consideration payable related to the WestEnd Acquisition.
Changes in the fair value of contingent consideration arrangement liabilities, realized or unrealized, are recorded in earnings and are included in change in value of consideration payable for acquisition of business in the Consolidated Statements of Operations.
The following table presents the balance of the contingent consideration arrangement liabilities at December 31, 2024, 2023 and 2022, respectively:
| | | | | |
(in thousands) | | Contingent
Consideration
Liabilities | |
Balance, December 31, 2022 | | $ | | 230,400 | |
USAA AMCO fourth and final annual earn-out payment | | | | (36,436 | ) |
USAA AMCO change in fair value measurement | | | | 8,736 | |
WestEnd change in fair value measurement | | | | 14,500 | |
Balance, December 31, 2023 | | | | 217,200 | |
WestEnd earn-out payment | | | | (80,000 | ) |
WestEnd change in fair value measurement | | | | 2,694 | |
Balance, December 31, 2024 | | $ | | 139,894 | |
There were no transfers between any of the Level 1, 2 and 3 categories in the fair value measurement hierarchy for the years ended December 31, 2024 and 2023. The Company recognizes transfers at the end of the reporting period.
The net carrying value of accounts receivable and accounts payable approximates fair value due to the short‑term nature of these assets and liabilities. The fair value of our long-term debt as of December 31, 2024 is considered to be its carrying value as the interest rate on the bank debt is variable and approximates current market rates. As a result, Level 2 inputs are utilized to determine the fair value of our long‑term debt.
NOTE 6. Related‑Party Transactions
The Company considers certain funds that it manages, including the Victory Funds, the VictoryShares, collective trust funds that it sponsors (the “Victory Collective Funds”), the NEC Funds and other pooled investment vehicles that it sponsors, to be related parties as a result of its advisory relationship.
The Company receives investment management, administrative, distribution and compliance fees in accordance with contracts that VCM and VCS have with the Victory Funds and has invested a portion of its balance sheet cash in the Victory Treasury Money Market Trust and earns interest on the amount invested in this fund.
The Company receives investment management, administrative and compliance fees in accordance with contracts that VCM has with the VictoryShares.
We also receive investment management fees from the Victory Collective Funds, the NEC Funds and other pooled investment vehicles under VCM’s advisory contracts with these funds. In addition, VCTA receives fees for transfer agency services under contracts with the Victory Funds III and sub-transfer agency services under contracts with the Victory Funds for member class shares.
Director fees payable by the Company in cash and contributions made under the Director Deferred Compensation Plan for non-employee members of our Board of Directors are included in general and administrative expense in the Consolidated Statements of Operations.
On July 8, 2024, the Company, Amundi and, solely for certain provisions thereof, Amundi Parent, entered into the Contribution Agreement, pursuant to which, upon the terms and subject to the conditions set forth therein, Amundi will contribute to the Company, all of the shares of Amundi US. The contribution will result in Amundi US becoming a wholly owned subsidiary of Victory. The transaction is expected to close by the end of the first quarter of 2025. In the fourth quarter of 2024, Amundi US began providing subadvisory services to certain Victory Funds. Subadvisory fees payable to Amundi US are included in distribution and other asset-based expenses in the Consolidated Statements of Operations.
The table below presents balances and transactions involving related parties included in the Consolidated Balance Sheets and Consolidated Statements of Operations.
•Included in cash and cash equivalents is cash held in the Victory Treasury Money Market Trust.
•Included in receivables (investment management fees) are amounts due from the Victory Funds, the VictoryShares, the Victory Collective Funds, the NEC Funds and other pooled investment vehicles for investment management services.
•Included in receivables (fund administration and distribution fees) are amounts due from the Victory Funds for fund administration services and compliance services, amounts due from the VictoryShares for fund administration services, amounts due from the Victory Funds III for transfer agent services and amounts due from the Victory Funds for sub-transfer agent services.
•Included in prepaid expenses are amounts paid by VCM that will be invoiced to the NEC Funds in subsequent periods.
•Included in revenue (investment management fees) are amounts earned for investment management services provided to the Victory Funds, the VictoryShares, the Victory Collective Funds, the NEC Funds and other pooled investment vehicles.
•Included in revenue (fund administration and distribution fees) are amounts earned for fund administration and compliance services, transfer agent services and sub-transfer agent services.
•Realized and unrealized gains and losses and dividend income on investments in the Victory Funds classified as investments in proprietary funds and deferred compensation plan investments and dividend income on investments in the Victory Treasury Money Market Trust are recorded in interest income and other income (expense) in the Consolidated Statements of Operations.
•Amounts due to the Victory Funds, the VictoryShares and other pooled investment vehicles for waivers of investment management fees and reimbursements of fund operating expenses are included in accounts payable and accrued expenses in the Consolidated Balance Sheets and represent consideration payable to customers.
| | | | | | | | | | |
| | As of December 31, | |
(in thousands) | | 2024 | | | 2023 | |
Related party assets | | |
| | | |
| |
Cash and cash equivalents | | $ | | 110,475 | | | $ | | 109,183 | |
Receivables (investment management fees) | | | | 50,520 | | | | | 46,217 | |
Receivables (fund administration and distribution fees) | | | | 16,014 | | | | | 14,238 | |
Prepaid expenses | | | | 1,702 | | | | | 730 | |
Investments (investments in proprietary funds, fair value) | | | | 605 | | | | | 534 | |
Investments (deferred compensation plan investments, fair value) | | | | 34,473 | | | | | 31,143 | |
Total | | $ | | 213,789 | | | $ | | 202,045 | |
| | | | | | | | |
Related party liabilities | | |
| | | |
| |
Accounts payable and accrued expenses (fund reimbursements) | | $ | | 5,889 | | | $ | | 5,641 | |
| | | | | | | | | | | | | | | |
| | Year ended December 31, | |
(in thousands) | | 2024 | | | 2023 | | | 2022 | |
Related party revenue | | | | | | | | | | | | |
Investment management fees | | $ | | 533,178 | | | $ | | 488,132 | | | $ | | 510,900 | |
Fund administration and distribution fees | | | | 188,894 | | | | | 180,152 | | | | | 190,090 | |
Total | | $ | | 722,072 | | | $ | | 668,284 | | | $ | | 700,990 | |
| | | | | | | | | | | | |
Related party expense | | |
| | | |
| | | |
| |
General and administrative | | $ | | 435 | | | $ | | 506 | | | $ | | 415 | |
Distribution and other asset-based expenses | | | | 308 | | | | | — | | | | | — | |
Total | | $ | | 743 | | | $ | | 506 | | | $ | | 415 | |
| | | | | | | | | | | | |
Related party other income (expense) | | | | | | | | | | | | |
Interest income and other income (expense) | | $ | | 9,728 | | | $ | | 6,531 | | | $ | | (2,199 | ) |
NOTE 7. Investments
As of December 31, 2024 and 2023, the Company had investments in proprietary funds and deferred compensation plan investments. Investments in proprietary funds consist entirely of seed capital investments in certain Victory Funds. Deferred compensation plan investments are held under deferred compensation plans and consist of investments in Victory Funds.
Unrealized and realized gains and losses on investments in proprietary funds and deferred compensation plan investments are recorded in earnings as interest income and other income (expense).
Investments in Proprietary Funds
The following table presents a summary of the cost and fair value of investments in proprietary funds:
| | | | | | | | | | | | | | | | | | | | |
| | | | | | Gross Unrealized | | | Fair | |
(in thousands) | | Cost | | | Gains | | | (Losses) | | | Value | |
As of December 31, 2024 | | $ | | 621 | | | $ | | 46 | | | $ | | (62 | ) | | $ | | 605 | |
As of December 31, 2023 | | | | 569 | | | | | 55 | | | | | (90 | ) | | | | 534 | |
The following table presents proceeds from sales of investments in proprietary funds and realized gains and losses recognized during the years ended December 31, 2024, 2023 and 2022:
| | | | | | | | | | | | | | | |
| | Sale | | | Realized | |
(in thousands) | | Proceeds | | | Gains | | | (Losses) | |
For the Year Ended December 31, 2024 | | $ | | 37 | | | $ | | 16 | | | $ | | — | |
For the Year Ended December 31, 2023 | | | | 32 | | | | | 4 | | | | | — | |
For the Year Ended December 31, 2022 | | | | 295 | | | | | — | | | | | (42 | ) |
Deferred Compensation Plan Investments
The following table presents a summary of the cost and fair value of deferred compensation plan investments:
| | | | | | | | | | | | | | | | | | | | |
| | | | | | Gross Unrealized | | | Fair | |
(in thousands) | | Cost | | | Gains | | | (Losses) | | | Value | |
As of December 31, 2024 | | $ | | 33,224 | | | $ | | 1,802 | | | $ | | (418 | ) | | $ | | 34,608 | |
As of December 31, 2023 | | | | 30,109 | | | | | 1,610 | | | | | (445 | ) | | | | 31,274 | |
The following table presents proceeds from sales of deferred compensation plan investments and realized gains and losses recognized during the years ended December 31, 2024, 2023 and 2022:
| | | | | | | | | | | | | | | |
| | Sale | | | Realized | |
| | Proceeds | | | Gains | | | (Losses) | |
For the year ending December 31, 2024 | | $ | | 10,643 | | | $ | | 483 | | | $ | | (32 | ) |
For the year ending December 31, 2023 | | | | 11,147 | | | | | 89 | | | | | (440 | ) |
For the year ending December 31, 2022 | | | | 23,714 | | | | | 2,225 | | | | | (1,966 | ) |
NOTE 8. Property and Equipment
The following table presents property and equipment as of December 31, 2024 and 2023:
| | | | | | | | | | |
| | As of December 31, | |
(in thousands) | | 2024 | | | 2023 | |
Equipment and implementation costs | | $ | | 41,713 | | | $ | | 40,713 | |
Leasehold improvements | | | | 4,278 | | | | | 4,381 | |
Furniture and fixtures | | | | 2,782 | | | | | 3,055 | |
Total | | | | 48,773 | | | | | 48,149 | |
Accumulated depreciation and amortization | | | | (36,899 | ) | | | | (28,571 | ) |
Total property and equipment, net | | $ | | 11,874 | | | $ | | 19,578 | |
Depreciation and amortization expense for property and equipment was $9.0 million, $8.8 million and $8.0 million for the years ended December 31, 2024, 2023 and 2022, respectively.
NOTE 9. Goodwill and Other Intangible Assets
The following table presents changes in the goodwill balance for the periods ended December 31, 2024 and 2023:
| | | | | | | | | | |
| | As of December 31, | |
(in thousands) | | 2024 | | | 2023 | |
Balance, beginning of period | | $ | | 981,805 | | | $ | | 981,805 | |
Balance, end of period | | $ | | 981,805 | | | $ | | 981,805 | |
There were no impairments to goodwill recognized during the years ended December 31, 2024, 2023 or 2022.
Identifiable Intangible Assets
The following table presents a summary of indefinite‑lived intangible assets by type:
| | | | | | | | | | | | | | | |
| | Fund
Advisory,
Transfer | | | | | | | | |
| | Agent and
Distribution | | | Trade | | | | | |
(in thousands) | | Contracts | | | Names | | | Totals | |
December 31, 2022 balance | | $ | | 1,113,000 | | | $ | | 23,700 | | | $ | | 1,136,700 | |
Impairment | | | | — | | | | | (3,770 | ) | | | | (3,770 | ) |
Transfers to definite-lived intangible assets | | | | — | | | | | (3,130 | ) | | | | (3,130 | ) |
December 31, 2023 balance | | $ | | 1,113,000 | | | $ | | 16,800 | | | $ | | 1,129,800 | |
Additions or transfers | | | | — | | | | | — | | | | | — | |
December 31, 2024 balance | | $ | | 1,113,000 | | | $ | | 16,800 | | | $ | | 1,129,800 | |
In the third quarter of 2023, the Company recognized a $3.8 million impairment loss on an indefinite-lived trade name asset primarily due to changing the asset’s estimated remaining useful life. The asset was transferred to
definite lived intangible assets and the remaining book value of the asset is being amortized on a straight-line basis over a period that is shorter than the asset’s economic life. The impairment loss is recorded in depreciation and amortization in the Consolidated Statements of Operations. There were no impairments to indefinite-lived intangible assets recognized in 2024 and 2022.
The following table presents a summary of definite‑lived intangible assets by type:
| | | | | | | | | | | | | | | | | | | | |
| | | | | | | | | Intellectual | | | | | |
| | Customer | | | Trade | | | Property/ | | | | | |
(in thousands) | | Relationships | | | Names | | | Other | | | Totals | |
Gross book value - December 31, 2023 | | $ | | 310,286 | | | $ | | 45,462 | | | $ | | 7,547 | | | $ | | 363,295 | |
Accumulated amortization | | | | (163,309 | ) | | | | (40,446 | ) | | | | (7,508 | ) | | | | (211,263 | ) |
Net book value - December 31, 2023 | | $ | | 146,977 | | | $ | | 5,016 | | | $ | | 39 | | | $ | | 152,032 | |
Weighted average useful life (yrs) | | | | 7.4 | | | | | 3.2 | | | | | 0.5 | | | | | 7.1 | |
Gross book value - December 31, 2024 | | $ | | 310,286 | | | $ | | 45,462 | | | $ | | 7,547 | | | $ | | 363,295 | |
Accumulated amortization | | | | (182,925 | ) | | | | (42,009 | ) | | | | (7,547 | ) | | | | (232,481 | ) |
Net book value - December 31, 2024 | | $ | | 127,361 | | | $ | | 3,453 | | | $ | | — | | | $ | | 130,814 | |
Weighted average useful life (yrs) | | | | 6.5 | | | | | 2.3 | | | | | — | | | | | 6.2 | |
Amortization expense for definite‑lived intangible assets for the years ended December 31, 2024, 2023 and 2022 was $21.2 million, $29.0 million and $35.2 million, respectively, and is recorded in depreciation and amortization in the Consolidated Statements of Operations. There were no impairments to definite-lived intangible assets recognized in 2024, 2023 or 2022.
The following table presents estimated amortization expense for definite‑lived intangible assets for each of the five succeeding years and thereafter:
| | | | | |
2025 | | $ | | 21,055 | |
2026 | | | | 20,707 | |
2027 | | | | 19,623 | |
2028 | | | | 17,679 | |
2029 | | | | 17,250 | |
Thereafter | | | | 34,500 | |
Total | | $ | | 130,814 | |
NOTE 10. Income Taxes
The following table presents the provision for income taxes for the years ended December 31, 2024, 2023, and 2022:
| | | | | | | | | | | | | | | |
(in thousands) | | 2024 | | | 2023 | | | 2022 | |
Current tax expense (benefit): | | | | | | |
| | | |
| |
Federal | | $ | | 41,502 | | | $ | | 32,457 | | | $ | | 30,723 | |
State | | | | 10,840 | | | | | 8,554 | | | | | 8,055 | |
Foreign | | | | 34 | | | | | 201 | | | | | 90 | |
Total current tax expense | | | | 52,376 | | | | | 41,212 | | | | | 38,868 | |
Deferred tax expense (benefit): | | | | | | | | | | | | |
Federal | | | | 26,680 | | | | | 17,951 | | | | | 29,263 | |
State | | | | 5,658 | | | | | 3,618 | | | | | 6,654 | |
Foreign | | | | 178 | | | | | (30 | ) | | | | (263 | ) |
Total deferred tax expense | | | | 32,516 | | | | | 21,539 | | | | | 35,654 | |
Income tax expense | | $ | | 84,892 | | | $ | | 62,751 | | | $ | | 74,522 | |
As of December 31, 2024, 2023, and 2022, the Company had no material liability for unrecognized tax benefits.
The effective tax rate for the years ended December 31, 2024, 2023 and 2022 differs from the United States federal statutory rate primarily because of state and local income taxes and excess tax benefits on share-based compensation.
The following table presents the tax rates for the years ended December 31, 2024, 2023 and 2022.
| | | | | | | | | | | | | | | |
| | 2024 | | | | 2023 | | | | 2022 | | |
Federal income tax at U.S. statutory rate | | | 21.0 | | % | | | 21.0 | | % | | | 21.0 | | % |
State income tax rate, net of federal tax benefit | | | 3.3 | | % | | | 3.3 | | % | | | 3.3 | | % |
Excess tax benefits on share-based compensation | | | (2.4 | ) | % | | | (2.3 | ) | % | | | (3.4 | ) | % |
Foreign taxes and other | | | 0.8 | | % | | | 0.7 | | % | | | 0.4 | | % |
Income tax expense | | | 22.7 | | % | | | 22.7 | | % | | | 21.3 | | % |
Deferred income taxes reflect the net tax effect of temporary differences between the carrying amounts of assets and liabilities for financial reporting purposes and the amount used for income tax reporting purposes.
In assessing the realization of deferred tax assets, management considers the reversal of deferred tax liabilities as well as projections of future taxable income during the periods in which temporary differences are expected to reverse. Based on the consideration of these facts, the Company believes it is more likely than not that all of its gross deferred tax assets will be realized in the future, and as a result, has not recorded a valuation allowance on these amounts as of December 31, 2024 and 2023.
| | | | | | | | | | |
(in thousands) | | 2024 | | | 2023 | |
Deferred tax assets: | | |
| | | |
| |
Definite-lived intangibles | | $ | | 22,437 | | | $ | | 23,516 | |
Share-based compensation expense | | | | 2,573 | | | | | 4,717 | |
Acquisition-related costs | | | | 6,142 | | | | | 3,979 | |
Deferred compensation | | | | 6,330 | | | | | 9,108 | |
Restructuring expenses | | | | 1,042 | | | | | 1,223 | |
Contingent consideration arrangements | | | | 239 | | | | | 286 | |
R&E expenditures | | | | 3,331 | | | | | 2,940 | |
Other | | | | 89 | | | | | 300 | |
Total deferred tax assets | | | | 42,183 | | | | | 46,069 | |
Deferred tax liabilities: | | |
| | | |
| |
Indefinite-lived intangibles | | | | 171,905 | | | | | 149,320 | |
Goodwill | | | | 18,413 | | | | | 8,944 | |
Debt issuance costs | | | | 1,226 | | | | | 2,146 | |
Depreciation | | | | 890 | | | | | 3,157 | |
OCI - Swap gain and cumulative translation adjustment | | | | 6,221 | | | | | 10,685 | |
Prepaid expenses | | | | 308 | | | | | 241 | |
Unrealized gain on deferred compensation investments | | | | 340 | | | | | 290 | |
Total deferred tax liabilities | | | | 199,303 | | | | | 174,783 | |
Deferred tax liability, net | | $ | | (157,120 | ) | | $ | | (128,714 | ) |
As of December 31, 2024 and 2023, the Company had no material net operating loss carryforwards.
In the normal course of business, the Company is subject to examination by federal and certain state and local tax regulators. As of December 31, 2024, U.S. federal income tax returns for 2021, 2022 and 2023 are open
and therefore subject to examination. State and local income tax returns filed are generally open for examination from 2020 to 2023.
We have analyzed the Company’s tax positions for all open years and have concluded that no additional provision for income tax is required in the consolidated financial statements. The Company does not expect the total amount of unrecognized tax benefits to significantly increase in the next twelve months.
The Organization for Economic Co-operation and Development released a framework (“Pillar 2”) in 2021 to introduce a global minimum tax of 15% for companies with global revenues and profits above certain thresholds. Certain aspects of Pillar 2 were effective January 1, 2024 and other aspects are effective January 1, 2025. Each country is required to implement Pillar 2 through its own local tax legislation. Although the U.S. has not yet enacted legislation to adopt Pillar 2, many other countries have adopted, or are in the process of adopting, legislation to implement Pillar 2. Pillar 2 did not materially impact the Company’s effective tax rate or its Consolidated Balance Sheet, Consolidated Statement of Operations or Consolidated Statement of Cash Flows in 2024. The Company does not currently expect Pillar 2 to have a material impact on its future effective tax rates or consolidated financial statements and continues to monitor Pillar 2 developments.
NOTE 11. Debt
2019 Credit Agreement
On July 1, 2019, concurrent with the USAA AMCO Acquisition, the Company entered into the 2019 Credit Agreement, repaid all indebtedness outstanding under the prior credit agreement (the “2018 Credit Agreement”), and terminated the 2018 Credit Agreement.
The 2019 Credit Agreement was entered into among Victory, as borrower, the lenders from time to time party thereto and Barclays Bank PLC, as administrative agent and collateral agent, pursuant to which the Company obtained a seven-year term loan in an aggregate principal amount of $1.1 billion (the “2019 Term Loans”) and established a five-year revolving credit facility (which was unfunded as of the closing date) with aggregate commitments of $100.0 million (with a $10.0 million sub-limit for the issuance of letters of credit).
The obligations of the Company under the 2019 Credit Agreement are guaranteed by the Company’s domestic subsidiaries (other than VCS) (the “Guarantors”) and secured by substantially all of the assets of the Company and the Guarantors, subject in each case to certain customary exceptions.
The 2019 Credit Agreement contains customary affirmative and negative covenants, including covenants that affect, among other things, the ability of the Company and its subsidiaries to incur additional indebtedness, create liens, merge or dissolve, make investments, dispose of assets, engage in sale and leaseback transactions, make distributions and dividends and prepayments of junior indebtedness, engage in transactions with affiliates, enter into restrictive agreements, amend documentation governing junior indebtedness, modify its fiscal year and modify its organizational documents, subject to customary exceptions, thresholds, qualifications and “baskets.” In addition, the 2019 Credit Agreement contains a financial performance covenant, requiring a maximum first lien leverage ratio, measured as of the last day of each fiscal quarter on which outstanding borrowings under the revolving credit facility exceed 35.0% of the commitments thereunder (excluding certain letters of credit), of no greater than 3.80 to 1.00.
As of December 31, 2024 and 2023, there were no outstanding borrowings under the revolving credit facility and the Company was in compliance with its financial performance covenant.
First Amendment
Amounts outstanding under the 2019 Credit Agreement originally accrued interest at an annual rate equal to, at the option of the Company, either LIBOR (adjusted for reserves) plus a margin of 3.25% or an alternate base rate plus a margin of 2.25%.
On January 17, 2020, the Company entered into the First Amendment (the “First Amendment”) to the 2019 Credit Agreement with the other loan parties thereto, Barclays Bank PLC, as administrative agent, and the Royal Bank of Canada as fronting bank.
Pursuant to the First Amendment, the Company refinanced the 2019 Term Loans with replacement term loans in an aggregate principal amount of $952.0 million (the “2020 Term Loans”). The 2020 Term Loans provided for substantially the same terms as the 2019 Term Loans, including the same maturity date of July 1, 2026,
except that the 2020 Term Loans reduced the applicable margin on LIBOR by 75 basis points, resulting in an applicable margin on LIBOR under the 2020 Term Loans of 2.50%.
Second Amendment
On February 18, 2021, the Company entered into the Second Amendment (the “Second Amendment”) to the 2019 Credit Agreement with the other loan parties thereto, Barclays Bank PLC, as administrative agent, and the Royal Bank of Canada as fronting bank. Pursuant to the Second Amendment, the Company repriced the 2020 Term Loans with replacement term loans in an aggregate principal amount of $755.7 million (the “Repriced Term Loans”). The Repriced Term Loans provided for substantially the same terms as the 2020 Term Loans, including the same maturity date of July 2026, except that the Repriced Term Loans reduced the applicable margin on LIBOR by 25 basis points, resulting in an applicable margin on LIBOR under the Repriced Term Loans of 2.25%.
Third Amendment
On December 31, 2021, the Company entered into the Third Amendment (the “Third Amendment”) to the 2019 Credit Agreement with the guarantors party thereto, Barclays Bank PLC, as administrative agent, and the lenders party thereto from time to time. Pursuant to the Third Amendment, the Company obtained incremental term loans (the “2021 Incremental Term Loans”) in an aggregate principal amount of $505.0 million and used the proceeds to fund the WestEnd Acquisition and to pay fees and expenses incurred in connection therewith.
The 2021 Incremental Term Loans will mature in December 2028 and, until the Fourth Amendment to the 2019 Credit Agreement, accrued interest at an annual rate equal to, at the option of the Company, either LIBOR (adjusted for reserves and subject to a 50 basis point floor) plus a margin of 2.25% or an alternate base rate plus a margin of 1.25%.
Original issue discount was $2.5 million for the 2021 Incremental Term Loans. The Company incurred a total of $9.1 million of other third party costs related to the 2021 Incremental Term Loans, which were recorded as term loan debt issuance costs.
Fourth Amendment
On September 23, 2022, the Company entered into the Fourth Amendment (the “Fourth Amendment”) to the 2019 Credit Agreement to change the interest rate on its debt from LIBOR to a rate based on the secured overnight financing rate (“SOFR”) plus a ten-basis point credit spread adjustment. There was no change to the applicable margin on the referenced rate from the Fourth Amendment.
The LIBOR rate loans outstanding as of the Fourth Amendment’s effective date continued as LIBOR rate loans until the end of their then current interest periods. The 2021 Incremental Term Loans converted into Term SOFR loans on September 30, 2022, while the Repriced Term Loans converted into Term SOFR loans on October 6, 2022. Also on October 6, 2022, the interest periods for the Repriced Term Loans and 2021 Incremental Term Loans were aligned and the three-month Term SOFR rate was elected for all the Company’s term loans. The Company has continued to elect the three-month Term SOFR rate for all of the term loans outstanding under the 2019 Credit Agreement since executing the Fourth Amendment.
Fifth Amendment
On June 7, 2024, the Company entered into the Fifth Amendment to the 2019 Credit Agreement, extending the maturity date of the $100.0 million senior secured first lien revolving facility from July 1, 2024 to March 31, 2026, and decreasing the drawn interest rate margin by 0.50% per annum. The revolving facility otherwise remains subject to substantially the same terms as those set forth in the 2019 Credit Agreement. The Company incurred $1.0 million in upfront fees, arranger fees and other third party costs related to the Fifth Amendment to the 2019 Credit Agreement, which were recorded to revolving credit facility debt issuance cost in other assets.
On July 1, 2024, the Company executed an agency succession agreement, by and among Barclays Bank PLC as the resigning administrative agent and collateral agent under the 2019 Credit Agreement and Royal Bank of Canada, as the successor administrative agent and collateral agent.
The following table presents the components of long-term debt in the Consolidated Balance Sheets as of December 31, 2024 and 2023.
| | | | | | | | | | | | | | | | | | |
| | | | | | | | | | Interest Rate | | Effective Interest Rate |
(in thousands) | | 2024 | | | 2023 | | | 2024 | | 2023 | | 2024 | | 2023 |
Term Loans | | | | | | | | | | | | | | | | |
Due July 2026 | | $ | | 624,693 | | | $ | | 630,680 | | | 6.93% | | 7.77% | | 7.33% | | 8.17% |
Due December 2028 | | | | 347,496 | | | | | 371,028 | | | 6.93% | | 7.77% | | 7.26% | | 8.10% |
Term loan principal outstanding | | | | 972,189 | | | | | 1,001,708 | | | | | | | | | |
Unamortized debt issuance costs | |
| | (5,935 | ) | |
| | (8,753 | ) | | | | | | | | |
Unamortized debt discount | |
| | (2,392 | ) | |
| | (3,686 | ) | | | | | | | | |
Long-term debt | | $ | | 963,862 | | | $ | | 989,269 | | | | | | | | | |
Debt issuance costs related to the 2019 Credit Agreement totaled $48.7 million at December 31, 2024 and 2023 are reflected net of accumulated amortization and loss on debt extinguishment of $42.8 million and $40.0 million, respectively. Debt issuance costs of $4.8 million and $3.7 million at December 31, 2024 and 2023, respectively, related to the revolving credit facility are included in other assets in the Consolidated Balance Sheets and are reflected net of accumulated amortization and loss on debt extinguishment of $4.0 million and $3.5 million as of December 31, 2024 and 2023, respectively. Debt discount related to the Term Loans totaled $23.3 million at December 31, 2024 and 2023 and is reflected net of accumulated amortization and loss on debt extinguishment of $20.9 million and $19.6 million, respectively.
In 2024, a total of $29.5 million of the outstanding term loans under the 2019 Credit Agreement was repaid or repurchased and retired. The Company recognized a $0.4 million loss on debt extinguishment in 2024 due to the repayments and repurchases of term loan principal, which consisted of the write-off of $0.3 million and $0.1 million of unamortized debt issuance costs and debt discount, respectively.
There were no repayments of outstanding term loans under the 2019 Credit Agreement in 2023.
In 2022, a total of $149.5 million of the outstanding term loans under the 2019 Credit Agreement was repaid or repurchased and retired. The Company recognized a $2.6 million loss on debt extinguishment in 2022 due to the repayments and repurchases of term loan principal, which consisted of the write-off of $2.4 million and $0.7 million of unamortized debt issuance costs and debt discount, respectively, net of a $0.5 million gain on repurchases.
The following table presents the components of interest expense and other financing costs on the Consolidated Statements of Operations for the years ended December 31, 2024, 2023 and 2022.
| | | | | | | | | | | | | | | |
(in thousands) | | 2024 | | | 2023 | | | 2022 | |
Interest expense | | $ | | 75,784 | | | $ | | 75,016 | | | $ | | 42,715 | |
Amortization of debt issuance costs | | | | 3,108 | | | | | 3,029 | | | | | 3,207 | |
Amortization of debt discount | | | | 1,207 | | | | | 1,210 | | | | | 1,270 | |
Interest rate swap (income) expense | | | | — | | | | | (15,726 | ) | | | | (3,684 | ) |
Amortization of deferred gain on terminated interest rate swap | | | | (16,708 | ) | | | | (2,785 | ) | | | | — | |
Other | | | | 445 | | | | | 538 | | | | | 456 | |
Total | | $ | | 63,836 | | | $ | | 61,282 | | | $ | | 43,964 | |
NOTE 12. Derivatives
Interest Rate Swap
In 2020, the Company entered into the Swap to manage interest rate risk associated with a portion of its floating-rate long-term debt. The Company does not purchase or hold any derivative instruments for trading or speculative purposes. Under the terms of the original Swap agreement, the Company paid interest at a fixed rate of interest on a quarterly basis and received interest at the three-month LIBOR rate in effect for that quarter.
In 2022, the Company and the Swap counterparty executed an amendment to the Swap to update LIBOR conventions to SOFR conventions and to modify the fixed rate for the change from three-month LIBOR to three-month Term SOFR effective on October 6, 2022. There was no change to the $450 million notional value, the July 1, 2026 expiration date, the quarterly payment frequency or the designated three-month maturity from the Swap Amendment. The interest rate effectively fixed by the Swap on $450 million of the Company’s outstanding term loan debt through July 1, 2026 changed from 3.215% to 3.149% as a result of the amendment to the Swap.
The Company elected to apply certain optional expedients available under ASC 848 providing relief from contract modification and hedge accounting requirements to the amendments to the Swap agreement. As a result, the Company was not required to evaluate whether the modifications to the Swap agreement resulted in the establishment of a new contract or the continuation of an existing contract and elected not to remeasure the contract at the modification date or reassess its previous accounting determination. The modified contract is accounted for, and presented as, a continuation of the existing contract. The Company also elected to change the contractual terms of the Swap without dedesignating the existing hedging relationship and redesignating a new hedging relationship.
The designation of a derivative instrument as a hedge and its ability to meet the hedge accounting criteria determine how the Company reflects the change in fair value of the derivative instrument. A derivative qualifies for hedge accounting treatment if, at inception, it meets defined correlation and effectiveness criteria. These criteria require that the anticipated cash flows and/or changes in fair value of the hedging instrument substantially offset those of the position being hedged. The Swap was assessed for effectiveness and continued qualification for hedge accounting on a quarterly basis. Since inception, the Swap was deemed to be highly effective.
The Swap was designated as a cash flow hedge. Accordingly, the Swap was measured at fair value with mark-to-market gains or losses deferred and included in AOCI, net of tax, to the extent the hedge was determined to be effective. Gains or losses from the Swap are reclassified to interest expense in the same period during which the hedged transaction affected earnings. Cash flows from the Swap are classified as operating cash flows in the Consolidated Statements of Cash Flows consistent with the classification of cash flows from the hedged transactions.
In 2023, the Company monetized the gain on the Swap and entered into an agreement to terminate the Swap ("Swap Termination Agreement"). The Swap Termination Agreement was effective on October 30, 2023. Under the Swap Termination Agreement, the Swap counterparty agreed to pay the Company $43.4 million in cash, which was comprised of the $45.8 million value of the Swap on the termination date inclusive of $1.4 million of interest receivable less $2.4 million in swap unwind costs.
As a result of the Swap Termination Agreement, the Company recorded a $44.4 million deferred gain in AOCI, before tax, replacing the $44.4 million fair value of the Swap in AOCI, before tax. The deferred gain on the Swap monetization is being amortized on a straight-line basis through July 1, 2026 and is included in interest expense and other financing costs on the Consolidated Statements of Operations. The Swap unwind costs of $2.4 million were recorded in general and administrative costs on the Consolidated Statement of Operations for the year ended December 31, 2023.
Due to the termination of the Swap, there was no amount receivable from the Swap counterparty at December 31, 2024 and 2023.
The following tables summarize the classification of the Swap in our consolidated financial statements (in thousands):
| | | | | | | | | | | | | |
| | | Year ended December 31, | |
Statements of Operations | Description | | 2024 | | | 2023 | | | 2022 | |
Interest income (expense) and other financing costs | Reclassification from AOCI – Swap income/expense | | $ | — | | | $ | 15,726 | | | $ | 3,684 | |
Interest income (expense) and other financing costs | Reclassification from AOCI – Amortization of Swap deferred gain | | | 16,708 | | | | 2,785 | | | | — | |
Total | | | $ | 16,708 | | | $ | 18,511 | | | $ | 3,684 | |
| | | | | | | | | | | | | |
| | | Year ended December 31, | |
Statements of Comprehensive Income | Description | | 2024 | | | 2023 | | | 2022 | |
Other comprehensive income (loss) | Swap income (loss), net of tax | | $ | — | | | $ | (1,970 | ) | | $ | 29,719 | |
Other comprehensive income (loss) | Amortization of deferred gain on terminated Swap, net of tax | | | (12,607 | ) | | | (2,184 | ) | | | — | |
Total | | | $ | (12,607 | ) | | $ | (4,154 | ) | | $ | 29,719 | |
NOTE 13. Equity Method Investment
In September 2020, the Company acquired, through a wholly owned subsidiary, a 15% interest voting share and income share in Alderwood and made a capital contribution to Alderwood of $1.5 million in cash. The Company also committed to contribute additional capital of $4.5 million to Alderwood and $50.0 million to a private fund to be launched by Alderwood, subject to certain terms and conditions. Alderwood’s operating entity, Alderwood Capital, was a London-based investment advisory firm focused on taking minority stakes in specialist boutique asset management businesses.
In January 2022, the Company signed an amendment to the Alderwood members’ agreement (“Alderwood Amendment”) and made an additional $1.5 million capital contribution to Alderwood. The Alderwood Amendment reduced the Company’s commitment to contribute additional capital to Alderwood from $4.5 million to $3.0 million.
In July 2022, Alderwood decided to wind down its business and operations, including the business and operations of its private fund. On July 31, 2022, the Company’s wholly owned subsidiary retired as a member of Alderwood thereby terminating the Company’s commitment to contribute an additional $3.0 million in capital to Alderwood and $50.0 million in capital to Alderwood’s private fund. Alderwood returned the $1.5 million in capital contributed to Alderwood pursuant to the Alderwood Amendment, and the Company recognized a loss on disposal of its investment in Alderwood of $0.8 million.
Given the level of ownership interest in Alderwood, an English limited liability partnership, and the fact that Alderwood maintained specific ownership accounts for investors, the Company accounted for its investment in Alderwood using the equity method of accounting.
Losses from equity method investments are recorded in interest income and other income (expense) in the Consolidated Statements of Operations. For the year ended December 31, 2022, losses from equity method investments totaled $0.8 million ($0 in 2023 and 2024). As of December 31, 2024 and 2023, the Company had no equity method investments.
NOTE 14. Equity
Equity Structure
Under the amended and restated certificate of incorporation filed by the Company on November 23, 2021, authorized capital stock consists of 600,000,000 shares of common stock, $0.01 par value per share common stock and 10,000,000 shares of “blank check” preferred stock, $0.01 par value per share. The Company currently has one class of Common Stock entitling the holder to one vote per share.
On October 11, 2024, the Company held a special meeting of its shareholders and the Company’s shareholders voted to approve an amendment of the amended and restated certificate of incorporation to increase the number of authorized shares of preferred stock, par value $0.01 per share, from 10,000,000 to 100,000,000, of which certain of such shares will be designated as Series A Non-Voting Convertible Preferred Stock pursuant to the terms and conditions of the Contribution Agreement entered into by the Company with Amundi. No shares of Preferred Stock were issued as of December 31, 2024.
Share Rollforward
The following tables present the changes in the number of shares of common stock issued and repurchased (in thousands):
| | | | | | | | | | |
| | Shares of Common Stock | | | Shares of Treasury Stock | |
Balance, December 31, 2021 | | | | 77,242 | | | | | (8,580 | ) |
Issuance of shares | | | | 11 | | | | | — | |
Repurchase of shares | | | | — | | | | | (3,034 | ) |
Vesting of restricted share grants | | | | 844 | | | | | — | |
Exercise of options | | | | 2,431 | | | | | — | |
Shares withheld related to net settlement of equity awards | | | | — | | | | | (1,589 | ) |
Balance, December 31, 2022 | | | | 80,528 | | | | | (13,203 | ) |
Issuance of shares | | | | 9 | | | | | — | |
Repurchase of shares | | | | — | | | | | (4,161 | ) |
Vesting of restricted share grants | | | | 786 | | | | | — | |
Exercise of options | | | | 1,081 | | | | | — | |
Shares withheld related to net settlement of equity awards | | | | — | | | | | (786 | ) |
Balance, December 31, 2023 | | | | 82,404 | | | | | (18,150 | ) |
Issuance of shares | | | | 7 | | | | | — | |
Repurchase of shares | | | | — | | | | | (1,403 | ) |
Vesting of restricted share grants | | | | 462 | | | | | — | |
Exercise of options | | | | 1,075 | | | | | — | |
Shares withheld related to net settlement of equity awards | | | | — | | | | | (742 | ) |
Balance, December 31, 2024 | | | | 83,948 | | | | | (20,295 | ) |
Shares Repurchased and Withheld
Share Repurchase Program
In May 2022, the Company’s’ Board of Directors approved a new share repurchase program (the “2022 Share Repurchase Program”) authorizing the repurchase of up to $100.0 million of the Company’s Common Stock. The 2022 Share Repurchase Program was completed in March 2023.
In March 2023, the Company’s Board of Directors approved a new share repurchase program (the “2023 Share Repurchase Program”) authorizing the repurchase of up to $100.0 million of the Company’s Common Stock through December 31, 2025. The 2023 Share Repurchase Program was completed in December 2023.
In December 2023, the Company’s Board of Directors approved a new share repurchase program (the “2024 Share Repurchase Program”) authorizing the repurchase of up to $100.0 million of the Company’s Common Stock through December 31, 2025. The 2024 Share Repurchase Program was completed in December 2024.
In December 2024, the Company’s Board of Directors approved a new share repurchase program (the “2025 Share Repurchase Program”) authorizing the repurchase of up to $200.0 million of the Company’s Common Stock through December 31, 2026. Under the 2025 Share Repurchase Program, which took effect in December 2024, the Company may purchase its shares from time to time in privately negotiated transactions, through block trades, pursuant to open market purchases, or pursuant to any trading plan that may be adopted in accordance with Rule 10b5-1 of the SEC. The amount and timing of purchases under the 2025 Share Repurchase Program will depend on a number of factors including the price and availability of the Company’s shares, trading volume, capital availability, Company performance and general economic and market conditions. The 2025 Share Repurchase Program can be suspended or discontinued at any time.
In 2024, the Company repurchased 1.4 million shares of Common Stock at a total cost of $95.8 million, which included $0.6 million in excise taxes payable on share repurchases, for an average price of $68.29 per share. In 2023, the Company repurchased 4.2 million shares of Common Stock at a total cost of $134.5 million, which included $1.0 million in excise taxes payable on share repurchases, for an average price of $32.33 per share. In 2022, 3.0 million shares of Common Stock were repurchased under programs authorized by the Company’s Board of Directors at a total cost of $87.3 million for an average price of $28.76 per share.
As of December 31, 2024, $200.0 million was available for future repurchases under the 2025 Share Repurchase Program, and a cumulative total of 12.7 million shares of Common Stock had been repurchased under programs authorized by the Company’s Board of Directors at a total cost of $391.6 million for an average price of $30.91 per share.
Shares Withheld for net settlement of employee equity awards
In 2024, 2023 and 2022, 0.7 million, 0.8 million and 1.6 million shares were net settled for $34.7 million, $24.4 million and $45.0 million to satisfy $26.4 million, $18.6 million and $31.2 million of employee tax obligations and $8.3 million, $5.8 million and $13.8 million of employee stock option exercise prices, respectively.
Dividend Payments
Dividends paid for the year ended December 31, 2024 totaled $101.1 million and included quarterly dividends of $100.1 million and cash bonuses and distributions related to dividends previously declared upon vesting of restricted stock and stock option awards of $1.0 million.
Dividends paid or payable for the years ended December 31, 2023 and 2022 totaled $85.4 million and $69.2 million and included quarterly dividends of $84.2 million and $68.3 million and cash bonuses and distributions related to dividends previously declared upon vesting of restricted stock and stock option awards of $1.2 million and $0.9 million, respectively.
As of December 31, 2024, 2023 and 2022, the amount of cash bonuses and distributions related to dividends previously declared on unvested and outstanding restricted share awards and stock options totaled $1.6 million, $1.2 million and $1.3 million, respectively, which was not recorded as a liability as of the balance sheet date. A liability will be recorded for these cash bonuses and dividends when the restricted shares and options vest.
NOTE 15. Share‑Based Compensation
Equity Incentive Plans
Prior to the Company’s IPO in 2018, equity-based awards were issued to executives, directors and key employees of the Company under the Victory Capital Holdings, Inc. Equity Incentive Plan (the “2013 Plan”) and the Outside Director Equity Incentive Plan (the “Director Plan”).
In connection with the IPO, the Company’s board of directors adopted, and the Company’s stockholders approved, the Victory Capital Holdings, Inc. 2018 Stock Incentive Plan (the “2018 Plan”), and the Victory Capital Holdings, Inc. 2018 Employee Stock Purchase Plan (the “ESPP Plan”), each of which became effective upon the completion of the IPO. No further grants will be made under the 2013 Plan.
The 2018 Plan authorizes the grant of non-qualified stock options, incentive stock options, restricted stock awards, restricted stock units, stock appreciation rights, performance awards and other awards that may be settled in or based upon shares of the Company’s Common Stock.
On May 8, 2024, the Company’s stockholders approved an amendment to the 2018 Plan which increased the number of shares of Common Stock, par value $0.01 per share, authorized for issuance under the 2018 Plan by 2,800,000 shares to 6,172,484 shares.
Shares of Common Stock are available for issuance under the 2018 Plan as determined by the Compensation Committee of the Company’s board of directors. Shares underlying awards that are settled in cash, expire or are canceled, forfeited or otherwise terminated without delivery to a participant will again be available for issuance under the 2018 Plan. In addition, shares withheld or surrendered in connection with the payment of an exercise price of an award or to satisfy tax withholding will again be available for issuance under the 2018 Plan. As of December 31, 2024, 3,235,372 shares of Common Stock remained available for issuance under the 2018 Plan.
The Compensation Committee of the Company’s board of directors approves the terms and conditions for offerings under the ESPP Plan. A total of 350,388 shares of Common Stock is available for issuance under the ESPP Plan. As of December 31, 2024, 302,658 shares of Common Stock remained available for issuance under the ESPP Plan.
Under the Company’s approved offerings under the ESPP Plan, shares of Common Stock are available for purchase at three month calendar intervals at a 5 percent discount from the market price on the purchase date, which is the last day of each calendar quarter during the six month offering period. Amounts purchased by an individual cannot exceed $25,000 worth of stock in any given calendar year. The ESPP Plan is a non-compensatory plan and includes no option features other than employees may change their contributions or withdraw from the plan once during each six month offering period during a specified time approved by the Company. All U.S.-based employees are eligible to participate in the ESPP.
Grant Activity
In 2024, the company issued grants for 535,797 restricted shares of Common Stock under the 2018 Plan. The 2024 grants included grants for 23,683 restricted shares of Common Stock that were fully vested on the grant date, grants for 291,334 restricted shares of Common Stock that vest over four years, grants for 94,748 restricted shares of Common Stock that vest over three years, 75,741 restricted shares of Common Stock that vest over two years, 3,466 that have a cliff vesting of two years, and 46,825 that have a cliff vesting of 21 months. No stock option awards were issued in 2024.
In 2023, the company issued grants for 539,597 restricted shares of Common Stock under the 2018 Plan. The 2023 grants included grants for 38,669 restricted shares of Common Stock that were fully vested on the grant date, grants for 24,140 restricted shares of Common Stock that vest over four years, 68,271 restricted shares of Common Stock that vest over two years, 258,908 restricted shares of Common Stock that vest over three years, 84,039 that have a cliff vesting of two years, 33,624 restricted shares that vest 33% over two years and the rest in one year, and 31,946 restricted shares that vest 67% over two years and the rest in one year. No stock option awards were issued in 2023.
In 2022, the company issued grants for 655,542 restricted shares of Common Stock under the 2018 Plan. The 2022 grants included grants for 41,587 restricted shares of Common Stock that were fully vested on the grant date, grants for 3,108 restricted shares of Common Stock that vest over 33 months, 449,113 restricted shares of Common Stock that vest over two years, 158,051 restricted shares of Common Stock that vest over three years, and 3,683 restricted shares that vest based on performance conditions. No stock option awards were issued in 2022.
The following tables presents activity during the years ended December 31, 2024, 2023, and 2022 related to stock option awards and restricted stock awards.
| | | | | | | | | | | | | | | | | | | | | | | | | | | | | | | | | | | | | | | | | | |
| | Shares Subject to Stock Option Awards | |
| | Year to Date Ended December 31, | |
| | 2024 | | | 2023 | | | 2022 | |
| | Avg wtd | | | Avg wtd | | | | | | Avg wtd | | | Avg wtd | | | | | | Avg wtd | | | Avg wtd | | | | |
| | grant-date | | | exercise | | | | | | grant-date | | | exercise | | | | | | grant-date | | | exercise | | | | |
| | fair value | | | price | | | Units | | | fair value | | | price | | | Units | | | fair value | | | price | | | Units | |
Outstanding at beginning of period | | $ | | 4.68 | | | $ | | 8.76 | | | | 1,801,853 | | | $ | | 4.31 | | | $ | | 7.57 | | | | 2,884,180 | | | $ | | 3.94 | | | $ | | 6.71 | | | | 5,315,210 | |
Forfeited | | | | 3.96 | | | | | 5.99 | | | | (6,023 | ) | | | | 6.32 | | | | | 13.84 | | | | (650 | ) | | | | 6.46 | | | | | 14.15 | | | | (451 | ) |
Exercised | | | | 4.42 | | | | | 7.99 | | | | (1,075,415 | ) | | | | 3.69 | | | | | 5.58 | | | | (1,081,677 | ) | | | | 3.51 | | | | | 5.70 | | | | (2,430,579 | ) |
Outstanding at end of the period | | $ | | 5.08 | | | $ | | 9.94 | | | | 720,415 | | | $ | | 4.68 | | | $ | | 8.76 | | | | 1,801,853 | | | $ | | 4.31 | | | $ | | 7.57 | | | | 2,884,180 | |
Vested | | $ | | 5.15 | | | $ | | 10.17 | | | | 544,217 | | | $ | | 4.66 | | | $ | | 8.71 | | | | 1,625,655 | | | $ | | 4.27 | | | $ | | 7.46 | | | | 2,707,632 | |
Unvested | | | | 4.85 | | | | | 9.23 | | | | 176,198 | | | | | 4.85 | | | | | 9.23 | | | | 176,198 | | | | | 4.85 | | | | | 9.24 | | | | 176,548 | |
Total intrinsic value of stock options exercised in 2024, 2023, and 2022 was $43.4 million, $28.5 million, and $54.9 million, respectively.
| | | | | | | | | | | | | | | | | | | | | | | | | | | |
| | Restricted Stock Awards | |
| | For Year Ended December 31, | |
| | 2024 | | | 2023 | | | 2022 | |
| | Avg wtd | | | | | | Avg wtd | | | | | | Avg wtd | | | | |
| | fair value | | | Units | | | fair value | | | Units | | | fair value | | | Units | |
Unvested at beginning of period | | $ | | 30.39 | | | | 853,748 | | | $ | | 25.38 | | | | 1,153,515 | | | $ | | 17.75 | | | | 1,352,839 | |
Granted | | | | 41.71 | | | | 535,797 | | | | | 30.25 | | | | 539,597 | | | | | 31.01 | | | | 655,542 | |
Vested | | | | 31.00 | | | | (462,268 | ) | | | | 22.96 | | | | (786,205 | ) | | | | 17.50 | | | | (844,205 | ) |
Forfeited | | | | 34.46 | | | | (16,035 | ) | | | | 29.55 | | | | (53,159 | ) | | | | 28.79 | | | | (10,661 | ) |
Unvested at end of period | | $ | | 36.67 | | | | 911,242 | | | $ | | 30.39 | | | | 853,748 | | | $ | | 25.38 | | | | 1,153,515 | |
Share‑based compensation expense for equity awards is measured at the grant date, based on the estimated fair value of the award, and recognized over the requisite employee service period. Stock option awards have a ten year contractual life.
The Company uses the Common Stock closing price on the grant date as the grant date fair value of restricted share awards. For stock option awards, the grant date fair value of stock option awards is computed using Black‑Scholes option pricing framework.
Share-based Compensation Expense
The Company recorded $15.2 million, $16.5 million and $17.8 million of share-based compensation expense related to the 2018 Plan and 2013 Plan in 2024, 2023 and 2022, respectively. Share-based compensation expense is recorded in personnel compensation and benefits in the Consolidated Statements of Operations. The related tax benefits were $3.7 million for 2024 and $4.0 million and $4.3 million for 2023 and 2022, respectively.
As of December 31, 2024, the Company expects to recognize total share-based compensation expense of $21.2 million over a weighted average period of 2.3 years. The total fair value of restricted share awards vested during the years ended December 31, 2024, 2023, and 2022 was $19.5 million, $23.1 million, and $24.2 million respectively. The aggregate intrinsic value of stock options currently exercisable at December 31, 2024, 2023 and 2022 was $30.1 million, $41.6 million and $52.4 million, respectively.
NOTE 16. LEASES
The Company determines if a contract is a lease at inception. We have leases primarily for office facilities and information technology equipment. All of our leases are classified as operating leases.
Supplemental balance sheet information related to the Company’s operating leases as of December 31, 2024 and 2023 is as follows:
| | | | | | | | |
(in thousands) | | December 31, 2024 | | | December 31, 2023 | |
Operating lease ROU assets(1) | | $ | 19,839 | | | $ | 9,665 | |
Current portion of operating lease liabilities(2) | | | 2,932 | | | | 4,675 | |
Noncurrent portion of operating lease liabilities(2) | | | 17,939 | | | | 6,487 | |
Total operating lease liabilities(3) | | $ | 20,871 | | | $ | 11,162 | |
(1)ROU assets are recorded in other assets on the Consolidated Balance Sheets.
(2)Current portion and noncurrent portion of operating lease liabilities are recorded in other liabilities on the Consolidated Balance Sheets.
(3)The increase in lease liabilities during 2024 primarily relates to our San Antonio, Texas headquarters.
| | | | | | | | |
| | December 31, 2024 | | | December 31, 2023 | |
Weighted-average remaining lease term | | 8.3 years | | | 4.0 years | |
Weighted-average discount rate | | | 6.7 | % | | | 4.7 | % |
The components of lease expense and other lease information for the years ended December 31, 2024 and 2023 are as follows:
| | | | | | | | |
| | Year Ended | | | Year Ended | |
(in thousands) | | December 31, 2024 | | | December 31, 2023 | |
Operating lease cost | | $ | 5,052 | | | $ | 5,207 | |
Short-term lease cost | | | — | | | | — | |
Variable lease cost | | | 1,671 | | | | 1,885 | |
Gross lease cost | | | 6,723 | | | | 7,092 | |
Sub-lease income | | | (604 | ) | | | (815 | ) |
Net lease cost | | $ | 6,119 | | | $ | 6,277 | |
| | | | | | |
Other lease information | | | | | | |
Cash paid for amounts included in measurement of lease liabilities | | | | | | |
Operating cash flows for operating leases | | $ | 5,517 | | | $ | 5,660 | |
In general, our leases have remaining lease terms of approximately 1 year to 12 years. These leases generally contain renewal options for periods ranging from two to five years. Because the Company is not reasonably certain to exercise these renewal options, the options are not considered in determining the lease term and associated potential option payments are excluded from lease payments. Expenses associated with operating leases are recorded in general and administrative expenses on the Consolidated Statement of Operations. Variable lease costs, such as utilities and common area maintenance charges, are excluded from lease liabilities and expensed as incurred. The variable lease costs are determined based on terms in the lease contracts and primarily relate to usage of the ROU asset and services received from the lessor.
Future undiscounted cash flows related to our operating leases and the reconciliation to operating lease liabilities as of December 31, 2024 are shown in the table below.
| | | | | |
(in thousands) | | As of December 31, 2024 | |
2025 | | $ | | 3,988 | |
2026 | | | | 3,757 | |
2027 | | | | 3,296 | |
2028 | | | | 2,759 | |
2029 | | | | 2,783 | |
Thereafter | | | | 11,596 | |
Total undiscounted lease payments | | | | 28,179 | |
Less: imputed interest | | | | 7,308 | |
Total lease liabilities | | $ | | 20,871 | |
NOTE 17. Employee Benefit Plans
The Company maintains a defined contribution 401(k) Plan (the “401(k) Plan”), covering substantially all employees who have met the eligibility requirements. The 401(k) Plan is subject to the provisions of the Employee Retirement Income Security Act of 1974 and the Economic Growth and Tax Relief Reconciliation Act of 2001. In 2024, 2023 and 2022 the Company recognized expense of $5.4 million, $5.0 million and $4.8 million in employer matched contributions, respectively.
The Company sponsors a deferred compensation plan primarily for the benefit of a select group of management or highly compensated employees (“Employee DC Plan”) as a means to reward and motivate them. The Company purchases mutual funds as directed by the plan participants to fund its related obligations. Such securities are held in a rabbi trust for the participants, and under the terms of the trust agreement, the assets of the trust are available to satisfy the claims of the Company’s general creditors in the event of bankruptcy.
The Company created a deferred compensation plan for non-employee members of our board of directors (the “Director DC Plan”). Benefits payable under the Director DC Plan are payable from the Company’s general assets. Amounts contributed under the Director DC Plan and earnings on those amounts are subject to the claims of the Company’s general creditors.
Gains and losses from fluctuations in value of deferred compensation plan investments are included in interest income and other income (expense) in the Consolidated Statements of Operations and are offset entirely by the corresponding changes in value of the deferred compensation liability. Changes in the value of the Employee DC Plan and Director DC Plan liabilities are recorded in personnel compensation and benefits and general and administrative expense, respectively, in the Consolidated Statements of Operations. Investments held under both deferred compensation plans are recorded in deferred compensation plan investments in the Consolidated Balance Sheets.
The following table presents the components of deferred compensation plan-related expense related to the Employee DC Plan.
| | | | | | | | | | | | | | | |
(in thousands) | | 2024 | | | 2023 | | | 2022 | |
Employee contributions | | $ | | 1,463 | | | $ | | 1,529 | | | $ | | 1,872 | |
Employer contributions | | | | 607 | | | | | 683 | | | | | 936 | |
Change in value of deferred compensation plan liability | | | | 2,766 | | | | | 2,754 | | | | | (2,907 | ) |
Total | | $ | | 4,836 | | | $ | | 4,966 | | | $ | | (99 | ) |
Expense related to the Director DC plan was de minimis for the years ended December 31, 2024, 2023 and 2022.
NOTE 18. Earnings Per Share
The following table sets forth the computation of basic earnings per share and diluted earnings per share for the years ended December 31, 2024, 2023 and 2022:
| | | | | | | | | | | | | | | |
| | Year Ended December 31, | |
(in thousands, except per share amounts) | | 2024 | | | 2023 | | | 2022 | |
Net income | | $ | | 288,864 | | | $ | | 213,157 | | | $ | | 275,511 | |
Shares: | | |
| | | |
| | | |
| |
Basic weighted average common shares outstanding | | | | 64,607 | | | | | 66,202 | | | | | 68,481 | |
Assumed conversion of dilutive instruments | | | | 1,321 | | | | | 2,012 | | | | | 3,785 | |
Diluted weighted average common shares outstanding | | | | 65,928 | | | | | 68,214 | | | | | 72,266 | |
Earnings per share | | | | | | | | | | | | |
Basic: | | $ | | 4.47 | | | $ | | 3.22 | | | $ | | 4.02 | |
Diluted: | | $ | | 4.38 | | | $ | | 3.12 | | | $ | | 3.81 | |
For the years ended December 31, 2024, 2023, and 2022, the number of outstanding instruments excluded from the above computations of weighted average shares for diluted earnings per share because the effects would be anti‑dilutive was de minimis. Holders of non‑vested share‑based compensation awards do not have rights to receive nonforfeitable dividends on the shares covered by the awards.
NOTE 19. Net Capital Requirements
VCS is subject to the SEC Uniform Net Capital Rule (Rule 15c3‑1 under the Exchange Act) administered by the SEC and FINRA, which requires the maintenance of minimum net capital, as defined, and requires that the ratio of aggregate indebtedness to net capital, cannot exceed 15 to 1. Net capital and the related net capital requirement may fluctuate on a daily basis.
At December 31, 2024, VCS had net capital under the Rule 15c3‑1 of $1.2 million, which was $1.1 million in excess of its minimum required net capital of $0.1 million. At December 31, 2023, VCS had net capital under the Rule 15c3‑1 of $0.4 million, which was $0.3 million in excess of its minimum required net capital of $0.1 million. The Company's ratio of aggregate indebtedness to net capital as of December 31, 2024 and 2023 was 1.66 to 1 and 5.15 to 1, respectively.
Capital requirements may limit the amount of cash available for dividend from VCS to the parent company. VCS's cash and cash equivalents are generally not available for corporate purposes.
NOTE 20. Accumulated Other Comprehensive INCOME (Loss)
The following table presents changes in accumulated other comprehensive income (loss) by component for the years ending December 31, 2024, 2023, and 2022.
| | | | | | | | | | | | | | | |
| | Cash Flow | | | Cumulative | | | | | |
| | Hedges | | | Translation | | | | | |
(in thousands) | | (1)(2) | | | Adjustment | | | Total | |
Balance, December 31, 2021 | | | | 5,895 | | | | | 77 | | | | | 5,972 | |
Other comprehensive income (loss) before reclassification and tax | | | | 42,842 | | | | | (331 | ) | | | | 42,511 | |
Tax impact | | | | (10,327 | ) | | | | 82 | | | | | (10,245 | ) |
Reclassification adjustments, before tax | | | | (3,684 | ) | | | | — | | | | | (3,684 | ) |
Tax impact | | | | 888 | | | | | — | | | | | 888 | |
Net current period other comprehensive income (loss) | | | | 29,719 | | | | | (249 | ) | | | | 29,470 | |
Balance, December 31, 2022 | | | | 35,614 | | | | | (172 | ) | | | | 35,442 | |
Other comprehensive income (loss) before reclassification and tax | | | | 13,214 | | | | | 54 | | | | | 13,268 | |
Tax impact | | | | (2,850 | ) | | | | (14 | ) | | | | (2,864 | ) |
Reclassification adjustments, before tax(3) | | | | (18,511 | ) | | | | — | | | | | (18,511 | ) |
Tax impact | | | | 3,993 | | | | | — | | | | | 3,993 | |
Net current period other comprehensive income (loss) | | | | (4,154 | ) | | | | 40 | | | | | (4,114 | ) |
Balance, December 31, 2023 | | $ | | 31,460 | | | $ | | (132 | ) | | $ | | 31,328 | |
Other comprehensive income (loss) before reclassification and tax | | | | — | | | | | (50 | ) | | | | (50 | ) |
Tax impact | | | | — | | | | | 12 | | | | | 12 | |
Reclassification adjustments, before tax | | | | (16,708 | ) | | | | — | | | | | (16,708 | ) |
Tax impact | | | | 4,101 | | | | | — | | | | | 4,101 | |
Net current period other comprehensive income (loss) | | | | (12,607 | ) | | | | (38 | ) | | | | (12,645 | ) |
Balance, December 31, 2024 | | $ | | 18,853 | | | $ | | (170 | ) | | $ | | 18,683 | |
(1)Reclassifications out of AOCI(L) related to cash flow hedges are recorded in interest expense and other financing costs
(2)On October 30, 2023, the Company terminated the Swap. The termination resulted in a $44.4 million deferred gain recorded in AOCI, before tax, and the elimination of the unrealized gain on cash flow hedge recorded in AOCI prior to the termination. The deferred gain is being amortization a straight-line basis over the remaining term of the hedged debt (through July 1, 2026). Please refer to Note 12, Derivatives, for further information on the monetization of the interest rate swap gain.
(3)Reclassification adjustments, before tax, includes $15,726 of income reclassified out of AOCI prior to the termination of the Swap and $2,785 of amortization of deferred gain following the termination of the Swap.
NOTE 21. SEGMENT REPORTING
ASU 2023-07, which is based on a management approach to segment reporting, establishes requirements to report segment revenue and significant expenses reported in Net income, the primary measurement used in evaluating segment performance. Since the Company operates and reports in one segment, all financial segment information required by ASU 2023-07 can be found in the consolidated financial statements.
The Company provides investment management services and products to institutional, intermediary, retirement platforms and individual investors. The presentation of financial results as one reportable segment is consistent with the way discrete financial information is available that is regularly provided to our Chief Executive Officer, the CODM. When making decisions about allocating resources, assessing performance, and understanding how our long-term organic revenue growth is driven by investment decisions our CODM considers the impact on consolidated, entity-wide performance and financial results.
Supplemental information related to significant segment expenses included the Consolidated Statements of Operations is as follows:
| | | | | | | | | | | | | | | |
| | Year Ended December 31, | |
(in thousands) | | 2024 | | | 2023 | | | 2022 | |
Salaries, payroll related taxes and employee benefits | | $ | | 88,599 | | | $ | | 90,884 | | | $ | | 87,819 | |
Incentive compensation | | | | 102,712 | | | | | 87,081 | | | | | 94,511 | |
Sales-based compensation(1) | | | | 24,338 | | | | | 20,945 | | | | | 27,589 | |
Equity awards granted to employees and directors(2) | | | | 15,220 | | | | | 16,548 | | | | | 17,816 | |
Acquisition and transaction-related compensation | | | | (13,655 | ) | | | | 5,534 | | | | | 10,463 | |
Total personnel compensation and benefits expense | | $ | | 217,214 | | | $ | | 220,992 | | | $ | | 238,198 | |
| | | | | | | | | | | | | | | |
| | Year Ended December 31, | |
(in thousands) | | 2024 | | | 2023 | | | 2022 | |
Broker-dealer distribution fees | | $ | | 20,222 | | | $ | | 20,275 | | | $ | | 22,703 | |
Platform distribution fees | | | | 89,233 | | | | | 92,509 | | | | | 98,155 | |
Sub-administration | | | | 17,010 | | | | | 15,877 | | | | | 16,261 | |
Sub-advisory | | | | 9,152 | | | | | 10,576 | | | | | 13,573 | |
Middle-office | | | | 10,872 | | | | | 10,359 | | | | | 10,413 | |
Total distribution and other asset-based expenses | | $ | | 146,489 | | | $ | | 149,596 | | | $ | | 161,105 | |
(4)Represents sales-based commissions paid to our distribution teams. Sales-based compensation varies based on gross and net client cash flows and revenue earned on sales.
(5)Share-based compensation typically vests over several years based on service and the achievement of specific business and financial targets. The value of share-based compensation is recognized as compensation expense over the vesting period.
Substantially all of the Company’s identifiable assets are located in the United States. In addition, we have historically derived substantially all of our revenue from clients in the United States.
NOTE 22. Subsequent Events
On February 6, 2025, our Board of Directors declared a quarterly cash dividend of $0.47 per share on Victory common stock. The dividend is payable on March 10, 2025, to stockholders of record on February 18, 2025.
Report of Independent Registered Public Accounting Firm
To the Stockholders and the Board of Directors of Victory Capital Holdings, Inc.
Opinion on the Financial Statements
We have audited the accompanying consolidated balance sheets of Victory Capital Holdings, Inc. and subsidiaries (the Company) as of December 31, 2024 and 2023, the related consolidated statements of operations, comprehensive income (loss), changes in stockholders’ equity and cash flows for each of the three years in the period ended December 31, 2024, and the related notes (collectively referred to as the “consolidated financial statements”). In our opinion, the consolidated financial statements present fairly, in all material respects, the financial position of the Company at December 31, 2024 and 2023, and the results of its operations and its cash flows for each of the three years in the period ended December 31, 2024, in conformity with U.S. generally accepted accounting principles.
We also have audited, in accordance with the standards of the Public Company Accounting Oversight Board (United States) (PCAOB), the Company's internal control over financial reporting as of December 31, 2024, based on criteria established in Internal Control—Integrated Framework issued by the Committee of Sponsoring Organizations of the Treadway Commission (2013 framework), and our report dated February 28, 2025 expressed an unqualified opinion thereon.
Basis for Opinion
These financial statements are the responsibility of the Company’s management. Our responsibility is to express an opinion on the Company’s financial statements based on our audits. We are a public accounting firm registered with the PCAOB and are required to be independent with respect to the Company in accordance with the U.S. federal securities laws and the applicable rules and regulations of the Securities and Exchange Commission and the PCAOB.
We conducted our audits in accordance with the standards of the PCAOB. Those standards require that we plan and perform the audit to obtain reasonable assurance about whether the financial statements are free of material misstatement, whether due to error or fraud. Our audits included performing procedures to assess the risks of material misstatement of the financial statements, whether due to error or fraud, and performing procedures that respond to those risks. Such procedures included examining, on a test basis, evidence regarding the amounts and disclosures in the financial statements. Our audits also included evaluating the accounting principles used and significant estimates made by management, as well as evaluating the overall presentation of the financial statements. We believe that our audits provide a reasonable basis for our opinion.
Critical Audit Matter
The critical audit matter communicated below is a matter arising from the current period audit of the financial statements that was communicated or required to be communicated to the audit committee and that: (1) relates to accounts or disclosures that are material to the financial statements and (2) involved our especially challenging, subjective or complex judgments. The communication of the critical audit matter does not alter in any way our opinion on the consolidated financial statements, taken as a whole, and we are not, by communicating the critical audit matter below, providing a separate opinion on the critical audit matter or on the account or disclosure to which it relates.
| | |
|
| Valuation of Consideration Payable for Acquisition of Business |
Description of the Matter |
| At December 31, 2024, the fair value of the consideration payable for acquisition of business due to the sellers of WestEnd Advisors, LLC (“WestEnd”) was $139.9 million. Changes in the fair value of the payable result in a gain or loss during the period and the Company recorded the change in fair value of $2.7 million as change in value of consideration payable for acquisition of business on the consolidated statement of |
| | |
|
| operations as a loss for the year ended December 31, 2024. This consideration payable for acquisition of business resulted from the acquisition of WestEnd on December 31, 2021, and is based on net revenue of the WestEnd business during a 4 year period subsequent to December 31, 2021 and subject to certain catch up provisions over a five and one half year period following December 31, 2021. As more fully described in Notes 4 and 5 to the consolidated financial statements, the Company estimates the fair value of the future expected contingent payments using the real options method, and the significant assumptions are the net revenue 5 year average annual growth rate, market price of risk adjustment for revenue (continuous), revenue volatility and discount rates for the WestEnd investment franchise. Auditing the fair value of the consideration payable for acquisition of business was complex due to the significant estimation uncertainty in determining the fair value, and the complexity of the valuation model used. The significant estimation uncertainty was primarily due to the sensitivity and highly subjective nature of the significant assumptions described above, which are affected by future economic and market conditions and thus require significant judgement, and the inherent complexity of the valuation model. |
How We Addressed the Matter in Our Audit |
| We obtained an understanding, evaluated the design and tested the operating effectiveness of controls over the Company’s development of the significant assumptions and process to estimate the fair value of the consideration payable for acquisition of business. This included testing controls over management’s review of the significant assumptions and methods used to develop the fair value estimate, the accuracy of the calculations included within the valuation model, and the underlying data used in the valuation model. To test the valuation of the consideration payable for acquisition of business, our audit procedures included, among others, evaluating the methodology used, the significant assumptions discussed above used to develop the net future revenue projections and testing the completeness and accuracy of the underlying data used by the Company. For example, we evaluated management’s assumptions by comparing them to current industry, market and economic trends, and historical results of the Company's business and other guideline companies within the same industry. We also tested the clerical accuracy of the net revenue projection calculations. To evaluate the valuation methodology used by management’s specialist, we involved our valuation specialists to assist in developing an independent range of the fair value of the consideration payable for acquisition of business. We also performed a sensitivity analysis of the key assumptions to evaluate the change in the fair value of the consideration payable for acquisition of business resulting from changes in the assumptions. |
/s/ Ernst & Young LLP
We have served as the Company’s auditor since 2013.
Cleveland, Ohio
February 28, 2025
Report of Independent Registered Public Accounting Firm
To the Stockholders and the Board of Directors of Victory Capital Holdings, Inc.
Opinion on Internal Control Over Financial Reporting
We have audited Victory Capital Holdings, Inc. and subsidiaries’ internal control over financial reporting as of December 31, 2024, based on criteria established in Internal Control—Integrated Framework issued by the Committee of Sponsoring Organizations of the Treadway Commission (2013 framework) (the COSO criteria). In our opinion, Victory Capital Holdings, Inc. and subsidiaries (the Company) maintained, in all material respects, effective internal control over financial reporting as of December 31, 2024, based on the COSO criteria.
We also have audited, in accordance with the standards of the Public Company Accounting Oversight Board (United States) (PCAOB), the consolidated balance sheets of the Company as of December 31, 2024 and 2023, the related consolidated statements of operations, comprehensive income(loss), changes in stockholders’ equity and cash flows for each of the three years in the period ended December 31, 2024, and the related notes and our report dated February 28, 2025 expressed an unqualified opinion thereon.
Basis for Opinion
The Company’s management is responsible for maintaining effective internal control over financial reporting and for its assessment of the effectiveness of internal control over financial reporting included in the accompanying Management’s Report on Internal Control over Financial Reporting. Our responsibility is to express an opinion on the Company’s internal control over financial reporting based on our audit. We are a public accounting firm registered with the PCAOB and are required to be independent with respect to the Company in accordance with the U.S. federal securities laws and the applicable rules and regulations of the Securities and Exchange Commission and the PCAOB.
We conducted our audit in accordance with the standards of the PCAOB. Those standards require that we plan and perform the audit to obtain reasonable assurance about whether effective internal control over financial reporting was maintained in all material respects.
Our audit included obtaining an understanding of internal control over financial reporting, assessing the risk that a material weakness exists, testing and evaluating the design and operating effectiveness of internal control based on the assessed risk, and performing such other procedures as we considered necessary in the circumstances. We believe that our audit provides a reasonable basis for our opinion.
Definition and Limitations of Internal Control Over Financial Reporting
A company’s internal control over financial reporting is a process designed to provide reasonable assurance regarding the reliability of financial reporting and the preparation of financial statements for external purposes in accordance with generally accepted accounting principles. A company’s internal control over financial reporting includes those policies and procedures that (1) pertain to the maintenance of records that, in reasonable detail, accurately and fairly reflect the transactions and dispositions of the assets of the company; (2) provide reasonable assurance that transactions are recorded as necessary to permit preparation of financial statements in accordance with generally accepted accounting principles, and that receipts and expenditures of the company are being made only in accordance with authorizations of management and directors of the company; and (3) provide reasonable assurance regarding prevention or timely detection of unauthorized acquisition, use, or disposition of the company’s assets that could have a material effect on the financial statements.
Because of its inherent limitations, internal control over financial reporting may not prevent or detect misstatements. Also, projections of any evaluation of effectiveness to future periods are subject to the risk that controls may become inadequate because of changes in conditions, or that the degree of compliance with the policies or procedures may deteriorate.
/s/ Ernst & Young LLP
Cleveland, Ohio
February 28, 2025
Item 9. Changes in and Disagreements With Accountants on Accounting and Financial Disclosure.
None
Item 9A. Controls and Procedures.
Evaluation of Disclosure Controls and Procedures
Regulations under the Exchange Act require public companies, including us, to maintain “disclosure controls and procedures,” which are defined in Rule 13a-15(e) and Rule 15d-15(e) to mean a company’s controls and other procedures that are designed to ensure that information required to be disclosed in the reports that it files or submits under the Exchange Act is recorded, processed, summarized and reported, within the time periods specified in the SEC’s rules and forms. Disclosure controls and procedures include, without limitation, controls and procedures designed to ensure that information required to be disclosed in our reports filed under the Exchange Act is accumulated and communicated to management, including our principal executive officer and principal financial officer or persons performing similar functions, as appropriate to allow timely decisions regarding required or necessary disclosures.
In designing and evaluating our disclosure controls and procedures, management recognizes that disclosure controls and procedures, no matter how well conceived and operated, can provide only reasonable, not absolute, assurance that the objectives of the disclosure controls and procedures are met. Additionally, in designing disclosure controls and procedures, our management necessarily was required to apply its judgment in evaluating the cost benefit relationship of possible disclosure controls and procedures.
Based on the evaluation of the effectiveness of the disclosure controls and procedures by our management as of December 31, 2024, our chief executive officer and chief financial officer have concluded that, as of such date, our disclosure controls and procedures were effective at the reasonable assurance level.
Management’s Report on Internal Control over Financial Reporting
Our management is responsible for establishing and maintaining adequate internal control over financial reporting as defined in Rule 13a-15(f) and 15d-15(f) under the Exchange Act. Under the supervision of our management, including our chief executive officer and chief financial officer, we conducted an evaluation of the effectiveness of our internal control over financial reporting as of December 31, 2024 using the criteria established in Internal Control—Integrated Framework (2013) issued by the Committee of Sponsoring Organizations of the Treadway Commission, or COSO. Based on our evaluation under the COSO framework, our management concluded that our internal control over financial reporting is effective as of December 31, 2024 to provide reasonable assurance regarding the reliability of financial reporting and the preparation of financial statements for external purposes in accordance with generally accepted accounting principles.
Our independent auditor, Ernst & Young LLP, an independent registered public accounting firm, has issued an audit report on the effectiveness of our internal control over financial reporting which appears in Item 8 of this Annual Report.
Changes in Internal Control over Financial Reporting
Regulations under the Exchange Act require public companies, including our company, to evaluate any change in our “internal control over financial reporting” as such term is defined in Rule 13a‑15(f) and Rule 15d‑15(f) of the Exchange Act. In connection with their evaluation of our disclosure controls and procedures, our chief executive officer and chief financial officer did not identify any change in our internal control over financial reporting during the most recent fiscal quarter that materially affected, or is reasonably likely to materially affect, our internal control over financial reporting.
Item 9B. Other Information.
During the quarter ended December 31, 2024, none of the Company’s directors or officers adopted, modified or terminated a Rule 10b5-1 trading arrangement or a non-Rule 10b5-1 trading arrangement, as such terms are defined under Item 408(a) of Regulation S-K.
PART III
Item 10. Directors, Executive Officers and Corporate Governance.
Insider Trading Policy. Victory has adopted an Insider Trading Policy (the “Trading Policy) that applies to all designated executive officers, directors, and employees of Victory. The Trading Policy is designed to promote compliance with insider trading laws, rules and regulations with respect to the purchase, sale and/or other dispositions of Victory’s securities, as well as the applicable rules and regulations of NASDAQ. The Trading Policy addresses the implementation of certain blackout periods in Victory’s s’ securities (including common stock, debt, options and other related derivative securities) for covered persons. A copy of the Trading Blackout Policy is filed as an exhibit to this Annual Report.
The other information required by this Item is set forth in our definitive proxy statement required to be filed pursuant to Regulation 14A for the 2025 annual meeting of shareholders.
Item 11. Executive Compensation.
The information required by this Item is set forth in our definitive proxy statement required to be filed pursuant to Regulation 14A for the 2025 annual meeting of shareholders.
Item 12. Security Ownership of Certain Beneficial Owners and Management and Related Shareholder Matters.
The information required by this Item is set forth in our definitive proxy statement required to be filed pursuant to Regulation 14A for the 2025 annual meeting of shareholders.
Item 13. Certain Relationships and Related Transactions, and Director Independence.
The information required by this Item is set forth in our definitive proxy statement required to be filed pursuant to Regulation 14A for the 2025 annual meeting of shareholders.
Item 14. Principal Accountant Fees and Services.
The information required by this Item is set forth in our definitive proxy statement required to be filed pursuant to Regulation 14A for the 2025 annual meeting of shareholders.
PART IV
Item 15. Exhibits, Financial Statement Schedules.
(1)Financial Statements: The information required by this Item is contained in Item 8 of Part II of this report.
(2)Financial Statement Schedules: None
(3)Exhibits: See Exhibit Index
Item 16. Form 10‑K Summary.
None
EXHIBIT INDEX
| | |
Exhibit No. |
| Description |
3.1 | | Amended and Restated Certificate of Incorporation of the Registrant (Filed as Exhibit 3.1 to the Company’s Report on Form S-1/A, File No. 333-222509, dated February 6, 2018, and incorporated herein by reference). |
| | |
3.2 | | Amended and Restated Bylaws of the Registrant (Filed as Exhibit 3.2 to the Company’s Report on Form S-1/A, File No. 333-222509, dated February 6, 2018, and incorporated herein by reference). |
| | |
3.3 | | Second Amended and Restated Certificate of Incorporation of the Registrant (Filed as Exhibit 3.1 to the Company’s Report on Form 8-K, File No. 001-38388, dated November 23, 2021, and incorporated herein by reference). |
| | |
4.1 | | Form of Class A common stock certificate (Filed as Exhibit 4.1 to the Company’s Report on Form S-1/A, File No. 333-222509, dated February 6, 2018, and incorporated herein by reference). |
| | |
4.2 | | Form of Class B common stock certificate (Filed as Exhibit 4.2 to the Company’s Report on Form S-1/A, File No. 333-222509, dated February 6, 2018, and incorporated herein by reference). |
| | |
4.3 | | Second Amended and Restated Shareholders’ Agreement, dated as of February 12, 2018 (Filed as Exhibit 4.3 to the Company’s Report on Form S-1/A, File No. 333-222509, dated February 6, 2018, and incorporated herein by reference). |
| | |
4.4 | | Employee Shareholders’ Agreement, dated as of February 12, 2018 (Filed as Exhibit 4.4 to the Company’s Report on Form S-1/A, File No. 333-222509, dated February 6, 2018, and incorporated herein by reference). |
| | |
4.5 | | Description of the Registrant’s Securities Registered Pursuant to Section 12 of the Securities Exchange Act of 1934 (filed as Exhibit 4.5 to the Company’s Report on Form 10-K, File No. 001-38388, on March 13, 2020, and incorporated herein by reference). |
| | |
10.1 | | Form of Indemnification Agreement (Filed as Exhibit 10.1 to the Company’s Report on Form S-1/A, File No. 333-222509, dated February 6, 2018, and incorporated herein by reference). |
| | |
10.2+ | | Form of Victory Capital Holdings, Inc. 2018 Stock Incentive Plan (Filed as Exhibit 10.2 to the Company’s Report on Form S-1/A, File No. 333-222509, dated February 6, 2018, and incorporated herein by reference). |
| | |
10.3 | | Form of Victory Capital Holdings, Inc. 2018 Employee Stock Purchase Plan (Filed as Exhibit 10.3 to the Company’s Report on Form S-1/A, File No. 333-222509, dated February 6, 2018, and incorporated herein by reference). |
| | |
| | |
10.4+ | | Victory Capital Holdings, Inc. Equity Incentive Plan (Filed as Exhibit 10.4 to the Company’s Report on Form S-1/A, File No. 333-222509, dated February 6, 2018, and incorporated herein by reference). |
| | |
10.5+ | | Amendment No. 1 to the Victory Capital Holdings, Inc. Equity Incentive Plan (Filed as Exhibit 10.5 to the Company’s Report on Form S-1/A, File No. 333-222509, dated February 6, 2018, and incorporated herein by reference). |
| | |
10.6+ | | Amendment No. 2 to the Victory Capital Holdings, Inc. Equity Incentive Plan (Filed as Exhibit 10.6 to the Company’s Report on Form S-1/A, File No. 333-222509, dated February 6, 2018, and incorporated herein by reference). |
| | |
10.7+ | | Amendment No. 3 to the Victory Capital Holdings, Inc. Equity Incentive Plan (Filed as Exhibit 10.7 to the Company’s Report on Form S-1/A, File No. 333-222509, dated February 6, 2018, and incorporated herein by reference). |
| | |
10.8+ | | Amendment No. 4 to the Victory Capital Holdings, Inc. Equity Incentive Plan (Filed as Exhibit 10.8 to the Company’s Report on Form S-1/A, File No. 333-222509, dated February 6, 2018, and incorporated herein by reference). |
| | |
10.9+ | | Victory Capital Management Inc. Severance Pay Plan and Summary Plan Description (Filed as Exhibit 10.9 to the Company’s Report on Form S-1/A, File No. 333-222509, dated February 6, 2018, and incorporated herein by reference). |
| | |
10.10+ | | Victory Capital Holdings, Inc. Bonus Plan (Filed as Exhibit 10.10 to the Company’s Report on Form S-1/A, File No. 333-222509, dated February 6, 2018, and incorporated herein by reference). |
| | |
10.11+ | | Victory Capital Management Inc. Deferred Compensation Plan (Filed as Exhibit 10.11 to the Company’s Report on Form S-1/A, File No. 333-222509, dated February 6, 2018, and incorporated herein by reference). |
| | |
10.12+ | | First Amendment to the Victory Capital Management Inc. Deferred Compensation Plan (Filed as Exhibit 10.12 to the Company’s Report on Form S-1/A, File No. 333-222509, dated February 6, 2018, and incorporated herein by reference). |
| | |
10.13+ | | First Addendum to the Victory Capital Management Inc. Deferred Compensation Plan (Filed as Exhibit 10.13 to the Company’s Report on Form S-1/A, File No. 333-222509, dated February 6, 2018, and incorporated herein by reference). |
| | |
10.14+ | | Second Amendment to the Victory Capital Management Inc. Deferred Compensation Plan (Filed as Exhibit 10.14 to the Company’s Report on Form S-1/A, File No. 333-222509, dated February 6, 2018, and incorporated herein by reference). |
| | |
10.15+ | | Form of Stock Option Grant Notice under the Victory Capital Holdings, Inc. Equity Incentive Plan (Filed as Exhibit 10.15 to the Company’s Report on Form S-1/A, File No. 333-222509, dated February 6, 2018, and incorporated herein by reference). |
| | |
10.16+ | | Form of Restricted Shares Grant Notice under the Victory Capital Holdings, Inc. Equity Incentive Plan (Filed as Exhibit 10.16 to the Company’s Report on Form S-1/A, File No. 333-222509, dated February 6, 2018, and incorporated herein by reference). |
| | |
10.17+ | | Form of Stock Option Grant Notice under the Victory Capital Holdings, Inc. 2018 Equity Incentive Plan (Filed as Exhibit 10.17 to the Company’s Report on Form S-1/A, File No. 333-222509, dated February 6, 2018, and incorporated herein by reference). |
| | |
10.18+ | | Form of Restricted Shares Grant Notice under the Victory Capital Holdings, Inc. 2018 Equity Incentive Plan (Filed as Exhibit 10.18 to the Company’s Report on Form S-1/A, File No. 333-222509, dated February 6, 2018, and incorporated herein by reference). |
| | |
10.19 | | Credit Agreement, dated as of February 12, 2018, among Victory Capital Holdings, Inc., as borrower, the lenders from time to time party thereto and Royal Bank of Canada, as |
| | |
| | administrative agent and collateral agent (Filed as Exhibit 10.1 to the Company’s Report on Form 8-K, File No. 001-38388, dated February 15, 2018, and incorporated herein by reference). |
| | |
10.20 | | Amendment No. 1 to Credit Agreement, dated as of May 3, 2018 among, inter alios, the Company, the other loan parties party thereto, the lenders party thereto and Royal Bank of Canada, in its capacities as administrative agent and collateral agent for the secured parties (in such capacities, the “Administrative Agent”), which amends the Credit Agreement, dated as of February 12, 2018 among the Company, the lenders from time to time party thereto and the Administrative Agent (Filed as Exhibit 10.1 to the Company’s Report on Form 8-K, File No. 001-38388, dated May 8, 2018, and incorporated herein by reference). |
| | |
10.21+ | | Employment Agreement by and between Victory Capital Holdings, Inc. and David C. Brown, dated as of March 20, 2017 (Filed as Exhibit 10.26 to the Company’s Report on Form S-1/A, File No. 333-222509, dated February 6, 2018, and incorporated herein by reference). |
| | |
10.23 | | Amended and Restated Commitment Letter, dated as of September 24, 2018, by and among Royal Bank of Canada, Barclays Bank PLC and Victory Capital Holdings, Inc. (Filed as Exhibit 10.1 to the Company’s Report on Form 8-K, File No. 001-38388, dated September 27, 2018, and incorporated herein by reference). |
| | |
10.24 | | Stock Purchase Agreement, dated November 6, 2018, by and among the Company, USAA Investment Corporation and, for certain limited purposes, USAA Capital Corporation (Filed as Exhibit 2.1 to the Company’s Report on Form 8-K, File No. 001-38388, dated November 6, 2018, and incorporated herein by reference). |
| | |
10.25 | | Commitment Letter, dated as of November 6, 2018, by and among Barclays Bank PLC, Royal Bank of Canada, and Victory Capital Holdings, Inc. (Filed as Exhibit 10.1 to the Company’s Report on Form 8-K, File No. 001-38388, dated November 6, 2018, and incorporated herein by reference) |
| | |
10.27 | | Amendment No. 1 to the Stock Purchase Agreement with USAA Investment Corporation and USAA Capital Corporation, dated as of June 28, 2019 (filed as Exhibit 2.2 to the Company’s Report on Form 8-K, File No. 001-38388, on July 1, 2019, and incorporated herein by reference). |
| | |
10.28 | | 2019 Credit Agreement among the Company, the lenders from time to time party thereto and Barclays Bank PLC, dated as of July 1, 2019 (filed as Exhibit 10.1 to the Company’s Report on Form 8-K, File No. 001-38388, on July 1, 2019, and incorporated herein by reference). |
| | |
10.29+ | | Third Amendment to the Victory Capital Management Inc. Deferred Compensation Plan, dated as of July 29, 2019 (filed as Exhibit 10.3 to the Company’s Report on Form 10-Q, File No. 001-38388, on August 13, 2019, and incorporated herein by reference). |
| | |
10.30+ | | Amendment and Restatement of the Victory Capital Management Inc. Deferred Compensation Plan, dated as of November 13, 2019 (filed as Exhibit 10.3 to the Company’s Report on Form 10-Q, File No. 001-38388, on November 13, 2019, and incorporated herein by reference). |
| | |
10.31+ | | Amendment and Restatement of the Victory Capital Management Inc. Deferred Compensation Plan, dated as of March 11, 2020 (filed as Exhibit 10.31 to the Company’s Report on Form 10-K, File No. 001-38388, on March 13, 2020, and incorporated herein by reference). |
| | |
10.32+ | | Victory Capital Management Inc. Director Deferred Compensation Plan dated as of December 12, 2019 (filed as Exhibit 10.31 to the Company’s Report on Form 10-K, File No. 001-38388, on March 13, 2020, and incorporated herein by reference). |
| | |
10.33 | | Second Amendment to the 2019 Credit Agreement dated as of February 18, 2021 (filed as Exhibit 10.1 to the Company’s Report on Form 8-K, File No. 001-38388, on February 18, 2021, and incorporated herein by reference). |
| | |
10.34 | | Victory Capital Management Inc. Director Deferred Compensation Plan dated as of December 12, 2019 (filed as Exhibit 10.31 to the Company’s Report on Form 10-K, File No. 001-38388, on March 13, 2020, and incorporated herein by reference). |
| | |
| | |
10.35 | | Underwriting Agreement dated as of November 17, 2021 (Filed as Exhibit 1.1 to the Company’s Report on Form 8-K, File No. 001-38388, dated November 22, 2021, and incorporated herein by reference). |
| | |
10.36 | | Unit Purchase Agreement, dated as of November 4, 2021, by and among the company, WestEnd Advisors, LLC, and the other parties listed thereto (filed as Exhibit 2.1 on Form 10-Q, File No. 001-38388, on November 8, 2021, and incorporated herein by reference). |
| | |
10.37 | | Third Amendment to the 2019 Credit Agreement dated as of December 31, 2021 (filed as Exhibit 10.1 to the Company’s Report on Form 8-K, File No. 001-38388, on January 5, 2022, and incorporated herein by reference). |
| | |
10.38 | | Fourth Amendment to the 2019 Credit Agreement dated as of September 23, 2022 (filed as Exhibit 10.38 to the Company’s Report on Form 10-K, File No. 001-38388, on March 6, 2023, and incorporated herein by reference). |
| | |
10.39 | | Fifth Amendment to the 2019 Credit Agreement dated as of June 7, 2024 (filed as Exhibit 10.1 to the Company’s Report on Form 10-K, File No. 001-38388, on June 13, 2024, and incorporated herein by reference). |
| | |
10.40+ | | Amendment of the Victory Capital Management Inc. Deferred Compensation Plan, dated as of November 19, 2024 (filed herewith). |
| | |
19.1 | | Victory Capital Holdings, Inc. Insider Trading Policy, Effective July 12, 2023 (filed herewith). |
| | |
21.1* | | List of Subsidiaries |
| | |
23.1* | | Consent of Ernst & Young LLP |
| | |
31.1* | | Certification of the Principal Executive Officer pursuant to Section 302 of the Sarbanes‑Oxley |
| | |
31.2* | | Certification of the Principal Financial Officer pursuant to Section 302 of the Sarbanes‑Oxley |
| | |
32.1** | | Certification of Principal Executive Officer pursuant to 18 U.S.C. Section 1350, as adopted pursuant to Section 906 of the Sarbanes‑Oxley Act of 2002 |
| | |
32.2** | | Certification of Principal Financial Officer pursuant to 18 U.S.C. Section 1350, as adopted pursuant to Section 906 of the Sarbanes‑Oxley Act of 2002 |
| | |
97 | | Victory Capital Holdings, Inc. Compensation Clawback Policy, Effective October 26, 2023 (filed as Exhibit 97 to the Company's Report on Form 10-K, File No. 001-38388, on February 29, 2024). |
| | |
101* | | The following information formatted in iXBRL (Inline eXtensible Business Reporting Language): (i) Audited Consolidated Balance Sheets as of December 31, 2024 and 2023, (ii) Audited Consolidated Statements of Operations for the years ended December 31, 2024, 2023 and 2022, (iii) Audited Consolidated Statements of Comprehensive Income for the years ended December 31, 2024, 2023 and 2022, (iv) Audited Consolidated Statements of Cash Flows for the years ended December 31, 2024, 2023 and 2022, (v) Audited Consolidated Statements of Changes in Stockholders’ Equity for the years ended December 31, 2024, 2023 and 2022 and (vi) Notes to the Audited Consolidated Financial Statements. |
| | |
104* | | Cover Page Interactive Data File (embedded within the Inline XBRL document) |
* Filed herewith
** Furnished herewith
+ This exhibit is a management contract or compensatory plan or arrangement.
SIGNATURES
Pursuant to the requirements of Section 13 or 15(d) of the Securities Exchange Act of 1934, the registrant has duly caused this report to be signed on its behalf by the undersigned, thereunto duly authorized on this 28th day of February, 2025.
| | | |
| VICTORY CAPITAL HOLDINGS, INC. |
| | | |
| By: | | /s/ DAVID C. BROWN |
| Name: | | David C. Brown |
| Title: | | Chief Executive Officer and Chairman |
Pursuant to the requirements of the Securities Exchange Act of 1934, this report has been signed by the following persons in the capacities and on the dates indicated.
| | | | |
| | | | |
Signature |
| Title |
| Date |
| | | | |
/s/ DAVID C. BROWN David C. Brown | | Chief Executive Officer and Chairman (Principal Executive Officer) | | February 28, 2025 |
| | | | |
/s/ MICHAEL D. POLICARPO Michael D. Policarpo | | President, Chief Financial Officer and Chief Administrative Officer (Principal Financial Officer and Principal Accounting Officer) | | February 28, 2025 |
| | | | |
/s/ ROBERT DELANEY Robert Delaney | | Director | | February 28, 2025 |
| | | | |
/s/ LAWRENCE DAVANZO Lawrence Davanzo | | Director | | February 28, 2025 |
| | | | |
/s/ RICHARD M. DEMARTINI Richard M. DeMartini | | Director | | February 28, 2025 |
| | | | |
/s/ ROBERT J. HURST Robert J. Hurst | | Director | | February 28, 2025 |
| | | | |
/s/ KARIN HIRTLER‑GARVEY Karin Hirtler‑Garvey | | Director | | February 28, 2025 |
| | | | |
/s/ MARY JACKSON Mary Jackson | | Director | | February 28, 2025 |
| | | | |
/s/ ALAN H. RAPPAPORT Alan H. Rappaport | | Director | | February 28, 2025 |