Table of Contents
Filed Pursuant to Rule 424(b)(3)
Registration No. 333-194872
Prospectus Supplement No. 1
(to Prospectus dated April 10, 2014)

SUMMIT MATERIALS, LLC
SUMMIT MATERIALS FINANCE CORP.
Offer to Exchange (the “exchange offer”)
$260,000,000 aggregate principal amount of 10.5% Senior Notes due 2020 (the “exchange notes”), which have been registered under the Securities Act of 1933, as amended, for any and all outstanding unregistered 10.5% Senior Notes due 2020 issued on January 17, 2014.
This Prospectus Supplement No. 1, dated May 13, 2014 (this “Supplement”), is being filed to update, amend and supplement the information previously included in our prospectus, dated April 10, 2014 (the “Prospectus”), with the information contained in the Form 10-Qs filed with the Securities and Exchange Commission (the “SEC”) on May 13, 2014 by each of Summit Materials, LLC and Continental Cement Company, L.L.C. (each, a “Report”). Any document, exhibit or information contained in the Reports that has been deemed furnished and not filed in accordance with SEC rules shall not be included in this Supplement. We have attached each of the Reports to this Supplement. This Supplement is not complete without, and may not be delivered or used except in connection with, the Prospectus, including all amendments and supplements thereto.
You should carefully consider the “Risk Factors” beginning on page 18 of the Prospectus, as supplemented, before participating in the exchange offer.
Neither the SEC nor any state securities commission has approved or disapproved of the exchange notes to be distributed in the exchange offer or passed upon the accuracy or adequacy of this prospectus. Any representation to the contrary is a criminal offense.
Table of Contents
UNITED STATES
SECURITIES AND EXCHANGE COMMISSION
Washington, D.C. 20549
FORM 10-Q
(Mark One)
| x | QUARTERLY REPORT PURSUANT TO SECTION 13 OR 15(d) OF THE SECURITIES EXCHANGE ACT OF 1934 |
For the quarterly period ended March 29, 2014
OR
| ¨ | TRANSITION REPORT PURSUANT TO SECTION 13 OR 15(d) OF THE SECURITIES EXCHANGE ACT OF 1934 |
For the transition period from to
Commission file number 333-187556
SUMMIT MATERIALS, LLC
(Exact name of registrant as specified in its charter)
| Delaware | 26-4138486 | |
(State or other jurisdiction of incorporation or organization) | (I.R.S. Employer Identification No.) | |
1550 Wynkoop Street, 3rd Floor Denver, Colorado | 80202 | |
| (Address of principal executive offices) | (Zip Code) | |
Registrant’s telephone number, including area code: (303) 893-0012
Indicate by check mark whether the registrant (1) has filed all reports required to be filed by Section 13 or 15(d) of the Securities Exchange Act of 1934 during the preceding 12 months (or for such shorter period that the registrant was required to file such reports), and (2) has been subject to such filing requirements for the past 90 days. Yes x No ¨
Indicate by check mark whether the registrant has submitted electronically and posted on its corporate Web site, if any, every Interactive Data File required to be submitted and posted pursuant to Rule 405 of Regulation S-T (§232.405 of this chapter) during the preceding 12 months (or for such shorter period that the registrant was required to submit and post such files). Yes x No ¨
Indicate by check mark whether the registrant is a large accelerated filer, an accelerated filer, a non-accelerated filer, or a smaller reporting company. See the definitions of “large accelerated filer,” “accelerated filer” and “smaller reporting company” in Rule 12b-2 of the Exchange Act.
| Large accelerated filer | ¨ | Accelerated filer | ¨ | |||
| Non-accelerated filer | x (Do not check if a smaller reporting company) | Smaller reporting company | ¨ | |||
Indicate by check mark whether the registrant is a shell company (as defined in Rule 12b-2 of the Exchange Act). Yes ¨ No x
As of May 12, 2014, 100% of the registrant’s outstanding limited liability company interests were held by Summit Materials Intermediate Holdings, LLC.
Table of Contents
CAUTIONARY NOTE REGARDING FORWARD-LOOKING STATEMENTS
This quarterly report on Form 10-Q (this “report”) includes “forward-looking statements” within the meaning of the federal securities laws, which involve risks and uncertainties. Forward-looking statements include all statements that do not relate solely to historical or current facts, and you can identify forward-looking statements because they contain words such as “believes,” “expects,” “may,” “will,” “should,” “seeks,” “intends,” “trends,” “plans,” “estimates,” “projects” or “anticipates” or similar expressions that concern our strategy, plans, expectations or intentions. All statements made relating to our estimated and projected earnings, margins, costs, expenditures, cash flows, growth rates and financial results are forward-looking statements. These forward-looking statements are subject to risks, uncertainties and other factors that may cause our actual results, performance or achievements to be materially different from future results, performance or achievements expressed or implied by such forward-looking statements. We derive many of our forward-looking statements from our operating budgets and forecasts, which are based upon many detailed assumptions. While we believe that our assumptions are reasonable, it is very difficult to predict the effect of known factors, and, of course, it is impossible to anticipate all factors that could affect our actual results. In light of the significant uncertainties inherent in the forward-looking statements included herein, the inclusion of such information should not be regarded as a representation by us or any other person that the results or conditions described in such statements or our objectives and plans will be realized. Important factors could affect our results and could cause results to differ materially from those expressed in our forward-looking statements, including but not limited to the factors discussed in the section entitled “Risk Factors” in our Annual Report on Form 10-K for the fiscal year ended December 28, 2013 (the “Form 10-K”), as filed with the Securities and Exchange Commission (the “SEC”), any factors discussed in the section entitled “Risk Factors” of this report, and the following:
| • | our substantial current level of indebtedness; |
| • | our dependence on the construction industry and the strength of the local economies in which we operate; |
| • | our ability to execute on our acquisition strategy, successfully integrate acquisitions with our existing operations and retain key employees of such acquired businesses; |
| • | the cyclical nature of our business; |
| • | declines in public infrastructure construction and reductions in governmental funding, including the funding by transportation authorities and other state agencies; |
| • | conditions in the credit markets; |
| • | our ability to accurately estimate the overall risks, requirements or costs when we bid on or negotiate contracts that are ultimately awarded to us; |
| • | risks related to weather and seasonality; |
| • | competition within our local markets; |
| • | our dependence on securing and permitting aggregate reserves in strategically located areas; |
| • | risks associated with our capital-intensive business; |
| • | any failure to meet schedule or performance requirements of our contracts; |
| • | changes in environmental, health, safety and climate change laws or governmental requirements or policies concerning zoning and land use; |
| • | our dependence on senior management and inability to attract and retain qualified management personnel; |
| • | special hazards related to our operations that may cause personal injury or property damage not covered by insurance; |
| • | material costs and losses as a result of claims that our products do not meet regulatory requirements or contractual specifications; |
| • | cancellation of significant contracts or our disqualification from bidding for new contracts; |
| • | our reliance on exemptions from certain disclosure requirements due to our status as an “emerging growth company”; |
| • | interruptions in our information technology systems and infrastructure; and |
| • | other factors as described in the Form 10-K. |
All subsequent written and oral forward-looking statements attributable to us, or persons acting on our behalf, are expressly qualified in their entirety by these cautionary statements.
Any forward-looking statement that we make speaks only as of the date of this report. We undertake no obligation to publicly update or revise any forward-looking statement as a result of new information, future events or otherwise, except as otherwise required by law.
1
Table of Contents
As used in this report, unless otherwise noted or the context otherwise requires,
| • | “we,” “our,” “us,” and the “Company” refer to Summit Materials, LLC and its subsidiaries as a combined entity; |
| • | “Summit Materials” refers only to Summit Materials, LLC and not its subsidiaries; |
| • | “Finance Corp” refers only to Summit Materials Finance Corp., a wholly-owned subsidiary of Summit Materials; |
| • | “Sponsors” refers to certain investment funds affiliated with Blackstone Capital Partners V L.P. and Silverhawk Summit, L.P.; |
| • | “Lafarge” refers to Lafarge North America, Inc.; |
| • | “Westroc” refers to Westroc, LLC; and |
| • | “Alleyton” refers collectively to Alleyton Resource Company, LLC, Alcomat, LLC and Alleyton Services Company, LLC, formerly Alleyton Resource Corporation, Colorado Gulf, LP and certain assets of Barten Shepard Investments, LP. |
2
Table of Contents
SUMMIT MATERIALS, LLC
FORM 10-Q
| Page No. | ||||||
| PART I — Financial Information | ||||||
| Item 1. | 4 | |||||
Consolidated Balance Sheets as of March 29, 2014 (Unaudited) and December 28, 2013 | 4 | |||||
| 5 | ||||||
| 6 | ||||||
| 7 | ||||||
| 8 | ||||||
| 9 | ||||||
| Item 2. | Management’s Discussion and Analysis of Financial Condition and Results of Operations | 25 | ||||
| Item 3. | 37 | |||||
| Item 4. | 37 | |||||
| PART II — Other Information | ||||||
| Item 1. | 38 | |||||
| Item 1A. | 38 | |||||
| Item 2. | 38 | |||||
| Item 3. | 38 | |||||
| Item 4. | 38 | |||||
| Item 5. | 38 | |||||
| Item 6. | 38 | |||||
| SIGNATURES | 40 | |||||
Table of Contents
| ITEM 1. | FINANCIAL STATEMENTS |
SUMMIT MATERIALS, LLC AND SUBSIDIARIES
(In thousands)
| March 29, | December 28, | |||||||
| 2014 | 2013 | |||||||
| (unaudited) | (audited) | |||||||
| Assets | ||||||||
Current assets: | ||||||||
Cash | $ | 34,135 | $ | 14,917 | ||||
Accounts receivable, net | 95,747 | 99,337 | ||||||
Costs and estimated earnings in excess of billings | 12,372 | 10,767 | ||||||
Inventories | 113,248 | 96,432 | ||||||
Other current assets | 11,191 | 13,181 | ||||||
|
|
|
| |||||
Total current assets | 266,693 | 234,634 | ||||||
Property, plant and equipment, less accumulated depreciation, depletion and amortization | 891,211 | 831,778 | ||||||
Goodwill | 271,948 | 127,038 | ||||||
Intangible assets, less accumulated amortization (March 29, 2014 - $2,341 and December 28, 2013 - $2,192) | 15,166 | 15,147 | ||||||
Other assets | 45,900 | 39,197 | ||||||
|
|
|
| |||||
Total assets | $ | 1,490,918 | $ | 1,247,794 | ||||
|
|
|
| |||||
| Liabilities, Redeemable Noncontrolling Interest and Member’s Interest | ||||||||
Current liabilities: | ||||||||
Current portion of debt | $ | 4,220 | $ | 30,220 | ||||
Current portion of acquisition-related liabilities | 14,428 | 10,635 | ||||||
Accounts payable | 67,100 | 72,104 | ||||||
Accrued expenses | 61,378 | 57,251 | ||||||
Billings in excess of costs and estimated earnings | 6,535 | 9,263 | ||||||
|
|
|
| |||||
Total current liabilities | 153,661 | 179,473 | ||||||
Long-term debt | 939,983 | 658,767 | ||||||
Acquisition-related liabilities | 42,034 | 23,756 | ||||||
Other noncurrent liabilities | 74,256 | 77,480 | ||||||
|
|
|
| |||||
Total liabilities | 1,209,934 | 939,476 | ||||||
|
|
|
| |||||
Commitments and contingencies (see note 9) | ||||||||
Redeemable noncontrolling interest | 25,137 | 24,767 | ||||||
Member’s interest: | ||||||||
Member’s equity | 511,812 | 486,896 | ||||||
Accumulated deficit | (251,635 | ) | (198,511 | ) | ||||
Accumulated other comprehensive loss | (5,472 | ) | (6,045 | ) | ||||
|
|
|
| |||||
Member’s interest | 254,705 | 282,340 | ||||||
Noncontrolling interest | 1,142 | 1,211 | ||||||
|
|
|
| |||||
Total member’s interest | 255,847 | 283,551 | ||||||
|
|
|
| |||||
Total liabilities, redeemable noncontrolling interest and member’s interest | $ | 1,490,918 | $ | 1,247,794 | ||||
|
|
|
| |||||
See notes to unaudited consolidated financial statements.
4
Table of Contents
SUMMIT MATERIALS, LLC AND SUBSIDIARIES
Unaudited Consolidated Statements of Operations
(In thousands)
| Three Months Ended | ||||||||
| March 29, | March 30, | |||||||
| 2014 | 2013 | |||||||
Revenue: | ||||||||
Product | $ | 103,961 | $ | 68,140 | ||||
Service | 47,130 | 38,689 | ||||||
|
|
|
| |||||
Total revenue | 151,091 | 106,829 | ||||||
|
|
|
| |||||
Cost of revenue (excluding items shown separately below): | ||||||||
Product | 89,019 | 65,972 | ||||||
Service | 39,656 | 30,101 | ||||||
|
|
|
| |||||
Total cost of revenue | 128,675 | 96,073 | ||||||
|
|
|
| |||||
General and administrative expenses | 35,488 | 34,003 | ||||||
Depreciation, depletion, amortization and accretion | 19,356 | 17,131 | ||||||
Transaction costs | 2,591 | 1,482 | ||||||
|
|
|
| |||||
Operating loss | (35,019 | ) | (41,860 | ) | ||||
Other (income) expense, net | (194 | ) | 433 | |||||
Loss on debt financings | — | 3,115 | ||||||
Interest expense | 18,819 | 13,367 | ||||||
|
|
|
| |||||
Loss from continuing operations before taxes | (53,644 | ) | (58,775 | ) | ||||
Income tax benefit | (596 | ) | (2,621 | ) | ||||
|
|
|
| |||||
Loss from continuing operations | (53,048 | ) | (56,154 | ) | ||||
Loss from discontinued operations | 20 | 123 | ||||||
|
|
|
| |||||
Net loss | (53,068 | ) | (56,277 | ) | ||||
Net loss attributable to noncontrolling interest | (2,515 | ) | (3,456 | ) | ||||
|
|
|
| |||||
Net loss attributable to member of Summit Materials, LLC | $ | (50,553 | ) | $ | (52,821 | ) | ||
|
|
|
| |||||
See notes to unaudited consolidated financial statements.
5
Table of Contents
SUMMIT MATERIALS, LLC AND SUBSIDIARIES
Unaudited Consolidated Statements of Comprehensive Loss
(In thousands)
| Three Months Ended | ||||||||
| March 29, | March 30, | |||||||
| 2014 | 2013 | |||||||
Net loss | $ | (53,068 | ) | $ | (56,277 | ) | ||
Other comprehensive (loss) income: | ||||||||
Postretirement curtailment adjustment | (1,346 | ) | — | |||||
Postretirement liability adjustment | 2,164 | — | ||||||
|
|
|
| |||||
Other comprehensive income | 818 | — | ||||||
|
|
|
| |||||
Comprehensive loss | (52,250 | ) | (56,277 | ) | ||||
Less comprehensive loss attributable to the noncontrolling interest | (2,270 | ) | (3,456 | ) | ||||
|
|
|
| |||||
Comprehensive loss attributable to member of Summit Materials, LLC | $ | (49,980 | ) | $ | (52,821 | ) | ||
|
|
|
| |||||
See notes to unaudited consolidated financial statements.
6
Table of Contents
SUMMIT MATERIALS, LLC AND SUBSIDIARIES
Unaudited Consolidated Statements of Cash Flows
(In thousands)
| Three months ended | ||||||||
| March 29, | March 30, | |||||||
| 2014 | 2013 | |||||||
Cash flow from operating activities: | ||||||||
Net loss | $ | (53,068 | ) | $ | (56,277 | ) | ||
Adjustments to reconcile net loss to net cash used in operating activities: | ||||||||
Depreciation, depletion, amortization and accretion | 20,479 | 17,738 | ||||||
Financing fee amortization | 310 | 796 | ||||||
Share-based compensation expense | 566 | 542 | ||||||
Deferred income tax benefit | (525 | ) | (515 | ) | ||||
Net (gain) loss on asset disposals | (48 | ) | 870 | |||||
Loss on debt financings | — | 2,990 | ||||||
Other | 558 | 687 | ||||||
Decrease (increase) in operating assets, net of acquisitions: | ||||||||
Account receivable | 16,989 | 32,557 | ||||||
Inventories | (13,377 | ) | (10,499 | ) | ||||
Costs and estimated earnings in excess of billings | (839 | ) | 145 | |||||
Other current assets | 9 | (2,110 | ) | |||||
Other assets | 3,202 | 626 | ||||||
(Decrease) increase in operating liabilities, net of acquisitions: | ||||||||
Accounts payable | (10,239 | ) | (16,688 | ) | ||||
Accrued expenses | (9,620 | ) | (14,328 | ) | ||||
Billings in excess of costs and estimated earnings | (2,728 | ) | (1,313 | ) | ||||
Other liabilities | (2,044 | ) | (1,117 | ) | ||||
|
|
|
| |||||
Net cash used for operating activities | (50,375 | ) | (45,896 | ) | ||||
|
|
|
| |||||
Cash flow from investing activities: | ||||||||
Acquisitions, net of cash acquired | (182,514 | ) | — | |||||
Purchases of property, plant and equipment | (19,941 | ) | (16,405 | ) | ||||
Proceeds from the sale of property, plant and equipment | 2,202 | 5,859 | ||||||
Other | 7 | — | ||||||
|
|
|
| |||||
Net cash used for investing activities | (200,246 | ) | (10,546 | ) | ||||
|
|
|
| |||||
Cash flow from financing activities: | ||||||||
Proceeds from investment by member | 24,350 | — | ||||||
Proceeds from debt issuances | 306,750 | 154,181 | ||||||
Payments on long-term debt | (54,314 | ) | (51,390 | ) | ||||
Payments on acquisition-related liabilities | (638 | ) | (1,585 | ) | ||||
Financing costs | (6,309 | ) | (2,221 | ) | ||||
|
|
|
| |||||
Net cash provided by financing activities | 269,839 | 98,985 | ||||||
|
|
|
| |||||
Net increase in cash | 19,218 | 42,543 | ||||||
Cash – beginning of period | 14,917 | 27,431 | ||||||
|
|
|
| |||||
Cash – end of period | $ | 34,135 | $ | 69,974 | ||||
|
|
|
| |||||
See notes to unaudited consolidated financial statements.
7
Table of Contents
SUMMIT MATERIALS, LLC AND SUBSIDIARIES
Unaudited Consolidated Statements of Changes in Redeemable Noncontrolling Interest and Member’s Interest
(In thousands)
| Total Member’s Interest | ||||||||||||||||||||||||
| Member’s equity | Accumulated deficit | Accumulated other comprehensive loss | Noncontrolling interest | Total member’s interest | Redeemable noncontrolling interest | |||||||||||||||||||
Balance — December 28, 2013 | $ | 486,896 | $ | (198,511 | ) | $ | (6,045 | ) | $ | 1,211 | $ | 283,551 | $ | 24,767 | �� | |||||||||
Contributed capital | 24,350 | — | — | — | 24,350 | — | ||||||||||||||||||
Accretion/ redemption value adjustment | — | (2,571 | ) | — | — | (2,571 | ) | 2,571 | ||||||||||||||||
Net loss | — | (50,553 | ) | — | (69 | ) | (50,622 | ) | (2,446 | ) | ||||||||||||||
Other comprehensive income | — | — | 573 | — | 573 | 245 | ||||||||||||||||||
Share-based compensation | 566 | — | — | — | 566 | — | ||||||||||||||||||
|
|
|
|
|
|
|
|
|
|
|
| |||||||||||||
Balance — March 29, 2014 | $ | 511,812 | $ | (251,635 | ) | $ | (5,472 | ) | $ | 1,142 | $ | 255,847 | $ | 25,137 | ||||||||||
|
|
|
|
|
|
|
|
|
|
|
| |||||||||||||
Balance — December 29, 2012 | $ | 484,584 | $ | (94,085 | ) | $ | (9,130 | ) | $ | 1,059 | $ | 382,428 | $ | 22,850 | ||||||||||
Accretion | — | (150 | ) | — | — | (150 | ) | 150 | ||||||||||||||||
Redemption value adjustment | — | (3,369 | ) | — | �� | — | (3,369 | ) | 3,369 | |||||||||||||||
Net loss | — | (52,821 | ) | — | (87 | ) | (52,908 | ) | (3,369 | ) | ||||||||||||||
Share-based compensation | 542 | — | — | — | 542 | — | ||||||||||||||||||
|
|
|
|
|
|
|
|
|
|
|
| |||||||||||||
Balance — March 30, 2013 | $ | 485,126 | $ | (150,425 | ) | $ | (9,130 | ) | $ | 972 | $ | 326,543 | $ | 23,000 | ||||||||||
|
|
|
|
|
|
|
|
|
|
|
| |||||||||||||
See notes to unaudited consolidated financial statements.
8
Table of Contents
SUMMIT MATERIALS, LLC
NOTES TO UNAUDITED CONSOLIDATED FINANCIAL STATEMENTS
(Tables in thousands)
| 1. | SUMMARY OF ORGANIZATION AND SIGNIFICANT ACCOUNTING POLICIES |
Summit Materials, LLC (“Summit Materials”) is a vertically integrated heavy-side building materials company. Across its subsidiaries, it is engaged in the production and sale of aggregates, cement, ready-mixed concrete, hot-mix asphalt and concrete products. Summit Materials, through its subsidiaries (collectively, the “Company”), owns and operates quarries, sand and gravel pits, a cement plant, cement distribution terminals, ready–mixed concrete plants, asphalt plants and landfill sites. It is also engaged in road paving and related construction services. The Company is organized by geographic region and has three operating segments, which are also its reporting segments: the Central; West; and East regions.
Summit Materials is a wholly owned indirect subsidiary of Summit Materials Holdings L.P., whose major indirect owners are certain investment funds affiliated with Blackstone Capital Partners V L.P. (“BCP”) and Silverhawk Summit, L.P.
The consolidated financial statements of the Company include the accounts of Summit Materials and its wholly and non-wholly owned subsidiaries. All significant intercompany balances and transactions have been eliminated.
Basis of Presentation— These consolidated financial statements were prepared in accordance with U.S. generally accepted accounting principles (“GAAP”) for interim financial information, without audit, pursuant to the rules and regulations of the Securities and Exchange Commission. Certain information and footnote disclosures normally included in financial statements prepared in accordance with GAAP have been condensed or omitted pursuant to such rules and regulations. These unaudited consolidated financial statements should be read in conjunction with the Company’s audited consolidated financial statements and the notes thereto as of and for the year ended December 28, 2013. The Company continues to follow the accounting policies set forth in those consolidated financial statements. Management believes that these consolidated interim financial statements include all adjustments, normal and recurring in nature, that are necessary to present fairly the financial position of the Company as of March 29, 2014 and the results of operations and cash flows for the three month periods ended March 29, 2014 and March 30, 2013.
The Company’s fiscal quarters are based on a 4-4-5 schedule; each quarter is composed of 13 weeks and ends on a Saturday. The Company’s first quarter ended on March 29 and March 30 in 2014 and 2013, respectively. In 2013, Continental Cement Company, L.L.C. (“Continental Cement”), an indirect majority owned subsidiary of Summit Materials, changed its fiscal year to be consistent with the Company’s fiscal year. Prior to fiscal 2013, Continental Cement’s fiscal year was based on the calendar year with quarter-end dates of March 31, June 30, September 30 and December 31. The effect of this change to the Company’s financial position, results of operations and liquidity is immaterial.
Substantially all of the Company’s products and services are produced, consumed and performed outdoors, primarily in the spring, summer and fall. Seasonal changes and other weather-related conditions can affect the production and sales volumes of its products and delivery of its services. Therefore, the financial results for any interim period are not necessarily indicative of the results expected for the full year. Furthermore, the Company’s sales and earnings are sensitive to national, regional and local economic conditions and to cyclical changes in construction spending, among other factors.
Use of Estimates— Preparation of these consolidated financial statements in conformity with GAAP requires management to make estimates and assumptions. These estimates and the underlying assumptions affect the amounts of assets and liabilities reported, disclosures about contingent assets and liabilities and reported amounts of revenue and expenses. Such estimates include the valuation of accounts receivable, inventories, goodwill, intangibles and other long-lived assets, pension and other postretirement obligations and asset retirement obligations. Estimates also include revenue earned on contracts and costs to complete contracts; most of the Company’s construction work is performed under fixed unit-price contracts with state and local governmental entities. Management evaluates its estimates and assumptions on an ongoing basis using historical experience and other factors, including the current economic environment. Management adjusts such estimates and assumptions when circumstances dictate. As future events and their effects cannot be determined with precision, actual results can differ significantly from estimates made. Changes in estimates, including those resulting from continuing changes in the economic environment, are reflected in the Company’s consolidated financial statements during the period in which the change in estimate occurs.
Business and Credit Concentrations— The operations of the Company are conducted primarily across 16 states, with the most significant revenue generated in Texas, Kansas, Kentucky, Utah and Missouri. The Company’s accounts receivable consist primarily of amounts due from customers within these areas. Collection of these accounts is, therefore, dependent on the economic conditions in the aforementioned states, as well as specific situations affecting individual customers. However, credit granted within the Company’s trade areas has been granted to many customers, and management does not believe that any significant concentrations of credit exist with respect to individual customers or groups of customers. No single customer accounted for more than 10% of total revenue in the three month periods ended March 29, 2014 or March 30, 2013.
9
Table of Contents
Fair Value Measurements— Certain acquisitions made by the Company require the payment of contingent amounts of purchase consideration. These payments are contingent on specified operating results being achieved in periods subsequent to the acquisition and will not be made if earn-out thresholds are not achieved. Contingent consideration obligations are measured at fair value each reporting period, and any adjustments to fair value are recognized in earnings in the period identified. As of March 29, 2014 and December 28, 2013, contingent consideration obligations of $5.5 million and $1.9 million were included in the non-current portion of acquisition-related liabilities and $0.5 million included in the current portion of acquisition related liabilities as of March 29, 2014. The $4.1 million increase in contingent consideration obligations relates to the January 17, 2014 acquisition of Alleyton Resource Corporation, Colorado Gulf, LP and certain assets of Barten Shepard Investments, LP, (collectively, “Alleyton”).
The fair value of the contingent consideration obligations approximated their carrying value of $6.4 million and $1.9 million as of March 29, 2014 and December 28, 2013, respectively. The fair values are based on unobservable, or Level 3, inputs, including projected probability-weighted cash payments and an 11.0% discount rate, which reflects a market discount rate. Changes in fair value may occur as a result of a change in actual or projected cash payments, the probability weightings applied by the Company to projected payments or a change in the discount rate. Significant increases or decreases in any of these inputs in isolation could result in a lower, or higher, fair value measurement. There were no material valuation adjustments to contingent consideration obligations in the three month periods ended March 29, 2014 or March 30, 2013.
Financial Instruments— The Company’s financial instruments include certain acquisition-related liabilities (deferred consideration and noncompete obligations) and debt. The fair value of the deferred consideration and noncompete obligations approximate their carrying value of $42.8 million and $7.6 million, respectively, as of March 29, 2014, and $28.3 million and $4.2 million, respectively, as of December 28, 2013. The $17.9 million increase in the deferred consideration and noncompete obligations primarily relate to the January 17, 2014 acquisition of Alleyton. The fair value was determined based on unobservable, or Level 3 inputs, including the cash payment terms in the purchase agreements and a discount rate reflecting the Company’s credit risk.
The fair value of long-term debt approximated $996.4 million and $696.5 million as of March 29, 2014 and December 28, 2013, respectively, compared to its carrying value of $944.2 million and $663.0 million, respectively. Fair value was determined based on observable, or Level 2 inputs, such as interest rates, bond yields and quoted prices in inactive markets.
Redeemable Noncontrolling Interest— The Company owns all of the outstanding Class A Units of Continental Cement, which represent a 69.7% economic interest. Continental Cement’s Class B Units, which represent a 30.3% economic interest, are subordinate to the Class A Units. The Class B Units can be put to Continental Cement in the future based on the passage of time, which can be accelerated upon the occurrence of a contingent event; therefore, the noncontrolling interest of the Class B unit holders is classified in temporary equity. The redemption value was based upon the estimated fair value of Continental Cement at the date of acquisition and the Company has elected to accrete changes in the redemption value of the noncontrolling interest over the period from the date of issuance to the earliest anticipated redemption date, which is currently May 2016. The accretion is recognized through an adjustment to accumulated deficit. The redemption value of the redeemable noncontrolling interest as of March 29, 2014 and December 28, 2013 approximated its carrying value.
| 2. | ACQUISITIONS |
2014 Acquisitions
West region
| • | On January 17, 2014, the Company acquired all of the membership interests of Alleyton Resource Corporation, Colorado Gulf, LP and certain assets of Barten Shepard Investments, LP, an aggregates and ready-mixed concrete business in Houston, Texas. The Alleyton acquisition was funded with a portion of the proceeds from the January 17, 2014 issue and sale of $260.0 million aggregate principal amount of 10.5% senior notes due 2020. The Alleyton acquisition expands our growing presence in the Texas market. The purchase price allocation for the Alleyton acquisition has not been finalized due to the recent timing of the acquisition. |
2013 Acquisitions
Central region
| • | On April 1, 2013, the Company acquired certain aggregates, ready-mixed concrete and asphalt assets of Lafarge North America, Inc. in and around Wichita, Kansas, with borrowings under the Company’s revolving credit facility. |
10
Table of Contents
West region
| • | On April 1, 2013, the Company acquired all of the membership interests of Westroc, LLC, an aggregates and ready-mixed concrete provider near Salt Lake City, Utah, with borrowings under the Company’s revolving credit facility. |
The operating results of the acquired businesses have been included in the Company’s results of operations since the respective dates of the acquisitions. Assets acquired and liabilities assumed are measured at their acquisition-date fair value. The goodwill recognized in connection with the Company’s acquisitions is primarily attributable to the expected profitability, assembled workforces and operational infrastructure of the acquired businesses and the synergies expected to result after integration of those acquired businesses. The 2014 acquisition and the 2013 acquisitions were not material individually or in the aggregate.
| 3. | GOODWILL |
Changes in the carrying amount of goodwill, by reportable segment, from December 28, 2013 to March 29, 2014 are summarized as follows:
| Central | West | Total | ||||||||||
Balance, December 28, 2013 | $ | 72,789 | $ | 54,249 | $ | 127,038 | ||||||
Acquisitions | — | 144,910 | 144,910 | |||||||||
|
|
|
|
|
| |||||||
Balance, March 29, 2014 | $ | 72,789 | $ | 199,159 | $ | 271,948 | ||||||
|
|
|
|
|
| |||||||
| 4. | DISCONTINUED OPERATIONS |
The Company’s discontinued operations include certain concrete paving operations. The concrete paving operations were wound down in the second quarter of 2013 and the sale of the related assets was completed in the three months ended March 29, 2014. Prior to recognition as discontinued operations, this business was included in the East region’s operations.
Debt and interest expense were not allocated to discontinued operations since there was no debt specifically attributable to the operations. The concrete paving operations were organized within a limited liability company, which passes its tax attributes for federal and state tax purposes to its parent company. Revenue and loss before income tax expense included in discontinued operations for the three month periods ended March 29, 2014 and March 30, 2013 are summarized below:
| Three Months Ended | ||||||||
| March 29, | March 30, | |||||||
| 2014 | 2013 | |||||||
Revenue | $ | 323 | $ | 3,501 | ||||
Loss from discontinued operations before income tax expense | 20 | 123 | ||||||
11
Table of Contents
| 5. | ACCOUNTS RECEIVABLE, NET |
Accounts receivable, net consists of the following as of March 29, 2014 and December 28, 2013:
| March 29, | December 28, | |||||||
| 2014 | 2013 | |||||||
Trade accounts receivable | $ | 82,738 | $ | 85,188 | ||||
Retention receivables | 13,925 | 15,966 | ||||||
Receivables from related parties | 1,342 | 202 | ||||||
|
|
|
| |||||
Accounts receivable | 98,005 | 101,356 | ||||||
Less: Allowance for doubtful accounts | (2,258 | ) | (2,019 | ) | ||||
|
|
|
| |||||
Accounts receivable, net | $ | 95,747 | $ | 99,337 | ||||
|
|
|
| |||||
Retention receivables are amounts earned by the Company but held by customers until construction contracts and projects are near completion or fully completed. Amounts are expected to be billed and collected within a year.
| 6. | INVENTORIES |
Inventories consist of the following as of March 29, 2014 and December 28, 2013:
| March 29, | December 28, | |||||||
| 2014 | 2013 | |||||||
Aggregate stockpiles | $ | 74,609 | $ | 70,300 | ||||
Finished goods | 13,780 | 11,207 | ||||||
Work in process | 4,880 | 2,623 | ||||||
Raw materials | 19,979 | 12,302 | ||||||
|
|
|
| |||||
Total | $ | 113,248 | $ | 96,432 | ||||
|
|
|
| |||||
| 7. | DEBT |
Debt consists of the following as of March 29, 2014 and December 28, 2013:
| March 29, | December 28, | |||||||
| 2014 | 2013 | |||||||
Revolver | $ | — | $ | 26,000 | ||||
|
|
|
| |||||
Long-term debt: | ||||||||
$510.0 million senior notes, including an $18.1 million net premium at March 29, 2014 and $250 million senior notes, net of $4.0 million discount at December 28, 2013 | 528,097 | 245,971 | ||||||
$418.8 million credit facility, term loan, net of $2.7 million and $2.9 million discount at March 29, 2014 and December 28, 2013, respectively | 416,106 | 417,016 | ||||||
|
|
|
| |||||
Total | 944,203 | 662,987 | ||||||
Current portion of long-term debt | 4,220 | 4,220 | ||||||
|
|
|
| |||||
Long-term debt | $ | 939,983 | $ | 658,767 | ||||
|
|
|
| |||||
12
Table of Contents
The contractual payments of long-term debt, including current maturities, for the five years subsequent to March 29, 2014, are as follows:
2014 (nine months) | $ | 3,165 | ||
2015 | 4,220 | |||
2016 | 5,275 | |||
2017 | 4,220 | |||
2018 | 3,165 | |||
2019 | 398,790 | |||
Thereafter | 510,000 | |||
|
| |||
Total | 928,835 | |||
Plus: Original issue net premium | 15,368 | |||
|
| |||
Total debt | $ | 944,203 | ||
|
|
Senior Notes—Summit Materials and its wholly-owned subsidiary, Summit Materials Finance Corp. (“Finance Corp.” and, together with Summit Materials, the “Issuers”), are co-issuers of the 10.5% Senior Notes due January 31, 2020 (the “Senior Notes”) that have been issued under an indenture dated as of January 30, 2012 (as amended and supplemented, the “Indenture”). The Senior Notes bear interest at 10.5% per year, payable semi-annually in arrears. The Indenture contains covenants limiting, among other things, the ability of Summit Materials and its restricted subsidiaries to incur additional indebtedness or issue certain preferred shares, pay dividends, redeem stock or make other distributions, make certain investments, sell or transfer certain assets, create liens, consolidate, merge, sell or otherwise dispose of all or substantially all of Summit Materials’ assets, enter into certain transactions with affiliates, and designate subsidiaries as unrestricted subsidiaries. The Indenture also contains customary events of default.
The Issuers issued $250.0 million aggregate principal amount of Senior Notes (the “Existing Notes”) in January 2012. On January 17, 2014, the Issuers issued an additional $260.0 million aggregate principal amount of Senior Notes (the “Additional Notes”), receiving proceeds of $282.8 million, before payment of fees and expenses and including a $22.8 million premium. The proceeds from the sale of the Additional Notes were used for the purchase of Alleyton, to make payments on the Company’s Revolver (discussed and defined below) and for general corporate purposes. The Additional Notes are treated as a single series with the Existing Notes and have substantially the same terms as those of the Existing Notes. The Additional Notes and the Existing Notes vote as one class under the Indenture.
Credit Facility— The Company has a senior secured credit facility (the “Credit Facility”) providing for term loans in an aggregate amount of $422.0 million (the “Term Debt”) and revolving credit commitments in an aggregate amount of $150.0 million (the “Revolver”). The Company is required to make principal repayments of 0.25% of borrowings under the Term Debt on the last business day of each March, June, September and December. The current outstanding principal amount of Term Debt and applicable interest rate reflect the terms of a repricing consummated by the Company in February 2013, which included additional borrowings of $25.0 million, an interest rate reduction of 1.0% and a deferral of the March 2013 principal payment. The unpaid principal balance of Term Debt is due in full on the maturity date, which is January 30, 2019. On January 16, 2014, the Credit Facility was amended to allow for the issuance of the Additional Notes.
The Revolver matures on January 30, 2017 and bears interest per annum equal to an applicable margin of 3.5% plus, at the Company’s option, either (i) a base rate determined by reference to the highest of (a) the federal funds rate plus 0.50%, (b) the prime rate of Bank of America, N.A. and (c) the British Bankers Association London Interbank Offered Rate (“LIBOR”) plus 1.00% or (ii) a British Bankers Association LIBOR rate determined by reference to Reuters prior to the interest period relevant to such borrowing adjusted for certain additional costs. As of March 29, 2014, the borrowing capacity under the Revolver was $131.7 million, which is net of $18.3 million of outstanding letters of credit. The outstanding letters of credit are renewed annually and support required bonding on construction projects and the Company’s insurance liabilities.
The Company must adhere to certain financial covenants related to its borrowings under the Credit Facility and interest leverage ratios, as defined in the Credit Facility. The consolidated first lien net leverage ratio, reported each quarter, should be no greater than 4.75:1.0 from April 1, 2012 through June 30, 2014; 4.50:1.0 from July 1, 2014 to June 30, 2015, and 4.25:1.0 thereafter. The interest coverage ratio must be at least 1.70:1.0 from January 1, 2013 to December 31, 2014 and 1.85:1.0 thereafter.
As of March 29, 2014 and December 28, 2013, the Company was in compliance with all covenants applicable to the Senior Notes and the Credit Facility. The Company’s wholly-owned subsidiary companies and its non wholly-owned subsidiary, Continental Cement, are named as issuers or guarantors, as applicable, of the Senior Notes and the Credit Facility. In addition, the Company has pledged substantially all of its assets as collateral for the Credit Facility.
13
Table of Contents
Accrued interest expense on long-term debt as of March 29, 2014 and December 28, 2013 was $13.8 million and $17.1 million, respectively. Interest expense related to the debt totaled $17.2 million and $11.8 million for the three month periods ended March 29, 2014 and March 30, 2013, respectively. As of March 29, 2014 and December 28, 2013, $16.9 million and $11.5 million, respectively, of deferred financing fees were being amortized over the term of the debt using the effective interest method.
| 8. | INCOME TAXES |
Summit Materials is a limited liability company and passes its tax attributes for federal and state tax purposes to its parent company and is generally not subject to federal or state income tax. However, certain subsidiary entities file federal and state income tax returns due to their status as C corporations. The provision for income taxes is composed of federal, state and local income taxes for the subsidiary entities that have C corporation status.
The effective income tax rate for these entities differs from the statutory federal rate primarily due to (1) depletion expense and domestic production activities deduction, which are allowed as deductions for tax purposes but not recorded under GAAP, (2) state income taxes and the effect of graduated tax rates and (3) certain non-recurring items, such as differences in the treatment of transaction costs, which are often not deductible for tax purposes.
As of March 29, 2014 and December 28, 2013, the Company has not recognized any liabilities for uncertain tax positions. The Company records interest and penalties as a component of the income tax provision. No material interest or penalties were recognized in income tax expense for the three month periods ended March 29, 2014 and March 30, 2013.
| 9. | COMMITMENTS AND CONTINGENCIES |
The Company is party to certain legal actions arising from the ordinary course of business activities. Accruals are recorded when the outcome is probable and can be reasonably estimated in accordance with applicable accounting requirements. While the ultimate results of claims and litigation cannot be predicted with certainty, management expects that the ultimate resolution of all pending or threatened claims and litigation as of March 29, 2014 will not have a material effect on the Company’s consolidated results of operations, financial position or liquidity. The Company’s policy is to record legal fees as incurred.
Litigation and Claims— The Company is obligated under an indemnification agreement entered into with the sellers of Harper Contracting, Inc., Harper Sand and Gravel, Inc., Harper Ready Mix Company, Inc. and Harper Investments, Inc. (collectively, “Harper”) for the sellers’ ownership interests in a joint venture agreement. The Company has the rights to any benefits under the joint venture as well as the assumption of any obligations, but does not own equity interests in the joint venture. The joint venture has incurred significant losses on a highway project in Utah, which have resulted in requests for funding from the joint venture partners and, ultimately, from the Company. Through March 29, 2014, the Company has funded $8.8 million, of which $4.0 million was funded in 2012 and $4.8 million was funded in 2011. As of March 29, 2014 and December 28, 2013, an accrual of $4.3 million was recorded in other noncurrent liabilities for this matter.
During the course of business, there may be revisions to project costs and conditions that can give rise to change orders on construction contracts. Revisions can also result in claims made against a customer or subcontractor to recover project variances that have not been satisfactorily addressed through change orders with a customer. As of March 29, 2014 and December 28, 2013, unapproved change orders and claims totaled $3.2 million ($0.5 million in costs and estimated earnings in excess of billings and $2.7 million in other assets).
Environmental Remediation— The Company’s mining operations, cement production and waste processing are subject to and affected by federal, state and local laws and regulations relating to the environment, health and safety and other regulatory matters. These operations require environmental operating permits, which are subject to modification, renewal and revocation. Management regularly monitors and reviews its operations, procedures and policies for compliance with these laws and regulations. Despite these compliance efforts, risk of environmental liability is inherent in the operation of the Company’s business, as it is with other companies engaged in similar businesses, and there can be no assurance that environmental liabilities will not have a material adverse effect on the Company’s consolidated financial position, results of operations or liquidity in the future.
Other— In February 2011, the Company incurred a property loss related to a sunken barge with cement product aboard. During the three months ended March 30, 2013, the Company recorded a $1.8 million charge for costs to remove the barge from the waterway. As of March 29, 2014 and December 28, 2013, the Company had $0.5 million and $0.9 million, respectively, included in accrued expenses as management’s best estimate of the remaining costs to remove the barge.
14
Table of Contents
In the ordinary course of business, the Company enters into various firm purchase commitments with terms generally less than one year for certain raw materials and services. Management does not expect any significant changes in the market value of these goods and services during the commitment period that would have a material adverse effect on the financial position, results of operations or liquidity of the Company.
| 10. | SUPPLEMENTAL CASH FLOW INFORMATION |
Supplemental cash flow information is as follows:
| Three months ended | ||||||||
| March 29, | March 30, | |||||||
| 2014 | 2013 | |||||||
Cash payments: | ||||||||
Interest | $ | 19,970 | $ | 25,011 | ||||
Income taxes | 795 | 19 | ||||||
| 11. | SEGMENT INFORMATION |
The Company has determined that it has three operating segments, which are its reportable segments: the Central; West; and East regions. These segments are consistent with the Company’s management reporting structure. The operating results of each segment are regularly reviewed and evaluated by the Chief Executive Officer, who is the Company’s Chief Operating Decision Maker (“CODM”). The CODM evaluates the performance of the Company’s segments and allocates resources to them based on several factors, including a measurement of segment profit, which is computed as earnings before interest, taxes, depreciation, depletion, amortization and accretion. In addition, certain items such as management fees are excluded from the calculation of segment profit.
Each region’s operations consist of various activities related to the production, distribution and sale of building materials and the provision of construction services. Assets employed by segment include assets directly identified with those operations. Corporate assets consist primarily of cash, property, plant and equipment for corporate operations and other assets not directly identifiable with a reportable business segment. The accounting policies applicable to each segment are consistent with those used in preparing the consolidated financial statements. The following tables display selected financial data for the Company’s reportable segments:
| Three months ended | ||||||||
| March 29, | March 30, | |||||||
| 2014 | 2013 | |||||||
Revenue: | ||||||||
Central region | $ | 47,542 | $ | 35,900 | ||||
West region | 94,894 | 60,063 | ||||||
East region | 8,655 | 10,866 | ||||||
|
|
|
| |||||
Total revenue | $ | 151,091 | $ | 106,829 | ||||
|
|
|
| |||||
15
Table of Contents
| Three months ended | ||||||||
| March 29, | March 30, | |||||||
| 2014 | 2013 | |||||||
Segment (loss) profit: | ||||||||
Central region | $ | (423 | ) | $ | (5,954 | ) | ||
West region | 1,791 | (6,722 | ) | |||||
East region | (9,338 | ) | (9,533 | ) | ||||
Corporate and other | (7,499 | ) | (6,068 | ) | ||||
|
|
|
| |||||
Total reportable segments and corporate | (15,469 | ) | (28,277 | ) | ||||
Interest expense | 18,819 | 13,367 | ||||||
Depreciation, depletion, amortization and accretion | 19,356 | 17,131 | ||||||
|
|
|
| |||||
Loss from continuing operations before taxes | $ | (53,644 | ) | $ | (58,775 | ) | ||
|
|
|
| |||||
| Three months ended | ||||||||
| March 29, | March 30, | |||||||
| 2014 | 2013 | |||||||
Cash paid for capital expenditures: | ||||||||
Central region | $ | 12,401 | $ | 8,611 | ||||
West region | 4,138 | 5,373 | ||||||
East region | 2,245 | 2,164 | ||||||
|
|
|
| |||||
Total reportable segments | 18,784 | 16,148 | ||||||
Corporate and other | 1,157 | 257 | ||||||
|
|
|
| |||||
Total capital expenditures | $ | 19,941 | $ | 16,405 | ||||
|
|
|
| |||||
| Three months ended | ||||||||
| March 29, | March 30, | |||||||
| 2014 | 2013 | |||||||
Depreciation, depletion, amortization and accretion: | ||||||||
Central region | $ | 8,847 | $ | 7,642 | ||||
West region | 6,747 | 5,835 | ||||||
East region | 3,457 | 3,632 | ||||||
|
|
|
| |||||
Total reportable segments | 19,051 | 17,109 | ||||||
Corporate and other | 305 | 22 | ||||||
|
|
|
| |||||
Total depreciation, depletion, amortization and accretion | $ | 19,356 | $ | 17,131 | ||||
|
|
|
| |||||
16
Table of Contents
| March 29, | December 28, | |||||||
| 2014 | 2013 | |||||||
Total assets: | ||||||||
Central region | $ | 672,999 | $ | 657,421 | ||||
West region | 594,842 | 383,544 | ||||||
East region | 188,475 | 192,486 | ||||||
|
|
|
| |||||
Total reportable segments | 1,456,316 | 1,233,451 | ||||||
Corporate and other | 34,602 | 14,343 | ||||||
|
|
|
| |||||
Total | $ | 1,490,918 | $ | 1,247,794 | ||||
|
|
|
| |||||
| Three months ended | ||||||||
| March 29, | March 30, | |||||||
| 2014 | 2013 | |||||||
Revenue by product:* | ||||||||
Aggregates | $ | 31,549 | $ | 20,865 | ||||
Cement | 7,206 | 9,440 | ||||||
Ready-mixed concrete | 42,380 | 13,133 | ||||||
Asphalt | 24,396 | 19,351 | ||||||
Construction and paving | 55,502 | 46,410 | ||||||
Other | (9,942 | ) | (2,370 | ) | ||||
|
|
|
| |||||
Total revenue | $ | 151,091 | $ | 106,829 | ||||
|
|
|
| |||||
* Revenue by product includes intracompany sales transferred at market value. The elimination of intracompany transactions is included in Other. | ||||
| 12. | RELATED PARTY TRANSACTIONS |
The Company incurred certain management fees due to Blackstone Management Partners L.L.C. (“BMP”) totaling $0.9 million and $0.6 million during the three month periods ended March 29, 2014 and March 30, 2013, respectively. Under the terms of an agreement with Summit Materials Holdings L.P., and BMP, BMP provides monitoring, advisory and consulting services to the Company. In consideration for these services, the Company pays BMP the greater of $300,000 or 2.0% of the Company’s consolidated profit annually, as defined in the agreement.
In addition, in consideration of BMP undertaking financial and structural analysis, due diligence investigations, corporate strategy and other advice and negotiation assistance related to acquisitions, the Company pays BMP a transaction fee equal to 1.0% of the aggregate enterprise value of any acquired entity or, if such transaction is structured as an asset purchase or sale, 1.0% of the consideration paid for or received in respect of the assets acquired or disposed of. Under the terms of the agreement, BMP is permitted to assign, and has assigned, a portion of the fees to which it is entitled to Silverhawk Summit, L.P. and to certain other equity-holding current and former employees and board members. During the three months ended March 29, 2014, the Company paid BMP $1.7 million under this agreement and paid immaterial amounts to Silverhawk Summit, L.P. and to other equity-holders.
The management and acquisition-related fees paid pursuant to these agreements are included in general and administrative expenses.
Blackstone Advisory Partners L.P., an affiliate of The Blackstone Group L.P. served as an initial purchaser of $13.0 million principal amount of the Additional Notes issued in January 2014 and received compensation in connection therewith.
Cement sales to companies owned by a noncontrolling member of Continental Cement were approximately $1.7 million and $1.6 million during the three months ended March 29, 2014 and March 30, 2013, respectively. Accounts receivables due from the noncontrolling member were $1.2 million and $0.2 million as of March 29, 2014 and December 28, 2013, respectively. In addition, as of December 28, 2013, the Company had accrued interest payments of $0.7 million due to a certain noncontrolling member for a related party note, the principal balance of which was repaid in 2012. The $0.7 million of accrued interest was paid in the three months ended March 29, 2014.
17
Table of Contents
In the three months ended March 29, 2014, the Company sold certain assets, including inventory and equipment, in the East region associated with the production of concrete blocks to a related party for $2.2 million.
| 13. | SENIOR NOTES’ GUARANTOR AND NON-GUARANTOR FINANCIAL INFORMATION |
Summit Materials’ wholly-owned subsidiary companies other than Finance Corp. (“Wholly-owned Guarantors”) and non wholly-owned subsidiary, Continental Cement (“Non Wholly-owned Guarantor”) are named as guarantors (collectively, the “Guarantors”) of the Senior Notes. Certain other partially-owned subsidiaries, including a subsidiary of Continental Cement, do not guarantee the Senior Notes (collectively, the “Non-Guarantors”). Summit Materials (“Parent”) and Finance Corp. (collectively, the “Issuers”) were co-issuers of the Senior Notes. The Guarantors provide a joint and several, full and unconditional guarantee of the Senior Notes. There are no significant restrictions on Summit Materials ability to obtain funds from any of the Guarantor Subsidiaries in the form of dividends or loans. Additionally, there are no significant restrictions on a Guarantor Subsidiary’s ability to obtain funds from Summit Materials or its direct or indirect subsidiaries.
The following condensed consolidating balance sheets, statements of operations and cash flows are provided for the Issuers, the Non-Wholly-owned Guarantor, the Wholly-owned Guarantors and the Non-Guarantors. Earnings from subsidiaries are included in other income in the condensed consolidated statements of operations below. The financial information may not necessarily be indicative of results of operations, cash flows or financial position had the guarantor or non-guarantor subsidiaries operated as independent entities.
18
Table of Contents
Condensed Consolidating Balance Sheets
March 29, 2014
| Issuers | Non- Wholly- owned Guarantor | Wholly- owned Guarantors | Non- Guarantors | Eliminations | Consolidated | |||||||||||||||||||
| Assets | ||||||||||||||||||||||||
Current assets: | ||||||||||||||||||||||||
Cash | $ | 33,264 | $ | 5 | $ | 4,210 | $ | 1,343 | $ | (4,687 | ) | $ | 34,135 | |||||||||||
Accounts receivable, net | — | 5,828 | 87,718 | 2,834 | (633 | ) | 95,747 | |||||||||||||||||
Intercompany receivables | 290,165 | 9,591 | 175,520 | — | (475,276 | ) | — | |||||||||||||||||
Cost and estimated earnings in excess of billings | — | — | 12,293 | 79 | — | 12,372 | ||||||||||||||||||
Inventories | — | 14,529 | 95,568 | 3,151 | — | 113,248 | ||||||||||||||||||
Other current assets | 769 | 336 | 8,758 | 345 | 983 | 11,191 | ||||||||||||||||||
|
|
|
|
|
|
|
|
|
|
|
| |||||||||||||
Total current assets | 324,198 | 30,289 | 384,067 | 7,752 | (479,613 | ) | 266,693 | |||||||||||||||||
Property, plant and equipment, net | 4,821 | 307,151 | 572,302 | 6,937 | — | 891,211 | ||||||||||||||||||
Goodwill | — | 23,124 | 247,852 | 972 | — | 271,948 | ||||||||||||||||||
Intangible assets, net | — | 617 | 14,549 | — | — | 15,166 | ||||||||||||||||||
Other assets | 446,013 | 19,426 | 38,949 | 1,161 | (459,649 | ) | 45,900 | |||||||||||||||||
|
|
|
|
|
|
|
|
|
|
|
| |||||||||||||
Total assets | $ | 775,032 | $ | 380,607 | $ | 1,257,719 | $ | 16,822 | $ | (939,262 | ) | $ | 1,490,918 | |||||||||||
|
|
|
|
|
|
|
|
|
|
|
| |||||||||||||
| Liabilities, Redeemable Noncontrolling Interest and Member’s Interest | ||||||||||||||||||||||||
Current liabilities: | ||||||||||||||||||||||||
Current portion of debt | $ | 10 | $ | 1,019 | $ | 3,191 | $ | — | $ | — | $ | 4,220 | ||||||||||||
Current portion of acquisition-related liabilities | 1,617 | — | 12,811 | — | — | 14,428 | ||||||||||||||||||
Accounts payable | 4,968 | 12,610 | 49,233 | 922 | (633 | ) | 67,100 | |||||||||||||||||
Accrued expenses | 16,597 | 5,615 | 41,713 | 1,157 | (3,704 | ) | 61,378 | |||||||||||||||||
Intercompany payables | 191,646 | 26,965 | 256,491 | 174 | (475,276 | ) | — | |||||||||||||||||
Billings in excess of costs and estimated earnings | — | — | 5,898 | 637 | — | 6,535 | ||||||||||||||||||
|
|
|
|
|
|
|
|
|
|
|
| |||||||||||||
Total current liabilities | 214,838 | 46,209 | 369,337 | 2,890 | (479,613 | ) | 153,661 | |||||||||||||||||
Long-term debt | 301,856 | 154,336 | 483,791 | — | — | 939,983 | ||||||||||||||||||
Acquisition-related liabilities | — | — | 42,034 | — | — | 42,034 | ||||||||||||||||||
Other noncurrent liabilities | 919 | 17,892 | 55,445 | — | — | 74,256 | ||||||||||||||||||
|
|
|
|
|
|
|
|
|
|
|
| |||||||||||||
Total liabilities | 517,613 | 218,437 | 950,607 | 2,890 | (479,613 | ) | 1,209,934 | |||||||||||||||||
Redeemable noncontrolling interest | — | — | — | — | 25,137 | 25,137 | ||||||||||||||||||
Redeemable members’ interest | — | 23,600 | — | — | (23,600 | ) | — | |||||||||||||||||
Total member’s interest | 257,419 | 138,570 | 307,112 | 13,932 | (461,186 | ) | 255,847 | |||||||||||||||||
|
|
|
|
|
|
|
|
|
|
|
| |||||||||||||
Total liabilities, redeemable noncontrolling interest and member’s interest | $ | 775,032 | $ | 380,607 | $ | 1,257,719 | $ | 16,822 | $ | (939,262 | ) | $ | 1,490,918 | |||||||||||
|
|
|
|
|
|
|
|
|
|
|
| |||||||||||||
19
Table of Contents
Condensed Consolidating Balance Sheets
December 28, 2013
| Issuers | Non- Wholly- owned Guarantor | Wholly- owned Guarantors | Non- Guarantors | Eliminations | Consolidated | |||||||||||||||||||
| Assets | ||||||||||||||||||||||||
Current assets: | ||||||||||||||||||||||||
Cash | $ | 10,375 | $ | 9 | $ | 3,442 | $ | 3,631 | $ | (2,540 | ) | $ | 14,917 | |||||||||||
Accounts receivable, net | — | 4,587 | 93,102 | 3,100 | (1,452 | ) | 99,337 | |||||||||||||||||
Intercompany receivables | 38,134 | 3,433 | 30,787 | — | (72,354 | ) | — | |||||||||||||||||
Cost and estimated earnings in excess of billings | — | — | 10,539 | 228 | — | 10,767 | ||||||||||||||||||
Inventories | — | 10,402 | 85,372 | 658 | — | 96,432 | ||||||||||||||||||
Other current assets | 750 | 444 | 11,715 | 272 | — | 13,181 | ||||||||||||||||||
|
|
|
|
|
|
|
|
|
|
|
| |||||||||||||
Total current assets | 49,259 | 18,875 | 234,957 | 7,889 | (76,346 | ) | 234,634 | |||||||||||||||||
Property, plant and equipment, net | 3,969 | 301,908 | 518,935 | 6,966 | — | 831,778 | ||||||||||||||||||
Goodwill | — | 23,124 | 102,942 | 972 | — | 127,038 | ||||||||||||||||||
Intangible assets, net | — | 642 | 14,505 | — | — | 15,147 | ||||||||||||||||||
Other assets | 296,494 | 17,973 | 37,535 | 1,303 | (314,108 | ) | 39,197 | |||||||||||||||||
|
|
|
|
|
|
|
|
|
|
|
| |||||||||||||
Total assets | $ | 349,722 | $ | 362,522 | $ | 908,874 | $ | 17,130 | $ | (390,454 | ) | $ | 1,247,794 | |||||||||||
|
|
|
|
|
|
|
|
|
|
|
| |||||||||||||
| Liabilities, Redeemable Noncontrolling Interest and Member’s Interest | ||||||||||||||||||||||||
Current liabilities: | ||||||||||||||||||||||||
Current portion of debt | $ | 26,010 | $ | 1,018 | $ | 3,192 | $ | — | $ | — | $ | 30,220 | ||||||||||||
Current portion of acquisition-related liabilities | 2,000 | — | 8,635 | — | — | 10,635 | ||||||||||||||||||
Accounts payable | 5,455 | 9,387 | 57,142 | 1,572 | (1,452 | ) | 72,104 | |||||||||||||||||
Accrued expenses | 12,041 | 9,185 | 37,342 | 1,223 | (2,540 | ) | 57,251 | |||||||||||||||||
Intercompany payables | — | — | 71,556 | 798 | (72,354 | ) | — | |||||||||||||||||
Billings in excess of costs and estimated earnings | — | — | 8,837 | 426 | — | 9,263 | ||||||||||||||||||
|
|
|
|
|
|
|
|
|
|
|
| |||||||||||||
Total current liabilities | 45,506 | 19,590 | 186,704 | 4,019 | (76,346 | ) | 179,473 | |||||||||||||||||
Long-term debt | 19,587 | 154,590 | 484,590 | — | — | 658,767 | ||||||||||||||||||
Acquisition-related liabilities | 85 | — | 23,671 | — | — | 23,756 | ||||||||||||||||||
Other noncurrent liabilities | 959 | 20,306 | 56,215 | — | — | 77,480 | ||||||||||||||||||
|
|
|
|
|
|
|
|
|
|
|
| |||||||||||||
Total liabilities | 66,137 | 194,486 | 751,180 | 4,019 | (76,346 | ) | 939,476 | |||||||||||||||||
Redeemable noncontrolling interest | — | — | — | — | 24,767 | 24,767 | ||||||||||||||||||
Redeemable members’ interest | — | 23,450 | — | — | (23,450 | ) | — | |||||||||||||||||
Total member’s interest | 283,585 | 144,586 | 157,694 | 13,111 | (315,425 | ) | 283,551 | |||||||||||||||||
|
|
|
|
|
|
|
|
|
|
|
| |||||||||||||
Total liabilities, redeemable noncontrolling interest and member’s interest | $ | 349,722 | $ | 362,522 | $ | 908,874 | $ | 17,130 | $ | (390,454 | ) | $ | 1,247,794 | |||||||||||
|
|
|
|
|
|
|
|
|
|
|
| |||||||||||||
20
Table of Contents
Condensed Consolidating Statements of Operations
For the three months ended March 29, 2014
| Issuers | Non- Wholly- owned Guarantor | Wholly- owned Guarantors | Non- Guarantors | Eliminations | Consolidated | |||||||||||||||||||
Revenue | $ | — | $ | 7,707 | $ | 140,410 | $ | 6,332 | $ | (3,358 | ) | $ | 151,091 | |||||||||||
|
|
|
|
|
|
|
|
|
|
|
| |||||||||||||
Cost of revenue (excluding items shown separately below) | — | 10,903 | 117,624 | 3,506 | (3,358 | ) | 128,675 | |||||||||||||||||
General and administrative expenses | 7,688 | 1,624 | 25,900 | 276 | — | 35,488 | ||||||||||||||||||
Depreciation, depletion, amortization and accretion | 304 | 3,074 | 15,712 | 266 | — | 19,356 | ||||||||||||||||||
Transaction costs | — | 50 | 2,541 | — | — | 2,591 | ||||||||||||||||||
|
|
|
|
|
|
|
|
|
|
|
| |||||||||||||
Operating (loss) income | (7,992 | ) | (7,944 | ) | (21,367 | ) | 2,284 | — | (35,019 | ) | ||||||||||||||
Other expense (income), net | 36,825 | (97 | ) | (195 | ) | 49 | (36,776 | ) | (194 | ) | ||||||||||||||
Interest expense | 5,736 | 2,846 | 11,772 | 26 | (1,561 | ) | 18,819 | |||||||||||||||||
|
|
|
|
|
|
|
|
|
|
|
| |||||||||||||
(Loss) income from continuing operations before taxes | (50,553 | ) | (10,693 | ) | (32,944 | ) | 2,209 | 38,337 | (53,644 | ) | ||||||||||||||
Income tax benefit | — | — | (596 | ) | — | — | (596 | ) | ||||||||||||||||
|
|
|
|
|
|
|
|
|
|
|
| |||||||||||||
(Loss) income from continuing operations | (50,553 | ) | (10,693 | ) | (32,348 | ) | 2,209 | 38,337 | (53,048 | ) | ||||||||||||||
Loss from discontinued operations | — | — | 20 | — | — | 20 | ||||||||||||||||||
|
|
|
|
|
|
|
|
|
|
|
| |||||||||||||
Net (loss) income | (50,553 | ) | (10,693 | ) | (32,368 | ) | 2,209 | 38,337 | (53,068 | ) | ||||||||||||||
Net loss attributable to noncontrolling interest | — | — | — | — | (2,515 | ) | (2,515 | ) | ||||||||||||||||
|
|
|
|
|
|
|
|
|
|
|
| |||||||||||||
Net (loss) income attributable to member of Summit Materials, LLC | $ | (50,553 | ) | $ | (10,693 | ) | $ | (32,368 | ) | $ | 2,209 | $ | 40,852 | $ | (50,553 | ) | ||||||||
|
|
|
|
|
|
|
|
|
|
|
| |||||||||||||
Comprehensive (loss) income attributable to member of Summit Materials, LLC | $ | (50,553 | ) | $ | (9,875 | ) | $ | (32,368 | ) | $ | 2,209 | $ | 40,607 | $ | (49,980 | ) | ||||||||
|
|
|
|
|
|
|
|
|
|
|
| |||||||||||||
21
Table of Contents
Condensed Consolidating Statements of Operations
For the three months ended March 30, 2013
| Issuers | Non- Wholly- owned Guarantor | Wholly- owned Guarantors | Non- Guarantors | Eliminations | Consolidated | |||||||||||||||||||
Revenue | $ | — | $ | 9,911 | $ | 93,754 | $ | 5,927 | $ | (2,763 | ) | $ | 106,829 | |||||||||||
|
|
|
|
|
|
|
|
|
|
|
| |||||||||||||
Cost of revenue (excluding items shown separately below) | — | 14,505 | 80,724 | 3,607 | (2,763 | ) | 96,073 | |||||||||||||||||
General and administrative expenses | 1,654 | 3,387 | 28,692 | 270 | — | 34,003 | ||||||||||||||||||
Depreciation, depletion, amortization and accretion | 22 | 2,663 | 14,195 | 251 | — | 17,131 | ||||||||||||||||||
Transaction costs | — | — | 1,482 | — | — | 1,482 | ||||||||||||||||||
|
|
|
|
|
|
|
|
|
|
|
| |||||||||||||
Operating (loss) income | (1,676 | ) | (10,644 | ) | (31,339 | ) | 1,799 | — | (41,860 | ) | ||||||||||||||
Other expense (income), net | 51,145 | (55 | ) | 3,161 | 128 | (50,831 | ) | 3,548 | ||||||||||||||||
Interest expense | — | 2,731 | 11,270 | 125 | (759 | ) | 13,367 | |||||||||||||||||
|
|
|
|
|
|
|
|
|
|
|
| |||||||||||||
(Loss) income from continuing operations before taxes | (52,821 | ) | (13,320 | ) | (45,770 | ) | 1,546 | 51,590 | (58,775 | ) | ||||||||||||||
Income tax benefit | — | — | (2,621 | ) | — | — | (2,621 | ) | ||||||||||||||||
|
|
|
|
|
|
|
|
|
|
|
| |||||||||||||
(Loss) income from continuing operations | (52,821 | ) | (13,320 | ) | (43,149 | ) | 1,546 | 51,590 | (56,154 | ) | ||||||||||||||
Loss from discontinued operations | — | — | 123 | — | — | 123 | ||||||||||||||||||
|
|
|
|
|
|
|
|
|
|
|
| |||||||||||||
Net (loss) income | (52,821 | ) | (13,320 | ) | (43,272 | ) | 1,546 | 51,590 | (56,277 | ) | ||||||||||||||
Net loss attributable to noncontrolling interest | — | — | — | — | (3,456 | ) | (3,456 | ) | ||||||||||||||||
|
|
|
|
|
|
|
|
|
|
|
| |||||||||||||
Net (loss) income attributable to member of Summit Materials, LLC | $ | (52,821 | ) | $ | (13,320 | ) | $ | (43,272 | ) | $ | 1,546 | $ | 55,046 | $ | (52,821 | ) | ||||||||
|
|
|
|
|
|
|
|
|
|
|
| |||||||||||||
22
Table of Contents
Condensed Consolidating Statements of Cash Flows
For the three months ended March 29, 2014
| Issuers | Non- Wholly- owned Guarantor | Wholly- owned Guarantors | Non- Guarantors | Eliminations | Consolidated | |||||||||||||||||||
Net cash used in operating activities | $ | (10,964 | ) | $ | (13,844 | ) | $ | (22,564 | ) | $ | (3,183 | ) | $ | 180 | $ | (50,375 | ) | |||||||
|
|
|
|
|
|
|
|
|
|
|
| |||||||||||||
Cash flow from investing activities: | ||||||||||||||||||||||||
Acquisitions, net of cash acquired | (182,514 | ) | — | — | — | — | (182,514 | ) | ||||||||||||||||
Purchase of property, plant and equipment | (1,157 | ) | (6,448 | ) | (12,292 | ) | (44 | ) | — | (19,941 | ) | |||||||||||||
Proceeds from the sale of property, plant, and equipment | — | 48 | 2,083 | 71 | — | 2,202 | ||||||||||||||||||
Other | — | — | 7 | — | — | 7 | ||||||||||||||||||
|
|
|
|
|
|
|
|
|
|
|
| |||||||||||||
Net cash used for (provided by) investing activities | (183,671 | ) | (6,400 | ) | (10,202 | ) | 27 | — | (200,246 | ) | ||||||||||||||
|
|
|
|
|
|
|
|
|
|
|
| |||||||||||||
Cash flow from financing activities: | ||||||||||||||||||||||||
Proceeds from investment by member | 24,350 | — | (1,166 | ) | 1,166 | — | 24,350 | |||||||||||||||||
Net proceeds from debt issuance | 306,750 | — | — | — | — | 306,750 | ||||||||||||||||||
Loans received from and payments made on loans from other Summit Companies | (56,210 | ) | 20,240 | 38,595 | (298 | ) | (2,327 | ) | — | |||||||||||||||
Payments on long-term debt | (51,057 | ) | — | (3,257 | ) | — | — | (54,314 | ) | |||||||||||||||
Payments on acquisition-related liabilities | — | — | (638 | ) | — | — | (638 | ) | ||||||||||||||||
Financing costs | (6,309 | ) | — | — | — | — | (6,309 | ) | ||||||||||||||||
|
|
|
|
|
|
|
|
|
|
|
| |||||||||||||
Net cash provided by (used for) financing activities | 217,524 | 20,240 | 33,534 | 868 | (2,327 | ) | 269,839 | |||||||||||||||||
|
|
|
|
|
|
|
|
|
|
|
| |||||||||||||
Net increase (decrease) in cash | 22,889 | (4 | ) | 768 | (2,288 | ) | (2,147 | ) | 19,218 | |||||||||||||||
Cash — Beginning of period | 10,375 | 9 | 3,442 | 3,631 | (2,540 | ) | 14,917 | |||||||||||||||||
|
|
|
|
|
|
|
|
|
|
|
| |||||||||||||
Cash— End of period | $ | 33,264 | $ | 5 | $ | 4,210 | $ | 1,343 | $ | (4,687 | ) | $ | 34,135 | |||||||||||
|
|
|
|
|
|
|
|
|
|
|
| |||||||||||||
23
Table of Contents
Condensed Consolidating Statements of Cash Flows
For the three months ended March 30, 2013
| Issuers | Non- Wholly- owned Guarantor | Wholly- owned Guarantors | Non- Guarantors | Eliminations | Consolidated | |||||||||||||||||||
Net cash (used in) provided by operating activities | $ | (2,033 | ) | $ | (12,004 | ) | $ | (34,204 | ) | $ | 2,345 | $ | — | $ | (45,896 | ) | ||||||||
|
|
|
|
|
|
|
|
|
|
|
| |||||||||||||
Cash flow from investing activities: | ||||||||||||||||||||||||
Purchase of property, plant and equipment | (257 | ) | (6,170 | ) | (9,748 | ) | (230 | ) | — | (16,405 | ) | |||||||||||||
Proceeds from the sale of property, plant, and equipment | — | — | 5,857 | 2 | — | 5,859 | ||||||||||||||||||
|
|
|
|
|
|
|
|
|
|
|
| |||||||||||||
Net cash used for investing activities | (257 | ) | (6,170 | ) | (3,891 | ) | (228 | ) | — | (10,546 | ) | |||||||||||||
|
|
|
|
|
|
|
|
|
|
|
| |||||||||||||
Cash flow from financing activities: | ||||||||||||||||||||||||
Net proceeds from debt issuance | 154,181 | — | — | — | — | 154,181 | ||||||||||||||||||
Loans received from and payments made on loans from other Summit Companies | (98,285 | ) | 17,862 | 81,665 | (2,114 | ) | 872 | — | ||||||||||||||||
Payments on long-term debt | (51,390 | ) | — | — | — | — | (51,390 | ) | ||||||||||||||||
Payments on acquisition-related liabilities | — | — | (1,585 | ) | — | — | (1,585 | ) | ||||||||||||||||
Financing costs | (2,221 | ) | — | — | — | — | (2,221 | ) | ||||||||||||||||
|
|
|
|
|
|
|
|
|
|
|
| |||||||||||||
Net cash provided by (used for) financing activities | 2,285 | 17,862 | 80,080 | (2,114 | ) | 872 | 98,985 | |||||||||||||||||
|
|
|
|
|
|
|
|
|
|
|
| |||||||||||||
Net (decrease) increase in cash | (5 | ) | (312 | ) | 41,985 | 3 | 872 | 42,543 | ||||||||||||||||
Cash — Beginning of period | 697 | 397 | 30,981 | 680 | (5,324 | ) | 27,431 | |||||||||||||||||
|
|
|
|
|
|
|
|
|
|
|
| |||||||||||||
Cash— End of period | $ | 692 | $ | 85 | $ | 72,966 | $ | 683 | $ | (4,452 | ) | $ | 69,974 | |||||||||||
|
|
|
|
|
|
|
|
|
|
|
| |||||||||||||
| 14. | SUBSEQUENT EVENTS |
On March 31, 2014, the Company acquired all of the stock of Troy Vines, Inc., an integrated aggregates and ready-mixed concrete business headquartered in Midland, Texas, which serves the Permian Basin region of West Texas. The acquisition was funded with cash on hand.
* * *
24
Table of Contents
| ITEM 2. | MANAGEMENT’S DISCUSSION AND ANALYSIS OF FINANCIAL CONDITION AND RESULTS OF OPERATIONS |
This Management’s Discussion and Analysis of Financial Condition and Results of Operations is intended to assist in understanding and assessing the trends and significant changes in our results of operations and financial condition. Historical results may not be indicative of future performance. Our forward-looking statements reflect our current views about future events, are based on assumptions and are subject to known and unknown risks and uncertainties that could cause actual results to differ materially from those contemplated by these statements. Factors that may cause differences between actual results and those contemplated by forward-looking statements include, but are not limited to, those discussed in the section entitled “Risk Factors” in the Form 10-K and any factors discussed in the sections entitled “Cautionary Note Regarding Forward-Looking Statements” and “Risk Factors” of this report. This Management’s Discussion and Analysis of Financial Condition and Results of Operations should be read in conjunction with our consolidated interim financial statements and the related notes and other information included in this report.
Overview
We are a leading, vertically-integrated, geographically-diverse, heavy-side building materials company. We supply aggregates, cement and related downstream products such as ready-mixed concrete, asphalt paving mix, concrete products and paving and related construction services for a variety of end uses in the U.S. construction industry, including private residential and nonresidential construction, as well as public infrastructure projects. We believe we are a top 15 supplier of aggregates, a top 25 producer of cement and a major producer of ready-mixed concrete and asphalt paving mix in the United States by volume.
We were formed in September 2008. Since July 2009, $798.1 million of funding commitments have been made to our parent company. We have grown rapidly as a result of our disciplined acquisition strategy, utilizing approximately $467.5 million of deployed equity. Our nine operating companies make up our three distinct operating segments – Central, West and East regions – spanning 16 states and 24 metropolitan areas. We believe each of our operating companies has a top three market share position in its local market area and an extensive operating history, averaging over 35 years. Our highly experienced management team, led by 30-year industry veteran, CEO, Tom Hill has successfully enhanced the operations of acquired companies by focusing on scale advantages, cost efficiencies and pricing discipline to improve profitability and cash flow.
As of March 29, 2014, we had 1.3 billion tons and 0.4 billion tons of proven and probable aggregates reserves serving our aggregates and cement businesses, respectively, and operated over 200 sites and plants, to which we believe we have adequate road, barge and/or railroad access. From time to time, in connection with certain acquisitions, we engage a third party engineering firm to perform an aggregates reserves assessments, but we do not perform annual reserve audits.
Of the 16 states in which we operate, we currently maintain facilities in 14 states across our three geographic regions. The map below illustrates our geographic footprint:
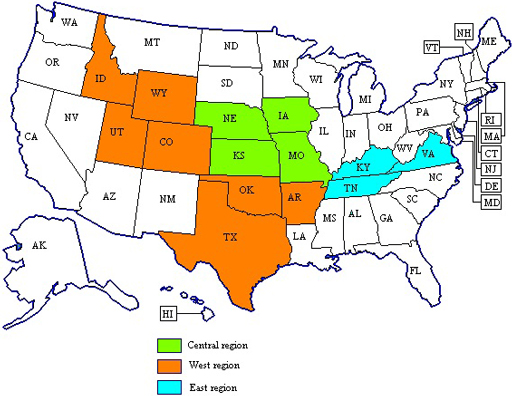
25
Table of Contents
Our revenue is derived from multiple end-use markets including private residential and nonresidential construction, as well as public infrastructure construction. Residential and nonresidential construction consists of new construction and repair and remodel markets, which were significantly affected by the downturn in the overall economy and the construction industry, in particular. We believe exposure to multiple geographic markets affords us greater stability through economic cycles and positions us to capitalize on upside opportunities as the residential and nonresidential construction recovery occurs. Public infrastructure construction includes spending by federal, state and local governments for roads, highways, bridges, airports and other infrastructure projects. Public infrastructure projects are a historically stable portion of state and federal budgets. Our acquisitions to date have been focused in states with constitutionally-protected transportation funding sources, which we believe serves to limit our exposure to state and local budgetary uncertainties.
Business Trends and Conditions
The U.S. heavy-side building materials industry is composed of four primary sectors: (i) aggregates; (ii) cement; (iii) ready-mixed concrete; and (iv) asphalt paving mix, one or more of which is widely used in most forms of construction activity. Participants in these sectors typically range from small, privately-held companies focused on a single product or market to multinational companies that offer a wide array of building materials and services across several markets. Markets are defined in part by the distance materials can be transported efficiently, resulting in predominantly local or regional operations.
Although the construction sector in the local economies in which we operate have begun to show signs of recovery, we could still be affected by any economic stagnation or decline, which could vary by local region and market. Our sales and earnings are sensitive to national, regional and local economic conditions and particularly to cyclical changes in construction spending, especially in the private sector. From a macroeconomic view, we see positive indicators for the construction sector, including upward trends in housing starts, construction employment and highway obligations. All of these factors should result in increased construction activity in the private sector, which could lead to increased public infrastructure spending in the relatively near future as compared to the recently preceding years.
Transportation infrastructure projects, driven by both federal and state funding programs, represent a significant share of the U.S. heavy-side building materials market. Moving Ahead for Progress in the 21st Century (“MAP-21”) is a27-month, approximately $105.0 billion transportation funding program that provided for $40.4 billion and $41.0 billion in highway infrastructure investments in fiscal years 2013 and 2014, respectively. The spending levels are consistent with the preceding federal transportation funding program. In addition to federal funding, highway construction and maintenance funding is also available through state, county and local agencies. Our five largest states by revenue (Texas, Kansas, Kentucky, Utah and Missouri represented approximately 45%, 19%, 5%, 11% and 10%, respectively, of our total revenue for the three months ended March 29, 2014) each have funds whose revenue sources are constitutionally protected and may only be spent on transportation projects:
| • | Texas Department of Transportation’s budget from 2014 to 2016 is $25.3 billion |
| • | Kansas has a 10-year $8.2 billion highway bill that was passed in May 2010 |
| • | Kentucky’s highway program has anticipated 2013-2018 funding of $5.7 billion |
| • | Utah’s transportation investment fund has $3.5 billion committed through 2018 |
| • | Missouri has an estimated $0.7 billion in annual construction funding committed to essential road and bridge programs through 2017 |
Currently, there is uncertainty as to what will succeed MAP-21, which expires in September 2014. A new highway bill may be passed by the end of 2014, which would require continuing resolutions between September 2014 and the date a new bill is passed. We are not expecting a significant change in funding levels through the continuing resolutions or a new bill. However, given the nation’s aging infrastructure and considering longstanding historical spending trends, management expects U.S. infrastructure investment to grow over the long-term. Management believes that the Company is well-positioned to capitalize on any such increase in investment.
Within many of our markets, the state and local governments have taken actions to maintain or grow highway funding during a time of uncertainty with respect to federal funding. The Texas legislature recently passed the largest two-year budget in the history of the Texas Department of Transportation (with growth in both new construction and maintenance). In addition, increased energy activity in parts of Texas has driven an increase in private construction demand, which we expect to continue. In particular, Austin and Houston, Texas have seen rapid residential demand growth as increased jobs have drawn new residents. Funding for public infrastructure projects in Kansas are partially funded through increases in heavy truck registrations, dedicated sales tax and bonding, which has provided reliable funding for public infrastructure in the state. We believe that public infrastructure spending in Kentucky, which comprises the majority of our revenue in the state, will remain consistent in the upcoming years. We expect primarily maintenance-related public demand in Utah and Missouri, both of which have recently completed large spending programs.
26
Table of Contents
Backlog
Our construction services backlog represents our estimate of the revenue that will be realized under the portion of the construction contracts remaining to be performed. We generally include a project in our contract backlog at the time a contract is awarded and funding is in place. At the election of the customer, substantially all of the contracts in our backlog are subject to cancellation or modification in accordance with applicable contract terms. However, we have not been materially adversely affected by contract cancellations or modifications in the past.
As a vertically-integrated business, during the three months ended March 29, 2014, approximately 26% of our aggregates production was further processed and sold as a downstream product, such as ready-mixed concrete or asphalt paving mix, or used in our construction services business and approximately 83% of the asphalt paving mix we sold was installed by our own paving crews. Our products sold externally are generally picked up or delivered upon receipt of orders or requests from customers. Accordingly, the backlog associated with external product sales is converted into revenue within a relatively short period of time. Inventory for products is generally maintained in sufficient quantities to meet rapid delivery requirements of customers. A quarterly increase or decrease of backlog does not necessarily correspond with an improvement or deterioration of our business, as many of our construction services are awarded and completed within one year and, therefore, may not be reflected in our beginning or year-end contract backlog. Our backlog includes only those products and projects for which we have obtained a purchase order or a signed contract with the customer. The following table sets forth, by product, our backlog as of the indicated dates:
| March 29, | March 30, | |||||||
| (in thousands) | 2014 | 2013 | ||||||
Aggregate (in tons) | 7,117 | 5,794 | ||||||
Asphalt (in tons) | 2,796 | 2,764 | ||||||
Ready-mixed concrete (in cubic yards) | 184 | 168 | ||||||
Construction services(1) | $ | 422,523 | $ | 393,559 | ||||
(1) The dollar value of the construction services backlog includes the value of the aggregate and asphalt tons and ready-mixed concrete cubic yards in backlog that are expected to be used internally to perform the construction services. | ||||
In addition to being subject to cyclical changes in the economy, our business is seasonal in nature. Almost all of our products are produced and consumed outdoors. Severe weather, seasonal changes and other weather-related conditions can significantly affect the production and sales volumes of our products. Typically, the highest sales and earnings are in the second and third quarters, and the lowest are in the first and fourth quarters. Winter weather months are generally periods of lower sales as we, and our customers, normally cannot cost-effectively mobilize and demobilize equipment and manpower under adverse weather conditions. Periods of heavy rainfall also adversely affect our work patterns and demand for our products. Our working capital may vary greatly during peak periods, but generally returns to average levels as our operating cycle is completed each fiscal year.
We are subject to commodity price risk with respect to price changes in energy, including fossil fuels and electricity for aggregates, cement, ready-mixed concrete and asphalt paving mix production, liquid asphalt, natural gas for hot mix asphalt production and diesel fuel for distribution vehicles and production related mobile equipment. Liquid asphalt escalator provisions in most of our private and commercial contracts limit our exposure to price fluctuations in this commodity. We often obtain similar escalators on public infrastructure contracts, other than those in Texas. In addition, we enter into various firm purchase commitments, with terms generally less than one year, for certain raw materials, including commodities, in the ordinary course of business. As a result of the contract escalation clauses and effective use of the firm purchase commitments, commodity prices did not have a material effect on our results of operations in the three months ended March 29, 2014 as compared to the three months ended March 30, 2013.
Financial Highlights
The principal factors in evaluating our financial condition and operating results for the three months ended March 29, 2014 are:
| • | Revenue increased $44.3 million in the three months ended March 29, 2014 from the comparable period in 2013, as a result of pricing and volume increases across our product lines, which includes volume contributions from our acquisitions. |
| • | Our operating earnings improved $6.8 million in the three months ended March 29, 2014 from the comparable period in 2013. This improvement in earnings was largely driven by price increases in aggregates, cement and asphalt and volume increases in aggregates, ready-mixed concrete and asphalt. |
| • | In January 2014, we increased our long-term debt by $260.0 million with the issuance of additional Senior Notes at 10.5% due January 31, 2020. |
27
Table of Contents
Acquisitions
On January 17, 2014, we acquired certain aggregates and ready-mixed concrete assets of Alleyton in Houston, Texas, which expands our presence in the Texas market.
On April 1, 2013, we acquired certain aggregates, ready-mixed concrete and asphalt assets of Lafarge in and around Wichita, Kansas, which expands our footprint in the Wichita market across our lines of business.
On April 1, 2013, we acquired the membership interests of Westroc in Utah. The Westroc acquisition expands our market coverage for aggregates and ready-mixed concrete in Utah.
Discontinued Operations
As part of our strategy to focus on our core business as a heavy-side building materials company, we have exited certain non-core businesses in recent years, including certain concrete paving operations, which were wound down in the second quarter of 2013. Prior to recognition as discontinued operations, this business was included in the Company’s East region’s operations.
Results of Operations
The following discussion of our results of operations is focused on the key financial measures we use to evaluate the performance of our business from both a consolidated and operating segment perspective. Operating income and margins are discussed in terms of changes in volume, pricing and mix of revenue source (i.e., type of product sales or service revenue). The majority of our service revenue is generated by contracts that extend across multiple reporting periods, for which we generally account using the percentage of completion method of accounting. Under this method, revenue is recognized as work progresses. Performance on service contracts refers to changes in contract earnings rates during the term of the contract based on revisions to estimates of profit at completion on individual contracts. These revisions result from increases or decreases to the estimated value of the contract and/or the estimated costs required to complete the contract. The following discussion of results of operations provides additional disclosure to the extent that a significant or unusual event causes a material change in the profitability of a contract or groups of contracts.
Operating income reflects our profit from continuing operations after taking into consideration cost of revenue, general and administrative expenses, depreciation, depletion, amortization and accretion and transaction costs. The components of cost of revenue generally increase ratably with revenue, as labor, transportation costs and subcontractor costs are recorded in cost of revenue. As a result of our revenue growth occurring primarily through acquisitions and strengthening of our infrastructure (finance, information technology, legal and human resources), our general and administrative costs and depreciation, depletion, amortization and accretion have generally grown ratably with revenue. As volumes increase, we expect these costs, as a percentage of revenue, to decrease. Our transaction costs fluctuate with the number and size of acquisitions consummated each year. The table below includes revenue and operating loss by segment for the three months ended March 29, 2014 and March 30, 2013.
| Three Months Ended | ||||||||||||||||
| March 29, 2014 | March 30, 2013 | |||||||||||||||
| (in thousands) | Revenue | Operating loss | Revenue | Operating loss | ||||||||||||
Central | $ | 47,542 | $ | (9,365 | ) | $ | 35,900 | $ | (13,018 | ) | ||||||
West | 94,894 | (5,106 | ) | 60,063 | (11,015 | ) | ||||||||||
East | 8,655 | (12,556 | ) | 10,866 | (11,377 | ) | ||||||||||
Corporate (1) | — | (7,992 | ) | — | (6,450 | ) | ||||||||||
|
|
|
|
|
|
|
| |||||||||
Total | $ | 151,091 | $ | (35,019 | ) | $ | 106,829 | $ | (41,860 | ) | ||||||
|
|
|
|
|
|
|
| |||||||||
(1) Corporate results primarily consist of compensation and office expenses for employees included in the Company’s headquarters. | ||||||||
Non-GAAP Performance Measures
Our chief operating decision maker evaluates the performance of our segments and allocates resources to them based on several factors including a measure we call segment profit, or Adjusted EBITDA by segment. We define Adjusted EBITDA as net loss before loss from discontinued operations, income tax (benefit) expense, interest expense and depreciation, depletion, amortization and accretion. Adjusted EBITDA is determined before considering the loss from discontinued operations as these amounts are not viewed by management as part of our core business when assessing the performance of our segments or allocation of resources. Accretion expense is recognized on our asset retirement obligations and reflects the time value of money. Given that accretion is similar in nature to interest expense, it is treated consistently with interest expense and is excluded from Adjusted EBITDA.
28
Table of Contents
Adjusted EBITDA reflects an additional way of viewing aspects of our business that, when viewed with our results determined in accordance with GAAP and the accompanying reconciliation to a GAAP financial measure included in the table below, may provide a more complete understanding of factors and trends affecting our business. However, it should not be construed as being more important than other comparable GAAP measures and must be considered in conjunction with the GAAP measures. In addition, non-GAAP financial measures are not standardized; therefore, it may not be possible to compare such financial measures with other companies’ non-GAAP financial measures having the same or similar names. We strongly encourage investors to review our consolidated interim financial statements in their entirety and not rely on any single financial measure.
The tables below reconcile our net loss to Adjusted EBITDA and present Adjusted EBITDA by segment for the three months ended March 29, 2014 and March 30, 2013.
| Three Months Ended | ||||||||
| March 29, | March 30, | |||||||
| Reconciliation of Net Loss to Adjusted EBITDA | 2014 | 2013 | ||||||
| (in thousands) | ||||||||
Net loss | $ | (53,068 | ) | $ | (56,277 | ) | ||
Income tax benefit | (596 | ) | (2,621 | ) | ||||
Interest expense | 18,819 | 13,367 | ||||||
Depreciation, depletion and amortization | 19,149 | 16,959 | ||||||
Accretion | 207 | 172 | ||||||
Loss from discontinued operations | 20 | 123 | ||||||
|
|
|
| |||||
Adjusted EBITDA | $ | (15,469 | ) | $ | (28,277 | ) | ||
|
|
|
| |||||
| Adjusted EBITDA by Segment | ||||||||
| (in thousands) | ||||||||
Central | $ | (423 | ) | $ | (5,954 | ) | ||
West | 1,791 | (6,722 | ) | |||||
East | (9,338 | ) | (9,533 | ) | ||||
Corporate | (7,499 | ) | (6,068 | ) | ||||
|
|
|
| |||||
Adjusted EBITDA | $ | (15,469 | ) | $ | (28,277 | ) | ||
|
|
|
| |||||
29
Table of Contents
Consolidated Results of Operations
The table below sets forth our consolidated results of operations for the three months ended March 29, 2014 and March 30, 2013.
| Three Months Ended | ||||||||
| March 29, | March 30, | |||||||
| (in thousands) | 2014 | 2013 | ||||||
Revenue | $ | 151,091 | $ | 106,829 | ||||
Cost of revenue (excluding items shown separately below) | 128,675 | 96,073 | ||||||
General and administrative expenses | 35,488 | 34,003 | ||||||
Depreciation, depletion, amortization and accretion | 19,356 | 17,131 | ||||||
Transaction costs | 2,591 | 1,482 | ||||||
|
|
|
| |||||
Operating loss | (35,019 | ) | (41,860 | ) | ||||
Other (income) expense, net | (194 | ) | 433 | |||||
Loss on debt financings | — | 3,115 | ||||||
Interest expense | 18,819 | 13,367 | ||||||
|
|
|
| |||||
Loss from continuing operations before taxes | (53,644 | ) | (58,775 | ) | ||||
Income tax benefit | (596 | ) | (2,621 | ) | ||||
|
|
|
| |||||
Loss from continuing operations | (53,048 | ) | (56,154 | ) | ||||
Loss from discontinued operations | 20 | 123 | ||||||
|
|
|
| |||||
Net loss | (53,068 | ) | (56,277 | ) | ||||
Net loss attributable to noncontrolling interest | (2,515 | ) | (3,456 | ) | ||||
|
|
|
| |||||
Net loss attributable to member of Summit Materials, LLC | $ | (50,553 | ) | $ | (52,821 | ) | ||
|
|
|
| |||||
Three months ended March 29, 2014 and March 30, 2013
(All comparisons are with the three months ended March 30, 2013, unless noted)
| Three Months Ended | ||||||||||||
| March 29, | March 30, | |||||||||||
| ($ in thousands) | 2014 | 2013 | Variance | |||||||||
Revenue | $ | 151,091 | $ | 106,829 | 41.4 | % | ||||||
Operating loss | (35,019 | ) | (41,860 | ) | (16.3 | )% | ||||||
Operating margin | (23.2 | )% | (39.2 | )% | ||||||||
Adjusted EBITDA | $ | (15,469 | ) | $ | (28,277 | ) | 45.3 | % | ||||
Revenue in the three months ended March 29, 2014 increased $44.3 million, or 41.4%, due to improved volumes and pricing across our product lines, driven by the January 17, 2014 acquisition of Alleyton and the April 1, 2013 acquisitions of the Lafarge-Wichita assets and Westroc. Product revenue increased $35.8 million as a result of improved pricing and volume increases in aggregates, ready-mixed concrete and asphalt paving mix. Detail of consolidated percent changes in production volumes and pricing were as follows:
30
Table of Contents
| Percentage Change in | ||||||||
| Volume | Pricing | |||||||
Aggregates | 48.9 | % | 1.9 | % | ||||
Cement | (33.6 | %) | 16.5 | % | ||||
Ready-mixed concrete | 267.7 | % | (12.0 | )% | ||||
Asphalt | 18.3 | % | 8.0 | % | ||||
Aggregates and ready-mixed concrete volumes were positively affected by the Alleyton, Lafarge-Wichita and Westroc acquisitions, resulting in increased revenue of $45.3 million in 2014. The decrease in ready-mixed concrete pricing was a result of different pricing structures across our markets, particularly in the Houston, Texas market, which we entered into with the Alleyton acquisition in January 2014. Our cement volumes decreased 33.6% due to adverse weather conditions and a shift in customer mix, which was partially offset by increased pricing resulting from the customer mix shift. The effect from the price and volume changes resulted in a net increase in revenue of $47.3 million in 2014, which was partially offset by the disposition of certain non-core operations, such as the sale of concrete block assets in the East region and precast and concrete pipe assets in the West region.
Operating loss
Our operating loss decreased $6.8 million in the three months ended March 29, 2014. Operating margin, which we define as operating income as a percentage of revenue, improved 16%. These profit improvements were driven by the following:
| • | Improved pricing across our aggregates, cement and asphalt products. |
| • | A $1.3 million curtailment benefit recognized in 2014 related to a retiree postretirement benefit plan we maintain for certain union employees. Effective January 1, 2014, the healthcare and life insurance benefits plan for employees at the cement plant was amended to eliminate all future retiree health and life coverage for the remaining union employees. |
| • | A decline in general and administrative costs, as a percentage of revenue, from 31.8% to 23.5%. During 2013, we strengthened our infrastructure (finance, information technology, legal and human resources) and expect the growth in general and administrative costs to stabilize during 2014. Included in the reduction in general and administrative costs was a $1.8 million charge recognized in the three months ended March 30, 2013 to remove a sunken barge from the Mississippi River. |
| • | Offsetting these profit improvements were $1.1 million of increased transaction costs primarily as a result of the January 17, 2014 acquisition of Alleyton. |
Adjusted EBITDA
Adjusted EBITDA increased $12.8 million in the three months ended March 29, 2014, related to the following:
| • | Operating loss decreased $6.8 million, primarily as a result of the margin improvement discussed above. |
| • | In 2014, we did not have a refinancing loss compared to a $3.1 million loss on the February 2013 debt repricing. |
Other Financial Information
Loss on debt financings
In February 2013, we completed a repricing of our credit facility, which provides for term loans in an aggregate amount of $422.0 million and revolving credit commitments in an aggregate amount of $150.0 million (the “Credit Facility”), which reduced our stated term-loan interest rate by 1.0% and provided additional borrowing capacity of $25.0 million. As a result of the repricing, we recognized a loss of $3.1 million for related bank fees in 2013.
Interest expense
Interest expense increased $5.5 million in the three months ended March 29, 2014 due to the additional $260.0 million of 10.5% senior notes issued on January 17, 2014.
Discontinued operations
As part of our strategy to focus on our core business as a heavy-side building materials company, we have exited certain operations in recent years, including concrete paving operations in the East region. Revenue from these discontinued operations was $0.3 million in the three months ended March 29, 2014 and $3.5 million in the three months ended March 30, 2013.
31
Table of Contents
Segment results of operations
Central Region
| Three Months Ended | ||||||||||||
| March 29, | March 30, | |||||||||||
| ($ in thousands) | 2014 | 2013 | Variance | |||||||||
Revenue | $ | 47,542 | $ | 35,900 | 32.4 | % | ||||||
Operating loss | (9,365 | ) | (13,018 | ) | 28.1 | % | ||||||
Operating margin | (19.7 | )% | (36.3 | )% | ||||||||
Adjusted EBITDA | $ | (423 | ) | $ | (5,954 | ) | 92.9 | % | ||||
Revenue in the Central region increased $11.6 million, or 32.4%, in the three months ended March 29, 2014. Revenue from acquisitions totaled $4.9 million for the three months ended March 29, 2014. Improved weather in the region, particularly in March 2014, and the April 1, 2013 acquisition of the Lafarge-Wichita assets contributed to increases in aggregates, ready-mixed concrete and asphalt volumes. In addition, asphalt prices increased 20.2% due to a concentration of higher grade asphalt mixes in 2014, which commanded a higher price due to higher material input cost. Cement volumes decreased 33.6% as a result of poor weather conditions, primarily in January and February and extending into the second quarter, in certain key markets, limiting sales and mobility on the Mississippi River. Cement volumes and pricing were affected by a shift in customer mix away from high-volume customers. The Central region’s percent changes in production volumes and pricing were as follows:
| Percentage Change in | ||||||||
| Volume | Pricing | |||||||
Aggregates | 33.4 | % | 1.9 | % | ||||
Cement | (33.6 | %) | 16.5 | % | ||||
Ready-mixed concrete | 86.0 | % | 4.0 | % | ||||
Asphalt | 260.0 | % | 20.2 | % | ||||
Operating loss
The Central region’s operating loss decreased $3.7 million and operating margin improved 16.6% in the three months ended March 29, 2014. The increased profitability was largely driven by the 86.0% increase in ready-mixed concrete volumes and improved pricing across all product lines. Margin was also positively affected by synergies realized from the April 1, 2013 acquisition of the Lafarge-Wichita assets, a $1.3 million curtailment benefit recognized in the three months ended March 29, 2014 related to a retiree postretirement benefit plan maintained for certain union employees and a $1.8 million charge recognized in the three months ended March 30, 2013 to remove a sunken barge from the Mississippi River.
Adjusted EBITDA
Adjusted EBITDA improved $5.5 million in the three months ended March 29, 2014, as a result of increased volumes and improved pricing. In addition, during the three months ended March 30, 2013, we realized a $0.6 million loss on debt financing and a $1.8 million charge to remove a sunken barge from the Mississippi River.
32
Table of Contents
West Region
| Three Months Ended | ||||||||||||
| March 29, | March 30, | |||||||||||
| ($ in thousands) | 2014 | 2013 | Variance | |||||||||
Revenue | $ | 94,894 | $ | 60,063 | 58.0 | % | ||||||
Operating loss | (5,106 | ) | (11,015 | ) | 53.6 | % | ||||||
Operating margin | (5.4 | )% | (18.3 | )% | ||||||||
Adjusted EBITDA | $ | 1,791 | $ | (6,722 | ) | 126.6 | % | |||||
Revenue in the West region increased 58.0% in the three months ended March 29, 2014 due primarily to acquisitions and improved weather conditions. Incremental revenue from acquisitions totaled $29.9 million in the three months ended March 29, 2014. The increase was attributable to increases in aggregates, ready-mixed concrete and asphalt volumes and increases in aggregates and asphalt pricing. The West region’s percent changes in production volumes and pricing were as follows:
| Percentage Change in | ||||||||
| Volume | Pricing | |||||||
Aggregates | 103.5 | % | 8.0 | % | ||||
Ready-mixed concrete | 390.5 | % | (19.0 | )% | ||||
Asphalt | 11.5 | % | 7.6 | % | ||||
Operating loss
The West region recognized an operating loss of $5.1 million in the three months ended March 29, 2014 compared to $11.0 million in the comparable period in 2013. Operating margin improved 12.9% in the three months ended March 29, 2014. The improvement was primarily driven by higher pricing in aggregates and asphalt. Warmer weather in the state of Texas and the acquisitions of Alleyton and Westroc resulted in greater sales of our ready-mixed concrete.
Adjusted EBITDA
Adjusted EBITDA improved $8.5 million to $1.8 million in the three months ended March 29, 2014 from $(6.7) million primarily due to increases in the pricing of our aggregates and asphalt and increased volumes in aggregates, ready-mixed concrete and asphalt.
East Region
| Three Months Ended | ||||||||||||
| March 29, | March 30, | |||||||||||
| ($ in thousands) | 2014 | 2013 | Variance | |||||||||
Revenue | $ | 8,655 | $ | 10,866 | (20.3 | )% | ||||||
Operating loss | (12,556 | ) | (11,377 | ) | (10.4 | )% | ||||||
Operating margin | (145.1 | )% | (104.7 | )% | ||||||||
Adjusted EBITDA | $ | (9,338 | ) | $ | (9,533 | ) | 2.0 | % | ||||
Revenue in the East region decreased 20.3% in the three months ended March 29, 2014 primarily as a result of a 13.3% decline in aggregates volume, which was partially offset by a 3.6% increase in pricing.
33
Table of Contents
Operating loss
The East region recognized an operating loss of $12.6 million in the three months ended March 29, 2014 compared to $11.4 million in the comparable period in 2013, resulting in a 40.4% decrease in operating margin. The decrease in operating margin was a result of higher stripping costs and lower production output in aggregates.
Adjusted EBITDA
Adjusted EBITDA increased by $0.2 million in the three months ended March 29, 2014. After taking into consideration a $1.2 million loss on debt financings in the three months ended March 30, 2013, the remaining change in Adjusted EBITDA was consistent with the increased operating loss discussed above.
Liquidity and Capital Resources
Our primary sources of liquidity include cash on-hand, cash provided by our operations and amounts available for borrowing under our credit facilities. As of March 29, 2014, we had $34.1 million in cash and working capital of $117.3 million as compared to cash and working capital of $14.9 million and $85.4 million, respectively, at December 28, 2013. Working capital is calculated as current assets less current liabilities, excluding the current portion of long-term debt and outstanding borrowings on our senior secured revolving credit facility (the “Revolver”). There were no restricted cash balances as of March 29, 2014 or December 28, 2013. Our remaining borrowing capacity on our Revolver as of March 29, 2014 was $131.7 million, which is net of $18.3 million of outstanding letters of credit.
Given the seasonality of our business, we typically experience significant fluctuations in working capital needs and balances throughout the year. Our working capital requirements generally increase during the first half of the year as we build up inventory and focus on repair and maintenance and other set up costs for the upcoming season. Working capital levels then decrease as we wind down the construction season and enter the winter months, which is when we see significant inflows of cash from the collection of receivables. For example, net cash used for operating activities in the three months ended March 30, 2013 was $45.9 million, compared to full year 2013 net cash provided by operating activities of $66.4 million. Net cash used for operating activities in the three months ended March 29, 2014 was $50.4 million.
We believe we have access to sufficient financial resources from our liquidity sources to fund our business and operations, including contractual obligations, capital expenditures and debt service obligations, for at least the next twelve months. Our growth strategy contemplates future acquisitions for which we believe we have sufficient access to capital. As of March 29, 2014, we had approximately $330.6 million of funding commitments from our equity sponsors outstanding.
Indebtedness
Please refer to the notes to the consolidated interim financial statements for detailed information on our long-term debt and Revolver, scheduled maturities of long-term debt and affirmative and negative covenants, including the maximum allowable consolidated first lien net leverage and interest coverage ratios.
At March 29, 2014 and December 28, 2013, $928.8 million and $695.9 million, respectively, of total debt, without giving effect to original issuance discount or premium, were outstanding under our respective debt agreements. As of March 29, 2014, the Company was in compliance with all debt covenants.
Summit Materials and its wholly-owned subsidiary, Finance Corp, have issued $510.0 million aggregate principal amount of 10.5% Senior Notes due January 31, 2020 (the “Senior Notes”) under an indenture dated as of January 30, 2012 (as amended and supplemented, the “Indenture”), $250.0 million was issued on January 30, 2012 and $260.0 million on January 17, 2014. The Company received proceeds of $282.8 million, before payment of fees and expenses, from issuance of the additional $260.0 million senior notes. The proceeds from the January 2014 issuance were used for the purchase of Alleyton, to make payments on the Revolver and for general corporate purposes.
In addition to the Senior Notes, Summit Materials has a senior secured credit facility (the “Credit Facility”), which provides for term loans in an aggregate amount of $422.0 million and credit commitments under the Revolver in an aggregate amount of $150.0 million. Summit Materials’ wholly-owned subsidiary companies and its non wholly-owned subsidiary, Continental Cement, are named as guarantors of the Senior Notes and the Credit Facility. Certain other partially-owned subsidiaries, including a subsidiary of Continental Cement, do not guarantee the Senior Notes. In addition, the Company has pledged substantially all of its assets as collateral for the Credit Facility.
34
Table of Contents
Cash Flows
The following table summarizes our net cash used for or provided by operating, investing and financing activities and our capital expenditures in the three months ended March 29, 2014 and March 30, 2013:
| Three Months Ended | ||||||||
| March 29, | March 30, | |||||||
| (in thousands) | 2014 | 2013 | ||||||
Net cash (used for) provided by | ||||||||
Operating activities | $ | (50,375 | ) | $ | (45,896 | ) | ||
Investing activities | (200,246 | ) | (10,546 | ) | ||||
Financing activities | 269,839 | 98,985 | ||||||
Cash paid for capital expenditures | $ | (19,941 | ) | $ | (16,405 | ) | ||
Operating activities
For the three months ended March 29, 2014, cash used in operating activities was $50.4 million primarily as a result of:
| • | Net loss of $53.1 million, adjusted for non-cash expenses of $21.3 million, including $20.8 million of depreciation, depletion, amortization and accretion. |
| • | The timing of payments associated with accounts payable and accrued expenses utilized $19.9 million of cash in conjunction with the build-up of inventory levels and incurrence of repairs and maintenance to prepare the business for increased sales volumes in the summer and fall. In the three months ended March 29, 2014, there were cash interest payments of $20.0 million as interest on our notes is payable in January and July of each year and interest on our Credit Facility is due on the last business day of each calendar quarter. Almost all of our products are consumed and services provided outdoors. Our highest sales and earnings are normally in the spring, summer and fall months, primarily in the second and third quarters, and our lowest sales are in the winter months of the first and fourth quarters. Accordingly, during the winter months, particularly in the first quarter, our payments on accounts payable and accrued expenses outstanding from the prior year-end typically exceed new accounts payable and accrued expenses generated during the quarter, resulting in a net cash outflow. |
| • | Accounts receivable provided $17.0 million of cash from December 28, 2013 to March 29, 2014. In conjunction with the seasonality of our business, the majority of our sales occur in the spring, summer and fall and we typically incur an increase in accounts receivable (net billed and unbilled) during the second and third quarters of each year. This amount is typically converted to cash in the fourth and first quarters. |
For the three months ended March 30, 2013, cash used for operating activities was $45.9 million primarily as a result of:
| • | Net loss of $56.3 million, adjusted for non-cash expenses, including $18.5 million of depreciation, depletion, amortization and accretion and a $3.0 million loss on our February 2013 debt refinancing. |
| • | Accounts payable and accrued expenses utilized additional cash from operations of $31.0 million from December 29, 2012 to March 30, 2013 due to $24.8 million of interest payments in the first quarter and as a result of the seasonality of our business. The December 2012 and March 2013 interest payments on the Credit Facility were both made in the three months ended March 30, 2013. |
| • | Inventory utilized $10.5 million of cash from December 29, 2012 to March 30, 2013. This increase is driven by the seasonality of our business for which our inventory levels typically decrease in the fourth quarter in preparation for the winter slowdown and are then increased at the end of the first quarter in preparation for the increased sales volumes in the spring. |
| • | Accounts receivable provided $32.6 million of additional cash from December 29, 2012 to March 30, 2013, which partially offset the decreases in cash from our operations, payments on accounts payable and accrued expenses and the cash utilized to increase our inventory levels. Consistent with the seasonal impact on our accounts payable and accrued expenses, collections on accounts receivable in the first quarter typically outpace new receivables generated from sales, resulting in a net cash inflow from accounts receivable during the three months ended March 30, 2013. |
35
Table of Contents
Investing activities
For the three months ended March 29, 2014, cash used for investing activities was $200.2 million, $182.5 million of which related to the January 17, 2014 acquisition of Alleyton in Houston, Texas. In addition, we invested $19.9 million in capital expenditures, offset by $2.2 million of proceeds from depreciable asset sales. Approximately $6.5 million of the capital expenditures were invested in our cement business in Hannibal, Missouri, for continued development of an underground mine ($3.0 million), as well as improvements made to the cement plant during the annual scheduled winter shutdown in February 2014.
For the three months ended March 30, 2013, cash used for investing activities was $10.5 million. We paid $16.4 million for capital expenditures, offset by $5.9 million of proceeds from depreciable asset sales. Approximately $6.4 million of the capital expenditures were invested in our cement business in Hannibal, Missouri, which related to continued development of the underground mine ($2.4 million) and a dome in St. Louis, Missouri that expanded our cement storage capacity ($1.4 million) as well as improvements made to the cement plant during the annual scheduled winter shutdown in February 2013.
Financing activities
For the three months ended March 29, 2014, cash provided by financing activities was $269.8 million, which was primarily composed of $282.8 million net proceeds from the January 2014 issuance of $260.0 million Senior Notes, at a premium of $22.8 million, less fees and repayments on the Revolver. Approximately $182.5 million of the funds from the borrowings were used to purchase Alleyton. The remaining funds have been used to fund working capital needs. In addition, we received contributions from our member of $24.4 million and made $0.6 million of payments on our acquisition related liabilities in the three months ended March 29, 2014.
For the three months ended March 30, 2013, cash provided by financing activities was $99.0 million, which is primarily composed of the February 2013 repricing transaction, through which our outstanding borrowings increased $25.0 million, and $79.5 million of borrowings on the revolving credit facility. Approximately $62.0 million of the funds from the borrowings were used on April 1, 2013 to purchase certain assets of Lafarge North America, Inc. in Wichita, Kansas and of Westroc, LLC near Salt Lake City, Utah.
Cash paid for capital expenditures
We expended approximately $19.9 million in capital expenditures in the three months ended March 29, 2014 compared to $16.4 million in the three months ended March 30, 2013. The 2014 capital expenditures include continued development of an underground mine to extract limestone on our Hannibal, Missouri property where our cement plant is located ($3.0 million), $2.9 million of land purchases in Kansas and Kentucky and various other pieces of equipment and rolling stock.
We estimate that we will incur between $71.0 million and $76.0 million in capital expenditures in 2014, which we have funded or expect to fund through our cash on hand, cash from operations, outside financing and available borrowings under our Credit Facility. In 2014, we expect to continue investing in Texas, including installation of a new asphalt plant in San Antonio, Texas and a new sand and gravel processing plant near Houston, Texas. We expect to spend approximately $15.0 million during 2014 on these projects. In addition, we expect to spend $5.9 million in 2014 to complete the underground mine at our cement plant, gaining access to over 200 years of proven and probable limestone reserves.
Commitments and contingencies
The Company is party to certain legal actions arising from the ordinary course of business activities. Accruals are recorded when the outcome is probable and can be reasonably estimated in accordance with applicable accounting requirements. While the ultimate results of claims and litigation cannot be predicted with certainty, management expects that the ultimate resolution of all current pending or threatened claims and litigation will not have a material effect on the Company’s consolidated results of operations, financial position or liquidity.
We are obligated under an indemnification agreement entered into with the sellers of Harper Contracting, Inc., Harper Sand and Gravel, Inc., Harper Ready Mix Company, Inc. and Harper Investments, Inc. (collectively, “Harper”) for the sellers’ ownership interests in a joint venture agreement. We have the rights to any benefits under the joint venture as well as the assumption of any obligations, but do not own equity interests in the joint venture. The joint venture has incurred significant losses on a highway project in Utah, which have resulted in requests for funding from the joint venture partners and, ultimately, from the Company. Through March 29, 2014, we have funded $8.8 million, $4.0 million was funded in 2012 and $4.8 million was funded in 2011. As of March 29, 2014 and December 28, 2013, an accrual of $4.3 million was recorded in other noncurrent liabilities for this matter.
36
Table of Contents
We are obligated under various firm purchase commitments for certain raw materials and services that are in the ordinary course of business. The terms of these agreements are generally less than one year. Management does not expect any significant changes in the market value of these goods and services during the commitment period that would have a material adverse effect on the financial position, results of operations or liquidity of the Company.
Off-Balance sheet arrangements
As of March 29, 2014, we had no material off-balance sheet arrangements.
New Accounting Standards
In April 2014, the FASB issued Accounting Standards Update (“ASU”) No. 2014-08, Reporting Discontinued Operations and Disclosures of Disposals of Components of an Entity, which changes the criteria for determining which disposals can be presented as discontinued operations and modifies related disclosure requirements. Under the new guidance, a discontinued operation is defined as a disposal of a component or group of components that is disposed of or is classified as held for sale and “represents a strategic shift that has (or will have) a major effect on an entity’s operations and financial results.” This ASU is effective for fiscal years beginning on or after December 15, 2014, and interim periods within that annual period, with early adoption permitted. We do not expect the adoption of this standard to have a material impact on our consolidated financial statements.
| ITEM 3. | QUANTITATIVE AND QUALITATIVE DISCLOSURES ABOUT MARKET RISK |
We are exposed to certain market risks arising from transactions that are entered into in the normal course of business. Our operations are highly dependent upon the interest rate-sensitive construction industry as well as the general economic environment. These marketplaces could experience lower levels of economic activity in an environment of rising interest rates or escalating costs.
Management has considered the current economic environment and its potential effect to our business. Demand for aggregates products, particularly in the residential and nonresidential construction markets, could decline if companies and consumers are unable to obtain financing for construction projects or if an economic recession causes delays or cancellations to capital projects. Additionally, declining tax revenue and state budget deficits have negatively affected states’ abilities to finance infrastructure construction projects. In the three months ended March 29, 2014, there have been no material changes in our market risk exposures since December 28, 2013. For a discussion of quantitative and qualitative disclosures about market risk, please refer to theForm 10-K.
| ITEM 4. | CONTROLS AND PROCEDURES |
Disclosure Controls and Procedures
We maintain disclosure controls and procedures that are designed to ensure that information required to be disclosed in the Company’s reports under the Securities and Exchange Act of 1934, as amended (the “Exchange Act”), is recorded, processed, summarized and reported within the time periods specified in the SEC’s rules and forms, and that such information is accumulated and communicated to the Company’s management, including the Company’s Chief Executive Officer and the Company’s Chief Financial Officer, as appropriate, to allow timely decisions regarding required disclosure. Any controls and procedures, no matter how well designed and operated, can provide only reasonable, not absolute, assurance of achieving the desired control objectives. The Company’s management, with the participation of the Company’s Chief Executive Officer and Chief Financial Officer, has evaluated the effectiveness of the Company’s disclosure controls and procedures (as such term is defined in Rules 13a-15(e) and 15d-15(e) under the Exchange Act) as of March 29, 2014. Based upon that evaluation, the Company’s Chief Executive Officer and Chief Financial Officer concluded that, as of March 29, 2014, the Company’s disclosure controls and procedures were effective to accomplish their objectives at the reasonable assurance level.
Changes in Internal Control over Financial Reporting
There was no change in the Company’s internal control over financial reporting (as such term is defined in Rules 13a-15(f) and 15d-15(f) under the Exchange Act) that occurred during the Company’s last fiscal quarter that has materially affected, or is reasonably likely to materially affect, the Company’s internal control over financial reporting.
37
Table of Contents
| ITEM 1. | LEGAL PROCEEDINGS |
We are party to certain legal actions arising from the ordinary course of business activities. Accruals are recorded when the outcome is probable and can be reasonably estimated in accordance with applicable accounting requirements. While the ultimate results of claims and litigation cannot be predicted with certainty, management expects that the ultimate resolution of all current pending or threatened claims and litigation will not have a material effect on the Company’s consolidated results of operations, financial position or liquidity.
| ITEM 1A. | RISK FACTORS |
In addition to the other information set forth in this report, you should carefully consider the factors discussed in the section entitled “Risk Factors” in the Form 10-K, which could materially affect the Company’s business, financial condition, operating results or liquidity or future results. The risks described in the Form 10-K are not the only risks facing the Company. Additional risks and uncertainties not currently known to the Company or that it currently deems to be immaterial also may materially adversely affect its business, financial condition, operating results or liquidity. There have been no material changes to the risk factors disclosed in the Form 10-K.
| ITEM 2. | UNREGISTERED SALES OF EQUITY SECURITIES AND USE OF PROCEEDS |
None.
| ITEM 3. | DEFAULTS UPON SENIOR SECURITIES |
None.
| ITEM 4. | MINE SAFETY DISCLOSURES |
The information concerning mine safety violations and other regulatory matters required by Section 1503(a) of the Dodd-Frank Wall Street Reform and Consumer Protection Act and Item 104 of Regulation S-K (17 CFR 229.104) is included in Exhibit 95.1 to this report.
| ITEM 5. | OTHER INFORMATION |
Pursuant to Section 219 of the Iran Threat Reduction and Syria Human Rights Act of 2012 (“ITRA”), which added Section 13(r) of the Exchange Act, the Company hereby incorporates by reference herein Exhibit 99.1 of this report, which includes disclosures publicly filed and/or provided to The Blackstone Group L.P., an affiliate of certain investment funds that indirectly own a majority of the equity interests of the Company, by Travelport Limited, which may be considered the Company’s affiliate.
We are not presently aware that we and our subsidiaries knowingly engaged in any transaction or dealing reportable under Section 13(r) of the Exchange Act during the quarter ended March 29, 2014.
| ITEM 6. | EXHIBITS |
| 3.1 | Certificate of Formation of Summit Materials, LLC, as amended (incorporated by reference from Exhibit 3.1 to the Registration Statement on Form S-4, filed on March 27, 2013 (File No. 333-187556)). | |
| 3.2 | Amended and Restated Limited Liability Company Agreement of Summit Materials, LLC (incorporated by reference from Exhibit 3.2 to the Registration Statement on Form S-4, filed on March 27, 2013 (File No. 333-187556)). | |
| 4.1 | Second Supplemental Indenture, dated as of January 17, 2014, among Summit Materials, LLC, Summit Materials Finance Corp., the guarantors named therein and Wilmington Trust, National Association, as trustee (incorporated by reference to Exhibit 4.4 filed with the registrant’s Current Report on Form 8-K, filed on January 23, 2014). | |
| 4.2 | Third Supplemental Indenture, dated as of February 21, 2014, among Alcomat, LLC, Alleyton Resource Company, LLC, Alleyton Services Company, LLC and Wilmington Trust, National Association, as trustee (incorporated by reference to Exhibit 4.4 filed with the registrant’s Annual Report on Form 10-K, filed on March 7, 2014). | |
38
Table of Contents
| 4.3 | Registration Rights Agreement, dated as of January 17, 2014, among Summit Materials, LLC, Summit Materials Finance Corp., the guarantors named therein, Merrill Lynch, Pierce, Fenner & Smith Incorporated, on behalf of the initial purchasers (incorporated by reference to Exhibit 4.5 filed with the registrant’s Current Report on Form 8-K, filed January 23, 2014). | |
| 10.1 | Amendment No. 2, dated as of January 16, 2014, to the Credit Agreement, dated as of January 30, 2012 and amended as of February 5, 2013, by and among Summit Materials, LLC, the guarantors party thereto, Bank of America, N.A., as administrative agent, collateral agent, L/C issuer and swing line lender and the other parties thereto (incorporated by reference to Exhibit 10.1 filed with the registrant’s Current Report on Form 8-K, filed on January 23, 2014). | |
| 10.2 | Amendment dated January 14, 2014, to Acquisition Agreement, dated as of December 5, 2013, among Alleyton Resource Corporation, Colorado Gulf, LP, Texas CGC, LLC, Barten Shepard Investments, LP, TBGSI Corp., the individuals signatory thereto and Summit Materials, LLC (incorporated by reference to Exhibit 10.7 filed with the registrant’s Annual Report on Form 10-K, filed on March 7, 2014). | |
| 31.1* | Certification of the Chief Executive Officer pursuant to Rule 13a-14(a) or Rule 15d-14(a) of the Securities Exchange Act of 1934, as adopted pursuant to Section 302 of the Sarbanes-Oxley Act of 2002. | |
| 31.2* | Certification of the Chief Financial Officer pursuant to Rule 13a-14(a) or Rule 15d-14(a) of the Securities Exchange Act of 1934, as adopted pursuant to Section 302 of the Sarbanes-Oxley Act of 2002. | |
| 32.1** | Certification of the Chief Executive Officer pursuant to 18 U.S.C. Section 1350, as adopted pursuant to Section 906 of the Sarbanes-Oxley Act of 2002. | |
| 32.2** | Certification of the Chief Financial Officer pursuant to 18 U.S.C. Section 1350, as adopted pursuant to Section 906 of the Sarbanes-Oxley Act of 2002. | |
| 95.1* | Mine Safety Disclosures. | |
| 99.1* | Section 13(r) Disclosure. | |
| 101.INS* | XBRL Instance Document | |
| 101.SCH* | XBRL Taxonomy Extension Schema Document | |
| 101.CAL* | XBRL Taxonomy Extension Calculation Linkbase Document | |
| 101.DEF* | XBRL Taxonomy Extension Definition Linkbase Document | |
| 101.LAB* | XBRL Taxonomy Extension Label Linkbase Document | |
| 101.PRE* | XBRL Taxonomy Extension Presentation Linkbase Document | |
| * | Filed herewith |
| ** | Furnished herewith |
The agreements and other documents filed as exhibits to this report are not intended to provide factual information or other disclosure other than with respect to the terms of the agreements or other documents themselves, and you should not rely on them for that purpose. In particular, any representations and warranties made by us in these agreements or other documents were made solely within the specific context of the relevant agreement or document and may not describe the actual state of affairs as of the date they were made or at any other time.
39
Table of Contents
Pursuant to the requirements of the Securities Exchange Act of 1934, the registrant has duly caused this report to be signed on its behalf by the undersigned, thereunto duly authorized.
| SUMMIT MATERIALS, LLC | ||||||
| Date: May 13, 2014 | By: | /s/ Thomas W. Hill | ||||
| Thomas W. Hill | ||||||
Chief Executive Officer (Principal Executive Officer) | ||||||
| Date: May 13, 2014 | By: | /s/ Brian J. Harris | ||||
| Brian J. Harris | ||||||
Chief Financial Officer (Principal Financial and Accounting Officer) | ||||||
40
Table of Contents
Exhibit 31.1
CERTIFICATION
I, Thomas W. Hill, certify that:
| 1. | I have reviewed this Quarterly Report on Form 10-Q of Summit Materials, LLC (the ���registrant”); |
| 2. | Based on my knowledge, this report does not contain any untrue statement of a material fact or omit to state a material fact necessary to make the statements made, in light of the circumstances under which such statements were made, not misleading with respect to the period covered by this report; |
| 3. | Based on my knowledge, the financial statements, and other financial information included in this report, fairly present in all material respects the financial condition, results of operations and cash flows of the registrant as of, and for, the periods presented in this report; |
| 4. | The registrant’s other certifying officer(s) and I are responsible for establishing and maintaining disclosure controls and procedures (as defined in Exchange Act Rules 13a-15(e) and 15d-15(e)) for the registrant and have: |
| (a) | Designed such disclosure controls and procedures, or caused such disclosure controls and procedures to be designed under our supervision, to ensure that material information relating to the registrant, including its consolidated subsidiaries, is made known to us by others within those entities, particularly during the period in which this report is being prepared; |
| (b) | [Reserved]; |
| (c) | Evaluated the effectiveness of the registrant’s disclosure controls and procedures and presented in this report our conclusions about the effectiveness of the disclosure controls and procedures, as of the end of the period covered by this report based on such evaluation; and |
| (d) | Disclosed in this report any change in the registrant’s internal control over financial reporting that occurred during the registrant’s most recent fiscal quarter (the registrant’s fourth fiscal quarter in the case of an annual report) that has materially affected, or is reasonably likely to materially affect, the registrant’s internal control over financial reporting; and |
| 5. | The registrant’s other certifying officer(s) and I have disclosed, based on our most recent evaluation of internal control over financial reporting, to the registrant’s auditors and the audit committee of the registrant’s board of directors (or persons performing the equivalent functions): |
| (a) | All significant deficiencies and material weaknesses in the design or operation of internal control over financial reporting which are reasonably likely to adversely affect the registrant’s ability to record, process, summarize and report financial information; and |
| (b) | Any fraud, whether or not material, that involves management or other employees who have a significant role in the registrant’s internal control over financial reporting. |
Date: May 13, 2014
/s/ Thomas W. Hill |
| Thomas W. Hill |
Chief Executive Officer (Principal Executive Officer) |
Table of Contents
Exhibit 31.2
CERTIFICATION
I, Brian J. Harris, certify that:
| 1. | I have reviewed this Quarterly Report on Form 10-Q of Summit Materials, LLC (the “registrant”); |
| 2. | Based on my knowledge, this report does not contain any untrue statement of a material fact or omit to state a material fact necessary to make the statements made, in light of the circumstances under which such statements were made, not misleading with respect to the period covered by this report; |
| 3. | Based on my knowledge, the financial statements, and other financial information included in this report, fairly present in all material respects the financial condition, results of operations and cash flows of the registrant as of, and for, the periods presented in this report; |
| 4. | The registrant’s other certifying officer(s) and I are responsible for establishing and maintaining disclosure controls and procedures (as defined in Exchange Act Rules 13a-15(e) and 15d-15(e)) for the registrant and have: |
| (a) | Designed such disclosure controls and procedures, or caused such disclosure controls and procedures to be designed under our supervision, to ensure that material information relating to the registrant, including its consolidated subsidiaries, is made known to us by others within those entities, particularly during the period in which this report is being prepared; |
| (b) | [Reserved]; |
| (c) | Evaluated the effectiveness of the registrant’s disclosure controls and procedures and presented in this report our conclusions about the effectiveness of the disclosure controls and procedures, as of the end of the period covered by this report based on such evaluation; and |
| (d) | Disclosed in this report any change in the registrant’s internal control over financial reporting that occurred during the registrant’s most recent fiscal quarter (the registrant’s fourth fiscal quarter in the case of an annual report) that has materially affected, or is reasonably likely to materially affect, the registrant’s internal control over financial reporting; and |
| 5. | The registrant’s other certifying officer(s) and I have disclosed, based on our most recent evaluation of internal control over financial reporting, to the registrant’s auditors and the audit committee of the registrant’s board of directors (or persons performing the equivalent functions): |
| (a) | All significant deficiencies and material weaknesses in the design or operation of internal control over financial reporting which are reasonably likely to adversely affect the registrant’s ability to record, process, summarize and report financial information; and |
| (b) | Any fraud, whether or not material, that involves management or other employees who have a significant role in the registrant’s internal control over financial reporting. |
Date: May 13, 2014
/s/ Brian J. Harris |
| Brian J. Harris |
Chief Financial Officer (Principal Financial Officer) |
Table of Contents
Exhibit 32.1
Certification
Pursuant to 18 U.S.C. Section 1350
as adopted pursuant to Section 906 of the Sarbanes-Oxley Act of 2002
In connection with the Quarterly Report of Summit Materials, LLC (the “Company”) on Form 10-Q for the quarter ended March 29, 2014 as filed with the Securities and Exchange Commission on the date hereof (the “Report”), I, Thomas W. Hill, Chief Executive Officer of the Company, certify, pursuant to 18 U.S.C. Section 1350, as adopted pursuant to Section 906 of the Sarbanes-Oxley Act of 2002, that:
| (i) | The Report fully complies with the requirements of Section 13(a) or 15(d) of the Securities Exchange Act of 1934; and |
| (ii) | The information contained in the Report fairly presents, in all material respects, the financial condition and results of operations of the Company. |
Date: May 13, 2014
/s/ Thomas W. Hill |
| Thomas W. Hill |
Chief Executive Officer (Principal Executive Officer) |
Table of Contents
Exhibit 32.2
Certification
Pursuant to 18 U.S.C. Section 1350
as adopted pursuant to Section 906 of the Sarbanes-Oxley Act of 2002
In connection with the Quarterly Report of Summit Materials, LLC (the “Company”) on Form 10-Q for the quarter ended March 29, 2014 as filed with the Securities and Exchange Commission on the date hereof (the “Report”), I, Brian J. Harris, Chief Financial Officer of the Company, certify, pursuant to 18 U.S.C. Section 1350, as adopted pursuant to Section 906 of the Sarbanes-Oxley Act of 2002, that:
| (i) | The Report fully complies with the requirements of Section 13(a) or 15(d) of the Securities Exchange Act of 1934; and |
| (ii) | The information contained in the Report fairly presents, in all material respects, the financial condition and results of operations of the Company. |
Date: May 13, 2014
/s/ Brian J. Harris |
| Brian J. Harris |
Chief Financial Officer (Principal Financial Officer) |
Table of Contents
Exhibit 95.1
Mine Safety Disclosures
The operation of the Company’s aggregates quarries and mines is subject to regulation by the federal Mine Safety and Health Administration (“MSHA”) under the Federal Mine Safety and Health Act of 1977 (the “Mine Act”). MSHA inspects the Company’s quarries and mines on a regular basis and issues various citations and orders when it believes a violation has occurred under the Mine Act. Whenever MSHA issues a citation or order, it also generally proposes a civil penalty, or fine, related to the alleged violation. Citations or orders may be contested and appealed, and as part of that process, are often reduced in severity and amount, and are sometimes dismissed.
Under the Dodd-Frank Wall Street Reform and Consumer Protection Act of 2010 (the “Dodd-Frank Act”), the Company is required to present information regarding certain mining safety and health citations which MSHA has issued with respect to its aggregates mining operations in its periodic reports filed with the Securities and Exchange Commission (“SEC”). In evaluating this information, consideration should be given to factors such as: (i) the number of citations and orders will vary depending on the size of the quarry or mine and types of operations (underground or surface), (ii) the number of citations issued will vary from inspector to inspector and location to location, and (iii) citations and orders can be contested and appealed, and in that process, may be reduced in severity and amount, and are sometimes dismissed.
The Company presents the following items regarding certain mining safety and health matters for the three months ended March 29, 2014, as applicable:
| • | Total number of violations of mandatory health or safety standards that could significantly and substantially contribute to the cause and effect of a mine safety or health hazard under section 104 of the Mine Act for which the Company has received a citation from MSHA (hereinafter, “Section 104 S&S Citations”). If MSHA determines that a violation of a mandatory health or safety standard is likely to result in a reasonably serious injury or illness under the unique circumstance contributed to by the violation, MSHA will classify the violation as a “significant and substantial” violation (commonly referred to as a “S&S” violation). MSHA inspectors will classify each citation or order written as a “S&S” violation or not. |
| • | Total number of orders issued under section 104(b) of the Mine Act (hereinafter, “Section 104(b) Orders”). These orders are issued for situations in which MSHA determines a previous violation covered by a Section 104(a) citation has not been totally abated within the prescribed time period, so a further order is needed to require the mine operator to immediately withdraw all persons (except authorized persons) from the affected area of a quarry or mine. |
| • | Total number of citations and orders for unwarrantable failure of the mine operator to comply with mandatory health or safety standards under Section 104(d) of the Mine Act (hereinafter, “Section 104(d) Citations and Orders”). These violations are similar to those described above, but the standard is that the violation could significantly and substantially contribute to the cause and effect of a safety or health hazard, but the conditions do not cause imminent danger, and the MSHA inspector finds that the violation is caused by an unwarranted failure of the operator to comply with the health and safety standards. |
| • | Total number of flagrant violations under section 110(b)(2) of the Mine Act (hereinafter, “Section 110(b)(2) Violations”). These violations are penalty violations issued if MSHA determines that violations are “flagrant”, for which civil penalties may be assessed. A “flagrant” violation means a reckless or repeated failure to make reasonable efforts to eliminate a known violation of a mandatory health or safety standard that substantially and proximately caused, or reasonably could have been expected to cause, death or serious bodily injury. |
| • | Total number of imminent danger orders issued under section 107(a) of the Mine Act (hereinafter, “Section 107(a) Orders”). These orders are issued for situations in which MSHA determines an imminent danger exists in the quarry or mine and results in orders of immediate withdrawal of all persons (except certain authorized persons) from the area of the quarry or mine affected by its condition until the imminent danger and the underlying conditions causing the imminent danger no longer exist. |
| • | Total dollar value of proposed assessments from MSHA under the Mine Act. These are the amounts of proposed assessments issued by MSHA with each citation or order for the time period covered by the reports. Penalties are assessed by MSHA according to a formula that considers a number of factors, including the mine operator’s history, size, negligence, gravity of the violation, good faith in trying to correct the violation promptly, and the effect of the penalty on the operator’s ability to continue in business. |
| • | Total number of mining-related fatalities. Mines subject to the Mine Act are required to report all fatalities occurring at their facilities unless the fatality is determined to be “non-chargeable” to the mining industry. The final rules of the SEC require disclosure of mining-related fatalities at mines subject to the Mine Act. Only fatalities determined by MSHA not to be mining-related may be excluded. |
Table of Contents
| • | Receipt of written notice from MSHA of a pattern (or a potential to have such a pattern) of violations of mandatory health or safety standards that are of such nature as could have significantly and substantially contributed to the cause and effect of other mine health or safety hazards under Section 104(e) of the Mine Act. If MSHA determines that a mine has a “pattern” of these types of violations, or the potential to have such a pattern, MSHA is required to notify the mine operator of the existence of such a thing. |
| • | Legal actions before the Federal Mine Safety and Health Review Commission (the “Commission”) pending as of the last day of period. |
| • | Legal actions before the Commission initiated during period. |
| • | Legal actions before the Commission resolved during period. |
The Commission is an independent adjudicative agency that provides administrative trial and appellate review of legal disputes arising under the Mine Act. The cases may involve, among other questions, challenges by operators to citations, orders and penalties they have received from MSHA, or complaints of discrimination by miners under Section 105 of the Mine Act. There were no legal actions pending before the Commission for any of the Company’s quarries and mines, as of or during the quarter ended March 29, 2014.
Appendix 1 follows.
Table of Contents
Appendix 1
Name of Company | Name of Operation | MSHA ID Number | State | Number of Inspections | Total Number of Section 104 S&S Citations | Section 104(b) Orders | Section 104(d) Citations and Orders | Section 110(b)(2) Violations | Section 107(a) Orders | Total Dollar Value of Proposed MSHA Assessments | Total Number of Mining Related Fatalities | Received Written Notice under Section 104(e) (yes/no) | Received Written Notice of potential Violation under 104(e) (yes/no) | Number of Contested Citations | Number of Contested Penalties | Total Dollar Value of Penalties in Contest | Number of Complaints of Discharge or Discrimination | |||||||||||||||||||||||||||||||||||||||||||||||||
Alleyton | Monahan | 4104552 | TX | 0 | 0 | 0 | 0 | 0 | 0 | $ | 0.00 | 0 | No | No | 0 | 0 | $ | 0.00 | 0 | |||||||||||||||||||||||||||||||||||||||||||||||
Alleyton | 4L Ranch | 4104416 | TX | 1 | 1 | 0 | 1 | 0 | 0 | $ | 0.00 | 0 | No | No | 0 | 0 | $ | 0.00 | 0 | |||||||||||||||||||||||||||||||||||||||||||||||
Alleyton | Potter Plant | 4104987 | TX | 0 | 0 | 0 | 0 | 0 | 0 | $ | 0.00 | 0 | No | No | 0 | 0 | $ | 0.00 | 0 | |||||||||||||||||||||||||||||||||||||||||||||||
Austin Materials | Hays Quarry | 4104514 | TX | 0 | 0 | 0 | 0 | 0 | 0 | $ | 0.00 | 0 | No | No | 0 | 0 | $ | 0.00 | 0 | |||||||||||||||||||||||||||||||||||||||||||||||
Austin Materials | Ramming Pit | 4104807 | TX | 0 | 0 | 0 | 0 | 0 | 0 | $ | 0.00 | 0 | No | No | 0 | 0 | $ | 0.00 | 0 | |||||||||||||||||||||||||||||||||||||||||||||||
Colorado Companies | Washplant 2 | 0504746 | CO | 0 | 0 | 0 | 0 | 0 | 0 | $ | 0.00 | 0 | No | No | 0 | 0 | $ | 0.00 | 0 | |||||||||||||||||||||||||||||||||||||||||||||||
Colorado Companies | Washplant 3 | 0504565 | CO | 0 | 0 | 0 | 0 | 0 | 0 | $ | 0.00 | 0 | No | No | 0 | 0 | $ | 0.00 | 0 | |||||||||||||||||||||||||||||||||||||||||||||||
Colorado Companies | Crusher 1 | 0504296 | CO | 0 | 0 | 0 | 0 | 0 | 0 | $ | 0.00 | 0 | No | No | 0 | 0 | $ | 0.00 | 0 | |||||||||||||||||||||||||||||||||||||||||||||||
Colorado Companies | Washplant 1 | 0504873 | CO | 0 | 0 | 0 | 0 | 0 | 0 | $ | 0.00 | 0 | No | No | 0 | 0 | $ | 0.00 | 0 | |||||||||||||||||||||||||||||||||||||||||||||||
Colorado Companies | Washplant 4 | 0503809 | CO | 0 | 0 | 0 | 0 | 0 | 0 | $ | 0.00 | 0 | No | No | 0 | 0 | $ | 0.00 | 0 | |||||||||||||||||||||||||||||||||||||||||||||||
Colorado Companies | Crusher 2 | 0504645 | CO | 2 | 5 | 0 | 0 | 0 | 0 | $ | 0.00 | 0 | No | No | 0 | 0 | $ | 0.00 | 0 | |||||||||||||||||||||||||||||||||||||||||||||||
Colorado Companies | Elam Construction Inc | 0504593 | CO | 0 | 0 | 0 | 0 | 0 | 0 | $ | 0.00 | 0 | No | No | 0 | 0 | $ | 0.00 | 0 | |||||||||||||||||||||||||||||||||||||||||||||||
Colorado Companies | Crusher 3 | 0504593 | CO | 0 | 0 | 0 | 0 | 0 | 0 | $ | 0.00 | 0 | No | No | 0 | 0 | $ | 0.00 | 0 | |||||||||||||||||||||||||||||||||||||||||||||||
Con-Agg of MO | Boon Quarries West | 2300022 | MO | 0 | 0 | 0 | 0 | 0 | 0 | $ | 0.00 | 0 | No | No | 1 | 1 | $ | 460.00 | 0 | |||||||||||||||||||||||||||||||||||||||||||||||
Con-Agg of MO | plant # 80 | 2302071 | MO | 1 | 0 | 0 | 0 | 0 | 0 | $ | 0.00 | 0 | No | No | 0 | 0 | $ | 0.00 | 0 | |||||||||||||||||||||||||||||||||||||||||||||||
Con-Agg of MO | Plant # 81 | 2302296 | MO | 3 | 0 | 0 | 0 | 0 | 0 | $ | 316.00 | 0 | No | No | 0 | 0 | $ | 0.00 | 0 | |||||||||||||||||||||||||||||||||||||||||||||||
Con-Agg of MO | Boon Quarries East | 2300078 | MO | 0 | 0 | 0 | 0 | 0 | 0 | $ | 0.00 | 0 | No | No | 0 | 0 | $ | 0.00 | 0 | |||||||||||||||||||||||||||||||||||||||||||||||
Con-Agg of MO | Huntsville Quarry | 2302004 | MO | 0 | 0 | 0 | 0 | 0 | 0 | $ | 0.00 | 0 | No | No | 0 | 0 | $ | 0.00 | 0 | |||||||||||||||||||||||||||||||||||||||||||||||
Con-Agg of MO | Con-Agg LLC dba Boone Quarries | 2302153 | MO | 2 | 0 | 0 | 0 | 0 | 0 | $ | 0.00 | 0 | No | No | 0 | 0 | $ | 0.00 | 0 | |||||||||||||||||||||||||||||||||||||||||||||||
Con-Agg of MO | Plant # 65 | 2301922 | MO | 1 | 2 | 0 | 0 | 0 | 0 | $ | 0.00 | 0 | No | No | 1 | 1 | $ | 100.00 | 0 | |||||||||||||||||||||||||||||||||||||||||||||||
Con-Agg of MO | Boone Quarries- North Telsmith Plant | 2301894 | MO | 1 | 0 | 0 | 0 | 0 | 0 | $ | 0.00 | 0 | No | No | 0 | 0 | $ | 0.00 | 0 | |||||||||||||||||||||||||||||||||||||||||||||||
Con-Agg of MO | Plant #83 | 2302338 | MO | 1 | 0 | 0 | 0 | 0 | 0 | $ | 0.00 | 0 | No | No | 0 | 0 | $ | 0.00 | 0 | |||||||||||||||||||||||||||||||||||||||||||||||
Continental Cement Company | Hannibal Plant | 2300217 | MO | 1 | 0 | 0 | 0 | 0 | 0 | $ | 0.00 | 0 | No | No | 0 | 0 | $ | 0.00 | 0 | |||||||||||||||||||||||||||||||||||||||||||||||
Continental Cement Company | Owensville Plant | 2301038 | MO | 0 | 0 | 0 | 0 | 0 | 0 | $ | 0.00 | 0 | No | No | 0 | 0 | $ | 0.00 | 0 | |||||||||||||||||||||||||||||||||||||||||||||||
Continental Cement Company | Hannibal Underground | 2302434 | MO | 1 | 0 | 0 | 0 | 0 | 0 | $ | 0.00 | 0 | No | No | 0 | 0 | $ | 0.00 | 0 | |||||||||||||||||||||||||||||||||||||||||||||||
Cornejo & Sons | Oxford Sand and Gravel | 1400522 | KS | 0 | 0 | 0 | 0 | 0 | 0 | $ | 0.00 | 0 | No | No | 0 | 0 | $ | 0.00 | 0 | |||||||||||||||||||||||||||||||||||||||||||||||
Cornejo & Sons | Wichita Sand and Gravel | 1400543 | KS | 1 | 1 | 0 | 0 | 0 | 0 | $ | 0.00 | 0 | No | No | 0 | 0 | $ | 0.00 | 0 | |||||||||||||||||||||||||||||||||||||||||||||||
Cornejo & Sons | Kingsbury | 1400624 | KS | 0 | 0 | 0 | 0 | 0 | 0 | $ | 0.00 | 0 | No | No | 0 | 0 | $ | 0.00 | 0 | |||||||||||||||||||||||||||||||||||||||||||||||
Cornejo & Sons | Grove | 1401539 | KS | 0 | 0 | 0 | 0 | 0 | 0 | $ | 0.00 | 0 | No | No | 0 | 0 | $ | 0.00 | 0 | |||||||||||||||||||||||||||||||||||||||||||||||
Cornejo & Sons | Durbin Quarry | 1401719 | KS | 0 | 0 | 0 | 0 | 0 | 0 | $ | 0.00 | 0 | No | No | 1 | 1 | $ | 5,000.00 | 0 | |||||||||||||||||||||||||||||||||||||||||||||||
Hamm, Inc | Plant #80006 | 1401471 | KS | 1 | 0 | 0 | 0 | 0 | 0 | $ | 0.00 | 0 | No | No | 0 | 0 | $ | 0.00 | 0 | |||||||||||||||||||||||||||||||||||||||||||||||
Hamm, Inc | Plant #80012 | 1401472 | KS | 1 | 0 | 0 | 0 | 0 | 0 | $ | 100.00 | 0 | No | No | 1 | 1 | $ | 2,473.00 | 0 | |||||||||||||||||||||||||||||||||||||||||||||||
Hamm, Inc | Plant # 80002 | 1401583 | KS | 0 | 0 | 0 | 0 | 0 | 0 | $ | 0.00 | 0 | No | No | 0 | 0 | $ | 0.00 | 0 | |||||||||||||||||||||||||||||||||||||||||||||||
Hamm, Inc | Plant # 80013 | 1401609 | KS | 0 | 0 | 0 | 0 | 0 | 0 | $ | 0.00 | 0 | No | No | 0 | 0 | $ | 0.00 | 0 | |||||||||||||||||||||||||||||||||||||||||||||||
Hamm, Inc | Plant # 80010 | 1401687 | KS | 0 | 0 | 0 | 0 | 0 | 0 | $ | 0.00 | 0 | No | No | 0 | 0 | $ | 0.00 | 0 | |||||||||||||||||||||||||||||||||||||||||||||||
Hamm, Inc | Plant # 80011 | 1401470 | KS | 1 | 1 | 0 | 0 | 0 | 0 | $ | 0.00 | 0 | No | No | 0 | 0 | $ | 0.00 | 0 | |||||||||||||||||||||||||||||||||||||||||||||||
Hamm, Inc | Plant # 80003 | 1401474 | KS | 0 | 0 | 0 | 0 | 0 | 0 | $ | 0.00 | 0 | No | No | 0 | 0 | $ | 0.00 | 0 | |||||||||||||||||||||||||||||||||||||||||||||||
Hamm, Inc | 85.9 | 1401759 | KS | 0 | 0 | 0 | 0 | 0 | 0 | $ | 0.00 | 0 | No | No | 0 | 0 | $ | 0.00 | 0 | |||||||||||||||||||||||||||||||||||||||||||||||
Hamm, Inc | Plant #81038 | 1401709 | KS | 1 | 1 | 0 | 0 | 0 | 0 | $ | 238.00 | 0 | No | No | 0 | 0 | $ | 0.00 | 0 | |||||||||||||||||||||||||||||||||||||||||||||||
Hinkle Contracting Company | Hart County Stone Company | 1500035 | KY | 0 | 1 | 0 | 0 | 0 | 0 | $ | 0.00 | 0 | No | No | 0 | 0 | $ | 0.00 | 0 | |||||||||||||||||||||||||||||||||||||||||||||||
Hinkle Contracting Company | Monroe Co. Stone | 1500101 | KY | 0 | 0 | 0 | 0 | 0 | 0 | $ | 0.00 | 0 | No | No | 0 | 0 | $ | 0.00 | 0 | |||||||||||||||||||||||||||||||||||||||||||||||
Hinkle Contracting Company | Allen Co. Stone | 1500063 | KY | 1 | 0 | 0 | 0 | 0 | 0 | $ | 0.00 | 0 | No | No | 0 | 0 | $ | 0.00 | 0 | |||||||||||||||||||||||||||||||||||||||||||||||
Hinkle Contracting Company | Glass Sand and Gravel | 1504261 | KY | 0 | 0 | 0 | 0 | 0 | 0 | $ | 0.00 | 0 | No | No | 0 | 0 | $ | 0.00 | 0 | |||||||||||||||||||||||||||||||||||||||||||||||
Hinkle Contracting Company | Bassett Stone Company | 1500004 | KY | 1 | 0 | 0 | 0 | 0 | 0 | $ | 300.00 | 0 | No | No | 0 | 0 | $ | 0.00 | 0 | |||||||||||||||||||||||||||||||||||||||||||||||
Hinkle Contracting Company | Tipton Ridge Quarry | 1500019 | KY | 1 | 0 | 0 | 0 | 0 | 0 | $ | 200.00 | 0 | No | No | 0 | 0 | $ | 0.00 | 0 | |||||||||||||||||||||||||||||||||||||||||||||||
Hinkle Contracting Company | Barren Co Stone | 1506863 | KY | 0 | 0 | 0 | 0 | 0 | 0 | $ | 0.00 | 0 | No | No | 0 | 0 | $ | 0.00 | 0 | |||||||||||||||||||||||||||||||||||||||||||||||
Hinkle Contracting Company | Casey Stone Company | 1500012 | KY | 0 | 0 | 0 | 0 | 0 | 0 | $ | 0.00 | 0 | No | No | 0 | 0 | $ | 0.00 | 0 | |||||||||||||||||||||||||||||||||||||||||||||||
Hinkle Contracting Company | Natural Bridge Stone | 1500075 | KY | 0 | 0 | 0 | 0 | 0 | 0 | $ | 0.00 | 0 | No | No | 0 | 0 | $ | 0.00 | 0 | |||||||||||||||||||||||||||||||||||||||||||||||
Hinkle Contracting Company | Somerset Stone Company | 1500094 | KY | 1 | 0 | 0 | 0 | 0 | 0 | $ | 0.00 | 0 | No | No | 0 | 0 | $ | 0.00 | 0 | |||||||||||||||||||||||||||||||||||||||||||||||
Hinkle Contracting Company | Lake Cumberland Stone | 1500099 | KY | 0 | 0 | 0 | 0 | 0 | 0 | $ | 0.00 | 0 | No | No | 0 | 0 | $ | 0.00 | 0 | |||||||||||||||||||||||||||||||||||||||||||||||
Hinkle Contracting Company | Cave Run Stone | 1507194 | KY | 0 | 0 | 0 | 0 | 0 | 0 | $ | 0.00 | 0 | No | No | 0 | 0 | $ | 0.00 | 0 | |||||||||||||||||||||||||||||||||||||||||||||||
Hinkle Contracting Company | Bourbon Limestone Company | 1518415 | KY | 0 | 0 | 0 | 0 | 0 | 0 | $ | 0.00 | 0 | No | No | 2 | 2 | $ | 2,100.00 | 0 | |||||||||||||||||||||||||||||||||||||||||||||||
Hinkle Contracting Company | Pulaski Stone Company | 1519092 | KY | 0 | 0 | 0 | 0 | 0 | 0 | $ | 0.00 | 0 | No | No | 0 | 0 | $ | 0.00 | 0 | |||||||||||||||||||||||||||||||||||||||||||||||
Hinkle Contracting Company | Jellico Stone Company | 4000057 | TN | 1 | 0 | 0 | 0 | 0 | 0 | $ | 0.00 | 0 | No | No | 0 | 0 | $ | 0.00 | 0 | |||||||||||||||||||||||||||||||||||||||||||||||
Hinkle Contracting Company | Ewing Stone | 4400234 | VA | 1 | 0 | 0 | 0 | 0 | 0 | $ | 0.00 | 0 | No | No | 0 | 0 | $ | 0.00 | 0 | |||||||||||||||||||||||||||||||||||||||||||||||
Kilgore Companies | Portable 1 | 4202528 | UT | 0 | 0 | 0 | 0 | 0 | 0 | $ | 0.00 | 0 | No | No | 0 | 0 | $ | 0.00 | 0 | |||||||||||||||||||||||||||||||||||||||||||||||
Kilgore Companies | West Valley | 4201980 | UT | 0 | 0 | 0 | 0 | 0 | 0 | $ | 0.00 | 0 | No | No | 0 | 0 | $ | 0.00 | 0 | |||||||||||||||||||||||||||||||||||||||||||||||
Kilgore Companies | Parleys Stone | 4202102 | UT | 0 | 0 | 0 | 0 | 0 | 0 | $ | 0.00 | 0 | No | No | 0 | 0 | $ | 0.00 | 0 | |||||||||||||||||||||||||||||||||||||||||||||||
Kilgore Companies | Black Canyon 2100 | 1002146 | ID | 0 | 0 | 0 | 0 | 0 | 0 | $ | 0.00 | 0 | No | No | 0 | 0 | $ | 0.00 | 0 | |||||||||||||||||||||||||||||||||||||||||||||||
Kilgore Companies | Powerscreen 2100- 2 | 1002147 | ID | 0 | 0 | 0 | 0 | 0 | 0 | $ | 0.00 | 0 | No | No | 0 | 0 | $ | 0.00 | 0 | |||||||||||||||||||||||||||||||||||||||||||||||
Kilgore Companies | Roadrunner Screen | 1001916 | ID | 1 | 0 | 0 | 0 | 0 | 0 | $ | 0.00 | 0 | No | No | 0 | 0 | $ | 0.00 | 0 | |||||||||||||||||||||||||||||||||||||||||||||||
Kilgore Companies | Mona Pit | 4202212 | UT | 0 | 0 | 0 | 0 | 0 | 0 | $ | 0.00 | 0 | No | No | 0 | 0 | $ | 0.00 | 0 | |||||||||||||||||||||||||||||||||||||||||||||||
Kilgore Companies | 42H0393 Crusher | 4801625 | WY | 0 | 0 | 0 | 0 | 0 | 0 | $ | 0.00 | 0 | No | No | 0 | 0 | $ | 0.00 | 0 | |||||||||||||||||||||||||||||||||||||||||||||||
Kilgore Companies | Kohlberg Wash Plant (Fear | 4801626 | WY | 0 | 0 | 0 | 0 | 0 | 0 | $ | 0.00 | 0 | No | No | 0 | 0 | $ | 0.00 | 0 | |||||||||||||||||||||||||||||||||||||||||||||||
Kilgore Companies | Stockton Pit | 4202480 | UT | 1 | 0 | 0 | 0 | 0 | 0 | $ | 0.00 | 0 | No | No | 0 | 0 | $ | 0.00 | 0 | |||||||||||||||||||||||||||||||||||||||||||||||
Kilgore Companies | Valley Pit | 4200400 | UT | 0 | 0 | 0 | 0 | 0 | 0 | $ | 0.00 | 0 | No | No | 0 | 0 | $ | 0.00 | 0 | |||||||||||||||||||||||||||||||||||||||||||||||
Kilgore Companies | Highland Pit | 4200941 | UT | 1 | 0 | 0 | 0 | 0 | 0 | $ | 100.00 | 0 | No | No | 0 | 0 | $ | 0.00 | 0 | |||||||||||||||||||||||||||||||||||||||||||||||
RK Hall Construction | Sawyer Plant | 3401950 | OK | 1 | 0 | 0 | 0 | 0 | 0 | $ | 0.00 | 0 | No | No | 0 | 0 | $ | 0.00 | 0 | |||||||||||||||||||||||||||||||||||||||||||||||
RK Hall Construction | Kirby Crusher #15 | 0301958 | AR | 1 | 1 | 0 | 0 | 0 | 0 | $ | 117.00 | 0 | No | No | 0 | 0 | $ | 0.00 | 0 | |||||||||||||||||||||||||||||||||||||||||||||||
Table of Contents
Exhibit 99.1
SECTION 13(R) DISCLOSURE
The disclosure reproduced below was initially included in a periodic report filed with the Securities and Exchange Commission by The Blackstone Group L.P. (“Blackstone”) in regard to Travelport Limited, which may be considered an affiliate of Blackstone, and therefore an affiliate of Summit Materials, LLC (“Summit Materials”). Summit Materials did not independently verify or participate in the preparation of this disclosure.
Blackstone included the following disclosure in its Form 10-Q for the fiscal quarter ended March 31, 2014:
Travelport Limited, which may be considered our affiliate, provided the disclosure reproduced below in connection with activities during the quarter ended March 31, 2014. We have not independently verified or participated in the preparation of this disclosure.
“As part of our global business in the travel industry, we provide certain passenger travel-related GDS and airline IT services to Iran Air. We also provide certain airline IT services to Iran Air Tours. All of these services are either exempt from applicable sanctions prohibitions pursuant to a statutory exemption permitting transactions ordinarily incident to travel or, to the extent not otherwise exempt, specifically licensed by the U.S. Office of Foreign Assets Control. Subject to any changes in the exempt/licensed status of such activities, we intend to continue these business activities, which are directly related to and promote the arrangement of travel for individuals.”
Travelport has not provided us with gross revenues and net profits attributable to the activities described above.
Table of Contents
UNITED STATES
SECURITIES AND EXCHANGE COMMISSION
Washington, D.C. 20549
FORM 10-Q
(Mark One)
| x | QUARTERLY REPORT PURSUANT TO SECTION 13 OR 15(d) OF THE SECURITIES EXCHANGE ACT OF 1934 |
For the quarterly period ended March 29, 2014
OR
| ¨ | TRANSITION REPORT PURSUANT TO SECTION 13 OR 15(d) OF THE SECURITIES EXCHANGE ACT OF 1934 |
For the transition period from to
Commission file number 333-187556-38
CONTINENTAL CEMENT COMPANY, L.L.C.
(Exact name of registrant as specified in its charter)
| Delaware | 27-2594654 | |
(State or other jurisdiction of incorporation or organization) | (I.R.S. Employer Identification No.) | |
16100 Swingley Ridge Road, Suite 230 Chesterfield, Missouri | 63017 | |
| (Address of principal executive offices) | (Zip Code) | |
Registrant’s telephone number, including area code: (636) 532-7440
Indicate by check mark whether the registrant (1) has filed all reports required to be filed by Section 13 or 15(d) of the Securities Exchange Act of 1934 during the preceding 12 months (or for such shorter period that the registrant was required to file such reports), and (2) has been subject to such filing requirements for the past 90 days. Yes x No ¨
Indicate by check mark whether the registrant has submitted electronically and posted on its corporate Web site, if any, every Interactive Data File required to be submitted and posted pursuant to Rule 405 of Regulation S-T (§232.405 of this chapter) during the preceding 12 months (or for such shorter period that the registrant was required to submit and post such files). Yes x No ¨
Indicate by check mark whether the registrant is a large accelerated filer, an accelerated filer, a non-accelerated filer, or a smaller reporting company. See the definitions of “large accelerated filer,” “accelerated filer” and “smaller reporting company” in Rule 12b-2 of the Exchange Act.
| Large accelerated filer | ¨ | Accelerated filer | ¨ | |||
| Non-accelerated filer | x (Do not check if a smaller reporting company) | Smaller reporting company | ¨ | |||
Indicate by check mark whether the registrant is a shell company (as defined in Rule 12b-2 of the Exchange Act). Yes ¨ No x
As of May 12, 2014, 100 Class A units and 100,000,000 Class B units of our membership interests were issued and outstanding.
Continental Cement Company, L.L.C. meets the conditions set forth in General Instruction H(1)(a) and (b) of Form 10-Q and is therefore filing this Form 10-Q with the reduced disclosure format.
Table of Contents
CAUTIONARY NOTE REGARDING FORWARD-LOOKING STATEMENTS
This quarterly report on Form 10-Q (this “report”) includes “forward-looking statements” within the meaning of the federal securities laws, which involve risks and uncertainties. Forward-looking statements include all statements that do not relate solely to historical or current facts, and you can identify forward-looking statements because they contain words such as “believes,” “expects,” “may,” “will,” “should,” “seeks,” “intends,” “trends,” “plans,” “estimates,” “projects” or “anticipates” or similar expressions that concern our strategy, plans, expectations or intentions. All statements made relating to our estimated and projected earnings, margins, costs, expenditures, cash flows, growth rates and financial results are forward-looking statements. These forward-looking statements are subject to risks, uncertainties and other factors that may cause our actual results, performance or achievements to be materially different from future results, performance or achievements expressed or implied by such forward-looking statements. We derive many of our forward-looking statements from our operating budgets and forecasts, which are based upon many detailed assumptions. While we believe that our assumptions are reasonable, it is very difficult to predict the effect of known factors, and, of course, it is impossible to anticipate all factors that could affect our actual results.
In light of the significant uncertainties inherent in the forward-looking statements included herein, the inclusion of such information should not be regarded as a representation by us or any other person that the results or conditions described in such statements or our objectives and plans will be realized. Important factors could affect our results and could cause results to differ materially from those expressed in our forward-looking statements, including but not limited to the factors discussed in the section entitled “Risk Factors” in Continental Cement, L.L.C.’s Annual Report on Form 10-K for the fiscal year ended December 28, 2013 (“Form 10-K”), as filed with the Securities and Exchange Commission (the “SEC”).
All subsequent written and oral forward-looking statements attributable to us, or persons acting on our behalf, are expressly qualified in their entirety by these cautionary statements.
Any forward-looking statement that we make speaks only as of the date of this report. We undertake no obligation to publicly update or revise any forward-looking statement as a result of new information, future events or otherwise, except as otherwise required by law.
As used in this report, unless otherwise noted or the context otherwise requires: references to “Continental Cement,” “Company,” “we,” “us,” and “our” are to Continental Cement Company, L.L.C., a Delaware limited liability company, and its subsidiary; and references to “Summit Materials” are to Summit Materials, LLC and not to its subsidiaries. The Company is a non-wholly owned indirect subsidiary of Summit Materials.
1
Table of Contents
CONTINENTAL CEMENT COMPANY, L.L.C.
FORM 10-Q
| Page No. | ||||||
| PART I — Financial Information | ||||||
| Item 1. | 3 | |||||
Consolidated Balance Sheets as of March 29, 2014 (Unaudited) and December 28, 2013 | 3 | |||||
| 4 | ||||||
| 5 | ||||||
| 6 | ||||||
| 7 | ||||||
| 8 | ||||||
| Item 2. | Management’s Discussion and Analysis of Financial Condition and Results of Operations | 11 | ||||
| Item 4. | 15 | |||||
| PART II — Other Information | ||||||
| Item 1. | 16 | |||||
| Item 1A. | 16 | |||||
| Item 4. | 16 | |||||
| Item 5. | 16 | |||||
| Item 6. | 17 | |||||
| SIGNATURES | 19 | |||||
Table of Contents
| ITEM 1. | FINANCIAL STATEMENTS |
CONTINENTAL CEMENT COMPANY, L.L.C. AND SUBSIDIARY
Consolidated Balance Sheets
(In thousands, except unit amounts)
| March 29, 2014 (unaudited) | December 28, 2013 (audited) | |||||||
| Assets | ||||||||
Current assets: | ||||||||
Cash | $ | 5 | $ | 9 | ||||
Accounts receivable, net | 8,049 | 7,353 | ||||||
Due from Affiliates | — | 2,990 | ||||||
Inventories | 14,529 | 10,402 | ||||||
Other current assets | 402 | 482 | ||||||
|
|
|
| |||||
Total current assets | 22,985 | 21,236 | ||||||
Property, plant and equipment, less accumulated depreciation and depletion (March 29, 2014 – $39,716 and December 28, 2013 – $36,700) | 311,606 | 306,204 | ||||||
Goodwill | 24,096 | 24,096 | ||||||
Other assets | 12,330 | 12,576 | ||||||
|
|
|
| |||||
Total assets | $ | 371,017 | $ | 364,112 | ||||
|
|
|
| |||||
Liabilities, Redeemable Members’ Interest and Member’s Interest | ||||||||
Current liabilities: | ||||||||
Current portion of long-term debt due to Summit Materials | $ | 1,018 | $ | 1,018 | ||||
Accounts payable | 13,230 | 10,165 | ||||||
Accrued expenses | 6,403 | 9,997 | ||||||
Due to Summit Materials | 17,422 | — | ||||||
|
|
|
| |||||
Total current liabilities | 38,073 | 21,180 | ||||||
Long-term debt due to Summit Materials | 154,336 | 154,590 | ||||||
Pension and post-retirement benefit obligations | 17,020 | 19,457 | ||||||
Other noncurrent liabilities | 872 | 850 | ||||||
|
|
|
| |||||
Total liabilities | 210,301 | 196,077 | ||||||
|
|
|
| |||||
Commitments and contingencies (see note 6) | ||||||||
Redeemable members’ interest (100,000,000 Class B units issued and authorized) | 23,600 | 23,450 | ||||||
Member’s interest: | ||||||||
Member’s equity (100 Class A units issued and authorized) | 135,196 | 135,180 | ||||||
Retained earnings | 8,726 | 17,029 | ||||||
Accumulated other comprehensive loss | (6,806 | ) | (7,624 | ) | ||||
|
|
|
| |||||
Total member’s interest | 137,116 | 144,585 | ||||||
|
|
|
| |||||
Total liabilities, redeemable members’ interest and member’s interest | $ | 371,017 | $ | 364,112 | ||||
|
|
|
| |||||
See notes to unaudited consolidated financial statements.
3
Table of Contents
CONTINENTAL CEMENT COMPANY, L.L.C. AND SUBSIDIARY
Unaudited Consolidated Statements of Operations
(In thousands)
| Three Months Ended | ||||||||
| March 29, 2014 | March 30, 2013 | |||||||
Revenue: | ||||||||
Revenue from third parties: | ||||||||
Product | $ | 5,555 | $ | 7,863 | ||||
Service | 2,921 | 2,450 | ||||||
Revenue from related parties: | ||||||||
Product | 2,152 | 2,048 | ||||||
|
|
|
| |||||
Total revenue | 10,628 | 12,361 | ||||||
|
|
|
| |||||
Cost of revenue (excluding items shown separately below): | ||||||||
Product | 8,402 | 12,338 | ||||||
Service | 2,500 | 2,167 | ||||||
|
|
|
| |||||
Total cost of revenue | 10,902 | 14,505 | ||||||
General and administrative expenses | 1,816 | 3,534 | ||||||
Depreciation, depletion, amortization and accretion | 3,201 | 2,771 | ||||||
|
|
|
| |||||
Operating loss | (5,291 | ) | (8,449 | ) | ||||
Other income, net | (5 | ) | (59 | ) | ||||
Interest expense | 2,867 | 2,842 | ||||||
|
|
|
| |||||
Net loss | $ | (8,153 | ) | $ | (11,232 | ) | ||
|
|
|
| |||||
See notes to unaudited consolidated financial statements.
4
Table of Contents
CONTINENTAL CEMENT COMPANY, L.L.C. AND SUBSIDIARY
Unaudited Consolidated Statements of Comprehensive Loss
(In thousands)
| Three Months Ended | ||||||||
| March 29, 2014 | March 30, 2013 | |||||||
Net loss | $ | (8,153 | ) | $ | (11,232 | ) | ||
Other comprehensive (loss) income: | ||||||||
Postretirement curtailment adjustment | (1,346 | ) | — | |||||
Postretirement liability adjustment | 2,164 | — | ||||||
|
|
|
| |||||
Other comprehensive income | 818 | — | ||||||
|
|
|
| |||||
Comprehensive loss | $ | (7,335 | ) | $ | (11,232 | ) | ||
|
|
|
| |||||
See notes to unaudited consolidated financial statements.
5
Table of Contents
CONTINENTAL CEMENT COMPANY, L.L.C. AND SUBSIDIARY
Unaudited Consolidated Statements of Cash Flows
(In thousands)
| Three Months Ended | ||||||||
| March 29, 2014 | March 30, 2013 | |||||||
Cash flows from operating activities: | ||||||||
Net loss | $ | (8,153 | ) | $ | (11,232 | ) | ||
Adjustments to reconcile net loss to net cash used in operating activities: | ||||||||
Depreciation, depletion, amortization and accretion | 3,201 | 2,771 | ||||||
Other | 50 | 80 | ||||||
(Increase) decrease in operating assets: | ||||||||
Accounts receivable | (766 | ) | 3,465 | |||||
Inventories | (4,127 | ) | (2,116 | ) | ||||
Other current assets | 80 | 149 | ||||||
Other assets | 208 | 903 | ||||||
Increase (decrease) in operating liabilities: | ||||||||
Accounts payable | 1,002 | 951 | ||||||
Accrued expenses | (3,565 | ) | (4,357 | ) | ||||
Other liabilities | (1,619 | ) | (490 | ) | ||||
|
|
|
| |||||
Net cash used in operating activities | (13,689 | ) | (9,876 | ) | ||||
|
|
|
| |||||
Cash flows from investing activities: | ||||||||
Purchase of property, plant and equipment | (6,492 | ) | (6,400 | ) | ||||
Other | 48 | — | ||||||
|
|
|
| |||||
Net cash used in investing activities | (6,444 | ) | (6,400 | ) | ||||
|
|
|
| |||||
Cash flows from financing activities: | ||||||||
Principal payments on long-term debt | (255 | ) | (483 | ) | ||||
Book overdraft | (28 | ) | 1,341 | |||||
Net borrowings from Summit Materials | 20,412 | 14,927 | ||||||
|
|
|
| |||||
Net cash provided by financing activities | 20,129 | 15,785 | ||||||
|
|
|
| |||||
Net decrease in cash | (4 | ) | (491 | ) | ||||
Cash – beginning of period | 9 | 599 | ||||||
|
|
|
| |||||
Cash – end of period | $ | 5 | $ | 108 | ||||
|
|
|
| |||||
Supplemental disclosures of cash flow information | ||||||||
Cash interest paid during the period | $ | 4,520 | $ | 3,311 | ||||
|
|
|
| |||||
See notes to unaudited consolidated financial statements.
6
Table of Contents
CONTINENTAL CEMENT COMPANY, L.L.C. AND SUBSIDIARY
Unaudited Consolidated Statements of Changes in Redeemable Members’ Interest and Member’s Interest
(In thousands)
| Member’s equity | Retained earnings | Accumulated other comprehensive loss | Total member’s equity | Redeemable members’ interest | ||||||||||||||||
Balance – December 28, 2013 | $ | 135,180 | $ | 17,029 | $ | (7,624 | ) | $ | 144,585 | $ | 23,450 | |||||||||
Accretion of redeemable members’ interest | — | (150 | ) | — | (150 | ) | 150 | |||||||||||||
Net loss | — | (8,153 | ) | — | (8,153 | ) | — | |||||||||||||
Other comprehensive income | — | — | 818 | 818 | — | |||||||||||||||
Share-based compensation | 16 | — | — | 16 | — | |||||||||||||||
|
|
|
|
|
|
|
|
|
| |||||||||||
Balance – March 29, 2014 | $ | 135,196 | $ | 8,726 | $ | (6,806 | ) | $ | 137,116 | $ | 23,600 | |||||||||
|
|
|
|
|
|
|
|
|
| |||||||||||
Balance – December 31, 2012 | $ | 135,118 | $ | 7,764 | $ | (12,031 | ) | $ | 130,851 | $ | 22,850 | |||||||||
Accretion of redeemable members’ interest | — | (150 | ) | — | (150 | ) | 150 | |||||||||||||
Net loss | — | (11,232 | ) | — | (11,232 | ) | — | |||||||||||||
Share-based compensation | 16 | — | — | 16 | — | |||||||||||||||
|
|
|
|
|
|
|
|
|
| |||||||||||
Balance – March 30, 2013 | $ | 135,134 | $ | (3,618 | ) | $ | (12,031 | ) | $ | 119,485 | $ | 23,000 | ||||||||
|
|
|
|
|
|
|
|
|
| |||||||||||
See notes to unaudited consolidated financial statements.
7
Table of Contents
CONTINENTAL CEMENT COMPANY, L.L.C. AND SUBSIDIARY
Notes to Unaudited Consolidated Financial Statements
(Tables in thousands)
| (1) | Summary of Organization and Significant Accounting Policies |
Continental Cement Company, L.L.C. (“Continental Cement”) produces portland cement at its plant located in Hannibal, Missouri. Cement distribution terminals are maintained in Hannibal and St. Louis, Missouri and Bettendorf, Iowa. The Company’s primary customers are ready-mixed concrete and concrete products producers and contractors located in the Midwestern United States.
Green America Recycling, L.L.C. (“GAR”), a wholly-owned subsidiary of Continental Cement, is engaged in the business of securing, processing and blending hazardous and nonhazardous waste materials primarily for use as supplemental fuels in the cement manufacturing process. GAR’s primary customers are commercial transportation disposal facilities and petroleum and chemical manufacturers located in the continental United States. Continental Cement and GAR collectively are referred to as the “Company.”
Continental Cement, a Delaware limited liability company, is governed by the amended and restated limited liability company agreement, as amended (the “LLC Agreement”). As such, liability of its members is generally limited to the amount of their net investment in Continental Cement. Continental Cement is an indirect non-wholly owned subsidiary of Summit Materials, LLC (“Summit Materials”).
Basis of Presentation – These unaudited consolidated financial statements were prepared in accordance with U.S. generally accepted accounting principles (“GAAP”) for interim financial information, without audit, pursuant to the rules and regulations of the Securities and Exchange Commission. Certain information and footnote disclosures normally included in financial statements prepared in accordance with GAAP have been condensed or omitted pursuant to such rules and regulations. These unaudited consolidated financial statements should be read in conjunction with the Company’s audited consolidated financial statements and the notes thereto as of and for the year ended December 28, 2013. The Company continues to follow the accounting policies set forth in those consolidated financial statements.
Management believes that these consolidated interim financial statements include all adjustments, normal and recurring in nature, that are necessary to present fairly the financial position of the Company as of March 29, 2014 and the results of operations and cash flows for the three month periods ended March 29, 2014 and March 30, 2013.
In 2013, the Company changed its fiscal year from a calendar year to a 52 week year with each quarter composed of 13 weeks ending on a Saturday, consistent with that of Summit Materials. The Company’s quarter ended March 29, 2014 included a full 13 weeks, or 91 days, of results compared to the quarter ended March 30, 2013, which included 89 days. The impact of this change to the Company’s financial position and results of operations is immaterial.
Substantially all of the Company’s products are consumed outdoors, primarily in the spring, summer and fall. Seasonal changes and other weather-related conditions can affect the sales volumes of its products. Therefore, the financial results for any interim period are not necessarily indicative of the results expected for the full year. Furthermore, the Company’s sales and earnings are sensitive to national, regional and local economic conditions and to cyclical changes in construction spending.
Principles of Consolidation – The consolidated financial statements of the Company include the accounts of Continental Cement and GAR. All significant intercompany balances and transactions have been eliminated.
Use of Estimates – The consolidated financial statements have been prepared in conformity with GAAP, which require management to make estimates and assumptions. These estimates and the underlying assumptions affect the amounts of assets and liabilities reported and disclosures about contingent assets and liabilities. Such estimates include the valuation of accounts receivable, inventories, goodwill, intangible and other long-lived assets, pension and other postretirement obligations, asset retirement obligations and redeemable members’ interest. Management evaluates its estimates and assumptions on an ongoing basis using historical experience and other factors, including the current economic environment. Management adjusts such estimates and assumptions when circumstances dictate. As future events and their effects cannot be determined with precision, actual results could differ significantly from estimates made. Changes in estimates, including those resulting from continuing changes in the economic environment, will be reflected in the Company’s consolidated financial statements for the period in which the change in estimate occurs.
8
Table of Contents
Business and Credit Concentrations –The majority of the Company’s customers are located in Missouri, Iowa and Illinois. The Company’s accounts receivable consist primarily of accounts of ready-mixed concrete and concrete products producers and contractors located within these states. Collection of these accounts is, therefore, dependent on the economic conditions of the area. However, credit granted within the Company’s trade area has been granted to many customers and management does not believe that there are any significant concentrations of credit with respect to individual customers or groups of customers.
Approximately 21% and 16% of cement sales were with companies owned by a noncontrolling member of Continental Cement during the three month periods ended March 29, 2014 and March 30, 2013, respectively. The Company has historically had no collection issues with the noncontrolling member and management expects full collection on all outstanding accounts receivable due from the noncontrolling member.
| (2) | Accounts Receivable, net |
Accounts receivable, net consists of the following as of March 29, 2014 and December 28, 2013:
| March 29, 2014 | December 28, 2013 | |||||||
Trade accounts receivable from unaffiliated entities | $ | 6,562 | $ | 6,961 | ||||
Trade accounts receivable from related parties | 1,587 | 422 | ||||||
|
|
|
| |||||
Accounts receivable | 8,149 | 7,383 | ||||||
Less: allowance for doubtful accounts | (100 | ) | (30 | ) | ||||
|
|
|
| |||||
Accounts receivable, net | $ | 8,049 | $ | 7,353 | ||||
|
|
|
| |||||
| (3) | Inventories |
Inventories consist of the following as of March 29, 2014 and December 28, 2013:
| March 29, 2014 | December 28, 2013 | |||||||
Raw materials | $ | 829 | $ | 972 | ||||
Work-in-process | 4,880 | 2,623 | ||||||
Finished goods | 8,820 | 6,807 | ||||||
|
|
|
| |||||
Total inventories | $ | 14,529 | $ | 10,402 | ||||
|
|
|
| |||||
| (4) | Accrued Expenses |
Accrued expenses consist of the following as of March 29, 2014 and December 28, 2013:
| March 29, 2014 | December 28, 2013 | |||||||
Accrued interest due to Summit Materials | $ | 2,195 | $ | 3,848 | ||||
Accrued interest due to non-controlling member | — | 723 | ||||||
Accrued post-retirement benefits other than pensions, current portion | 1,268 | 1,268 | ||||||
Accrued professional fees | 289 | 340 | ||||||
Accrued payroll, insurance and benefits | 573 | 758 | ||||||
Accrued bonus liability | 280 | 884 | ||||||
Accrued costs to remove barge from waterway | 464 | 880 | ||||||
Other | 1,334 | 1,296 | ||||||
|
|
|
| |||||
Total | $ | 6,403 | $ | 9,997 | ||||
|
|
|
| |||||
| (5) | Long-Term Debt |
Long-term debt due to Summit Materials, including the current portion of long-term debt, was $155.4 million and $155.6 million as of March 29, 2014 and December 28, 2013, respectively. Interest costs incurred were $2.8 million and $2.7 million for the three month periods ended March 29, 2014 and March 30, 2013, respectively. The interest rate in effect at March 29, 2014 was 3.7%.
The terms of Summit Materials’ debt limit certain transactions of its subsidiaries, including those of Continental Cement. Continental Cement’s ability to incur additional indebtedness or issue certain preferred shares, pay dividends to the
9
Table of Contents
noncontrolling members, redeem stock or make other distributions, make certain investments, sell or transfer certain assets, create liens, consolidate, merge, sell or otherwise dispose of all or substantially all of its assets, enter into certain transactions with affiliates are limited. Continental Cement is named as a guarantor of Summit Materials’ debt, for which Continental Cement pledged substantially all of its assets as collateral. Continental Cement provides a joint and several, full and unconditional guarantee of borrowings under Summit Materials’ senior secured credit facility (“Credit Facility”). As of March 29, 2014 and December 28, 2013, Summit Materials’ debt included $510 million and $250 million, respectively, of senior notes due January 31, 2020 (“Senior Notes”) and borrowings under the Credit Facility composed of $422.0 million in term loans that mature January 30, 2019 and a $150.0 million revolving credit facility that matures January 30, 2017.
Summit Materials is and has been current on all required principal and interest payments. As of March 29, 2014, approximately $95.0 million and $60.3 million of the Company’s long-term debt due to Summit Materials represent the amount of Summit Materials’ debt that has been allocated to the Company under the Credit Facility and Senior Notes, respectively, compared to $95.3 million and $60.3 million, respectively, as of December 28, 2013.
| (6) | Commitments and Contingencies |
The Company is party to certain legal actions arising from the ordinary course of business activities. Accruals are recorded when the outcome is probable and can be reasonably estimated in accordance with applicable accounting requirements. While the ultimate results of claims and litigation cannot be predicted with certainty, management expects that the ultimate resolution of all pending or threatened claims and litigation as of March 29, 2014 will not have a material effect on the Company’s consolidated results of operations, financial position or liquidity. The Company’s policy is to record legal fees as incurred.
Litigation and Claims – In February 2011, the Company incurred a property loss related to a sunken barge with cement product aboard. During the three month periods March 30, 2013, the Company recognized a $1.8 million charge for costs expected to be incurred to remove the barge from the waterway. As of March 29, 2014 and December 28, 2013, $0.5 million and $0.9 million, respectively, was included in accrued expenses as management’s best estimate of the remaining costs to remove the barge.
Environmental Remediation – The Company’s cement production, mining operations and waste processing operations are subject to and affected by federal, state and local laws and regulations relating to the environment, health and safety and other regulatory matters. These operations require environmental operating permits, which are subject to modification, renewal and revocation. The Company regularly monitors and reviews its operations, procedures and policies for compliance with these laws and regulations. Despite these compliance efforts, risk of environmental liability is inherent in the operation of the Company’s business, as it is with other companies engaged in similar businesses, and there can be no assurance that environmental liabilities will not have a material adverse effect on the Company’s financial position, results of operations or liquidity in the future.
Other – The Company is obligated under various firm purchase commitments for certain raw materials and services that are in the ordinary course of business. The terms of the purchase commitments are generally less than one year. Management does not expect any significant changes in the market value of these goods and services during the commitment period that would have a material adverse effect on the financial position, results of operations or liquidity of the Company.
As of March 29, 2014 and December 28, 2013 approximately 61% and 62%, respectively, of the Company’s employees were represented by labor organizations under collective bargaining agreements. The Company’s collective bargaining agreements for such employees generally expire between 2013 and 2015. The contract that expired in 2013 was successfully renegotiated and ratified in December 2013 and is expected to be finalized in the first half of 2014 with a term that will extend through 2018.
| (7) | Related Party Transactions |
As of December 28, 2013, the Company had accrued interest payments of $0.7 million due to a certain noncontrolling member for a related party note, which was paid in the first quarter of 2014. The principal balance on the note was repaid in January 2012.
Cement sales to companies owned by a certain noncontrolling member of Continental Cement were approximately $1.7 million and $1.6 million for the three month periods ended March 29, 2014 and March 30, 2013, respectively, and accounts receivables due from these parties were approximately $1.3 million and $0.2 million as of March 29, 2014 and December 28, 2013, respectively.
Cement sales to other companies owned by Summit Materials were approximately $0.5 million for both of the three month periods ended March 29, 2014 and March 30, 2013. Accounts receivables due from these parties were approximately $0.3 million and $0.2 million as of March 29, 2014 and December 28, 2013, respectively.
10
Table of Contents
| ITEM 2. | MANAGEMENT’S DISCUSSION AND ANALYSIS OF FINANCIAL CONDITION AND RESULTS OF OPERATIONS |
This Management’s Discussion and Analysis of Financial Condition and Results of Operations is intended to assist in understanding and assessing the trends and significant changes in the Company’s results of operations and financial condition. Historical results may not be indicative of future performance. Our forward-looking statements reflect our current views about future events, are based on assumptions and are subject to known and unknown risks and uncertainties that could cause actual results to differ materially from those contemplated by these statements. Factors that may cause differences between actual results and those contemplated by forward-looking statements include, but are not limited to, those discussed in the section entitled “Risk Factors” in the Form 10-K and any factors discussed in the section entitled “Cautionary Note Regarding Forward-Looking Statements.” This Management’s Discussion and Analysis of Financial Condition and Results of Operations should be read in conjunction with the unaudited consolidated financial statements and the related notes and other information included in this report.
Overview
Continental Cement produces portland cement at its highly-efficient, state-of-the-art, dry cement manufacturing plant located in Hannibal, Missouri and has distribution terminals in Hannibal and St. Louis, Missouri and Bettendorf, Iowa. Continental Cement’s primary customers are ready-mixed concrete and concrete products producers and contractors located in the Midwestern United States. In addition to producing cement, the Company secures, processes and blends hazardous and nonhazardous waste materials primarily for use as supplemental fuels in the cement manufacturing process. The Company’s primary customers for this service are commercial transportation disposal facilities and petroleum and chemical manufacturers located in the continental United States.
Continental Cement’s products serve a variety of end uses in its market, including residential and non-residential, agricultural and public infrastructure projects and is used in most forms of construction activities. Continental Cement believes exposure to various end use markets and geographic markets in the Midwestern United States affords greater stability through economic cycles and positions it to capitalize on upside opportunities when recoveries in residential and non-residential construction occur. Continental Cement believes it is a top 25 supplier of cement in the United States by volume and the primary supplier within its local market.
Business Trends and Conditions
Continental Cement could be affected by any economic improvement or decline, which could vary by local region and market. Continental Cement’s sales and earnings are sensitive to national, regional and local economic conditions and particularly to cyclical changes in construction spending, especially in the private sector. From a macroeconomic view, the Company sees positive indicators for the construction sector, including upward trends in housing starts, construction employment and highway obligations. All of these factors should result in increased construction activity in the relatively near future as compared to the recently preceding years.
Public infrastructure projects, driven by both federal and state funding programs, represent a significant share of the U.S. heavy-side building materials market. Moving Ahead for Progress in the 21st Century (“MAP-21”) is a 27 month, approximately $105.0 billion transportation funding program that provided for $40.4 billion and $41.0 billion in highway infrastructure investments in fiscal years 2013 and 2014, respectively. The spending levels are consistent with the preceding federal transportation funding program. Currently, there is uncertainty as to what will succeed MAP-21, which expires in September 2014. A new highway bill may be passed by the end of 2014, which would require continuing resolutions between September 2014 and the date a new bill is passed. Management does not expect a significant change in funding levels through continuing resolutions or a new bill. However, given the nation’s aging infrastructure and considering longstanding historical spending trends, management expects U.S. infrastructure investment to grow over the long term. Management believes that the Company is well positioned to capitalize on any such increase in investment.
In addition to federal funding, highway construction and maintenance funding is also available through state, county and local agencies. The Company generates most of its revenue in Missouri – 70% in the first quarter of 2014. Missouri’s annual construction funding committed to essential road and bridge programs is approximately $700.0 million. In addition, Missouri’s transportation funds are constitutionally protected and may only be spent on transportation projects.
In addition to being subject to cyclical changes in the economy, Continental Cement’s business is also seasonal in nature; its products are consumed outdoors. Severe weather, seasonal changes and other weather-related conditions can significantly affect the sales volumes of Continental Cement’s products. Winter weather months are generally periods of lower sales as Continental Cement’s customers have fewer active projects. Typically, the highest sales and earnings are in the second and third quarters and the lowest are in the first and fourth quarters. Periods of heavy rainfall also adversely affect customers’ work patterns and demand for the Company’s products. The Company’s working capital may vary greatly during peak periods, but generally returns to comparable levels as its operating cycle is completed each fiscal year.
11
Table of Contents
Results of Operations
The following discussion of the Company’s results of operations is focused on the material financial measures management uses to evaluate the performance of its business. Operating income and margins are discussed in terms of changes in volume, pricing and customer mix. The Company’s product revenue reflects cement sales and service revenue reflects revenue from the acceptance of waste fuels.
In 2013, the Company changed its fiscal year from a calendar year to a 52 week year with each quarter composed of 13 weeks ending on a Saturday, consistent with that of Summit Materials. Continental Cement’s quarter ended March 29, 2014 included a full 13 weeks, or 91 days, of results compared to the quarter ended March 30, 2013, which included 89 days. The impact of this change to the Company’s financial position and results of operations is immaterial.
Non-GAAP Performance Measures
Continental Cement evaluates the performance of its business and allocates its resources based on several factors, including a measure it calls Adjusted EBITDA. Continental Cement defines Adjusted EBITDA as net income (loss) before interest expense and depreciation, depletion, amortization and accretion. Accretion is recognized on asset retirement obligations and reflects the time value of money. Since accretion is similar in nature to interest expense, it is treated consistently with interest expense and is excluded from Adjusted EBITDA.
Adjusted EBITDA reflects an additional way of viewing aspects of the Company’s business that, when viewed with the Company’s results determined in accordance with U.S. generally accepted accounting principles (“GAAP”) and the accompanying reconciliations to GAAP financial measures included in the tables below, may provide a more complete understanding of factors and trends affecting the Company’s business. However, it should not be construed as being more important than other comparable GAAP measures and must be considered in conjunction with GAAP measures. In addition, non-GAAP financial measures are not standardized; therefore it may not be possible to compare such financial measures with other companies’ non-GAAP financial measures having the same or similar names. The Company strongly encourages investors to review its consolidated financial statements in their entirety and not rely on any single financial measure.
Reconciliation of Net Loss to Adjusted EBITDA
| Three Months Ended | ||||||||
(in thousands) | March 29, 2014 | March 30, 2013 | ||||||
Net loss | $ | (8,153 | ) | $ | (11,232 | ) | ||
Interest expense | 2,867 | 2,842 | ||||||
Depreciation, depletion and amortization | 3,179 | 2,751 | ||||||
Accretion | 22 | 20 | ||||||
|
|
|
| |||||
Adjusted EBITDA | $ | (2,085 | ) | $ | (5,619 | ) | ||
|
|
|
| |||||
12
Table of Contents
Consolidated Results of Operations
The tables below set forth the Company’s consolidated results for each of the periods indicated.
| Three Months Ended | ||||||||
(in thousands) | March 29, 2014 | March 30, 2013 | ||||||
Revenue | $ | 10,628 | $ | 12,361 | ||||
Cost of revenue (excluding items shown separately below) | 10,902 | 14,505 | ||||||
General and administrative expenses | 1,816 | 3,534 | ||||||
Depreciation, depletion, amortization and accretion | 3,201 | 2,771 | ||||||
|
|
|
| |||||
Operating loss | (5,291 | ) | (8,449 | ) | ||||
Other income, net | (5 | ) | (59 | ) | ||||
Interest expense | 2,867 | 2,842 | ||||||
|
|
|
| |||||
Net loss | $ | (8,153 | ) | $ | (11,232 | ) | ||
|
|
|
| |||||
First quarter of 2014 compared to the first quarter of 2013
(All comparisons are with the three months ended March 30, 2013, unless noted)
| Three Months Ended | ||||||||||||
($ in thousands) | March 29, 2014 | March 30, 2013 | Variance | |||||||||
Revenue | $ | 10,628 | $ | 12,361 | (14.0 | )% | ||||||
Operating loss | $ | (5,291 | ) | $ | (8,449 | ) | 37.4 | % | ||||
Operating margin | (49.8 | )% | (68.4 | )% | ||||||||
Adjusted EBITDA | $ | (2,085 | ) | $ | (5,619 | ) | 62.9 | % | ||||
The Company’s revenue decreased 14.0% in the three months ended March 29, 2014. Cement volumes decreased 33.6% as a result of poor weather conditions, primarily in January and February, but into the second quarter in certain key markets, limiting sales and mobility on the Mississippi River. In addition, volumes and pricing were affected by a shift in customer mix away from high-volume customers. The volume and pricing movements in cement sales affected revenue by $(3.3) million and $1.6 million, respectively. The Company realized improvement in its waste processing business which contributed $0.5 million more to revenue in the three months ended March 29, 2014.
Operating margin, which Continental Cement defines as operating income as a percentage of revenue, improved 18.6% in the three months ended March 29, 2014 and Adjusted EBITDA improved $3.5 million, or 62.9%. This profit improvement was primarily due to a $1.3 million curtailment benefit related to the postretirement healthcare plan, a $1.0 million reduction in repair and maintenance costs and a $1.8 million charge recorded in the three months ended March 30, 2013 for costs to remove a sunken barge from the waterway. These improvements to profit were partially offset by the 14.0% revenue decline.
Liquidity and Capital Resources
The Company’s primary sources of liquidity include cash provided by its operations and amounts available for borrowing from Summit Materials. The Company participates in Summit Material’s centralized treasury function, through which excess funds are swept to and shortfalls are funded by Summit Materials. As a result, the Company’s cash balance is nominal. The Company believes it has sufficient financial resources from its liquidity sources to fund its business and operations, including contractual obligations, capital expenditures and debt service obligations for at least the next twelve months.
Given the seasonality of its business, the Company typically experiences significant fluctuations in working capital needs and balances throughout the year due to sales peaking in the summer and fall months and cement production occurring throughout the year with the exception of scheduled plant maintenance during non-peak months. Working capital requirements generally increase during the first half of the year as management focuses on repair and maintenance and builds up inventory for the upcoming season. For example, cash used in operating activities in the three months ended March 30, 2013 was $9.9 million compared to full year 2013 net cash provided by operating activities of $18.6 million. Cash used in operating activities in the three months ended March 29, 2014 was $13.7 million.
13
Table of Contents
Cash Flows
The following table summarizes the Company’s net cash used for or provided by operating, investing and financing activities and the Company’s capital expenditures for the periods indicated:
| Three Months Ended | ||||||||
| (in thousands) | March 29, 2014 | March 30, 2013 | ||||||
Net cash (used for) provided by: | ||||||||
Operating activities | $ | (13,689 | ) | $ | (9,876 | ) | ||
Investing activities | (6,444 | ) | (6,400 | ) | ||||
Financing activities | 20,129 | 15,785 | ||||||
Cash paid for capital expenditures | $ | (6,492 | ) | $ | (6,400 | ) | ||
Operating activities
For the three months ended March 29, 2014, cash used in operating activities was $13.7 million as a result of:
| • | Net loss of $8.2 million, adjusted for non-cash expenses of $3.3 million, which were primarily depreciation, depletion, amortization and accretion expense. |
| • | Cash utilized for working capital needs approximated $8.8 million primarily as a result of $4.9 million used for accounts receivable and inventories and $2.6 million for accounts payable and accrued expenses, consistent with the seasonality of the Company’s business. The cash expenditures related to inventory reflect the build-up of inventory levels to prepare the business for increased sales volumes in the summer and fall. |
For the three months ended March 30, 2013, cash used by operating activities was $9.9 million as a result of:
| • | Net loss of $11.2 million, adjusted for non-cash expenses of $2.9 million, which were primarily depreciation, depletion, amortization and accretion expense. |
| • | Cash utilized for accrued expenses of $4.4 million as amounts incurred during the fourth quarter of 2012 were paid in the first quarter of 2013. In the fourth quarter of 2012, Continental Cement’s current liabilities increased consistent with the seasonality of its business. |
| • | Inventory utilized cash of $2.1 million as production outpaced sales. Cement volumes in the first quarter of 2013 were relatively consistent with the first quarter of 2012, but plant efficiency improved and the annual plant shutdown was eleven days shorter in 2013 than in 2012. |
| • | Offsetting the cash outflows, accounts receivable provided $3.5 million of cash as amounts outstanding during the fourth quarter of 2012 were collected at a rate greater than the generation of new receivables. The first quarter is generally the slowest month for Continental Cement’s sales due to weather limiting sales volumes and the scheduled plant shutdown for repair and maintenance. |
Investing activities
For the three months ended March 29, 2014, cash used for investing activities was $6.4 million, which was primarily used for capital investments. The capital expenditures included enhancement costs incurred during the cement plant’s annual scheduled winter shutdown, as well as continued development of the underground mine ($3.0 million).
For the quarter March 30, 2013, cash used for investing activities was $6.4 million, all of which was related to capital expenditures. The capital expenditures were primarily a result of enhancement costs incurred during the cement plant’s annual scheduled winter shutdown, as well as continued development of the underground mine ($2.4 million) and a storage dome in St. Louis, Missouri, which expanded our cement storage capacity.
Financing activities
For the three months ended March 29, 2014, cash provided by financing activities was $20.1 million, primarily driven by $20.4 million of net borrowings from Summit Materials to fund working capital requirements and capital investments.
For the three months ended March 30, 2013, cash provided by financing activities was $15.8 million, primarily driven by $14.9 million of net borrowings from Summit Materials and its subsidiaries to fund working capital requirements and $1.3 million adjustment from the book overdraft associated with the Summit Materials’ centralized banking system.
14
Table of Contents
Cash paid for capital expenditures
The Company estimates that it will incur between $18.0 million and $21.0 million in capital expenditures in 2014, which it has funded or expects to fund through cash on hand, cash from operations and available borrowings under Summit Materials’ credit facilities. A significant portion of the Company’s anticipated capital expenditures in 2014 relate to completing the development of the underground mine. The Company expects to spend approximately $5.9 million during 2014 on this project, of which $3.0 million was spent during the first quarter. Production of the underground mine was sufficiently advanced that the Company began recognizing depletion on it in the first quarter of 2014. The underground mine provides access to over 200 years of proven and probable limestone reserves.
Commitments and Contingencies
The Company is party to certain legal actions arising from the ordinary course of business activities. Accruals are recorded when the outcome is probable and can be reasonably estimated in accordance with applicable accounting requirements. While the ultimate results of claims and litigation cannot be predicted with certainty, management expects that the ultimate resolution of all current pending or threatened claims and litigation will not have a material effect on the Company’s consolidated results of operations, financial position or liquidity.
In February 2011, Continental Cement incurred a property loss related to a sunken barge with cement product aboard. During the three months ended March 30, 2013, the Company recorded a $1.8 million charge for costs to remove the barge from the waterway. As of March 29, 2014 and December 28, 2013, $0.5 million and $0.9 million remained in accrued expenses as management’s best estimate of the remaining costs to remove the barge.
The Company is obligated under various firm purchase commitments for certain raw materials and services that are in the ordinary course of business. The terms of the purchase commitments are generally less than one year. Management does not expect any significant changes in the market value of these goods and services during the commitment period that would have a material adverse effect on the Company’s financial position, results of operations or liquidity.
Off-Balance Sheet Arrangements
As of March 29, 2014, the Company had no material off-balance sheet arrangements.
| ITEM 4. | CONTROLS AND PROCEDURES |
Disclosure Controls and Procedures
We maintain disclosure controls and procedures that are designed to ensure that information required to be disclosed in the Company’s reports under the Securities and Exchange Act of 1934, as amended (the “Exchange Act”) is recorded, processed, summarized and reported within the time periods specified in the SEC’s rules and forms, and that such information is accumulated and communicated to the Company’s management, including the Company’s Principal Executive Officer and the Company’s Principal Financial Officer, as appropriate, to allow timely decisions regarding required disclosure. Any controls and procedures, no matter how well designed and operated, can provide only reasonable, not absolute, assurance of achieving the desired control objectives. The Company’s management, with the participation of the Company’s Principal Executive Officer and Principal Financial Officer, has evaluated the effectiveness of the Company’s disclosure controls and procedures (as such term is defined in Rules 13a-15(e) and 15d-15(e) under the Exchange Act) as of March 29, 2014. Based upon that evaluation, the Company’s Principal Executive Officer and Principal Financial Officer concluded that, as of March 29, 2014, the Company’s disclosure controls and procedures were effective to accomplish their objectives at the reasonable assurance level.
Changes in Internal Control over Financial Reporting
There was no change in the Company’s internal control over financial reporting (as such term is defined in Rules 13a-15(f) and 15d-15(f) under the Exchange Act) that occurred during the Company’s last fiscal quarter that has materially affected, or is reasonably likely to materially affect, the Company’s internal control over financial reporting.
15
Table of Contents
| ITEM 1. | LEGAL PROCEEDINGS |
The Company is party to certain legal actions arising from the ordinary course of business activities. Accruals are recorded when the outcome is probable and can be reasonably estimated in accordance with applicable accounting requirements. While the ultimate results of claims and litigation cannot be predicted with certainty, management expects that the ultimate resolution of all current pending or threatened claims and litigation will not have a material effect on the Company’s consolidated results of operations, financial position or liquidity.
| ITEM 1A. | RISK FACTORS |
In addition to the other information set forth in this report, you should carefully consider the factors discussed in the section entitled “Risk Factors” in the Form 10-K, which could materially affect the Company’s business, financial condition, results of operations or liquidity. The risks described in the Form 10-K are not the only risks facing the Company. Additional risks and uncertainties not currently known to the Company or that it currently deems to be immaterial also may materially adversely affect its business, financial condition, results of operations or liquidity. There have been no material changes to the risk factors disclosed in the Form 10-K.
| ITEM 4. | MINE SAFETY DISCLOSURES |
The information concerning mine safety violations and other regulatory matters required by Section 1503(a) of the Dodd-Frank Wall Street Reform and Consumer Protection Act and Item 104 of Regulation S-K (17 CFR 229.104) is included in Exhibit 95.1 to this report.
| ITEM 5. | OTHER INFORMATION |
Pursuant to Section 219 of the Iran Threat Reduction and Syria Human Rights Act of 2012 (“ITRA”), which added Section 13(r) of the Exchange Act, the Company hereby incorporates by reference herein Exhibit 99.1 of this report, which includes disclosures publicly filed and/or provided to The Blackstone Group L.P., an affiliate of certain investment funds that indirectly own a majority of the equity interests of the Company, by Travelport Limited, which may be considered the Company’s affiliates.
We are not presently aware that we and our subsidiaries knowingly engaged in any transaction or dealing reportable under Section 13(r) of the Exchange Act during the quarter ended March 29, 2014.
16
Table of Contents
| ITEM 6. | EXHIBITS |
| 3.1 | Certificate of Formation of Continental Cement Company, L.L.C., as amended (incorporated by reference from Exhibit 3.7 to the Registration Statement on Form S-4, filed on March 27, 2013 (File No. 333-187556)). | |
| 3.2 | Amended and Restated Limited Liability Company Agreement of Continental Cement Company, L.L.C. (incorporated by reference from Exhibit 3.8 to the Registration Statement on Form S-4, filed on March 27, 2013 (File No. 333-187556)). | |
| 3.3 | First Amendment to Amended and Restated Limited Liability Company Agreement of Continental Cement Company, L.L.C. (incorporated by reference from Exhibit 3.9 to the Registration Statement on Form S-4, filed on March 27, 2013 (File No. 333-187556)). | |
| 4.1 | Second Supplemental Indenture, dated as of January 17, 2014, among Summit Materials, LLC, Summit Materials Finance Corp., the guarantors named therein and Wilmington Trust, National Association, as trustee (incorporated by reference to Exhibit 4.4 filed with the registrant’s Current Report on Form 8-K, filed on January 23, 2014). | |
| 4.2 | Third Supplemental Indenture, dated as of February 21, 2014, among Alcomat, LLC, Alleyton Resource Company, LLC, Alleyton Services Company, LLC and Wilmington Trust, National Association, as trustee (incorporated by reference to Exhibit 4.4 filed with the registrant’s Annual Report on Form 10-K, filed on March 7, 2014). | |
| 4.3 | Registration Rights Agreement, dated as of January 17, 2014, among Summit Materials, LLC, Summit Materials Finance Corp., the guarantors named therein, Merrill Lynch, Pierce, Fenner & Smith Incorporated, on behalf of the initial purchasers (incorporated by reference to Exhibit 4.5 filed with the registrant’s Current Report on Form 8-K, filed on January 23, 2014). | |
| 10.1 | Amendment No. 2, dated as of January 16, 2014, to the Credit Agreement, dated as of January 30, 2012 and amended as of February 5, 2013, by and among Summit Materials, LLC, the guarantors party thereto, Bank of America, N.A., as administrative agent, collateral agent, L/C issuer and swing line lender and the other parties thereto (incorporated by reference to Exhibit 10.1 filed with the registrant’s Current Report on Form 8-K, filed on January 23, 2014). | |
| 31.1* | Certification of the Principal Executive Officer pursuant to Rule 13a-14(a) or Rule 15d-14(a) of the Securities Exchange Act of 1934, as adopted pursuant to Section 302 of the Sarbanes-Oxley Act of 2002. | |
| 31.2* | Certification of the Principal Financial Officer pursuant to Rule 13a-14(a) or Rule 15d-14(a) of the Securities Exchange Act of 1934, as adopted pursuant to Section 302 of the Sarbanes-Oxley Act of 2002. | |
| 32.1** | Certification of the Principal Executive Officer pursuant to 18 U.S.C. Section 1350, as adopted pursuant to Section 906 of the Sarbanes-Oxley Act of 2002. | |
| 32.2** | Certification of the Principal Financial Officer pursuant to 18 U.S.C. Section 1350, as adopted pursuant to Section 906 of the Sarbanes-Oxley Act of 2002. | |
| 95.1* | Mine Safety Disclosures. | |
| 99.1* | Section 13(r) Disclosure. | |
| 101.INS* | XBRL Instance Document | |
| 101.SCH* | XBRL Taxonomy Extension Schema Document | |
| 101.CAL* | XBRL Taxonomy Extension Calculation Linkbase Document | |
| 101.DEF* | XBRL Taxonomy Extension Definition Linkbase Document | |
| 101.LAB* | XBRL Taxonomy Extension Label Linkbase Document | |
| 101.PRE* | XBRL Taxonomy Extension Presentation Linkbase Document | |
| * | Filed herewith |
| ** | Furnished herewith |
17
Table of Contents
The agreements and other documents filed as exhibits to this report are not intended to provide factual information or other disclosure other than with respect to the terms of the agreements or other documents themselves, and you should not rely on them for that purpose. In particular, any representations and warranties made by us in these agreements or other documents were made solely within the specific context of the relevant agreement or document and may not describe the actual state of affairs as of the date they were made or at any other time.
18
Table of Contents
Pursuant to the requirements of the Securities Exchange Act of 1934, the registrant has duly caused this report to be signed on its behalf by the undersigned, thereunto duly authorized.
| CONTINENTAL CEMENT COMPANY, L.L.C. | ||||||
| Date: May 13, 2014 | By: | /s/ Thomas Beck | ||||
| Thomas Beck | ||||||
President (Principal Executive Officer) | ||||||
| Date: May 13, 2014 | By: | /s/ Mark Strieker | ||||
| Mark Strieker | ||||||
Vice President of Finance and Administration (Principal Financial and Accounting Officer) | ||||||
19
Table of Contents
Exhibit 31.1
CERTIFICATION
I, Thomas Beck, certify that:
| 1. | I have reviewed this Quarterly Report on Form 10-Q of Continental Cement Company, L.L.C. (the “registrant”); |
| 2. | Based on my knowledge, this report does not contain any untrue statement of a material fact or omit to state a material fact necessary to make the statements made, in light of the circumstances under which such statements were made, not misleading with respect to the period covered by this report; |
| 3. | Based on my knowledge, the financial statements, and other financial information included in this report, fairly present in all material respects the financial condition, results of operations and cash flows of the registrant as of, and for, the periods presented in this report; |
| 4. | The registrant’s other certifying officer(s) and I are responsible for establishing and maintaining disclosure controls and procedures (as defined in Exchange Act Rules 13a-15(e) and 15d-15(e)) for the registrant and have: |
| (a) | Designed such disclosure controls and procedures, or caused such disclosure controls and procedures to be designed under our supervision, to ensure that material information relating to the registrant, including its consolidated subsidiaries, is made known to us by others within those entities, particularly during the period in which this report is being prepared; |
| (b) | [Reserved]; |
| (c) | Evaluated the effectiveness of the registrant’s disclosure controls and procedures and presented in this report our conclusions about the effectiveness of the disclosure controls and procedures, as of the end of the period covered by this report based on such evaluation; and |
| (d) | Disclosed in this report any change in the registrant’s internal control over financial reporting that occurred during the registrant’s most recent fiscal quarter (the registrant’s fourth fiscal quarter in the case of an annual report) that has materially affected, or is reasonably likely to materially affect, the registrant’s internal control over financial reporting; and |
| 5. | The registrant’s other certifying officer(s) and I have disclosed, based on our most recent evaluation of internal control over financial reporting, to the registrant’s auditors and the audit committee of the registrant’s board of directors (or persons performing the equivalent functions): |
| (a) | All significant deficiencies and material weaknesses in the design or operation of internal control over financial reporting which are reasonably likely to adversely affect the registrant’s ability to record, process, summarize and report financial information; and |
| (b) | Any fraud, whether or not material, that involves management or other employees who have a significant role in the registrant’s internal control over financial reporting. |
Date: May 13, 2014
/s/ Thomas Beck |
| Thomas Beck |
President (Principal Executive Officer) |
Table of Contents
Exhibit 31.2
CERTIFICATION
I, Mark Strieker, certify that:
| 1. | I have reviewed this Quarterly Report on Form 10-Q of Continental Cement Company, L.L.C. (the “registrant”); |
| 2. | Based on my knowledge, this report does not contain any untrue statement of a material fact or omit to state a material fact necessary to make the statements made, in light of the circumstances under which such statements were made, not misleading with respect to the period covered by this report; |
| 3. | Based on my knowledge, the financial statements, and other financial information included in this report, fairly present in all material respects the financial condition, results of operations and cash flows of the registrant as of, and for, the periods presented in this report; |
| 4. | The registrant’s other certifying officer(s) and I are responsible for establishing and maintaining disclosure controls and procedures (as defined in Exchange Act Rules 13a-15(e) and 15d-15(e)) for the registrant and have: |
| (a) | Designed such disclosure controls and procedures, or caused such disclosure controls and procedures to be designed under our supervision, to ensure that material information relating to the registrant, including its consolidated subsidiaries, is made known to us by others within those entities, particularly during the period in which this report is being prepared; |
| (b) | [Reserved]; |
| (c) | Evaluated the effectiveness of the registrant’s disclosure controls and procedures and presented in this report our conclusions about the effectiveness of the disclosure controls and procedures, as of the end of the period covered by this report based on such evaluation; and |
| (d) | Disclosed in this report any change in the registrant’s internal control over financial reporting that occurred during the registrant’s most recent fiscal quarter (the registrant’s fourth fiscal quarter in the case of an annual report) that has materially affected, or is reasonably likely to materially affect, the registrant’s internal control over financial reporting; and |
| 5. | The registrant’s other certifying officer(s) and I have disclosed, based on our most recent evaluation of internal control over financial reporting, to the registrant’s auditors and the audit committee of the registrant’s board of directors (or persons performing the equivalent functions): |
| (a) | All significant deficiencies and material weaknesses in the design or operation of internal control over financial reporting which are reasonably likely to adversely affect the registrant’s ability to record, process, summarize and report financial information; and |
| (b) | Any fraud, whether or not material, that involves management or other employees who have a significant role in the registrant’s internal control over financial reporting. |
Date: May 13, 2014
/s/ Mark Strieker |
| Mark Strieker |
Vice President of Finance and Administration (Principal Financial Officer) |
Table of Contents
Exhibit 32.1
Certification
Pursuant to 18 U.S.C. Section 1350
as adopted pursuant to Section 906 of the Sarbanes-Oxley Act of 2002
In connection with the Quarterly Report of Continental Cement Company, L.L.C. (the “Company”) on Form 10-Q for the quarter ended March 29, 2014 as filed with the Securities and Exchange Commission on the date hereof (the “Report”), I, Thomas Beck, President of the Company, certify, pursuant to 18 U.S.C. Section 1350, as adopted pursuant to Section 906 of the Sarbanes-Oxley Act of 2002, that:
| (i) | The Report fully complies with the requirements of Section 13(a) or 15(d) of the Securities Exchange Act of 1934; and |
| (ii) | The information contained in the Report fairly presents, in all material respects, the financial condition and results of operations of the Company. |
Date: May 13, 2014
/s/ Thomas Beck |
| Thomas Beck |
President (Principal Executive Officer) |
Table of Contents
Exhibit 32.2
Certification
Pursuant to 18 U.S.C. Section 1350
as adopted pursuant to Section 906 of the Sarbanes-Oxley Act of 2002
In connection with the Quarterly Report of Continental Cement Company, L.L.C. (the “Company”) on Form 10-Q for the quarter ended March 29, 2014 as filed with the Securities and Exchange Commission on the date hereof (the “Report”), I, Mark Strieker, Vice President of Finance and Administration, certify, pursuant to 18 U.S.C. Section 1350, as adopted pursuant to Section 906 of the Sarbanes-Oxley Act of 2002, that:
| (i) | The Report fully complies with the requirements of Section 13(a) or 15(d) of the Securities Exchange Act of 1934; and |
| (ii) | The information contained in the Report fairly presents, in all material respects, the financial condition and results of operations of the Company. |
Date: May 13, 2014
/s/ Mark Strieker |
| Mark Strieker |
Vice President of Finance and Administration (Principal Financial and Accounting Officer) |
Table of Contents
Exhibit 95.1
Mine Safety Disclosures
The operation of the Company’s two aggregates quarries and an underground mine are subject to regulation by the federal Mine Safety and Health Administration (“MSHA”) under the Federal Mine Safety and Health Act of 1977 (the “Mine Act”). MSHA inspects the Company’s quarries and mines on a regular basis and issues various citations and orders when it believes a violation has occurred under the Mine Act. Whenever MSHA issues a citation or order, it also generally proposes a civil penalty, or fine, related to the alleged violation. Citations or orders may be contested and appealed, and as part of that process, are often reduced in severity and amount, and are sometimes dismissed.
Under the Dodd-Frank Wall Street Reform and Consumer Protection Act of 2010 (the “Dodd-Frank Act”), the Company is required to present information regarding certain mining safety and health citations which MSHA has issued with respect to its aggregates mining operations in its periodic reports filed with the Securities and Exchange Commission (“SEC”). In evaluating this information, consideration should be given to factors such as: (i) the number of citations and orders will vary depending on the size of the quarry or mine and types of operations (underground or surface), (ii) the number of citations issued will vary from inspector to inspector and location to location, and (iii) citations and orders can be contested and appealed, and in that process, may be reduced in severity and amount, and are sometimes dismissed.
The Company presents the following items regarding certain mining safety and health matters for the three months ended March 29, 2014, as applicable:
| • | Total number of violations of mandatory health or safety standards that could significantly and substantially contribute to the cause and effect of a mine safety or health hazard under section 104 of the Mine Act for which the Company has received a citation from MSHA (hereinafter, “Section 104 S&S Citations”). If MSHA determines that a violation of a mandatory health or safety standard is likely to result in a reasonably serious injury or illness under the unique circumstance contributed to by the violation, MSHA will classify the violation as a “significant and substantial” violation (commonly referred to as a “S&S” violation). MSHA inspectors will classify each citation or order written as a “S&S” violation or not. |
| • | Total number of orders issued under section 104(b) of the Mine Act (hereinafter, “Section 104(b) Orders”). These orders are issued for situations in which MSHA determines a previous violation covered by a Section 104(a) citation has not been totally abated within the prescribed time period, so a further order is needed to require the mine operator to immediately withdraw all persons (except authorized persons) from the affected area of a quarry or mine. |
| • | Total number of citations and orders for unwarrantable failure of the mine operator to comply with mandatory health or safety standards under Section 104(d) of the Mine Act (hereinafter, “Section 104(d) Citations and Orders”). These violations are similar to those described above, but the standard is that the violation could significantly and substantially contribute to the cause and effect of a safety or health hazard, but the conditions do not cause imminent danger, and the MSHA inspector finds that the violation is caused by an unwarranted failure of the operator to comply with the health and safety standards. |
| • | Total number of flagrant violations under section 110(b)(2) of the Mine Act (hereinafter, “Section 110(b)(2) Violations”). These violations are penalty violations issued if MSHA determines that violations are “flagrant”, for which civil penalties may be assessed. A “flagrant” violation means a reckless or repeated failure to make reasonable efforts to eliminate a known violation of a mandatory health or safety standard that substantially and proximately caused, or reasonably could have been expected to cause, death or serious bodily injury. |
| • | Total number of imminent danger orders issued under section 107(a) of the Mine Act (hereinafter, “Section 107(a) Orders”). These orders are issued for situations in which MSHA determines an imminent danger exists in the quarry or mine and results in orders of immediate withdrawal of all persons (except certain authorized persons) from the area of the quarry or mine affected by its condition until the imminent danger and the underlying conditions causing the imminent danger no longer exist. |
| • | Total dollar value of proposed assessments from MSHA under the Mine Act. These are the amounts of proposed assessments issued by MSHA with each citation or order for the time period covered by the reports. Penalties are assessed by MSHA according to a formula that considers a number of factors, including the mine operator’s history, size, negligence, gravity of the violation, good faith in trying to correct the violation promptly, and the effect of the penalty on the operator’s ability to continue in business. |
| • | Total number of mining-related fatalities. Mines subject to the Mine Act are required to report all fatalities occurring at their facilities unless the fatality is determined to be “non-chargeable” to the mining industry. The final rules of the SEC require disclosure of mining-related fatalities at mines subject to the Mine Act. Only fatalities determined by MSHA not to be mining-related may be excluded. |
Table of Contents
| • | Receipt of written notice from MSHA of a pattern (or a potential to have such a pattern) of violations of mandatory health or safety standards that are of such nature as could have significantly and substantially contributed to the cause and effect of other mine health or safety hazards under Section 104(e) of the Mine Act. If MSHA determines that a mine has a “pattern” of these types of violations, or the potential to have such a pattern, MSHA is required to notify the mine operator of the existence of such a thing. |
| • | Legal actions before the Federal Mine Safety and Health Review Commission (the “Commission”) pending as of the last day of period. |
| • | Legal actions before the Commission initiated during period. |
| • | Legal actions before the Commission resolved during period. |
The Commission is an independent adjudicative agency that provides administrative trial and appellate review of legal disputes arising under the Mine Act. The cases may involve, among other questions, challenges by operators to citations, orders and penalties they have received from MSHA, or complaints of discrimination by miners under Section 105 of the Mine Act. There were no legal actions pending before the Commission for any of the Company’s quarries or the underground mine, as of or during the quarter ended March 29, 2014.
Appendix 1 follows.
Table of Contents
Appendix 1
Name of | Name of | MSHA ID Number | State | Number of Inspections | Total Number of Section 104 S&S Citations | Section 104(b) Orders | Section 104(d) Citations and Orders | Section 110(b)(2) Violations | Section 107(a) Orders | Total Dollar Value of Proposed MSHA Assessments | Total Number of Mining Related Fatalities | Received Written Notice under Section 104(e) (yes/no) | Received Written Notice of potential Violation under 104(e) (yes/no) | Number of Contested Citations | Number of Contested Penalties | Total Dollar Value of Penalties in Contest | Number of Complaints of Discharge or Discrimination | |||||||||||||||||||||||||||||||||||||||||||||||
Continental Cement Company | Hannibal Plant | 2300217 | MO | 1 | 0 | 0 | 0 | 0 | 0 | $ | 0.00 | 0 | No | No | 0 | 0 | $ | 0.00 | 0 | |||||||||||||||||||||||||||||||||||||||||||||
Continental Cement Company | Owensville Plant | 2301038 | MO | 0 | 0 | 0 | 0 | 0 | 0 | $ | 0.00 | 0 | No | No | 0 | 0 | $ | 0.00 | 0 | |||||||||||||||||||||||||||||||||||||||||||||
Continental Cement Company | Hannibal Underground Mine | 2302434 | MO | 1 | 0 | 0 | 0 | 0 | 0 | $ | 0.00 | 0 | No | No | 0 | 0 | $ | 0.00 | 0 | |||||||||||||||||||||||||||||||||||||||||||||
Table of Contents
Exhibit 99.1
SECTION 13(R) DISCLOSURE
The disclosure reproduced below was initially included in a periodic report filed with the Securities and Exchange Commission by The Blackstone Group L.P. (“Blackstone”) in regard to Travelport Limited, which may be considered an affiliate of Blackstone, and therefore an affiliate of Summit Materials, LLC (“Summit Materials”). Summit Materials did not independently verify or participate in the preparation of this disclosure.
Blackstone included the following disclosure in its Form 10-Q for the fiscal quarter ended March 31, 2014:
Travelport Limited, which may be considered our affiliate, provided the disclosure reproduced below in connection with activities during the quarter ended March 31, 2014. We have not independently verified or participated in the preparation of this disclosure.
“As part of our global business in the travel industry, we provide certain passenger travel-related GDS and airline IT services to Iran Air. We also provide certain airline IT services to Iran Air Tours. All of these services are either exempt from applicable sanctions prohibitions pursuant to a statutory exemption permitting transactions ordinarily incident to travel or, to the extent not otherwise exempt, specifically licensed by the U.S. Office of Foreign Assets Control. Subject to any changes in the exempt/licensed status of such activities, we intend to continue these business activities, which are directly related to and promote the arrangement of travel for individuals.”
Travelport has not provided us with gross revenues and net profits attributable to the activities described above.