UNITED STATES
SECURITIES AND EXCHANGE COMMISSION
Washington, D.C. 20549
FORM N-CSR
CERTIFIED SHAREHOLDER REPORT OF REGISTERED
MANAGEMENT INVESTMENT COMPANIES
Investment Company Act File Number: 811-22810
T. Rowe Price Global Allocation Fund, Inc.
(Exact name of registrant as specified in charter)
100 East Pratt Street, Baltimore, MD 21202
(Address of principal executive offices)
David Oestreicher
100 East Pratt Street, Baltimore, MD 21202
(Name and address of agent for service)
Registrant’s telephone number, including area code: (410) 345-2000
Date of fiscal year end: October 31
Date of reporting period: October 31, 2024
Item 1. Reports to Shareholders
(a) Report pursuant to Rule 30e-1
Annual Shareholder Report
October 31, 2024
This annual shareholder report contains important information about Global Allocation Fund (the "fund") for the period of November 1, 2023 to October 31, 2024. You can find the fund’s prospectus, financial information on Form N‑CSR (which includes required tax information for dividends), holdings, proxy voting information, and other information atwww.troweprice.com/prospectus. You can also request this information without charge by contacting T. Rowe Price at 1‑800‑638‑5660 or info@troweprice.com or contacting your intermediary.
What were the fund costs for the last year? (based on a hypothetical $10,000 investment)
| | Costs of a $10,000 investment | Costs paid as a percentage of a $10,000 investment |
|---|
| Global Allocation Fund - Investor Class | $86 | 0.78% |
What drove fund performance during the past 12 months?
Global equity and fixed income markets advanced over the period, with many major stock indexes posting double-digit gains. Global emerging markets outpaced their developed markets counterparts during the period. In the fixed income universe, a very strong fourth quarter of 2023 and third quarter of 2024 offset negative returns in global bond markets during the first and second quarters of 2024.
Versus the Morningstar Global Allocation Index, security selection within U.S. small- and mid-cap securities had a positive impact during the period. The inclusion of international developed markets bonds as a diversifying exposure also aided relative results.
On the negative side, stock selection among emerging markets equities was a notable detractor during the period. Our overweight allocation to cash during the period also weighed on relative returns during a period of strong returns for both stocks and bonds.
The fund seeks long-term capital appreciation and income. It provides investors a core multi-asset portfolio that is globally diversified across traditional and alternative asset classes—emphasizing the roles of broad diversification, fundamental research, tactical allocation, and risk management. The fund is a single investment option that invests in global opportunities across a wide spectrum of equity, fixed income, and hedge fund strategies.
How has the fund performed?
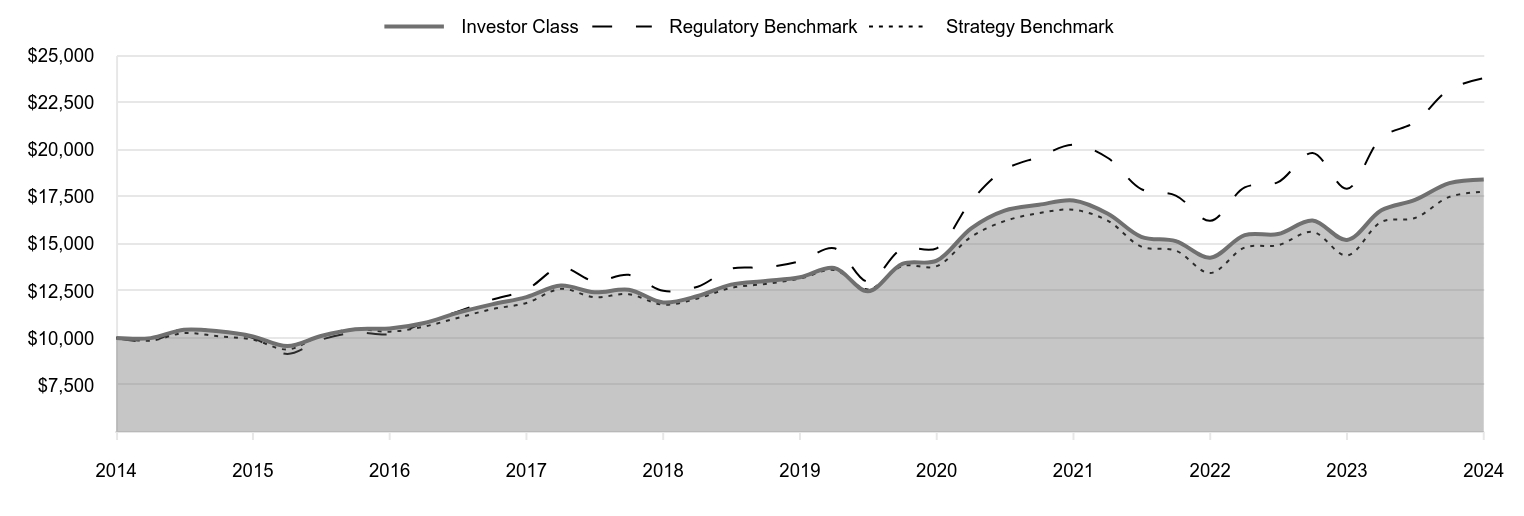
Cumulative Returns of a Hypothetical $10,000 Investment as of October 31, 2024
| Investor Class | Regulatory Benchmark | Strategy Benchmark |
|---|
| 2014 | 10,000 | 10,000 | 10,000 |
| 2015 | 9,990 | 9,815 | 9,855 |
| 2015 | 10,436 | 10,497 | 10,259 |
| 2015 | 10,353 | 10,325 | 10,087 |
| 2015 | 10,083 | 9,997 | 9,908 |
| 2016 | 9,565 | 9,148 | 9,389 |
| 2016 | 10,104 | 9,903 | 10,104 |
| 2016 | 10,463 | 10,280 | 10,463 |
| 2016 | 10,501 | 10,201 | 10,332 |
| 2017 | 10,797 | 10,788 | 10,605 |
| 2017 | 11,335 | 11,401 | 11,062 |
| 2017 | 11,786 | 12,033 | 11,530 |
| 2017 | 12,170 | 12,568 | 11,857 |
| 2018 | 12,786 | 13,753 | 12,609 |
| 2018 | 12,425 | 13,016 | 12,164 |
| 2018 | 12,562 | 13,353 | 12,326 |
| 2018 | 11,888 | 12,503 | 11,769 |
| 2019 | 12,226 | 12,724 | 12,099 |
| 2019 | 12,836 | 13,675 | 12,662 |
| 2019 | 13,026 | 13,746 | 12,873 |
| 2019 | 13,226 | 14,078 | 13,152 |
| 2020 | 13,718 | 14,764 | 13,611 |
| 2020 | 12,481 | 12,997 | 12,581 |
| 2020 | 13,932 | 14,736 | 13,816 |
| 2020 | 14,106 | 14,766 | 13,814 |
| 2021 | 15,826 | 17,277 | 15,377 |
| 2021 | 16,766 | 18,943 | 16,209 |
| 2021 | 17,076 | 19,625 | 16,634 |
| 2021 | 17,303 | 20,270 | 16,811 |
| 2022 | 16,601 | 19,563 | 16,227 |
| 2022 | 15,378 | 17,912 | 14,853 |
| 2022 | 15,145 | 17,568 | 14,643 |
| 2022 | 14,266 | 16,225 | 13,449 |
| 2023 | 15,463 | 17,999 | 14,802 |
| 2023 | 15,521 | 18,281 | 14,927 |
| 2023 | 16,243 | 19,836 | 15,640 |
| 2023 | 15,211 | 17,929 | 14,381 |
| 2024 | 16,781 | 20,644 | 16,167 |
| 2024 | 17,333 | 21,474 | 16,373 |
| 2024 | 18,227 | 23,212 | 17,500 |
| 2024 | 18,427 | 23,808 | 17,774 |
202411-4029887, 202412-3916058
Average Annual Total Returns
| | 1 Year | 5 Years | 10 Years |
|---|
| Global Allocation Fund (Investor Class) | 21.14% | 6.86% | 6.30% |
| MSCI All Country World Index Net (Regulatory Benchmark) | 32.79 | 11.08 | 9.06 |
| Morningstar Global Allocation Index (Strategy Benchmark) | 23.59 | 6.21 | 5.92 |
The preceding line graph shows the value of a hypothetical $10,000 investment in the fund over the past 10 fiscal year periods or since inception (for funds lacking 10-year records). The fund’s performance information included in the line graph and table above is compared with a regulatory required index that represents an overall securities market (Regulatory Benchmark). In addition, the line graph and table may also include one or more indexes that more closely aligns to the fund's investment strategy (Strategy Benchmark(s)). Due to new SEC Rules on shareholder reporting the fund adopted a new broad-based securities market index, referred to as the Regulatory Benchmark. Market index returns do not include expenses, which are deducted from fund returns. The fund's total return figures reflect the reinvestment of dividends and capital gains, if any.Neither the fund’s returns nor the index returns reflect the deduction of taxes that a shareholder would pay on fund distributions or redemptions of fund shares.The fund’s past performance is not a good predictor of the fund’s future performance.Updated performance information can be found at www.troweprice.com.
What are some fund statistics?
- Total Net Assets (000s)$812,075
- Number of Portfolio Holdings1,549
- Investment Advisory Fees Paid (000s)$4,332
- Portfolio Turnover Rate38.8%
What did the fund invest in?
Security Allocation (as a % of Net Assets)
| Common Stocks | 54.0% |
| Bond Mutual Funds | 15.6 |
| Equity Mutual Funds | 7.9 |
| Private Investment Companies | 7.7 |
| U.S. Government Agency Obligations (Excluding Mortgage-Backed) | 7.0 |
| Corporate Bonds | 4.1 |
| Non-U.S. Government Mortgage-Backed Securities | 0.7 |
| Securities Lending Collateral | 0.7 |
| Short-Term and Other | 2.3 |
Top Ten Holdings (as a % of Net Assets)
| Blackstone Partners Offshore Fund | 7.7% |
| T. Rowe Price Integrated U.S. Small-Mid Cap Core Equity Fund - I Class | 5.4 |
| T. Rowe Price Emerging Markets Bond Fund - I Class | 3.9 |
| U.S. Treasury Inflation-Indexed Notes | 2.9 |
| T. Rowe Price International Bond Fund - I Class | 2.9 |
| T. Rowe Price Institutional High Yield Fund - Institutional Class | 2.6 |
| T. Rowe Price Multi-Strategy Total Return Fund - I Class | 2.6 |
| T. Rowe Price Emerging Markets Local Currency Bond Fund - I Class | 2.2 |
| U.S. Treasury Bonds | 2.1 |
| T. Rowe Price Dynamic Global Bond Fund - I Class | 2.0 |
If you invest directly with T. Rowe Price, you can elect to receive future shareholder reports or other important documents through electronic delivery by enrolling at www.troweprice.com/paperless. If you invest through a financial intermediary such as an investment advisor, a bank, retirement plan sponsor or a brokerage firm, please contact that organization and ask if it can provide electronic delivery.
MSCI and Morningstar do not accept any liability for any errors or omissions in the indexes or data, and hereby expressly disclaim all warranties of originality, accuracy, completeness, timeliness, merchantability and fitness for a particular purpose. No party may rely on any indexes or data contained in this communication. Visit www.troweprice.com/en/us/market-data-disclosures for additional legal notices & disclaimers.
Global Allocation Fund
Investor Class (RPGAX)
T. Rowe Price Investment Services, Inc.
100 East Pratt Street
Baltimore, MD 21202
Annual Shareholder Report
October 31, 2024
This annual shareholder report contains important information about Global Allocation Fund (the "fund") for the period of November 1, 2023 to October 31, 2024. You can find the fund’s prospectus, financial information on Form N‑CSR (which includes required tax information for dividends), holdings, proxy voting information, and other information atwww.troweprice.com/prospectus. You can also request this information without charge by contacting T. Rowe Price at 1‑800‑638‑5660 or info@troweprice.com or contacting your intermediary.
What were the fund costs for the last year? (based on a hypothetical $10,000 investment)
| | Costs of a $10,000 investment | Costs paid as a percentage of a $10,000 investment |
|---|
| Global Allocation Fund - Advisor Class | $112 | 1.01% |
What drove fund performance during the past 12 months?
Global equity and fixed income markets advanced over the period, with many major stock indexes posting double-digit gains. Global emerging markets outpaced their developed markets counterparts during the period. In the fixed income universe, a very strong fourth quarter of 2023 and third quarter of 2024 offset negative returns in global bond markets during the first and second quarters of 2024.
Versus the Morningstar Global Allocation Index, security selection within U.S. small- and mid-cap securities had a positive impact during the period. The inclusion of international developed markets bonds as a diversifying exposure also aided relative results.
On the negative side, stock selection among emerging markets equities was a notable detractor during the period. Our overweight allocation to cash during the period also weighed on relative returns during a period of strong returns for both stocks and bonds.
The fund seeks long-term capital appreciation and income. It provides investors a core multi-asset portfolio that is globally diversified across traditional and alternative asset classes—emphasizing the roles of broad diversification, fundamental research, tactical allocation, and risk management. The fund is a single investment option that invests in global opportunities across a wide spectrum of equity, fixed income, and hedge fund strategies.
How has the fund performed?
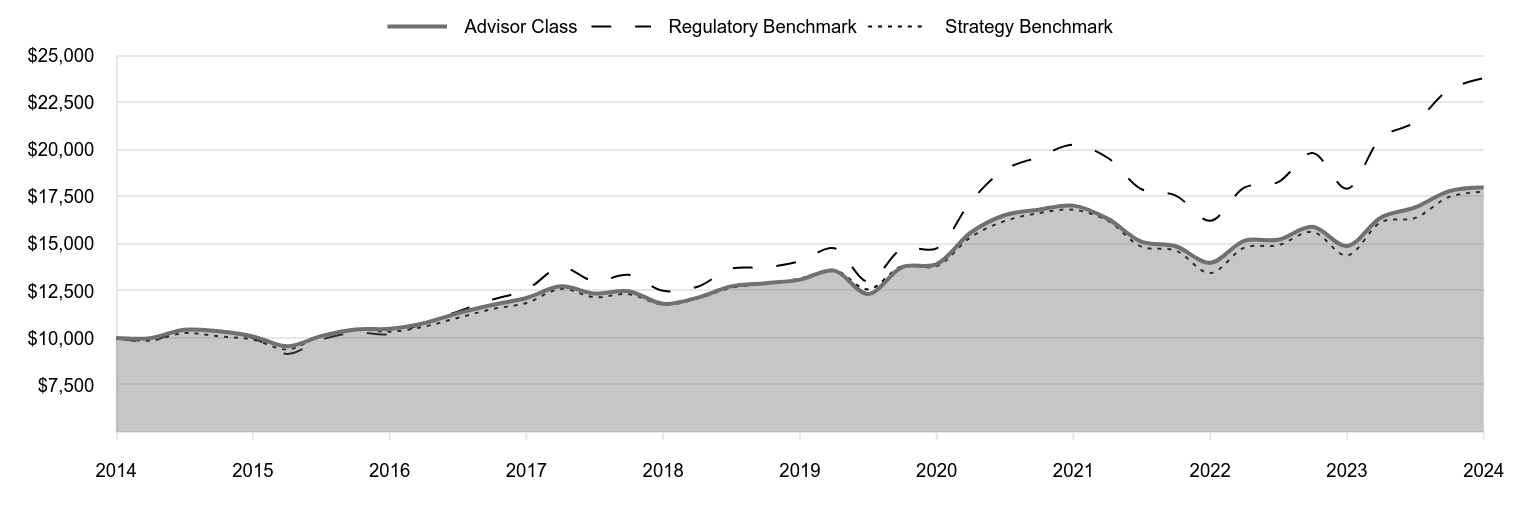
Cumulative Returns of a Hypothetical $10,000 Investment as of October 31, 2024
| Advisor Class | Regulatory Benchmark | Strategy Benchmark |
|---|
| 2014 | 10,000 | 10,000 | 10,000 |
| 2015 | 9,990 | 9,815 | 9,855 |
| 2015 | 10,437 | 10,497 | 10,259 |
| 2015 | 10,353 | 10,325 | 10,087 |
| 2015 | 10,083 | 9,997 | 9,908 |
| 2016 | 9,554 | 9,148 | 9,389 |
| 2016 | 10,094 | 9,903 | 10,104 |
| 2016 | 10,454 | 10,280 | 10,463 |
| 2016 | 10,482 | 10,201 | 10,332 |
| 2017 | 10,789 | 10,788 | 10,605 |
| 2017 | 11,308 | 11,401 | 11,062 |
| 2017 | 11,750 | 12,033 | 11,530 |
| 2017 | 12,124 | 12,568 | 11,857 |
| 2018 | 12,741 | 13,753 | 12,609 |
| 2018 | 12,360 | 13,016 | 12,164 |
| 2018 | 12,487 | 13,353 | 12,326 |
| 2018 | 11,814 | 12,503 | 11,769 |
| 2019 | 12,140 | 12,724 | 12,099 |
| 2019 | 12,739 | 13,675 | 12,662 |
| 2019 | 12,908 | 13,746 | 12,873 |
| 2019 | 13,098 | 14,078 | 13,152 |
| 2020 | 13,578 | 14,764 | 13,611 |
| 2020 | 12,335 | 12,997 | 12,581 |
| 2020 | 13,761 | 14,736 | 13,816 |
| 2020 | 13,924 | 14,766 | 13,814 |
| 2021 | 15,617 | 17,277 | 15,377 |
| 2021 | 16,520 | 18,943 | 16,209 |
| 2021 | 16,818 | 19,625 | 16,634 |
| 2021 | 17,033 | 20,270 | 16,811 |
| 2022 | 16,328 | 19,563 | 16,227 |
| 2022 | 15,117 | 17,912 | 14,853 |
| 2022 | 14,874 | 17,568 | 14,643 |
| 2022 | 13,994 | 16,225 | 13,449 |
| 2023 | 15,169 | 17,999 | 14,802 |
| 2023 | 15,215 | 18,281 | 14,927 |
| 2023 | 15,905 | 19,836 | 15,640 |
| 2023 | 14,886 | 17,929 | 14,381 |
| 2024 | 16,415 | 20,644 | 16,167 |
| 2024 | 16,936 | 21,474 | 16,373 |
| 2024 | 17,805 | 23,212 | 17,500 |
| 2024 | 17,990 | 23,808 | 17,774 |
202411-4029887, 202412-3916058
Average Annual Total Returns
| | 1 Year | 5 Years | 10 Years |
|---|
| Global Allocation Fund (Advisor Class) | 20.85% | 6.55% | 6.05% |
| MSCI All Country World Index Net (Regulatory Benchmark) | 32.79 | 11.08 | 9.06 |
| Morningstar Global Allocation Index (Strategy Benchmark) | 23.59 | 6.21 | 5.92 |
The preceding line graph shows the value of a hypothetical $10,000 investment in the fund over the past 10 fiscal year periods or since inception (for funds lacking 10-year records). The fund’s performance information included in the line graph and table above is compared with a regulatory required index that represents an overall securities market (Regulatory Benchmark). In addition, the line graph and table may also include one or more indexes that more closely aligns to the fund's investment strategy (Strategy Benchmark(s)). Due to new SEC Rules on shareholder reporting the fund adopted a new broad-based securities market index, referred to as the Regulatory Benchmark. Market index returns do not include expenses, which are deducted from fund returns. The fund's total return figures reflect the reinvestment of dividends and capital gains, if any.Neither the fund’s returns nor the index returns reflect the deduction of taxes that a shareholder would pay on fund distributions or redemptions of fund shares.The fund’s past performance is not a good predictor of the fund’s future performance.Updated performance information can be found at www.troweprice.com.
What are some fund statistics?
- Total Net Assets (000s)$812,075
- Number of Portfolio Holdings1,549
- Investment Advisory Fees Paid (000s)$4,332
- Portfolio Turnover Rate38.8%
What did the fund invest in?
Security Allocation (as a % of Net Assets)
| Common Stocks | 54.0% |
| Bond Mutual Funds | 15.6 |
| Equity Mutual Funds | 7.9 |
| Private Investment Companies | 7.7 |
| U.S. Government Agency Obligations (Excluding Mortgage-Backed) | 7.0 |
| Corporate Bonds | 4.1 |
| Non-U.S. Government Mortgage-Backed Securities | 0.7 |
| Securities Lending Collateral | 0.7 |
| Short-Term and Other | 2.3 |
Top Ten Holdings (as a % of Net Assets)
| Blackstone Partners Offshore Fund | 7.7% |
| T. Rowe Price Integrated U.S. Small-Mid Cap Core Equity Fund - I Class | 5.4 |
| T. Rowe Price Emerging Markets Bond Fund - I Class | 3.9 |
| U.S. Treasury Inflation-Indexed Notes | 2.9 |
| T. Rowe Price International Bond Fund - I Class | 2.9 |
| T. Rowe Price Institutional High Yield Fund - Institutional Class | 2.6 |
| T. Rowe Price Multi-Strategy Total Return Fund - I Class | 2.6 |
| T. Rowe Price Emerging Markets Local Currency Bond Fund - I Class | 2.2 |
| U.S. Treasury Bonds | 2.1 |
| T. Rowe Price Dynamic Global Bond Fund - I Class | 2.0 |
If you invest directly with T. Rowe Price, you can elect to receive future shareholder reports or other important documents through electronic delivery by enrolling at www.troweprice.com/paperless. If you invest through a financial intermediary such as an investment advisor, a bank, retirement plan sponsor or a brokerage firm, please contact that organization and ask if it can provide electronic delivery.
MSCI and Morningstar do not accept any liability for any errors or omissions in the indexes or data, and hereby expressly disclaim all warranties of originality, accuracy, completeness, timeliness, merchantability and fitness for a particular purpose. No party may rely on any indexes or data contained in this communication. Visit www.troweprice.com/en/us/market-data-disclosures for additional legal notices & disclaimers.
Global Allocation Fund
Advisor Class (PAFGX)
T. Rowe Price Investment Services, Inc.
100 East Pratt Street
Baltimore, MD 21202
Annual Shareholder Report
October 31, 2024
This annual shareholder report contains important information about Global Allocation Fund (the "fund") for the period of November 1, 2023 to October 31, 2024. You can find the fund’s prospectus, financial information on Form N‑CSR (which includes required tax information for dividends), holdings, proxy voting information, and other information atwww.troweprice.com/prospectus. You can also request this information without charge by contacting T. Rowe Price at 1‑800‑638‑5660 or info@troweprice.com or contacting your intermediary.
What were the fund costs for the last year? (based on a hypothetical $10,000 investment)
| | Costs of a $10,000 investment | Costs paid as a percentage of a $10,000 investment |
|---|
| Global Allocation Fund - I Class | $66 | 0.60% |
What drove fund performance during the past 12 months?
Global equity and fixed income markets advanced over the period, with many major stock indexes posting double-digit gains. Global emerging markets outpaced their developed markets counterparts during the period. In the fixed income universe, a very strong fourth quarter of 2023 and third quarter of 2024 offset negative returns in global bond markets during the first and second quarters of 2024.
Versus the Morningstar Global Allocation Index, security selection within U.S. small- and mid-cap securities had a positive impact during the period. The inclusion of international developed markets bonds as a diversifying exposure also aided relative results.
On the negative side, stock selection among emerging markets equities was a notable detractor during the period. Our overweight allocation to cash during the period also weighed on relative returns during a period of strong returns for both stocks and bonds.
The fund seeks long-term capital appreciation and income. It provides investors a core multi-asset portfolio that is globally diversified across traditional and alternative asset classes—emphasizing the roles of broad diversification, fundamental research, tactical allocation, and risk management. The fund is a single investment option that invests in global opportunities across a wide spectrum of equity, fixed income, and hedge fund strategies.
How has the fund performed?
Cumulative Returns of a Hypothetical $500,000 Investment as of October 31, 2024
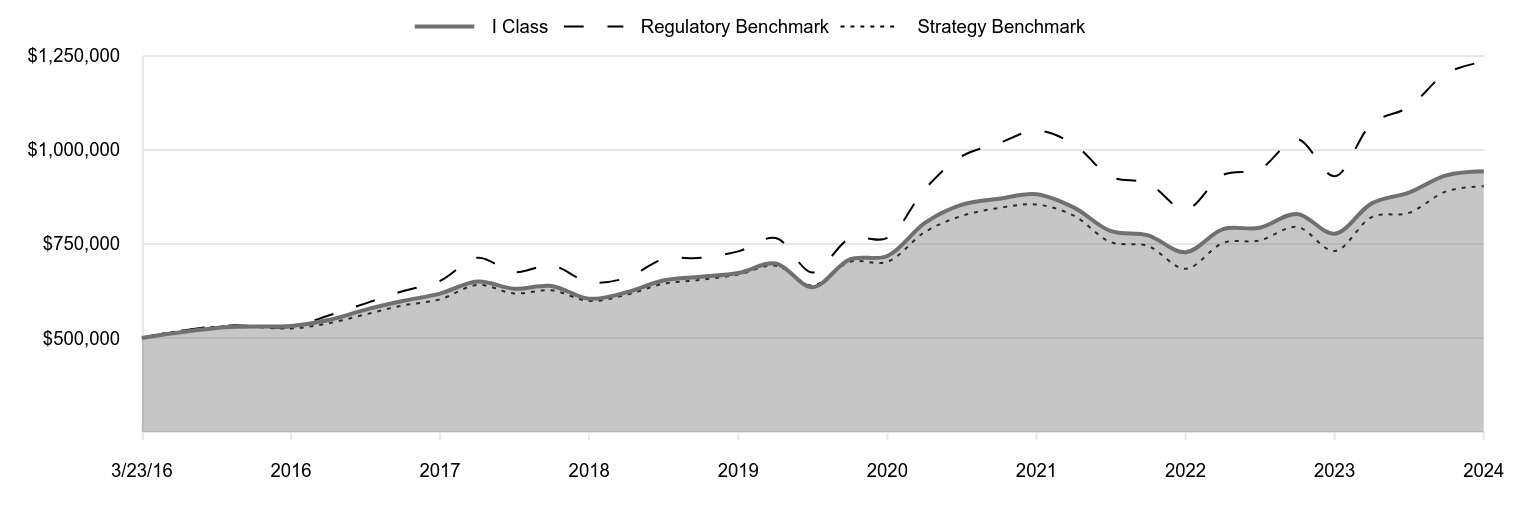
| I Class | Regulatory Benchmark | Strategy Benchmark |
|---|
| 3/23/16 | 500,000 | 500,000 | 500,000 |
| 4/30/16 | 510,506 | 513,519 | 513,603 |
| 7/31/16 | 529,131 | 533,078 | 531,818 |
| 10/31/16 | 531,996 | 529,014 | 525,192 |
| 1/31/17 | 547,484 | 559,439 | 539,056 |
| 4/30/17 | 574,688 | 591,241 | 562,268 |
| 7/31/17 | 598,006 | 624,010 | 586,061 |
| 10/31/17 | 617,923 | 651,761 | 602,713 |
| 1/31/18 | 649,662 | 713,175 | 640,930 |
| 4/30/18 | 630,860 | 674,982 | 618,298 |
| 7/31/18 | 638,281 | 692,436 | 626,552 |
| 10/31/18 | 604,141 | 648,387 | 598,234 |
| 1/31/19 | 621,288 | 659,820 | 614,984 |
| 4/30/19 | 652,758 | 709,151 | 643,598 |
| 7/31/19 | 662,403 | 712,848 | 654,340 |
| 10/31/19 | 672,554 | 730,029 | 668,505 |
| 1/31/20 | 697,989 | 765,634 | 691,844 |
| 4/30/20 | 634,724 | 673,995 | 639,510 |
| 7/31/20 | 708,878 | 764,164 | 702,260 |
| 10/31/20 | 717,694 | 765,711 | 702,186 |
| 1/31/21 | 805,966 | 895,935 | 781,601 |
| 4/30/21 | 853,685 | 982,323 | 823,929 |
| 7/31/21 | 869,940 | 1,017,721 | 845,539 |
| 10/31/21 | 882,001 | 1,051,148 | 854,536 |
| 1/31/22 | 846,412 | 1,014,473 | 824,809 |
| 4/30/22 | 784,259 | 928,861 | 754,985 |
| 7/31/22 | 772,394 | 911,023 | 744,305 |
| 10/31/22 | 727,756 | 841,367 | 683,641 |
| 1/31/23 | 789,168 | 933,377 | 752,407 |
| 4/30/23 | 792,675 | 948,012 | 758,746 |
| 7/31/23 | 829,503 | 1,028,638 | 794,988 |
| 10/31/23 | 776,892 | 929,727 | 731,007 |
| 1/31/24 | 858,231 | 1,070,556 | 821,785 |
| 4/30/24 | 886,498 | 1,113,559 | 832,245 |
| 7/31/24 | 932,207 | 1,203,697 | 889,562 |
| 10/31/24 | 943,032 | 1,234,592 | 903,450 |
202411-4029887, 202412-3916058
Average Annual Total Returns
| | 1 Year | 5 Years | Since Inception 3/23/16 |
|---|
| Global Allocation Fund (I Class) | 21.39% | 6.99% | 7.65% |
| MSCI All Country World Index Net (Regulatory Benchmark) | 32.79 | 11.08 | 11.07 |
| Morningstar Global Allocation Index (Strategy Benchmark) | 23.59 | 6.21 | 7.11 |
The preceding line graph shows the value of a hypothetical $500,000 investment in the fund over the past 10 fiscal year periods or since inception (for funds lacking 10-year records). The fund’s performance information included in the line graph and table above is compared with a regulatory required index that represents an overall securities market (Regulatory Benchmark). In addition, the line graph and table may also include one or more indexes that more closely aligns to the fund's investment strategy (Strategy Benchmark(s)). Due to new SEC Rules on shareholder reporting the fund adopted a new broad-based securities market index, referred to as the Regulatory Benchmark. Market index returns do not include expenses, which are deducted from fund returns. The fund's total return figures reflect the reinvestment of dividends and capital gains, if any.Neither the fund’s returns nor the index returns reflect the deduction of taxes that a shareholder would pay on fund distributions or redemptions of fund shares.The fund’s past performance is not a good predictor of the fund’s future performance.Updated performance information can be found at www.troweprice.com.
What are some fund statistics?
- Total Net Assets (000s)$812,075
- Number of Portfolio Holdings1,549
- Investment Advisory Fees Paid (000s)$4,332
- Portfolio Turnover Rate38.8%
What did the fund invest in?
Security Allocation (as a % of Net Assets)
| Common Stocks | 54.0% |
| Bond Mutual Funds | 15.6 |
| Equity Mutual Funds | 7.9 |
| Private Investment Companies | 7.7 |
| U.S. Government Agency Obligations (Excluding Mortgage-Backed) | 7.0 |
| Corporate Bonds | 4.1 |
| Non-U.S. Government Mortgage-Backed Securities | 0.7 |
| Securities Lending Collateral | 0.7 |
| Short-Term and Other | 2.3 |
Top Ten Holdings (as a % of Net Assets)
| Blackstone Partners Offshore Fund | 7.7% |
| T. Rowe Price Integrated U.S. Small-Mid Cap Core Equity Fund - I Class | 5.4 |
| T. Rowe Price Emerging Markets Bond Fund - I Class | 3.9 |
| U.S. Treasury Inflation-Indexed Notes | 2.9 |
| T. Rowe Price International Bond Fund - I Class | 2.9 |
| T. Rowe Price Institutional High Yield Fund - Institutional Class | 2.6 |
| T. Rowe Price Multi-Strategy Total Return Fund - I Class | 2.6 |
| T. Rowe Price Emerging Markets Local Currency Bond Fund - I Class | 2.2 |
| U.S. Treasury Bonds | 2.1 |
| T. Rowe Price Dynamic Global Bond Fund - I Class | 2.0 |
If you invest directly with T. Rowe Price, you can elect to receive future shareholder reports or other important documents through electronic delivery by enrolling at www.troweprice.com/paperless. If you invest through a financial intermediary such as an investment advisor, a bank, retirement plan sponsor or a brokerage firm, please contact that organization and ask if it can provide electronic delivery.
MSCI and Morningstar do not accept any liability for any errors or omissions in the indexes or data, and hereby expressly disclaim all warranties of originality, accuracy, completeness, timeliness, merchantability and fitness for a particular purpose. No party may rely on any indexes or data contained in this communication. Visit www.troweprice.com/en/us/market-data-disclosures for additional legal notices & disclaimers.
Global Allocation Fund
I Class (TGAFX)
T. Rowe Price Investment Services, Inc.
100 East Pratt Street
Baltimore, MD 21202
Item 1. (b) Notice pursuant to Rule 30e-3.
Not applicable.
Item 2. Code of Ethics.
The registrant has adopted a code of ethics, as defined in Item 2 of Form N-CSR, applicable to its principal executive officer, principal financial officer, principal accounting officer or controller, or persons performing similar functions. A copy of this code of ethics is filed as an exhibit to this Form N-CSR. No substantive amendments were approved or waivers were granted to this code of ethics during the period covered by this report.
Item 3. Audit Committee Financial Expert.
The registrant’s Board of Directors has determined that Mr. Paul F. McBride qualifies as an audit committee financial expert, as defined in Item 3 of Form N-CSR. Mr. McBride is considered independent for purposes of Item 3 of Form N-CSR.
Item 4. Principal Accountant Fees and Services.
(a) – (d) Aggregate fees billed for the last two fiscal years for professional services rendered to, or on behalf of, the registrant by the registrant’s principal accountant were as follows:
| | | | | | | | | | |
| | | 2024 | | | 2023 | | | |
Audit Fees | | $ | 46,029 | | | $ | 45,083 | |
Audit-Related Fees | | | - | | | | - | |
Tax Fees | | | - | | | | - | |
All Other Fees | | | - | | | | - | |
Audit fees include amounts related to the audit of the registrant’s annual financial statements and services normally provided by the accountant in connection with statutory and regulatory filings. Audit-related fees include amounts reasonably related to the performance of the audit of the registrant’s financial statements and specifically include the issuance of a report on internal controls and, if applicable, agreed-upon procedures related to fund acquisitions. Tax fees include amounts related to services for tax compliance, tax planning, and tax advice. The nature of these services specifically includes the review of distribution calculations and the preparation of Federal, state, and excise tax returns. All other fees include the registrant’s pro-rata share of amounts for agreed-upon procedures in conjunction with service contract approvals by the registrant’s Board of Directors/Trustees.
(e)(1) The registrant’s audit committee has adopted a policy whereby audit and non-audit services performed by the registrant’s principal accountant for the registrant, its investment adviser, and any entity controlling, controlled by, or under common control with the investment adviser that provides ongoing services to the registrant require pre-approval in advance at regularly scheduled audit committee meetings. If such a service is required between regularly scheduled audit committee meetings, pre-approval may be authorized by one audit committee member with ratification at the next scheduled audit committee meeting. Waiver of pre-approval for audit or non-audit services requiring fees of a de minimis amount is not permitted.
(2) No services included in (b) – (d) above were approved pursuant to paragraph (c)(7)(i)(C) of Rule 2-01 of Regulation S-X.
(f) Less than 50 percent of the hours expended on the principal accountant’s engagement to audit the registrant’s financial statements for the most recent fiscal year were attributed to work performed by persons other than the principal accountant’s full-time, permanent employees.
(g) The aggregate fees billed for the most recent fiscal year and the preceding fiscal year by the registrant’s principal accountant for non-audit services rendered to the registrant, its investment adviser, and any entity controlling, controlled by, or under common control with the investment adviser that provides ongoing services to the registrant were $846,000 and $1,584,000, respectively.
(h) All non-audit services rendered in (g) above were pre-approved by the registrant’s audit committee. Accordingly, these services were considered by the registrant’s audit committee in maintaining the principal accountant’s independence.
(i) Not applicable.
(j) Not applicable.
Item 5. Audit Committee of Listed Registrants.
Not applicable.
Item 6. Investments.
(a) Not applicable. The complete schedule of investments is included in Item 7 of this Form N-CSR.
(b) Not applicable.
Item 7. Financial Statements and Financial Highlights for Open-End Management Investment Companies.
(a – b) Report pursuant to Regulation S-X.
Financial
Highlights
Portfolio
of
Investments
Financial
Statements
and
Notes
Additional
Fund
Information
Financial
Statements
and
Other
Information
For
more
insights
from
T.
Rowe
Price
investment
professionals,
go
to
troweprice.com
.
T.
ROWE
PRICE
RPGAX
Global
Allocation
Fund
PAFGX
Global
Allocation
Fund–
.
Advisor Class
TGAFX
Global
Allocation
Fund–
.
I Class
T.
ROWE
PRICE
Global
Allocation
Fund
For
a
share
outstanding
throughout
each
period
The
accompanying
notes
are
an
integral
part
of
these
financial
statements.
Investor
Class
..
Year
..
..
Ended
.
10/31/24
10/31/23
10/31/22
10/31/21
10/31/20
NET
ASSET
VALUE
Beginning
of
period
$
13.26
$
12.83
$
16.75
$
13.80
$
13.22
Investment
activities
Net
investment
income
(1)(2)
0.28
0.25
0.20
0.16
0.15
Net
realized
and
unrealized
gain/loss
2.49
0.59
(2.95)
2.95
0.72
Total
from
investment
activities
2.77
0.84
(2.75)
3.11
0.87
Distributions
Net
investment
income
(0.36)
(0.22)
(0.15)
(0.14)
(0.18)
Net
realized
gain
—
(0.19)
(1.02)
(0.02)
(0.11)
Total
distributions
(0.36)
(0.41)
(1.17)
(0.16)
(0.29)
NET
ASSET
VALUE
End
of
period
$
15.67
$
13.26
$
12.83
$
16.75
$
13.80
Ratios/Supplemental
Data
Total
return
(2)(3)
21.14%
6.62%
(17.55)%
22.66%
6.65%
Ratios
to
average
net
assets:
(2)
Gross
expenses
before
waivers/payments
by
Price
Associates
0.92%
0.86%
0.86%
0.83%
0.84%
Net
expenses
after
waivers/
payments
by
Price
Associates
0.78%
0.72%
0.73%
0.72%
0.73%
Net
investment
income
1.86%
1.89%
1.37%
1.01%
1.12%
Portfolio
turnover
rate
38.8%
50.5%
72.1%
42.2%
56.8%
Net
assets,
end
of
period
(in
thousands)
$516,949
$492,231
$708,365
$1,037,535
$731,173
0%
0%
0%
0%
0%
(1)
Per
share
amounts
calculated
using
average
shares
outstanding
method.
(2)
Includes
the
impact
of
expense-related
arrangements
with
Price
Associates.
(3)
Total
return
reflects
the
rate
that
an
investor
would
have
earned
on
an
investment
in
the
fund
during
each
period,
assuming
reinvestment
of
all
distributions,
and
payment
of
no
redemption
or
account
fees,
if
applicable.
T.
ROWE
PRICE
Global
Allocation
Fund
For
a
share
outstanding
throughout
each
period
The
accompanying
notes
are
an
integral
part
of
these
financial
statements.
Advisor
Class
..
Year
..
..
Ended
.
10/31/24
10/31/23
10/31/22
10/31/21
10/31/20
NET
ASSET
VALUE
Beginning
of
period
$
13.16
$
12.71
$
16.59
$
13.67
$
13.13
Investment
activities
Net
investment
income
(1)(2)
0.24
0.21
0.15
0.11
0.11
Net
realized
and
unrealized
gain/loss
2.47
0.59
(2.93)
2.93
0.71
Total
from
investment
activities
2.71
0.80
(2.78)
3.04
0.82
Distributions
Net
investment
income
(0.33)
(0.16)
(0.08)
(0.10)
(0.17)
Net
realized
gain
—
(0.19)
(1.02)
(0.02)
(0.11)
Total
distributions
(0.33)
(0.35)
(1.10)
(0.12)
(0.28)
NET
ASSET
VALUE
End
of
period
$
15.54
$
13.16
$
12.71
$
16.59
$
13.67
Ratios/Supplemental
Data
Total
return
(2)(3)
20.85%
6.38%
(17.85)%
22.33%
6.31%
Ratios
to
average
net
assets:
(2)
Gross
expenses
before
waivers/payments
by
Price
Associates
1.25%
1.19%
1.18%
1.17%
1.17%
Net
expenses
after
waivers/
payments
by
Price
Associates
1.01%
1.01%
1.02%
1.04%
1.05%
Net
investment
income
1.65%
1.59%
1.08%
0.70%
0.81%
Portfolio
turnover
rate
38.8%
50.5%
72.1%
42.2%
56.8%
Net
assets,
end
of
period
(in
thousands)
$3,385
$3,446
$4,457
$6,662
$10,435
0%
0%
0%
0%
0%
(1)
Per
share
amounts
calculated
using
average
shares
outstanding
method.
(2)
Includes
the
impact
of
expense-related
arrangements
with
Price
Associates.
(3)
Total
return
reflects
the
rate
that
an
investor
would
have
earned
on
an
investment
in
the
fund
during
each
period,
assuming
reinvestment
of
all
distributions,
and
payment
of
no
redemption
or
account
fees,
if
applicable.
T.
ROWE
PRICE
Global
Allocation
Fund
For
a
share
outstanding
throughout
each
period
The
accompanying
notes
are
an
integral
part
of
these
financial
statements.
I
Class
..
Year
..
..
Ended
.
10/31/24
10/31/23
10/31/22
10/31/21
10/31/20
NET
ASSET
VALUE
Beginning
of
period
$
13.29
$
12.88
$
16.82
$
13.84
$
13.25
Investment
activities
Net
investment
income
(1)(2)
0.31
0.27
0.22
0.18
0.16
Net
realized
and
unrealized
gain/loss
2.49
0.58
(2.97)
2.97
0.72
Total
from
investment
activities
2.80
0.85
(2.75)
3.15
0.88
Distributions
Net
investment
income
(0.41)
(0.25)
(0.17)
(0.15)
(0.18)
Net
realized
gain
—
(0.19)
(1.02)
(0.02)
(0.11)
Total
distributions
(0.41)
(0.44)
(1.19)
(0.17)
(0.29)
NET
ASSET
VALUE
End
of
period
$
15.68
$
13.29
$
12.88
$
16.82
$
13.84
Ratios/Supplemental
Data
Total
return
(2)(3)
21.39%
6.75%
(17.49)%
22.89%
6.71%
Ratios
to
average
net
assets:
(2)
Gross
expenses
before
waivers/payments
by
Price
Associates
0.78%
0.76%
0.75%
0.73%
0.75%
Net
expenses
after
waivers/
payments
by
Price
Associates
0.60%
0.59%
0.60%
0.62%
0.63%
Net
investment
income
2.06%
1.99%
1.59%
1.11%
1.22%
Portfolio
turnover
rate
38.8%
50.5%
72.1%
42.2%
56.8%
Net
assets,
end
of
period
(in
thousands)
$291,741
$276,877
$241,804
$191,932
$104,623
0%
0%
0%
0%
0%
(1)
Per
share
amounts
calculated
using
average
shares
outstanding
method.
(2)
Includes
the
impact
of
expense-related
arrangements
with
Price
Associates.
(3)
Total
return
reflects
the
rate
that
an
investor
would
have
earned
on
an
investment
in
the
fund
during
each
period,
assuming
reinvestment
of
all
distributions,
and
payment
of
no
redemption
or
account
fees,
if
applicable.
T.
ROWE
PRICE
Global
Allocation
Fund
October
31,
2024
Shares/Par
$
Value
(
Cost
and
value
in
$000s)
‡
ARGENTINA 0.2%
Common
Stocks 0.2%
Arcos
Dorados
Holdings,
Class
A
(USD) (1)
32,727
288
Banco
BBVA
Argentina,
ADR
(USD) (1)
2,348
33
Globant
(USD) (2)
1,149
241
MercadoLibre
(USD) (2)
654
1,332
Tenaris,
ADR
(USD)
1,455
48
Total
Argentina
(Cost
$789)
1,942
AUSTRALIA 0.5%
Common
Stocks 0.5%
ALS
6,155
57
ANZ
Group
Holdings
8,214
167
BHP
Group
44,618
1,240
BHP
Group
(GBP) (1)
11,561
321
Capricorn
Metals (2)
25,549
103
Challenger
14,030
56
Champion
Iron
11,222
43
Champion
Iron
(CAD)
6,751
26
Cochlear
358
66
De
Grey
Mining (2)
34,564
34
Downer
EDI
25,738
94
Emerald
Resources (2)
35,228
97
Frontier
Digital
Ventures (2)
215,761
64
Goodman
Group
9,185
219
IGO
18,089
62
Macquarie
Group
1,340
203
Mineral
Resources
540
14
Northern
Star
Resources
17,314
201
oOh!media
66,161
54
Pilbara
Minerals (2)
95,265
176
Predictive
Discovery (2)
184,797
34
Reliance
Worldwide
19,880
68
Scentre
Group
148,672
341
South32
39,570
95
Worley
22,678
208
4,043
Corporate
Bonds 0.0%
Transurban
Finance,
2.45%,
3/16/31
(USD) (3)
140,000
119
T.
ROWE
PRICE
Global
Allocation
Fund
Shares/Par
$
Value
(Cost
and
value
in
$000s)
Transurban
Finance,
4.125%,
2/2/26
(USD) (3)
15,000
15
Woodside
Finance,
3.70%,
3/15/28
(USD) (3)
67,000
64
Woodside
Finance,
4.50%,
3/4/29
(USD) (3)
105,000
102
300
Total
Australia
(Cost
$3,361)
4,343
AUSTRIA 0.2%
Common
Stocks 0.2%
BAWAG
Group
14,435
1,119
Erste
Group
Bank
11,935
675
OMV
2,043
85
Schoeller-Bleckmann
Oilfield
Equipment
1,885
56
Total
Austria
(Cost
$1,332)
1,935
BAHRAIN 0.0%
Common
Stocks 0.0%
Aluminium
Bahrain
40,258
142
Total
Bahrain
(Cost
$120)
142
BANGLADESH 0.0%
Common
Stocks 0.0%
BRAC
Bank
322,228
138
Square
Pharmaceuticals
32,949
60
Total
Bangladesh
(Cost
$190)
198
BELGIUM 0.0%
Common
Stocks 0.0%
Shurgard
Self
Storage
2,092
90
Umicore
4,604
55
Warehouses
De
Pauw
3,110
74
Total
Belgium
(Cost
$291)
219
BRAZIL 0.4%
Common
Stocks 0.4%
B3
181,454
334
CI&T,
Class
A
(USD) (2)
11,453
75
Hypera
29,735
114
T.
ROWE
PRICE
Global
Allocation
Fund
Shares/Par
$
Value
(Cost
and
value
in
$000s)
Intelbras
Industria
de
Telecomunicacao
Eletronica
Brasileira
16,073
53
Itau
Unibanco
Holding,
ADR
(USD)
30,685
186
Klabin
101,410
368
Localiza
Rent
a
Car
46,313
337
Multiplan
Empreendimentos
Imobiliarios
25,304
112
NU
Holdings,
Class
A
(USD) (2)
19,373
292
Petroleo
Brasileiro,
ADR
(USD)
17,700
238
Raia
Drogasil
111,461
472
TOTVS
11,500
59
Vale,
ADR
(USD)
43,143
462
WEG
41,649
392
Total
Brazil
(Cost
$3,745)
3,494
CANADA 1.6%
Closed-End
Mutual
Funds 0.0%
Sprott
Physical
Uranium
Trust (1)(2)
1,400
26
26
Common
Stocks 1.4%
Agnico
Eagle
Mines
3,584
309
Agnico
Eagle
Mines
(USD)
723
62
Alamos
Gold,
Class
A (1)
9,743
197
Alamos
Gold,
Class
A
(USD)
4,625
93
Aritzia (2)
4,822
155
Artemis
Gold (2)
4,239
43
AtkinsRealis
Group (1)
4,315
208
ATS (2)
2,571
77
Aya
Gold
&
Silver (1)(2)
17,454
224
Barrick
Gold
(USD)
8,848
171
Boardwalk
Real
Estate
Investment
Trust
1,064
55
Brookfield
4,262
226
BRP
2,280
112
Cameco
(USD)
3,487
182
Canadian
Apartment
Properties
REIT (1)
1,390
46
Canadian
National
Railway
(USD)
2,586
279
Canadian
Natural
Resources
6,518
222
Capstone
Copper (2)
3,403
24
Cenovus
Energy
8,941
144
Colliers
International
Group
(USD)
593
91
Constellation
Software
73
220
Constellation
Software,
Warrants,
3/31/40 (2)(4)
79
—
Definity
Financial
11,149
430
T.
ROWE
PRICE
Global
Allocation
Fund
Shares/Par
$
Value
(Cost
and
value
in
$000s)
dentalcorp
Holdings (2)
9,562
65
Descartes
Systems
Group (2)
2,170
225
Descartes
Systems
Group
(USD) (2)
887
92
Element
Fleet
Management
26,199
536
Enbridge
(USD)
6,030
244
ERO
Copper (1)(2)
30,760
565
Exchange
Income (1)
3,196
126
First
Quantum
Minerals (2)
5,161
67
Foran
Mining (2)
14,996
47
Franco-Nevada
3,332
442
Franco-Nevada
(USD)
4,039
536
G
Mining
Ventures (2)
13,097
112
Hudbay
Minerals
(USD)
2,743
25
Ivanhoe
Mines,
Class
A (2)
11,447
151
Jamieson
Wellness (1)
4,227
101
Kinaxis (2)
671
75
Kinross
Gold
(USD)
6,288
63
Lundin
Gold
4,667
113
Magna
International
(USD) (1)
4,668
184
Maple
Leaf
Foods
4,505
68
National
Bank
of
Canada
5,322
508
New
Gold (2)
7,893
22
NGEx
Minerals (2)
6,145
52
NuVista
Energy (2)
10,751
86
Osisko
Gold
Royalties
10,812
218
Parex
Resources
2,692
25
Richelieu
Hardware
2,930
77
Shopify,
Class
A (2)
2,061
161
Shopify,
Class
A
(USD) (2)
5,179
405
Skeena
Resources (2)
9,206
89
Snowline
Gold (2)
8,905
37
South
Bow (2)
1,998
50
Spin
Master
3,723
79
StorageVault
Canada
42,860
125
Sun
Life
Financial
5,451
302
Suncor
Energy
4,539
171
Suncor
Energy
(USD)
5,982
226
Teck
Resources,
Class
B
(USD)
5,910
275
TMX
Group
3,710
116
Wesdome
Gold
Mines (2)
17,975
158
West
Fraser
Timber
1,027
93
Wheaton
Precious
Metals
6,091
402
T.
ROWE
PRICE
Global
Allocation
Fund
Shares/Par
$
Value
(Cost
and
value
in
$000s)
Wheaton
Precious
Metals
(USD)
5,474
361
11,445
Corporate
Bonds 0.1%
Canadian
Natural
Resources,
2.95%,
7/15/30
(USD)
110,000
98
Canadian
Pacific
Railway,
1.75%,
12/2/26
(USD)
130,000
122
Canadian
Pacific
Railway,
2.875%,
11/15/29
(USD)
235,000
215
Canadian
Pacific
Railway,
3.50%,
5/1/50
(USD)
155,000
115
Canadian
Pacific
Railway,
4.30%,
5/15/43
(USD)
25,000
22
Enbridge,
5.625%,
4/5/34
(USD)
65,000
66
Enbridge,
6.20%,
11/15/30
(USD)
45,000
48
Royal
Bank
of
Canada,
2.30%,
11/3/31
(USD)
250,000
214
South
Bow
USA
Infrastructure
Holdings,
5.026%,
10/1/29
(USD) (3)
35,000
34
Thomson
Reuters,
3.35%,
5/15/26
(USD)
10,000
10
Toronto-Dominion
Bank,
1.15%,
6/12/25
(USD)
145,000
142
Toronto-Dominion
Bank,
4.994%,
4/5/29
(USD)
90,000
91
1,177
Government
Bonds 0.1%
Province
of
Alberta,
3.30%,
3/15/28
(USD) (1)
135,000
131
Province
of
British
Columbia,
4.20%,
7/6/33
(USD)
320,000
311
Province
of
New
Brunswick,
3.625%,
2/24/28
(USD)
250,000
244
686
Total
Canada
(Cost
$10,333)
13,334
CAYMAN
ISLANDS 0.1%
Convertible
Preferred
Stocks 0.1%
ByteDance,
Series
E,
Acquisition
Date:
7/8/19,
Cost $89
(USD) (2)(4)(5)
1,810
497
Total
Cayman
Islands
(Cost
$89)
497
CHILE 0.1%
Common
Stocks 0.0%
Antofagasta
(GBP)
13,057
292
292
Corporate
Bonds 0.1%
Celulosa
Arauco
y
Constitucion,
5.50%,
11/2/47
(USD)
250,000
230
T.
ROWE
PRICE
Global
Allocation
Fund
Shares/Par
$
Value
(Cost
and
value
in
$000s)
Corp
Nacional
del
Cobre
de
Chile,
3.00%,
9/30/29
(USD) (3)
220,000
198
428
Total
Chile
(Cost
$629)
720
CHINA 1.7%
Common
Stocks 1.2%
58.com
(USD) (2)(4)
5,864
—
Alibaba
Group
Holding,
ADR
(USD)
12,372
1,212
Atour
Lifestyle
Holdings,
ADR
(USD)
1,833
48
Baidu,
ADR
(USD) (2)
644
59
BeiGene,
ADR
(USD) (2)
720
146
Bilibili,
Class
Z
(HKD) (2)
3,360
74
BOC
Aviation
(HKD)
9,400
73
Bosideng
International
Holdings
(HKD)
190,000
107
China
Resources
Gas
Group
(HKD)
33,000
127
China
Resources
Mixc
Lifestyle
Services
(HKD)
76,000
314
CMOC
Group,
Class
H
(HKD)
63,000
52
COSCO
SHIPPING
Energy
Transportation,
Class
H
(HKD)
40,000
38
Fosun
International
(HKD)
49,500
28
H
World
Group
(HKD)
37,600
138
Haier
Smart
Home,
Class
H
(HKD)
24,200
88
Kanzhun,
ADR
(USD)
14,457
210
KE
Holdings,
ADR
(USD)
24,585
539
Kingboard
Laminates
Holdings
(HKD)
75,000
65
Meituan,
Class
B
(HKD) (2)
25,000
591
Midea
Group
(HKD) (2)
25,800
242
NetEase,
ADR
(USD) (1)
2,712
218
New
Oriental
Education
&
Technology
Group,
ADR
(USD)
6,122
383
PDD
Holdings,
ADR
(USD) (2)
5,614
677
Shandong
Weigao
Group
Medical
Polymer,
Class
H
(HKD)
113,200
71
Tencent
Holdings
(HKD)
43,854
2,287
Tsingtao
Brewery,
Class
H
(HKD)
14,000
90
Yangzijiang
Shipbuilding
Holdings
(SGD)
39,500
77
Yum
China
Holdings
(USD)
26,947
1,189
Zhongsheng
Group
Holdings
(HKD)
115,500
178
Zijin
Mining
Group,
Class
H
(HKD)
62,000
132
ZTO
Express
Cayman,
ADR
(USD)
17,889
413
9,866
Common
Stocks
-
China
A
Shares 0.5%
Beijing
Huafeng
Test
&
Control
Technology,
A
Shares
(CNH)
3,009
51
China
Oilfield
Services,
A
Shares
(CNH)
52,700
112
T.
ROWE
PRICE
Global
Allocation
Fund
Shares/Par
$
Value
(Cost
and
value
in
$000s)
CNOOC
Energy
Technology
&
Services,
A
Shares
(CNH)
155,600
96
CRRC,
A
Shares
(CNH)
393,500
460
Eastroc
Beverage
Group,
A
Shares
(CNH)
7,980
238
Fuyao
Glass
Industry
Group,
A
Shares
(CNH)
32,962
264
Hangcha
Group,
A
Shares
(CNH)
50,980
127
Hongfa
Technology,
A
Shares
(CNH)
25,160
107
Huali
Industrial
Group,
A
Shares
(CNH)
6,400
60
Humanwell
Healthcare
Group,
A
Shares
(CNH)
19,600
59
Jiangsu
Hengli
Hydraulic,
A
Shares
(CNH)
43,300
315
Kweichow
Moutai,
A
Shares
(CNH)
1,360
292
Loncin
Motor,
A
Shares
(CNH)
43,600
50
NARI
Technology,
A
Shares
(CNH)
28,421
104
Shandong
Pharmaceutical
Glass,
A
Shares
(CNH)
34,600
122
Shenzhen
Inovance
Technology,
A
Shares
(CNH)
13,400
105
Shenzhen
Jufei
Optoelectronics,
A
Shares
(CNH)
73,400
80
Shenzhen
Mindray
Bio-Medical
Electronics,
A
Shares
(CNH)
5,600
210
Wuliangye
Yibin,
A
Shares
(CNH)
5,600
116
WUS
Printed
Circuit
Kunshan,
A
Shares
(CNH)
9,900
56
Xiamen
Faratronic,
A
Shares
(CNH)
9,600
153
Xuji
Electric,
A
Shares
(CNH)
26,200
112
Yankershop
Food,
A
Shares
(CNH)
13,600
96
Yantai
Jereh
Oilfield
Services
Group,
A
Shares
(CNH)
27,100
128
Yifeng
Pharmacy
Chain,
A
Shares
(CNH)
140,256
468
YTO
Express
Group,
A
Shares
(CNH)
24,100
56
Yunnan
Aluminium,
A
Shares
(CNH)
53,100
106
4,143
Total
China
(Cost
$11,940)
14,009
COLOMBIA 0.0%
Common
Stocks 0.0%
Bancolombia,
ADR
(USD)
2,390
76
Geopark
(USD)
3,382
27
Total
Colombia
(Cost
$103)
103
DENMARK 0.4%
Common
Stocks 0.3%
Coloplast,
Class
B (1)
1,753
220
Genmab (2)
867
194
Novo
Nordisk,
ADR
(USD)
2,895
324
Novo
Nordisk,
Class
B
15,676
1,758
Royal
Unibrew
966
73
T.
ROWE
PRICE
Global
Allocation
Fund
Shares/Par
$
Value
(Cost
and
value
in
$000s)
Zealand
Pharma (1)(2)
1,243
143
2,712
Corporate
Bonds 0.1%
Danske
Bank,
VR,
3.244%,
12/20/25
(USD) (3)(6)
335,000
333
333
Total
Denmark
(Cost
$2,364)
3,045
EGYPT 0.0%
Common
Stocks 0.0%
Integrated
Diagnostics
Holdings
(USD) (2)
33,821
17
Total
Egypt
(Cost
$24)
17
FINLAND 0.2%
Common
Stocks 0.2%
Elisa
5,610
267
Mandatum
22,124
102
Sampo,
Class
A
18,343
814
Stora
Enso,
Class
R
10,239
114
Valmet (1)
11,664
299
Total
Finland
(Cost
$1,373)
1,596
FRANCE 1.7%
Common
Stocks 1.6%
Air
Liquide
2,563
460
Airbus
5,322
812
Alstom (2)
4,140
91
ArcelorMittal
6,394
158
AXA
24,128
906
Beneteau
6,747
74
BNP
Paribas
5,810
397
Capgemini
672
117
Cie
de
Saint-Gobain
1,623
147
Coface
4,748
77
Dassault
Aviation
1,125
227
Edenred
15,087
488
Engie
28,494
478
Eramet
1,497
89
Esker
489
139
EssilorLuxottica
2,355
552
T.
ROWE
PRICE
Global
Allocation
Fund
Shares/Par
$
Value
(Cost
and
value
in
$000s)
Eurofins
Scientific
2,518
124
Euronext
3,464
382
Forvia
3,171
30
Gecina
648
69
Kering
399
100
L'Oreal
688
258
Lectra
3,093
86
Legrand
2,722
307
LVMH
Moet
Hennessy
Louis
Vuitton
1,076
716
Nexity (2)
8,149
127
Planisware (2)
6,468
158
Robertet
4
4
Safran
2,526
572
Sanofi
8,509
899
Sartorius
Stedim
Biotech
2,282
458
Schneider
Electric
319
83
SPIE
16,221
587
Teleperformance
795
84
Thales
831
134
TotalEnergies
28,765
1,805
Ubisoft
Entertainment (2)
3,655
55
Verallia
8,316
240
Vinci
796
89
Virbac
446
170
12,749
Corporate
Bonds 0.1%
BNP
Paribas,
VR,
2.871%,
4/19/32
(USD) (3)(6)
350,000
303
BPCE,
4.50%,
3/15/25
(USD) (3)
400,000
399
TotalEnergies
Capital
International,
2.434%,
1/10/25
(USD)
275,000
273
975
Total
France
(Cost
$10,428)
13,724
GERMANY 1.6%
Common
Stocks 1.5%
Adesso (1)
516
38
Allianz
2,491
784
BASF
5,860
285
Bayer
6,732
181
Covestro (2)
4,993
316
Daimler
Truck
Holding
10,398
430
Deutsche
Post
2,581
104
T.
ROWE
PRICE
Global
Allocation
Fund
Shares/Par
$
Value
(Cost
and
value
in
$000s)
Deutsche
Telekom
34,866
1,054
Douglas (2)
2,502
51
Evotec (1)(2)
5,184
40
flatexDEGIRO
14,515
213
Fresenius (2)
4,357
159
Heidelberg
Materials
912
101
Hypoport (2)
401
94
Infineon
Technologies
9,630
305
KION
Group
4,007
156
Knaus
Tabbert (1)
1,438
35
LEG
Immobilien
1,232
116
Mercedes-Benz
Group
1,469
89
Merck
2,311
382
Muenchener
Rueckversicherungs-Gesellschaft
1,241
635
Nagarro (1)(2)
746
73
Puma
6,242
285
Redcare
Pharmacy (1)(2)
2,552
391
SAP
7,399
1,728
Schott
Pharma
5,161
167
Scout24
4,308
372
Siemens
10,569
2,056
Siemens
Healthineers
14,901
778
Siltronic (1)
3,174
180
Springer
Nature (2)
5,311
134
Symrise
2,081
250
Zalando (2)
2,982
90
12,072
Corporate
Bonds 0.0%
Daimler
Trucks
Finance
North
America,
3.65%,
4/7/27
(USD) (3)
155,000
151
Mercedes-Benz
Finance
North
America,
4.80%,
3/30/26
(USD) (3)
155,000
155
306
Preferred
Stocks 0.1%
Dr.
Ing.
h.c.
F.
Porsche
2,070
146
Sartorius
806
209
Volkswagen
1,139
110
465
Total
Germany
(Cost
$9,756)
12,843
T.
ROWE
PRICE
Global
Allocation
Fund
Shares/Par
$
Value
(Cost
and
value
in
$000s)
HONG
KONG 0.2%
Common
Stocks 0.2%
AIA
Group
72,600
573
Budweiser
Brewing
APAC
96,900
101
CK
Hutchison
Holdings
13,500
71
Galaxy
Entertainment
Group
17,000
76
Hongkong
Land
Holdings
(USD)
14,300
61
Impro
Precision
Industries
118,000
35
Jardine
Matheson
Holdings
(USD)
9,700
373
Kerry
Properties
14,500
31
Samsonite
International
30,600
72
Sun
Hung
Kai
Properties
10,583
114
Swire
Properties
20,600
42
Wharf
Real
Estate
Investment
10,000
30
Yue
Yuen
Industrial
Holdings
31,000
65
Total
Hong
Kong
(Cost
$1,548)
1,644
HUNGARY 0.1%
Common
Stocks 0.1%
OTP
Bank
8,223
409
Total
Hungary
(Cost
$271)
409
ICELAND 0.0%
Common
Stocks 0.0%
Alvotech (2)
4,317
57
Arion
Banki
95,385
109
Total
Iceland
(Cost
$164)
166
INDIA 1.0%
Common
Stocks 1.0%
Asian
Paints
9,594
334
Astral
5,357
113
Axis
Bank
20,922
287
Blue
Star
6,801
151
Computer
Age
Management
Services
461
24
Craftsman
Automation
272
16
CreditAccess
Grameen
5,623
65
Dixon
Technologies
India
791
132
T.
ROWE
PRICE
Global
Allocation
Fund
Shares/Par
$
Value
(Cost
and
value
in
$000s)
HDFC
Asset
Management
6,100
311
HDFC
Bank
13,244
272
HDFC
Life
Insurance
59,483
508
Hindalco
Industries
4,916
40
Hindustan
Unilever
8,720
262
ICICI
Bank
46,179
708
ICICI
Bank,
ADR
(USD)
2,991
91
Indraprastha
Gas
18,659
93
Info
Edge
India
1,280
113
Infosys
33,050
690
InterGlobe
Aviation (2)
621
30
JSW
Steel
3,513
40
Kotak
Mahindra
Bank
44,922
922
Larsen
&
Toubro
12,261
527
Metro
Brands
4,171
59
Nexus
Select
Trust
25,529
44
NTPC
48,554
235
Page
Industries
181
93
Polycab
India
1,871
144
Power
Grid
Corp.
of
India
60,734
231
Reliance
Industries
38,548
610
Sapphire
Foods
India (2)
16,640
63
Tata
Consultancy
Services
4,615
217
Tata
Motors
3,017
30
Tata
Steel
39,564
70
TeamLease
Services (2)
1,112
37
Titan
6,474
251
Torrent
Pharmaceuticals
1,768
67
Varun
Beverages
7,082
50
Vedant
Fashions
4,288
71
Voltas
12,029
236
Zomato (2)
51,016
146
Total
India
(Cost
$6,269)
8,383
INDONESIA 0.2%
Common
Stocks 0.2%
Bank
Central
Asia
1,375,300
897
Bank
Mandiri
Persero
812,300
345
Sarana
Menara
Nusantara
469,100
24
Sumber
Alfaria
Trijaya
1,179,800
249
Telkom
Indonesia
Persero
512,800
91
Total
Indonesia
(Cost
$1,072)
1,606
T.
ROWE
PRICE
Global
Allocation
Fund
Shares/Par
$
Value
(Cost
and
value
in
$000s)
IRELAND 0.4%
Common
Stocks 0.4%
Cairn
Homes
(GBP)
78,563
182
DCC
(GBP)
2,264
143
ICON
(USD) (2)
2,482
551
Kenmare
Resources
(GBP)
4,249
20
TE
Connectivity
(USD)
13,571
2,001
2,897
Corporate
Bonds 0.0%
AerCap
Ireland
Capital,
2.45%,
10/29/26
(USD)
150,000
143
AerCap
Ireland
Capital,
5.75%,
6/6/28
(USD)
265,000
271
414
Total
Ireland
(Cost
$3,168)
3,311
ITALY 0.5%
Common
Stocks 0.5%
Amplifon
9,769
273
Ariston
Holding
11,660
49
Banca
Mediolanum
7,343
91
BFF
Bank
8,729
85
Carel
Industries
6,359
131
De'
Longhi
5,102
160
DiaSorin
965
105
Enel
27,596
209
Ermenegildo
Zegna
(USD) (1)
15,715
119
Ferrari
(USD)
362
172
FinecoBank
Banca
Fineco
9,424
150
GVS (2)
10,547
71
Interpump
Group
1,338
60
Intesa
Sanpaolo
142,616
610
Leonardo
7,211
172
Moncler
3,077
171
PRADA
(HKD)
28,300
217
Prysmian
5,720
404
Stellantis
5,865
80
Technoprobe (2)
10,122
69
UniCredit
12,367
547
3,945
T.
ROWE
PRICE
Global
Allocation
Fund
Shares/Par
$
Value
(Cost
and
value
in
$000s)
Corporate
Bonds 0.0%
Enel
Finance
International,
2.125%,
7/12/28
(USD) (3)
200,000
181
181
Total
Italy
(Cost
$2,704)
4,126
JAPAN 3.6%
Common
Stocks 3.5%
Aiful
161,600
340
ARE
Holdings
500
6
Asahi
Group
Holdings
10,500
126
Asahi
Kasei
13,000
90
Astellas
Pharma
30,300
355
Calbee
4,500
101
Central
Japan
Railway
5,600
116
Chugai
Pharmaceutical
8,400
400
Comforia
Residential
REIT
23
45
CyberAgent
15,200
99
Daicel
9,900
87
Daiei
Kankyo
11,100
229
Daiichi
Sankyo
3,100
101
Daiwabo
Holdings
11,500
207
Denso
14,800
210
Dexerials
7,800
119
Disco
500
142
eGuarantee
2,800
28
Eiken
Chemical
8,700
141
Electric
Power
Development
7,800
130
Fujitsu
8,000
154
Fukuoka
Financial
Group
2,500
57
Fuso
Chemical
3,400
83
Hamamatsu
Photonics
17,800
235
Hanwa
10,300
341
Hikari
Tsushin
1,600
323
Hitachi
32,300
812
Honda
Motor
7,500
75
Horiba
4,000
246
Idec
8,500
137
IHI
5,600
298
Inpex
24,400
322
Invincible
Investment
168
68
Isetan
Mitsukoshi
Holdings
12,400
185
T.
ROWE
PRICE
Global
Allocation
Fund
Shares/Par
$
Value
(Cost
and
value
in
$000s)
Isuzu
Motors
9,000
116
ITOCHU
11,800
584
Japan
Metropolitan
Fund
Invest
47
29
Kao
2,500
110
Keyence
700
316
Kirin
Holdings
5,100
75
Komatsu
6,100
158
Konica
Minolta
63,100
263
Kyoritsu
Maintenance
2,700
43
Kyushu
Railway
1,900
50
LY
33,200
91
MatsukiyoCocokara
5,200
71
METAWATER
11,400
132
MINEBEA
MITSUMI
2,500
44
Mitsubishi
8,000
146
Mitsubishi
Electric
33,800
595
Mitsubishi
Estate
33,900
501
Mitsubishi
HC
Capital
12,500
84
Mitsubishi
Logistics
4,500
30
Mitsubishi
UFJ
Financial
Group
104,100
1,097
Mitsui
Chemicals (1)
2,600
59
Mitsui
Fudosan
73,100
624
Miura
16,900
395
Modec
7,700
168
Murata
Manufacturing
11,800
206
Nakanishi
7,800
133
Nextage (1)
27,000
259
Nifco
9,900
230
Nintendo
6,500
343
Nippon
Sanso
Holdings
2,500
87
Nippon
Seiki
10,300
81
Nippon
Soda
17,200
286
Nippon
Steel
17,200
344
Nippon
Telegraph
&
Telephone
490,600
473
Nissan
Chemical
2,600
88
Niterra
11,500
326
Nomura
Real
Estate
Holdings
4,600
113
Nomura
Research
Institute
5,100
153
Obara
Group
6,200
172
Olympus
19,500
343
Omron
2,300
91
Open
House
Group (1)
4,900
181
ORIX
19,800
417
T.
ROWE
PRICE
Global
Allocation
Fund
Shares/Par
$
Value
(Cost
and
value
in
$000s)
Panasonic
Holdings
19,200
158
Persol
Holdings
202,000
339
Recruit
Holdings
14,300
873
Renesas
Electronics
45,500
610
Rengo
27,000
164
Resona
Holdings
50,300
332
Resorttrust
10,900
198
Round
One
20,600
130
Sakata
INX
15,800
159
Sankyu
3,400
118
Sega
Sammy
Holdings
14,300
269
Seven
&
i
Holdings
69,600
1,002
Shimadzu
1,300
38
Shimizu
27,900
185
Shin-Etsu
Chemical
7,500
275
Shionogi
4,500
64
SMC
200
85
Sompo
Holdings
6,300
135
Sony
Group
62,400
1,098
Stanley
Electric
6,800
116
SUMCO (1)
9,700
93
Sumitomo
15,200
321
Sumitomo
Mitsui
Trust
Group
4,700
103
Sumitomo
Seika
Chemicals
2,200
73
Suntory
Beverage
&
Food
3,500
118
Suzuki
Motor
14,400
143
Taiheiyo
Cement
20,400
444
Takashimaya
24,600
195
Takeda
Pharmaceutical
15,100
421
Takeuchi
Manufacturing
3,900
122
TechnoPro
Holdings
6,800
121
THK
4,000
66
TIS
2,600
65
Tokai
Carbon (1)
33,300
188
Tokio
Marine
Holdings
22,800
821
Tokyo
Century
6,900
70
Tokyo
Electron
1,500
221
Tokyo
Kiraboshi
Financial
Group
3,300
89
Tokyo
Seimitsu
2,700
145
Tokyo
Tatemono
7,300
119
Toyo
Tire
23,500
333
Toyota
Industries
1,900
132
Toyota
Motor
49,100
846
T.
ROWE
PRICE
Global
Allocation
Fund
Shares/Par
$
Value
(Cost
and
value
in
$000s)
Toyota
Tsusho
7,300
124
TRYT (1)
41,400
101
Welcia
Holdings
2,700
34
Yamaha
23,500
190
Yellow
Hat
3,900
64
28,625
Corporate
Bonds 0.1%
Mitsubishi
UFJ
Financial
Group,
VR,
1.538%,
7/20/27
(USD) (6)
300,000
284
284
Total
Japan
(Cost
$22,868)
28,909
KAZAKHSTAN 0.1%
Common
Stocks 0.1%
Halyk
Savings
Bank
of
Kazakhstan,
GDR
(USD)
7,947
147
Kaspi.KZ,
ADR
(USD)
2,719
300
NAC
Kazatomprom,
GDR
(USD)
6,345
248
Total
Kazakhstan
(Cost
$388)
695
KENYA 0.0%
Common
Stocks 0.0%
Equity
Group
Holdings
166,100
61
Safaricom
47,000
6
Total
Kenya
(Cost
$56)
67
LITHUANIA 0.0%
Common
Stocks 0.0%
Baltic
Classifieds
Group
(GBP)
36,256
148
Total
Lithuania
(Cost
$72)
148
LUXEMBOURG 0.1%
Common
Stocks 0.1%
CVC
Capital
Partners (2)
23,599
495
Total
Luxembourg
(Cost
$386)
495
T.
ROWE
PRICE
Global
Allocation
Fund
Shares/Par
$
Value
(Cost
and
value
in
$000s)
MAURITIUS 0.0%
Common
Stocks 0.0%
Alphamin
Resources
(CAD)
123,393
104
Total
Mauritius
(Cost
$84)
104
MEXICO 0.2%
Common
Stocks 0.2%
Corp.
Inmobiliaria
Vesta (1)
29,242
76
Corp.
Inmobiliaria
Vesta,
ADR
(USD)
871
23
Fomento
Economico
Mexicano,
ADR
(USD)
2,100
203
Gruma,
Class
B
15,131
260
Grupo
Aeroportuario
del
Sureste,
ADR
(USD)
282
76
Grupo
Mexico,
Series
B
47,988
252
Industrias
Penoles (2)
3,361
53
Vista
Energy,
ADR
(USD) (2)
443
22
Wal-Mart
de
Mexico
153,093
423
1,388
Government
Bonds 0.0%
United
Mexican
States,
3.50%,
2/12/34
(USD)
305,000
248
248
Total
Mexico
(Cost
$1,582)
1,636
MOROCCO 0.0%
Common
Stocks 0.0%
Attijariwafa
Bank
2,460
135
Hightech
Payment
Systems
2,215
128
Label
Vie
166
73
Total
Morocco
(Cost
$295)
336
NETHERLANDS 1.0%
Common
Stocks 0.9%
Aalberts
2,309
83
Adyen (2)
361
551
AerCap
Holdings
(USD)
1,140
107
Akzo
Nobel
7,866
502
Argenx,
ADR
(USD) (2)
930
545
ASML
Holding
2,908
1,957
T.
ROWE
PRICE
Global
Allocation
Fund
Shares/Par
$
Value
(Cost
and
value
in
$000s)
ASML
Holding
(USD)
489
329
ASR
Nederland
1,530
73
BE
Semiconductor
Industries
767
82
Heineken
9,726
798
IMCD
1,283
204
ING
Groep
75,443
1,280
Koninklijke
Philips (2)
19,306
508
Prosus
11,343
478
Signify
2,518
62
7,559
Corporate
Bonds 0.1%
JDE
Peet's,
1.375%,
1/15/27
(USD) (3)
290,000
268
NXP,
2.65%,
2/15/32
(USD)
375,000
318
Shell
International
Finance,
3.25%,
5/11/25
(USD)
75,000
74
660
Total
Netherlands
(Cost
$5,226)
8,219
NEW
ZEALAND 0.0%
Common
Stocks 0.0%
Fisher
&
Paykel
Healthcare
5,045
108
108
Corporate
Bonds 0.0%
Westpac
New
Zealand,
5.195%,
2/28/29
(USD) (3)
200,000
203
203
Total
New
Zealand
(Cost
$214)
311
NIGERIA 0.0%
Common
Stocks 0.0%
Guaranty
Trust
Holding
1,533,662
49
Total
Nigeria
(Cost
$45)
49
NORWAY 0.3%
Common
Stocks 0.3%
DNB
Bank
35,265
731
Equinor
25,244
600
Frontline
3,370
65
Norsk
Hydro
7,335
45
T.
ROWE
PRICE
Global
Allocation
Fund
Shares/Par
$
Value
(Cost
and
value
in
$000s)
Seadrill
(USD) (2)
1,300
51
Storebrand
37,853
432
Subsea
7
10,621
163
TGS
18,510
168
Total
Norway
(Cost
$1,566)
2,255
OMAN 0.0%
Common
Stocks 0.0%
OQ
Exploration
&
Production
(OMR) (2)
23,549
22
OQ
Gas
Networks
(OMR)
210,212
75
Total
Oman
(Cost
$103)
97
PAKISTAN 0.0%
Common
Stocks 0.0%
National
Bank
of
Pakistan (2)
152,000
33
Systems
27,908
49
Total
Pakistan
(Cost
$63)
82
PANAMA 0.0%
Common
Stocks 0.0%
Banco
Latinoamericano
de
Comercio
Exterior,
Class
E
(USD)
809
26
26
Government
Bonds 0.0%
Republic
of
Panama,
6.70%,
1/26/36
(USD)
25,000
25
25
Total
Panama
(Cost
$45)
51
PERU 0.1%
Common
Stocks 0.1%
Credicorp
(USD)
1,169
215
InRetail
Peru
(USD)
2,256
71
Southern
Copper
(USD)
5,082
557
843
T.
ROWE
PRICE
Global
Allocation
Fund
Shares/Par
$
Value
(Cost
and
value
in
$000s)
Government
Bonds 0.0%
Republic
of
Peru,
5.375%,
2/8/35
(USD)
40,000
39
39
Total
Peru
(Cost
$650)
882
PHILIPPINES 0.1%
Common
Stocks 0.1%
Ayala
11,610
137
BDO
Unibank
154,132
404
Jollibee
Foods
54,700
249
SM
Investments
13,890
224
Total
Philippines
(Cost
$874)
1,014
POLAND 0.0%
Government
Bonds 0.0%
Republic
of
Poland,
3.25%,
4/6/26
(USD)
55,000
54
Total
Poland
(Cost
$55)
54
PORTUGAL 0.2%
Common
Stocks 0.2%
Banco
Comercial
Portugues,
Class
R
219,305
111
Galp
Energia
34,226
585
Jeronimo
Martins
55,590
1,078
Total
Portugal
(Cost
$1,437)
1,774
QATAR 0.1%
Common
Stocks 0.1%
Qatar
National
Bank
83,876
399
Total
Qatar
(Cost
$406)
399
ROMANIA 0.1%
Common
Stocks 0.1%
Banca
Transilvania
41,884
259
BRD-Groupe
Societe
Generale
7,848
35
OMV
Petrom
1,052,035
170
Total
Romania
(Cost
$300)
464
T.
ROWE
PRICE
Global
Allocation
Fund
Shares/Par
$
Value
(Cost
and
value
in
$000s)
RUSSIA 0.0%
Common
Stocks 0.0%
Alrosa (4)
80,680
—
Polyus (2)(4)
294
—
Total
Russia
(Cost
$180)
—
SAUDI
ARABIA 0.2%
Common
Stocks 0.2%
Al
Rajhi
Bank
29,488
689
Arabian
Internet
&
Communications
Services
1,175
80
Saudi
Arabian
Mining (2)
6,505
97
Saudi
National
Bank
78,373
689
Total
Saudi
Arabia
(Cost
$1,567)
1,555
SINGAPORE 0.2%
Common
Stocks 0.2%
CapitaLand
Integrated
Commercial
Trust
68,940
105
DBS
Group
Holdings
6,980
202
Digital
Core
REIT
Management
(USD)
42,800
27
Mapletree
Industrial
Trust
35,800
65
Sea,
ADR
(USD) (2)
5,554
522
United
Overseas
Bank
18,100
440
Wilmar
International
70,600
170
Total
Singapore
(Cost
$995)
1,531
SLOVENIA 0.0%
Common
Stocks 0.0%
Nova
Ljubljanska
Banka,
GDR
7,934
212
Total
Slovenia
(Cost
$104)
212
SOUTH
AFRICA 0.2%
Common
Stocks 0.2%
Anglo
American
Platinum
1,258
49
Anglogold
Ashanti
(USD)
1,965
55
Anglogold
Ashanti
3,060
85
Bid
9,341
220
Capitec
Bank
Holdings
990
179
T.
ROWE
PRICE
Global
Allocation
Fund
Shares/Par
$
Value
(Cost
and
value
in
$000s)
Clicks
Group
14,538
311
Gold
Fields
8,460
140
Harmony
Gold
Mining
6,211
67
Impala
Platinum
Holdings (2)
25,906
171
Northam
Platinum
Holdings
12,779
95
Sibanye
Stillwater (2)
38,190
45
1,417
Corporate
Bonds 0.0%
Anglo
American
Capital,
2.625%,
9/10/30
(USD) (3)
200,000
175
175
Total
South
Africa
(Cost
$1,324)
1,592
SOUTH
KOREA 0.4%
Common
Stocks 0.4%
Hyundai
Mobis
1,432
257
Hyundai
Motor
748
115
JYP
Entertainment
1,775
62
KB
Financial
Group
6,437
419
KT
5,326
170
KT,
ADR
(USD) (1)(2)
6,473
102
LG
Chem
435
98
NAVER
1,005
123
POSCO
Holdings
222
54
Samsung
Electronics
34,678
1,473
SK
Hynix
1,722
225
Total
South
Korea
(Cost
$2,501)
3,098
SPAIN 0.3%
Common
Stocks 0.3%
Aedas
Homes
4,209
120
Amadeus
IT
Group
14,233
1,032
Cellnex
Telecom
1,902
70
Fluidra
5,005
135
Iberdrola
38,200
568
Laboratorios
Farmaceuticos
Rovi
2,886
245
Puig
Brands,
Class
B (2)
3,552
82
2,252
T.
ROWE
PRICE
Global
Allocation
Fund
Shares/Par
$
Value
(Cost
and
value
in
$000s)
Corporate
Bonds 0.0%
Banco
Santander,
3.49%,
5/28/30
(USD)
200,000
183
183
Total
Spain
(Cost
$1,538)
2,435
SWEDEN 0.5%
Common
Stocks 0.5%
Assa
Abloy,
Class
B
14,064
441
Autoliv,
SDR
1,952
182
Beijer
Ref (1)
6,626
100
Boliden
2,314
72
Camurus (2)
1,650
93
Elekta,
Class
B
14,716
89
Essity,
Class
B
18,470
522
Hexagon,
Class
B
5,755
54
Millicom
International
Cellular,
SDR (2)
3,465
96
Nordnet (1)
6,833
142
Norva24
Group (2)
27,727
81
Sandvik
25,456
501
Spotify
Technology
(USD) (2)
933
359
Svenska
Cellulosa,
Class
B (1)
20,746
275
Svenska
Handelsbanken,
Class
A
11,741
122
Sweco,
Class
B
4,584
78
Swedbank,
Class
A
5,718
116
Telefonaktiebolaget
LM
Ericsson,
Class
B
45,828
384
Trelleborg,
Class
B
2,199
73
Troax
Group
3,166
64
Total
Sweden
(Cost
$3,167)
3,844
SWITZERLAND 1.0%
Common
Stocks 0.9%
ABB
8,292
461
Alcon
7,467
686
ams-OSRAM (2)
3,138
30
Barry
Callebaut
44
77
Bossard
Holding (1)
228
55
Cie
Financiere
Richemont,
Class
A
6,405
933
DKSH
Holding
2,095
150
Julius
Baer
Group
12,589
768
Montana
Aerospace (2)
10,812
191
T.
ROWE
PRICE
Global
Allocation
Fund
Shares/Par
$
Value
(Cost
and
value
in
$000s)
Nestle
10,572
999
Novartis
6,554
711
Partners
Group
Holding
286
393
Roche
Holding
2,689
833
Sandoz
Group
3,015
137
Sensirion
Holding (1)(2)
161
12
SKAN
Group
517
46
Sonova
Holding
1,174
430
Tecan
Group
254
64
Zurich
Insurance
Group
432
255
7,231
Corporate
Bonds 0.1%
Alcon
Finance,
2.60%,
5/27/30 (3)
235,000
208
UBS
Group,
VR,
1.364%,
1/30/27
(USD) (3)(6)
300,000
286
UBS
Group,
VR,
3.179%,
2/11/43
(USD) (3)(6)
200,000
149
643
Total
Switzerland
(Cost
$5,886)
7,874
TAIWAN 1.1%
Common
Stocks 1.1%
Accton
Technology
15,000
252
Chailease
Holding
70,540
330
Delta
Electronics
18,000
222
Hon
Hai
Precision
Industry
36,000
231
Largan
Precision
1,000
70
MediaTek
10,000
389
Taiwan
Semiconductor
Manufacturing
212,000
6,648
Taiwan
Semiconductor
Manufacturing,
ADR
(USD)
3,009
574
Total
Taiwan
(Cost
$2,690)
8,716
THAILAND 0.1%
Common
Stocks 0.1%
Bangkok
Dusit
Medical
Services,
NVDR
230,100
187
Bumrungrad
Hospital
26,800
216
SCB
X
83,100
279
WHA
228,100
40
Total
Thailand
(Cost
$622)
722
T.
ROWE
PRICE
Global
Allocation
Fund
Shares/Par
$
Value
(Cost
and
value
in
$000s)
UNITED
KINGDOM 2.7%
Common
Stocks 2.4%
Adriatic
Metals,
CDI
(AUD) (2)
84,534
236
Amcor,
CDI
(AUD)
6,458
71
Anglo
American
12,793
397
Ashtead
Group
1,088
81
AstraZeneca
5,730
815
AstraZeneca,
ADR
(USD)
39,603
2,818
Auction
Technology
Group (2)
19,285
112
Barclays
53,637
164
Big
Yellow
Group
11,328
176
BP
135,972
665
BP,
ADR
(USD)
1,994
59
Bridgepoint
Group
77,023
312
British
American
Tobacco
2,282
80
BT
Group (1)
173,159
309
Bunzl
4,847
213
Centamin
26,956
55
Compass
Group
12,764
415
Croda
International
4,423
212
Derwent
London
2,311
65
Diageo
6,743
208
Diploma
1,296
71
Dowlais
Group
50,303
32
Endava,
ADR
(USD) (1)(2)
5,138
122
Experian
1,823
89
Genuit
Group
20,865
126
Genus
5,172
140
Georgia
Capital (2)
5,992
78
Glencore
87,578
459
Great
Portland
Estates
17,244
70
Greggs
5,673
201
GSK,
ADR
(USD) (1)
4,791
176
Helios
Towers (2)
93,001
127
Hiscox
16,171
225
HSBC
Holdings
54,344
499
Immunocore
Holdings,
ADR
(USD) (2)
1,316
41
Imperial
Brands
7,810
236
Informa
32,933
344
Intermediate
Capital
Group
6,606
175
Investec
7,843
60
T.
ROWE
PRICE
Global
Allocation
Fund
Shares/Par
$
Value
(Cost
and
value
in
$000s)
IQE (2)
286,423
44
Johnson
Matthey
5,742
111
Kingfisher
66,480
251
Legal
&
General
Group
16,980
48
Lloyds
Banking
Group
188,268
129
London
Stock
Exchange
Group
4,229
573
Melrose
Industries
39,696
243
National
Grid
72,328
908
Next
2,126
269
Oxford
Nanopore
Technologies (2)
20,183
35
Pearson
6,256
92
Persimmon
14,322
271
Prudential
24,458
204
Renishaw
1,842
75
Rightmove
8,349
64
Rio
Tinto
2,534
164
Rolls-Royce
Holdings (2)
63,211
436
Rotork
49,533
192
Segro
39,054
396
Shell
10,334
345
Shell,
ADR
(USD)
5,288
357
Smith
&
Nephew
9,227
115
Smiths
Group
3,897
77
Spirax
Group
2,218
185
SSE
4,322
98
Standard
Chartered
31,447
365
Syncona (2)
33,100
46
Taylor
Wimpey
41,784
79
TBC
Bank
Group
1,762
62
Unilever
(EUR)
2,082
127
Unilever
28,370
1,731
UNITE
Group
4,864
55
Watches
of
Switzerland
Group (2)
15,079
79
Weir
Group
5,129
138
WPP
37,552
395
Yellow
Cake (2)
3,654
26
YouGov
18,891
113
19,632
Convertible
Preferred
Stocks 0.0%
Yulife
Holdings,
Series
C,
Acquisition
Date:
10/11/22,
Cost $9 (2)(4)(5)
475
7
7
T.
ROWE
PRICE
Global
Allocation
Fund
Shares/Par
$
Value
(Cost
and
value
in
$000s)
Corporate
Bonds 0.3%
Barclays,
VR,
2.279%,
11/24/27
(USD) (6)
335,000
318
BAT
Capital,
4.39%,
8/15/37
(USD)
125,000
109
Coca-Cola
Europacific
Partners,
1.50%,
1/15/27
(USD) (3)
210,000
196
HSBC
Holdings,
VR,
2.206%,
8/17/29
(USD) (6)
200,000
180
HSBC
Holdings,
VR,
7.399%,
11/13/34
(USD) (6)
200,000
224
Nationwide
Building
Society,
1.50%,
10/13/26
(USD) (3)
405,000
381
RELX
Capital,
3.00%,
5/22/30
(USD)
100,000
91
Santander
U.K.
Group
Holdings,
VR,
2.469%,
1/11/28
(USD) (6)
200,000
188
Standard
Chartered,
VR,
1.822%,
11/23/25
(USD) (3)(6)
320,000
319
2,006
Total
United
Kingdom
(Cost
$17,603)
21,645
UNITED
STATES 74.6%
Asset-Backed
Securities 0.5%
AmeriCredit
Automobile
Receivables
Trust,
Series
2021-2,
Class
D,
1.29%,
6/18/27
150,000
144
ARI
Fleet
Lease
Trust,
Series
2023-B,
Class
A2,
6.05%,
7/15/32 (3)
85,413
86
Avis
Budget
Rental
Car
Funding
AESOP,
Series
2020-2A,
Class
A,
2.02%,
2/20/27 (3)
100,000
97
CarMax
Auto
Owner
Trust,
Series
2021-1,
Class
D,
1.28%,
7/15/27
90,000
89
Carvana
Auto
Receivables
Trust,
Series
2021-P4,
Class
C,
2.33%,
2/10/28
155,000
144
CyrusOne
Data
Centers
Issuer
I,
Series
2024-2A,
Class
A2,
4.50%,
5/20/49 (3)
140,000
134
Driven
Brands
Funding,
Series
2020-2A,
Class
A2,
3.237%,
1/20/51 (3)
122,105
113
Driven
Brands
Funding,
Series
2021-1A,
Class
A2,
2.791%,
10/20/51 (3)
123,057
110
Elara
HGV
Timeshare
Issuer,
Series
2023-A,
Class
A,
6.16%,
2/25/38 (3)
69,774
71
Elara
HGV
Timeshare
Issuer,
Series
2023-A,
Class
B,
6.53%,
2/25/38 (3)
69,774
71
Enterprise
Fleet
Financing,
Series
2023-2,
Class
A2,
5.56%,
4/22/30 (3)
168,345
169
Exeter
Automobile
Receivables
Trust,
Series
2021-4A,
Class
C,
1.46%,
10/15/27
30,975
31
Ford
Credit
Auto
Owner
Trust,
Series
2020-2,
Class
C,
1.74%,
4/15/33 (3)
115,000
111
T.
ROWE
PRICE
Global
Allocation
Fund
Shares/Par
$
Value
(Cost
and
value
in
$000s)
Ford
Credit
Auto
Owner
Trust,
Series
2023-1,
Class
A,
4.85%,
8/15/35 (3)
185,000
186
Ford
Credit
Floorplan
Master
Owner
Trust,
Series
2020-2,
Class
B,
1.32%,
9/15/27
205,000
199
GM
Financial
Automobile
Leasing
Trust,
Series
2023-1,
Class
C,
5.76%,
1/20/27
180,000
181
Golub
Capital
Partners,
Series
2019-43A,
Class
A1R,
CLO,
FRN,
3M
TSFR
+
1.34%,
10/20/37 (3)(7)
250,000
250
Hardee's
Funding,
Series
2024-1A,
Class
A2,
7.253%,
3/20/54 (3)
109,450
111
Highbridge
Loan
Management,
Series
5A-2015,
Class
A1R3,
CLO,
FRN,
3M
TSFR
+
1.06%,
5.695%,
10/15/30 (3)
250,000
250
Jamestown
XV,
Series
2020-15A,
Class
A1R,
CLO,
FRN,
3M
TSFR
+
1.37%,
6.026%,
7/15/35 (3)
250,000
250
JPMorgan
Chase
Bank,
Series
2021-2,
Class
C,
0.969%,
12/26/28 (3)
2,729
3
Kubota
Credit
Owner
Trust,
Series
2023-1A,
Class
A4,
5.07%,
2/15/29 (3)
50,000
50
MVW,
Series
2019-2A,
Class
A,
2.22%,
10/20/38 (3)
53,347
52
MVW,
Series
2021-1WA,
Class
B,
1.44%,
1/22/41 (3)
26,686
25
Navient
Private
Education
Refi
Loan
Trust,
Series
2019-CA,
Class
A2,
3.13%,
2/15/68 (3)
93,557
91
Navient
Private
Education
Refi
Loan
Trust,
Series
2020-GA,
Class
A,
1.17%,
9/16/69 (3)
20,741
19
Navient
Private
Education
Refi
Loan
Trust,
Series
2020-HA,
Class
A,
1.31%,
1/15/69 (3)
21,242
20
Nelnet
Student
Loan
Trust,
Series
2021-CA,
Class
AFX,
1.32%,
4/20/62 (3)
122,758
113
Octane
Receivables
Trust,
Series
2023-1A,
Class
A,
5.87%,
5/21/29 (3)
33,264
33
Progress
Residential
Trust,
Series
2024-SFR5,
Class
A,
3.00%,
8/9/29 (3)
100,000
91
ServiceMaster
Funding,
Series
2021-1,
Class
A2I,
2.865%,
7/30/51 (3)
123,694
111
Signal
Peak,
Series
2018-5A,
Class
A1R,
CLO,
FRN,
3M
TSFR
+
1.55%,
6.176%,
4/25/37 (3)
250,000
251
SMB
Private
Education
Loan
Trust,
Series
2016-A,
Class
A2A,
2.70%,
5/15/31 (3)
692
1
SMB
Private
Education
Loan
Trust,
Series
2016-B,
Class
A2B,
FRN,
1M
TSFR
+
1.564%,
6.368%,
2/17/32 (3)
8,385
8
SMB
Private
Education
Loan
Trust,
Series
2017-A,
Class
A2A,
2.88%,
9/15/34 (3)
26,818
26
SMB
Private
Education
Loan
Trust,
Series
2018-B,
Class
A2A,
3.60%,
1/15/37 (3)
21,992
22
SMB
Private
Education
Loan
Trust,
Series
2020-B,
Class
A1A,
1.29%,
7/15/53 (3)
43,714
41
T.
ROWE
PRICE
Global
Allocation
Fund
Shares/Par
$
Value
(Cost
and
value
in
$000s)
SMB
Private
Education
Loan
Trust,
Series
2021-A,
Class
APT1,
1.07%,
1/15/53 (3)
103,977
92
U.S.
Bank,
Series
2023-1,
Class
B,
6.789%,
8/25/32 (3)
149,831
152
3,998
Bond
Mutual
Funds 15.6%
T.
Rowe
Price
Dynamic
Global
Bond
Fund
-
I
Class,
4.413% (8)(9)
2,043,066
15,875
T.
Rowe
Price
Emerging
Markets
Bond
Fund
-
I
Class,
6.01% (8)(9)
3,460,552
31,976
T.
Rowe
Price
Emerging
Markets
Local
Currency
Bond
Fund
-
I
Class,
6.368% (8)(9)
3,685,806
17,544
T.
Rowe
Price
Institutional
Floating
Rate
Fund
-
Institutional
Class,
7.737% (8)(9)
942,329
8,914
T.
Rowe
Price
Institutional
High
Yield
Fund
-
Institutional
Class,
6.57% (8)(9)
2,700,277
21,224
T.
Rowe
Price
International
Bond
Fund
-
I
Class,
3.444% (8)
(9)
3,295,718
23,334
T.
Rowe
Price
International
Bond
Fund
(USD
Hedged)
-
I
Class,
3.265% (8)(9)
869,704
7,384
126,251
Common
Stocks 31.7%
AbbVie
4,599
938
Acadia
Realty
Trust,
REIT
10,172
249
Adobe (2)
355
170
Advanced
Micro
Devices (2)
6,412
924
Agree
Realty,
REIT (1)
471
35
Alcoa
1,630
65
Alexandria
Real
Estate
Equities,
REIT
507
57
Allstate
7,601
1,418
Alphabet,
Class
A
3,026
518
Alphabet,
Class
C
33,797
5,836
Amazon.com (2)
43,794
8,163
Ameren
10,782
939
American
Express
7,757
2,095
American
Homes
4
Rent,
Class
A,
REIT
7,718
272
American
Tower,
REIT
2,462
526
AMETEK
12,097
2,218
Amgen
2,027
649
Amphenol,
Class
A
22,706
1,522
Analog
Devices
6,798
1,517
Annaly
Capital
Management,
REIT
22,200
422
Apollo
Global
Management
1,514
217
T.
ROWE
PRICE
Global
Allocation
Fund
Shares/Par
$
Value
(Cost
and
value
in
$000s)
Apple
56,831
12,839
Apple
Hospitality
REIT,
REIT
7,665
113
Atlas
Energy
Solutions (1)
2,217
43
Atlassian,
Class
A (2)
404
76
Atmos
Energy
8,392
1,165
Autodesk (2)
2,197
624
AutoZone (2)
255
767
AvalonBay
Communities,
REIT
4,711
1,044
Avidity
Biosciences (2)
739
31
Baker
Hughes
3,514
134
Ball
810
48
Bank
of
America
58,416
2,443
Becton
Dickinson
&
Company
3,200
747
Berkshire
Hathaway,
Class
B (2)
6,912
3,117
BILL
Holdings (2)
3,315
193
Boeing (2)
4,009
599
Booking
Holdings
403
1,885
Booz
Allen
Hamilton
Holding
5,866
1,066
Bristol-Myers
Squibb
9,236
515
Broadcom
7,283
1,236
Broadridge
Financial
Solutions
3,234
682
Broadstone
Net
Lease,
REIT
796
14
Camden
Property
Trust,
REIT
1,028
119
Canva,
Acquisition
Date:
8/16/21
-
12/17/21,
Cost $179 (2)
(4)(5)
105
139
Carvana (2)
6,189
1,531
CBRE
Group,
Class
A (2)
850
111
Cencora
10,575
2,412
Centene (2)
1,283
80
CF
Industries
Holdings
1,085
89
Charles
Schwab
25,214
1,786
Chevron
8,253
1,228
Chipotle
Mexican
Grill (2)
9,199
513
Chubb
5,098
1,440
Cigna
Group
1,085
342
Cintas
488
100
Citigroup
10,536
676
Cleveland-Cliffs (2)
4,427
57
CME
Group
5,242
1,181
CMS
Energy
14,705
1,024
Coca-Cola
44,857
2,930
Colgate-Palmolive
20,692
1,939
Comcast,
Class
A
19,539
853
T.
ROWE
PRICE
Global
Allocation
Fund
Shares/Par
$
Value
(Cost
and
value
in
$000s)
Commercial
Metals
799
43
Confluent,
Class
A (2)
1,232
32
ConocoPhillips
22,360
2,449
Constellation
Energy
1,347
354
Corebridge
Financial
10,653
338
Corpay (2)
1,632
538
Corteva
740
45
Coupang (2)
2,300
59
Crowdstrike
Holdings,
Class
A (2)
339
101
Crown
Castle,
REIT
1,112
120
CSX
37,857
1,274
CubeSmart,
REIT
6,356
304
Cummins
3,966
1,305
Danaher
3,823
939
Datadog,
Class
A (2)
537
67
Dayforce (1)(2)
4,191
297
Deere
4,833
1,956
Diamondback
Energy
7,353
1,300
Digital
Realty
Trust,
REIT
180
32
Dollar
General
1,449
116
Dollar
Tree (2)
4,333
280
Dominion
Energy
723
43
DoorDash,
Class
A (2)
965
151
Douglas
Emmett,
REIT
4,416
79
Dover
1,383
262
East
West
Bancorp
2,201
215
EastGroup
Properties,
REIT
1,053
180
Elevance
Health
5,843
2,371
Eli
Lilly
4,085
3,389
Entegris
419
44
EOG
Resources
1,980
241
EPR
Properties,
REIT
306
14
EQT
38,120
1,393
Equifax
2,672
708
Equinix,
REIT
1,634
1,484
Equity
LifeStyle
Properties,
REIT
7,444
522
Equity
Residential,
REIT
5,057
356
Essential
Properties
Realty
Trust,
REIT
990
31
Essex
Property
Trust,
REIT
1,452
412
Evercore,
Class
A
267
71
Exelon
21,500
845
Expand
Energy
15,458
1,310
Expro
Group
Holdings (2)
2,650
34
T.
ROWE
PRICE
Global
Allocation
Fund
Shares/Par
$
Value
(Cost
and
value
in
$000s)
Extra
Space
Storage,
REIT
278
45
Exxon
Mobil
24,488
2,860
Fair
Isaac (2)
573
1,142
Farmers
Business
Network,
Acquisition
Date:
11/3/17,
Cost $3 (2)(4)(5)
163
1
Federal
Realty
Investment
Trust,
REIT
240
27
FedEx
1,809
495
Ferguson
Enterprises
2,997
590
FirstEnergy
1,007
42
Fiserv (2)
11,127
2,202
Floor
&
Decor
Holdings,
Class
A (2)
958
99
Fortinet (2)
2,256
177
Freeport-McMoRan
13,689
616
FTI
Consulting (2)
1,351
264
Gaming
&
Leisure
Properties,
REIT
5,726
287
GE
HealthCare
Technologies
3,658
320
GE
Vernova (2)
1,631
492
General
Dynamics
4,668
1,361
General
Electric
10,067
1,729
Global
Payments
4,212
437
Goldman
Sachs
Group
2,894
1,498
Gusto,
Acquisition
Date:
10/4/21,
Cost $24 (2)(4)(5)
826
15
Halliburton
5,394
150
HB
Fuller
650
48
HCA
Healthcare
621
223
Hess
403
54
Hilton
Worldwide
Holdings
1,638
385
Home
Depot
3,929
1,547
Host
Hotels
&
Resorts,
REIT
562
10
Howmet
Aerospace
1,186
118
Hubbell
150
64
Humana
424
109
Huntington
Bancshares
65,830
1,026
Huntsman
2,198
48
IDEXX
Laboratories (2)
559
227
Ingersoll
Rand
5,768
554
Insmed (2)
2,470
166
International
Flavors
&
Fragrances
769
76
International
Paper
37,311
2,072
Intuit
496
303
Intuitive
Surgical (2)
2,145
1,081
Ivanhoe
Electric (1)(2)
3,521
36
Johnson
&
Johnson
10,658
1,704
T.
ROWE
PRICE
Global
Allocation
Fund
Shares/Par
$
Value
(Cost
and
value
in
$000s)
JPMorgan
Chase
19,602
4,350
Kenvue
131,739
3,021
Keurig
Dr
Pepper
50,374
1,660
KeyCorp
27,642
477
Keysight
Technologies (2)
13,918
2,074
Kilroy
Realty,
REIT
3,413
137
Kimco
Realty,
REIT
3,556
84
Kinder
Morgan
2,301
56
KLA
1,594
1,062
Kodiak
Gas
Services
1,326
42
Kosmos
Energy (2)
34,046
128
L3Harris
Technologies
3,052
755
Lam
Research
920
68
Laureate
Education
4,994
86
Linde
5,031
2,295
Lineage,
REIT
836
62
Loar
Holdings (1)(2)
778
67
Louisiana-Pacific
917
91
Lowe's
3,289
861
Lululemon
Athletica (2)
219
65
Marathon
Petroleum
1,538
224
Marriott
International,
Class
A
1,295
337
Marsh
&
McLennan
7,175
1,566
Martin
Marietta
Materials
840
498
Mastercard,
Class
A
2,073
1,036
McDonald's
5,915
1,728
Merck
4,533
464
Meta
Platforms,
Class
A
7,226
4,101
MetLife
3,614
283
Mettler-Toledo
International (2)
511
660
Microsoft
31,236
12,693
Middleby (2)
1,175
152
Molina
Healthcare (2)
1,980
636
Mondelez
International,
Class
A
9,388
643
MongoDB (2)
452
122
Monolithic
Power
Systems
284
216
Morgan
Stanley
1,566
182
Mosaic
15,830
424
MP
Materials (1)(2)
4,252
76
MSCI
69
39
Natera (2)
858
104
Netflix (2)
3,750
2,835
Newmont
4,393
200
T.
ROWE
PRICE
Global
Allocation
Fund
Shares/Par
$
Value
(Cost
and
value
in
$000s)
Newmont,
CDI
(AUD)
2,462
114
NextEra
Energy
11,420
905
NIKE,
Class
B
254
20
NNN
REIT,
REIT
1,031
45
Noble
1,485
47
Norfolk
Southern
3,523
882
Northrop
Grumman
656
334
Nucor
2,574
365
NVIDIA
105,826
14,049
NXP
Semiconductors
1,218
286
Old
Dominion
Freight
Line
7,289
1,467
O'Reilly
Automotive (2)
561
647
Ovintiv
1,018
40
Owens
Corning
1,383
245
Packaging
Corp.
of
America
459
105
Parker-Hannifin
1,637
1,038
Pax
Labs,
Class
A,
Acquisition
Date:
4/18/19,
Cost $81 (2)
(4)(5)
21,572
9
Pebblebrook
Hotel
Trust,
REIT
2,591
31
PepsiCo
587
97
Permian
Resources
26,988
368
PG&E
2,337
47
Phillips
66
532
65
Planet
Fitness,
Class
A (2)
3,531
277
Procter
&
Gamble
15,528
2,565
Progressive
6,207
1,507
Prologis,
REIT
6,590
744
PTC (2)
3,337
618
Public
Storage,
REIT
6,968
2,293
QUALCOMM
4,940
804
Quanta
Services
202
61
Quest
Diagnostics
5,906
914
Rad
Power
Bikes,
Class
A,
Acquisition
Date:
9/16/21,
Cost $155 (2)(4)(5)
16,193
3
Range
Resources
32,249
968
Rayonier,
REIT
2,559
80
Realty
Income,
REIT
3,950
235
Regency
Centers,
REIT
6,673
477
Regeneron
Pharmaceuticals (2)
781
655
Reliance
1,713
491
Repligen (2)
1,157
155
Republic
Services
6,642
1,315
Revvity
7,517
891
Rexford
Industrial
Realty,
REIT
10,722
460
T.
ROWE
PRICE
Global
Allocation
Fund
Shares/Par
$
Value
(Cost
and
value
in
$000s)
Rockwell
Automation
3,034
809
Roper
Technologies
1,156
622
Ross
Stores
5,110
714
Royal
Gold
459
67
RPM
International
573
73
S&P
Global
346
166
Salesforce
2,727
795
SBA
Communications,
REIT
857
197
Schlumberger
50,617
2,028
ServiceNow (2)
1,452
1,355
Sherwin-Williams
6,699
2,403
Simon
Property
Group,
REIT
3,234
547
Snowflake,
Class
A (2)
241
28
Soleno
Therapeutics (2)
800
44
Southern
699
64
Standardaero (2)
1,560
45
Stanley
Black
&
Decker
632
59
Starbucks
5,392
527
Steel
Dynamics
6,416
837
Stryker
1,492
532
Sun
Communities,
REIT
2,327
309
Synopsys (2)
1,165
598
T-Mobile
U.S.
11,524
2,572
Targa
Resources
1,193
199
TechnipFMC
25,864
690
Tenet
Healthcare (2)
5,408
838
Terreno
Realty,
REIT
4,233
254
Tesla (2)
3,298
824
Texas
Instruments
6,536
1,328
Texas
Pacific
Land
27
31
Thermo
Fisher
Scientific
6,193
3,383
TJX
8,955
1,012
Tractor
Supply
2,924
776
TransDigm
Group
93
121
TransUnion
1,886
191
Travelers
3,049
750
Uber
Technologies (2)
16,264
1,172
Union
Pacific
3,712
861
UnitedHealth
Group
8,246
4,655
Upwork (2)
22,027
299
Uranium
Energy (2)
7,410
55
Valero
Energy
1,490
193
Vaxcyte (2)
212
23
T.
ROWE
PRICE
Global
Allocation
Fund
Shares/Par
$
Value
(Cost
and
value
in
$000s)
Ventas,
REIT
6,279
411
Veralto
311
32
Verisk
Analytics
1,071
294
VICI
Properties,
REIT
5,132
163
Viper
Energy
3,989
207
Visa,
Class
A
17,173
4,978
Vornado
Realty
Trust,
REIT
2,582
107
Vulcan
Materials
341
93
Walmart
29,469
2,415
Warrior
Met
Coal
2,221
140
Waste
Connections
2,224
393
Weatherford
International
690
55
Welltower,
REIT
4,866
656
Western
Alliance
Bancorp
4,133
344
Westinghouse
Air
Brake
Technologies
6,959
1,308
Weyerhaeuser,
REIT
4,200
131
Williams
14,296
749
WP
Carey,
REIT
1,196
67
Xcel
Energy
18,681
1,248
Zoetis
330
59
257,760
Convertible
Preferred
Stocks 0.2%
ABL
Space
Systems,
Series
B,
Acquisition
Date:
3/24/21,
Cost $97 (2)(4)(5)
2,160
4
ABL
Space
Systems,
Series
B-2,
Acquisition
Date:
10/22/21,
Cost $42 (2)(4)(5)
618
1
Canva,
Series
A,
Acquisition
Date:
11/4/21,
Cost $7 (2)(4)(5)
4
5
Caris
Life
Sciences,
Series
D,
Acquisition
Date:
5/11/21,
Cost $52 (2)(4)(5)
6,404
23
Databricks,
Series
G,
Acquisition
Date:
2/1/21,
Cost $21 (2)
(4)(5)
348
30
Databricks,
Series
H,
Acquisition
Date:
8/31/21,
Cost $68 (2)
(4)(5)
927
81
Databricks,
Series
I,
Acquisition
Date:
9/14/23,
Cost $7 (2)
(4)(5)
96
8
Form
Energy,
Series
F,
Acquisition
Date:
10/4/24,
Cost $25 (2)(4)(5)
1,051
25
Gusto,
Series
E,
Acquisition
Date:
7/13/21,
Cost $33 (2)(4)
(5)
1,103
21
Jetti
Holdings,
Series
C,
Acquisition
Date:
5/24/21
-
6/30/21,
Cost $15 (2)(4)(5)
255
27
Jetti
Holdings,
Series
D,
Acquisition
Date:
9/20/22
-
10/19/22,
Cost $144 (2)(4)(5)
1,084
144
T.
ROWE
PRICE
Global
Allocation
Fund
Shares/Par
$
Value
(Cost
and
value
in
$000s)
Kobold
Metals,
Series
B-1,
Acquisition
Date:
1/10/22,
Cost $71 (2)(4)(5)
2,594
220
Kobold
Metals,
Series
B-Prime,
Acquisition
Date:
3/21/23,
Cost $122 (2)(4)(5)
2,843
242
Lilac
Solutions,
Series
B,
Acquisition
Date:
9/8/21,
Cost $37 (2)(4)(5)
2,783
26
Lilac
Solutions,
Series
C-1,
Acquisition
Date:
11/21/22,
Cost $10 (2)(4)(5)
971
9
Redwood
Materials,
Series
C,
Acquisition
Date:
5/28/21,
Cost $79 (2)(4)(5)
1,666
86
Sortera
Tech,
Series
C-1,
Acquisition
Date:
4/13/23,
Cost $11 (2)(4)(5)
764
11
Tonian
Holdings,
Series
A,
Non-Voting
Units,
Acquisition
Date:
1/15/21,
Cost $2 (2)(4)(5)
2,304
3
Tonian
Holdings,
Series
A,
Voting
Units,
Acquisition
Date:
1/15/21,
Cost $3 (2)(4)(5)
3,239
4
Treeline
Biosciences,
Series
A,
Acquisition
Date:
9/26/22,
Cost $12 (2)(4)(5)
1,491
13
Treeline
Biosciences,
Series
A-1,
Acquisition
Date:
10/2/24,
Cost $47 (2)(4)(5)
5,423
47
Verai
Discoveries,
Series
A,
Acquisition
Date:
10/17/22,
Cost $16 (2)(4)(5)
802
16
Waymo,
Series
A-2,
Acquisition
Date:
5/8/20,
Cost $143 (2)
(4)(5)
1,669
134
1,180
Corporate
Bonds 3.1%
AbbVie,
2.95%,
11/21/26
145,000
141
AbbVie,
4.50%,
5/14/35
30,000
29
AbbVie,
4.80%,
3/15/29
150,000
151
AHS
Hospital,
5.024%,
7/1/45
20,000
19
Alexandria
Real
Estate
Equities,
4.75%,
4/15/35
105,000
101
Ally
Financial,
2.20%,
11/2/28
120,000
107
Altria
Group,
2.35%,
5/6/25
40,000
39
Ameren,
5.70%,
12/1/26
185,000
188
American
Airlines
PTT,
Series
2019-1,
Class
AA,
3.15%,
2/15/32
139,833
128
American
Express,
VR,
6.489%,
10/30/31 (6)
285,000
306
American
Tower,
1.45%,
9/15/26
355,000
334
Amphenol,
2.20%,
9/15/31
105,000
88
Amphenol,
4.75%,
3/30/26
25,000
25
Amphenol,
5.05%,
4/5/29
55,000
56
Aon,
3.875%,
12/15/25
25,000
25
Appalachian
Power,
4.45%,
6/1/45
240,000
200
AT&T,
2.75%,
6/1/31
215,000
188
T.
ROWE
PRICE
Global
Allocation
Fund
Shares/Par
$
Value
(Cost
and
value
in
$000s)
Athene
Global
Funding,
4.86%,
8/27/26 (3)
175,000
174
Atlassian,
5.25%,
5/15/29
35,000
35
Autodesk,
2.40%,
12/15/31
135,000
115
AutoZone,
3.125%,
4/21/26
170,000
166
AutoZone,
3.75%,
6/1/27
70,000
68
Bank
of
America,
3.50%,
4/19/26
400,000
394
Bank
of
America,
4.45%,
3/3/26
50,000
50
Bank
of
America,
VR,
4.244%,
4/24/38 (6)
120,000
108
Bank
of
America,
VR,
5.08%,
1/20/27 (6)
225,000
226
Banner
Health,
1.897%,
1/1/31
65,000
55
Becton
Dickinson
&
Company,
2.823%,
5/20/30
115,000
104
Becton
Dickinson
&
Company,
3.70%,
6/6/27
183,000
179
Becton
Dickinson
&
Company,
5.081%,
6/7/29
170,000
172
Berkshire
Hathaway
Energy,
5.15%,
11/15/43
25,000
24
BlackRock
Funding,
4.70%,
3/14/29
50,000
50
Boardwalk
Pipelines,
4.95%,
12/15/24
10,000
10
Booking
Holdings,
3.65%,
3/15/25
30,000
30
Brighthouse
Financial
Global
Funding,
1.55%,
5/24/26 (3)
100,000
95
Brixmor
Operating
Partnership,
3.90%,
3/15/27
195,000
190
Brixmor
Operating
Partnership,
4.05%,
7/1/30
80,000
76
Cadence
Design
Systems,
4.30%,
9/10/29
60,000
59
Cameron
LNG,
2.902%,
7/15/31 (3)
40,000
35
Cameron
LNG,
3.701%,
1/15/39 (3)
30,000
25
Cardinal
Health,
3.41%,
6/15/27
125,000
121
Cardinal
Health,
3.75%,
9/15/25
80,000
79
Carvana,
12.00%,
12/1/28,
(9.00%
Cash
or
12.00%
PIK) (3)
(10)
19,004
20
Carvana,
13.00%,
6/1/30,
(11.00%
Cash
or
13.00%
PIK) (3)
(10)
29,330
32
Carvana,
14.00%,
6/1/31,
(14.00%
PIK) (3)(10)
35,286
42
Caterpillar
Financial
Services,
5.00%,
5/14/27
240,000
243
Centra
Health,
4.70%,
1/1/48
385,000
330
Charter
Communications
Operating,
4.908%,
7/23/25
12,000
12
Charter
Communications
Operating,
6.10%,
6/1/29
80,000
82
Charter
Communications
Operating,
6.15%,
11/10/26
155,000
158
Cigna
Group,
3.25%,
4/15/25
250,000
248
Citigroup,
4.45%,
9/29/27
70,000
69
Citigroup,
VR,
3.887%,
1/10/28 (6)
315,000
309
Citigroup,
VR,
4.075%,
4/23/29 (6)
100,000
97
CMS
Energy,
4.875%,
3/1/44
25,000
23
CNO
Global
Funding,
2.65%,
1/6/29 (3)
315,000
281
CommonSpirit
Health,
2.782%,
10/1/30
50,000
44
Corebridge
Financial,
4.40%,
4/5/52
375,000
307
Corebridge
Global
Funding,
4.65%,
8/20/27 (3)
60,000
60
T.
ROWE
PRICE
Global
Allocation
Fund
Shares/Par
$
Value
(Cost
and
value
in
$000s)
Cox
Communications,
5.45%,
9/1/34 (3)
105,000
102
CRH
America
Finance,
3.95%,
4/4/28 (3)
400,000
389
Crown
Castle,
2.10%,
4/1/31
250,000
210
Crown
Castle,
3.70%,
6/15/26
40,000
39
Crown
Castle,
4.75%,
5/15/47
30,000
26
CVS
Health,
2.70%,
8/21/40
540,000
359
Diamondback
Energy,
5.15%,
1/30/30
35,000
35
Discover
Financial
Services,
3.75%,
3/4/25
15,000
15
DTE
Energy,
4.95%,
7/1/27
45,000
45
Elevance
Health,
4.101%,
3/1/28
130,000
128
Elevance
Health,
4.65%,
1/15/43
20,000
18
Energy
Transfer,
5.25%,
4/15/29
120,000
121
Energy
Transfer,
5.60%,
9/1/34
175,000
176
ERAC
USA
Finance,
5.40%,
5/1/53 (3)
300,000
298
Essex
Portfolio,
2.65%,
3/15/32
135,000
114
Eversource
Energy,
Series
M,
3.30%,
1/15/28
15,000
14
Experian
Finance,
2.75%,
3/8/30 (3)
200,000
180
Extra
Space
Storage,
4.00%,
6/15/29
145,000
139
Fifth
Third
Bancorp,
VR,
4.895%,
9/6/30 (6)
55,000
54
FirstEnergy
Transmission,
4.35%,
1/15/25 (3)
65,000
65
FirstEnergy
Transmission,
5.00%,
1/15/35 (3)
60,000
59
Fiserv,
3.20%,
7/1/26
100,000
98
Fiserv,
5.45%,
3/15/34
175,000
177
Florida
Gas
Transmission,
4.35%,
7/15/25 (3)
215,000
214
Ford
Motor
Credit,
7.122%,
11/7/33
200,000
210
Foundry
JV
Holdco,
6.15%,
1/25/32 (3)
200,000
203
GATX,
6.90%,
5/1/34
270,000
298
General
Motors,
4.00%,
4/1/25
55,000
55
General
Motors
Financial,
2.40%,
4/10/28
305,000
279
George
Washington
University,
Series
2014,
4.30%,
9/15/44
15,000
13
Goldman
Sachs
Group,
3.50%,
1/23/25
300,000
299
Goldman
Sachs
Group,
3.85%,
1/26/27
115,000
113
Goldman
Sachs
Group,
5.15%,
5/22/45
15,000
14
Goldman
Sachs
Group,
6.75%,
10/1/37
10,000
11
Goldman
Sachs
Group,
VR,
2.615%,
4/22/32 (6)
200,000
172
Goldman
Sachs
Group,
VR,
2.908%,
7/21/42 (6)
130,000
94
Hasbro,
3.00%,
11/19/24
150,000
150
HCA,
4.125%,
6/15/29
235,000
226
HCA,
5.45%,
9/15/34
85,000
84
Health
Care
Service
Corp.
A
Mutual
Legal
Reserve,
5.45%,
6/15/34 (3)
95,000
95
Healthcare
Realty
Holdings,
3.625%,
1/15/28
30,000
29
Healthpeak,
2.125%,
12/1/28
80,000
72
T.
ROWE
PRICE
Global
Allocation
Fund
Shares/Par
$
Value
(Cost
and
value
in
$000s)
Healthpeak,
2.875%,
1/15/31
45,000
40
High
Street
Funding
Trust
I,
4.111%,
2/15/28 (3)
100,000
96
Honeywell
International,
1.10%,
3/1/27
275,000
255
Humana,
5.95%,
3/15/34
110,000
113
Hyundai
Capital
America,
1.30%,
1/8/26 (3)
145,000
139
Hyundai
Capital
America,
1.65%,
9/17/26 (3)
180,000
170
Hyundai
Capital
America,
1.80%,
10/15/25 (3)
55,000
53
Hyundai
Capital
America,
2.00%,
6/15/28 (3)
235,000
212
Indiana
University
Health
Obligated
Group,
3.97%,
11/1/48
145,000
119
Ingersoll
Rand,
5.176%,
6/15/29
170,000
173
Intercontinental
Exchange,
3.75%,
12/1/25
75,000
74
Intercontinental
Exchange,
5.25%,
6/15/31
75,000
76
Interpublic
Group,
5.375%,
6/15/33
410,000
409
IQVIA,
6.25%,
2/1/29
50,000
52
John
Deere
Capital,
4.40%,
9/8/31
260,000
253
JPMorgan
Chase,
VR,
1.578%,
4/22/27 (6)
235,000
224
JPMorgan
Chase,
VR,
3.882%,
7/24/38 (6)
160,000
139
Kentucky
Utilities,
4.375%,
10/1/45
65,000
55
Kilroy
Realty,
3.45%,
12/15/24
40,000
40
Kilroy
Realty,
4.25%,
8/15/29
25,000
24
Kilroy
Realty,
4.375%,
10/1/25
15,000
15
L3Harris
Technologies,
4.854%,
4/27/35
50,000
48
Liberty
Mutual
Group,
4.85%,
8/1/44 (3)
20,000
17
LYB
International
Finance
II,
3.50%,
3/2/27
300,000
290
Marriott
International,
Series
AA,
4.65%,
12/1/28
285,000
284
Mars,
4.75%,
4/20/33 (3)
125,000
122
MassMutual
Global
Funding
II,
5.10%,
4/9/27 (3)
220,000
223
McDonald's,
1.45%,
9/1/25
65,000
63
MedStar
Health,
Series
20A,
3.626%,
8/15/49
130,000
97
Met
Tower
Global
Funding,
1.25%,
9/14/26 (3)
245,000
231
Microchip
Technology,
5.05%,
3/15/29
55,000
55
Micron
Technology,
4.185%,
2/15/27
181,000
179
Mid-Atlantic
Interstate
Transmission,
4.10%,
5/15/28 (3)
110,000
107
Mississippi
Power,
3.95%,
3/30/28
170,000
165
Moody's,
2.00%,
8/19/31
335,000
281
Morgan
Stanley,
4.30%,
1/27/45
45,000
39
Morgan
Stanley,
VR,
5.656%,
4/18/30 (6)
360,000
369
Motorola
Solutions,
5.00%,
4/15/29
50,000
50
New
York
State
Electric
&
Gas,
5.30%,
8/15/34 (3)
65,000
65
NextEra
Energy
Capital
Holdings,
2.44%,
1/15/32
320,000
270
NiSource,
3.49%,
5/15/27
215,000
209
NiSource,
3.95%,
3/30/48
105,000
83
Northern
Trust,
3.95%,
10/30/25
25,000
25
T.
ROWE
PRICE
Global
Allocation
Fund
Shares/Par
$
Value
(Cost
and
value
in
$000s)
Nucor,
2.70%,
6/1/30
70,000
63
Nucor,
3.95%,
5/1/28
121,000
118
Occidental
Petroleum,
5.375%,
1/1/32
105,000
104
Omnicom
Group,
3.65%,
11/1/24
50,000
50
O'Reilly
Automotive,
3.60%,
9/1/27
145,000
141
O'Reilly
Automotive,
5.75%,
11/20/26
35,000
36
Owens
Corning,
5.70%,
6/15/34
50,000
51
PACCAR
Financial,
0.90%,
11/8/24
415,000
415
Pacific
Gas
&
Electric,
2.10%,
8/1/27
275,000
255
Pioneer
Natural
Resources,
1.125%,
1/15/26
80,000
77
Pioneer
Natural
Resources,
5.10%,
3/29/26
50,000
50
President
&
Fellows
of
Harvard
College,
3.619%,
10/1/37
25,000
22
Principal
Financial
Group,
2.125%,
6/15/30
160,000
138
Principal
Financial
Group,
3.40%,
5/15/25
35,000
35
Public
Storage
Operating,
1.95%,
11/9/28
150,000
136
Realty
Income,
2.20%,
6/15/28
70,000
64
Regency
Centers,
4.125%,
3/15/28
35,000
34
Republic
Services,
3.375%,
11/15/27
230,000
223
Revvity,
1.90%,
9/15/28
230,000
206
RGA
Global
Funding,
5.448%,
5/24/29 (3)
100,000
102
Roper
Technologies,
2.95%,
9/15/29
60,000
55
Roper
Technologies,
3.80%,
12/15/26
50,000
49
Sabine
Pass
Liquefaction,
4.20%,
3/15/28
50,000
49
Santander
Holdings
USA,
VR,
2.49%,
1/6/28 (6)
135,000
127
Santander
Holdings
USA,
VR,
6.342%,
5/31/35 (6)
110,000
112
SBA
Tower
Trust,
2.836%,
1/15/25 (3)
250,000
249
Sempra,
3.30%,
4/1/25
185,000
184
ServiceNow,
1.40%,
9/1/30
235,000
196
Sherwin-Williams,
4.80%,
9/1/31
175,000
174
Simon
Property
Group,
2.65%,
2/1/32
340,000
292
Solventum,
5.40%,
3/1/29 (3)
110,000
111
Southern,
5.70%,
3/15/34
90,000
94
Southern
Gas
Capital,
4.95%,
9/15/34
100,000
98
Targa
Resources,
5.50%,
2/15/35
45,000
45
Targa
Resources
Partners,
5.00%,
1/15/28
75,000
74
Texas
Instruments,
1.125%,
9/15/26
80,000
75
Texas
Instruments,
1.375%,
3/12/25
45,000
44
Time
Warner
Cable,
6.55%,
5/1/37
13,000
12
Time
Warner
Cable,
6.75%,
6/15/39
13,000
13
TJX,
1.60%,
5/15/31
55,000
45
Trinity
Health,
4.125%,
12/1/45
25,000
21
Uber
Technologies,
4.30%,
1/15/30
145,000
141
Union
Pacific,
4.75%,
9/15/41
10,000
9
T.
ROWE
PRICE
Global
Allocation
Fund
Shares/Par
$
Value
(Cost
and
value
in
$000s)
United
Airlines
PTT,
Series
2014-2,
Class
A,
3.75%,
9/3/26
2,496
2
United
Airlines
PTT,
Series
2018-1,
Class
A,
3.70%,
3/1/30
244,944
224
UnitedHealth
Group,
3.75%,
7/15/25
40,000
40
UnitedHealth
Group,
4.70%,
4/15/29
200,000
200
Verizon
Communications,
1.68%,
10/30/30
28,000
23
Verizon
Communications,
2.625%,
8/15/26
230,000
222
Waste
Connections,
2.20%,
1/15/32
155,000
130
Wells
Fargo,
VR,
5.389%,
4/24/34 (6)
410,000
412
Williams,
5.15%,
3/15/34
35,000
34
Willis
North
America,
4.50%,
9/15/28
160,000
158
WP
Carey,
3.85%,
7/15/29
115,000
110
24,761
Equity
Mutual
Funds 7.9%
T.
Rowe
Price
Integrated
U.S.
Small-Mid
Cap
Core
Equity
Fund
-
I
Class (8)
1,820,547
43,493
T.
Rowe
Price
Multi-Strategy
Total
Return
Fund
-
I
Class (8)
2,179,409
21,009
64,502
Municipal
Securities 0.2%
Bay
Area
Toll
Auth.,
Series
S-10,
3.176%,
4/1/41
300,000
234
California,
Build
America,
GO,
7.625%,
3/1/40
35,000
42
California
State
Univ.,
Series
B,
2.795%,
11/1/41
250,000
185
Central
Texas
Regional
Mobility
Auth.,
Series
E,
3.167%,
1/1/41
225,000
177
Florida
Dev.
Finance,
Nova
Southeastern
Univ.,
Series
B,
4.109%,
4/1/50
390,000
326
Fulton
County,
Build
America,
GO,
5.148%,
7/1/39
180,000
179
JobsOhio
Beverage
System,
Liquid
Profits,
Series
B,
3.985%,
1/1/29
15,000
15
Los
Angeles
Airport,
Series
C,
Build
America,
7.053%,
5/15/40
15,000
17
Maryland
Economic
Development,
Seagirt
Marine
Terminal,
Series
B,
4.75%,
6/1/42
175,000
152
Maryland
HHEFA,
Univ.
of
Maryland
Medical
System,
Series
B,
4.665%,
7/1/36
20,000
19
Metropolitan
Government
Nashville
&
Davidson
County
Health
&
Ed.
Facs,
Vanderbilt
Univ.
Medical
Center,
Series
B,
3.235%,
7/1/52
200,000
137
Miami-Dade
County
Transit
System,
Series
B,
Build
America,
5.624%,
7/1/40
160,000
165
Municipal
Electric
Auth.
of
Georgia,
Build
America,
Vogtle
Units,
6.655%,
4/1/57
123,000
138
T.
ROWE
PRICE
Global
Allocation
Fund
Shares/Par
$
Value
(Cost
and
value
in
$000s)
New
York
State
Dormitory
Auth.,
Series
F,
Build
America,
5.628%,
3/15/39
15,000
15
Philadelphia
Auth.
for
IDA,
3.964%,
4/15/26
5,000
5
Port
Auth.
of
New
York
&
New
Jersey,
Series
182,
5.31%,
8/1/46
20,000
20
Virginia
Commonwealth
Univ.
Health
System
Auth.,
Series
A,
4.956%,
1/1/44
25,000
24
Wisconsin
General
Fund
Annual
Appropriation,
Series
A,
3.954%,
5/1/36
110,000
102
1,952
Non-U.S.
Government
Mortgage-Backed
Securities 0.7%
Angel
Oak
Mortgage
Trust,
Series
2021-1,
Class
A1,
CMO,
ARM,
0.909%,
1/25/66 (3)
59,809
50
Angel
Oak
Mortgage
Trust,
Series
2021-1,
Class
A2,
CMO,
ARM,
1.115%,
1/25/66 (3)
19,625
17
Angel
Oak
Mortgage
Trust,
Series
2021-2,
Class
A1,
CMO,
ARM,
0.985%,
4/25/66 (3)
55,540
46
Angel
Oak
Mortgage
Trust,
Series
2023-3,
Class
A1,
CMO,
STEP,
4.80%,
9/26/67 (3)
203,326
199
BANK5,
Series
2024-5YR8,
Class
A3,
5.884%,
8/15/57
115,000
119
Barclays
Mortgage
Loan
Trust,
Series
2021-NQM1,
Class
A3,
CMO,
ARM,
2.189%,
9/25/51 (3)
69,999
63
Bayview
Financing
Trust,
Series
2024-2F,
Class
A,
CMO,
ARM,
Acquisition
Date:
8/29/24,
Cost $106,
8.10%,
9/25/29 (4)(5)
106,452
106
BBCMS
Mortgage
Trust,
Series
2019-BWAY,
Class
D,
ARM,
1M
TSFR
+
2.274%,
7.078%,
11/15/34 (3)
50,000
1
Benchmark
Mortgage
Trust,
Series
2023-V3,
Class
A3,
ARM,
6.363%,
7/15/56
145,000
151
Benchmark
Mortgage
Trust,
Series
2024-V9,
Class
A3,
5.602%,
8/15/57
19,381
20
BMO
Mortgage
Trust,
Series
2024-5C5,
Class
A3,
5.857%,
2/15/57
190,000
196
BWAY
Mortgage
Trust,
Series
2022-26BW,
Class
A,
3.402%,
2/10/44 (3)
150,000
120
BX
Trust,
Series
2021-LGCY,
Class
C,
ARM,
1M
TSFR
+
1.118%,
5.922%,
10/15/36 (3)
225,000
221
CD
Mortgage
Trust,
Series
2016-CD2,
Class
A4,
ARM,
3.526%,
11/10/49
55,000
52
CD
Mortgage
Trust,
Series
2017-CD3,
Class
B,
ARM,
3.984%,
2/10/50
110,000
66
Citigroup
Commercial
Mortgage
Trust,
Series
2015-GC33,
Class
A4,
3.778%,
9/10/58
25,000
25
Citigroup
Mortgage
Loan
Trust,
Series
2020-EXP2,
Class
A3,
CMO,
ARM,
2.50%,
8/25/50 (3)
51,349
43
T.
ROWE
PRICE
Global
Allocation
Fund
Shares/Par
$
Value
(Cost
and
value
in
$000s)
Commercial
Mortgage
Trust,
Series
2015-CR24,
Class
A5,
3.696%,
8/10/48
40,000
40
Commercial
Mortgage
Trust,
Series
2015-LC21,
Class
A4,
3.708%,
7/10/48
60,000
59
Commercial
Mortgage
Trust,
Series
2015-LC23,
Class
A4,
3.774%,
10/10/48
100,000
99
Connecticut
Avenue
Securities,
Series
2021-R02,
Class
2M1,
CMO,
ARM,
SOFR30A
+
0.90%,
5.757%,
11/25/41 (3)
10,662
11
Connecticut
Avenue
Securities
Trust,
Series
2024-R04,
Class
1A1,
CMO,
ARM,
SOFR30A
+
1.00%,
5.857%,
5/25/44 (3)
34,121
34
Ellington
Financial
Mortgage
Trust,
Series
2019-2,
Class
A3,
CMO,
ARM,
3.046%,
11/25/59 (3)
12,486
12
Ellington
Financial
Mortgage
Trust,
Series
2020-2,
Class
A1,
CMO,
ARM,
1.178%,
10/25/65 (3)
34,713
32
Extended
Stay
America
Trust,
Series
2021-ESH,
Class
B,
ARM,
1M
TSFR
+
1.494%,
6.298%,
7/15/38 (3)
88,886
89
Federal
Home
Loan
Mortgage
Multifamily
Structured
PTC,
Series
K068,
Class
A1,
2.952%,
2/25/27
12,954
13
Federal
Home
Loan
Mortgage
Multifamily
Structured
PTC,
Series
K137,
Class
A2,
ARM,
2.347%,
11/25/31
860,000
741
Federal
Home
Loan
Mortgage
Multifamily
Structured
PTC,
Series
K-150,
Class
A2,
ARM,
3.71%,
9/25/32
370,000
346
Federal
Home
Loan
Mortgage
Multifamily
Structured
PTC,
Series
K-156,
Class
A2,
ARM,
4.43%,
2/25/33
285,000
280
Federal
Home
Loan
Mortgage
Multifamily
Structured
PTC,
Series
K753,
Class
A2,
4.40%,
10/25/30
405,000
400
Galton
Funding
Mortgage
Trust,
Series
2018-1,
Class
A23,
CMO,
ARM,
3.50%,
11/25/57 (3)
5,179
5
Grace
Trust,
Series
2020-GRCE,
Class
C,
ARM,
2.68%,
12/10/40 (3)
100,000
82
GS
Mortgage
Securities
Trust,
Series
2015-GC32,
Class
A4,
3.764%,
7/10/48
25,000
25
GS
Mortgage
Securities
Trust,
Series
2018-GS9,
Class
A4,
ARM,
3.992%,
3/10/51
65,000
63
JPMorgan
Barclays
Bank
Commercial
Mortgage
Securities
Trust,
Series
2015-C30,
Class
A5,
3.822%,
7/15/48
65,000
64
JPMorgan
Barclays
Bank
Commercial
Mortgage
Securities
Trust,
Series
2015-C31,
Class
A3,
3.801%,
8/15/48
41,719
41
JPMorgan
Chase
Commercial
Mortgage
Securities
Trust,
Series
2022-OPO,
Class
B,
3.377%,
1/5/39 (3)
100,000
88
JPMorgan
Mortgage
Trust,
Series
2019-INV3,
Class
A15,
CMO,
ARM,
3.50%,
5/25/50 (3)
30,071
27
JPMorgan
Mortgage
Trust,
Series
2019-INV3,
Class
A3,
CMO,
ARM,
3.50%,
5/25/50 (3)
35,610
32
T.
ROWE
PRICE
Global
Allocation
Fund
Shares/Par
$
Value
(Cost
and
value
in
$000s)
JPMorgan
Mortgage
Trust,
Series
2020-INV1,
Class
A11,
CMO,
ARM,
1M
TSFR
+
0.944%,
5.682%,
8/25/50 (3)
7,997
7
JPMorgan
Mortgage
Trust,
Series
2020-INV1,
Class
A3,
CMO,
ARM,
3.50%,
8/25/50 (3)
14,217
13
MHC
Commercial
Mortgage
Trust,
Series
2021-MHC,
Class
B,
ARM,
1M
TSFR
+
1.215%,
6.019%,
4/15/38 (3)
204,000
203
Morgan
Stanley
Bank
of
America
Merrill
Lynch
Trust,
Series
2015-C24,
Class
AS,
ARM,
4.036%,
5/15/48
35,000
34
Morgan
Stanley
Bank
of
America
Merrill
Lynch
Trust,
Series
2015-C27,
Class
A4,
3.753%,
12/15/47
85,000
84
Morgan
Stanley
Bank
of
America
Merrill
Lynch
Trust,
Series
2015-C27,
Class
AS,
4.068%,
12/15/47
155,000
151
New
Residential
Mortgage
Loan
Trust,
Series
2022-INV1,
Class
A4,
CMO,
ARM,
3.00%,
3/25/52 (3)
126,143
105
OBX
Trust,
Series
2019-EXP3,
Class
2A2,
CMO,
ARM,
1M
TSFR
+
1.214%,
5.952%,
10/25/59 (3)
6,663
7
Provident
Funding
Mortgage
Trust,
Series
2019-1,
Class
B1,
CMO,
ARM,
3.184%,
12/25/49 (3)
181,656
152
Sequoia
Mortgage
Trust,
Series
2018-CH2,
Class
A3,
CMO,
ARM,
4.00%,
6/25/48 (3)
5,595
5
SG
Residential
Mortgage
Trust,
Series
2019-3,
Class
A1,
CMO,
ARM,
2.703%,
9/25/59 (3)
540
—
Starwood
Mortgage
Residential
Trust,
Series
2020-INV1,
Class
A1,
CMO,
ARM,
1.027%,
11/25/55 (3)
16,742
16
Structured
Agency
Credit
Risk
Debt
Notes,
Series
2021-
DNA7,
Class
M1,
CMO,
ARM,
SOFR30A
+
0.85%,
5.707%,
11/25/41 (3)
72,448
72
Structured
Agency
Credit
Risk
Debt
Notes,
Series
2024-
DNA2,
Class
A1,
CMO,
ARM,
SOFR30A
+
1.25%,
6.107%,
5/25/44 (3)
28,666
29
Structured
Agency
Credit
Risk
Debt
Notes,
Series
2024-
HQA1,
Class
A1,
CMO,
ARM,
SOFR30A
+
1.25%,
6.107%,
3/25/44 (3)
144,038
144
Towd
Point
Mortgage
Trust,
Series
2018-1,
Class
A1,
CMO,
ARM,
3.00%,
1/25/58 (3)
9,844
10
Towd
Point
Mortgage
Trust,
Series
2024-3,
Class
A1B,
CMO,
ARM,
5.16%,
7/25/65 (3)
94,847
93
Verus
Securitization
Trust,
Series
2019-INV3,
Class
A1,
CMO,
ARM,
3.692%,
11/25/59 (3)
21,052
21
Verus
Securitization
Trust,
Series
2021-1,
Class
A1,
CMO,
ARM,
0.815%,
1/25/66 (3)
27,907
25
Verus
Securitization
Trust,
Series
2023-INV1,
Class
A1,
CMO,
STEP,
5.999%,
2/25/68 (3)
100,655
101
Wells
Fargo
Commercial
Mortgage
Trust,
Series
2015-C30,
Class
A4,
3.664%,
9/15/58
41,000
40
T.
ROWE
PRICE
Global
Allocation
Fund
Shares/Par
$
Value
(Cost
and
value
in
$000s)
Wells
Fargo
Commercial
Mortgage
Trust,
Series
2015-
NXS2,
Class
A5,
ARM,
3.767%,
7/15/58
75,000
74
5,464
Private
Investment
Companies 7.7%
Blackstone
Partners
Offshore
Fund,
Series
E1 (4)
24,760
62,643
62,643
U.S.
Government
Agency
Obligations
(Excluding
Mortgage-Backed) 7.0%
U.S.
Treasury
Bonds,
1.125%,
5/15/40
1,830,000
1,141
U.S.
Treasury
Bonds,
1.375%,
8/15/50
1,150,000
594
U.S.
Treasury
Bonds,
1.875%,
2/15/41
580,000
402
U.S.
Treasury
Bonds,
1.875%,
2/15/51
1,215,000
716
U.S.
Treasury
Bonds,
2.00%,
2/15/50
2,490,000
1,527
U.S.
Treasury
Bonds,
2.00%,
8/15/51
365,000
221
U.S.
Treasury
Bonds,
2.25%,
2/15/52
2,245,000
1,441
U.S.
Treasury
Bonds,
2.50%,
2/15/45
145,000
104
U.S.
Treasury
Bonds,
2.75%,
11/15/42
65,000
50
U.S.
Treasury
Bonds,
2.75%,
8/15/47
4,915,000
3,614
U.S.
Treasury
Bonds,
2.875%,
8/15/45
570,000
437
U.S.
Treasury
Bonds,
3.00%,
11/15/44
395,000
311
U.S.
Treasury
Bonds,
3.00%,
2/15/47
220,000
170
U.S.
Treasury
Bonds,
3.00%,
2/15/48
740,000
568
U.S.
Treasury
Bonds,
3.00%,
8/15/48
150,000
115
U.S.
Treasury
Bonds,
3.00%,
8/15/52
800,000
607
U.S.
Treasury
Bonds,
3.125%,
11/15/41
290,000
242
U.S.
Treasury
Bonds,
3.125%,
8/15/44
110,000
89
U.S.
Treasury
Bonds,
3.375%,
8/15/42
220,000
188
U.S.
Treasury
Bonds,
3.625%,
8/15/43
305,000
268
U.S.
Treasury
Bonds,
3.625%,
2/15/53
80,000
69
U.S.
Treasury
Bonds,
3.625%,
5/15/53
1,090,000
936
U.S.
Treasury
Bonds,
3.875%,
8/15/40
580,000
542
U.S.
Treasury
Bonds,
3.875%,
2/15/43
605,000
553
U.S.
Treasury
Bonds,
3.875%,
5/15/43
105,000
96
U.S.
Treasury
Bonds,
4.00%,
11/15/52
150,000
138
U.S.
Treasury
Bonds,
4.25%,
2/15/54
360,000
346
U.S.
Treasury
Bonds,
4.625%,
5/15/54
150,000
153
U.S.
Treasury
Bonds,
4.75%,
11/15/43
370,000
379
U.S.
Treasury
Bonds,
4.75%,
11/15/53
640,000
667
U.S.
Treasury
Inflation-Indexed
Bonds,
0.125%,
2/15/51
104,952
62
U.S.
Treasury
Inflation-Indexed
Bonds,
0.25%,
2/15/50
280,394
175
U.S.
Treasury
Inflation-Indexed
Bonds,
0.625%,
2/15/43
293,969
226
T.
ROWE
PRICE
Global
Allocation
Fund
Shares/Par
$
Value
(Cost
and
value
in
$000s)
U.S.
Treasury
Inflation-Indexed
Bonds,
0.75%,
2/15/42
671,498
538
U.S.
Treasury
Inflation-Indexed
Bonds,
0.75%,
2/15/45
267,364
204
U.S.
Treasury
Inflation-Indexed
Bonds,
0.875%,
2/15/47
248,949
191
U.S.
Treasury
Inflation-Indexed
Bonds,
1.00%,
2/15/46
82,238
65
U.S.
Treasury
Inflation-Indexed
Bonds,
1.00%,
2/15/48
144,251
113
U.S.
Treasury
Inflation-Indexed
Bonds,
1.00%,
2/15/49
168,885
131
U.S.
Treasury
Inflation-Indexed
Bonds,
1.375%,
2/15/44
178,564
156
U.S.
Treasury
Inflation-Indexed
Bonds,
1.50%,
2/15/53
618,991
531
U.S.
Treasury
Inflation-Indexed
Bonds,
2.125%,
2/15/41
287,496
290
U.S.
Treasury
Inflation-Indexed
Bonds,
2.125%,
2/15/54
177,655
176
U.S.
Treasury
Inflation-Indexed
Notes,
0.125%,
10/15/25
305,006
299
U.S.
Treasury
Inflation-Indexed
Notes,
0.125%,
4/15/26
1,171,911
1,138
U.S.
Treasury
Inflation-Indexed
Notes,
0.125%,
7/15/26
873,331
850
U.S.
Treasury
Inflation-Indexed
Notes,
0.125%,
10/15/26
2,159,788
2,093
U.S.
Treasury
Inflation-Indexed
Notes,
0.125%,
4/15/27 (11)
4,269,178
4,088
U.S.
Treasury
Inflation-Indexed
Notes,
0.125%,
1/15/30
550,593
505
U.S.
Treasury
Inflation-Indexed
Notes,
0.125%,
7/15/30
613,900
560
U.S.
Treasury
Inflation-Indexed
Notes,
0.125%,
1/15/31
423,248
381
U.S.
Treasury
Inflation-Indexed
Notes,
0.25%,
7/15/29
701,476
655
U.S.
Treasury
Inflation-Indexed
Notes,
0.375%,
7/15/25
199,118
197
U.S.
Treasury
Inflation-Indexed
Notes,
0.50%,
1/15/28
114,858
110
U.S.
Treasury
Inflation-Indexed
Notes,
0.625%,
1/15/26
353,335
347
U.S.
Treasury
Inflation-Indexed
Notes,
0.625%,
7/15/32
784,858
716
U.S.
Treasury
Inflation-Indexed
Notes,
0.75%,
7/15/28
144,972
140
U.S.
Treasury
Inflation-Indexed
Notes,
0.875%,
1/15/29
195,981
189
U.S.
Treasury
Inflation-Indexed
Notes,
1.25%,
4/15/28
1,126,218
1,103
U.S.
Treasury
Inflation-Indexed
Notes,
1.375%,
7/15/33
383,509
367
U.S.
Treasury
Inflation-Indexed
Notes,
1.625%,
10/15/29
250,113
248
U.S.
Treasury
Inflation-Indexed
Notes,
1.75%,
1/15/34 (11)
2,193,294
2,152
U.S.
Treasury
Inflation-Indexed
Notes,
1.875%,
7/15/34
150,485
149
U.S.
Treasury
Inflation-Indexed
Notes,
2.125%,
4/15/29
3,025,436
3,058
U.S.
Treasury
Inflation-Indexed
Notes,
2.375%,
10/15/28
3,639,401
3,727
U.S.
Treasury
Inflation-Indexed
Notes,
3.875%,
4/15/29
287,235
311
U.S.
Treasury
Notes,
0.625%,
8/15/30
420,000
343
U.S.
Treasury
Notes,
0.75%,
1/31/28
120,000
108
U.S.
Treasury
Notes,
1.25%,
8/15/31
535,000
442
U.S.
Treasury
Notes,
1.625%,
8/15/29
1,650,000
1,472
U.S.
Treasury
Notes,
1.875%,
2/28/27
2,720,000
2,584
U.S.
Treasury
Notes,
1.875%,
2/15/32
365,000
311
U.S.
Treasury
Notes,
3.625%,
5/31/28
100,000
98
U.S.
Treasury
Notes,
3.625%,
8/31/29
1,605,000
1,569
U.S.
Treasury
Notes,
3.875%,
8/15/34
700,000
677
U.S.
Treasury
Notes,
4.00%,
2/29/28
725,000
722
T.
ROWE
PRICE
Global
Allocation
Fund
Shares/Par
$
Value
(Cost
and
value
in
$000s)
U.S.
Treasury
Notes,
4.00%,
2/15/34
280,000
274
U.S.
Treasury
Notes,
4.125%,
9/30/27
2,220,000
2,220
U.S.
Treasury
Notes,
4.125%,
10/31/27
1,195,000
1,195
U.S.
Treasury
Notes,
4.25%,
2/28/29
490,000
492
U.S.
Treasury
Notes,
4.375%,
11/30/28
1,105,000
1,113
U.S.
Treasury
Notes,
4.375%,
5/15/34
150,000
151
U.S.
Treasury
Notes,
4.50%,
5/31/29
355,000
360
57,056
Total
United
States
(Cost
$492,087)
605,567
VIETNAM 0.4%
Common
Stocks 0.4%
Asia
Commercial
Bank
316,436
335
Bank
for
Foreign
Trade
of
Vietnam (2)
137,081
507
Binh
Minh
Plastics
18,600
99
FPT
94,233
504
FPT
Digital
Retail (2)
6,195
43
Hoa
Phat
Group (2)
559,180
593
Khang
Dien
House
Trading
&
Investment (2)
67,667
89
Military
Commercial
Joint
Stock
Bank
166,442
175
Mobile
World
Investment
48,100
126
Nam
Long
Investment
40,566
64
Phu
Nhuan
Jewelry
18,600
74
Saigon
Beer
Alcohol
Beverage
23,400
51
Vietnam
Dairy
Products
24,700
65
Vietnam
Engine
&
Agricultural
Machinery
28,800
52
Vietnam
Prosperity
Bank
8,100
7
Vincom
Retail (2)
13,700
10
Total
Vietnam
(Cost
$2,052)
2,794
SHORT-TERM
INVESTMENTS 1.1%
Money
Market
Funds 1.1%
T.
Rowe
Price
Treasury
Reserve
Fund,
4.86% (8)(12)
9,297,414
9,297
Total
Short-Term
Investments
(Cost
$9,297)
9,297
T.
ROWE
PRICE
Global
Allocation
Fund
Shares/Par
$
Value
(Cost
and
value
in
$000s)
SECURITIES
LENDING
COLLATERAL 0.7%
INVESTMENTS
IN
A
POOLED
ACCOUNT
THROUGH
SECURITIES
LENDING
PROGRAM
WITH
JPMORGAN
CHASE
BANK 0.5%
Money
Market
Funds 0.5%
T.
Rowe
Price
Government
Reserve
Fund,
4.86% (8)(12)
3,888,106
3,888
Total
Investments
in
a
Pooled
Account
through
Securities
Lending
Program
with
JPMorgan
Chase
Bank
3,888
INVESTMENTS
IN
A
POOLED
ACCOUNT
THROUGH
SECURITIES
LENDING
PROGRAM
WITH
STATE
STREET
BANK
AND
TRUST
COMPANY 0.2%
Money
Market
Funds 0.2%
T.
Rowe
Price
Government
Reserve
Fund,
4.86% (8)(12)
1,676,252
1,676
Total
Investments
in
a
Pooled
Account
through
Securities
Lending
Program
with
State
Street
Bank
and
Trust
Company
1,676
Total
Securities
Lending
Collateral
(Cost
$5,564)
5,564
Total
Investments
in
Securities
100.5%
of
Net
Assets
(Cost
$655,955)
$
816,293
‡
Country
classifications
are
generally
based
on
MSCI
categories
or
another
unaffiliated
third
party
data
provider;
Shares/Par
and
Notional
Amount
are
denominated
in
the
currency
of
the
country
presented
unless
otherwise
noted.
(1)
See
Note
4
.
All
or
a
portion
of
this
security
is
on
loan
at
October
31,
2024.
(2)
Non-income
producing
(3)
Security
was
purchased
pursuant
to
Rule
144A
under
the
Securities
Act
of
1933
and
may
be
resold
in
transactions
exempt
from
registration
only
to
qualified
institutional
buyers.
Total
value
of
such
securities
at
period-end
amounts
to
$13,890
and
represents
1.7%
of
net
assets.
(4)
See
Note
2.
Level
3
in
fair
value
hierarchy.
(5)
Security
cannot
be
offered
for
public
resale
without
first
being
registered
under
the
Securities
Act
of
1933
and
related
rules
("restricted
security").
Acquisition
date
represents
the
day
on
which
an
enforceable
right
to
acquire
such
security
is
obtained
and
is
presented
along
with
related
cost
in
the
security
description.
The
fund
may
have
registration
rights
for
certain
restricted
securities.
Any
costs
related
to
such
registration
are
generally
borne
by
the
issuer.
The
aggregate
value
of
restricted
securities
(excluding
144A
holdings)
at
period
end
amounts
to
$1,957
and
represents
0.2%
of
net
assets.
T.
ROWE
PRICE
Global
Allocation
Fund
.
.
.
.
.
.
.
.
.
.
(6)
Security
is
a
fix-to-float
security,
which
carries
a
fixed
coupon
until
a
certain
date,
upon
which
it
switches
to
a
floating
rate.
Reference
rate
and
spread
are
provided
if
the
rate
is
currently
floating.
(7)
All
or
a
portion
of
this
loan
is
unsettled
as
of
October
31,
2024.
The
interest
rate
for
unsettled
loans
will
be
determined
upon
settlement
after
period
end.
(8)
Affiliated
Companies
(9)
SEC
30-day
yield
(10)
Security
has
the
ability
to
pay
in-kind
or
pay
in
cash.
When
applicable,
separate
rates
of
such
payments
are
disclosed.
(11)
At
October
31,
2024,
all
or
a
portion
of
this
security
is
pledged
as
collateral
and/or
margin
deposit
to
cover
future
funding
obligations.
(12)
Seven-day
yield
1M
TSFR
One
month
term
SOFR
(Secured
overnight
financing
rate)
3M
TSFR
Three
month
term
SOFR
(Secured
overnight
financing
rate)
ADR
American
Depositary
Receipts
ARM
Adjustable
Rate
Mortgage
(ARM);
rate
shown
is
effective
rate
at
period-end.
The
rates
for
certain
ARMs
are
not
based
on
a
published
reference
rate
and
spread
but
may
be
determined
using
a
formula
based
on
the
rates
of
the
underlying
loans.
AUD
Australian
Dollar
CAD
Canadian
Dollar
CDI
CHESS
or
CREST
Depositary
Interest
CHF
Swiss
Franc
CLO
Collateralized
Loan
Obligation
CMO
Collateralized
Mortgage
Obligation
CNH
Offshore
China
Renminbi
CPI
Consumer
Price
Index
DKK
Danish
Krone
ETF
Exchange-Traded
Fund
EUR
Euro
FRN
Floating
Rate
Note
GBP
British
Pound
GDR
Global
Depositary
Receipts
GO
General
Obligation
HHEFA
Health
&
Higher
Educational
Facility
Authority
HKD
Hong
Kong
Dollar
IDA
Industrial
Development
Authority/Agency
ILS
Israeli
Shekel
JPY
Japanese
Yen
NOK
Norwegian
Krone
NVDR
Non-Voting
Depositary
Receipts
NZD
New
Zealand
Dollar
OMR
Rial
Omani
OTC
Over-the-counter
T.
ROWE
PRICE
Global
Allocation
Fund
.
.
.
.
.
.
.
.
.
.
PIK
Payment-in-kind
PTT
Pass-Through
Trust
REIT
A
domestic
Real
Estate
Investment
Trust
whose
distributions
pass-through
with
original
tax
character
to
the
shareholder
SDR
Swedish
Depository
Receipts
SEK
Swedish
Krona
SGD
Singapore
Dollar
SOFR30A
30-day
Average
SOFR
(Secured
overnight
financing
rate)
STEP
Stepped
coupon
bond
for
which
the
coupon
rate
of
interest
adjusts
on
specified
date(s);
rate
shown
is
effective
rate
at
period-end.
USD
U.S.
Dollar
VR
Variable
Rate;
rate
shown
is
effective
rate
at
period-end.
The
rates
for
certain
variable
rate
securities
are
not
based
on
a
published
reference
rate
and
spread
but
are
determined
by
the
issuer
or
agent
and
based
on
current
market
conditions.
T.
ROWE
PRICE
Global
Allocation
Fund
(Amounts
in
000s,
except
for
contracts)
OPTIONS
WRITTEN
(0.1)%
OTC
Options
Written (0.1)%
Counterparty
Description
Contracts
Notional
Amount
$
Value
Morgan
Stanley
iShares
iBoxx
High
Yield
Corporate
Bond
ETF,
Put,
11/15/24
@
$79.00
785
6,227
(44)
Morgan
Stanley
KE
Holdings,
Call,
11/15/24
@
$25.00
10
22
(1)
Morgan
Stanley
KE
Holdings,
Call,
11/15/24
@
$26.00
10
22
—
Morgan
Stanley
KE
Holdings,
Call,
1/17/25
@
$27.00
10
22
(1)
Morgan
Stanley
KE
Holdings,
Call,
1/17/25
@
$28.00
7
15
(1)
Morgan
Stanley
S&P
500
Index,
Put,
12/20/24
@
$5,750.00
69
39,368
(1,006)
UBS
Investment
Bank
iShares
iBoxx
High
Yield
Corporate
Bond
ETF,
Call,
12/20/24
@
$79.00
238
1,888
(10)
UBS
Investment
Bank
iShares
iBoxx
High
Yield
Corporate
Bond
ETF,
Put,
12/20/24
@
$79.00
238
1,888
(24)
Total
Options
Written
(Premiums
$(753))
$
(1,087)
T.
ROWE
PRICE
Global
Allocation
Fund
(Amounts
in
000s)
SWAPS
0.0%
Description
Notional
Amount
$
Value
Initial
$
Value
**
Unrealized
$
Gain/(Loss)
CENTRALLY
CLEARED
SWAPS
0.0%
Credit
Default
Swaps,
Protection
Sold
0.0%
United
States
0.0%
Protection
Sold
(Relevant
Credit:
Markit
CDX.NA.IG-S42,
5
Year
Index),
Receive
1.00%
Quarterly,
Pay
upon
credit
default,
6/20/29
800
19
17
2
Protection
Sold
(Relevant
Credit:
Markit
CDX.NA.IG-S43,
5
Year
Index),
Receive
1.00%
Quarterly,
Pay
upon
credit
default,
12/20/29
2,000
45
46
(1)
Total
United
States
1
Total
Centrally
Cleared
Credit
Default
Swaps,
Protection
Sold
1
Zero-Coupon
Inflation
Swaps
0.0%
United
States
0.0%
5
Year
Zero-Coupon
Inflation
Swap
Pay
Fixed
2.327%
at
Maturity,
Receive
Variable
(Change
in
CPI)
at
Maturity,
9/24/29
200
1
—
1
Total
United
States
1
Total
Centrally
Cleared
Zero-Coupon
Inflation
Swaps
1
Total
Centrally
Cleared
Swaps
2
Net
payments
(receipts)
of
variation
margin
to
date
(4)
Variation
margin
receivable
(payable)
on
centrally
cleared
swaps
$
(2)
**
Includes
interest
purchased
or
sold
but
not
yet
collected
of
less
than
$1.
T.
ROWE
PRICE
Global
Allocation
Fund
(Amounts
in
000s)
FORWARD
CURRENCY
EXCHANGE
CONTRACTS
Counterparty
Settlement
Receive
Deliver
Unrealized
Gain/(Loss)
Citigroup
Global
Markets
11/29/24
USD
7,799
JPY
1,192,263
$
(77)
State
Street
11/15/24
JPY
50,546
USD
346
(12)
State
Street
11/29/24
USD
2,762
AUD
4,201
(3)
State
Street
11/29/24
USD
3,600
CHF
3,109
(12)
State
Street
11/29/24
USD
1,224
DKK
8,428
(7)
State
Street
11/29/24
USD
12,155
EUR
11,223
(67)
State
Street
11/29/24
USD
5,381
GBP
4,145
37
State
Street
11/29/24
USD
729
HKD
5,660
—
State
Street
11/29/24
USD
136
ILS
505
—
State
Street
11/29/24
USD
205
NOK
2,242
1
State
Street
11/29/24
USD
63
NZD
106
—
State
Street
11/29/24
USD
1,208
SEK
12,831
2
State
Street
11/29/24
USD
445
SGD
588
(1)
Net
unrealized
gain
(loss)
on
open
forward
currency
exchange
contracts
$
(139)
T.
ROWE
PRICE
Global
Allocation
Fund
FUTURES
CONTRACTS
($000s)
Expiration
Date
Notional
Amount
Value
and
Unrealized
Gain
(Loss)
Short,
18
MSCI
EAFE
Index
contracts
12/24
(2,115)
$
80
Short,
70
S&P
500
E-Mini
Index
contracts
12/24
(20,085)
349
Long,
26
U.S.
Treasury
Long
Bond
contracts
12/24
3,067
(156)
Long,
40
U.S.
Treasury
Notes
five
year
contracts
12/24
4,289
(45)
Long,
15
U.S.
Treasury
Notes
ten
year
contracts
12/24
1,657
(55)
Long,
24
U.S.
Treasury
Notes
two
year
contracts
12/24
4,943
(57)
Long,
3
Ultra
U.S.
Treasury
Bonds
contracts
12/24
377
(24)
Short,
16
Ultra
U.S.
Treasury
Notes
ten
year
contracts
12/24
(1,820)
88
Net
payments
(receipts)
of
variation
margin
to
date
188
Variation
margin
receivable
(payable)
on
open
futures
contracts
$
368
T.
ROWE
PRICE
Global
Allocation
Fund
AFFILIATED
COMPANIES
($000s)
The
fund
may
invest
in
certain
securities
that
are
considered
affiliated
companies.
As
defined
by
the
1940
Act,
an
affiliated
company
is
one
in
which
the
fund
owns
5%
or
more
of
the
outstanding
voting
securities,
or
a
company
that
is
under
common
ownership
or
control.
The
following
securities
were
considered
affiliated
companies
for
all
or
some
portion
of
the
year
ended
October
31,
2024.
Net
realized
gain
(loss),
investment
income,
change
in
net
unrealized
gain/loss,
and
purchase
and
sales
cost
reflect
all
activity
for
the
period
then
ended.
Affiliate
Net
Realized
Gain
(Loss)
Change
in
Net
Unrealized
Gain/Loss
Investment
Income
T.
Rowe
Price
Dynamic
Global
Bond
Fund
-
I
Class,
4.41%
$
(275)
$
14
$
802
T.
Rowe
Price
Emerging
Markets
Bond
Fund
-
I
Class,
6.01%
(6)
(688)
168
T.
Rowe
Price
Emerging
Markets
Local
Currency
Bond
Fund
-
I
Class,
6.37%
(264)
678
1,090
T.
Rowe
Price
Institutional
Floating
Rate
Fund
-
Institutional
Class,
7.74%
(11)
146
760
T.
Rowe
Price
Institutional
High
Yield
Fund
-
Institutional
Class,
6.57%
(161)
1,666
1,384
T.
Rowe
Price
Integrated
U.S.
Small-Mid
Cap
Core
Equity
Fund
-
I
Class
2,630
11,792
340
T.
Rowe
Price
International
Bond
Fund
-
I
Class,
3.44%
(1,064)
2,599
771
T.
Rowe
Price
International
Bond
Fund
(USD
Hedged)
-
I
Class,
3.27%
—
222
152
T.
Rowe
Price
Multi-Strategy
Total
Return
Fund
-
I
Class
(175)
186
1,347
T.
Rowe
Price
Government
Reserve
Fund,
4.86%
—
—
—++
T.
Rowe
Price
Treasury
Reserve
Fund,
4.86%
—
—
469
Affiliates
not
held
at
period
end
(4,665)
8,737
1,674
Totals
$
(3,991)#
$
25,352
$
8,957+
T.
ROWE
PRICE
Global
Allocation
Fund
AFFILIATED
COMPANIES
(CONTINUED)
($000s)
Supplementary
Investment
Schedule
Affiliate
Value
10/31/23
Purchase
Cost
Sales
Cost
Value
10/31/24
T.
Rowe
Price
Dynamic
Global
Bond
Fund
-
I
Class,
4.41%
$
16,583
$
803
$
1,525
$
15,875
T.
Rowe
Price
Emerging
Markets
Bond
Fund
-
I
Class,
6.01%
—
33,440
776
31,976
T.
Rowe
Price
Emerging
Markets
Local
Currency
Bond
Fund
-
I
Class,
6.37%
17,787
1,093
2,014
17,544
T.
Rowe
Price
Institutional
Emerging
Markets
Bond
Fund
30,341
1,525
40,603
—
T.
Rowe
Price
Institutional
Floating
Rate
Fund
-
Institutional
Class,
7.74%
8,369
760
361
8,914
T.
Rowe
Price
Institutional
High
Yield
Fund
-
Institutional
Class,
6.57%
19,635
1,384
1,461
21,224
T.
Rowe
Price
Integrated
U.S.
Small-Mid
Cap
Core
Equity
Fund
-
I
Class
42,331
1,697
12,327
43,493
T.
Rowe
Price
International
Bond
Fund
-
I
Class,
3.44%
24,329
770
4,364
23,334
T.
Rowe
Price
International
Bond
Fund
(USD
Hedged)
-
I
Class,
3.27%
2,159
5,003
—
7,384
T.
Rowe
Price
Multi-Strategy
Total
Return
Fund
-
I
Class
21,151
1,347
1,675
21,009
T.
Rowe
Price
Government
Reserve
Fund,
4.86%
3,057
¤
¤
5,564
T.
Rowe
Price
Treasury
Reserve
Fund,
4.86%
18,210
¤
¤
9,297
Total
$
205,614^
T.
ROWE
PRICE
Global
Allocation
Fund
The
accompanying
notes
are
an
integral
part
of
these
financial
statements.
#
Capital
gain
distributions
from
underlying
Price
funds
represented
$1,357
of
the
net
realized
gain
(loss).
++
Excludes
earnings
on
securities
lending
collateral,
which
are
subject
to
rebates
and
fees
as
described
in
Note
4
.
+
Investment
income
comprised
$8,957
of
dividend
income
and
$0
of
interest
income.
¤
Purchase
and
sale
information
not
shown
for
cash
management
funds.
^
The
cost
basis
of
investments
in
affiliated
companies
was
$211,567.
T.
ROWE
PRICE
Global
Allocation
Fund
October
31,
2024
Statement
of
Assets
and
Liabilities
($000s,
except
shares
and
per
share
amounts)
Assets
Investments
in
securities,
at
value
(cost
$655,955)
$
816,293
Receivable
for
investment
securities
sold
1,855
Interest
and
dividends
receivable
1,089
Receivable
for
shares
sold
969
Foreign
currency
(cost
$800)
792
Variation
margin
receivable
on
futures
contracts
368
Cash
244
Unrealized
gain
on
forward
currency
exchange
contracts
40
Other
assets
749
Total
assets
822,399
Liabilities
Obligation
to
return
securities
lending
collateral
5,564
Payable
for
investment
securities
purchased
2,161
Options
written
(premiums
$753)
1,087
Payable
for
shares
redeemed
577
Investment
management
fees
payable
385
Unrealized
loss
on
forward
currency
exchange
contracts
179
Due
to
affiliates
25
Variation
margin
payable
on
centrally
cleared
swaps
2
Other
liabilities
344
Total
liabilities
10,324
Commitments
and
Contingent
Liabilities
(note
7
)
NET
ASSETS
$
812,075
T.
ROWE
PRICE
Global
Allocation
Fund
October
31,
2024
Statement
of
Assets
and
Liabilities
($000s,
except
shares
and
per
share
amounts)
The
accompanying
notes
are
an
integral
part
of
these
financial
statements.
Net
Assets
Consist
of:
Total
distributable
earnings
(loss)
$
164,010
Paid-in
capital
applicable
to
51,817,357
shares
of
$0.0001
par
value
capital
stock
outstanding;
1,000,000,000
shares
authorized
648,065
NET
ASSETS
$
812,075
NET
ASSET
VALUE
PER
SHARE
Investor
Class
(Net
assets:
$516,949;
Shares
outstanding:
32,994,755)
$
15.67
Advisor
Class
(Net
assets:
$3,385;
Shares
outstanding:
217,833)
$
15.54
I
Class
(Net
assets:
$291,741;
Shares
outstanding:
18,604,769)
$
15.68
T.
ROWE
PRICE
Global
Allocation
Fund
Year
Ended
10/31/24
Investment
Income
(Loss)
Income
Dividend
(net
of
foreign
taxes
of
$387)
$
17,490
.
Interest
4,144
Securities
lending
34
Total
income
21,668
Expenses
Investment
management
5,600
Shareholder
servicing
Investor
Class
$
778
Advisor
Class
8
I
Class
42
828
Rule
12b-1
fees
Advisor
Class
8
Prospectus
and
shareholder
reports
Investor
Class
88
Advisor
Class
1
I
Class
18
107
Custody
and
accounting
304
Legal
and
audit
154
Registration
85
Directors
3
Proxy
and
annual
meeting
3
Miscellaneous
35
Waived
/
paid
by
Price
Associates
(1,268)
Total
expenses
5,859
Net
investment
income
15,809
T.
ROWE
PRICE
Global
Allocation
Fund
The
accompanying
notes
are
an
integral
part
of
these
financial
statements.
Year
Ended
10/31/24
Realized
and
Unrealized
Gain
/
Loss
–
Net
realized
gain
(loss)
Securities
(net
of
foreign
taxes
of
$113)
34,288
Futures
3,612
Swaps
15
Options
written
(5,409)
Forward
currency
exchange
contracts
(24)
Foreign
currency
transactions
(48)
Capital
gain
distributions
from
mutual
funds
1,357
Net
realized
gain
33,791
Change
in
net
unrealized
gain
/
loss
Securities
(net
of
increase
in
deferred
foreign
taxes
of
$190)
107,066
Futures
(55)
Swaps
2
Options
written
(230)
Forward
currency
exchange
contracts
(230)
Other
assets
and
liabilities
denominated
in
foreign
currencies
13
Change
in
net
unrealized
gain
/
loss
106,566
Net
realized
and
unrealized
gain
/
loss
140,357
INCREASE
IN
NET
ASSETS
FROM
OPERATIONS
$
156,166
T.
ROWE
PRICE
Global
Allocation
Fund
Statement
of
Changes
in
Net
Assets
Year
.
.
.
.
.
.
.
.
.
.
.
.
.
.
Ended
.
.
.
.
.
.
.
.
.
.
.
.
.
.
10/31/24
10/31/23
Increase
(Decrease)
in
Net
Assets
Operations
Net
investment
income
$
15,809
$
17,843
Net
realized
gain
33,791
14,667
Change
in
net
unrealized
gain
/
loss
106,566
41,953
Increase
in
net
assets
from
operations
156,166
74,463
Distributions
to
shareholders
Net
earnings
Investor
Class
(12,874)
(22,307)
Advisor
Class
(84)
(123)
I
Class
(8,544)
(8,145)
Decrease
in
net
assets
from
distributions
(21,502)
(30,575)
Capital
share
transactions
*
Shares
sold
Investor
Class
71,838
83,180
Advisor
Class
923
957
I
Class
43,170
96,320
Distributions
reinvested
Investor
Class
12,046
14,937
Advisor
Class
73
116
I
Class
8,400
7,911
Shares
redeemed
Investor
Class
(145,797)
(350,350)
Advisor
Class
(1,619)
(2,281)
I
Class
(84,177)
(76,750)
Decrease
in
net
assets
from
capital
share
transactions
(95,143)
(225,960)
T.
ROWE
PRICE
Global
Allocation
Fund
Statement
of
Changes
in
Net
Assets
The
accompanying
notes
are
an
integral
part
of
these
financial
statements.
Year
.
.
.
.
.
.
.
.
.
.
.
.
.
.
Ended
.
.
.
.
.
.
.
.
.
.
.
.
.
.
10/31/24
10/31/23
Net
Assets
Increase
(decrease)
during
period
39,521
(182,072)
Beginning
of
period
772,554
954,626
End
of
period
$
812,075
$
772,554
*Share
information
(000s)
Shares
sold
Investor
Class
4,819
6,218
Advisor
Class
61
72
I
Class
2,908
7,166
Distributions
reinvested
Investor
Class
851
1,166
Advisor
Class
5
9
I
Class
594
617
Shares
redeemed
Investor
Class
(9,803)
(25,479)
Advisor
Class
(110)
(170)
I
Class
(5,727)
(5,727)
Decrease
in
shares
outstanding
(6,402)
(16,128)
T.
ROWE
PRICE
Global
Allocation
Fund
NOTES
TO
FINANCIAL
STATEMENTS
T.
Rowe
Price
Global
Allocation
Fund,
Inc. (the
fund) is
registered
under
the
Investment
Company
Act
of
1940
(the
1940
Act)
as a
diversified, open-
end
management
investment
company. The
fund
seeks long-term
capital
appreciation
and
income.
The
fund
has three classes
of
shares:
the
Global
Allocation
Fund
(Investor
Class),
the
Global
Allocation
Fund–Advisor
Class
(Advisor
Class)
and
the
Global
Allocation
Fund–I
Class
(I
Class).
Advisor
Class
shares
are
sold
only
through
various
brokers
and
other
financial
intermediaries.
I
Class
shares
require
a
$500,000
initial
investment
minimum,
although
the
minimum
generally
is
waived
or
reduced
for
financial
intermediaries,
eligible
retirement
plans,
and
certain
other
accounts.
The
Advisor
Class
operates
under
a
Board-approved
Rule
12b-1
plan
pursuant
to
which
the
class
compensates
financial
intermediaries
for
distribution,
shareholder
servicing,
and/or
certain
administrative
services;
the
Investor
and
I
Classes
do
not
pay
Rule
12b-1
fees. Each
class
has
exclusive
voting
rights
on
matters
related
solely
to
that
class;
separate
voting
rights
on
matters
that
relate
to
all
classes;
and,
in
all
other
respects,
the
same
rights
and
obligations
as
the
other
classes.
NOTE
1
-
SIGNIFICANT
ACCOUNTING
POLICIES
Basis
of
Preparation
The fund
is
an
investment
company
and
follows
accounting
and
reporting
guidance
in
the
Financial
Accounting
Standards
Board
(FASB)
Accounting
Standards
Codification
Topic
946
(ASC
946).
The
accompanying
financial
statements
were
prepared
in
accordance
with
accounting
principles
generally
accepted
in
the
United
States
of
America
(GAAP),
including,
but
not
limited
to,
ASC
946.
GAAP
requires
the
use
of
estimates
made
by
management.
Management
believes
that
estimates
and
valuations
are
appropriate;
however,
actual
results
may
differ
from
those
estimates,
and
the
valuations
reflected
in
the
accompanying
financial
statements
may
differ
from
the
value
ultimately
realized
upon
sale
or
maturity.
Investment
Transactions,
Investment
Income,
and
Distributions
Investment
transactions
are
accounted
for
on
the
trade
date
basis.
Income
and
expenses
are
recorded
on
the
accrual
basis.
Realized
gains
and
losses
are
reported
on
the
identified
cost
basis. Premiums
and
discounts
on
debt
securities
are
amortized
for
financial
reporting
purposes. Paydown
gains
and
losses
are
recorded
as
an
adjustment
to
interest
income. Inflation
adjustments
to
the
principal
amount
of
inflation-indexed
bonds
are
reflected
as
interest
income. Income
tax-related
interest
and
penalties,
if
incurred,
are
T.
ROWE
PRICE
Global
Allocation
Fund
recorded
as
income
tax
expense. Dividends
received
from other
investment
companies are
reflected
as
dividend income;
capital
gain
distributions
are
reflected
as
realized
gain/loss. Dividend
income and
capital
gain
distributions
are
recorded
on
the
ex-dividend
date. Earnings
on
investments
recognized
as
partnerships
for
federal
income
tax
purposes
reflect
the
tax
character
of
such
earnings. Distributions
from
REITs
are
initially
recorded
as
dividend
income
and,
to
the
extent
such
represent
a
return
of
capital
or
capital
gain
for
tax
purposes,
are
reclassified
when
such
information
becomes
available. Non-cash
dividends,
if
any,
are
recorded
at
the
fair
market
value
of
the
asset
received. Proceeds
from
litigation
payments,
if
any,
are
included
in
either
net
realized
gain
(loss)
or
change
in
net
unrealized
gain/loss
from
securities. Distributions
to
shareholders
are
recorded
on
the
ex-dividend
date. Income
distributions,
if
any,
are
declared
and
paid
by
each
class annually. A
capital
gain
distribution,
if
any, may
also
be
declared
and
paid
by
the
fund
annually.
Currency
Translation
Assets,
including
investments,
and
liabilities
denominated
in
foreign
currencies
are
translated
into
U.S.
dollar
values
each
day
at
the
prevailing
exchange
rate,
using
the
mean
of
the
bid
and
asked
prices
of
such
currencies
against
U.S.
dollars
as
provided
by
an
outside
pricing
service.
Purchases
and
sales
of
securities,
income,
and
expenses
are
translated
into
U.S.
dollars
at
the
prevailing
exchange
rate
on
the
respective
date
of
such
transaction.
The
effect
of
changes
in
foreign
currency
exchange
rates
on
realized
and
unrealized
security
gains
and
losses
is
not
bifurcated
from
the
portion
attributable
to
changes
in
market
prices.
Class
Accounting
Shareholder
servicing,
prospectus,
and
shareholder
report
expenses
incurred
by
each
class
are
charged
directly
to
the
class
to
which
they
relate.
Expenses
common
to
all
classes,
investment
income,
and
realized
and
unrealized
gains
and
losses
are
allocated
to
the
classes
based
upon
the
relative
daily
net
assets
of
each
class.
The
Advisor
Class
pays
Rule
12b-1
fees,
in
an
amount
not
exceeding
0.25%
of
the
class’s
average
daily
net
assets.
Capital
Transactions
Each
investor’s
interest
in
the
net
assets
of the
fund
is
represented
by
fund
shares. The
fund’s
net
asset
value
(NAV)
per
share
is
computed
at
the
close
of
the
New
York
Stock
Exchange
(NYSE),
normally
4
p.m.
Eastern
time,
each
day
the
NYSE
is
open
for
business.
However,
the
NAV
per
share
may
be
calculated
at
a
time
other
than
the
normal
close
of
the
NYSE
if
trading
on
the
NYSE
is
restricted,
if
the
NYSE
closes
earlier,
or
as
may
be
permitted
by
the
SEC.
Purchases
and
redemptions
of
fund
shares
are
transacted
at
the
next-computed
NAV
per
share,
after
receipt
of
the
transaction
order
by
T.
Rowe
Price
Associates,
Inc.,
or
its
agents.
T.
ROWE
PRICE
Global
Allocation
Fund
New
Accounting
Guidance
In
November
2023,
the
FASB
issued
Accounting
Standards
Update
(ASU),
ASU
2023-07,
Segment
Reporting
(Topic
280)
–
Improvements
to
Reportable
Segment
Disclosures,
which
improves
reportable
segment
disclosure
requirements,
primarily
through
enhanced
disclosures
about
segment
expenses.
In
addition,
the
ASU
clarifies
that
a
public
entity
with
a
single
reportable
segment
provide
all
disclosures
required
by
the
ASU
and
all
existing
segment
disclosures
in
Topic
280.
The
amendments
under
this
ASU
are
effective
for
fiscal
years
beginning
after
December
15,
2023.
Management
expects
that
adoption
of
the
guidance
will
not
have
a
material
impact
on
the
fund’s
financial
statements.
Indemnification
In
the
normal
course
of
business, the
fund
may
provide
indemnification
in
connection
with
its
officers
and
directors,
service
providers,
and/or
private
company
investments. The
fund’s
maximum
exposure
under
these
arrangements
is
unknown;
however,
the
risk
of
material
loss
is
currently
considered
to
be
remote.
NOTE
2
-
VALUATION
Fair
Value
The
fund’s
financial
instruments
are
valued
at
the
close
of
the
NYSE
and
are
reported
at
fair
value,
which
GAAP
defines
as
the
price
that
would
be
received
to
sell
an
asset
or
paid
to
transfer
a
liability
in
an
orderly
transaction
between
market
participants
at
the
measurement
date. The fund’s
Board
of
Directors
(the
Board)
has
designated
T.
Rowe
Price
Associates,
Inc.
as
the
fund’s
valuation
designee
(Valuation
Designee).
Subject
to
oversight
by
the
Board,
the
Valuation
Designee
performs
the
following
functions
in
performing
fair
value
determinations:
assesses
and
manages
valuation
risks;
establishes
and
applies
fair
value
methodologies;
tests
fair
value
methodologies;
and
evaluates
pricing
vendors
and
pricing
agents.
The
duties
and
responsibilities
of
the
Valuation
Designee
are
performed
by
its
Valuation
Committee. The
Valuation
Designee provides
periodic
reporting
to
the
Board
on
valuation
matters.
Various
valuation
techniques
and
inputs
are
used
to
determine
the
fair
value
of
financial
instruments.
GAAP
establishes
the
following
fair
value
hierarchy
that
categorizes
the
inputs
used
to
measure
fair
value:
Level
1
–
quoted
prices
(unadjusted)
in
active
markets
for
identical
financial
instruments
that
the
fund
can
access
at
the
reporting
date
T.
ROWE
PRICE
Global
Allocation
Fund
Level
2
–
inputs
other
than
Level
1
quoted
prices
that
are
observable,
either
directly
or
indirectly
(including,
but
not
limited
to,
quoted
prices
for
similar
financial
instruments
in
active
markets,
quoted
prices
for
identical
or
similar
financial
instruments
in
inactive
markets,
interest
rates
and
yield
curves,
implied
volatilities,
and
credit
spreads)
Level
3
–
unobservable
inputs
(including
the Valuation
Designee’s assumptions
in
determining
fair
value)
Observable
inputs
are
developed
using
market
data,
such
as
publicly
available
information
about
actual
events
or
transactions,
and
reflect
the
assumptions
that
market
participants
would
use
to
price
the
financial
instrument.
Unobservable
inputs
are
those
for
which
market
data
are
not
available
and
are
developed
using
the
best
information
available
about
the
assumptions
that
market
participants
would
use
to
price
the
financial
instrument.
GAAP
requires
valuation
techniques
to
maximize
the
use
of
relevant
observable
inputs
and
minimize
the
use
of
unobservable
inputs.
When
multiple
inputs
are
used
to
derive
fair
value,
the
financial
instrument
is
assigned
to
the
level
within
the
fair
value
hierarchy
based
on
the
lowest-level
input
that
is
significant
to
the
fair
value
of
the
financial
instrument.
Input
levels
are
not
necessarily
an
indication
of
the
risk
or
liquidity
associated
with
financial
instruments
at
that
level
but
rather
the
degree
of
judgment
used
in
determining
those
values.
Valuation
Techniques
Equity
securities,
including
exchange-traded
funds, listed
or
regularly
traded
on
a
securities
exchange
or
in
the
over-the-
counter
(OTC)
market
are
valued
at
the
last
quoted
sale
price
or,
for
certain
markets,
the
official
closing
price
at
the
time
the
valuations
are
made.
OTC
Bulletin
Board
securities
are
valued
at
the
mean
of
the
closing
bid
and
asked
prices.
A
security
that
is
listed
or
traded
on
more
than
one
exchange
is
valued
at
the
quotation
on
the
exchange
determined
to
be
the
primary
market
for
such
security.
Listed
securities
not
traded
on
a
particular
day
are
valued
at
the
mean
of
the
closing
bid
and
asked
prices
for
domestic
securities
and
the
last
quoted
sale
or
closing
price
for
international
securities.
The
last
quoted
prices
of
non-U.S.
equity
securities
may
be
adjusted
to
reflect
the
fair
value
of
such
securities
at
the
close
of
the
NYSE,
if
the Valuation
Designee
determines
that
developments
between
the
close
of
a
foreign
market
and
the
close
of
the
NYSE
will
affect
the
value
of
some
or
all
of
the
fund’s portfolio
securities.
Each
business
day,
the
Valuation
Designee uses
information
from
outside
pricing
services
to
evaluate
the
quoted
prices
of
portfolio
securities
and,
if
appropriate,
decide whether
it
is
necessary
to
adjust
quoted
prices
to
reflect
fair
value
by
reviewing
a
variety
of
factors,
including
T.
ROWE
PRICE
Global
Allocation
Fund
developments
in
foreign
markets,
the
performance
of
U.S.
securities
markets,
and
the
performance
of
instruments
trading
in
U.S.
markets
that
represent
foreign
securities
and
baskets
of
foreign
securities. The Valuation
Designee
uses
outside
pricing
services
to
provide
it
with
quoted
prices
and
information
to
evaluate
or
adjust
those
prices.
The Valuation
Designee
cannot
predict
how
often
it
will
use
quoted
prices
and
how
often
it
will
determine
it
necessary
to
adjust
those
prices
to
reflect
fair
value.
Debt
securities
generally
are
traded
in
the over-the-counter
(OTC)
market
and
are
valued
at
prices
furnished
by
independent
pricing
services
or
by
broker
dealers
who
make
markets
in
such
securities.
When
valuing
securities,
the
independent
pricing
services
consider
factors
such
as,
but
not
limited
to,
the
yield
or
price
of
bonds
of
comparable
quality,
coupon,
maturity,
and
type,
as
well
as
prices
quoted
by
dealers
who
make
markets
in
such
securities.
Investments
in
mutual
funds
are
valued
at
the
mutual
fund’s
closing
NAV
per
share
on
the
day
of
valuation.
Investments
in
private
investment
companies
are
valued
at
the
investee’s
NAV
per
share
as
of
the
valuation
date,
if
available.
If
the
investee’s
NAV
is
not
available
as
of
the
valuation
date
or
is
not
calculated
in
accordance
with
GAAP,
the
Valuation Designee
may
adjust
the
investee’s
NAV
to
reflect
fair
value
at
the
valuation
date.
Listed
options,
and
OTC
options
with
a
listed
equivalent,
are
valued
at
the
mean
of
the
closing
bid
and
asked
prices
and
exchange-traded
options
on
futures
contracts
are
valued
at
closing
settlement
prices.
Futures
contracts
are
valued
at
closing
settlement
prices.
Forward
currency
exchange
contracts
are
valued
using
the
prevailing
forward
exchange
rate.
Swaps
are
valued
at
prices
furnished
by
an
independent
pricing
service
or
independent
swap
dealers.
Assets
and
liabilities
other
than
financial
instruments,
including
short-term
receivables
and
payables,
are
carried
at
cost,
or
estimated
realizable
value,
if
less,
which
approximates
fair
value.
Investments
for
which
market
quotations are
not
readily
available
or
deemed
unreliable
are
valued
at
fair
value
as
determined
in
good
faith
by
the
Valuation
Designee.
The
Valuation
Designee
has
adopted
methodologies
for
determining
the
fair
value
of
investments
for
which
market
quotations
are
not
readily
available
or
deemed
unreliable,
including
the
use
of
other
pricing
sources.
Factors
used
in
determining
fair
value
vary
by
type
of
investment
and
may
include
market
or
investment
specific
considerations.
The
Valuation
Designee typically
will
afford
greatest
weight
to
actual
prices
in
arm’s
length
transactions,
to
the
extent
they
represent
orderly
transactions
between
market
participants,
transaction
information
can
be
reliably
obtained,
and
prices
are
deemed
representative
of
fair
value.
However,
the
Valuation
Designee may
also
T.
ROWE
PRICE
Global
Allocation
Fund
consider
other
valuation
methods
such
as
market-based
valuation
multiples;
a
discount
or
premium
from
market
value
of
a
similar,
freely
traded
security
of
the
same
issuer;
discounted
cash
flows;
yield
to
maturity;
or
some
combination.
Fair
value
determinations
are
reviewed
on
a
regular
basis.
Because
any
fair
value
determination
involves
a
significant
amount
of
judgment,
there
is
a
degree
of
subjectivity
inherent
in
such
pricing
decisions. Fair
value
prices
determined
by
the
Valuation
Designee could
differ
from
those
of
other
market
participants,
and
it
is
possible
that
the
fair
value
determined
for
a
security
may
be
materially
different
from
the
value
that
could
be
realized
upon
the
sale
of
that
security.
Valuation
Inputs
The
following
table
summarizes
the
fund’s
financial
instruments,
based
on
the
inputs
used
to
determine
their
fair
values
on
October
31,
2024
(for
further
detail
by
category,
please
refer
to
the
accompanying
Portfolio
of
Investments):
T.
ROWE
PRICE
Global
Allocation
Fund
($000s)
Level
1
Level
2
Level
3
Total
Value
Assets
Closed-End
Mutual
Funds
$
—
$
26
$
—
$
26
Fixed
Income
Securities
1
—
97,087
—
97,087
Bond
Mutual
Funds
126,251
—
—
126,251
Common
Stocks
280,057
163,086
167
443,310
Convertible
Preferred
Stocks
—
—
1,684
1,684
Equity
Mutual
Funds
64,502
—
—
64,502
Non-U.S.
Government
Mortgage-Backed
Securities
—
5,358
106
5,464
Preferred
Stocks
—
465
—
465
Private
Investment
Companies
—
—
62,643
62,643
Short-Term
Investments
9,297
—
—
9,297
Securities
Lending
Collateral
5,564
—
—
5,564
Total
Securities
485,671
266,022
64,600
816,293
Swaps*
—
3
—
3
Forward
Currency
Exchange
Contracts
—
40
—
40
Futures
Contracts*
517
—
—
517
Total
$
486,188
$
266,065
$
64,600
$
816,853
Liabilities
Options
Written
$
—
$
1,087
$
—
$
1,087
Swaps*
—
1
—
1
Forward
Currency
Exchange
Contracts
—
179
—
179
Futures
Contracts*
337
—
—
337
Total
$
337
$
1,267
$
—
$
1,604
1
Includes
Asset-Backed
Securities,
Corporate
Bonds,
Foreign
Government
Obligations
&
Municipalities,
Government
Bonds,
Municipal
Securities
and
U.S.
Government
Agency
Obligations
(Excluding
Mortgage-Backed).
T.
ROWE
PRICE
Global
Allocation
Fund
Following
is
a
reconciliation
of
the
fund’s
Level
3
holdings
for
the
year ended
October
31,
2024.
Gain
(loss)
reflects
both
realized
and
change
in
unrealized
gain/loss
on
Level
3
holdings
during
the
period,
if
any,
and
is
included
on
the
accompanying
Statement
of
Operations.
The
change
in
unrealized
gain/loss
on
Level
3
instruments
held
at
October
31,
2024,
totaled $5,107,000 for
the
year ended
October
31,
2024.
In
accordance
with
GAAP,
the
following
table
provides
quantitative
information
about
significant
unobservable
inputs
used
to
determine
the
fair
valuations
of
the
fund’s
Level
3
assets,
by
class
of
financial
instrument.
Because
the
Valuation
Designee considers
a
wide
variety
of
factors
and
inputs,
both
observable
and
unobservable,
in
determining
fair
values,
the
unobservable
inputs
presented
do
not
reflect
all
inputs
significant
to
the
fair
value
determination.
*
The
fair
value
presented
includes
cumulative
gain
(loss)
on
open
futures
contracts
and
centrally
cleared
swaps;
however,
the
net
value
reflected
on
the
accompanying
Portfolio
of
Investments
is
only
the
unsettled
variation
margin
receivable
(payable)
at
that
date.
($000s)
Beginning
Balance
10/31/23
Gain
(Loss)
During
Period
Total
Purchases
Total
Sales
Ending
Balance
10/31/24
Investment
in
Securities
Common
Stocks
$
156
$
86
$
—
$
(75)
$
167
Convertible
Preferred
Stocks
1,372
240
82
(10)
1,684
Non-U.S.
Government
Mortgage-
Backed
Securities
—
—
110
(4)
106
Private
Investment
Companies
59,932
5,711
—
(3,000)
62,643
Total
$
61,460
$
6,037
$
192
$
(3,089)
$
64,600
T.
ROWE
PRICE
Global
Allocation
Fund
Investments
in
Securities
Value
(000s)
Valuation
Technique(s)+
Significant
Unobservable
Input(s)
Value
or
Range
of
Input(s)
Weighted
Average
of
Input(s)*
Impact
to
Valuation
from
an
Increase
in
Input**
Common
Stocks
$167
Recent
comparable
transaction
price(s)
—#
—#
—#
—#
Discount
for
uncertainty
100%
100%
Decrease
Discount
for
lack
of
marketability
100%
100%
Decrease
Market
comparable
Probability
for
potential
outcome
20%
20%
Increase
Enterprise
value
to
gross
profit
multiple
5.0x
–
13.3x
11.5x
Increase
Gross
profit
growth
rate
25%
-
29%
29%
Increase
Enterprise
value
to
sales
multiple
1.7x
–
10.8x
9.1x
Increase
Sales
growth
rate
24%
-
29%
29%
Increase
Premium
to
public
company
multiples
25%
25%
Increase
Discount
for
liquidation
preference
—#
—#
—#
Discount
for
uncertainty
100%
100%
Decrease
Discount
for
lack
of
marketability
10%
10%
Decrease
T.
ROWE
PRICE
Global
Allocation
Fund
Investments
in
Securities
Value
(000s)
Valuation
Technique(s)+
Significant
Unobservable
Input(s)
Value
or
Range
of
Input(s)
Weighted
Average
of
Input(s)*
Impact
to
Valuation
from
an
Increase
in
Input**
Convertible
Preferred
Stocks
$
1,684
Recent
comparable
transaction
price(s)
—#
—#
—#
—#
Conversion
ratio
—#
—#
—#
Discount
for
uncertainty
20%
20%
Decrease
Market
comparable
Premium
to
public
company
multiples
15%
-
30%
24%
Increase
Enterprise
value
to
gross
profit
multiple
6.4x
–
20.1x
16.7x
Increase
Projected
enterprise
value
to
gross
profit
multiple
6.8x
–
8.4x
7.6x
Increase
Gross
profit
growth
rate
23%
-
55%
46%
Increase
Enterprise
value
to
sales
multiple
1.9x
–
15.4x
5.4x
Increase
Projected
enterprise
value
to
sales
multiple
2.6x
–
5.1x
3.0x
Increase
Sales
growth
rate
19%
-
55%
31%
Increase
Enterprise
value
to
EBIT
multiple
8.4x
–
11.0x
10.1x
Increase
EBIT
growth
rate
26%
26%
Increase
T.
ROWE
PRICE
Global
Allocation
Fund
+
Valuation
techniques
may
change
in
order
to
reflect the
Valuation
Designee’s
judgment
of
current
market
participant
assumptions.
*
Unobservable
inputs
were
weighted
by
the
relative
fair
value
of
the
instruments.
**
Represents
the
directional
change
in
the
fair
value
of
the
Level
3
investment(s)
that
would
have
resulted
from
an
increase
in
the
corresponding
input
at
period
end.
A
decrease
in
the
unobservable
input
would
have
had
the
opposite
effect.
Significant
increases
and
decreases
in
these
inputs
in
isolation
could
result
in
significantly
higher
or
lower
fair
value
measurements.
#
No
quantitative
unobservable
inputs
significant
to
the
valuation
technique
were
created
by
the
Valuation
Designee.
Investments
in
Securities
Value
(000s)
Valuation
Technique(s)+
Significant
Unobservable
Input(s)
Value
or
Range
of
Input(s)
Weighted
Average
of
Input(s)*
Impact
to
Valuation
from
an
Increase
in
Input**
Projected
enterprise
value
to
EBITDA
multiple
11.3x
–
25.0x
20.5x
Increase
Discount
for
dilution
43%
43%
Decrease
Discount
to
public
company
multiples
25%
25%
Decrease
Discount
rate
for
cost
of
capital
15%
-
25%
21%
Decrease
Discount
for
uncertainty
10%
-
60%
35%
Decrease
Discount
for
lack
of
marketability
10%
10%
Decrease
Mortgage-
Backed
Securities
$
106
Recent
comparable
transaction
price(s)
—#
—#
—#
—#
Private
Investment
Companies
$
62,643
Rollforward
of
Investee
NAV
Estimated
return
0.80%
0.80%
Increase
T.
ROWE
PRICE
Global
Allocation
Fund
NOTE
3
-
DERIVATIVE
INSTRUMENTS
During
the
year ended
October
31,
2024,
the
fund
invested
in
derivative
instruments.
As
defined
by
GAAP,
a
derivative
is
a
financial
instrument
whose
value
is
derived
from
an
underlying
security
price,
foreign
exchange
rate,
interest
rate,
index
of
prices
or
rates,
or
other
variable;
it
requires
little
or
no
initial
investment
and
permits
or
requires
net
settlement
or
delivery
of
cash
or
other
assets.
The
fund
invests
in
derivatives
only
if
the
expected
risks
and
rewards
are
consistent
with
its
investment
objectives,
policies,
and
overall
risk
profile,
as
described
in
its
prospectus
and
Statement
of
Additional
Information.
The
fund
may
use
derivatives
for
a
variety
of
purposes
and
may
use
them
to
establish
both
long
and
short
positions
within
the
fund’s
portfolio.
Potential
uses
include
to
hedge
against
declines
in
principal
value,
increase
yield,
invest
in
an
asset
with
greater
efficiency
and
at
a
lower
cost
than
is
possible
through
direct
investment,
to
enhance
return,
or
to
adjust
credit
exposure.
The
risks
associated
with
the
use
of
derivatives
are
different
from,
and
potentially
much
greater
than,
the
risks
associated
with
investing
directly
in
the
instruments
on
which
the
derivatives
are
based.
The
fund
values
its
derivatives
at
fair
value
and
recognizes
changes
in
fair
value
currently
in
its
results
of
operations.
Accordingly,
the
fund
does
not
follow
hedge
accounting,
even
for
derivatives
employed
as
economic
hedges.
Generally,
the
fund
accounts
for
its
derivatives
on
a
gross
basis.
It
does
not
offset
the
fair
value
of
derivative
liabilities
against
the
fair
value
of
derivative
assets
on
its
financial
statements,
nor
does
it
offset
the
fair
value
of
derivative
instruments
against
the
right
to
reclaim
or
obligation
to
return
collateral.
The
following
table
summarizes
the
fair
value
of
the
fund’s
derivative
instruments
held
as
of
October
31,
2024,
and
the
related
location
on
the
accompanying
Statement
of
Assets
and
Liabilities,
presented
by
primary
underlying
risk
exposure:
T.
ROWE
PRICE
Global
Allocation
Fund
($000s)
Location
on
Statement
of
Assets
and
Liabilities
Fair
Value*
Assets
Inflation
derivatives
Centrally
Cleared
Swaps
$
1
Interest
rate
derivatives
Futures
88
Foreign
exchange
derivatives
Forwards
40
Credit
derivatives
Centrally
Cleared
Swaps
2
Equity
derivatives
Futures
429
*
Total
$
560
*
Liabilities
Interest
rate
derivatives
Futures
$
337
Foreign
exchange
derivatives
Forwards
179
Credit
derivatives
Centrally
Cleared
Swaps,
Options
Written
79
Equity
derivatives
Options
Written
1,009
Total
$
1,604
*
The
fair
value
presented
includes
cumulative
gain
(loss)
on
open
futures
contracts
and
centrally
cleared
swaps;
however,
the
value
reflected
on
the
accompanying
Statement
of
Assets
and
Liabilities
is
only
the
unsettled
variation
margin
receivable
(payable)
at
that
date.
T.
ROWE
PRICE
Global
Allocation
Fund
Additionally,
the
amount
of
gains
and
losses
on
derivative
instruments
recognized
in
fund
earnings
during
the
year ended
October
31,
2024,
and
the
related
location
on
the
accompanying
Statement
of
Operations
is
summarized
in
the
following
table
by
primary
underlying
risk
exposure:
Counterparty
Risk
and
Collateral
The
fund
invests
in
derivatives
in
various
markets,
which
expose
it
to
differing
levels
of
counterparty
risk.
Counterparty
risk
on
exchange-traded
and
centrally
cleared
derivative
contracts,
such
as
futures,
exchange-traded
options,
and
centrally
cleared
swaps,
is
minimal
because
the
clearinghouse
provides
protection
against
counterparty
defaults.
For
futures
and
centrally
cleared
swaps,
the
fund
is
required
to
deposit
collateral
in
an
amount
specified
by
the
clearinghouse
and
the
clearing
firm
(margin
($000s)
Location
of
Gain
(Loss)
on
Statement
of
Operations
Options
Written
Futures
Forward
Currency
Exchange
Contracts
Swaps
Total
Realized
Gain
(Loss)
Interest
rate
derivatives
$
38
$
211
$
—
$
—
$
249
Foreign
exchange
derivatives
—
—
(24)
—
(24)
Credit
derivatives
—
—
—
15
15
Equity
derivatives
(5,447)
3,401
—
—
(2,046)
Total
$
(5,409)
$
3,612
$
(24)
$
15
$
(1,806)
Change
in
Unrealized
Gain
(Loss)
Inflation
derivatives
$
—
$
—
$
—
$
1
$
1
Interest
rate
derivatives
(1)
44
—
—
43
Foreign
exchange
derivatives
—
—
(230)
—
(230)
Credit
derivatives
(12)
—
—
1
(11)
Equity
derivatives
(217)
(99)
—
—
(316)
Total
$
(230)
$
(55)
$
(230)
$
2
$
(513)
T.
ROWE
PRICE
Global
Allocation
Fund
requirement),
and
the
margin
requirement
must
be
maintained
over
the
life
of
the
contract.
Each
clearinghouse
and
clearing
firm,
in
its
sole
discretion,
may
adjust
the
margin
requirements
applicable
to
the
fund.
Derivatives,
such
as
non-cleared bilateral
swaps,
forward
currency
exchange
contracts,
and
OTC
options,
that
are
transacted
and
settle
directly
with
a
counterparty
(bilateral
derivatives)
may
expose
the
fund
to
greater
counterparty
risk.
To
mitigate
this
risk,
the
fund
has
entered
into
master
netting
arrangements
(MNAs)
with
certain
counterparties
that
permit
net
settlement
under
specified
conditions
and,
for
certain
counterparties,
also
require
the
exchange
of
collateral
to
cover
mark-to-market
exposure.
MNAs
may
be
in
the
form
of
International
Swaps
and
Derivatives
Association
master
agreements
(ISDAs)
or
foreign
exchange
letter
agreements
(FX
letters).
MNAs
provide
the
ability
to
offset
amounts
the
fund
owes
a
counterparty
against
amounts
the
counterparty
owes
the
fund
(net
settlement).
Both
ISDAs
and
FX
letters
generally
allow
termination
of
transactions
and
net
settlement
upon
the
occurrence
of
contractually
specified
events,
such
as
failure
to
pay
or
bankruptcy.
In
addition,
ISDAs
specify
other
events,
the
occurrence
of
which
would
allow
one
of
the
parties
to
terminate.
For
example,
a
downgrade
in
credit
rating
of
a
counterparty
below
a
specified
rating
would
allow
the
fund
to
terminate,
while
a
decline
in
the
fund’s
net
assets
of
more
than
a
specified
percentage
would
allow
the
counterparty
to
terminate.
Upon
termination,
all
transactions
with
that
counterparty
would
be
liquidated
and
a
net
termination
amount
settled.
ISDAs
typically
include
collateral
agreements
whereas
FX
letters
do
not.
Collateral
requirements
are
determined
daily
based
on
the
net
aggregate
unrealized
gain
or
loss
on
all
bilateral
derivatives
with
a
counterparty,
subject
to
minimum
transfer
amounts
that
typically
range
from
$100,000
to
$250,000.
Any
additional
collateral
required
due
to
changes
in
security
values
is
typically
transferred
the
next
business
day.
Collateral
may
be
in
the
form
of
cash
or
debt
securities
issued
by
the
U.S.
government
or
related
agencies,
although
other
securities
may
be
used
depending
on
the
terms
outlined
in
the
applicable
MNA.
Cash
posted
by
the
fund
is
reflected
as
cash
deposits
in
the
accompanying
financial
statements
and
generally
is
restricted
from
withdrawal
by
the
fund;
securities
posted
by
the
fund
are
so
noted
in
the
accompanying
Portfolio
of
Investments;
both
remain
in
the
fund’s
assets.
Collateral
pledged
by
counterparties
is
not
included
in
the
fund’s
assets
because
the
fund
does
not
obtain
effective
control
over
those
assets.
For
bilateral
derivatives,
collateral
posted
or
received
by
the
fund
is
held
in
a
segregated
account
at
the
fund’s
custodian.
While
typically
not
sold
in
the
T.
ROWE
PRICE
Global
Allocation
Fund
same
manner
as
equity
or
fixed
income
securities,
exchange-traded
or
centrally
cleared
derivatives
may
be
closed
out
only
on
the
exchange
or
clearinghouse
where
the
contracts
were
cleared,
and
OTC
and
bilateral
derivatives
may
be
unwound
with
counterparties
or
transactions
assigned
to
other
counterparties
to
allow
the
fund
to
exit
the
transaction.
This
ability
is
subject
to
the
liquidity
of
underlying
positions. As
of
October
31,
2024,
securities
valued
at $794,000 had
been
pledged
or
posted
by
the
fund
to
counterparties
for
bilateral
derivatives. As
of
October
31,
2024,
collateral
pledged
by
counterparties
to
the
fund
for
bilateral
derivatives
consisted
of
securities
valued
at
$1,239,000. As
of
October
31,
2024,
securities
valued
at $1,311,000
had
been
posted
by
the
fund
for
exchange-traded
and/or
centrally
cleared
derivatives.
Forward
Currency
Exchange
Contracts
The
fund
is
subject
to
foreign
currency
exchange
rate
risk
in
the
normal
course
of
pursuing
its
investment
objectives.
It may use
forward
currency
exchange
contracts
(forwards)
primarily
to
protect
its
non-U.S.
dollar-denominated
securities
from
adverse
currency
movements
or
to
increase
exposure
to
a
particular
foreign
currency,
to
shift
the
fund’s
foreign
currency
exposure
from
one
country
to
another,
or
to
enhance
the
fund’s
return.
A
forward
involves
an
obligation
to
purchase
or
sell
a
fixed
amount
of
a
specific
currency
on
a
future
date
at
a
price
set
at
the
time
of
the
contract.
Although
certain
forwards
may
be
settled
by
exchanging
only
the
net
gain
or
loss
on
the
contract,
most
forwards
are
settled
with
the
exchange
of
the
underlying
currencies
in
accordance
with
the
specified
terms.
Forwards
are
valued
at
the
unrealized
gain
or
loss
on
the
contract,
which
reflects
the
net
amount
the
fund
either
is
entitled
to
receive
or
obligated
to
deliver,
as
measured
by
the
difference
between
the
forward
exchange
rates
at
the
date
of
entry
into
the
contract
and
the
forward
rates
at
the
reporting
date.
Appreciated
forwards
are
reflected
as
assets
and
depreciated
forwards
are
reflected
as
liabilities
on
the
accompanying
Statement
of
Assets
and
Liabilities.
When
a
contract
is
closed,
a
realized
gain
or
loss
is
recorded
on
the
accompanying
Statement
of
Operations.
Risks
related
to
the
use
of
forwards
include
the
possible
failure
of
counterparties
to
meet
the
terms
of
the
agreements;
that
anticipated
currency
movements
will
not
occur,
thereby
reducing
the
fund’s
total
return;
and
the
potential
for
losses
in
excess
of
the
fund’s
initial
investment.
During
the
year ended
October
31,
2024,
the
volume
of
the
fund’s
activity
in
forwards,
based
on
underlying
notional
amounts,
was
generally
between
4%
and
6%
of
net
assets.
Futures
Contracts
The
fund
is
subject
to interest
rate
risk
and
equity
price
risk in
the
normal
course
of
pursuing
its
investment
objectives
and
uses
futures
contracts
to
help
manage
such
risks.
The fund
may
enter
into
futures
contracts
T.
ROWE
PRICE
Global
Allocation
Fund
to
manage
exposure
to
interest
rates,
security
prices,
and
foreign
currencies;
as
an
efficient
means
of
adjusting
exposure
to
all
or
part
of
a
target
market;
or
as
a
cash
management
tool. A
futures
contract
provides
for
the
future
sale
by
one
party
and
purchase
by
another
of
a
specified
amount
of
a
specific
underlying
financial
instrument
at
an
agreed-upon
price,
date,
time,
and
place.
The
fund
currently
invests
only
in
exchange-traded
futures,
which
generally
are
standardized
as
to
maturity
date,
underlying
financial
instrument,
and
other
contract
terms.
Payments
are
made
or
received
by
the
fund
each
day
to
settle
daily
fluctuations
in
the
value
of
the
contract
(variation
margin),
which
reflect
changes
in
the
value
of
the
underlying
financial
instrument.
Variation
margin
is
recorded
as
unrealized
gain
or
loss
until
the
contract
is
closed.
The
value
of
a
futures
contract
included
in
net
assets
is
the
amount
of
unsettled
variation
margin;
net
variation
margin
receivable
is
reflected
as
an
asset
and
net
variation
margin
payable
is
reflected
as
a
liability
on
the
accompanying
Statement
of
Assets
and
Liabilities.
When
a
contract
is
closed,
a
realized
gain
or
loss
is
recorded
on
the
accompanying
Statement
of
Operations.
Risks
related
to
the
use
of
futures
contracts
include
possible
illiquidity
of
the
futures
markets,
contract
prices
that
can
be
highly
volatile
and
imperfectly
correlated
to
movements
in
hedged
security
values
and/or
interest
rates,
and
potential
losses
in
excess
of
the
fund’s
initial
investment.
During
the
year ended
October
31,
2024,
the
volume
of
the
fund’s
activity
in
futures,
based
on
underlying
notional
amounts,
was
generally
between
2%
and
5%
of
net
assets.
Options
The
fund
is
subject
to interest
rate
risk,
credit
risk
and
equity
price
risk in
the
normal
course
of
pursuing
its
investment
objectives
and
uses
options
to
help
manage
such
risks.
The
fund
may
use
options
to
manage
exposure
to
security
prices,
interest
rates,
foreign
currencies,
and
credit
quality;
as
an
efficient
means
of
adjusting
exposure
to
all
or
a
part
of
a
target
market;
to
enhance
income;
as
a
cash
management
tool;
or
to
adjust
credit
exposure.
The
fund
may
buy
or
sell
options
that
can
be
settled
either
directly
with
the
counterparty
(OTC
option)
or
through
a
central
clearinghouse
(exchange-traded
option).
Options
are
included
in
net
assets
at
fair
value,
options
purchased
are
included
in
Investments
in
Securities,
and
options
written
are
separately
reflected
as
a
liability
on
the
accompanying
Statement
of
Assets
and
Liabilities.
Premiums
on
unexercised,
expired
options
are
recorded
as
realized
gains
or
losses
on
the
accompanying
Statement
of
Operations;
premiums
on
exercised
options
are
recorded
as
an
adjustment
to
the
proceeds
from
the
sale
or
cost
of
the
purchase.
The
difference
between
the
premium
and
the
amount
received
or
paid
in
a
closing
transaction
is
also
treated
as
realized
gain
or
loss
on
the
accompanying
Statement
of
Operations.
In
return
for
a
premium
paid,
call
and
T.
ROWE
PRICE
Global
Allocation
Fund
put
options
give
the
holder
the
right,
but
not
the
obligation,
to
purchase
or
sell,
respectively,
a
security
at
a
specified
exercise
price.
In
return
for
a
premium
paid,
call
and
put
options
on
futures
give
the
holder
the
right,
but
not
the
obligation,
to
purchase
or
sell,
respectively,
a
position
in
a
particular
futures
contract
at
a
specified
exercise
price.
In
return
for
a
premium
paid,
call
and
put
index
options
give
the
holder
the
right,
but
not
the
obligation,
to
receive
cash
equal
to
the
difference
between
the
value
of
the
reference
index
on
the
exercise
date
and
the
exercise
price
of
the
option. Risks related
to
the
use
of
options
include
possible
illiquidity
of
the
options
markets;
trading
restrictions
imposed
by
an
exchange
or
counterparty;
possible
failure
of
counterparties
to
meet
the
terms
of
the
agreements;
movements
in
the
underlying
asset
values,
interest
rates
and
credit
ratings;
and,
for
options
written,
the
potential
for
losses
to
exceed
any
premium
received
by
the
fund.
During
the
year ended
October
31,
2024,
the
volume
of
the
fund’s
activity
in
options,
based
on
underlying
notional
amounts,
was
generally
between
5%
and
7%
of
net
assets.
Swaps
The
fund
is
subject
to
credit
risk
and
inflation
risk in
the
normal
course
of
pursuing
its
investment
objectives
and
uses
swap
contracts
to
help
manage
such
risks.
The
fund
may
use
swaps
in
an
effort
to
manage
both
long
and
short
exposure
to
changes
in
interest
rates,
inflation
rates,
and
credit
quality;
to
adjust
overall
exposure
to
certain
markets;
to
enhance
total
return
or
protect
the
value
of
portfolio
securities;
to
serve
as
a
cash
management
tool;
or
to
adjust
credit
exposure.
Swap
agreements
can
be
settled
either
directly
with
the
counterparty
(bilateral
swap)
or
through
a
central
clearinghouse
(centrally
cleared
swap).
Fluctuations
in
the
fair
value
of
a
contract
are
reflected
in
unrealized
gain
or
loss
and
are
reclassified
to
realized
gain
or
loss
on
the
accompanying
Statement
of
Operations upon
contract
termination
or
cash
settlement.
Net
periodic
receipts
or
payments
required
by
a
contract
increase
or
decrease,
respectively,
the
value
of
the
contract
until
the
contractual
payment
date,
at
which
time
such
amounts
are
reclassified
from
unrealized
to
realized
gain
or
loss
on
the
accompanying
Statement
of
Operations.
For
bilateral
swaps,
cash
payments
are
made
or
received
by
the
fund
on
a
periodic
basis
in
accordance
with
contract
terms;
unrealized
gain
on
contracts
and
premiums
paid
are
reflected
as
assets
and
unrealized
loss
on
contracts
and
premiums
received
are
reflected
as
liabilities
on
the
accompanying
Statement
of
Assets
and
Liabilities.
For
bilateral
swaps,
premiums
paid
or
received
are
amortized
over
the
life
of
the
swap
and
are
recognized
as
realized
gain
or
loss
on
the
accompanying
Statement
of
Operations.
For
centrally
cleared
swaps,
payments
are
made
or
received
by
the
fund
each
day
to
settle
the
daily
fluctuation
in
the
value
of
the
contract
(variation
margin).
Accordingly,
the
value
of
a
centrally
cleared
swap
included
T.
ROWE
PRICE
Global
Allocation
Fund
in
net
assets
is
the
unsettled
variation
margin;
net
variation
margin
receivable
is
reflected
as
an
asset
and
net
variation
margin
payable
is
reflected
as
a
liability
on
the
accompanying
Statement
of
Assets
and
Liabilities.
Credit
default
swaps
are
agreements
where
one
party
(the
protection
buyer)
agrees
to
make
periodic
payments
to
another
party
(the
protection
seller)
in
exchange
for
protection
against
specified
credit
events,
such
as
certain
defaults
and
bankruptcies
related
to
an
underlying
credit
instrument,
or
issuer
or
index
of
such
instruments.
Upon
occurrence
of
a
specified
credit
event,
the
protection
seller
is
required
to
pay
the
buyer
the
difference
between
the
notional
amount
of
the
swap
and
the
value
of
the
underlying
credit,
either
in
the
form
of
a
net
cash
settlement
or
by
paying
the
gross
notional
amount
and
accepting
delivery
of
the
relevant
underlying
credit.
For
credit
default
swaps
where
the
underlying
credit
is
an
index,
a
specified
credit
event
may
affect
all
or
individual
underlying
securities
included
in
the
index
and
will
be
settled
based
upon
the
relative
weighting
of
the
affected
underlying
security(ies)
within
the
index. Generally,
the
payment
risk
for
the
seller
of
protection
is
inversely
related
to
the
current
market
price
or
credit
rating
of
the
underlying
credit
or
the
market
value
of
the
contract
relative
to
the
notional
amount,
which
are
indicators
of
the
markets’
valuation
of
credit
quality.
As
of
October
31,
2024,
the
notional
amount
of
protection
sold
by
the
fund
totaled $2,800,000
(0.3%
of
net
assets),
which
reflects
the
maximum
potential
amount
the
fund
could
be
required
to
pay
under
such
contracts.
Risks
related
to
the
use
of
credit
default
swaps
include
the
possible
inability
of
the
fund
to
accurately
assess
the
current
and
future
creditworthiness
of
underlying
issuers,
the
possible
failure
of
a
counterparty
to
perform
in
accordance
with
the
terms
of
the
swap
agreements,
potential
government
regulation
that
could
adversely
affect
the
fund’s
swap
investments,
and
potential
losses
in
excess
of
the
fund’s
initial
investment.
Zero-coupon
inflation
swaps
are
agreements
to
exchange
cash
flows,
on
the
contract’s
maturity
date,
based
on
the
difference
between
a
predetermined
fixed
rate
and
the
cumulative
change
in
the
consumer
price
index,
both
applied
to
a
notional
principal
amount
for
a
specified
period
of
time.
Risks
related
to
the
use
of
zero-coupon
inflation
swaps
include
the
potential
for
unanticipated
movements
in
inflation
rates,
the
possible
failure
of
a
counterparty
to
perform
in
accordance
with
the
terms
of
the
swap
agreements,
potential
government
regulation
that
could
adversely
affect
the
fund’s
swap
investments,
and
potential
losses
in
excess
of
the
fund’s
initial
investment.
T.
ROWE
PRICE
Global
Allocation
Fund
During
the
year ended
October
31,
2024,
the
volume
of
the
fund’s
activity
in
swaps,
based
on
underlying
notional
amounts,
was
generally
between
0%
and
1%
of
net
assets.
NOTE
4
-
OTHER
INVESTMENT
TRANSACTIONS
Consistent
with
its
investment
objective, the
fund
engages
in
the
following
practices
to
manage
exposure
to
certain
risks
and/or
to
enhance
performance.
The
investment
objective,
policies,
program,
and
risk
factors
of the
fund
are
described
more
fully
in the
fund’s prospectus
and
Statement
of
Additional
Information.
Restricted
Securities
The
fund
invests
in
securities
that
are
subject
to
legal
or
contractual
restrictions
on
resale.
Prompt
sale
of
such
securities
at
an
acceptable
price
may
be
difficult
and
may
involve
substantial
delays
and
additional
costs.
Collateralized
Loan
Obligations
The
fund
invests
in
collateralized
loan
obligations
(CLOs)
which
are
entities
backed
by
a
diversified
pool
of
syndicated
bank
loans.
The
cash
flows
of
the
CLO
can
be
split
into
multiple
segments,
called
“tranches”
or
“classes”,
which
will
vary
in
risk
profile
and
yield.
The
riskiest
segments,
which
are
the
subordinate
or
“equity”
tranches,
bear
the
greatest
risk
of
loss
from
defaults
in
the
underlying
assets
of
the
CLO
and
serve
to
protect
the
other,
more
senior,
tranches.
Senior
tranches
will
typically
have
higher
credit
ratings
and
lower
yields
than
the
securities
underlying
the
CLO.
Despite
the
protection
from
the
more
junior
tranches,
senior
tranches
can
experience
substantial
losses.
Mortgage-Backed
Securities
The
fund
invests
in
mortgage-backed
securities
(MBS
or
pass-through
certificates)
that
represent
an
interest
in
a
pool
of
specific
underlying
mortgage
loans
and
entitle
the
fund
to
the
periodic
payments
of
principal
and
interest
from
those
mortgages.
MBS
may
be
issued
by
government
agencies
or
corporations,
or
private
issuers.
Most
MBS
issued
by
government
agencies
are
guaranteed;
however,
the
degree
of
protection
differs
based
on
the
issuer.
MBS are
sensitive
to
changes
in
economic
conditions
that
affect
the
rate
of
prepayments
and
defaults
on
the
underlying
mortgages;
accordingly,
the
value,
income,
and
related
cash
flows
from
MBS
may
be
more
volatile
than
other
debt
instruments.
T.
ROWE
PRICE
Global
Allocation
Fund
TBA
Purchase,
Sale
Commitments
and
Forward
Settling
Mortgage
Obligations
The
fund
enters
into
to-be-announced
(TBA)
purchase
or
sale
commitments
(collectively,
TBA
transactions),
pursuant
to
which
it
agrees
to
purchase
or
sell,
respectively,
mortgage-backed
securities
for
a
fixed
unit
price,
with
payment
and
delivery
at
a
scheduled
future
date
beyond
the
customary
settlement
period
for
such
securities.
With
TBA
transactions,
the
particular
securities
to
be
received
or
delivered
by
the
fund
are
not
identified
at
the
trade
date;
however,
the
securities
must
meet
specified
terms,
including
rate
and
mortgage
term,
and
be
within
industry-accepted
“good
delivery”
standards.
The
fund
may
enter
into
TBA
transactions
with
the
intention
of
taking
possession
of
or
relinquishing
the
underlying
securities,
may
elect
to
extend
the
settlement
by
“rolling”
the
transaction,
and/or
may
use
TBA
transactions
to
gain
or
reduce
interim
exposure
to
underlying
securities.
To
mitigate
counterparty
risk,
the
fund
has
entered
into
Master
Securities
Forward
Transaction
Agreements
(MSFTA)
with
counterparties
that
provide
for
collateral
and
the
right
to
offset
amounts
due
to
or
from
those
counterparties
under
specified
conditions.
Subject
to
minimum
transfer
amounts,
collateral
requirements
are
determined
and
transfers
made
based
on
the
net
aggregate
unrealized
gain
or
loss
on
all
TBA
commitments
and
other
forward
settling
mortgage
obligations
with
a
particular
counterparty
(collectively,
MSFTA
Transactions).
At
any
time,
the
fund’s
risk
of
loss
from
a
particular
counterparty
related
to
its
MSFTA
Transactions
is
the
aggregate
unrealized
gain
on
appreciated
MSFTA
Transactions
in
excess
of
unrealized
loss
on
depreciated
MSFTA
Transactions
and
collateral
received,
if
any,
from
such
counterparty. As
of
October
31,
2024,
no
collateral
was
pledged
by
the
fund
or
counterparties
for
MSFTA
Transactions.
Investment
in
Blackstone
Partners
Offshore
Fund
The
fund
invested
in
Blackstone
Partners
Offshore
Fund
Ltd.
(Blackstone
Partners),
a
multi-strategy
hedge
fund-of-funds
offered
by
Blackstone
Alternative
Asset
Management
(BAAM),
a
unit
of
Blackstone
Group
L.P.
(Blackstone).
Blackstone
Partners
provides
the
fund
exposure
to
alternative
investments
primarily
through
Blackstone
Partners’
investments
in
underlying
private
investment
funds,
and
the
underlying
funds
are
mostly
managed
by
investment
managers
unaffiliated
with
BAAM
or
Blackstone.
Blackstone
Partners
and
the
underlying
funds
may
use
leverage,
engage
in
short-selling,
and
invest
in
commodities
or
other
speculative
investments,
which
may
increase
the
risk
of
investment
loss.
Blackstone
Partners
and
the
underlying
funds
are
not
subject
to
the
same
regulatory
requirements
as
open-end
mutual
funds,
and,
therefore,
their
investments
and
related
valuations
may
not
be
as
transparent.
Ownership
T.
ROWE
PRICE
Global
Allocation
Fund
interests
in
Blackstone
Partners
are
not
transferable
and
are
subject
to
various
redemption
restrictions,
such
as
advance
notice
requirements,
limited
redemption
dates,
and
possible
suspension
of
redemption
rights.
In
addition,
Blackstone
Partners’
ownership
in
the
underlying
funds
may
also
be
subject
to
transfer
and
redemption
restrictions,
such
as
advance
notice
requirements,
limited
redemption
dates,
and
possible
suspension
of
redemption
rights.
All
of
these
restrictions
are
subject
to
change
at
the
sole
discretion
of
Blackstone
Partners
or
an
underlying
fund’s
management.
As
of
October
31,
2024,
the
fund’s
investment
in
Blackstone
Partners
is
subject
to
semi-annual
redemption
with
95
days
prior
written
notice
and
is
considered
an
illiquid
asset.
Securities
Lending
The fund
may
lend
its
securities
to
approved
borrowers
to
earn
additional
income.
Its
securities
lending
activities
are
administered
by
a
lending
agent
in
accordance
with
a
securities
lending
agreement.
Security
loans
generally
do
not
have
stated
maturity
dates,
and
the
fund
may
recall
a
security
at
any
time.
The
fund
receives
collateral
in
the
form
of
cash
or
U.S.
government
securities.
Collateral
is
maintained
over
the
life
of
the
loan
in
an
amount
not
less
than
the
value
of
loaned
securities;
any
additional
collateral
required
due
to
changes
in
security
values
is
delivered
to
the
fund
the
next
business
day.
Cash
collateral
is
invested
in
accordance
with
investment
guidelines
approved
by
fund
management.
Additionally,
the
lending
agent
indemnifies
the
fund
against
losses
resulting
from
borrower
default.
Although
risk
is
mitigated
by
the
collateral
and
indemnification,
the
fund
could
experience
a
delay
in
recovering
its
securities
and
a
possible
loss
of
income
or
value
if
the
borrower
fails
to
return
the
securities,
collateral
investments
decline
in
value,
and
the
lending
agent
fails
to
perform.
Securities
lending
revenue
consists
of
earnings
on
invested
collateral
and
borrowing
fees,
net
of
any
rebates
to
the
borrower,
compensation
to
the
lending
agent,
and
other
administrative
costs.
In
accordance
with
GAAP,
investments
made
with
cash
collateral
are
reflected
in
the
accompanying
financial
statements,
but
collateral
received
in
the
form
of
securities
is
not.
At
October
31,
2024,
the
value
of
loaned
securities
was
$5,308,000;
the
value
of
cash
collateral
and
related
investments
was
$5,564,000.
Other
Purchases
and
sales
of
portfolio
securities
other
than
in-kind
transactions,
if
any,
and short-term
and
U.S.
government securities
aggregated $269,337,000 and
$369,721,000,
respectively,
for
the
year ended
October
31,
2024. Purchases
and
sales
of
U.S.
government
securities
aggregated $43,145,000 and
$42,076,000,
respectively,
for
the
year ended
October
31,
2024.
T.
ROWE
PRICE
Global
Allocation
Fund
NOTE
5
-
FEDERAL
INCOME
TAXES
Generally,
no
provision
for
federal
income
taxes
is
required
since
the
fund
intends
to continue
to
qualify
as
a
regulated
investment
company
under
Subchapter
M
of
the
Internal
Revenue
Code
and
distribute
to
shareholders
all
of
its taxable
income
and
gains.
Distributions
determined
in
accordance
with
federal
income
tax
regulations
may
differ
in
amount
or
character
from
net
investment
income
and
realized
gains
for
financial
reporting
purposes.
The
fund
files
U.S.
federal,
state,
and
local
tax
returns
as
required.
The
fund’s
tax
returns
are
subject
to
examination
by
the
relevant
tax
authorities
until
expiration
of
the
applicable
statute
of
limitations,
which
is
generally
three
years
after
the
filing
of
the
tax
return
but
which
can
be
extended
to
six
years
in
certain
circumstances.
Tax
returns
for
open
years
have
incorporated
no
uncertain
tax
positions
that
require
a
provision
for
income
taxes.
Capital
accounts
within
the
financial
reporting
records
are
adjusted
for
permanent
book/tax
differences
to
reflect
tax
character
but
are
not
adjusted
for
temporary
differences.
The
permanent
book/tax
adjustments,
if
any,
have
no
impact
on
results
of
operations
or
net
assets.
The
permanent
book/tax
adjustments
relate
primarily
to
deemed
distributions
on
shareholder
redemptions
and
the
character
of
income
on
passive
foreign
investment
companies.
The
tax
character
of
distributions
paid
for
the
periods
presented
was
as
follows:
At
October
31,
2024,
the
tax-basis
cost
of
investments
(including
derivatives,
if
any)
and
gross
unrealized
appreciation
and
depreciation
were as
follows:
($000s)
October
31,
2024
October
31,
2023
Ordinary
income
(including
short-term
capital
gains,
if
any)
$
21,502
$
30,575
($000s)
Cost
of
investments
$
687,054
Unrealized
appreciation
$
196,744
Unrealized
depreciation
(68,718)
Net
unrealized
appreciation
(depreciation)
$
128,026
T.
ROWE
PRICE
Global
Allocation
Fund
At
October
31,
2024,
the
tax-basis
components
of
accumulated
net
earnings
(loss)
were
as
follows:
Temporary
differences
between
book-basis
and
tax-basis
components
of
total
distributable
earnings
(loss)
arise
when
certain
items
of
income,
gain,
or
loss
are
recognized
in
different
periods
for
financial
statement
purposes
versus
for
tax
purposes;
these
differences
will
reverse
in
a
subsequent
reporting
period.
The
temporary
differences
relate
primarily
to
the
deferral
of
losses
from
wash
sales
and
the
realization
of
gains/losses
on
passive
foreign
investment
companies.
During
the
year
ended
October
31,
2024,
the
fund
utilized
$3,051,000
of
capital
loss
carryforwards.
Other
temporary
differences
relate
primarily
to
differences
in
treatment
of
corporate
actions.
NOTE
6
-
FOREIGN TAXES
The
fund
is
subject
to
foreign
income
taxes
imposed
by
certain
countries
in
which
it
invests.
Additionally,
capital
gains
realized
upon
disposition
of
securities
issued
in
or
by
certain
foreign
countries
are
subject
to
capital
gains
tax
imposed
by
those
countries.
All
taxes
are
computed
in
accordance
with
the
applicable
foreign
tax
law,
and,
to
the
extent
permitted,
capital
losses
are
used
to
offset
capital
gains.
Taxes
attributable
to
income
are
accrued
by
the
fund
as
a
reduction
of
income.
Current
and
deferred
tax
expense
attributable
to
capital
gains
is
reflected
as
a
component
of
realized
or
change
in
unrealized
gain/
loss
on
securities
in
the
accompanying
financial
statements.
To
the
extent
that
the
fund
has
country
specific
capital
loss
carryforwards,
such
carryforwards
are
applied
against
net
unrealized
gains
when
determining
the
deferred
tax
liability.
Any
deferred
tax
liability
incurred
by
the
fund
is
included
in
either
Other
liabilities
or
Deferred
tax
liability
on
the
accompanying
Statement
of
Assets
and
Liabilities.
($000s)
Undistributed
ordinary
income
$
16,631
Undistributed
long-term
capital
gain
19,354
Net
unrealized
appreciation
(depreciation)
128,026
Other
temporary
differences
(1)
Total
distributable
earnings
(loss)
$
164,010
T.
ROWE
PRICE
Global
Allocation
Fund
NOTE
7
-
RELATED
PARTY
TRANSACTIONS
The
fund
is
managed
by
T.
Rowe
Price
Associates,
Inc.
(Price
Associates),
a
wholly
owned
subsidiary
of
T.
Rowe
Price
Group,
Inc.
(Price
Group). Price
Associates
has
entered
into
a
sub-advisory
agreement(s)
with
one
or
more
of
its
wholly
owned
subsidiaries,
to
provide
investment
advisory
services
to
the
fund.
The
investment
management
agreement
between
the
fund
and
Price
Associates
provides
for
an
annual
investment
management
fee,
which
is
computed
daily
and
paid
monthly. The
fee
consists
of
an
individual
fund
fee,
equal
to
0.40%
of
the
fund’s
average
daily
net
assets,
and
a
group
fee.
The
group
fee
rate
is
calculated
based
on
the
combined
net
assets
of
certain
mutual
funds
sponsored
by
Price
Associates
(the
group)
applied
to
a
graduated
fee
schedule,
with
rates
ranging
from
0.48%
for
the
first
$1
billion
of
assets
to
0.260%
for
assets
in
excess
of
$845
billion.
The
fund’s
group
fee
is
determined
by
applying
the
group
fee
rate
to
the
fund’s
average
daily
net
assets. At
October
31,
2024,
the
effective
annual
group
fee
rate
was
0.28%.
The Investor
Class and Advisor
Class are
each
subject
to
a
contractual
expense
limitation
through
the
expense
limitation
dates
indicated
in
the
table
below.
This
agreement
will
continue
through
the
expense
limitation
dates
indicated
in
the
table
below,
and
may
be
renewed,
revised,
or
revoked
only
with
approval
of
the
fund’s
Board.
During
the
limitation
period,
Price
Associates
is required
to
waive
or
pay
any
expenses
(excluding
interest;
expenses
related
to
borrowings,
taxes,
and
brokerage;
non-recurring,
extraordinary
expenses;
and
acquired
fund
fees
and
expenses)
that
would
otherwise
cause
the class’s ratio
of
annualized
total
expenses
to
average
net
assets
(net
expense
ratio)
to
exceed
its
expense
limitation.
Each
class
is
required
to
repay
Price
Associates
for
expenses
previously
waived/paid
to
the
extent
the
class’s net
assets
grow
or
expenses
decline
sufficiently
to
allow
repayment
without
causing
the class’s net
expense
ratio
(after
the
repayment
is
taken
into
account)
to
exceed
the
lesser
of:
(1)
the
expense
limitation
in
place
at
the
time
such
amounts
were
waived;
or
(2)
the class’s
current
expense
limitation.
However,
no
repayment
will
be
made
more
than
three
years
after
the
date
of
a
payment
or
waiver.
The
I
Class
is
also
subject
to
an
operating
expense
limitation
(I
Class
Limit)
pursuant
to
which
Price
Associates
is
contractually
required
to
pay
all
operating
expenses
of
the
I
Class,
excluding
management
fees;
interest;
expenses
related
to
borrowings,
taxes,
and
brokerage; non-recurring,
extraordinary expenses; and
acquired
fund
fees
and
expenses, to
the
extent
such
operating
expenses,
on
an
annualized
basis,
exceed
the
I
Class
Limit. This
agreement
will
continue
through
the
expense
limitation
date
indicated
in
the
table
below,
and
may
T.
ROWE
PRICE
Global
Allocation
Fund
be
renewed,
revised,
or
revoked
only
with
approval
of
the
fund’s
Board.
The
I
Class
is
required
to
repay
Price
Associates
for
expenses
previously
paid
to
the
extent
the
class’s
net
assets
grow
or
expenses
decline
sufficiently
to
allow
repayment
without
causing
the
class’s
operating
expenses
(after
the
repayment
is
taken
into
account)
to
exceed
the
lesser
of:
(1)
the
I
Class
Limit
in
place
at
the
time
such
amounts
were
paid;
or
(2)
the
current
I
Class
Limit.
However,
no
repayment
will
be
made
more
than
three
years
after
the
date
of
a
payment
or
waiver.
Pursuant
to
these
agreements,
expenses
were waived/paid
by
and/or
repaid
to
Price
Associates
during
the year
ended October
31,
2024 as
indicated
in
the
table
below.
Including
these
amounts,
expenses
previously
waived/paid
by
Price
Associates
in
the
amount
of $222,000 remain
subject
to
repayment
by
the
fund
at
October
31,
2024. Any
repayment
of
expenses
previously
waived/paid
by
Price
Associates
during
the
period
would
be
included
in
the
net
investment
income
and
expense
ratios
presented
on
the
accompanying
Financial
Highlights.
In
addition,
the
fund
has
entered
into
service
agreements
with
Price
Associates
and
two
wholly
owned
subsidiaries
of
Price
Associates,
each
an
affiliate
of
the
fund
(collectively,
Price).
Price
Associates
provides
certain
accounting
and
administrative
services
to
the
fund.
T.
Rowe
Price
Services,
Inc.
provides
shareholder
and
administrative
services
in
its
capacity
as
the
fund’s
transfer
and
dividend-disbursing
agent.
T.
Rowe
Price
Retirement
Plan
Services,
Inc.
provides
subaccounting
and
recordkeeping
services
for
certain
retirement
accounts
invested
in
the
Investor
Class
and
Advisor
Class.
For
the
year
ended
October
31,
2024,
expenses
incurred
pursuant
to
these
service
agreements
were
$122,000
for
Price
Associates;
$211,000
for
T.
Rowe
Price
Services,
Inc.;
and
$3,000
for
T.
Rowe
Price
Retirement
Plan
Services,
Inc.
All
amounts
due
to
and
due
from
Price,
exclusive
of
investment
management
fees
payable,
are
presented
net
on
the
accompanying
Statement
of
Assets
and
Liabilities.
Investor
Class
Advisor
Class
I
Class
Expense
limitation/I
Class
Limit
1.04%
1.15%
0.05%
Expense
limitation
date
02/28/26
02/28/26
02/28/26
(Waived)/repaid
during
the
period
($000s)
$—
$(3)
$(118)
T.
ROWE
PRICE
Global
Allocation
Fund
T.
Rowe
Price
Investment
Services,
Inc.
(Investment
Services)
serves
as
distributor
to
the
fund.
Pursuant
to
an
underwriting
agreement,
no
compensation
for
any
distribution
services
provided
is
paid
to
Investment
Services
by
the
fund
(except
for
12b-1
fees
under
a
Board-approved
Rule
12b-1
plan).
The fund
may
invest
its
cash
reserves
in
certain
open-end
management
investment
companies
managed
by
Price
Associates
and
considered
affiliates
of
the
fund:
the
T.
Rowe
Price
Government
Reserve
Fund
or
the
T.
Rowe
Price
Treasury
Reserve
Fund,
organized
as
money
market
funds
(together,
the
Price
Reserve
Funds).
The
Price
Reserve
Funds
are
offered
as
short-term
investment
options
to
mutual
funds,
trusts,
and
other
accounts
managed
by
Price
Associates
or
its
affiliates
and
are
not
available
for
direct
purchase
by
members
of
the
public.
Cash
collateral
from
securities
lending,
if
any,
is
invested
in
the
T.
Rowe
Price
Government
Reserve Fund. The
Price
Reserve
Funds
pay
no
investment
management
fees.
The
fund
may
also
invest
in
certain
other
T.
Rowe
Price
funds
(Price
Funds)
as
a
means
of
gaining
efficient
and
cost-effective
exposure
to
certain
markets.
The
fund
does
not
invest
for
the
purpose
of
exercising
management
or
control;
however,
investments
by
the
fund
may
represent
a
significant
portion
of
an
underlying
Price
Fund’s
net
assets.
Each
underlying
Price
Fund
is
an
open-
end
management
investment
company
managed
by
Price
Associates
and
is
considered
an
affiliate
of
the
fund.
To
ensure
that
the
fund
does
not
incur
duplicate
management
fees
(paid
by
the
underlying
Price
Fund(s)
and
the
fund),
Price
Associates
has
agreed
to
permanently
waive
a
portion
of
its
management
fee
charged
to
the
fund
in
an
amount
sufficient
to
fully
offset
that
portion
of
management
fees
paid
by
each
underlying
Price
Fund
related
to
the
fund’s
investment
therein.
Annual
management
fee
rates
and
amounts
waived
related
to
investments
in
the
underlying
Price
Fund(s)
for
the
year
ended
October
31,
2024,
are
as
follows:
($000s)
Effective
Management
Fee
Rate
Management
Fee
Waived
T.
Rowe
Price
Dynamic
Global
Bond
Fund
-
I
Class
0.48%
$
77
T.
Rowe
Price
Emerging
Markets
Bond
Fund
-
I
Class
0.69%
18
T.
Rowe
Price
Emerging
Markets
Local
Currency
Bond
Fund
-
I
Class
0.64%
98
T.
Rowe
Price
Institutional
Emerging
Markets
Bond
Fund
0.70%
203
T.
ROWE
PRICE
Global
Allocation
Fund
Total
management
fee
waived
was
allocated
ratably
in
the
amounts
of
$735,000,
$5,000
and
$407,000 for
the
Investor
Class,
Advisor
Class
and
I
Class,
respectively,
for
the
year ended
October
31,
2024.
The fund may
participate
in
securities
purchase
and
sale
transactions
with
other
funds
or
accounts
advised
by
Price
Associates
(cross
trades),
in
accordance
with
procedures
adopted
by the
fund’s
Board
and
Securities
and
Exchange
Commission
rules,
which
require,
among
other
things,
that
such
purchase
and
sale
cross
trades
be
effected
at
the
independent
current
market
price
of
the
security.
During
the
year
ended
October
31,
2024,
the
aggregate
value
of
purchases
and
sales
cross
trades
with
other
funds
or
accounts
advised
by
Price
Associates
was
less
than
1%
of
the
fund’s
net
assets
as
of
October
31,
2024.
NOTE
8
-
BORROWING
To
provide
temporary
liquidity,
the
fund
may
borrow
from
other
T.
Rowe
Price-
sponsored
mutual
funds
under
an
interfund
borrowing
program
developed
and
managed
by
Price
Associates.
The
program
permits
the
borrowing
and
lending
of
cash
at
rates
beneficial
to
both
the
borrowing
and
lending
funds.
Pursuant
to
program
guidelines,
loans
10%
or
more
of
a
borrowing
fund’s
total
assets
require
collateralization
at
102%
of
the
value
of
the
loan;
loans
of
less
than
10%
are
unsecured.
During
the
year ended
October
31,
2024,
the
fund
incurred
$3,000
in
interest
expense
related
to
outstanding
borrowings
on
two
days
in
the
average
amount
of
$7,800,000
and
at
an
average
annual
rate
of
6.94%.
At
October
31,
2024,
there
were
no
borrowings
outstanding.
($000s)
Effective
Management
Fee
Rate
Management
Fee
Waived
T.
Rowe
Price
Institutional
Floating
Rate
Fund
-
Institutional
Class
0.55%
$
48
T.
Rowe
Price
Institutional
High
Yield
Fund
-
Institutional
Class
0.50%
103
T.
Rowe
Price
Integrated
U.S.
Small-Mid
Cap
Core
Equity
Fund
-
I
Class
0.63%
267
T.
Rowe
Price
International
Bond
Fund
-
I
Class
0.48%
117
T.
Rowe
Price
International
Bond
Fund
(USD
Hedged)
-
I
Class
0.48%
22
T.
Rowe
Price
Multi-Strategy
Total
Return
Fund
-
I
Class
0.99%
194
Total
Management
Fee
Waived
$
1,147
T.
ROWE
PRICE
Global
Allocation
Fund
NOTE
9
-
OTHER
MATTERS
Unpredictable environmental,
political,
social
and
economic
events,
including
but
not
limited
to,
environmental
or
natural
disasters,
war
and
conflict
(including
Russia’s
military
invasion
of
Ukraine
and
the
conflict
in
Israel,
Gaza
and
surrounding
areas),
terrorism,
geopolitical
developments
(including
trading
and
tariff
arrangements,
sanctions
and
cybersecurity
attacks),
and
public
health
epidemics
(including
the
global
outbreak
of
COVID-19)
and
similar
public
health
threats,
may
significantly
affect
the
economy
and
the
markets
and
issuers
in
which
a
fund
invests.
The
extent
and
duration
of
such
events
and
resulting
market
disruptions
cannot
be
predicted.
These
and
other
similar
events
may
cause
instability
across
global
markets,
including
reduced
liquidity
and
disruptions
in
trading
markets,
while
some
events
may
affect
certain
geographic
regions,
countries,
sectors,
and
industries
more
significantly
than
others,
and
exacerbate
other
pre-existing
political,
social,
and
economic
risks.
The
fund’s
performance
could
be
negatively
impacted
if
the
value
of
a
portfolio
holding
were
harmed
by
these
or
such
events.
Management
actively
monitors
the
risks
and
financial
impacts
arising
from
such
events.
T.
ROWE
PRICE
Global
Allocation
Fund
REPORT
OF
INDEPENDENT
REGISTERED
PUBLIC
ACCOUNTING
FIRM
To
the
Board
of
Directors
and
Shareholders
of
T.
Rowe
Price
Global
Allocation
Fund,
Inc.
Opinion
on
the
Financial
Statements
We
have
audited
the
accompanying
statement
of
assets
and
liabilities,
including
the
portfolio
of
investments,
of
T.
Rowe
Price
Global
Allocation
Fund,
Inc.
(the
"Fund")
as
of
October
31,
2024,
the
related
statement
of
operations
for
the
year
ended
October
31,
2024,
the
statement
of
changes
in
net
assets
for
each
of
the
two
years
in
the
period
ended
October
31,
2024,
including
the
related
notes,
and
the
financial
highlights
for
each
of
the
five
years
in
the
period
ended
October
31,
2024
(collectively
referred
to
as
the
“financial
statements”).
In
our
opinion,
the
financial
statements
present
fairly,
in
all
material
respects,
the
financial
position
of
the
Fund
as
of
October
31,
2024,
the
results
of
its
operations
for
the
year
then
ended,
the
changes
in
its
net
assets
for
each
of
the
two
years
in
the
period
ended
October
31,
2024
and
the
financial
highlights
for
each
of
the
five
years
in
the
period
ended
October
31,
2024
in
conformity
with
accounting
principles
generally
accepted
in
the
United
States
of
America.
Basis
for
Opinion
These
financial
statements
are
the
responsibility
of
the
Fund’s
management.
Our
responsibility
is
to
express
an
opinion
on
the
Fund’s
financial
statements
based
on
our
audits.
We
are
a
public
accounting
firm
registered
with
the
Public
Company
Accounting
Oversight
Board
(United
States)
(PCAOB)
and
are
required
to
be
independent
with
respect
to
the
Fund
in
accordance
with
the
U.S.
federal
securities
laws
and
the
applicable
rules
and
regulations
of
the
Securities
and
Exchange
Commission
and
the
PCAOB.
We
conducted
our
audits
of
these
financial
statements
in
accordance
with
the
standards
of
the
PCAOB.
Those
standards
require
that
we
plan
and
perform
the
audit
to
obtain
reasonable
assurance
about
whether
the
financial
statements
are
free
of
material
misstatement,
whether
due
to
error
or
fraud.
T.
ROWE
PRICE
Global
Allocation
Fund
Our
audits
included
performing
procedures
to
assess
the
risks
of
material
misstatement
of
the
financial
statements,
whether
due
to
error
or
fraud,
and
performing
procedures
that
respond
to
those
risks.
Such
procedures
included
examining,
on
a
test
basis,
evidence
regarding
the
amounts
and
disclosures
in
the
financial
statements.
Our
audits
also
included
evaluating
the
accounting
principles
used
and
significant
estimates
made
by
management,
as
well
as
evaluating
the
overall
presentation
of
the
financial
statements.
Our
procedures
included
confirmation
of
securities
owned
as
of
October
31,
2024
by
correspondence
with
the
custodians,
transfer
agent,
investment
manager
and
brokers;
when
replies
were
not
received
from
brokers,
we
performed
other
auditing
procedures.
We
believe
that
our
audits
provide
a
reasonable
basis
for
our
opinion.
/s/
PricewaterhouseCoopers
LLP
Baltimore,
Maryland
December
18,
2024
We
have
served
as
the
auditor
of
one
or
more
investment
companies
in
the
T.
Rowe
Price
group
of
investment
companies
since
1973.
REPORT
OF
INDEPENDENT
REGISTERED
PUBLIC
ACCOUNTING
FIRM
(continued)
T.
ROWE
PRICE
Global
Allocation
Fund
TAX
INFORMATION
(UNAUDITED)
FOR
THE
TAX
YEAR
ENDED 10/31/24
We
are
providing
this
information
as
required
by
the
Internal
Revenue
Code.
The
amounts
shown
may
differ
from
those
elsewhere
in
this
report
because
of
differences
between
tax
and
financial
reporting
requirements.
The
fund’s
distributions
to
shareholders
included
$1,039,000
from
long-term
capital
gains,
subject
to
a
long-term
capital
gains
tax
rate
of
not
greater
than
20%.
For
taxable
non-corporate
shareholders,
$7,030,000
of
the
fund's
income
represents
qualified
dividend
income
subject
to
a
long-term
capital
gains
tax
rate
of
not
greater
than
20%.
For
corporate
shareholders,
$2,896,000
of
the
fund's
income
qualifies
for
the
dividends-received
deduction.
100
East
Pratt
Street
Baltimore,
MD
21202
T.
Rowe
Price
Investment
Services,
Inc.
Call
1-800-225-5132
to
request
a
prospectus
or
summary
prospectus;
each
includes
investment
objectives,
risks,
fees,
expenses,
and
other
information
that
you
should
read
and
consider
carefully
before
investing.
F154-050
12/24
Item 8. Changes in and Disagreements with Accountants for Open-End Management Investment Companies.
Not applicable.
Item 9. Proxy Disclosures for Open-End Management Investment Companies.
Not applicable.
Item 10. Remuneration Paid to Directors, Officers, and Others of Open-End Management Investment Companies.
Remuneration paid to Directors is included in Item 7 of this Form N-CSR.
Item 11. Statement Regarding Basis for Approval of Investment Advisory Contract.
If applicable, see Item 7.
Item 12. Disclosure of Proxy Voting Policies and Procedures for Closed-End Management Investment Companies.
Not applicable.
Item 13. Portfolio Managers of Closed-End Management Investment Companies.
Not applicable.
Item 14. Purchases of Equity Securities by Closed-End Management Investment Company and Affiliated Purchasers.
Not applicable.
Item 15. Submission of Matters to a Vote of Security Holders.
There has been no change to the procedures by which shareholders may recommend nominees to the registrant’s board of directors.
Item 16. Controls and Procedures.
(a) The registrant’s principal executive officer and principal financial officer have evaluated the registrant’s disclosure controls and procedures within 90 days of this filing and have concluded that the registrant’s disclosure controls and procedures were effective, as of that date, in ensuring that information required to be disclosed by the registrant in this Form N-CSR was recorded, processed, summarized, and reported timely.
(b) The registrant’s principal executive officer and principal financial officer are aware of no change in the registrant’s internal control over financial reporting that occurred during the period covered by this report that has materially affected, or is reasonably likely to materially affect, the registrant’s internal control over financial reporting.
Item 17. Disclosure of Securities Lending Activities for Closed-End Management Investment Companies.
Not applicable.
Item 18. Recovery of Erroneously Awarded Compensation.
Not applicable.
Item 19. Exhibits.
SIGNATURES
Pursuant to the requirements of the Securities Exchange Act of 1934 and the Investment Company Act of 1940, the registrant has duly caused this report to be signed on its behalf by the undersigned, thereunto duly authorized.
| | | | |
| T. Rowe Price Global Allocation Fund, Inc. |
| | |
| By | | /s/ David Oestreicher | | |
| | David Oestreicher | | |
| | Principal Executive Officer | | |
| | |
| Date | | December 18, 2024 | | |
Pursuant to the requirements of the Securities Exchange Act of 1934 and the Investment Company Act of 1940, this report has been signed below by the following persons on behalf of the registrant and in the capacities and on the dates indicated.
| | | | |
| By | | /s/ David Oestreicher | | |
| | David Oestreicher | | |
| | Principal Executive Officer | | |
| | |
| Date | | December 18, 2024 | | |
| | | | |
| By | | /s/ Alan S. Dupski | | |
| | Alan S. Dupski | | |
| | Principal Financial Officer | | |
| | |
| Date | | December 18, 2024 | | |