UNITED STATES
SECURITIES AND EXCHANGE COMMISSION
Washington, D.C. 20549
FORM N-CSR
CERTIFIED SHAREHOLDER REPORT OF REGISTERED
MANAGEMENT INVESTMENT COMPANIES
Investment Company Act File Number: 811-22810
| T. Rowe Price Global Allocation Fund, Inc. |
| (Exact name of registrant as specified in charter) |
| 100 East Pratt Street, Baltimore, MD 21202 |
| (Address of principal executive offices) |
| David Oestreicher |
| 100 East Pratt Street, Baltimore, MD 21202 |
| (Name and address of agent for service) |
Registrant’s telephone number, including area code: (410) 345-2000
Date of fiscal year end: October 31
Date of reporting period: April 30, 2014
Item 1. Report to Shareholders
 |
| Global Allocation Fund | April 30, 2014 |
The views and opinions in this report were current as of April 30, 2014. They are not guarantees of performance or investment results and should not be taken as investment advice. Investment decisions reflect a variety of factors, and the managers reserve the right to change their views about individual stocks, sectors, and the markets at any time. As a result, the views expressed should not be relied upon as a forecast of the fund’s future investment intent. The report is certified under the Sarbanes-Oxley Act, which requires mutual funds and other public companies to affirm that, to the best of their knowledge, the information in their financial reports is fairly and accurately stated in all material respects.
REPORTS ON THE WEB
Sign up for our E-mail Program, and you can begin to receive updated fund reports and prospectuses online rather than through the mail. Log in to your account at troweprice.com for more information.
Manager’s Letter
Fellow Shareholders
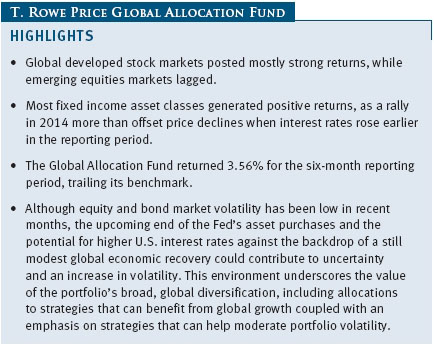
Global developed stock markets posted strong returns for much of the six-month period, although U.S. stocks, particularly small-caps and technology-related shares, lost their momentum near the end of the reporting period. However, emerging markets stocks significantly lagged their developed market counterparts amid investor fears about slowing growth in China as well as the effects of decreased global liquidity as the Federal Reserve tapers its asset purchases. The same worries also weighed on the returns of investment-grade bonds of both developed and emerging markets through the end of 2013, with emerging markets debt hit particularly hard by worries about the effects of Fed tapering. However, bonds rebounded strongly in 2014 to post gains for the entire reporting period as emerging markets debt quickly bounced back after some developing countries raised interest rates to stem declines in their currencies. High yield bonds generated the strongest returns within the fixed income asset classes. Against this backdrop, the fund modestly lagged its benchmark index.
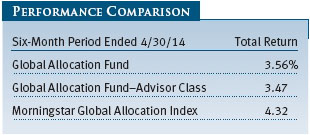
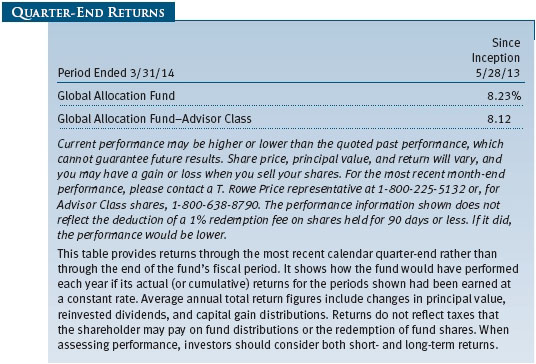
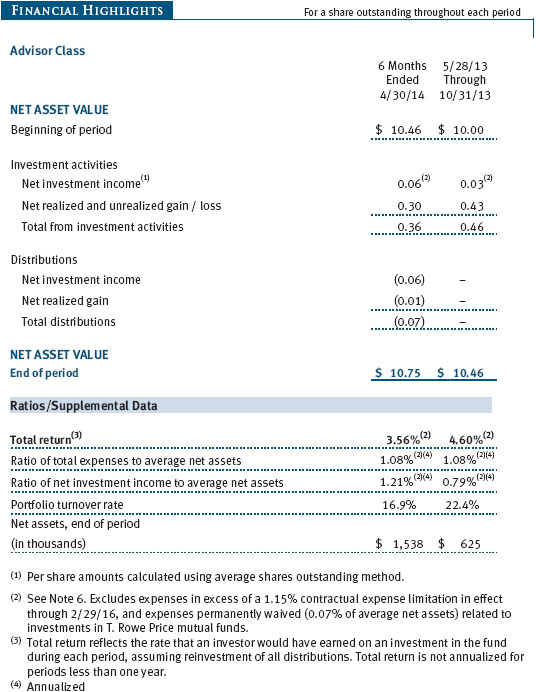
Your fund returned 3.56% for the six-month period ended April 30, 2014. (Results for the Advisor Class shares were slightly lower, reflecting a higher expense ratio.) The fund lagged the Morningstar Global Allocation Index, its primary benchmark, for the reporting period. On May 28, 2014, the fund will mark the one-year anniversary of its inception.
STRATEGY OVERVIEW
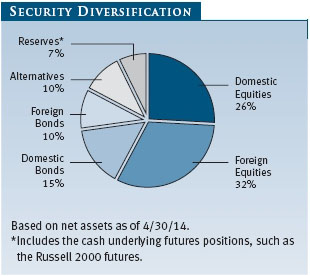
The fund’s diversified portfolio seeks long-term total return through both capital appreciation and income from investments in U.S. and international stocks, bonds, cash, and alternative investments. The portfolio consists of approximately 60% stocks, 30% bonds and cash, and 10% alternative investments, with flexibility to overweight or underweight segments of the portfolio relative to those broad allocations. The portfolio draws on the full global reach of T. Rowe Price’s investment management and research capabilities as international securities generally account for about 50% of the fund’s equity holdings and 40% of the total portfolio.
Strong security selection supported by the fundamental insights and analysis of T. Rowe Price’s global research team is the primary driver of added value in the portfolio. We also seek to add value through overweighting and underweighting of asset classes and sectors, reflecting the views of T. Rowe Price’s Asset Allocation Committee. The breadth of the underlying sectors, diversified across geography, asset classes, and investment strategies, provides the ability to position the portfolio where we see attractive opportunities in the context of current valuations as well as our outlook for the economic and market environment.
In addition, the portfolio includes asset classes and strategies that enhance its risk/reward profile by moderating risk and providing diversification through alternative sources of less correlated returns. These asset classes and strategies include a hedge fund allocation, currency hedging, and an equity index option strategy.
An externally managed investment in the Blackstone Partners Fund, a fund of hedge funds, accounted for about 10% of the portfolio. Diversified hedge fund strategies can add to portfolio diversification because they have historically delivered returns that are less correlated with traditional (stock and bond) asset classes represented in the fund, which can help dampen portfolio volatility. Including a measured allocation to a high-quality diversified hedge fund with an absolute return orientation in the portfolio’s broader asset mix can help improve the risk-adjusted returns of the portfolio.
Hedging a portion of the fund’s developed market currency exposure helps moderate the foreign exchange volatility associated with a significant international allocation while maintaining robust exposure to non-U.S. investment opportunities. The equity index option strategy, which currently involves writing calls on the Standard & Poor’s 500 Index, provides an alternative way of being compensated for bearing the downside risk of equities. We expect this strategy to offer a return profile that is less correlated with equity market returns as it earns a premium in exchange for forgoing some of the equity market’s upside potential. The consistency of receiving the premium collected from selling index call options can provide a more stable pattern of returns, which can be particularly beneficial in an environment of modestly positive or negative equity market performance.
MARKET ENVIRONMENT
Developed market stocks generally posted healthy returns during the six-month reporting period. In the U.S., technology-related and small-cap shares drove the broad market steadily higher through the last quarter of 2013 and into 2014. The Federal Reserve began to gradually reduce its asset purchases in January, a move that investors had expected. However, in March, market uncertainty was fostered by the combination of the crisis in Ukraine, a comment from Fed Chair Janet Yellen about rate increases possibly coming sooner than expected, and mixed Chinese economic data. Against this backdrop, many highly valued segments of the market—including biotech, technology, and social media stocks, as well as small-cap companies more broadly—witnessed declines.
Developed European markets kept pace with U.S. shares as investors seemed to gain confidence in the region’s slow economic recovery despite lingering high debt and unemployment levels. Stocks in peripheral eurozone countries performed particularly well. In Japan, however, stocks lost ground as the initial impact of Prime Minister Shinzo Abe’s highly aggressive economic stimulus programs wore off. Almost all of the decline in Japanese shares during the reporting period came in 2014 as investors grew increasingly concerned over the potential impact on consumers of April’s value-added tax increase.
Although emerging markets posted a loss for the six-month reporting period, the sector benefited from strong performance over the last three months. There was also much more variation in returns by country within emerging markets in early 2014, in contrast to the broad sell-off in 2013. For example, Indian stocks climbed steeply as investors anticipated an election victory by business-friendly candidate Narendra Modi, while Russian companies fell after the country’s annexation of Crimea. Emerging markets lost considerable ground in January, largely as a result of steep declines in the currencies of some developing countries. In response to the selling pressure, central banks in Brazil, India, South Africa, and Turkey raised their benchmark interest rates, helping to stabilize their currencies and defuse worries about emerging markets in general. Near the end of the reporting period, geopolitical tensions resulting from Russia’s annexation of the Crimean Peninsula from Ukraine triggered selling in Russian and Ukrainian stocks and currencies but did not significantly weigh on broader developing markets.
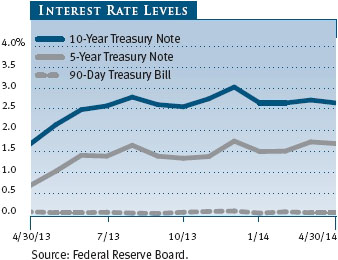
Interest rates rose fairly steadily at the beginning of the reporting period as the fixed income market priced in the impending start of the Fed’s taper of its asset purchase program. The yield on the 10-year Treasury note climbed from 2.56% at the end of October 2013 to 3.03% at the end of the year. In January 2014, the Fed began to taper the monthly amounts of its securities purchases, but Treasury yields moved lower as the 10-year Treasury yield reached 2.65% at the end of the reporting period. Many fixed income assets struggled amid rising rates in 2013, and emerging markets debt was hit particularly hard as investors also worried about the effects of lower global liquidity on developing countries. In 2014, however, most fixed income assets rallied along with Treasuries, and credit spreads, which measure the additional yield that investors demand as compensation for holding a bond with credit risk versus a similar-maturity Treasury security, narrowed. High yield bonds and leveraged loans posted strong returns throughout the reporting period as investor demand for yield in a low-rate environment continued.
ASSET ALLOCATION STRATEGY
We maintained an overweight to equities during the reporting period, although we reduced the size of that overweight as valuations overall appeared slightly extended, with some segments—such as U.S. small-caps—looking stretched. (We include both the market value of equity securities and the notional value of Russell 2000 futures in our equity positioning commentary.) As we pared back our overweight to equities, we increased the portfolio’s fixed income holdings, including cash. While yields on cash are negligible, the cash position helps moderate the portfolio’s risk profile and provides flexibility to take advantage of potential opportunities.
We maintained an overweight to international equities relative to U.S. stocks in light of more attractive valuations, with emerging markets valuations particularly compelling. We did, however, moderate our overweight to emerging markets early in the reporting period given expectations for a lower-growth environment in key emerging markets, such as China. We increased our overweight to international small-caps, which we believe should be well positioned to benefit from the economic recovery in Europe. Within the portfolio’s U.S. equities allocation, we are overweight U.S. large-cap stocks relative to small-caps as small-cap valuations look rich relative to large-cap stocks as well as when compared with their own history. To provide additional diversification and long-term protection from inflation, the portfolio also includes an allocation to real assets equities that are involved in or have exposure to industries related to real estate and commodities.
Within the portfolio’s broad fixed income allocation, we maintained an overweight to high yield bonds and to leveraged loans. Against the backdrop of a generally improving economic environment, the fundamental credit quality of many high yield issuers remains strong, and we expect default rates to stay low. In addition, high yield bonds and loans are generally less susceptible to the adverse price effects of rising interest rates than investment-grade debt. However, we moderated our overweight near the end of the reporting period as high yield valuations are somewhat expensive relative to history and the investor protections on new high yield issues steadily deteriorated. Among emerging markets bonds, we have an overweight to bonds denominated in local currencies. The sell-off in the asset class created some compelling relative valuation opportunities for issuers in fundamentally strong emerging markets economies.
PORTFOLIO REVIEW
U.S. Stocks
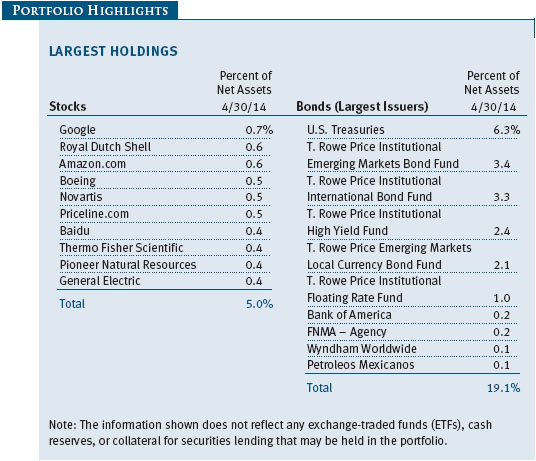
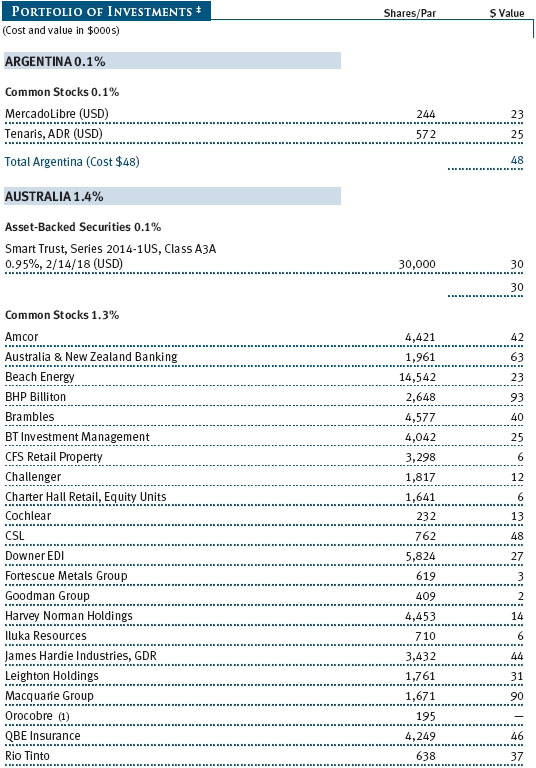
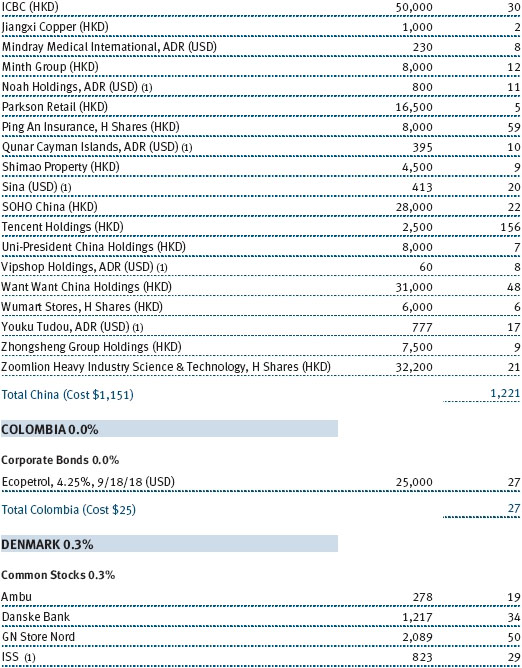
U.S. companies in a diverse range of industries made positive contributions to performance. Investor sentiment toward U.S. airlines in general has improved dramatically as carriers have aggressively cut capacity and costs. American Airlines was one of the strongest performers as investors expected the company to be able to smoothly integrate US Airways following their merger and to benefit from consolidating schedules and eliminating unprofitable routes. In the life sciences industry, Thermo Fisher Scientific generated strong returns as a result of growing revenues amid strong demand from its industrial customers. The fund’s allocation to real assets stocks in general also made a positive contribution. On the downside, some of the fund’s holdings of U.S. technology companies weighed on returns as their swift rise in 2013 gave way to an abrupt sell-off in March 2014. For example, shares of professional networking website LinkedIn and e-commerce giant Amazon.com both lost significant ground over the course of the reporting period following their strong gains. (Please refer to the portfolio of investments for a complete list of holdings and the amount each represents in the portfolio.)
International Stocks
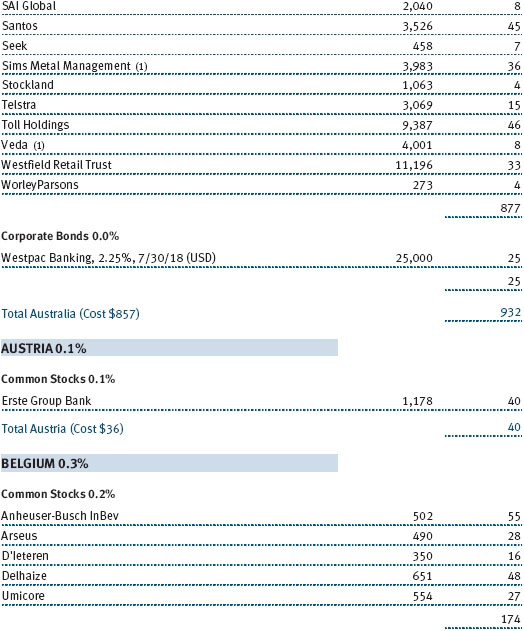
Outside the U.S., the fund also benefited from strong stock performances in a variety of industries. Royal Dutch Shell, a multinational oil and gas firm incorporated in the UK but headquartered in the Netherlands, reported a strong rebound in profits at the end of the reporting period amid optimism about the company’s new chief executive officer. Shares of Swiss pharmaceutical company Novartis gained as a result of growth in its recently launched products, diminishing competition from generic drugs, and improvements in productivity and efficiency. On the other hand, some of the fund’s emerging markets holdings posted disappointing results. Chinese Web portal Sina declined as the outlook for the initial public offering of its Weibo microblogging application began to look less encouraging. The portfolio’s holdings of Sberbank of Russia, a large Russian bank, lost significant ground in the reporting period after Russia’s occupation and subsequent annexation of Crimea. We continue to maintain our modest exposure to Sberbank as we believe that its dominant market share in Russia and strong core revenues will enable its stock to recover.
Domestic Bonds
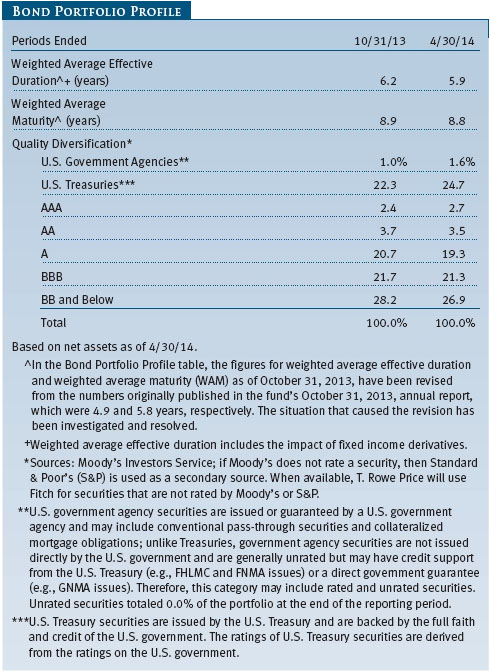
The portfolio’s fixed income holdings consist of a core allocation to U.S. investment-grade bonds, including both nominal coupon securities and Treasury inflation protected securities. This conservative core emphasizes high-quality, longer-duration bonds that can provide ballast during periods of heightened risk aversion. We supplement this core with allocations to diversifying fixed income asset classes, including high yield bonds and floating rate loans. The allocations to high yield bonds and loans performed strongly over the period as investors’ desire for yield kept demand for noninvestment-grade securities healthy. The portfolio’s higher-quality holdings, which had been hampered by higher interest rates at the end of 2013, have fared better in recent months as interest rates have eased from peak levels at the beginning of the year.
International Bonds
The portfolio’s fixed income allocation also includes international bonds denominated in foreign currencies as well as emerging market sovereign and corporate debt denominated in dollars or local currencies. These international bonds can provide an additional source of diversification relative to our allocations to domestic bonds and equities. Our holdings of bonds issued by peripheral eurozone countries rallied amid hopes for a strengthening eurozone economy. Our allocation to dollar-denominated emerging markets debt made a positive contribution to performance while bonds denominated in emerging markets currencies detracted as a result of the weakness in those currencies. The performance of emerging markets local currency debt rebounded toward the end of the reporting period as emerging markets currencies regained some of their losses.
Diversifying Strategies
The portfolio incorporates several diversifying components, such as the hedge fund allocation and an equity index option strategy, to manage volatility and overall risk, which should help the fund’s risk-adjusted performance in a period of elevated market volatility or a broad sell-off in stocks. For example, the equity index option strategy is expected to have a lower return and lower volatility profile than the broad stock market, while the hedge fund allocation is expected to have more bond-like volatility with potential value added from a broad range of underlying investment strategies and managers. Both the hedge fund allocation and the equity index option strategy made positive contributions to performance during the reporting period.
INVESTMENT OUTLOOK
Our expectation for global growth over the next several quarters remains modest. However, we believe that central banks around the world will maintain their accommodative monetary policies for some time, which should help support economic growth and reduce downside risk. In the U.S., we expect gross domestic product growth to bounce back from a disappointing first quarter of 2014 weighed down by severe weather as fiscal headwinds continue to diminish and the labor market becomes healthier. The housing recovery and generally muted energy prices are also supportive of the U.S. economy.
Internationally, many countries are at earlier stages of economic recovery than the U.S. Growth in Europe is improving gradually as labor market reforms and tempered austerity policies in several European countries are showing signs of positive results. However, the peripheral eurozone countries still face elevated levels of unemployment, and some eurozone nations haven’t made significant progress toward needed economic reforms. The aggressive expansionary fiscal and monetary policies in Japan have revived the country’s economic output and instilled some expectations of desirable inflation, but the sustainability of the upturn in Japan will depend on the passage of structural reforms.
We expect interest rates to move higher over the near term as the Fed tapers its asset purchases and eventually ends them later in 2014. Strengthening U.S. economic growth should also contribute to an increase in interest rates. Emerging economies remain vulnerable to the effects of rising U.S. interest rates, which would make U.S. fixed income securities more attractive. The emerging countries with large current account and trade deficits—which make them highly dependent on external funding—could be particularly challenged as U.S. rates normalize.
The upcoming end of the Fed’s quantitative easing program and prospects for higher U.S. rates reinforces the importance of the fund’s broad global diversification, including allocations to several nontraditional strategies, which can dampen volatility and help provide a buffer against potentially turbulent markets. The portfolio’s broad diversification across asset classes, regions, and countries, as well as our ability to make changes in the fund’s allocation to help enhance its risk/reward profile, should help it post attractive risk-adjusted returns in volatile, changing market environments.
Thank you for investing with T. Rowe Price.
Respectfully submitted,

Charles M. Shriver
Chairman of the fund’s Investment Advisory Committee
May 20, 2014
The committee chairman has day-to-day responsibility for managing the portfolio and works with committee members in developing and executing the fund’s investment program.
RISKS OF INVESTING IN STOCKS
As with all stock and bond mutual funds, the fund’s share price can fall because of weakness in the stock or bond markets, a particular industry, or specific holdings. Stock markets can decline for many reasons, including adverse political or economic developments, changes in investor psychology, or heavy institutional selling. The prospects for an industry or company may deteriorate because of a variety of factors, including disappointing earnings or changes in the competitive environment. In addition, the investment manager’s assessment of companies held in a fund may prove incorrect, resulting in losses or poor performance even in rising markets. A sizable cash or fixed income position may hinder the fund from participating fully in a strong, rapidly rising bull market. In addition, significant exposure to bonds increases the risk that the fund’s share value could be hurt by rising interest rates or credit downgrades or defaults. Convertible securities are also exposed to price fluctuations of the company’s stock.
RISKS OF INTERNATIONAL INVESTING
Funds that invest overseas generally carry more risk than funds that invest strictly in U.S. assets. Funds investing in a single country or in a limited geographic region tend to be riskier than more diversified funds. Risks can result from varying stages of economic and political development; differing regulatory environments, trading days, and accounting standards; and higher transaction costs of non-U.S. markets. Non-U.S. investments are also subject to currency risk, or a decline in the value of a foreign currency versus the U.S. dollar, which reduces the dollar value of securities denominated in that currency.
RISKS OF INVESTING IN BONDS
Funds that invest in bonds are subject to interest rate risk, the decline in bond prices that usually accompanies a rise in interest rates. Longer-maturity bonds typically decline more than those with shorter maturities. Funds that invest in bonds are also subject to credit risk, the chance that any fund holding could have its credit rating downgraded or that a bond issuer will default (fail to make timely payments of interest or principal), potentially reducing the fund’s income level and share price.
GLOSSARY
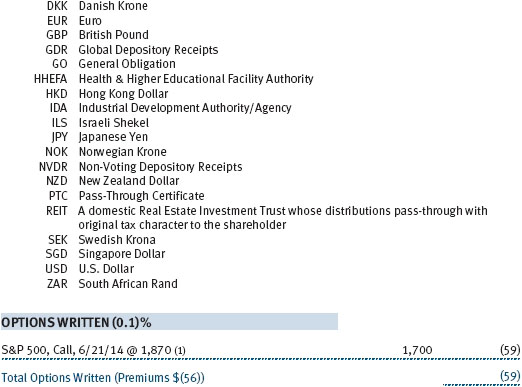
Call option: Gives the holder the right but not the obligation to buy a security or index at a specified price on or before a specified date. Writing a call option means selling it to collect the price or premium.
Duration: A measure of a bond’s sensitivity to changes in interest rates. For example, a bond with a duration of five years would fall about 5% in price in response to a one-percentage-point rise in interest rates, and vice versa.
Gross domestic product: The total market value of all goods and services produced in a country.
Morningstar Global Allocation Index: An index that represents the performance of a portfolio of 60% global equities and 40% global bonds, with the allocation within each broad asset class determined by Morningstar’s asset allocation methodology and represented by Morningstar core equity and fixed income indexes.
Nominal coupon bonds: Fixed income securities with coupon payments that do not vary in response to changes in an inflation rate.
Standard & Poor’s 500 Index: An unmanaged index that tracks the stocks of 500 primarily large-cap U.S. companies.
Performance and Expenses
| Growth of $10,000 |
This chart shows the value of a hypothetical $10,000 investment in the fund over the past 10 fiscal year periods or since inception (for funds lacking 10-year records). The result is compared with benchmarks, which may include a broad-based market index and a peer group average or index. Market indexes do not include expenses, which are deducted from fund returns as well as mutual fund averages and indexes.

| Fund Expense Example |
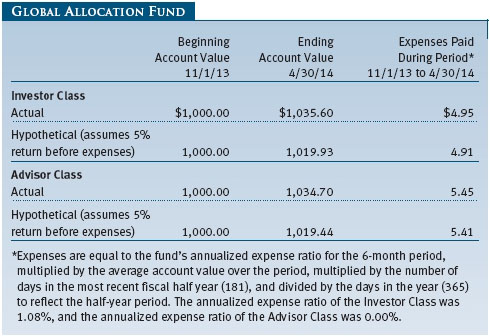
As a mutual fund shareholder, you may incur two types of costs: (1) transaction costs, such as redemption fees or sales loads, and (2) ongoing costs, including management fees, distribution and service (12b-1) fees, and other fund expenses. The following example is intended to help you understand your ongoing costs (in dollars) of investing in the fund and to compare these costs with the ongoing costs of investing in other mutual funds. The example is based on an investment of $1,000 invested at the beginning of the most recent six-month period and held for the entire period.
Actual Expenses
The first line of the following table (Actual) provides information about actual account values and expenses based on the fund’s actual returns. You may use the information on this line, together with your account balance, to estimate the expenses that you paid over the period. Simply divide your account value by $1,000 (for example, an $8,600 account value divided by $1,000 = 8.6), then multiply the result by the number on the first line under the heading “Expenses Paid During Period” to estimate the expenses you paid on your account during this period.
Hypothetical Example for Comparison Purposes
The information on the second line of the table (Hypothetical) is based on hypothetical account values and expenses derived from the fund’s actual expense ratio and an assumed 5% per year rate of return before expenses (not the fund’s actual return). You may compare the ongoing costs of investing in the fund with other funds by contrasting this 5% hypothetical example and the 5% hypothetical examples that appear in the shareholder reports of the other funds. The hypothetical account values and expenses may not be used to estimate the actual ending account balance or expenses you paid for the period.
Note: T. Rowe Price charges an annual account service fee of $20, generally for accounts with less than $10,000. The fee is waived for any investor whose T. Rowe Price mutual fund accounts total $50,000 or more; accounts electing to receive electronic delivery of account statements, transaction confirmations, prospectuses, and shareholder reports; or accounts of an investor who is a T. Rowe Price Preferred Services, Personal Services, or Enhanced Personal Services client (enrollment in these programs generally requires T. Rowe Price assets of at least $100,000). This fee is not included in the accompanying table. If you are subject to the fee, keep it in mind when you are estimating the ongoing expenses of investing in the fund and when comparing the expenses of this fund with other funds.
You should also be aware that the expenses shown in the table highlight only your ongoing costs and do not reflect any transaction costs, such as redemption fees or sales loads. Therefore, the second line of the table is useful in comparing ongoing costs only and will not help you determine the relative total costs of owning different funds. To the extent a fund charges transaction costs, however, the total cost of owning that fund is higher.
Unaudited
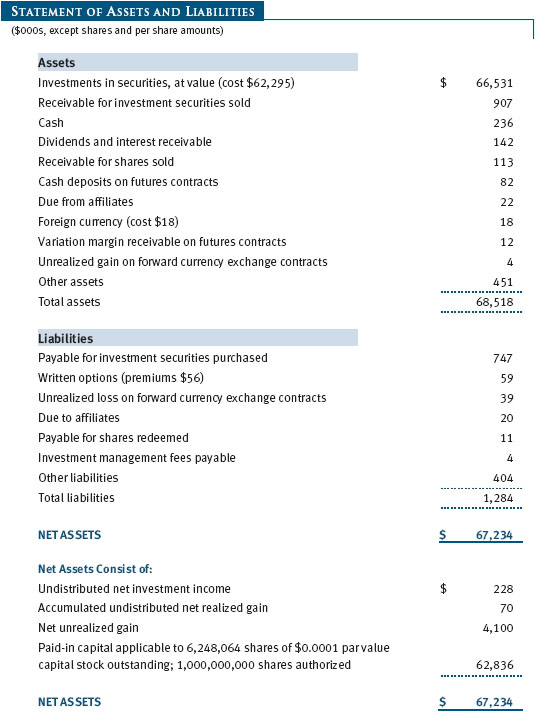
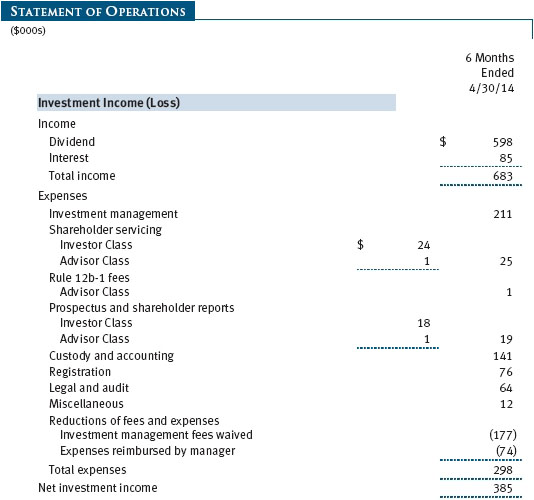
The accompanying notes are an integral part of these financial statements.
Unaudited
The accompanying notes are an integral part of these financial statements.
Unaudited
The accompanying notes are an integral part of these financial statements.
Unaudited
The accompanying notes are an integral part of these financial statements.
Unaudited
The accompanying notes are an integral part of these financial statements.
Unaudited

The accompanying notes are an integral part of these financial statements.
Unaudited
| Notes to Financial Statements |
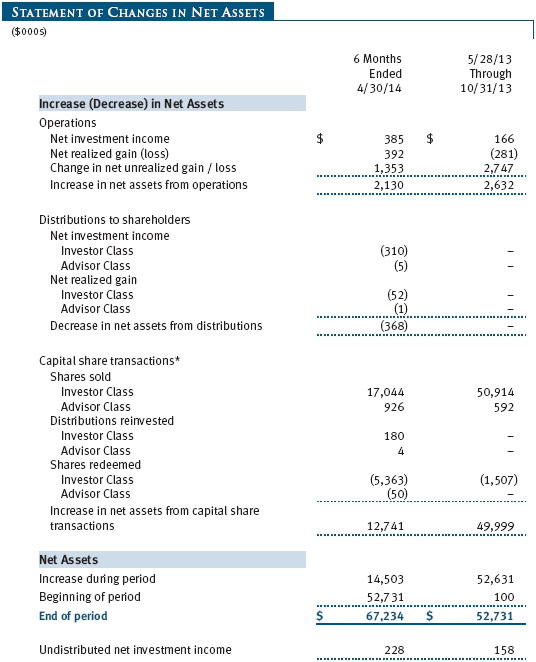
T. Rowe Price Global Allocation Fund, Inc. (the fund), is registered under the Investment Company Act of 1940 (the 1940 Act) as a diversified, open-end management investment company. The fund seeks long-term capital appreciation and income. The fund has two classes of shares: the Global Allocation Fund original share class, referred to in this report as the Investor Class, offered since May 28, 2013, and the Global Allocation Fund–Advisor Class (Advisor Class), offered since May 28, 2013. Advisor Class shares are sold only through unaffiliated brokers and other unaffiliated financial intermediaries that are compensated by the class for distribution, shareholder servicing, and/or certain administrative services under a Board-approved Rule 12b-1 plan. Each class has exclusive voting rights on matters related solely to that class; separate voting rights on matters that relate to both classes; and, in all other respects, the same rights and obligations as the other class.
NOTE 1 - SIGNIFICANT ACCOUNTING POLICIES
Basis of Preparation The fund is an investment company and follows accounting and reporting guidance in the Financial Accounting Standards Board Accounting Standards Codification Topic 946 (ASC 946). The accompanying financial statements were prepared in accordance with accounting principles generally accepted in the United States of America (GAAP), including but not limited to ASC 946. GAAP requires the use of estimates made by management. Management believes that estimates and valuations are appropriate; however, actual results may differ from those estimates, and the valuations reflected in the accompanying financial statements may differ from the value ultimately realized upon sale or maturity.
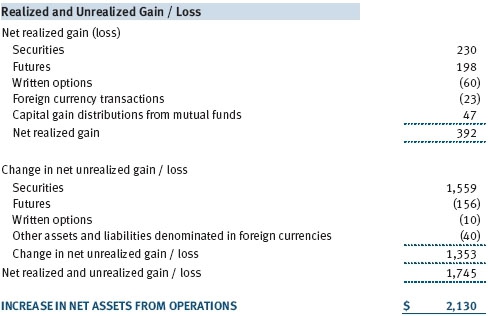
Investment Transactions, Investment Income, and Distributions Income and expenses are recorded on the accrual basis. Premiums and discounts on debt securities are amortized for financial reporting purposes. Paydown gains and losses are recorded as an adjustment to interest income. Inflation adjustments to the principal amount of inflation-indexed bonds are reflected as interest income. Dividends received from mutual fund investments are reflected as dividend income; capital gain distributions are reflected as realized gain/loss. Earnings on investments recognized as partnerships for federal income tax purposes reflect the tax character of such earnings. Dividend income and capital gain distributions are recorded on the ex-dividend date. Income tax-related interest and penalties, if incurred, would be recorded as income tax expense. Investment transactions are accounted for on the trade date. Realized gains and losses are reported on the identified cost basis. Distributions to shareholders are recorded on the ex-dividend date. Income distributions are declared and paid by each class annually. Capital gain distributions, if any, are generally declared and paid by the fund annually.
Currency Translation Assets, including investments, and liabilities denominated in foreign currencies are translated into U.S. dollar values each day at the prevailing exchange rate, using the mean of the bid and asked prices of such currencies against U.S. dollars as quoted by a major bank. Purchases and sales of securities, income, and expenses are translated into U.S. dollars at the prevailing exchange rate on the date of the transaction. The effect of changes in foreign currency exchange rates on realized and unrealized security gains and losses is reflected as a component of security gains and losses.
Class Accounting The Advisor Class pays distribution, shareholder servicing, and/or certain administrative expenses in the form of Rule 12b-1 fees, in an amount not exceeding 0.25% of the class’s average daily net assets. Shareholder servicing, prospectus, and shareholder report expenses incurred by each class are charged directly to the class to which they relate. Expenses common to both classes, investment income, and realized and unrealized gains and losses are allocated to the classes based upon the relative daily net assets of each class.
NOTE 2 - VALUATION
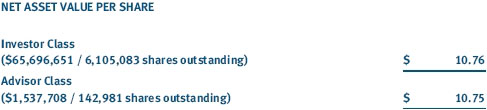
The fund’s financial instruments are valued and each class’s net asset value (NAV) per share is computed at the close of the New York Stock Exchange (NYSE), normally 4 p.m. ET, each day the NYSE is open for business.
Fair Value The fund’s financial instruments are reported at fair value, which GAAP defines as the price that would be received to sell an asset or paid to transfer a liability in an orderly transaction between market participants at the measurement date. The T. Rowe Price Valuation Committee (the Valuation Committee) has been established by the fund’s Board of Directors (the Board) to ensure that financial instruments are appropriately priced at fair value in accordance with GAAP and the 1940 Act. Subject to oversight by the Board, the Valuation Committee develops and oversees pricing-related policies and procedures and approves all fair value determinations. Specifically, the Valuation Committee establishes procedures to value securities; determines pricing techniques, sources, and persons eligible to effect fair value pricing actions; oversees the selection, services, and performance of pricing vendors; oversees valuation-related business continuity practices; and provides guidance on internal controls and valuation-related matters. The Valuation Committee reports to the fund’s Board; is chaired by the fund’s treasurer; and has representation from legal, portfolio management and trading, operations, and risk management.
Various valuation techniques and inputs are used to determine the fair value of financial instruments. GAAP establishes the following fair value hierarchy that categorizes the inputs used to measure fair value:
Level 1 – quoted prices (unadjusted) in active markets for identical financial instruments that the fund can access at the reporting date
Level 2 – inputs other than Level 1 quoted prices that are observable, either directly or indirectly (including, but not limited to, quoted prices for similar financial instruments in active markets, quoted prices for identical or similar financial instruments in inactive markets, interest rates and yield curves, implied volatilities, and credit spreads)
Level 3 – unobservable inputs
Observable inputs are developed using market data, such as publicly available information about actual events or transactions, and reflect the assumptions that market participants would use to price the financial instrument. Unobservable inputs are those for which market data are not available and are developed using the best information available about the assumptions that market participants would use to price the financial instrument. GAAP requires valuation techniques to maximize the use of relevant observable inputs and minimize the use of unobservable inputs. When multiple inputs are used to derive fair value, the financial instrument is assigned to the level within the fair value hierarchy based on the lowest-level input that is significant to the fair value of the financial instrument. Input levels are not necessarily an indication of the risk or liquidity associated with financial instruments at that level but rather the degree of judgment used in determining those values.
Valuation Techniques Equity securities listed or regularly traded on a securities exchange or in the over-the-counter (OTC) market are valued at the last quoted sale price or, for certain markets, the official closing price at the time the valuations are made. OTC Bulletin Board securities are valued at the mean of the closing bid and asked prices. A security that is listed or traded on more than one exchange is valued at the quotation on the exchange determined to be the primary market for such security. Listed securities not traded on a particular day are valued at the mean of the closing bid and asked prices for domestic securities and the last quoted sale or closing price for international securities.
For valuation purposes, the last quoted prices of non-U.S. equity securities may be adjusted to reflect the fair value of such securities at the close of the NYSE. If the fund determines that developments between the close of a foreign market and the close of the NYSE will, in its judgment, materially affect the value of some or all of its portfolio securities, the fund will adjust the previous quoted prices to reflect what it believes to be the fair value of the securities as of the close of the NYSE. In deciding whether it is necessary to adjust quoted prices to reflect fair value, the fund reviews a variety of factors, including developments in foreign markets, the performance of U.S. securities markets, and the performance of instruments trading in U.S. markets that represent foreign securities and baskets of foreign securities. The fund may also fair value securities in other situations, such as when a particular foreign market is closed but the fund is open. The fund uses outside pricing services to provide it with quoted prices and information to evaluate or adjust those prices. The fund cannot predict how often it will use quoted prices and how often it will determine it necessary to adjust those prices to reflect fair value. As a means of evaluating its security valuation process, the fund routinely compares quoted prices, the next day’s opening prices in the same markets, and adjusted prices.
Actively traded domestic equity securities generally are categorized in Level 1 of the fair value hierarchy. Non-U.S. equity securities generally are categorized in Level 2 of the fair value hierarchy despite the availability of quoted prices because, as described above, the fund evaluates and determines whether those quoted prices reflect fair value at the close of the NYSE or require adjustment. OTC Bulletin Board securities, certain preferred securities, and equity securities traded in inactive markets generally are categorized in Level 2 of the fair value hierarchy.
Debt securities generally are traded in the OTC market. Securities with remaining maturities of one year or more at the time of acquisition are valued at prices furnished by dealers who make markets in such securities or by an independent pricing service, which considers the yield or price of bonds of comparable quality, coupon, maturity, and type, as well as prices quoted by dealers who make markets in such securities. Generally, debt securities are categorized in Level 2 of the fair value hierarchy; however, to the extent the valuations include significant unobservable inputs, the securities would be categorized in Level 3.
Investments in mutual funds are valued at the mutual fund’s closing NAV per share on the day of valuation and are categorized in Level 1 of the fair value hierarchy. Investments in private investment companies are valued at the investee’s NAV per share as of the valuation date, if available. If the investee’s NAV is not available as of the valuation date or is not calculated in accordance with GAAP, the Valuation Committee may adjust the investee’s NAV to reflect fair value at the valuation date. Investments in private investment companies generally are categorized either in Level 2 or 3, depending on the significance of unobservable inputs. Listed options, and OTC options with a listed equivalent, are valued at the mean of the closing bid and asked prices and generally are categorized in Level 2 of the fair value hierarchy. Financial futures contracts are valued at closing settlement prices and are categorized in Level 1 of the fair value hierarchy. Forward currency exchange contracts are valued using the prevailing forward exchange rate and are categorized in Level 2 of the fair value hierarchy. Assets and liabilities other than financial instruments, including short-term receivables and payables, are carried at cost, or estimated realizable value, if less, which approximates fair value.
Thinly traded financial instruments and those for which the above valuation procedures are inappropriate or are deemed not to reflect fair value are stated at fair value as determined in good faith by the Valuation Committee. The objective of any fair value pricing determination is to arrive at a price that could reasonably be expected from a current sale. Financial instruments fair valued by the Valuation Committee are primarily private placements, restricted securities, warrants, rights, and other securities that are not publicly traded.
Subject to oversight by the Board, the Valuation Committee regularly makes good faith judgments to establish and adjust the fair valuations of certain securities as events occur and circumstances warrant. For instance, in determining the fair value of an equity investment with limited market activity, such as a private placement or a thinly traded public company stock, the Valuation Committee considers a variety of factors, which may include, but are not limited to, the issuer’s business prospects, its financial standing and performance, recent investment transactions in the issuer, new rounds of financing, negotiated transactions of significant size between other investors in the company, relevant market valuations of peer companies, strategic events affecting the company, market liquidity for the issuer, and general economic conditions and events. In consultation with the investment and pricing teams, the Valuation Committee will determine an appropriate valuation technique based on available information, which may include both observable and unobservable inputs. The Valuation Committee typically will afford greatest weight to actual prices in arm’s length transactions, to the extent they represent orderly transactions between market participants; transaction information can be reliably obtained; and prices are deemed representative of fair value. However, the Valuation Committee may also consider other valuation methods such as market-based valuation multiples; a discount or premium from market value of a similar, freely traded security of the same issuer; or some combination. Fair value determinations are reviewed on a regular basis and updated as information becomes available, including actual purchase and sale transactions of the issue. Because any fair value determination involves a significant amount of judgment, there is a degree of subjectivity inherent in such pricing decisions, and fair value prices determined by the Valuation Committee could differ from those of other market participants. Depending on the relative significance of unobservable inputs, including the valuation technique(s) used, fair valued securities may be categorized in Level 2 or 3 of the fair value hierarchy.
Valuation Inputs The following table summarizes the fund’s financial instruments, based on the inputs used to determine their fair values on April 30, 2014:
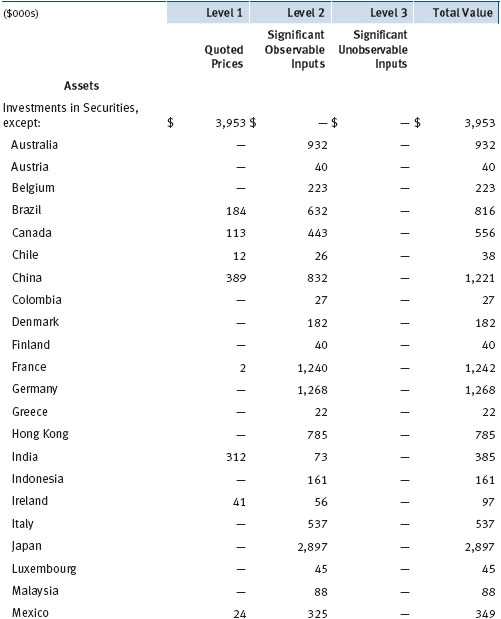
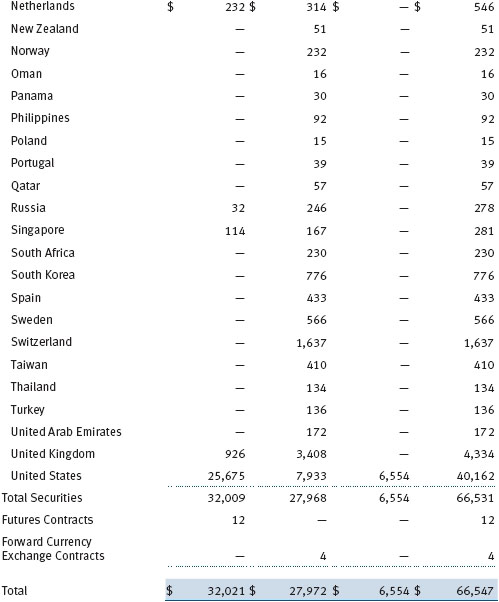
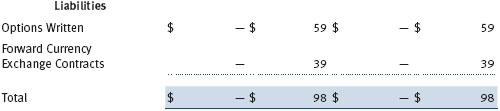
There were no material transfers between Levels 1 and 2 during the six months ended April 30, 2014.
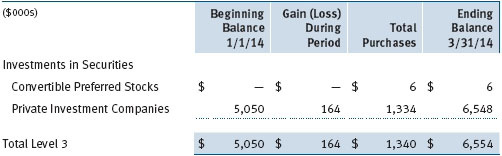
Following is a reconciliation of the fund’s Level 3 holdings for the six months ended April 30, 2014. Gain (loss) reflects both realized and change in unrealized gain/loss on Level 3 holdings during the period, if any, and is included on the accompanying Statement of Operations. The change in unrealized gain/loss on Level 3 instruments held at April 30, 2014, totaled $164,000 for the six months ended April 30, 2014.
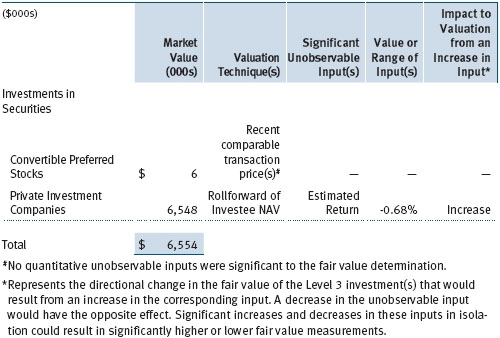
In accordance with GAAP, the following table provides quantitative information about significant unobservable inputs used to determine the fair valuations of the fund’s Level 3 assets, by class of financial instrument; it also indicates the sensitivity of the Level 3 valuations to changes in those significant unobservable inputs. Because the Valuation Committee considers a wide variety of factors and inputs, both observable and unobservable, in determining fair values, the unobservable inputs presented do not reflect all inputs significant to the fair value determination.
NOTE 3 - DERIVATIVE INSTRUMENTS
During the six months ended April 30, 2014, the fund invested in derivative instruments. As defined by GAAP, a derivative is a financial instrument whose value is derived from an underlying security price, foreign exchange rate, interest rate, index of prices or rates, or other variable; it requires little or no initial investment and permits or requires net settlement. The fund invests in derivatives only if the expected risks and rewards are consistent with its investment objectives, policies, and overall risk profile, as described in its prospectus and Statement of Additional Information. The fund may use derivatives for a variety of purposes, such as seeking to hedge against declines in principal value, increase yield, invest in an asset with greater efficiency and at a lower cost than is possible through direct investment, or to adjust credit exposure. The risks associated with the use of derivatives are different from, and potentially much greater than, the risks associated with investing directly in the instruments on which the derivatives are based. The fund at all times maintains sufficient cash reserves, liquid assets, or other SEC-permitted asset types to cover its settlement obligations under open derivative contracts.
The fund values its derivatives at fair value, as described in Note 2, and recognizes changes in fair value currently in its results of operations. Accordingly, the fund does not follow hedge accounting, even for derivatives employed as economic hedges. Generally, the fund accounts for its derivatives on a gross basis. It does not offset the fair value of derivative liabilities against the fair value of derivative assets on its financial statements, nor does it offset the fair value of derivative instruments against the right to reclaim or obligation to return collateral.
The following table summarizes the fair value of the fund’s derivative instruments held as of April 30, 2014, and the related location on the accompanying Statement of Assets and Liabilities, presented by primary underlying risk exposure:
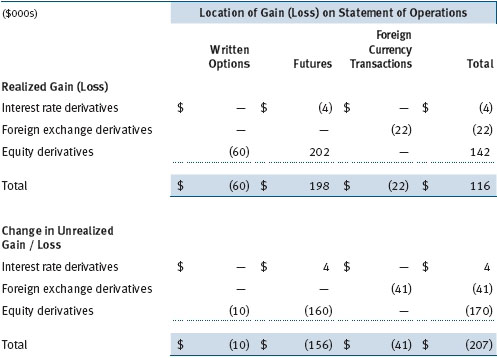
Additionally, the amount of gains and losses on derivative instruments recognized in fund earnings during the six months ended April 30, 2014, and the related location on the accompanying Statement of Operations is summarized in the following table by primary underlying risk exposure:
Counterparty Risk and Collateral The fund invests in derivatives in various markets, which expose it to differing levels of counterparty risk. Counterparty risk on exchange-traded and centrally cleared derivative contracts, such as futures, exchange-traded options, and centrally cleared swaps, is minimal because the clearinghouse provides protection against counterparty defaults. For futures and centrally cleared swaps, the fund is required to deposit collateral in an amount equal to a certain percentage of the contract value (margin requirement), and the margin requirement must be maintained over the life of the contract. Each clearing broker, in its sole discretion, may adjust the margin requirements applicable to the fund.
Derivatives, such as bilateral swaps, forward currency exchange contracts, and OTC options, that are transacted and settle directly with a counterparty (bilateral derivatives) expose the fund to greater counterparty risk. To mitigate this risk, the fund has entered into master netting arrangements (MNAs) with certain counterparties that permit net settlement under specified conditions and, for certain counterparties, also provide collateral agreements. MNAs may be in the form of International Swaps and Derivatives Association master agreements (ISDAs) or foreign exchange letter agreements (FX letters).
MNAs govern the ability to offset amounts the fund owes a counterparty against amounts the counterparty owes the fund (net settlement). Both ISDAs and FX letters generally allow net settlement in the event of contract termination and permit termination by either party prior to maturity upon the occurrence of certain stated events, such as failure to pay or bankruptcy. In addition, ISDAs specify other events, the occurrence of which would allow one of the parties to terminate. For example, a downgrade in credit rating of a counterparty would allow the fund to terminate while a decline in the fund’s net assets of more than a certain percentage would allow the counterparty to terminate. Upon termination, all bilateral derivatives with that counterparty would be liquidated and a net amount settled. ISDAs typically include collateral agreements whereas FX letters do not. Collateral requirements are determined based on the net aggregate unrealized gain or loss on all bilateral derivatives with each counterparty, subject to minimum transfer amounts that typically range from $100,000 to $250,000. Any additional collateral required due to changes in security values is transferred the next business day.
Collateral may be in the form of cash or debt securities issued by the U.S. government or related agencies. Cash and currencies posted by the fund are reflected as cash deposits in the accompanying financial statements and generally are restricted from withdrawal by the fund; securities posted by the fund are so noted in the accompanying Portfolio of Investments; both remain in the fund’s assets. Collateral pledged by counterparties is not included in the fund’s assets because the fund does not obtain effective control over those assets. For bilateral derivatives, collateral posted or received by the fund is held in a segregated account by the fund’s custodian. As of April 30, 2014, no collateral had been posted by the fund to counterparties for bilateral derivatives. As of April 30, 2014, cash of $82,000 had been posted by the fund for exchange-traded and/or centrally cleared derivatives.
Forward Currency Exchange Contracts The fund is subject to foreign currency exchange rate risk in the normal course of pursuing its investment objectives. It uses forward currency exchange contracts (forwards) primarily to protect its non-U.S. dollar-denominated securities from adverse currency movements relative to the U.S. dollar A forward involves an obligation to purchase or sell a fixed amount of a specific currency on a future date at a price set at the time of the contract. Although certain forwards may be settled by exchanging only the net gain or loss on the contract, most forwards are settled with the exchange of the underlying currencies in accordance with the specified terms. Forwards are valued at the unrealized gain or loss on the contract, which reflects the net amount the fund either is entitled to receive or obligated to deliver, as measured by the difference between the forward exchange rates at the date of entry into the contract and the forward rates at the reporting date. Appreciated forwards are reflected as assets, and depreciated forwards are reflected as liabilities on the accompanying Statement of Assets and Liabilities. Risks related to the use of forwards include the possible failure of counterparties to meet the terms of the agreements; that anticipated currency movements will not occur, thereby reducing the fund’s total return; and the potential for losses in excess of the fund’s initial investment. During the six months ended April 30, 2014, the fund’s exposure to forwards, based on underlying notional amounts, was generally between 7% and 8% of net assets.
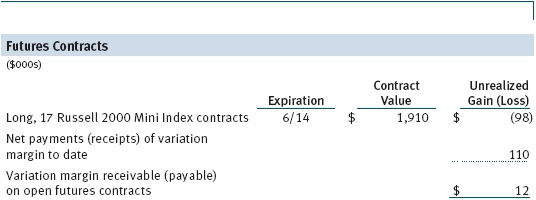
Futures Contracts The fund is subject to interest rate risk and equity price risk in the normal course of pursuing its investment objectives and uses futures contracts to help manage such risks. The fund may enter into futures contracts to manage exposure to interest rates, security prices, foreign currencies, and credit quality; as an efficient means of adjusting exposure to all or part of a target market; to enhance income; as a cash management tool; or to adjust credit exposure. A futures contract provides for the future sale by one party and purchase by another of a specified amount of a particular underlying financial instrument at an agreed-upon price, date, time, and place. The fund currently invests only in exchange-traded futures, which generally are standardized as to maturity date, underlying financial instrument, and other contract terms. Payments are made or received by the fund each day to settle daily fluctuations in the value of the contract (variation margin), which reflect changes in the value of the underlying financial instrument. Variation margin is recorded as unrealized gain or loss until the contract is closed. The value of a futures contract included in net assets is the amount of unsettled variation margin; net variation margin receivable is reflected as an asset and net variation margin payable is reflected as a liability on the accompanying Statement of Assets and Liabilities. Risks related to the use of futures contracts include possible illiquidity of the futures markets, contract prices that can be highly volatile and imperfectly correlated to movements in hedged security values and interest rates, and potential losses in excess of the fund’s initial investment. During the six months ended April 30, 2014, the fund’s exposure to futures, based on underlying notional amounts, was approximately 3% of net assets.
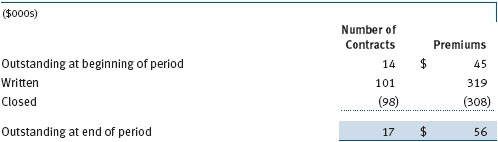
Options The fund is subject to equity price risk in the normal course of pursuing its investment objectives and uses options to help manage such risk. The fund may use index call and put options to manage exposure to security prices; as an efficient means of adjusting exposure to all or a part of a target market; to enhance income; as a cash management tool; or to adjust credit exposure. In return for a premium paid, index call and put options give the holder the right, but not the obligation, to receive cash, based on market movement, equal to the difference between the exercise settlement value of the index and the exercise price of the option. Options are included in net assets at fair value; purchased options are included in Investments in Securities; and written options are separately reflected as a liability on the accompanying Statement of Assets and Liabilities. Premiums on unexercised, expired options are recorded as realized gains or losses; premiums on exercised options are recorded as an adjustment to the proceeds from the sale or cost of the purchase. The difference between the premium and the amount received or paid in a closing transaction is also treated as realized gain or loss. Risks related to the use of options include possible illiquidity of the options market; trading restrictions imposed by an exchange; movements in underlying index values; and, for written options, potential losses in excess of the fund’s initial investment. During the six months ended April 30, 2014, the fund generally held between 14 and 17 written options contracts. Transactions in written options and related premiums received during the six months ended April 30, 2014, were as follows:
NOTE 4 - OTHER INVESTMENT TRANSACTIONS
Consistent with its investment objective, the fund engages in the following practices to manage exposure to certain risks and/or to enhance performance. The investment objective, policies, program, and risk factors of the fund are described more fully in the fund’s prospectus and Statement of Additional Information.
Restricted Securities The fund may invest in securities that are subject to legal or contractual restrictions on resale. Prompt sale of such securities at an acceptable price may be difficult and may involve substantial delays and additional costs.
Mortgage-Backed Securities The fund may invest in mortgage-backed securities (MBS or pass-through certificates) that represent an interest in a pool of specific underlying mortgage loans and entitle the fund to the periodic payments of principal and interest from those mortgages. MBS may be issued by government agencies or corporations, or private issuers. Most MBS issued by government agencies are guaranteed; however, the degree of protection differs based on the issuer. MBS are sensitive to changes in economic conditions that affect the rate of prepayments and defaults on the underlying mortgages; accordingly, the value, income, and related cash flows from MBS may be more volatile than other debt instruments.
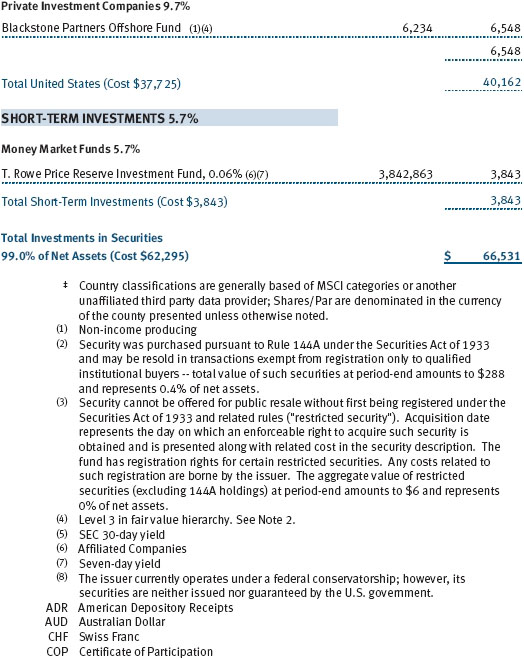
Investment in Blackstone Partners Offshore Fund The fund invested in Blackstone Partners Offshore Fund Ltd. (Blackstone Partners), a multi-strategy private investment company, to gain exposure to alternative investments primarily through Blackstone Partners’ investments in underlying private investment funds. Blackstone Partners and its underlying funds may use leverage, engage in short-selling, and invest in commodities or other speculative investments, which may increase the risk of investment loss. Blackstone Partners and its underlying funds are not subject to the same regulatory requirements as open-end mutual funds, and, therefore, their investments and related valuations may not be as transparent. Ownership interests in Blackstone Partners and certain of its underlying funds are not transferable and are subject to various redemption restrictions, such as advance notice requirements, limited redemption dates, and possible suspension of redemption rights. All of these restrictions are subject to change at the sole discretion of Blackstone Partners or an underlying fund’s management. As of April 30, 2014, the fund’s investment in Blackstone Partners is subject to semi-annual redemption with 95 days prior written notice and is considered an illiquid asset.
Other Purchases and sales of portfolio securities other than short-term securities aggregated $18,349,000 and $7,833,000, respectively, for the six months ended April 30, 2014. Purchases and sales of U.S. government securities aggregated $3,200,000 and $1,840,000, respectively, for the six months ended April 30, 2014.
NOTE 5 - FEDERAL INCOME TAXES
No provision for federal income taxes is required since the fund intends to continue to qualify as a regulated investment company under Subchapter M of the Internal Revenue Code and distribute to shareholders all of its taxable income and gains. Distributions determined in accordance with federal income tax regulations may differ in amount or character from net investment income and realized gains for financial reporting purposes. Financial reporting records are adjusted for permanent book/tax differences to reflect tax character but are not adjusted for temporary differences. The amount and character of tax-basis distributions and composition of net assets are finalized at fiscal year-end; accordingly, tax-basis balances have not been determined as of the date of this report. The fund intends to retain realized gains to the extent of available capital loss carryforwards. Net realized capital losses may be carried forward indefinitely to offset future realized capital gains.
At April 30. 2014, the cost of investments for federal income tax purposes was 62,472,000. Net unrealized gain aggregated 3,923,000 at period-end, of which 5,057,000 related to appreciated investments and 1,134,000 related to depreciated investments.
NOTE 6 - RELATED PARTY TRANSACTIONS
The fund is managed by T. Rowe Price Associates, Inc. (Price Associates), a wholly owned subsidiary of T. Rowe Price Group, Inc. (Price Group). The investment management agreement between the fund and Price Associates provides for an annual investment management fee, which is computed daily and paid monthly. The fee consists of an individual fund fee, equal to 0.40% of the fund’s average daily net assets, and a group fee. The group fee rate is calculated based on the combined net assets of certain mutual funds sponsored by Price Associates (the group) applied to a graduated fee schedule, with rates ranging from 0.48% for the first $1 billion of assets to 0.275% for assets in excess of $400 billion. The fund’s group fee is determined by applying the group fee rate to the fund’s average daily net assets. At April 30, 2014, the effective annual group fee rate was 0.29%.
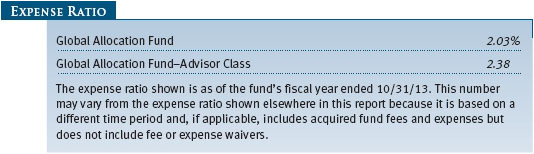
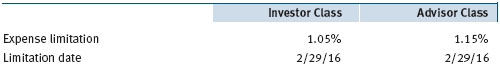
The Investor Class and Advisor Class are also each subject to a contractual expense limitation through the limitation dates indicated in the table below. During the limitation period, Price Associates is required to waive its management fee or reimburse expenses, excluding interest, taxes, brokerage commissions, and extraordinary expenses, that would otherwise cause the class’s ratio of annualized total expenses to average net assets (expense ratio) to exceed its expense limitation. Each class is required to repay Price Associates for expenses previously reimbursed and management fees waived to the extent the class’s net assets grow or expenses decline sufficiently to allow repayment without causing the class’s expense ratio to exceed its expense limitation. However, no repayment will be made more than three years after the date of a reimbursement or waiver.
Pursuant to this agreement, management fees in the amount of $154,000 were waived and expenses in the amount of $74,000 were reimbursed by Price Associates during the six months ended April 30, 2014. Including these amounts, management fees waived and expenses previously reimbursed by Price Associates in the amount of $377,000 remain subject to repayment at April 30, 2014.
In addition, the fund has entered into service agreements with Price Associates and two wholly owned subsidiaries of Price Associates (collectively, Price). Price Associates computes the daily share prices and provides certain other administrative services to the fund. T. Rowe Price Services, Inc., provides shareholder and administrative services in its capacity as the fund’s transfer and dividend-disbursing agent. T. Rowe Price Retirement Plan Services, Inc., provides subaccounting and recordkeeping services for certain retirement accounts invested in the Investor Class. For the six months ended April 30, 2014, expenses incurred pursuant to these service agreements were $102,000 for Price Associates; $19,000 for T. Rowe Price Services, Inc.; and less than $1,000 for T. Rowe Price Retirement Plan Services, Inc. The total amount payable at period-end pursuant to these service agreements is reflected as Due to Affiliates in the accompanying financial statements.
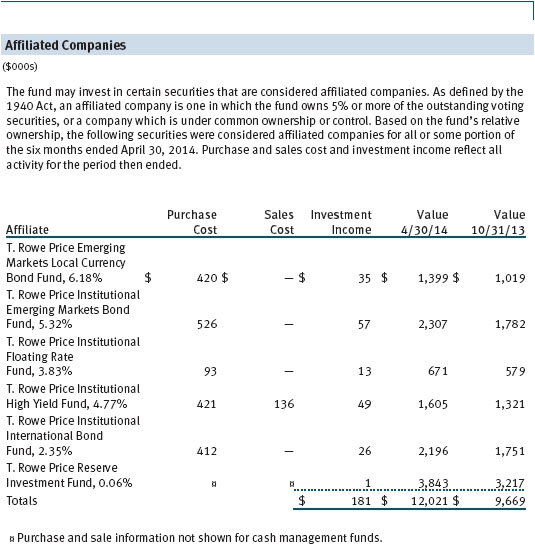
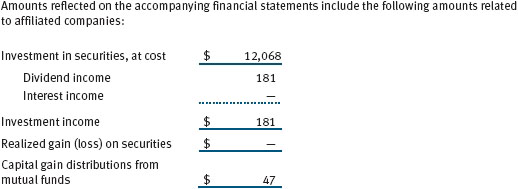
The fund may invest in the T. Rowe Price Reserve Investment Fund, the T. Rowe Price Government Reserve Investment Fund, or the T. Rowe Price Short-Term Reserve Fund (collectively, the Price Reserve Investment Funds), open-end management investment companies managed by Price Associates and considered affiliates of the fund. The Price Reserve Investment Funds are offered as short-term investment options to mutual funds, trusts, and other accounts managed by Price Associates or its affiliates and are not available for direct purchase by members of the public. The Price Reserve Investment Funds pay no investment management fees.
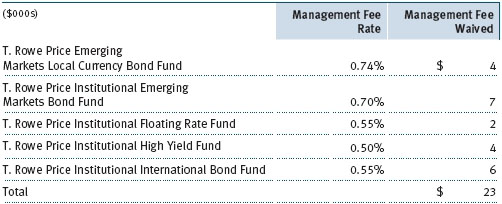
The fund may also invest in certain other T. Rowe Price fund(s) as a means of gaining efficient and cost-effective exposure to certain markets. The fund does not invest for the purpose of exercising management or control; however, investments by the fund may represent a significant portion of an underlying T. Rowe Price fund’s net assets. Each underlying T. Rowe Price fund is an open-end management investment company managed by Price Associates and is considered an affiliate of the fund. To ensure that the fund does not incur duplicate management fees (paid by the underlying T. Rowe Price fund(s) and the fund), Price Associates has agreed to permanently waive a portion of its management fee charged to the fund in an amount sufficient to fully offset that portion of management fees paid by each underlying T. Rowe Price fund related to the fund’s investment therein. The accompanying Statement of Operations reflects management fees permanently waived pursuant to this agreement.
Annual fee rates and management fees waived related to investments in the underlying T. Rowe Price fund(s) for the six months ended April 30, 2014, are as follows:
As of April 30, 2014, T. Rowe Price Group, Inc., or its wholly owned subsidiaries owned 2,475,000 shares of the Investor Class, and 25,000 shares of the Advisor Class, aggregating 40% of the fund’s net assets.
| Information on Proxy Voting Policies, Procedures, and Records |
A description of the policies and procedures used by T. Rowe Price funds and portfolios to determine how to vote proxies relating to portfolio securities is available in each fund’s Statement of Additional Information. You may request this document by calling 1-800-225-5132 or by accessing the SEC’s website, sec.gov.
The description of our proxy voting policies and procedures is also available on our website, troweprice.com. To access it, click on the words “Social Responsibility” at the top of our corporate homepage. Next, click on the words “Conducting Business Responsibly” on the left side of the page that appears. Finally, click on the words “Proxy Voting Policies” on the left side of the page that appears.
Each fund’s most recent annual proxy voting record is available on our website and through the SEC’s website. To access it through our website, follow the above directions to reach the “Conducting Business Responsibly” page. Click on the words “Proxy Voting Records” on the left side of that page, and then click on the “View Proxy Voting Records” link at the bottom of the page that appears.
| How to Obtain Quarterly Portfolio Holdings |
The fund files a complete schedule of portfolio holdings with the Securities and Exchange Commission for the first and third quarters of each fiscal year on Form N-Q. The fund’s Form N-Q is available electronically on the SEC’s website (sec.gov); hard copies may be reviewed and copied at the SEC’s Public Reference Room, 100 F St. N.E., Washington, DC 20549. For more information on the Public Reference Room, call 1-800-SEC-0330.
| Approval of Investment Management Agreement |
On April 30, 2014, the fund’s Board of Directors (Board), including a majority of the fund’s independent directors, approved the continuation of the investment management agreement (Advisory Contract) between the fund and its investment advisor, T. Rowe Price Associates, Inc. (Advisor). The April meeting followed a telephonic meeting held on March 4, 2014, during which the Board reviewed information and discussed the continuation of the Advisory Contract. In connection with its deliberations, the Board requested, and the Advisor provided, such information as the Board (with advice from independent legal counsel) deemed reasonably necessary. The Board considered a variety of factors in connection with its review of the Advisory Contract, also taking into account information provided by the Advisor during the course of the year, as discussed below:
Services Provided by the Advisor
The Board considered the nature, quality, and extent of the services provided to the fund by the Advisor. These services included, but were not limited to, directing the fund’s investments in accordance with its investment program and the overall management of the fund’s portfolio, as well as a variety of related activities such as financial, investment operations, and administrative services; compliance; maintaining the fund’s records and registrations; and shareholder communications. The Board also reviewed the background and experience of the Advisor’s senior management team and investment personnel involved in the management of the fund, as well as the Advisor’s compliance record. The Board concluded that it was satisfied with the nature, quality, and extent of the services provided by the Advisor.
Investment Performance of the Fund
The Board reviewed the fund’s three-month and since-inception returns and compared these returns with a wide variety of previously agreed-upon comparable performance measures and market data, including those supplied by Lipper and Morningstar, which are independent providers of mutual fund data.
On the basis of this evaluation and in light of the fund’s limited operating history, the Board concluded that the fund’s performance was satisfactory.
Costs, Benefits, Profits, and Economies of Scale
The Board reviewed detailed information regarding the revenues received by the Advisor under the Advisory Contract and other benefits that the Advisor (and its affiliates) may have realized from its relationship with the fund, including any research received under “soft dollar” agreements and commission-sharing arrangements with broker-dealers. The Board considered that the Advisor may receive some benefit from soft-dollar arrangements pursuant to which research is received from broker-dealers that execute the applicable fund’s portfolio transactions. The Board received information on the estimated costs incurred and profits realized by the Advisor from managing T. Rowe Price mutual funds. While the Board did not review information regarding profits realized from managing the fund, in particular because the fund had not achieved sufficient scale to produce meaningful profit margin percentages, the Board concluded that the Advisor’s profits were reasonable in light of the services provided to the funds.
The Board also considered whether the fund benefits under the fee levels set forth in the Advisory Contract from any economies of scale realized by the Advisor. Under the Advisory Contract, the fund pays a fee to the Advisor for investment management services composed of two components—a group fee rate based on the combined average net assets of most of the T. Rowe Price mutual funds (including the fund) that declines at certain asset levels and an individual fund fee rate based on the fund’s average daily net assets—and the fund pays its own expenses of operations (subject to an expense limitation agreed to by the Advisor with respect to both the Investor and Advisor Classes). The Board concluded that the advisory fee structure for the fund continued to provide for a reasonable sharing of benefits from any economies of scale with the fund’s investors.
Fees
The Board was provided with information regarding industry trends in management fees and expenses, and the Board reviewed the fund’s management fee rate, operating expenses, and total expense ratio (for the Investor Class and Advisor Class) in comparison with fees and expenses of other comparable funds based on information and data supplied by Lipper. The information provided to the Board indicated that the fund’s management fee rate (after including reductions of the management fee that resulted from the fund’s expense limitation and after including reductions of the management fee that resulted from the fund’s investments in other T. Rowe Price Funds) was at or below the median for comparable funds. The information also indicated that the total expense ratio (after including reductions of the management fee that resulted from fee waivers and/or expenses paid by the Advisor pursuant to the fund’s expense limitation) was below the median (for the Investor Class) and was above the median for certain groups of comparable funds and at or below the median for other groups of comparable funds (for the Advisor Class).
The Board also reviewed the fee schedules for institutional accounts and private accounts with similar mandates that are advised or subadvised by the Advisor and its affiliates. Management provided the Board with information about the Advisor’s responsibilities and services provided to institutional account clients, including information about how the requirements and economics of the institutional business are fundamentally different from those of the mutual fund business. The Board considered information showing that the mutual fund business is generally more complex from a business and compliance perspective than the institutional business and that the Advisor generally performs significant additional services and assumes greater risk in managing the fund and other T. Rowe Price mutual funds than it does for institutional account clients.
On the basis of the information provided and the factors considered, the Board concluded that the fees paid by the fund under the Advisory Contract are reasonable.
Approval of the Advisory Contract
As noted, the Board approved the continuation of the Advisory Contract. No single factor was considered in isolation or to be determinative to the decision. Rather, the Board concluded, in light of the fund’s limited operating history and a weighting and balancing of all factors considered, that it was in the best interests of the fund and its shareholders for the Board to approve the continuation of the Advisory Contract (including the fees to be charged for services thereunder). The independent directors were advised throughout the process by independent legal counsel.
Item 2. Code of Ethics.
A code of ethics, as defined in Item 2 of Form N-CSR, applicable to its principal executive officer, principal financial officer, principal accounting officer or controller, or persons performing similar functions is filed as an exhibit to the registrant’s annual Form N-CSR. No substantive amendments were approved or waivers were granted to this code of ethics during the registrant’s most recent fiscal half-year.
Item 3. Audit Committee Financial Expert.
Disclosure required in registrant’s annual Form N-CSR.
Item 4. Principal Accountant Fees and Services.
Disclosure required in registrant’s annual Form N-CSR.
Item 5. Audit Committee of Listed Registrants.
Not applicable.
Item 6. Investments.
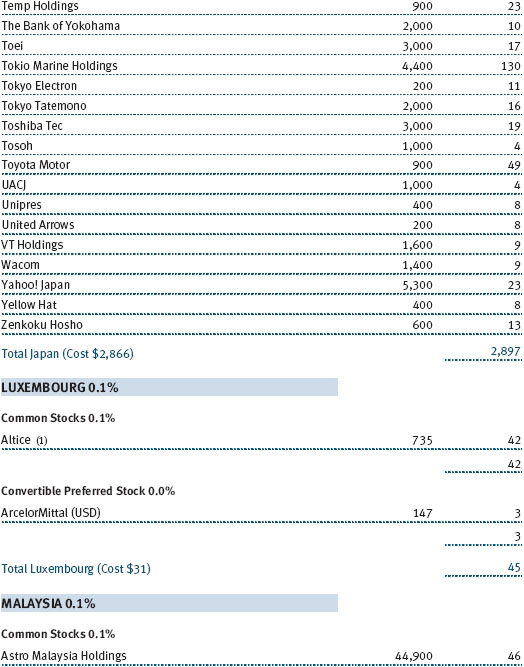
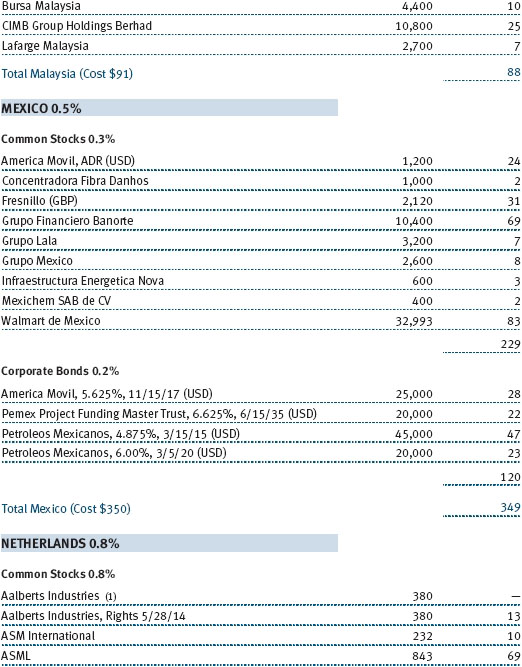
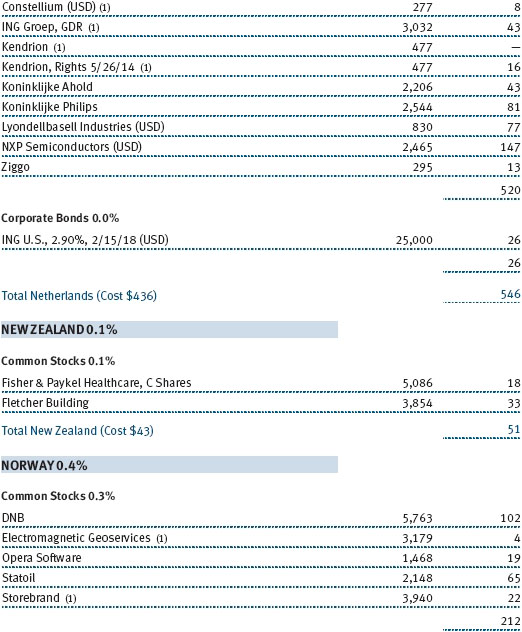
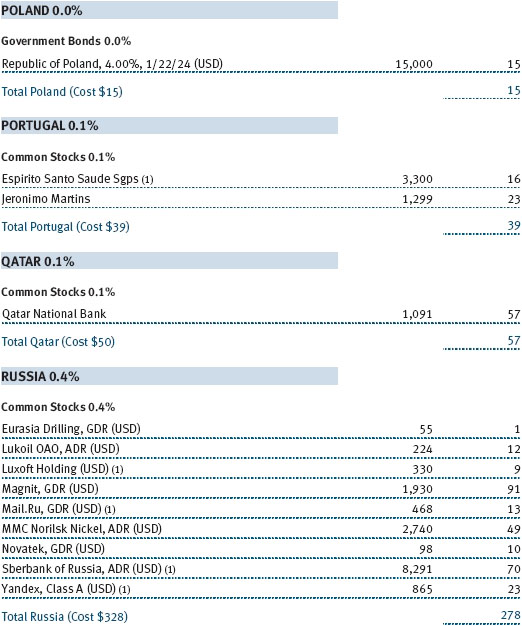
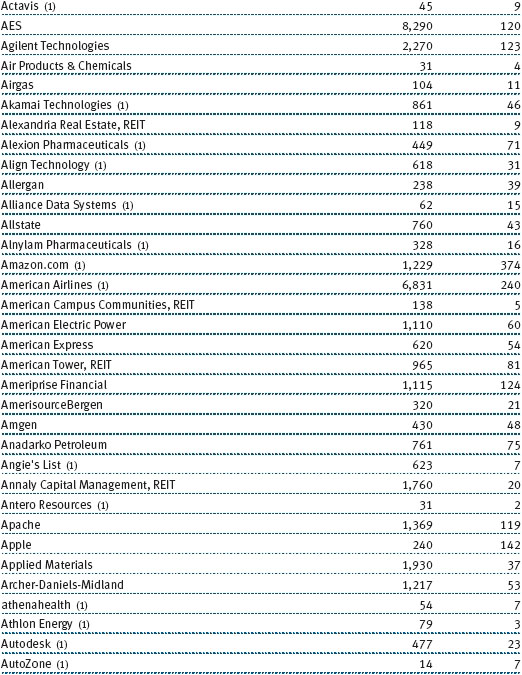
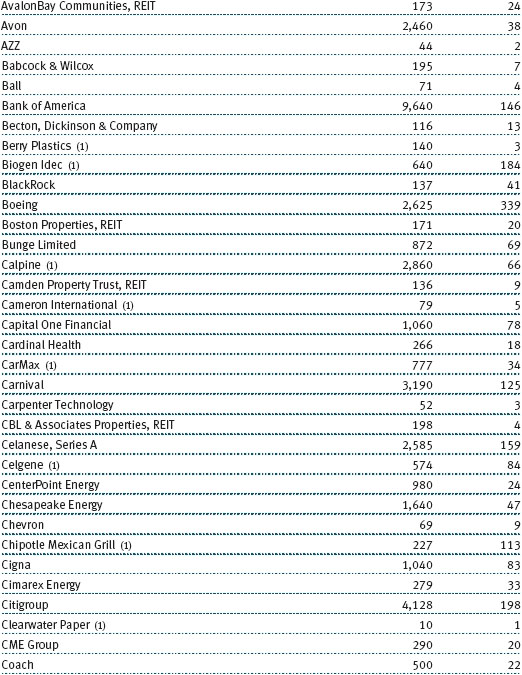
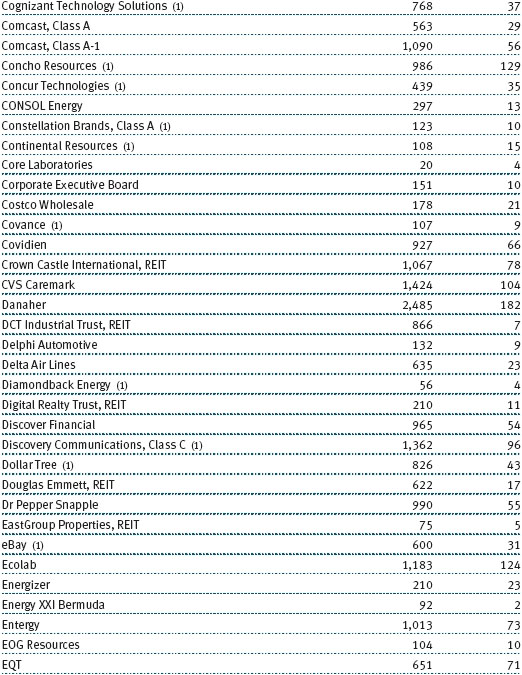
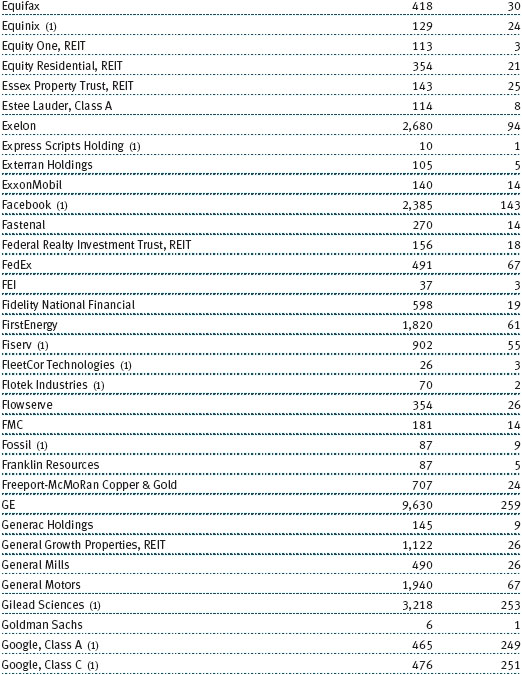
(a) Not applicable. The complete schedule of investments is included in Item 1 of this Form N-CSR.
(b) Not applicable.
Item 7. Disclosure of Proxy Voting Policies and Procedures for Closed-End Management Investment Companies.
Not applicable.
Item 8. Portfolio Managers of Closed-End Management Investment Companies.
Not applicable.
Item 9. Purchases of Equity Securities by Closed-End Management Investment Company and Affiliated Purchasers.
Not applicable.
Item 10. Submission of Matters to a Vote of Security Holders.
Not applicable.
Item 11. Controls and Procedures.
(a) The registrant’s principal executive officer and principal financial officer have evaluated the registrant’s disclosure controls and procedures within 90 days of this filing and have concluded that the registrant’s disclosure controls and procedures were effective, as of that date, in ensuring that information required to be disclosed by the registrant in this Form N-CSR was recorded, processed, summarized, and reported timely.
(b) The registrant’s principal executive officer and principal financial officer are aware of no change in the registrant’s internal control over financial reporting that occurred during the registrant’s second fiscal quarter covered by this report that has materially affected, or is reasonably likely to materially affect, the registrant’s internal control over financial reporting.
Item 12. Exhibits.
(a)(1) The registrant’s code of ethics pursuant to Item 2 of Form N-CSR is filed with the registrant’s annual Form N-CSR.
(2) Separate certifications by the registrant's principal executive officer and principal financial officer, pursuant to Section 302 of the Sarbanes-Oxley Act of 2002 and required by Rule 30a-2(a) under the Investment Company Act of 1940, are attached.
(3) Written solicitation to repurchase securities issued by closed-end companies: not applicable.
(b) A certification by the registrant's principal executive officer and principal financial officer, pursuant to Section 906 of the Sarbanes-Oxley Act of 2002 and required by Rule 30a-2(b) under the Investment Company Act of 1940, is attached.
SIGNATURES
Pursuant to the requirements of the Securities Exchange Act of 1934 and the Investment Company Act of 1940, the registrant has duly caused this report to be signed on its behalf by the undersigned, thereunto duly authorized.
T. Rowe Price Global Allocation Fund, Inc.
| By | /s/ Edward C. Bernard | |
| Edward C. Bernard | ||
| Principal Executive Officer | ||
| Date June 16, 2014 | ||
Pursuant to the requirements of the Securities Exchange Act of 1934 and the Investment Company Act of 1940, this report has been signed below by the following persons on behalf of the registrant and in the capacities and on the dates indicated.
| By | /s/ Edward C. Bernard | |
| Edward C. Bernard | ||
| Principal Executive Officer | ||
| Date June 16, 2014 | ||
| By | /s/ Gregory K. Hinkle | |
| Gregory K. Hinkle | ||
| Principal Financial Officer | ||
| Date June 16, 2014 | ||