Exhibit 99.1
 | ANALYST PRESENTATION APRIL 2014 STRICTLY CONFIDENTIAL |
 | DISCLAIMER By attending the meeting where this presentation is made, or by reading the presentation slides, you agree to be bound by the following limitations: This document has been prepared by Euronext Group N.V. (the “Company”) solely for the purposes of the analyst presentation to be held on April 8, 2014 ahead of the Company’s proposed initial public offering. This document is private and confidential and is not to be taken away, reproduced by any person, nor to be distributed or published, in whole or in part, by any medium or in any form for any purpose. No representation, warranty or undertaking, express or implied, is made as to, and no reliance should be placed on, the fairness, accuracy, completeness or correctness of the information or opinions contained herein. The Company is under no obligation to keep current this presentation and any opinion expressed is subject to change without notice. This presentation may include forward-looking statements, which are based on the Company’s current expectations and projections about future events. By their nature, forward-looking statements involve known and unknown risks, uncertainties, assumptions and other factors because they relate to events and depend on circumstances that will occur in the future whether or not outside the control of the Company. Such factors may cause actual results, performance or developments to differ materially from those expressed or implied by such forward-looking statements. Accordingly, no assurance is given that such forward-looking statements will prove to have been correct. They speak only as at the date at which they are made and the Company undertakes no obligation to update these forward-looking statements. Furthermore, the proposed IPO is subject to market conditions and regulatory approvals and there can be no assurance that the proposed IPO of the Company will be completed. This presentation may contain data pertaining to the Company’s potential markets and the industry and environment in which it operates. Some of these data comes from external sources or from Company’s estimates based on such sources. This presentation has been prepared solely by the Company. None of the Company, ABN AMRO Bank N.V., J.P. Morgan Securities plc, Société Générale, Goldman Sachs International, ING Bank N.V., Morgan Stanley & Co. International plc, Banco Bilbao Vizcaya Argentaria, S.A. and BMO Capital Markets Limited has independently verified the information contained herein and this presentation does not constitute any form of financial opinion or recommendation on the part of any of them or any of their affiliates. No representation or warranty, express or implied, is given by or on behalf of any such entities as to the accuracy or completeness of this presentation and no such entity shall have any liability whatsoever (in negligence or otherwise) for any loss howsoever arising from any use of this presentation, or its contents or otherwise arising in connection with it. ABN AMRO Bank N.V., J.P. Morgan Securities plc, Société Générale, Goldman Sachs International, ING Bank N.V., Morgan Stanley & Co. International plc, Banco Bilbao Vizcaya Argentaria, S.A. and BMO Capital Markets Limited are each acting only for the Company and IntercontinentalExchange Group, Inc., and will not be responsible to anyone other than the Company and IntercontinentalExchange Group, Inc. for providing the protections afforded to clients of such institutions or for providing advice, in relation to any potential investment into the Company. This presentation does not constitute or form part of, and should not be construed as, an offer to sell, or the solicitation of an offer to buy or acquire, securities of the Company, or an inducement to enter into investment activity. This presentation is not intended to form the basis of any investment decision. The provision of this presentation shall not be taken as any form of commitment on the part of the Company to proceed with any negotiations or any transaction. This presentation is not intended for distribution to, or use by, any person or entity in any jurisdiction or country where such distribution would be contrary to law or regulation. In particular this presentation and the information contained herein does not constitute or form part of, and should not be construed as, an offer or sale of securities and may not be disseminated, directly or indirectly, in the United States, except to persons that are “qualified institutional buyers” as such term is defined in Rule 144A under the United States Securities Act of 1933, as amended (the “Securities Act”), and outside the United States in compliance with Regulation S under the Securities Act. This presentation is not being distributed by, nor has it been approved for the purposes of Section 21 of the Financial Services and Markets Act 2000 (the “FSMA”) by, a person authorised under the FSMA. This presentation is being distributed to and is directed only at (i) persons who are outside the United Kingdom or (ii) persons who are investment professionals within the meaning of Article 19(5) of the Financial Services and Markets Act 2000 (Financial Promotion) Order 2005 (the “Order”) (iii) persons falling within Article 49(2)(a) to (d) (“high net worth companies, unincorporated associations etc.”) of the Financial Promotion Order, and (iv) persons to whom an invitation or inducement to engage in investment activity (within the meaning of Section 21 of the FSMA) in connection with the issue or sale of any securities may otherwise lawfully be communicated or caused to be communicated (all such persons together being referred to as “Relevant Persons”). Any investment activity to which this communication relates will only be available to and will only be engaged with, Relevant Persons. Any person who is not a Relevant Person should not act or rely on this document or any of its contents. This presentation does not constitute an advertisement, marketing material, investment advice or recommendation, solicitation or inducement to sell, purchase or otherwise invest in or dispose of any securities of the Company. This document is being distributed to and is directed at only persons in member states of the European Economic Area (the “EEA”) who are “qualified investors” within the meaning of Article 2(1)(e) of the Prospectus Directive (Directive 2003/71/EC, as amended) (“Qualified Investors”). Any person in the EEA who is not a Qualified Investor should not act or rely on this document or any of its contents. Each person is strongly advised to seek its own independent advice in relation to any investment, financial, legal, tax, accounting or regulatory issues. This presentation should not be construed as legal, regulatory, tax, accounting, investment or other advice. Analyses and opinions contained herein may be based on assumptions that, if altered, can change the analyses or opinions expressed. Nothing contained herein shall constitute any representation or warranty as to future performance of any security, credit, currency, rate or other market or economic measure. The Company’s past performance is not necessarily indicative of future results. No reliance may be placed for any purpose whatsoever on the information contained in this presentation or any other material discussed verbally, or on its completeness, accuracy or fairness. This presentation does not constitute a recommendation with respect to any securities. 2 #417362300 |
 | EURONEXT PRESENTING TEAM Dominique Cerutti Group Chief Executive Officer Amaury Dauge Lee Hodgkinson Head of Markets & Group Chief Financial Global Sales Officer CEO of Euronext London Diederik Zandstra Anthony Attia Head of Corporate Client CEO of Euronext Paris Group Nick Thornton Catherine Langlais Global Head of Market General Counsel Solutions 3 |
 | TODAY’S AGENDA No. Section Approximate time Presenter Welcome coffee 10.00 CET 30 minutes I. Introduction 10.30 CET 15 minutes J.P. Morgan II. Investment highlights 10.45 CET 1 hour Dominique Cerutti III. Euronext business overview 1. - Listing 11.45 CET 30 minutes Diederik Zandstra 2. - Cash trading 12.15 CET 30 minutes Lee Hodgkinson 3. - Derivatives trading 12.45 CET 30 minutes Lee Hodgkinson Lunch break 13.15 CET 1 hour 4. - Market data & indices 14.15 CET 30 minutes Lee Hodgkinson 5. - Universal trading platform 14.45 CET 20 minutes Anthony Attia 6. - Market solutions & other 15.05 CET 20 minutes Nick Thornton 7. - Post-trade 15.25 CET 15 minutes Lee Hodgkinson Break 15.40 CET 20 minutes IV. Financials 16.00 CET 1 hour Amaury Dauge V. Governance & regulation 17.00 CET 30 minutes Catherine Langlais VI. Concluding remarks 17.30 CET 15 minutes Dominique Cerutti Questions and answers 17.45 CET 4 |
 | I Introduction 5 |
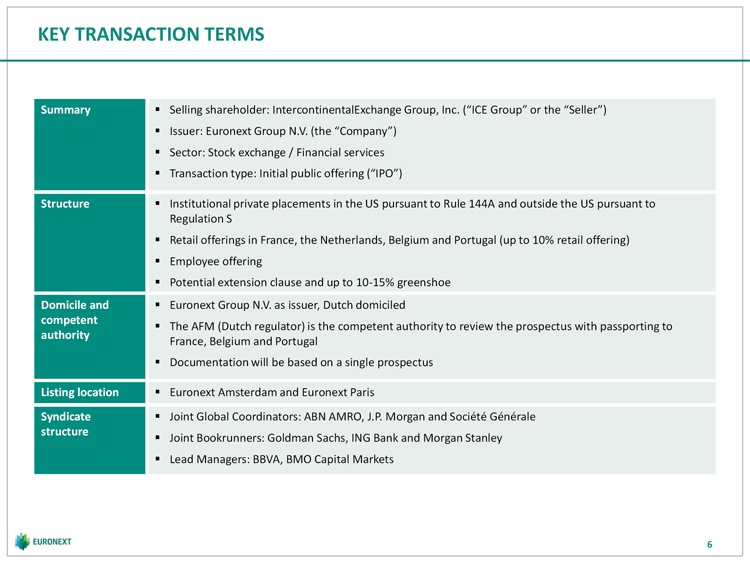 | KEY TRANSACTION TERMS Summary Selling shareholder: IntercontinentalExchange Group, Inc. (“ICE Group” or the “Seller”) Issuer: Euronext Group N.V. (the “Company”) Sector: Stock exchange / Financial services Transaction type: Initial public offering (“IPO”) Structure Institutional private placements in the US pursuant to Rule 144A and outside the US pursuant to Regulation S Retail offerings in France, the Netherlands, Belgium and Portugal (up to 10% retail offering) Employee offering Potential extension clause and up to 10-15% greenshoe Domicile and Euronext Group N.V. as issuer, Dutch domiciled competent The AFM (Dutch regulator) is the competent authority to review the prospectus with passporting to authority France, Belgium and Portugal Documentation will be based on a single prospectus Listing location Euronext Amsterdam and Euronext Paris Syndicate Joint Global Coordinators: ABN AMRO, J.P. Morgan and Société Générale structure Joint Bookrunners: Goldman Sachs, ING Bank and Morgan Stanley Lead Managers: BBVA, BMO Capital Markets 6 |
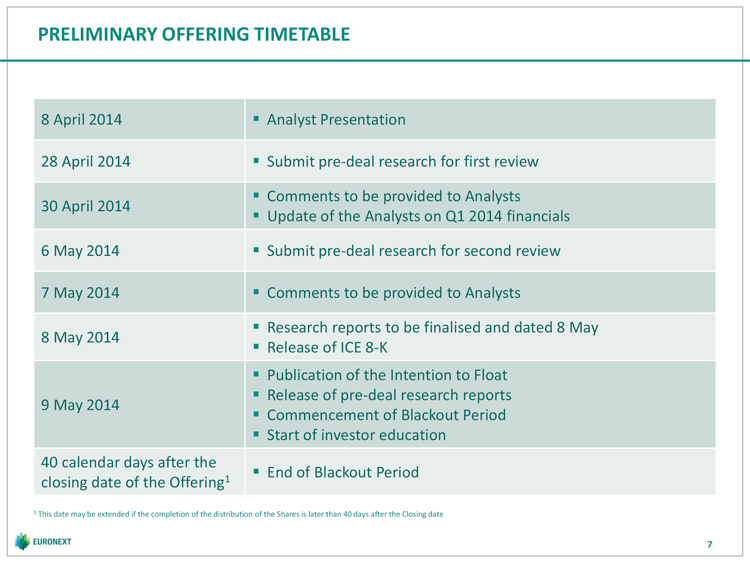 | PRELIMINARY OFFERING TIMETABLE 8 April 2014 Analyst Presentation 28 April 2014 Submit pre-deal research for first review Comments to be provided to Analysts 30 April 2014 Update of the Analysts on Q1 2014 financials 6 May 2014 Submit pre-deal research for second review 7 May 2014 Comments to be provided to Analysts Research reports to be finalised and dated 8 May 8 May 2014 Release of ICE 8-K Publication of the Intention to Float Release of pre-deal research reports 9 May 2014 Commencement of Blackout Period Start of investor education 40 calendar days after the End of Blackout Period closing date of the Offering1 1 This date may be extended if the completion of the distribution of the Shares is later than 40 days after the Closing date 7 |
 | RESEARCH GUIDELINES AND KEY CONTACTS All research analysts must comply with their respective research guidelines Restricted period: From the date you received invitations to this presentation until the start of the Blackout period No distribution in the United States, Canada, Japan or Australia Research reports should be prepared and delivered only in physical form (hard copy) and should not be made available to anyone through electronic means (e.g., by e-mail) or, subject to previous and express approval by the Joint Global Coordinators, included in any electronic retrieval system (e.g., posted on any Internet website) Blackout period: No research publication may be distributed to investors until the later of (i) 40 calendar days after the closing of the Offering or (ii) upon completion of the Offering (as notified to you by the Joint Global Coordinators) Questions to be sent to: Underwriters’ counsel Euronext’s Linklaters investor relations Bertrand Sénéchal Stephanie Bia +33 1 5643 5742 +33 1 4927 1268 bertrand.senechal@linklaters.com sbia@nyx.com 8 |
 | II Investment highlights |
 | KEY INVESTMENT HIGHLIGHTS Leading pan-European equities and derivatives platform with unique single order book model creating 1 unrivalled depth and liquidity 2 Established and diversified sources of revenues 3 State-of-the-art multi-product, multi-currency and low latency technology platform 4 European economy on the cusp of recovery with favourable sector dynamics and increasing market activity Independence allows new strategy to be executed, increasing potential for product innovation, asset class 5 diversification, operating optimisation and efficiencies 6 Low capital intensity, resilient free cash flow generation and strong dividend potential 7 Experienced management team with a deep bench of talent 10 |
 | 1 LEADING PAN-EUROPEAN EQUITIES AND DERIVATIVES PLATFORM … A leading pan-European trading platform A leading cash equities trading platform and the premier Domestic market cap of listed companies ( bn as of 28 February 2014) continental listing and financing venue 3,271 2,698 Attractive platform for corporate issuers with critical 1,427 1,170 983 mass of more than 1,300 listed companies 799 495 198 156 153 Blue chip franchise with 24 issuers listed on Euronext LSEG DB1 SIX OMX BME MOEX Oslo WSE Irish in EURO STOXX 50 benchmark Number of companies listed1 (as of 28 February 2014) Liquid pan-European trading market with c. 1.4trn 2,733 1,303 traded over the last twelve months as per February 894 2014 754 713 274 272 258 252 218 Approximately 4,600 corporate, financials and LSEG WSE OMX DB1 Luxemb. SIX MOEX Athens Oslo government bonds listed Cash trading volume2 ( bn, LTM total as per 28 February 2014) 2,427 #4 bond market in continental Europe by total bonds 1,358 1,076 listed (as per WFE data) 893 549 531 299 195 108 60 Established local derivatives platform, well positioned to LSEG DB1 BME OMX SIX Istanbul MOEX Oslo WSE capture underexploited opportunities Derivatives open interest3 (lots in mm, monthly as of 28 February 2014) Important index contracts in CAC 40, AEX 25, BEL 20, 91 36 PSI 20 and benchmark French milling wheat contract 17 13 7 Active local markets with derivative trading culture 3 1 1 0.2 0.2 Significant new product opportunities (e.g. single stock DB1 LIFFE BME OMX LME Oslo Istanbul Athens WSE futures and new commodity products) Source: WFE for non-Euronext data Note: For derivatives open interest data, ICE Europe was excluded due to unavailability of data from WFE 1 Excluding BME, where data includes a large percentage of OEICs; 2 Excluding reported trades; 3 Excluding Moscow Exchange, due to small contract size of derivatives transactions 11 |
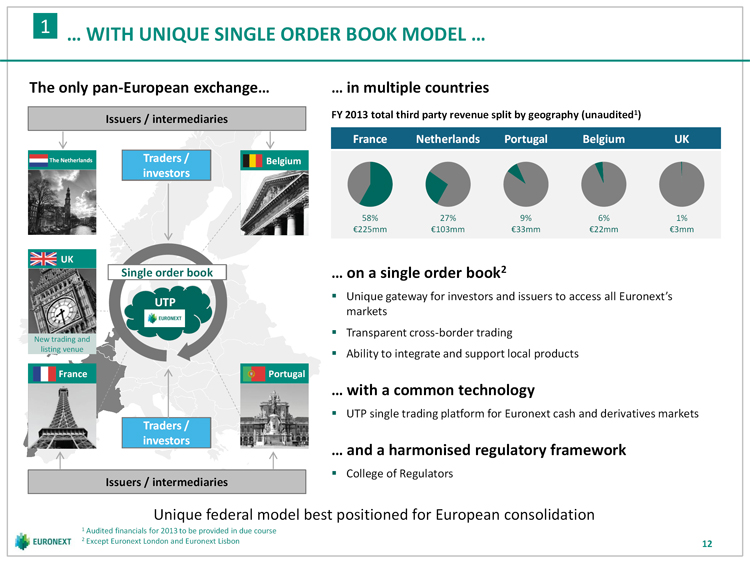 | 1 … WITH UNIQUE SINGLE ORDER BOOK MODEL … The only pan-European exchange… … in multiple countries Issuers / intermediaries FY 2013 total third party revenue split by geography (unaudited1) France Netherlands Portugal Belgium UK The Netherlands Traders / Belgium investors 58% 27% 9% 6% 1% 225mm 103mm 33mm 22mm 3mm UK Single order book … on a single order book2 Unique gateway for investors and issuers to access all Euronext’s UTP markets Transparent cross-border trading New trading and listing venue Ability to integrate and support local products France Portugal … with a common technology UTP single trading platform for Euronext cash and derivatives markets Traders / investors … and a harmonised regulatory framework College of Regulators Issuers / intermediaries Unique federal model best positioned for European consolidation 1 Audited financials for 2013 to be provided in due course 2 Except Euronext London and Euronext Lisbon 12 |
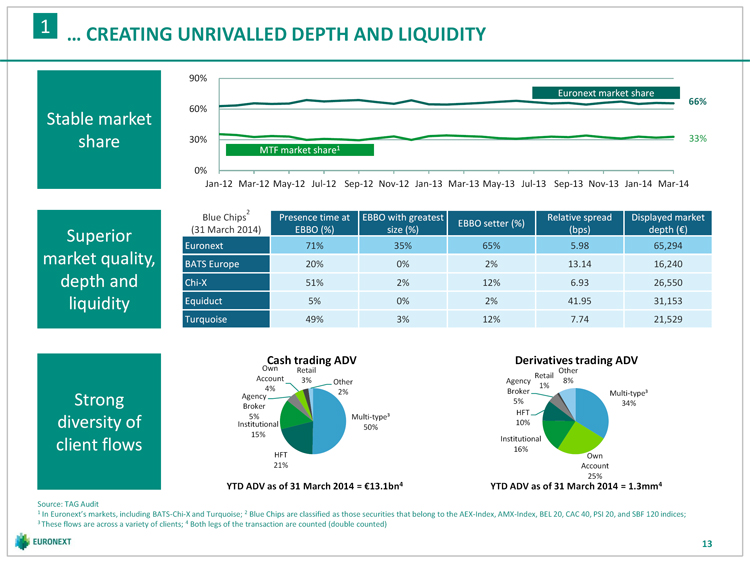 | 1 … CREATING UNRIVALLED DEPTH AND LIQUIDITY 90% Euronext market share 66% 60% Stable market share 30% 33% MTF market share1 0% Jan-12 Mar-12 May-12 Jul-12 Sep-12 Nov-12 Jan-13 Mar-13 May-13 Jul-13 Sep-13 Nov-13 Jan-14 Mar-14 Blue Chips2 Presence time at EBBO with greatest Relative spread Displayed market EBBO setter (%) Superior (31 March 2014) EBBO (%) size (%) (bps) depth ( ) Euronext 71% 35% 65% 5.98 65,294 market quality, BATS Europe 20% 0% 2% 13.14 16,240 depth and Chi-X 51% 2% 12% 6.93 26,550 liquidity Equiduct 5% 0% 2% 41.95 31,153 Turquoise 49% 3% 12% 7.74 21,529 Cash trading ADV Derivatives trading ADV Own Retail Other Account Retail 3% Other Agency 8% 4% 1% 2% Broker Multi-type³ Agency Strong 5% 34% Broker HFT 5% Multi-type³ diversity of Institutional 10% 50% 15% client flows Institutional 16% HFT Own 21% Account 25% YTD ADV as of 31 March 2014 = 13.1bn4 YTD ADV as of 31 March 2014 = 1.3mm4 Source: TAG Audit 1 In Euronext’s markets, including BATS-Chi-X and Turquoise; 2 Blue Chips are classified as those securities that belong to the AEX-Index, AMX-Index, BEL 20, CAC 40, PSI 20, and SBF 120 indices; 3 These flows are across a variety of clients; 4 Both legs of the transaction are counted (double counted) 13 |
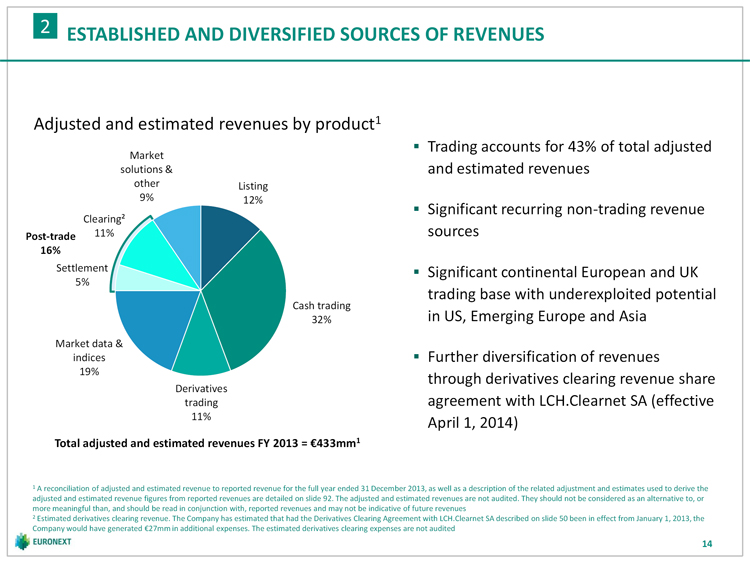 | 2 ESTABLISHED AND DIVERSIFIED SOURCES OF REVENUES Adjusted and estimated revenues by product1 Trading accounts for 43% of total adjusted Market solutions & and estimated revenues other Listing 9% 12% Significant recurring non-trading revenue Clearing² Post-trade 11% sources 16% Settlement Significant continental European and UK 5% trading base with underexploited potential Cash trading in US, Emerging Europe and Asia 32% Market data & indices Further diversification of revenues 19% through derivatives clearing revenue share Derivatives trading agreement with LCH.Clearnet SA (effective 11% April 1, 2014) Total adjusted and estimated revenues FY 2013 = 433mm1 1 A reconciliation of adjusted and estimated revenue to reported revenue for the full year ended 31 December 2013, as well as a description of the related adjustment and estimates used to derive the adjusted and estimated revenue figures from reported revenues are detailed on slide 92. The adjusted and estimated revenues are not audited. They should not be considered as an alternative to, or more meaningful than, and should be read in conjunction with, reported revenues and may not be indicative of future revenues 2 Estimated derivatives clearing revenue. The Company has estimated that had the Derivatives Clearing Agreement with LCH.Clearnet SA described on slide 50 been in effect from January 1, 2013, the Company would have generated 27mm in additional expenses. The estimated derivatives clearing expenses are not audited 14 |
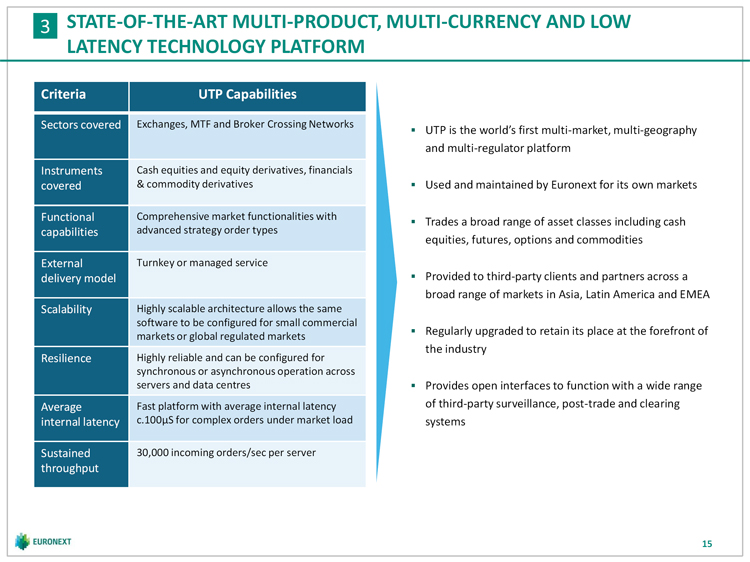 | 3 STATE-OF-THE-ART MULTI-PRODUCT, MULTI-CURRENCY AND LOW LATENCY TECHNOLOGY PLATFORM Criteria UTP Capabilities Sectors covered Exchanges, MTF and Broker Crossing Networks UTP is the world’s first multi-market, multi-geography and multi-regulator platform Instruments Cash equities and equity derivatives, financials covered & commodity derivatives Used and maintained by Euronext for its own markets Functional Comprehensive market functionalities with Trades a broad range of asset classes including cash capabilities advanced strategy order types equities, futures, options and commodities External Turnkey or managed service delivery model Provided to third-party clients and partners across a broad range of markets in Asia, Latin America and EMEA Scalability Highly scalable architecture allows the same software to be configured for small commercial Regularly upgraded to retain its place at the forefront of markets or global regulated markets the industry Resilience Highly reliable and can be configured for synchronous or asynchronous operation across servers and data centres Provides open interfaces to function with a wide range Average Fast platform with average internal latency of third-party surveillance, post-trade and clearing internal latency c.100µS for complex orders under market load systems Sustained 30,000 incoming orders/sec per server throughput 15 |
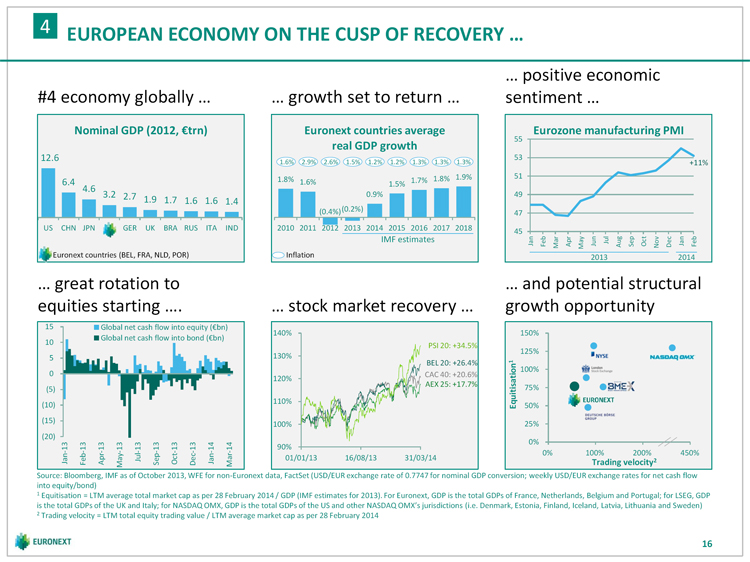 | 4 EUROPEAN ECONOMY ON THE CUSP OF RECOVERY … … positive economic #4 economy globally … … growth set to return … sentiment … Nominal GDP (2012, trn) Euronext countries average Eurozone manufacturing PMI 55 real GDP growth 12.6 53 1.6% 2.9% 2.6% 1.5% 1.2% 1.2% 1.3% 1.3% 1.3% +11% 1.9% 51 1.8% 1.6% 1.5% 1.7% 1.8% 6.4 4.6 3.2 0.9% 49 2.7 1.9 1.7 1.6 1.6 1.4 (0.4%) (0.2%) 47 US CHN JPN GER UK BRA RUS ITA IND 2010 2011 2012 2013 2014 2015 2016 2017 2018 45 IMF estimates Jan Feb Mar Apr May Jun Jul Aug Sep Oct Nov Dec Jan Feb Euronext countries (BEL, FRA, NLD, POR) Inflation 2013 2014 … great rotation to … and potential structural equities starting …. … stock market recovery … growth opportunity 15 Global net cash flow into equity ( bn) 140% 150% Global net cash flow into bond ( bn) 10 PSI 20: +34.5% 125% 5 130% BEL 20: +26.4% 1 100% 0 CAC 40: +20.6% 120% AEX 25: +17.7% (5) 75% 110% (10) Equitisation 50% (15) 25% 100% (20) 0% 90% 0% 100% 200% 450% Jan-13 Apr-13 Jul-13 Oct-13 Jan-14 01/01/13 16/08/13 31/03/14 Feb-13 May-13 Sep-13 Dec-13 Mar-14 Trading velocity2 Source: Bloomberg, IMF as of October 2013, WFE for non-Euronext data, FactSet (USD/EUR exchange rate of 0.7747 for nominal GDP conversion; weekly USD/EUR exchange rates for net cash flow into equity/bond) 1 Equitisation = LTM average total market cap as per 28 February 2014 / GDP (IMF estimates for 2013). For Euronext, GDP is the total GDPs of France, Netherlands, Belgium and Portugal; for LSEG, GDP is the total GDPs of the UK and Italy; for NASDAQ OMX, GDP is the total GDPs of the US and other NASDAQ OMX’s jurisdictions (i.e. Denmark, Estonia, Finland, Iceland, Latvia, Lithuania and Sweden) 2 Trading velocity = LTM total equity trading value / LTM average market cap as per 28 February 2014 16 |
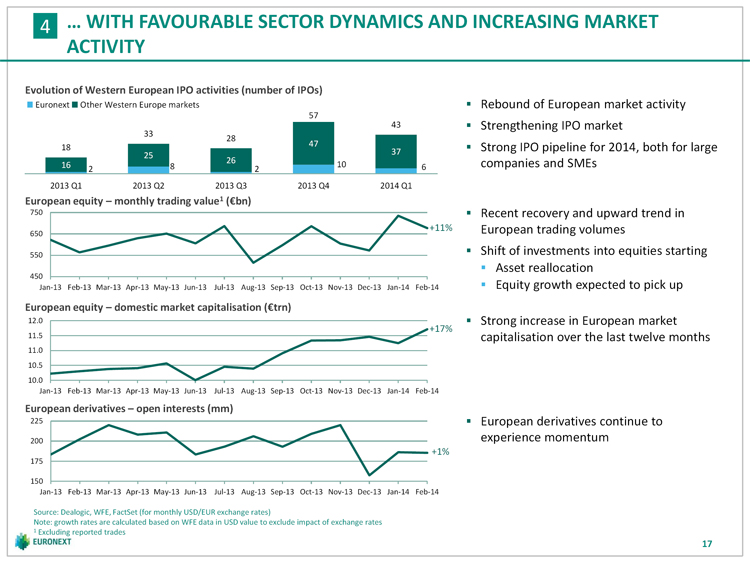 | 4 … WITH FAVOURABLE SECTOR DYNAMICS AND INCREASING MARKET ACTIVITY Evolution of Western European IPO activities (number of IPOs) Euronext Other Western Europe markets Rebound of European market activity 57 43 Strengthening IPO market 33 28 47 18 Strong IPO pipeline for 2014, both for large 37 25 26 16 8 10 6 companies and SMEs 2 2 2013 Q1 2013 Q2 2013 Q3 2013 Q4 2014 Q1 European equity monthly trading value1 ( bn) 750 Recent recovery and upward trend in +11% European trading volumes 650 550 Shift of investments into equities starting Asset reallocation 450 Jan-13 Feb-13 Mar-13 Apr-13 May-13 Jun-13 Jul-13 Aug-13 Sep-13 Oct-13 Nov-13 Dec-13 Jan-14 Feb-14 Equity growth expected to pick up European equity domestic market capitalisation ( trn) 12.0 Strong increase in European market +17% 11.5 capitalisation over the last twelve months 11.0 10.5 10.0 Jan-13 Feb-13 Mar-13 Apr-13 May-13 Jun-13 Jul-13 Aug-13 Sep-13 Oct-13 Nov-13 Dec-13 Jan-14 Feb-14 European derivatives open interests (mm) 225 European derivatives continue to 200 experience momentum +1% 175 150 Jan-13 Feb-13 Mar-13 Apr-13 May-13 Jun-13 Jul-13 Aug-13 Sep-13 Oct-13 Nov-13 Dec-13 Jan-14 Feb-14 Source: Dealogic, WFE, FactSet (for monthly USD/EUR exchange rates) Note: growth rates are calculated based on WFE data in USD value to exclude impact of exchange rates 1 Excluding reported trades 17 |
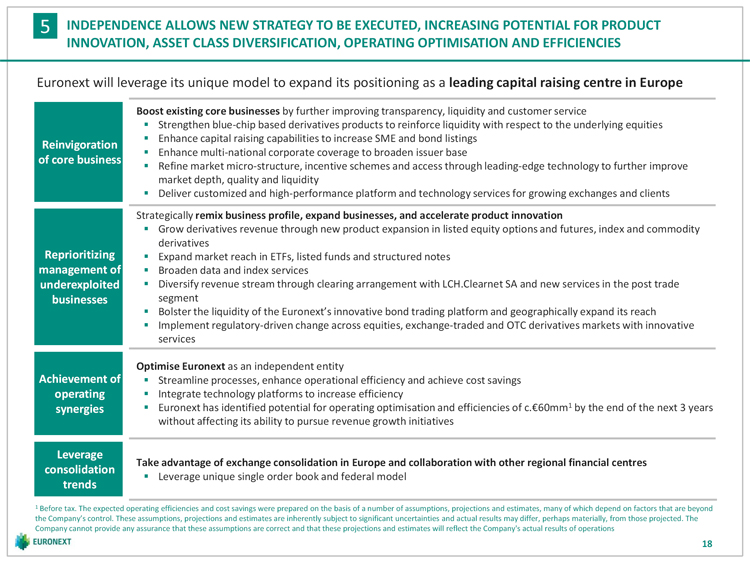 | 5 INDEPENDENCE ALLOWS NEW STRATEGY TO BE EXECUTED, INCREASING POTENTIAL FOR PRODUCT INNOVATION, ASSET CLASS DIVERSIFICATION, OPERATING OPTIMISATION AND EFFICIENCIES Euronext will leverage its unique model to expand its positioning as a leading capital raising centre in Europe Boost existing core businesses by further improving transparency, liquidity and customer service Strengthen blue-chip based derivatives products to reinforce liquidity with respect to the underlying equities Enhance capital raising capabilities to increase SME and bond listings Reinvigoration Enhance multi-national corporate coverage to broaden issuer base of core business Refine market micro-structure, incentive schemes and access through leading-edge technology to further improve market depth, quality and liquidity Deliver customized and high-performance platform and technology services for growing exchanges and clients Strategically remix business profile, expand businesses, and accelerate product innovation Grow derivatives revenue through new product expansion in listed equity options and futures, index and commodity derivatives Reprioritizing Expand market reach in ETFs, listed funds and structured notes management of Broaden data and index services underexploited Diversify revenue stream through clearing arrangement with LCH.Clearnet SA and new services in the post trade businesses segment Bolster the liquidity of the Euronext’s innovative bond trading platform and geographically expand its reach Implement regulatory-driven change across equities, exchange-traded and OTC derivatives markets with innovative services Optimise Euronext as an independent entity Achievement of Streamline processes, enhance operational efficiency and achieve cost savings operating Integrate technology platforms to increase efficiency synergies Euronext has identified potential for operating optimisation and efficiencies of c. 60mm1 by the end of the next 3 years without affecting its ability to pursue revenue growth initiatives Leverage Take advantage of exchange consolidation in Europe and collaboration with other regional financial centres consolidation Leverage unique single order book and federal model trends 1 Before tax. The expected operating efficiencies and cost savings were prepared on the basis of a number of assumptions, projections and estimates, many of which depend on factors that are beyond the Company’s control. These assumptions, projections and estimates are inherently subject to significant uncertainties and actual results may differ, perhaps materially, from those projected. The Company cannot provide any assurance that these assumptions are correct and that these projections and estimates will reflect the Company’s actual results of operations 18 |
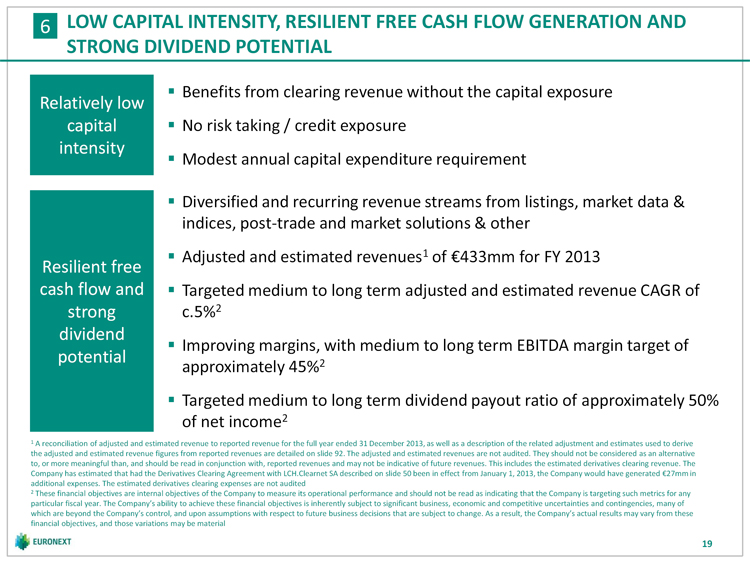 | 6 LOW CAPITAL INTENSITY, RESILIENT FREE CASH FLOW GENERATION AND STRONG DIVIDEND POTENTIAL Benefits from clearing revenue without the capital exposure Relatively low capital No risk taking / credit exposure intensity Modest annual capital expenditure requirement Diversified and recurring revenue streams from listings, market data & indices, post-trade and market solutions & other Adjusted and estimated revenues1 of 433mm for FY 2013 Resilient free cash flow and Targeted medium to long term adjusted and estimated revenue CAGR of strong c.5%2 dividend Improving margins, with medium to long term EBITDA margin target of potential approximately 45%2 Targeted medium to long term dividend payout ratio of approximately 50% of net income2 1 A reconciliation of adjusted and estimated revenue to reported revenue for the full year ended 31 December 2013, as well as a description of the related adjustment and estimates used to derive the adjusted and estimated revenue figures from reported revenues are detailed on slide 92. The adjusted and estimated revenues are not audited. They should not be considered as an alternative to, or more meaningful than, and should be read in conjunction with, reported revenues and may not be indicative of future revenues. This includes the estimated derivatives clearing revenue. The Company has estimated that had the Derivatives Clearing Agreement with LCH.Clearnet SA described on slide 50 been in effect from January 1, 2013, the Company would have generated 27mm in additional expenses. The estimated derivatives clearing expenses are not audited 2 These financial objectives are internal objectives of the Company to measure its operational performance and should not be read as indicating that the Company is targeting such metrics for any particular fiscal year. The Company’s ability to achieve these financial objectives is inherently subject to significant business, economic and competitive uncertainties and contingencies, many of which are beyond the Company’s control, and upon assumptions with respect to future business decisions that are subject to change. As a result, the Company’s actual results may vary from these financial objectives, and those variations may be material 19 |
 | 7 EXPERIENCED MANAGEMENT TEAM WITH A DEEP BENCH OF TALENT Dominique Cerutti Group Chief Executive Officer Joined NYSE Euronext in 2009 as President & Deputy CEO Member of the Managing Board Member of the Board of Directors of LCH.Clearnet Group Was a member of the Board of Directors of NYSE Euronext Previously led an international career with Top Executive roles at IBM including General Manager of IBM Europe and IBM Global Services EMEA Amaury Dauge Lee Hodgkinson Group Chief Financial Officer Head of Markets & Global Sales, CEO of Euronext London Has held various senior positions at Euronext and NYSE Euronext from 2001 including Member of the Managing Board COO of European Cash & Listing, Head of Euronext’s Corporate Finance, and Global Previously CEO of SWX Europe and a member of the Managing Board of Swiss Head of Corporate Planning Exchange AG Previously worked for Atos Consulting, PwC and BNP Paribas Over 20 years of financial markets’ experience, including 9 years at LSE Group Chief Operating Officer (currently being recruited) Diederik Zandstra Global role within Euronext, reporting to the Group CEO Head of Corporate Client Group Member of the Managing Board COO Joined NYSE Euronext in 2009 Directly responsible for all Market Operations of the Group and Information Previously over 12 years of IB and ECM experience at Credit Suisse First Boston, Technology Morgan Stanley and Renaissance Capital in New York and London Catherine Langlais Nick Thornton General Counsel Global Head of Market Solutions Has been with the Euronext Group since 1990, and the Executive Director of Legal and Held senior positions at LIFFE and NYSE Euronext since 1997 Regulatory Affairs for the Euronext group since 2004 Worked closely with clients in China, Japan, the Middle East and Poland Involved in the creation of Euronext in 2000, with the listing of Euronext NV in Paris in Formerly a managing consultant with PA Consulting Group 2001, and the subsequent strategic developments of Euronext Formerly member of the NYSE Euronext Management Committee Anthony Attia Cees Vermaas CEO of Euronext Paris CEO of Euronext Amsterdam Member of the Managing Board CEO of Euronext Amsterdam since 2010 Has held various senior positions at Euronext since 1997 including Executive Member of the Managing Board Director and Head of Operations. He was also in charge of the Universal Trading Previously held numerous managerial positions (Philips Group, IMC, CMG Finance) Platform. Within the NYSE Euronext leadership team, he was assisting Dominique Cerutti between 2010 and 2013 Vincent Van Dessel Luís Laginha de Sousa CEO of Euronext Brussels CEO of Euronext Lisbon CEO of Euronext Brussels since 2009 CEO of Euronext Lisbon since 2010 Member of the Managing Board Member of the Managing Board Previously worked at Brussels Stock Exchange as Director of Markets and Listing Previously 5 years as COO of Euronext Lisbon and Executive Board Member of from 1992 Caixaweb SGPS, SA and Board Member of several CGD Group companies in Portugal and Spain 20 |
 | III Euronext business overview |
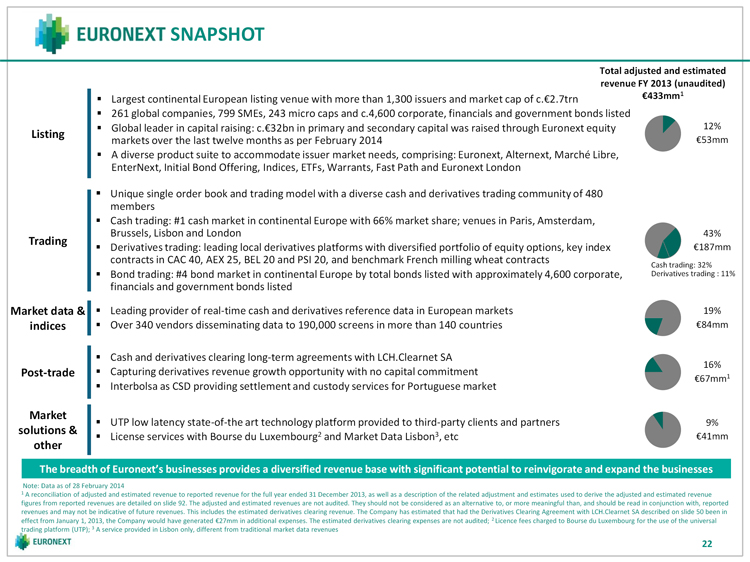 | SNAPSHOT Total adjusted and estimated revenue FY 2013 (unaudited) Largest continental European listing venue with more than 1,300 issuers and market cap of c. 2.7trn 433mm1 261 global companies, 799 SMEs, 243 micro caps and c.4,600 corporate, financials and government bonds listed Global leader in capital raising: c. 32bn in primary and secondary capital was raised through Euronext equity 12% Listing markets over the last twelve months as per February 2014 53mm A diverse product suite to accommodate issuer market needs, comprising: Euronext, Alternext, Marché Libre, EnterNext, Initial Bond Offering, Indices, ETFs, Warrants, Fast Path and Euronext London Unique single order book and trading model with a diverse cash and derivatives trading community of 480 members Cash trading: #1 cash market in continental Europe with 66% market share; venues in Paris, Amsterdam, Brussels, Lisbon and London 43% Trading Derivatives trading: leading local derivatives platforms with diversified portfolio of equity options, key index 187mm contracts in CAC 40, AEX 25, BEL 20 and PSI 20, and benchmark French milling wheat contracts Cash trading: 32% Bond trading: #4 bond market in continental Europe by total bonds listed with approximately 4,600 corporate, Derivatives trading : 11% financials and government bonds listed Market data & Leading provider of real-time cash and derivatives reference data in European markets 19% indices Over 340 vendors disseminating data to 190,000 screens in more than 140 countries 84mm Cash and derivatives clearing long-term agreements with LCH.Clearnet SA 16% Post-trade Capturing derivatives revenue growth opportunity with no capital commitment 67mm1 Interbolsa as CSD providing settlement and custody services for Portuguese market Market UTP low latency state-of-the art technology platform provided to third-party clients and partners 9% solutions & License services with Bourse du Luxembourg2 and Market Data Lisbon3, etc 41mm other The breadth of Euronext’s businesses provides a diversified revenue base with significant potential to reinvigorate and expand the businesses Note: Data as of 28 February 2014 1 A reconciliation of adjusted and estimated revenue to reported revenue for the full year ended 31 December 2013, as well as a description of the related adjustment and estimates used to derive the adjusted and estimated revenue figures from reported revenues are detailed on slide 92. The adjusted and estimated revenues are not audited. They should not be considered as an alternative to, or more meaningful than, and should be read in conjunction with, reported revenues and may not be indicative of future revenues. This includes the estimated derivatives clearing revenue. The Company has estimated that had the Derivatives Clearing Agreement with LCH.Clearnet SA described on slide 50 been in effect from January 1, 2013, the Company would have generated 27mm in additional expenses. The estimated derivatives clearing expenses are not audited; 2 Licence fees charged to Bourse du Luxembourg for the use of the universal trading platform (UTP); 3 A service provided in Lisbon only, different from traditional market data revenues 22 |
 | LISTING |
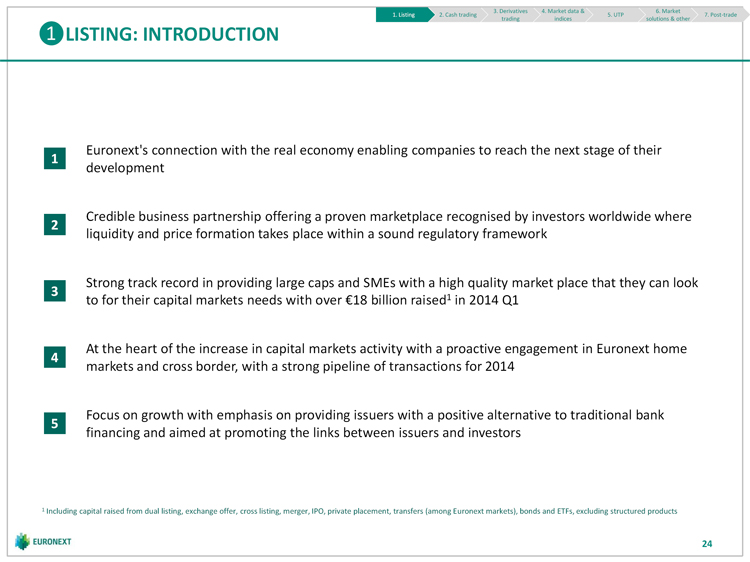 | 3. Derivatives 4. Market data & 6. Market 1. Listing 2. Cash trading 5. UTP 7. Post-trade trading indices solutions & other LISTING: INTRODUCTION Euronext’s connection with the real economy enabling companies to reach the next stage of their 1 development Credible business partnership offering a proven marketplace recognised by investors worldwide where 2 liquidity and price formation takes place within a sound regulatory framework Strong track record in providing large caps and SMEs with a high quality market place that they can look 3 to for their capital markets needs with over 18 billion raised1 in 2014 Q1 At the heart of the increase in capital markets activity with a proactive engagement in Euronext home 4 markets and cross border, with a strong pipeline of transactions for 2014 Focus on growth with emphasis on providing issuers with a positive alternative to traditional bank 5 financing and aimed at promoting the links between issuers and investors 1 Including capital raised from dual listing, exchange offer, cross listing, merger, IPO, private placement, transfers (among Euronext markets), bonds and ETFs, excluding structured products 24 |
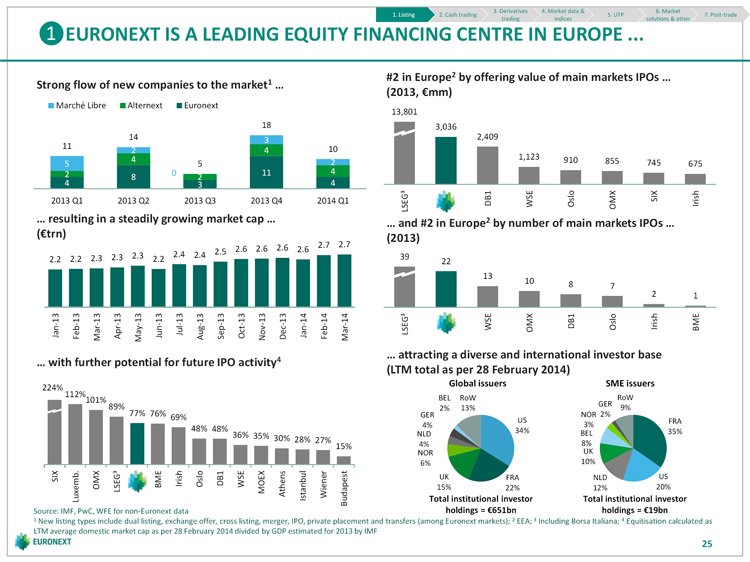 | 3. Derivatives 4. Market data & 6. Market 1. Listing 2. Cash trading 5. UTP 7. Post-trade trading indices solutions & other EURONEXT IS A LEADING EQUITY FINANCING CENTRE IN EUROPE ... #2 in Europe2 by offering value of main markets IPOs … Strong flow of new companies to the market1 … (2013, mm) Marché Libre Alternext Euronext 13,801 18 3,036 14 3 2,409 11 10 2 4 4 1,123 910 5 5 2 855 745 675 2 0 11 4 8 2 4 3 4 2013 Q1 2013 Q2 2013 Q3 2013 Q4 2014 Q1 LSEG³ DB1 WSE Oslo OMX SIX Irish … resulting in a steadily growing market cap … … and #2 in Europe2 by number of main markets IPOs … ( trn) (2013) 2.7 2.5 2.6 2.6 2.6 2.6 2.7 2.2 2.2 2.3 2.3 2.3 2.2 2.4 2.4 39 22 13 10 8 7 2 1 Jan-13 Feb-13 Mar-13 Apr-13 May-13 Jun-13 Jul-13 Aug-13 Sep-13 Oct-13 Nov-13 Dec-13 Jan-14 Feb-14 Mar-14 LSEG³ WSE OMX DB1 Oslo Irish BME … attracting a diverse and international investor base … with further potential for future IPO activity4 (LTM total as per 28 February 2014) Global issuers SME issuers 224% RoW 112% BEL RoW 101% GER 2% 13% 9% 89% 77% GER NOR 2% 76% 69% US FRA 4% 3% 48% 34% 35% 48% 36% NLD BEL 35% 30% 28% 27% 15% 4% 8% NOR UK 6% 10% SIX BME Irish Oslo DB1 WSE UK FRA NLD US OMX LSEG³ MOEX Athens Istanbul Wiener 15% 22% 12% 20% Luxemb. Budapest Total institutional investor Total institutional investor Source: IMF, PwC, WFE for non-Euronext data holdings = 651bn holdings = 19bn 1 New listing types include dual listing, exchange offer, cross listing, merger, IPO, private placement and transfers (among Euronext markets); 2 EEA; 3 Including Borsa Italiana; 4 Equitisation calculated as LTM average domestic market cap as per 28 February 2014 divided by GDP estimated for 2013 by IMF 25 |
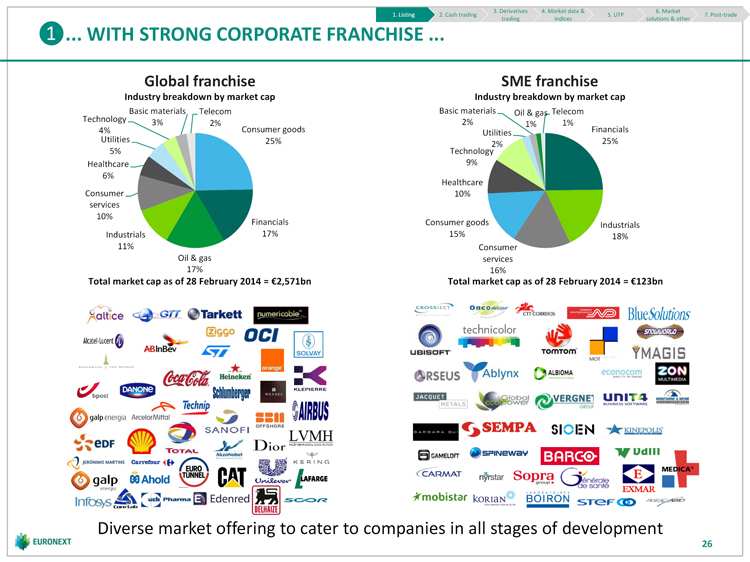 | 3. Derivatives 4. Market data & 6. Market 1. Listing 2. Cash trading 5. UTP 7. Post-trade trading indices solutions & other ... WITH STRONG CORPORATE FRANCHISE ... Global franchise SME franchise Industry breakdown by market cap Industry breakdown by market cap Basic materials Telecom Basic materials Oil & gas Telecom Technology 2% 3% 2% 1% 1% 4% Consumer goods Utilities Financials Utilities 25% 25% 2% 5% Technology Healthcare 9% 6% Healthcare Consumer 10% services 10% Financials Consumer goods Industrials Industrials 17% 15% 18% 11% Consumer Oil & gas services 17% 16% Total market cap as of 28 February 2014 = 2,571bn Total market cap as of 28 February 2014 = 123bn Diverse market offering to cater to companies in all stages of development 26 |
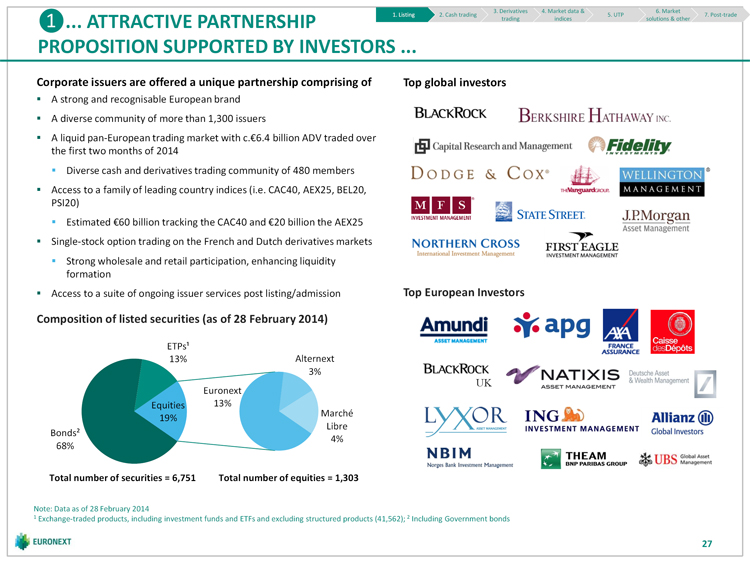 | 3. Derivatives 4. Market data & 6. Market 1. Listing 2. Cash trading 5. UTP 7. Post-trade ... ATTRACTIVE PARTNERSHIP trading indices solutions & other PROPOSITION SUPPORTED BY INVESTORS ... Corporate issuers are offered a unique partnership comprising of Top global investors A strong and recognisable European brand A diverse community of more than 1,300 issuers A liquid pan-European trading market with c. 6.4 billion ADV traded over the first two months of 2014 Diverse cash and derivatives trading community of 480 members Access to a family of leading country indices (i.e. CAC40, AEX25, BEL20, PSI20) Estimated 60 billion tracking the CAC40 and 20 billion the AEX25 Single-stock option trading on the French and Dutch derivatives markets Strong wholesale and retail participation, enhancing liquidity formation Access to a suite of ongoing issuer services post listing/admission Top European Investors Composition of listed securities (as of 28 February 2014) ETPs¹ 13% Alternext 3% UK Euronext Equities 13% Marché 19% Libre Bonds² 4% 68% Total number of securities = 6,751 Total number of equities = 1,303 Note: Data as of 28 February 2014 1 Exchange-traded products, including investment funds and ETFs and excluding structured products (41,562); 2 Including Government bonds 27 |
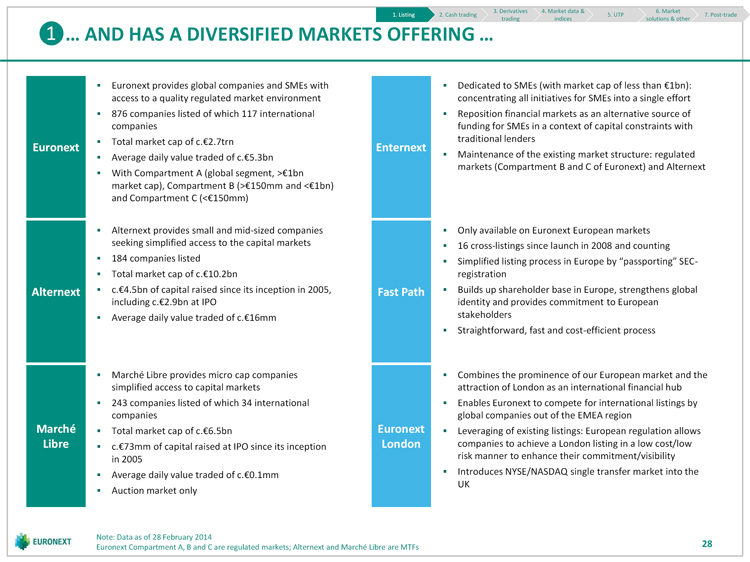 | 3. Derivatives 4. Market data & 6. Market 1. Listing 2. Cash trading 5. UTP 7. Post-trade trading indices solutions & other … AND HAS A DIVERSIFIED MARKETS OFFERING … Euronext provides global companies and SMEs with Dedicated to SMEs (with market cap of less than 1bn): access to a quality regulated market environment concentrating all initiatives for SMEs into a single effort 876 companies listed of which 117 international Reposition financial markets as an alternative source of companies funding for SMEs in a context of capital constraints with Total market cap of c. 2.7trn traditional lenders Euronext Enternext Average daily value traded of c. 5.3bn Maintenance of the existing market structure: regulated markets (Compartment B and C of Euronext) and Alternext With Compartment A (global segment, > 1bn market cap), Compartment B (> 150mm and < 1bn) and Compartment C (< 150mm) Alternext provides small and mid-sized companies Only available on Euronext European markets seeking simplified access to the capital markets 16 cross-listings since launch in 2008 and counting 184 companies listed Simplified listing process in Europe by “passporting” SEC- Total market cap of c. 10.2bn registration Alternext c. 4.5bn of capital raised since its inception in 2005, Fast Path Builds up shareholder base in Europe, strengthens global including c. 2.9bn at IPO identity and provides commitment to European Average daily value traded of c. 16mm stakeholders Straightforward, fast and cost-efficient process Marché Libre provides micro cap companies Combines the prominence of our European market and the simplified access to capital markets attraction of London as an international financial hub 243 companies listed of which 34 international Enables Euronext to compete for international listings by companies global companies out of the EMEA region Marché Total market cap of c. 6.5bn Euronext Leveraging of existing listings: European regulation allows Libre c. 73mm of capital raised at IPO since its inception London companies to achieve a London listing in a low cost/low in 2005 risk manner to enhance their commitment/visibility Average daily value traded of c. 0.1mm Introduces NYSE/NASDAQ single transfer market into the UK Auction market only Note: Data as of 28 February 2014 Euronext Compartment A, B and C are regulated markets; Alternext and Marché Libre are MTFs 28 |
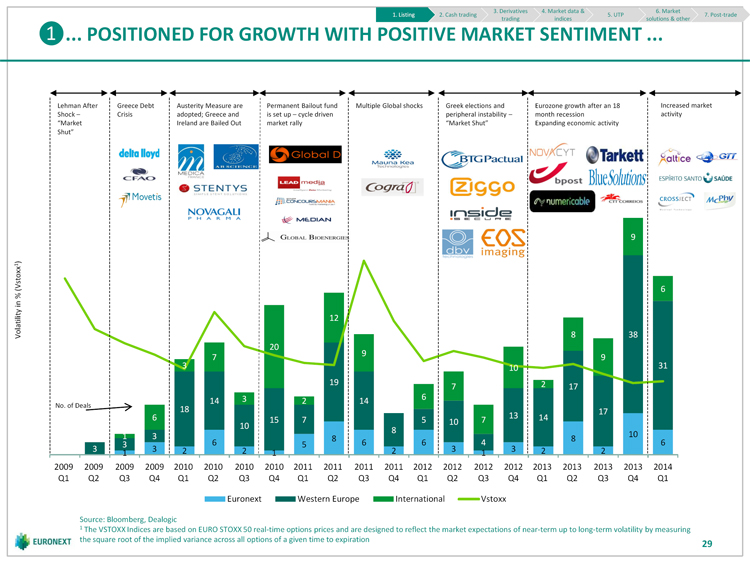 | 3. Derivatives 4. Market data & 6. Market 1. Listing 2. Cash trading 5. UTP 7. Post-trade trading indices solutions & other ... POSITIONED FOR GROWTH WITH POSITIVE MARKET SENTIMENT ... Lehman After Greece Debt Austerity Measure are Permanent Bailout fund Multiple Global shocks Greek elections and Eurozone growth after an 18 Increased market Shock Crisis adopted; Greece and is set up cycle driven peripheral instability month recession activity “Market Ireland are Bailed Out market rally “Market Shut” Expanding economic activity Shut” 9 ) 1 6 12 Volatility in % (Vstoxx 8 38 20 9 7 9 3 10 31 19 2 7 17 3 6 14 2 14 No. of Deals 18 17 6 13 14 15 7 5 10 7 10 8 1 3 10 8 8 3 6 5 6 6 4 6 3 3 2 2 2 3 3 2 2 1 1 1 2009 2009 2009 2009 2010 2010 2010 2010 2011 2011 2011 2011 2012 2012 2012 2012 2013 2013 2013 2013 2014 Q1 Q2 Q3 Q4 Q1 Q2 Q3 Q4 Q1 Q2 Q3 Q4 Q1 Q2 Q3 Q4 Q1 Q2 Q3 Q4 Q1 Euronext Western Europe International Vstoxx Source: Bloomberg, Dealogic 1 The VSTOXX Indices are based on EURO STOXX 50 real-time options prices and are designed to reflect the market expectations of near-term up to long-term volatility by measuring the square root of the implied variance across all options of a given time to expiration 29 |
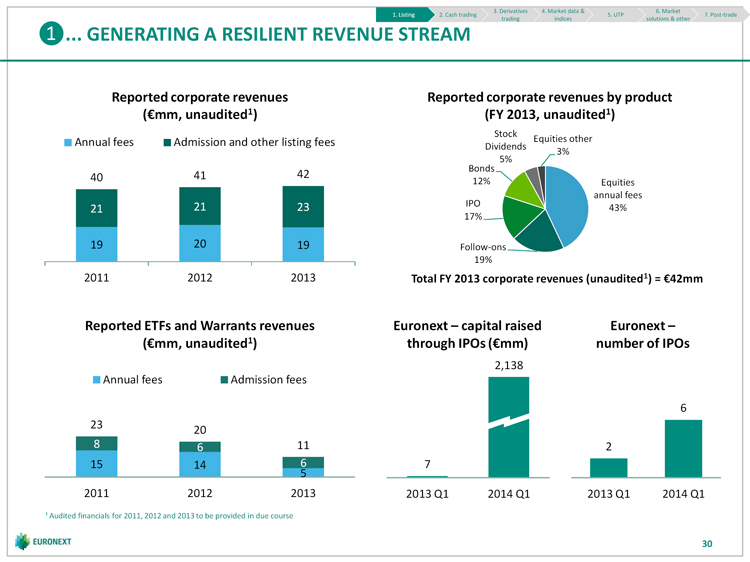 | 3. Derivatives 4. Market data & 6. Market 1. Listing 2. Cash trading 5. UTP 7. Post-trade trading indices solutions & other ... GENERATING A RESILIENT REVENUE STREAM Reported corporate revenues Reported corporate revenues by product ( mm, unaudited1) (FY 2013, unaudited1) Stock Annual fees Admission and other listing fees Equities other Dividends 3% 5% Bonds 40 41 42 12% Equities annual fees 21 IPO 21 23 43% 17% 19 20 19 Follow-ons 19% 2011 2012 2013 Total FY 2013 corporate revenues (unaudited1) = 42mm Reported ETFs and Warrants revenues Euronext capital raised Euronext ( mm, unaudited1) through IPOs ( mm) number of IPOs 2,138 Annual fees Admission fees 6 23 20 8 6 11 2 15 14 6 7 5 2011 2012 2013 2013 Q1 2014 Q1 2013 Q1 2014 Q1 ¹ Audited financials for 2011, 2012 and 2013 to be provided in due course 30 |
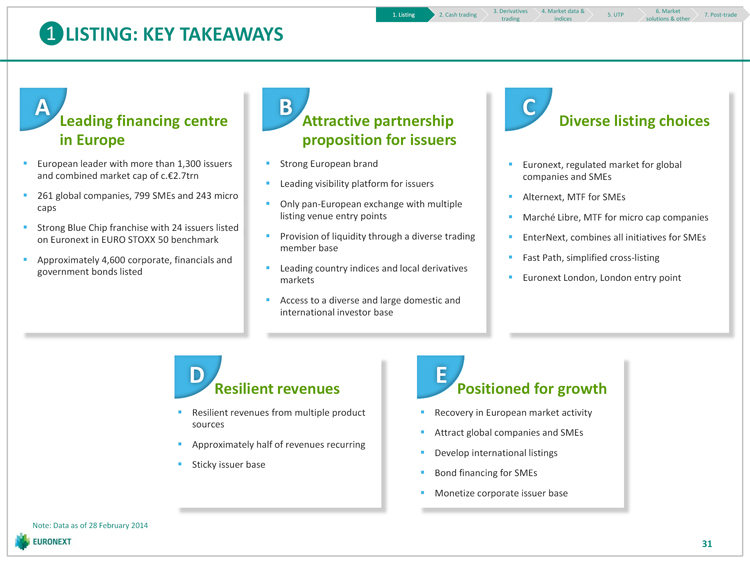 | 3. Derivatives 4. Market data & 6. Market 1. Listing 2. Cash trading 5. UTP 7. Post-trade trading indices solutions & other LISTING: KEY TAKEAWAYS A B C Leading financing centre Attractive partnership Diverse listing choices in Europe proposition for issuers European leader with more than 1,300 issuers Strong European brand Euronext, regulated market for global and combined market cap of c. 2.7trn companies and SMEs Leading visibility platform for issuers 261 global companies, 799 SMEs and 243 micro Alternext, MTF for SMEs caps Only pan-European exchange with multiple listing venue entry points Marché Libre, MTF for micro cap companies Strong Blue Chip franchise with 24 issuers listed on Euronext in EURO STOXX 50 benchmark Provision of liquidity through a diverse trading EnterNext, combines all initiatives for SMEs member base Approximately 4,600 corporate, financials and Fast Path, simplified cross-listing government bonds listed Leading country indices and local derivatives markets Euronext London, London entry point Access to a diverse and large domestic and international investor base D E Resilient revenues Positioned for growth Resilient revenues from multiple product Recovery in European market activity sources Attract global companies and SMEs Approximately half of revenues recurring Develop international listings Sticky issuer base Bond financing for SMEs Monetize corporate issuer base Note: Data as of 28 February 2014 31 |
 | CASH TRADING |
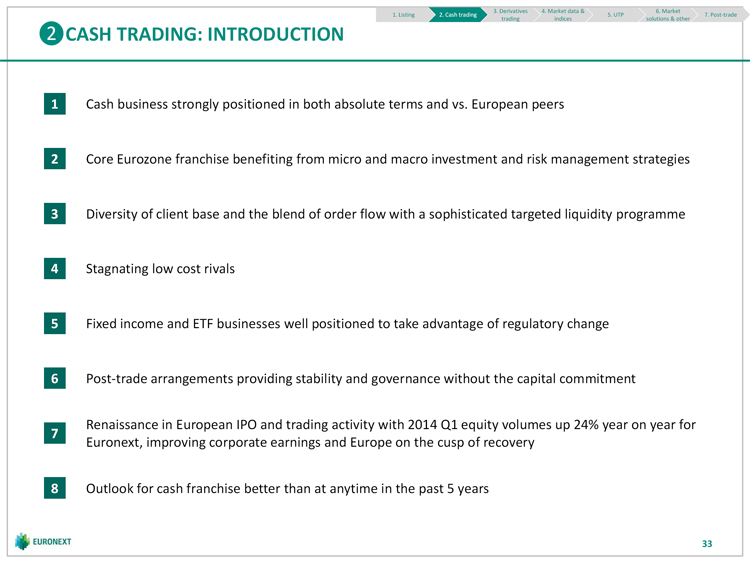 | 3. Derivatives 4. Market data & 6. Market 1. Listing 2. Cash trading 5. UTP 7. Post-trade trading indices solutions & other CASH TRADING: INTRODUCTION 1 Cash business strongly positioned in both absolute terms and vs. European peers 2 Core Eurozone franchise benefiting from micro and macro investment and risk management strategies 3 Diversity of client base and the blend of order flow with a sophisticated targeted liquidity programme 4 Stagnating low cost rivals 5 Fixed income and ETF businesses well positioned to take advantage of regulatory change 6 Post-trade arrangements providing stability and governance without the capital commitment Renaissance in European IPO and trading activity with 2014 Q1 equity volumes up 24% year on year for 7 Euronext, improving corporate earnings and Europe on the cusp of recovery 8 Outlook for cash franchise better than at anytime in the past 5 years 33 |
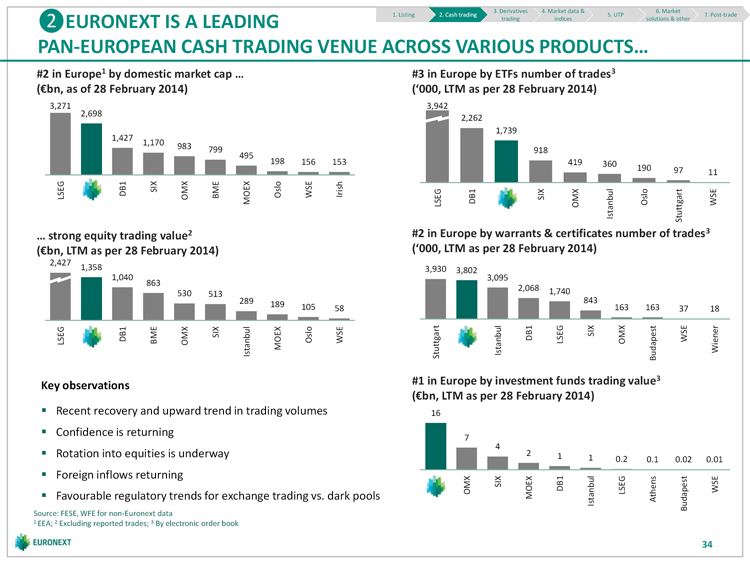 | 3. Derivatives 4. Market data & 6. Market 1. Listing 2. Cash trading 5. UTP 7. Post-trade EURONEXT IS A LEADING trading indices solutions & other PAN-EUROPEAN CASH TRADING VENUE ACROSS VARIOUS PRODUCTS… #2 in Europe1 by domestic market cap … #3 in Europe by ETFs number of trades3 ( bn, as of 28 February 2014) (‘000, LTM as per 28 February 2014) 3,271 3,942 2,698 2,262 1,739 1,427 1,170 983 799 918 495 198 156 153 419 360 190 97 11 LSEG DB1 SIX BME Oslo WSE Irish OMX MOEX LSEG DB1 SIX OMX Istanbul Oslo Stuttgart WSE … strong equity trading value2 #2 in Europe by warrants & certificates number of trades3 ( bn, LTM as per 28 February 2014) (‘000, LTM as per 28 February 2014) 2,427 1,358 3,930 3,802 1,040 3,095 863 530 513 2,068 1,740 289 843 189 105 163 163 58 37 18 LSEG DB1 BME OMX SIX Istanbul MOEX Oslo WSE Stuttgart Istanbul DB1 LSEG SIX OMX Budapest WSE Wiener Key observations #1 in Europe by investment funds trading value3 ( bn, LTM as per 28 February 2014) Recent recovery and upward trend in trading volumes 16 Confidence is returning 7 4 Rotation into equities is underway 2 1 1 0.2 0.1 0.02 0.01 Foreign inflows returning OMX SIX MOEX DB1 LSEG WSE Favourable regulatory trends for exchange trading vs. dark pools Istanbul Athens Budapest Source: FESE, WFE for non-Euronext data 1 EEA; 2 Excluding reported trades; 3 By electronic order book 34 |
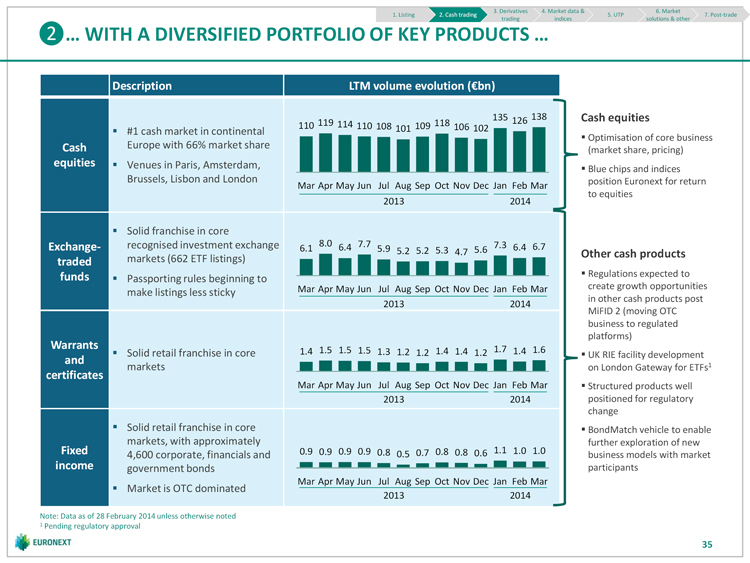 | 3. Derivatives 4. Market data & 6. Market 1. Listing 2. Cash trading 5. UTP 7. Post-trade trading indices solutions & other … WITH A DIVERSIFIED PORTFOLIO OF KEY PRODUCTS … Description LTM volume evolution ( bn) 135 126 138 Cash equities 110 119 114 110 #1 cash market in continental 108 101 109 118 106 102 Optimisation of core business Cash Europe with 66% market share (market share, pricing) equities Venues in Paris, Amsterdam, Blue chips and indices Brussels, Lisbon and London position Euronext for return Mar Apr May Jun Jul Aug Sep Oct Nov Dec Jan Feb Mar to equities 2013 2014 Solid franchise in core Exchange- recognised investment exchange 6.1 8.0 6.4 7.7 5.9 5.2 5.2 5.3 4.7 5.6 7.3 6.4 6.7 Other cash products traded markets (662 ETF listings) funds Regulations expected to Passporting rules beginning to Mar Apr May Jun Jul Aug Sep Oct Nov Dec Jan Feb Mar create growth opportunities make listings less sticky in other cash products post 2013 2014 MiFID 2 (moving OTC business to regulated platforms) Warrants Solid retail franchise in core 1.4 1.5 1.5 1.5 1.3 1.2 1.2 1.4 1.4 1.2 1.7 1.4 1.6 UK RIE facility development and markets on London Gateway for ETFs1 certificates Mar Apr May Jun Jul Aug Sep Oct Nov Dec Jan Feb Mar Structured products well 2013 2014 positioned for regulatory change Solid retail franchise in core BondMatch vehicle to enable markets, with approximately further exploration of new Fixed 4,600 corporate, financials and 0.9 0.9 0.9 0.9 0.8 0.5 0.7 0.8 0.8 0.6 1.1 1.0 1.0 business models with market income government bonds participants Mar Apr May Jun Jul Aug Sep Oct Nov Dec Jan Feb Mar Market is OTC dominated 2013 2014 Note: Data as of 28 February 2014 unless otherwise noted 1 Pending regulatory approval 35 |
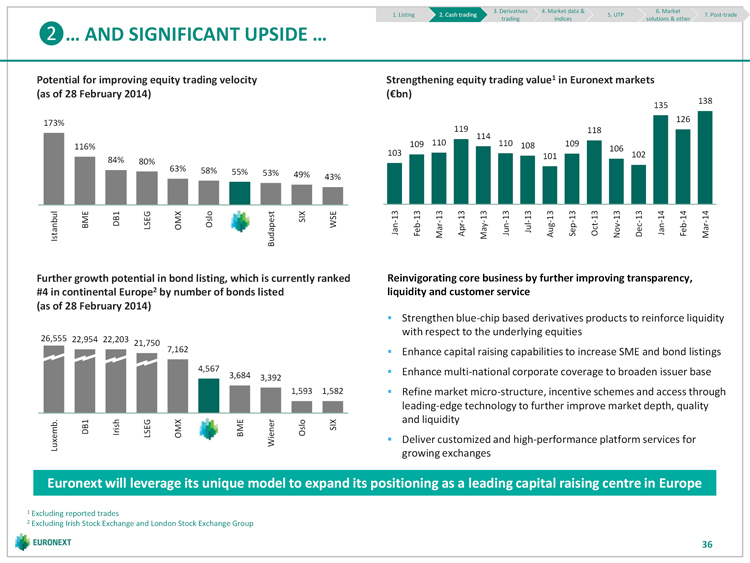 | 3. Derivatives 4. Market data & 6. Market 1. Listing 2. Cash trading 5. UTP 7. Post-trade trading indices solutions & other … AND SIGNIFICANT UPSIDE … Potential for improving equity trading velocity Strengthening equity trading value1 in Euronext markets (as of 28 February 2014) ( bn) 138 135 173% 126 119 118 109 110 114 110 108 109 116% 103 101 106 102 84% 80% 63% 58% 55% 53% 49% 43% Istanbul BME DB1 LSEG OMX Oslo Budapest SIX WSE Jan-13 Feb-13 Mar-13 Apr-13 May-13 Jun-13 Jul-13 Aug-13 Sep-13 Oct-13 Nov-13 Dec-13 Jan-14 Feb-14 Mar-14 Further growth potential in bond listing, which is currently ranked Reinvigorating core business by further improving transparency, #4 in continental Europe2 by number of bonds listed liquidity and customer service (as of 28 February 2014) Strengthen blue-chip based derivatives products to reinforce liquidity with respect to the underlying equities 26,555 22,954 22,203 21,750 7,162 Enhance capital raising capabilities to increase SME and bond listings 4,567 Enhance multi-national corporate coverage to broaden issuer base 3,684 3,392 1,593 1,582 Refine market micro-structure, incentive schemes and access through leading-edge technology to further improve market depth, quality DB1 Irish LSEG OMX BME Oslo SIX and liquidity Luxemb. Wiener Deliver customized and high-performance platform services for growing exchanges Euronext will leverage its unique model to expand its positioning as a leading capital raising centre in Europe 1 Excluding reported trades 2 Excluding Irish Stock Exchange and London Stock Exchange Group 36 |
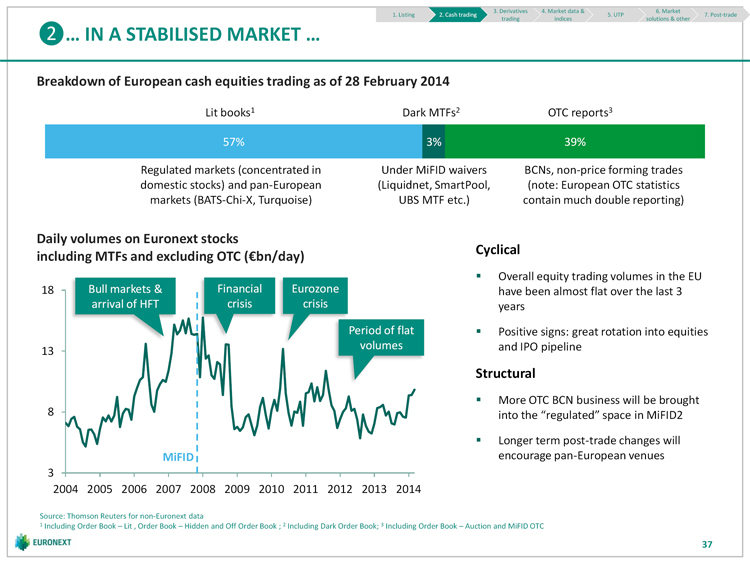 | 3. Derivatives 4. Market data & 6. Market 1. Listing 2. Cash trading 5. UTP 7. Post-trade trading indices solutions & other … IN A STABILISED MARKET … Breakdown of European cash equities trading as of 28 February 2014 Lit books1 Dark MTFs2 OTC reports3 57% 3% 39% Regulated markets (concentrated in Under MiFID waivers BCNs, non-price forming trades domestic stocks) and pan-European (Liquidnet, SmartPool, (note: European OTC statistics markets (BATS-Chi-X, Turquoise) UBS MTF etc.) contain much double reporting) Daily volumes on Euronext stocks Cyclical including MTFs and excluding OTC ( bn/day) Overall equity trading volumes in the EU 18 Bull markets & Financial Eurozone have been almost flat over the last 3 arrival of HFT crisis crisis years Period of flat Positive signs: great rotation into equities volumes and IPO pipeline 13 Structural More OTC BCN business will be brought 8 into the “regulated” space in MiFID2 Longer term post-trade changes will MiFID encourage pan-European venues 3 2004 2005 2006 2007 2008 2009 2010 2011 2012 2013 2014 Source: Thomson Reuters for non-Euronext data 1 Including Order Book Lit , Order Book Hidden and Off Order Book ; 2 Including Dark Order Book; 3 Including Order Book Auction and MiFID OTC 37 |
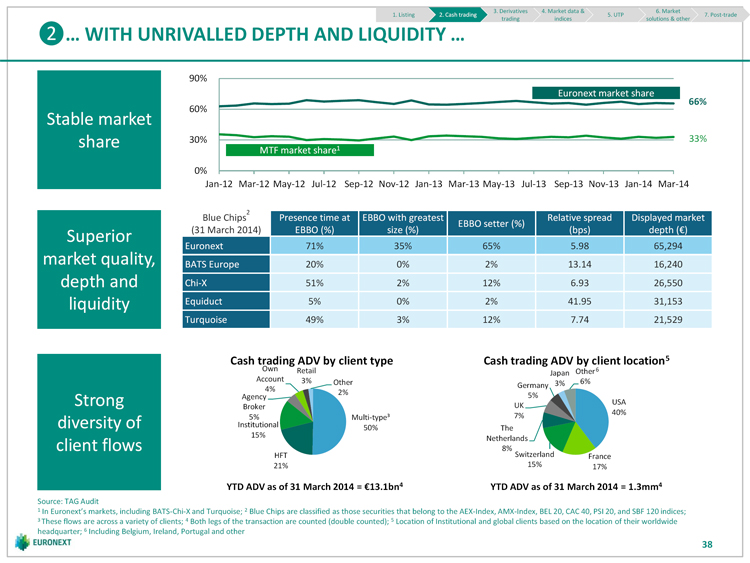 | 3. Derivatives 4. Market data & 6. Market 1. Listing 2. Cash trading 5. UTP 7. Post-trade trading indices solutions & other … WITH UNRIVALLED DEPTH AND LIQUIDITY … 90% Euronext market share 66% 60% Stable market share 30% 33% MTF market share1 0% Jan-12 Mar-12 May-12 Jul-12 Sep-12 Nov-12 Jan-13 Mar-13 May-13 Jul-13 Sep-13 Nov-13 Jan-14 Mar-14 Blue Chips2 Presence time at EBBO with greatest Relative spread Displayed market EBBO setter (%) Superior (31 March 2014) EBBO (%) size (%) (bps) depth ( ) Euronext 71% 35% 65% 5.98 65,294 market quality, BATS Europe 20% 0% 2% 13.14 16,240 depth and Chi-X 51% 2% 12% 6.93 26,550 liquidity Equiduct 5% 0% 2% 41.95 31,153 Turquoise 49% 3% 12% 7.74 21,529 Cash trading ADV by client type Cash trading ADV by client location5 Own Retail Other 6 Japan Account 3% 6% Other Germany 3% 4% 2% 5% Agency Strong USA Broker UK 40% 5% Multi-type³ 7% diversity of Institutional 50% The 15% client flows Netherlands 8% HFT Switzerland France 21% 15% 17% YTD ADV as of 31 March 2014 = 13.1bn4 YTD ADV as of 31 March 2014 = 1.3mm4 Source: TAG Audit 1 In Euronext’s markets, including BATS-Chi-X and Turquoise; 2 Blue Chips are classified as those securities that belong to the AEX-Index, AMX-Index, BEL 20, CAC 40, PSI 20, and SBF 120 indices; 3 These flows are across a variety of clients; 4 Both legs of the transaction are counted (double counted); 5 Location of Institutional and global clients based on the location of their worldwide headquarter; 6 Including Belgium, Ireland, Portugal and other 38 |
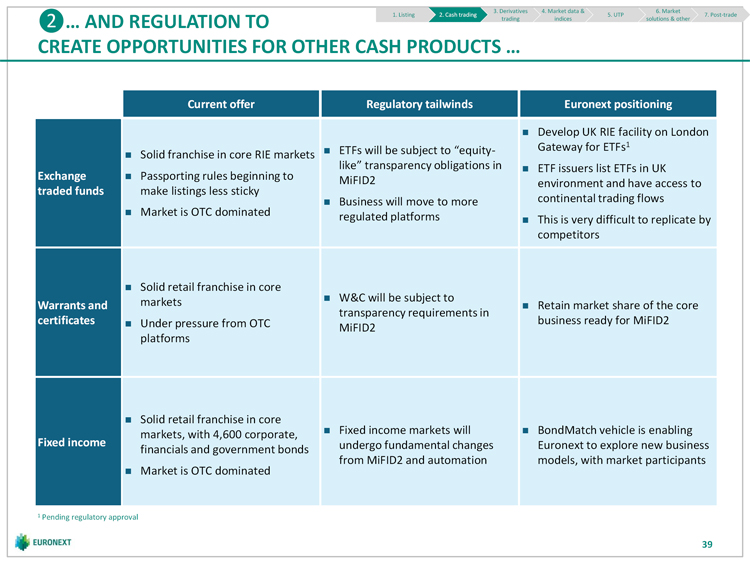 | 3. Derivatives 4. Market data & 6. Market 1. Listing 2. Cash trading 5. UTP 7. Post-trade … AND REGULATION TO trading indices solutions & other CREATE OPPORTUNITIES FOR OTHER CASH PRODUCTS … Current offer Regulatory tailwinds Euronext positioning Develop UK RIE facility on London ETFs will be subject to “equity- Gateway for ETFs1 Solid franchise in core RIE markets like” transparency obligations in ETF issuers list ETFs in UK Exchange Passporting rules beginning to MiFID2 environment and have access to traded funds make listings less sticky Business will move to more continental trading flows Market is OTC dominated regulated platforms This is very difficult to replicate by competitors Solid retail franchise in core markets W&C will be subject to Warrants and Retain market share of the core transparency requirements in certificates Under pressure from OTC business ready for MiFID2 MiFID2 platforms Solid retail franchise in core markets, with 4,600 corporate, Fixed income markets will BondMatch vehicle is enabling Fixed income undergo fundamental changes Euronext to explore new business financials and government bonds from MiFID2 and automation models, with market participants Market is OTC dominated 1 Pending regulatory approval 39 |
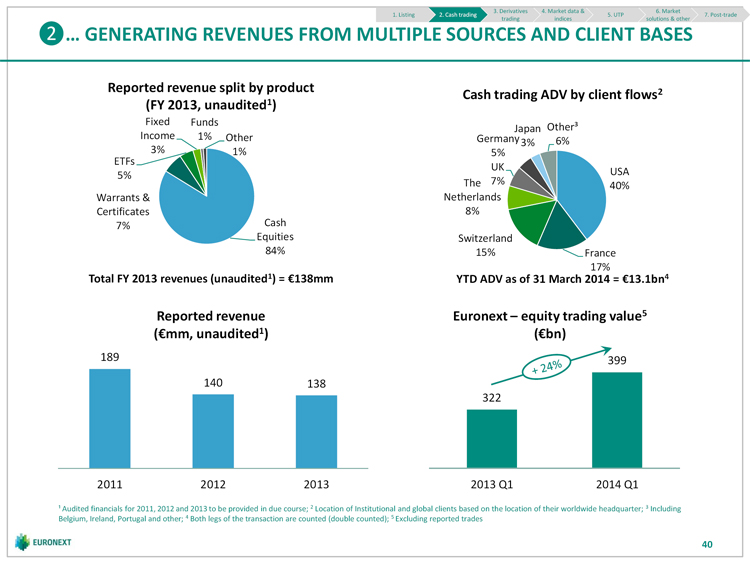 | 3. Derivatives 4. Market data & 6. Market 1. Listing 2. Cash trading 5. UTP 7. Post-trade trading indices solutions & other … GENERATING REVENUES FROM MULTIPLE SOURCES AND CLIENT BASES Reported revenue split by product Cash trading ADV by client flows2 (FY 2013, unaudited1) Fixed Funds Japan Other³ Income 1% Other Germany 3% 6% 3% 1% 5% ETFs UK 5% USA The 7% 40% Warrants & Netherlands Certificates 8% 7% Cash Equities Switzerland 84% 15% France 17% Total FY 2013 revenues (unaudited1) = 138mm YTD ADV as of 31 March 2014 = 13.1bn4 Reported revenue Euronext equity trading value5 ( mm, unaudited1) ( bn) 189 399 140 138 322 2011 2012 2013 2013 Q1 2014 Q1 ¹ Audited financials for 2011, 2012 and 2013 to be provided in due course; 2 Location of Institutional and global clients based on the location of their worldwide headquarter; 3 Including Belgium, Ireland, Portugal and other; 4 Both legs of the transaction are counted (double counted); 5 Excluding reported trades 40 |
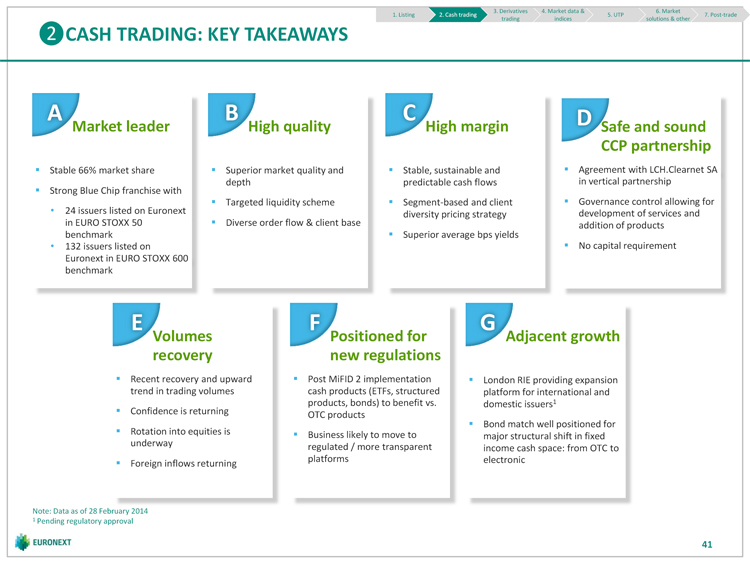 | 3. Derivatives 4. Market data & 6. Market 1. Listing 2. Cash trading 5. UTP 7. Post-trade trading indices solutions & other CASH TRADING: KEY TAKEAWAYS A B C D Market leader quality margin and sound CCP partnership Stable 66% market share Superior market quality and Stable, sustainable and Agreement with LCH.Clearnet SA depth predictable cash flows in vertical partnership Strong Blue Chip franchise with Targeted liquidity scheme Segment-based and client Governance control allowing for 24 issuers listed on Euronext diversity pricing strategy development of services and in EURO STOXX 50 Diverse order flow & client base addition of products benchmark Superior average bps yields 132 issuers listed on No capital requirement Euronext in EURO STOXX 600 benchmark E F G Volumes Positioned for Adjacent growth recovery new regulations Recent recovery and upward Post MiFID 2 implementation London RIE providing expansion trend in trading volumes cash products (ETFs, structured platform for international and products, bonds) to benefit vs. domestic issuers1 Confidence is returning OTC products Bond match well positioned for Rotation into equities is Business likely to move to major structural shift in fixed underway regulated / more transparent income cash space: from OTC to platforms electronic Foreign inflows returning Note: Data as of 28 February 2014 1 Pending regulatory approval 41 |
 | DERIVATIVES TRADING |
 | 3. Derivatives 4. Market data & 6. Market 1. Listing 2. Cash trading 5. UTP 7. Post-trade trading indices solutions & other DERIVATIVES TRADING: INTRODUCTION Re-prioritising underexploited business through an aggressive delivery programme of new products and 1 services 2 Global regulatory reform to increase transparency, reduce systemic risk and reappraise capital usage 3 Significant organic product and platform development opportunities New agreement with LCH.Clearnet SA delivering the economics of a vertical silo without the capital 4 commitment and risk More Euronext derivative products launched in 2014 Q1 than in 2012 and 2013 combined (and further 5 products to be launched by the end of 2014) 6 No intensive capital investment required for product development 7 Important new hires 43 |
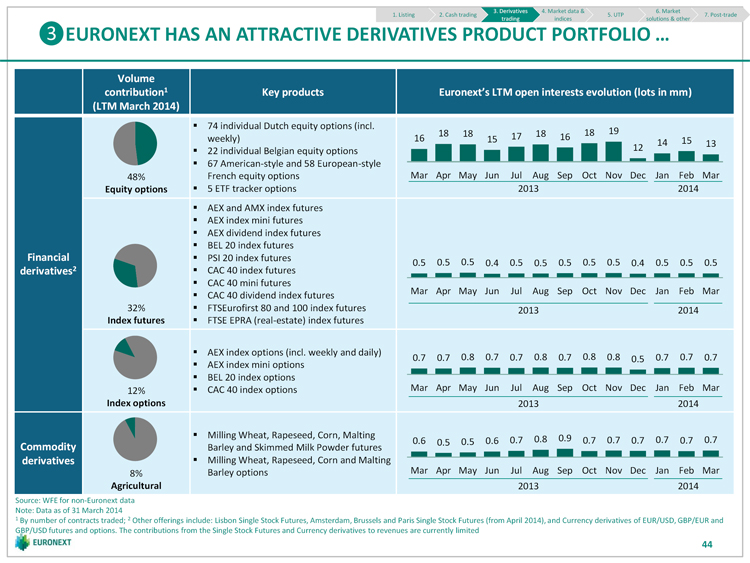 | 3. Derivatives 4. Market data & 6. Market 1. Listing 2. Cash trading 5. UTP 7. Post-trade trading indices solutions & other EURONEXT HAS AN ATTRACTIVE DERIVATIVES PRODUCT PORTFOLIO … Volume contribution1 Key products Euronext’s LTM open interests evolution (lots in mm) (LTM March 2014) 74 individual Dutch equity options (incl. 18 18 18 18 19 weekly) 16 15 17 16 14 15 13 22 individual Belgian equity options 12 67 American-style and 58 European-style 48% French equity options Mar Apr May Jun Jul Aug Sep Oct Nov Dec Jan Feb Mar Equity options 5 ETF tracker options 2013 2014 AEX and AMX index futures AEX index mini futures AEX dividend index futures BEL 20 index futures Financial PSI 20 index futures 0.5 0.5 0.5 0.4 0.5 0.5 0.5 0.5 0.5 0.4 0.5 0.5 0.5 derivatives2 CAC 40 index futures CAC 40 mini futures Mar Apr May Jun Jul Aug Sep Oct Nov Dec Jan Feb Mar CAC 40 dividend index futures 32% FTSEurofirst 80 and 100 index futures 2013 2014 Index futures FTSE EPRA (real-estate) index futures AEX index options (incl. weekly and daily) 0.7 0.7 0.8 0.7 0.7 0.8 0.7 0.8 0.8 0.5 0.7 0.7 0.7 AEX index mini options BEL 20 index options 12% CAC 40 index options Mar Apr May Jun Jul Aug Sep Oct Nov Dec Jan Feb Mar Index options 2013 2014 Milling Wheat, Rapeseed, Corn, Malting 0.6 0.5 0.5 0.6 0.7 0.8 0.9 0.7 0.7 0.7 0.7 0.7 0.7 Commodity Barley and Skimmed Milk Powder futures derivatives Milling Wheat, Rapeseed, Corn and Malting 8% Barley options Mar Apr May Jun Jul Aug Sep Oct Nov Dec Jan Feb Mar Agricultural 2013 2014 Source: WFE for non-Euronext data Note: Data as of 31 March 2014 1 By number of contracts traded; 2 Other offerings include: Lisbon Single Stock Futures, Amsterdam, Brussels and Paris Single Stock Futures (from April 2014), and Currency derivatives of EUR/USD, GBP/EUR and GBP/USD futures and options. The contributions from the Single Stock Futures and Currency derivatives to revenues are currently limited 44 |
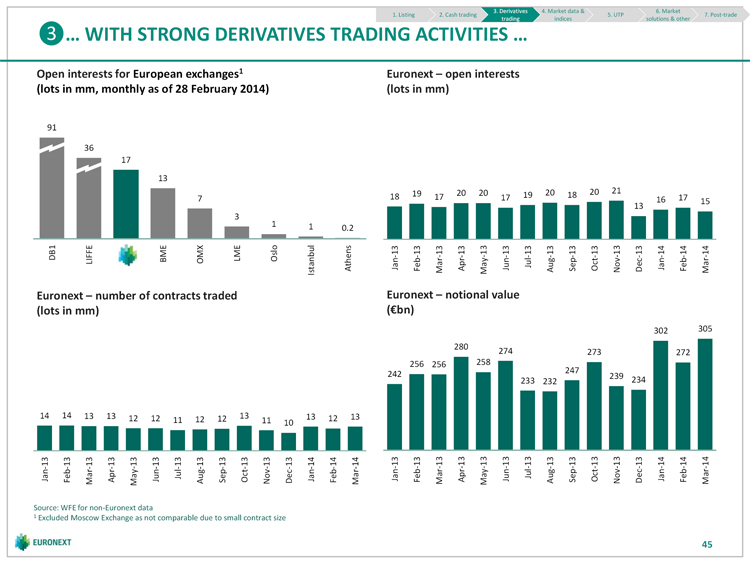 | 3. Derivatives 4. Market data & 6. Market 1. Listing 2. Cash trading 5. UTP 7. Post-trade trading indices solutions & other … WITH STRONG DERIVATIVES TRADING ACTIVITIES … Open interests for European exchanges1 Euronext open interests (lots in mm, monthly as of 28 February 2014) (lots in mm) 91 36 17 13 19 20 20 20 20 21 18 17 17 19 18 17 7 16 15 13 3 1 1 0.2 DB1 LIFFE BME OMX LME Oslo Istanbul Athens Jan-13 Feb-13 Mar-13 Apr-13 May-13 Jun-13 Jul-13 Aug-13 Sep-13 Oct-13 Nov-13 Dec-13 Jan-14 Feb-14 Mar-14 Euronext number of contracts traded Euronext notional value (lots in mm) ( bn) 302 305 280 274 273 272 256 256 258 247 242 233 232 239 234 14 14 13 13 12 12 12 13 13 12 13 11 12 11 10 Jan-13 Feb-13 Mar-13 Apr-13 May-13 Jun-13 Jul-13 Aug-13 Sep-13 Oct-13 Nov-13 Dec-13 Jan-14 Feb-14 Mar-14 Jan-13 Feb-13 Mar-13 Apr-13 May-13 Jun-13 Jul-13 Aug-13 Sep-13 Oct-13 Nov-13 Dec-13 Jan-14 Feb-14 Mar-14 Source: WFE for non-Euronext data 1 Excluded Moscow Exchange as not comparable due to small contract size 45 |
 | 3. Derivatives 4. Market data & 6. Market 1. Listing 2. Cash trading 5. UTP 7. Post-trade trading indices solutions & other … AND IS WELL POSITIONED ACROSS DERIVATIVES PRODUCT LINES … #2 in Europe by stock options open interest1 #3 in Europe by stock index futures open interest1 (‘000, monthly as of 28 February 2014) (‘000, monthly as of 28 February 2014) 4,115 44,526 1,311 480 14,720 429 312 9,257 5,208 3,987 120 95 83 54 51 684 6 1 DB1 BME LIFFE OMX Oslo Wiener Athens DB1 LIFFE OMX Istanbul WSE Oslo BME Wiener Athens #5 in Europe by stock index options open interest1 #3 in Europe by commodities open interest1 (‘000, monthly as of 28 February 2014) (‘000, monthly as of 28 February 2014) 33,606 3,036 3,281 990 964 781 740 660 63 56 5 2 1 7 6 DB1 LIFFE BME OMX WSE Oslo Athens Wiener Istanbul LME LIFFE Istanbul LSEG Source: WFE for non-Euronext data Note: Excluding ICE Europe due to unavailability of data from WFE 1 Excluded Moscow Exchange as not comparable due to small contract size of derivatives transactions 46 |
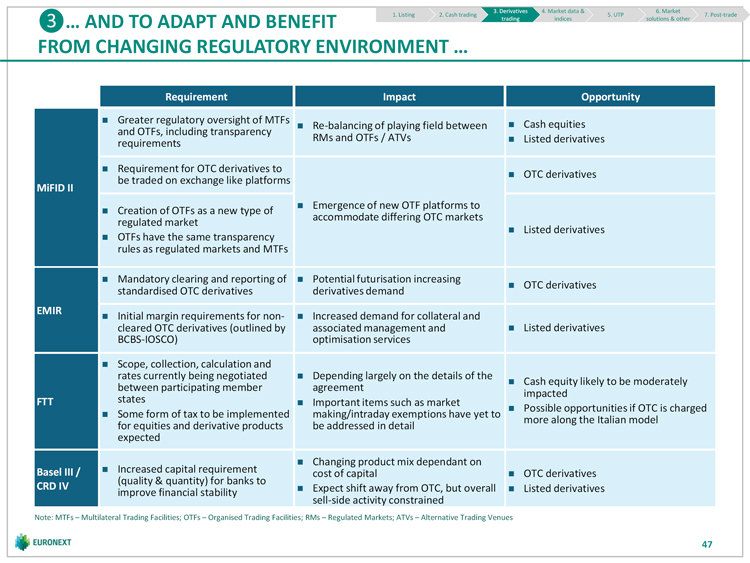 | 3. Derivatives 4. Market data & 6. Market 1. Listing 2. Cash trading 5. UTP 7. Post-trade … AND TO ADAPT AND BENEFIT trading indices solutions & other FROM CHANGING REGULATORY ENVIRONMENT … Requirement Impact Opportunity Greater regulatory oversight of MTFs Cash equities Re-balancing of playing field between and OTFs, including transparency RMs and OTFs / ATVs Listed derivatives requirements Requirement for OTC derivatives to OTC derivatives be traded on exchange like platforms MiFID II Emergence of new OTF platforms to Creation of OTFs as a new type of accommodate differing OTC markets regulated market Listed derivatives OTFs have the same transparency rules as regulated markets and MTFs Mandatory clearing and reporting of Potential futurisation increasing OTC derivatives standardised OTC derivatives derivatives demand EMIR Initial margin requirements for non- Increased demand for collateral and cleared OTC derivatives (outlined by associated management and Listed derivatives BCBS-IOSCO) optimisation services Scope, collection, calculation and rates currently being negotiated Depending largely on the details of the Cash equity likely to be moderately between participating member agreement impacted FTT states Important items such as market Possible opportunities if OTC is charged Some form of tax to be implemented making/intraday exemptions have yet to more along the Italian model for equities and derivative products be addressed in detail expected Changing product mix dependant on Basel III / Increased capital requirement OTC derivatives cost of capital (quality & quantity) for banks to CRD IV Expect shift away from OTC, but overall Listed derivatives improve financial stability sell-side activity constrained Note: MTFs Multilateral Trading Facilities; OTFs Organised Trading Facilities; RMs Regulated Markets; ATVs Alternative Trading Venues 47 |
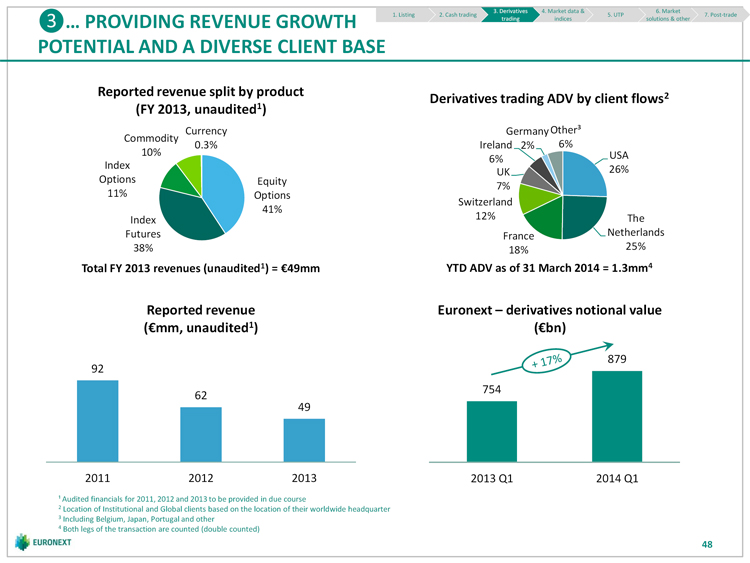 | 3. Derivatives 4. Market data & 6. Market 1. Listing 2. Cash trading 5. UTP 7. Post-trade … PROVIDING REVENUE GROWTH trading indices solutions & other POTENTIAL AND A DIVERSE CLIENT BASE Reported revenue split by product Derivatives trading ADV by client flows2 (FY 2013, unaudited1) Currency Germany Other³ Commodity 0.3% Ireland 2% 6% 10% USA 6% Index 26% UK Options Equity 7% 11% Options Switzerland 41% Index 12% The Futures France Netherlands 38% 18% 25% Total FY 2013 revenues (unaudited1) = 49mm YTD ADV as of 31 March 2014 = 1.3mm4 Reported revenue Euronext derivatives notional value ( mm, unaudited1) ( bn) 879 92 754 62 49 2011 2012 2013 2013 Q1 2014 Q1 ¹ Audited financials for 2011, 2012 and 2013 to be provided in due course 2 Location of Institutional and Global clients based on the location of their worldwide headquarter 3 Including Belgium, Japan, Portugal and other 4 Both legs of the transaction are counted (double counted) 48 |
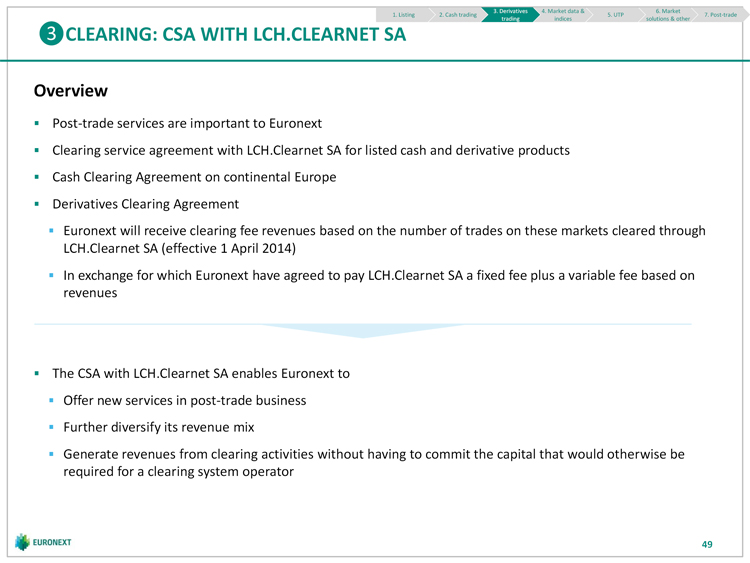 | 3. Derivatives 4. Market data & 6. Market 1. Listing 2. Cash trading 5. UTP 7. Post-trade trading indices solutions & other CLEARING: CSA WITH LCH.CLEARNET SA Overview Post-trade services are important to Euronext Clearing service agreement with LCH.Clearnet SA for listed cash and derivative products Cash Clearing Agreement on continental Europe Derivatives Clearing Agreement Euronext will receive clearing fee revenues based on the number of trades on these markets cleared through LCH.Clearnet SA (effective 1 April 2014) In exchange for which Euronext have agreed to pay LCH.Clearnet SA a fixed fee plus a variable fee based on revenues The CSA with LCH.Clearnet SA enables Euronext to Offer new services in post-trade business Further diversify its revenue mix Generate revenues from clearing activities without having to commit the capital that would otherwise be required for a clearing system operator 49 |
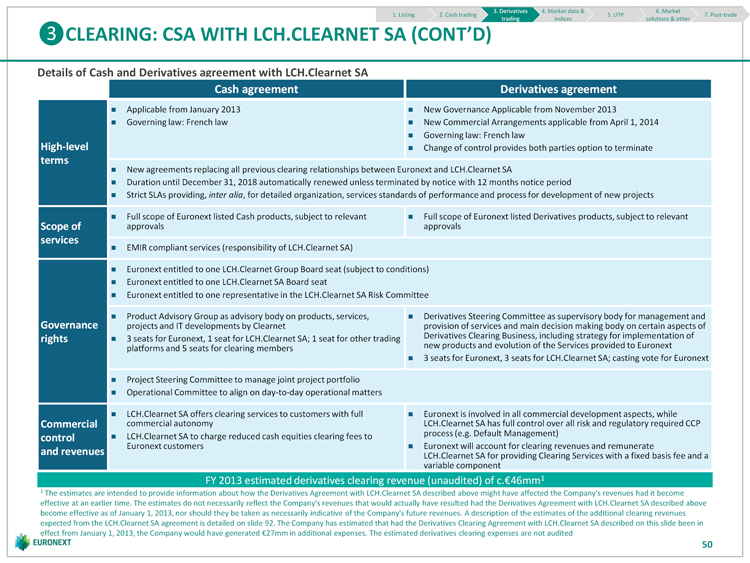 | 3. Derivatives 4. Market data & 6. Market 1. Listing 2. Cash trading 5. UTP 7. Post-trade trading indices solutions & other CLEARING: CSA WITH LCH.CLEARNET SA (CONT’D) Details of Cash and Derivatives agreement with LCH.Clearnet SA Cash agreement Derivatives agreement Applicable from January 2013 New Governance Applicable from November 2013 Governing law: French law New Commercial Arrangements applicable from April 1, 2014 Governing law: French law High-level Change of control provides both parties option to terminate terms New agreements replacing all previous clearing relationships between Euronext and LCH.Clearnet SA Duration until December 31, 2018 automatically renewed unless terminated by notice with 12 months notice period Strict SLAs providing, inter alia, for detailed organization, services standards of performance and process for development of new projects Full scope of Euronext listed Cash products, subject to relevant Full scope of Euronext listed Derivatives products, subject to relevant Scope of approvals approvals services EMIR compliant services (responsibility of LCH.Clearnet SA) Euronext entitled to one LCH.Clearnet Group Board seat (subject to conditions) Euronext entitled to one LCH.Clearnet SA Board seat Euronext entitled to one representative in the LCH.Clearnet SA Risk Committee Product Advisory Group as advisory body on products, services, Derivatives Steering Committee as supervisory body for management and Governance projects and IT developments by Clearnet provision of services and main decision making body on certain aspects of rights 3 seats for Euronext, 1 seat for LCH.Clearnet SA; 1 seat for other trading Derivatives Clearing Business, including strategy for implementation of platforms and 5 seats for clearing members new products and evolution of the Services provided to Euronext 3 seats for Euronext, 3 seats for LCH.Clearnet SA; casting vote for Euronext Project Steering Committee to manage joint project portfolio Operational Committee to align on day-to-day operational matters LCH.Clearnet SA offers clearing services to customers with full Euronext is involved in all commercial development aspects, while Commercial commercial autonomy LCH.Clearnet SA has full control over all risk and regulatory required CCP LCH.Clearnet SA to charge reduced cash equities clearing fees to process (e.g. Default Management) control Euronext customers Euronext will account for clearing revenues and remunerate and revenues LCH.Clearnet SA for providing Clearing Services with a fixed basis fee and a variable component FY 2013 estimated derivatives clearing revenue (unaudited) of c. 46mm1 1 The estimates are intended to provide information about how the Derivatives Agreement with LCH.Clearnet SA described above might have affected the Company’s revenues had it become effective at an earlier time. The estimates do not necessarily reflect the Company’s revenues that would actually have resulted had the Derivatives Agreement with LCH.Clearnet SA described above become effective as of January 1, 2013, nor should they be taken as necessarily indicative of the Company’s future revenues. A description of the estimates of the additional clearing revenues expected from the LCH.Clearnet SA agreement is detailed on slide 92. The Company has estimated that had the Derivatives Clearing Agreement with LCH.Clearnet SA described on this slide been in effect from January 1, 2013, the Company would have generated 27mm in additional expenses. The estimated derivatives clearing expenses are not audited 50 |
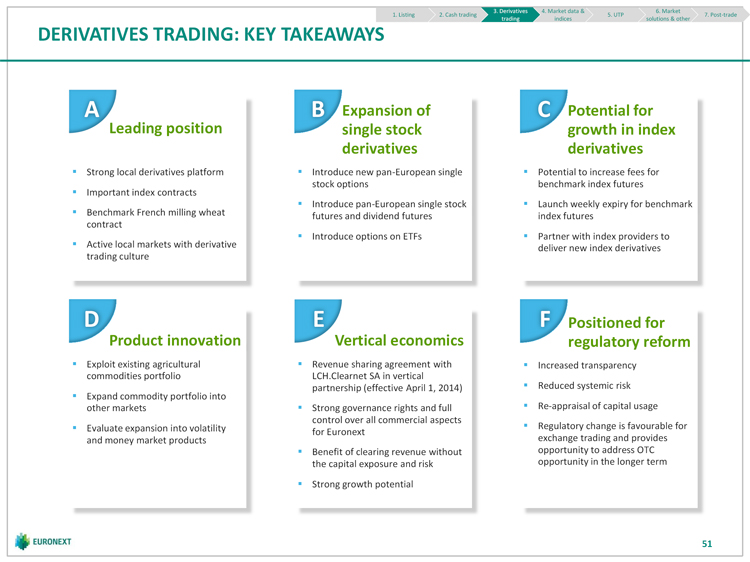 | 3. Derivatives 4. Market data & 6. Market 1. Listing 2. Cash trading 5. UTP 7. Post-trade trading indices solutions & other DERIVATIVES TRADING: KEY TAKEAWAYS A B Expansion of C Potential for Leading position single stock growth in index derivatives derivatives Strong local derivatives platform Introduce new pan-European single Potential to increase fees for stock options benchmark index futures Important index contracts Introduce pan-European single stock Launch weekly expiry for benchmark Benchmark French milling wheat futures and dividend futures index futures contract Introduce options on ETFs Partner with index providers to Active local markets with derivative deliver new index derivatives trading culture D E F Positioned for Product innovation Vertical economics regulatory reform Exploit existing agricultural Revenue sharing agreement with Increased transparency commodities portfolio LCH.Clearnet SA in vertical partnership (effective April 1, 2014) Reduced systemic risk Expand commodity portfolio into other markets Strong governance rights and full Re-appraisal of capital usage control over all commercial aspects Evaluate expansion into volatility Regulatory change is favourable for for Euronext and money market products exchange trading and provides Benefit of clearing revenue without opportunity to address OTC the capital exposure and risk opportunity in the longer term Strong growth potential 51 |
 | MARKET DATA & INDICES |
 | 3. Derivatives 4. Market data & 6. Market 1. Listing 2. Cash trading 5. UTP 7. Post-trade trading indices solutions & other MARKET DATA & INDICES: INTRODUCTION Well developed market data product suite, over 340 vendors disseminating data to 190,000 screens in 1 more than 140 countries 2 Resilient, high-margin revenues with relative immunity to variations in trading volumes 3 Maximising market data revenue through policy and contract enhancements 4 Growth in index usage licensing to over 5,000 listed products Exploring partnerships to enhance product offering relating to Euronext traded products, starting with 5 equities volatility data 6 Alliance with data and index providers to increase depth of Euronext products 7 Expand third-party index calculation services 8 Leverage technology and network for the distribution of third-party index services 9 Support clients’ needs for independent index calculation agents 53 |
 | 3. Derivatives 4. Market data & 6. Market 1. Listing 2. Cash trading 5. UTP 7. Post-trade trading indices solutions & other EURONEXT HAS A WELL DEVELOPED MARKET DATA PRODUCT SUITE … Revenue contribution Description Distribution of real time prices Pre-trade: current bid and offer prices and the depth of trading interests Post-trade: price, volume and time of the transactions executed Distribution of reference and historic data Market Data In 2013, development of new products, diversifying revenue away from reliance on 95% real time terminal users 80mm Non Display Trading Licences Index Constituent Weights Licences Calculates, manages, licenses and distributes real time indices Blue chip indices are the preeminent brands Indices Primary and basket indices for the markets Indices are displayed and quoted by major media 5% 4mm Direct licensing revenue combined with market data and derivatives fees on indices Total FY 2013 reported revenue (unaudited1) = 84mm ¹ Audited financials for 2013 to be provided in due course 54 |
 | 3. Derivatives 4. Market data & 6. Market 1. Listing 2. Cash trading 5. UTP 7. Post-trade trading indices solutions & other … WITH RESILIENT REVENUES Reported revenue Reported market data revenue split ( mm, unaudited1) (FY 2013, unaudited1) Market data Indices Commodities Retail 2% 4% Derivatives 11% 87 87 84 5 5 4 82 82 80 Cash Equities 82% Total FY 2013 market data revenues 2011 2012 2013 (unaudited1) = 80mm ¹ Audited financials for 2011, 2012 and 2013 to be provided in due course 55 |
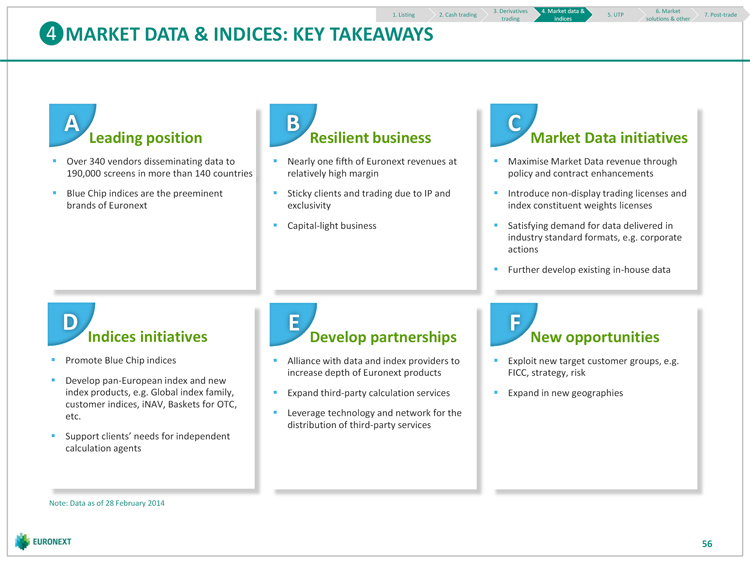 | 3. Derivatives 4. Market data & 6. Market 1. Listing 2. Cash trading 5. UTP 7. Post-trade trading indices solutions & other MARKET DATA & INDICES: KEY TAKEAWAYS A B C Leading position Resilient business Market Data initiatives Over 340 vendors disseminating data to Nearly one fifth of Euronext revenues at Maximise Market Data revenue through 190,000 screens in more than 140 countries relatively high margin policy and contract enhancements Blue Chip indices are the preeminent Sticky clients and trading due to IP and Introduce non-display trading licenses and brands of Euronext exclusivity index constituent weights licenses Capital-light business Satisfying demand for data delivered in industry standard formats, e.g. corporate actions Further develop existing in-house data D E F Indices initiatives Develop partnerships opportunities Promote Blue Chip indices Alliance with data and index providers to Exploit new target customer groups, e.g. increase depth of Euronext products FICC, strategy, risk Develop pan-European index and new index products, e.g. Global index family, Expand third-party calculation services Expand in new geographies customer indices, iNAV, Baskets for OTC, etc. Leverage technology and network for the distribution of third-party services Support clients’ needs for independent calculation agents Note: Data as of 28 February 2014 56 |
 | UNIVERSAL TRADING PLATFORM |
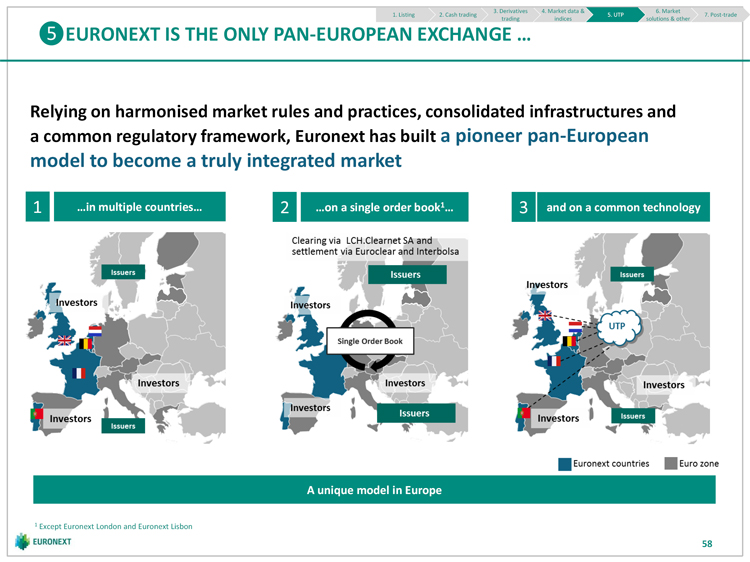 | 3. Derivatives 4. Market data & 6. Market 1. Listing 2. Cash trading 5. UTP 7. Post-trade trading indices solutions & other EURONEXT IS THE ONLY PAN-EUROPEAN EXCHANGE … Relying on harmonised market rules and practices, consolidated infrastructures and a common regulatory framework, Euronext has built a pioneer pan-European model to become a truly integrated market 1 …in multiple countries… 2 …on a single order book1… 3 and on a common technology A unique model in Europe 1 Except Euronext London and Euronext Lisbon 58 |
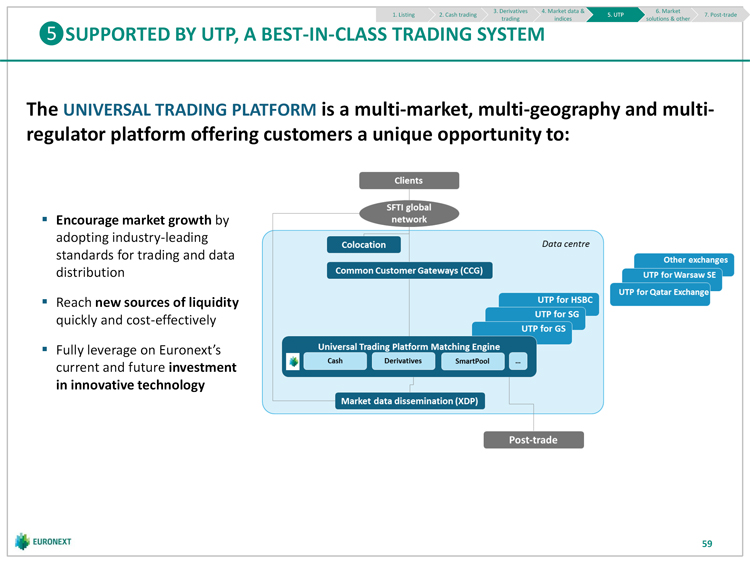 | 3. Derivatives 4. Market data & 6. Market 1. Listing 2. Cash trading 5. UTP 7. Post-trade trading indices solutions & other SUPPORTED BY UTP, A BEST-IN-CLASS TRADING SYSTEM The UNIVERSAL TRADING PLATFORM is a multi-market, multi-geography and multi-regulator platform offering customers a unique opportunity to: Encourage market growth by adopting industry-leading standards for trading and data distribution Reach new sources of liquidity quickly and cost-effectively Fully leverage on Euronext’s current and future investment in innovative technology 59 |
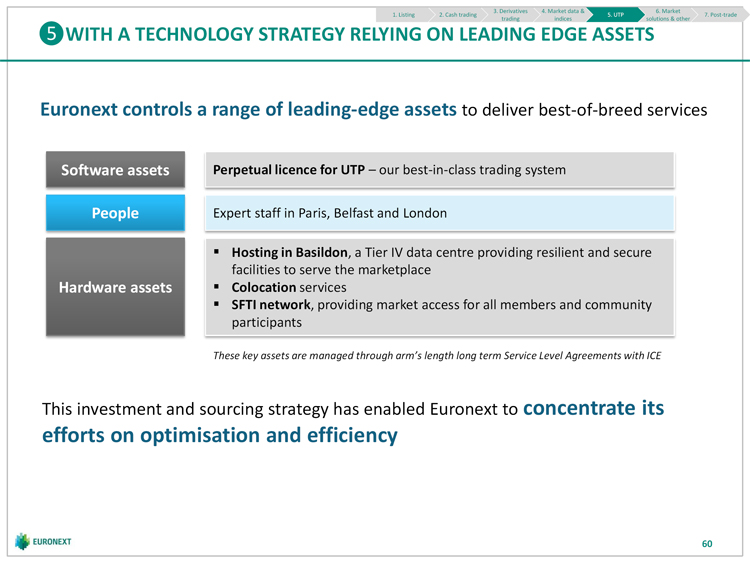 | 3. Derivatives 4. Market data & 6. Market 1. Listing 2. Cash trading 5. UTP 7. Post-trade trading indices solutions & other WITH A TECHNOLOGY STRATEGY RELYING ON LEADING EDGE ASSETS Euronext controls a range of leading-edge assets to deliver best-of-breed services Software assets Perpetual licence for UTP our best-in-class trading system People Expert staff in Paris, Belfast and London Hosting in Basildon, a Tier IV data centre providing resilient and secure facilities to serve the marketplace Hardware assets Colocation services SFTI network, providing market access for all members and community participants These key assets are managed through arm’s length long term Service Level Agreements with ICE This investment and sourcing strategy has enabled Euronext to concentrate its efforts on optimisation and efficiency 60 |
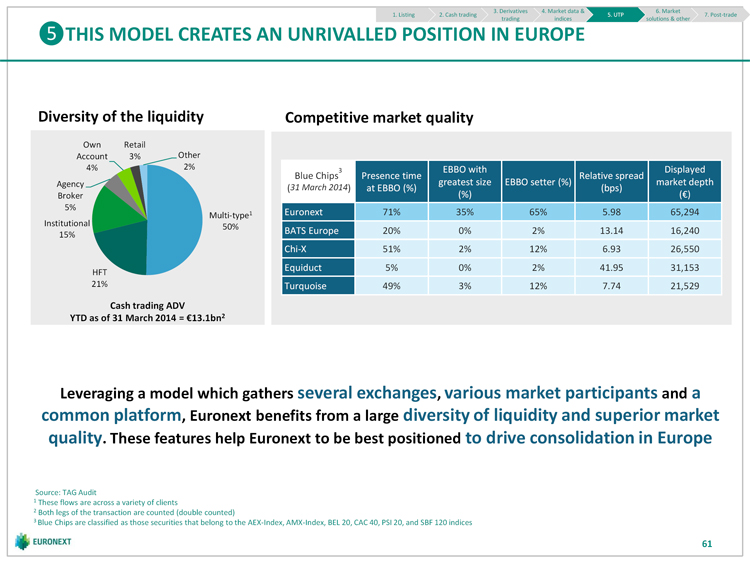 | 3. Derivatives 4. Market data & 6. Market 1. Listing 2. Cash trading 5. UTP 7. Post-trade trading indices solutions & other THIS MODEL CREATES AN UNRIVALLED POSITION IN EUROPE Diversity of the liquidity Competitive market quality Own Retail Account 3% Other 4% 2% EBBO with Displayed Blue Chips3 Presence time Relative spread Agency greatest size EBBO setter (%) market depth (31 March 2014) at EBBO (%) (bps) Broker (%) ( ) 5% Multi-type1 Euronext 71% 35% 65% 5.98 65,294 Institutional 50% BATS Europe 20% 0% 2% 13.14 16,240 15% Chi-X 51% 2% 12% 6.93 26,550 Equiduct 5% 0% 2% 41.95 31,153 HFT 21% Turquoise 49% 3% 12% 7.74 21,529 Cash trading ADV YTD as of 31 March 2014 = 13.1bn2 Leveraging a model which gathers several exchanges, various market participants and a common platform, Euronext benefits from a large diversity of liquidity and superior market quality. These features help Euronext to be best positioned to drive consolidation in Europe Source: TAG Audit 1 These flows are across a variety of clients 2 Both legs of the transaction are counted (double counted) 3 Blue Chips are classified as those securities that belong to the AEX-Index, AMX-Index, BEL 20, CAC 40, PSI 20, and SBF 120 indices 61 |
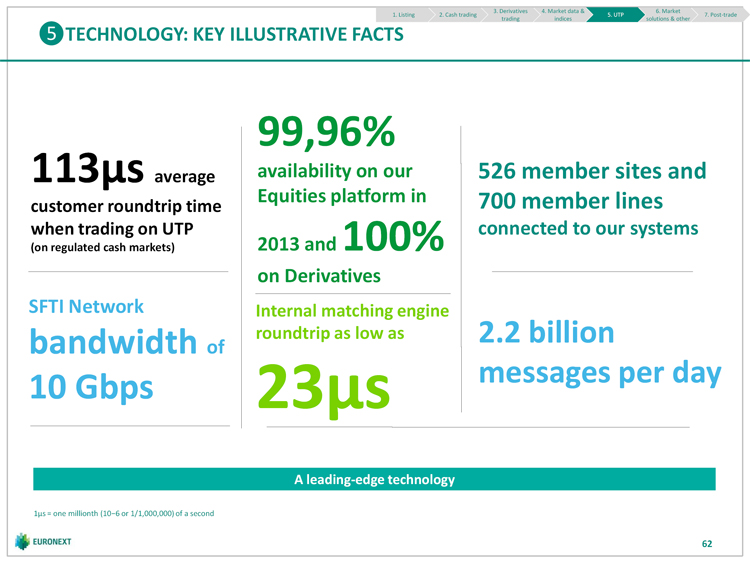 | 3. Derivatives 4. Market data & 6. Market 1. Listing 2. Cash trading 5. UTP 7. Post-trade trading indices solutions & other TECHNOLOGY: KEY ILLUSTRATIVE FACTS 99,96% 113µs average availability on our 526 member sites and Equities platform in 700 member lines customer roundtrip time when trading on UTP connected to our systems (on regulated cash markets) 2013 and 100% on Derivatives SFTI Network Internal matching engine bandwidth roundtrip as low as 2.2 billion of messages per day 10 Gbps 23µs A leading-edge technology 1μs = one millionth (10 6 or 1/1,000,000) of a second 62 |
 | MARKET SOLUTIONS & OTHER |
 | 3. Derivatives 4. Market data & 6. Market 1. Listing 2. Cash trading 5. UTP 7. Post-trade trading indices solutions & other MARKET SOLUTIONS & OTHER: INTRODUCTION Market Solutions makes Euronext technology and services available to other 1 markets A unique opportunity to build on the technology that created the Euronext single 2 order book 3 Ideal timing for rationalising the portfolio 4 A business strategy focused on exchange relationships 64 |
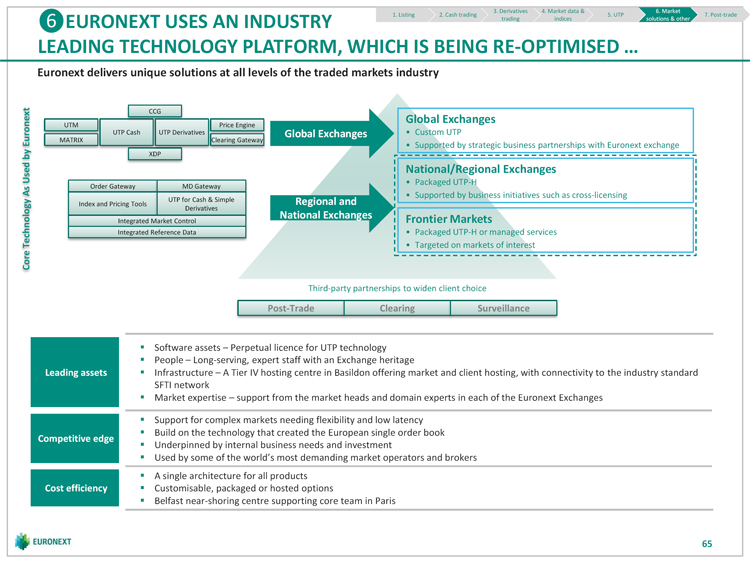 | 3. Derivatives 4. Market data & 6. Market 1. Listing 2. Cash trading 5. UTP 7. Post-trade EURONEXT USES AN INDUSTRY trading indices solutions & other LEADING TECHNOLOGY PLATFORM, WHICH IS BEING RE-OPTIMISED … Euronext delivers unique solutions at all levels of the traded markets industry CCG Global Exchanges UTM Price Engine UTP Cash UTP Derivatives Global Exchanges Custom UTP MATRIX Clearing Gateway Supported by strategic business partnerships with Euronext exchange XDP National/Regional Exchanges Packaged UTP-H Order Gateway MD Gateway Supported by business initiatives such as cross-licensing UTP for Cash & Simple Regional and Index and Pricing Tools Derivatives National Exchanges Frontier Markets Integrated Market Control Integrated Reference Data Packaged UTP-H or managed services Core Technology As Used by Euronext Targeted on markets of interest Third-party partnerships to widen client choice Post-Trade Clearing Surveillance Software assets Perpetual licence for UTP technology People Long-serving, expert staff with an Exchange heritage Leading assets Infrastructure A Tier IV hosting centre in Basildon offering market and client hosting, with connectivity to the industry standard SFTI network Market expertise support from the market heads and domain experts in each of the Euronext Exchanges Support for complex markets needing flexibility and low latency Build on the technology that created the European single order book Competitive edge Underpinned by internal business needs and investment Used by some of the world’s most demanding market operators and brokers A single architecture for all products Cost efficiency Customisable, packaged or hosted options Belfast near-shoring centre supporting core team in Paris 65 |
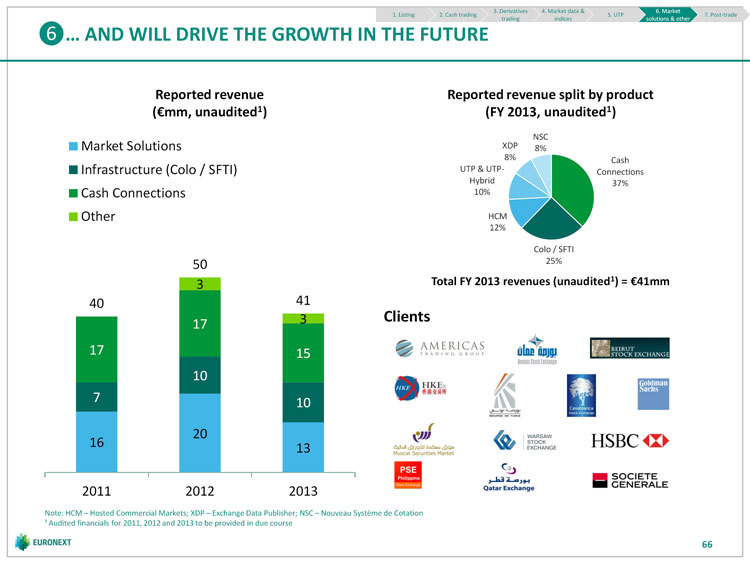 | 3. Derivatives 4. Market data & 6. Market 1. Listing 2. Cash trading 5. UTP 7. Post-trade trading indices solutions & other … AND WILL DRIVE THE GROWTH IN THE FUTURE Reported revenue Reported revenue split by product ( mm, unaudited1) (FY 2013, unaudited1) NSC Market Solutions XDP 8% 8% Cash Infrastructure (Colo / SFTI) UTP & UTP- Connections Hybrid 37% Cash Connections 10% Other HCM 12% Colo / SFTI 50 25% 3 Total FY 2013 revenues (unaudited1) = 41mm 40 41 3 Clients 17 17 15 10 7 10 20 16 13 2011 2012 2013 Note: HCM Hosted Commercial Markets; XDP Exchange Data Publisher; NSC Nouveau Système de Cotation ¹ Audited financials for 2011, 2012 and 2013 to be provided in due course 66 |
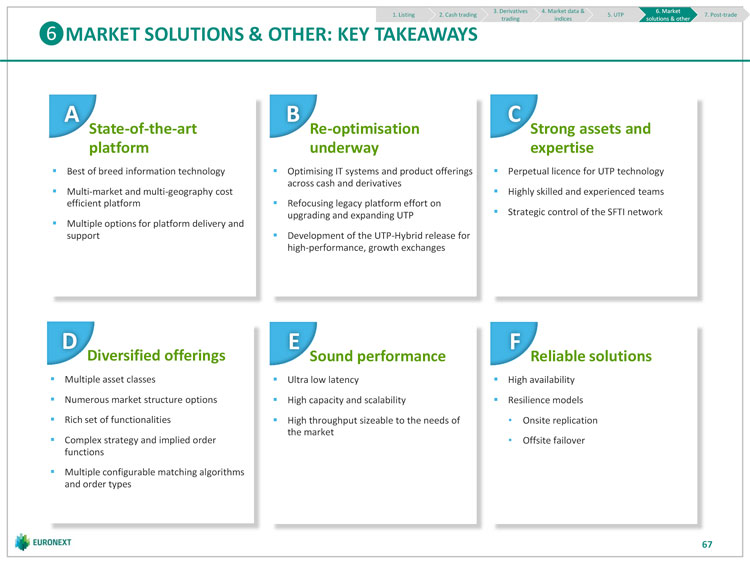 | 3. Derivatives 4. Market data & 6. Market 1. Listing 2. Cash trading 5. UTP 7. Post-trade trading indices solutions & other MARKET SOLUTIONS & OTHER: KEY TAKEAWAYS A B C -of-the-art -optimisation Strong assets and platform underway expertise Best of breed information technology Optimising IT systems and product offerings Perpetual licence for UTP technology across cash and derivatives Multi-market and multi-geography cost Highly skilled and experienced teams efficient platform Refocusing legacy platform effort on upgrading and expanding UTP Strategic control of the SFTI network Multiple options for platform delivery and support Development of the UTP-Hybrid release for high-performance, growth exchanges D E F Diversified offerings Sound performance Reliable solutions Multiple asset classes Ultra low latency High availability Numerous market structure options High capacity and scalability Resilience models Rich set of functionalities High throughput sizeable to the needs of Onsite replication the market Complex strategy and implied order Offsite failover functions Multiple configurable matching algorithms and order types 67 |
 | POST-TRADE |
 | 3. Derivatives 4. Market data & 6. Market 1. Listing 2. Cash trading 5. UTP 7. Post-trade trading indices solutions & other INTERBOLSA Overview National Central Securities Depository for Portugal National Settlement Systems for securities for Portugal supporting settlement of operations resulting from Regulated or non-regulated market OTC operations Securities lending operations FOP (Free-of-payment) transfers through the Securities Lending Management System Exercise of rights inherent to the securities registered or deposited in the Central Securities Depository Calculation of the corresponding financial settlement and sending of the payment instructions wherever the payment is in euro or in non-euro currencies National Numbering Agency in charge of Assignment of ISIN codes to all securities issued in Portugal Assignment of CFI codes to all securities with ISIN codes Nationwide disclosure of the assigned codes Intermediary between the national entities and the other National Numbering Agencies 69 |
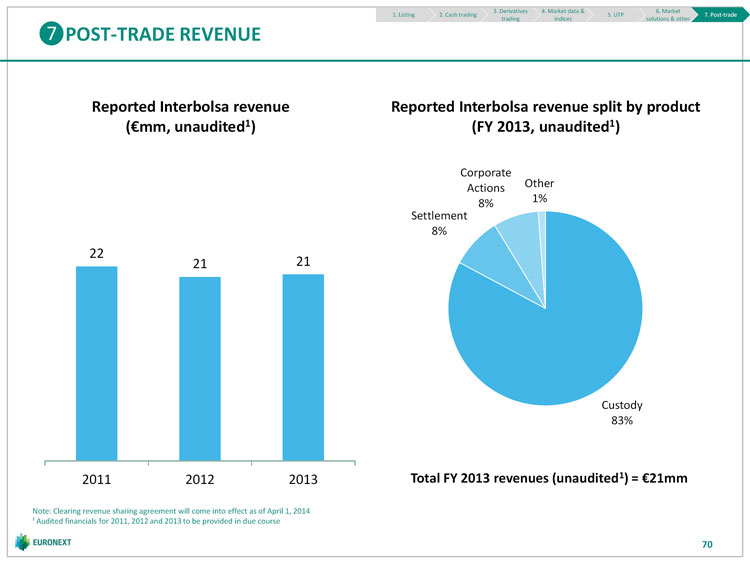 | 3. Derivatives 4. Market data & 6. Market 1. Listing 2. Cash trading 5. UTP 7. Post-trade trading indices solutions & other POST-TRADE REVENUE Reported Interbolsa revenue Reported Interbolsa revenue split by product ( mm, unaudited1) (FY 2013, unaudited1) Corporate Other Actions 1% 8% Settlement 8% 22 21 21 Custody 83% 2011 2012 2013 Total FY 2013 revenues (unaudited1) = 21mm Note: Clearing revenue sharing agreement will come into effect as of April 1, 2014 ¹ Audited financials for 2011, 2012 and 2013 to be provided in due course 70 |
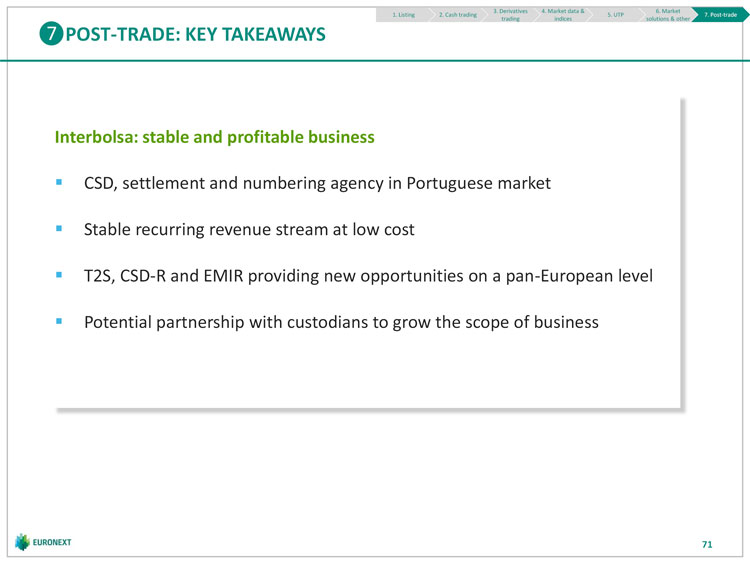 | 3. Derivatives 4. Market data & 6. Market 1. Listing 2. Cash trading 5. UTP 7. Post-trade trading indices solutions & other POST-TRADE: KEY TAKEAWAYS Interbolsa: stable and profitable business CSD, settlement and numbering agency in Portuguese market Stable recurring revenue stream at low cost T2S, CSD-R and EMIR providing new opportunities on a pan-European level Potential partnership with custodians to grow the scope of business 71 |
 | IV Financials |
 | INTRODUCTION Last three years: the end cycle of strong market disruptions? 2011-2013 macro environment 2011-2013 market conditions and volatility Historical combined financial statements reflect business segment within NYSE Euronext Today, a new Euronext: new business perimeter, different business mix and different dynamics triggered by standalone strategy 73 |
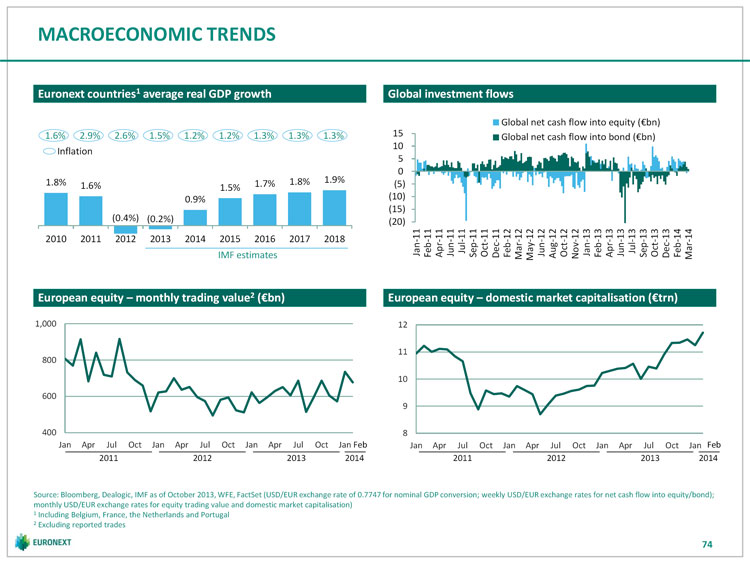 | MACROECONOMIC TRENDS Euronext countries1 average real GDP growth Global investment flows Global net cash flow into equity ( bn) 1.6% 2.9% 2.6% 1.5% 1.2% 1.2% 1.3% 1.3% 1.3% 15 Global net cash flow into bond ( bn) 10 Inflation 5 0 1.8% 1.8% 1.9% 1.6% 1.7% (5) 1.5% 0.9% (10) (15) (0.4%) (0.2%) (20) 2010 2011 2012 2013 2014 2015 2016 2017 2018 Jan-11 Feb-11 Apr-11 Jun-11 Jul-11 Sep-11 Oct-11 Feb-12 Jun-12 Oct-12 Jan-13 Feb-13 Apr-13 Jun-13 Jul-13 Sep-13 Oct-13 Feb-14 IMF estimates Dec-11 Mar-12 May-12 Aug-12 Nov-12 Dec-13 Mar-14 European equity monthly trading value2 ( bn) European equity domestic market capitalisation ( trn) 1,000 12 11 800 10 600 9 400 8 Jan Apr Jul Oct Jan Apr Jul Oct Jan Apr Jul Oct Jan Feb Jan Apr Jul Oct Jan Apr Jul Oct Jan Apr Jul Oct Jan Feb 2011 2012 2013 2014 2011 2012 2013 2014 Source: Bloomberg, Dealogic, IMF as of October 2013, WFE, FactSet (USD/EUR exchange rate of 0.7747 for nominal GDP conversion; weekly USD/EUR exchange rates for net cash flow into equity/bond); monthly USD/EUR exchange rates for equity trading value and domestic market capitalisation) 1 Including Belgium, France, the Netherlands and Portugal 2 Excluding reported trades 74 |
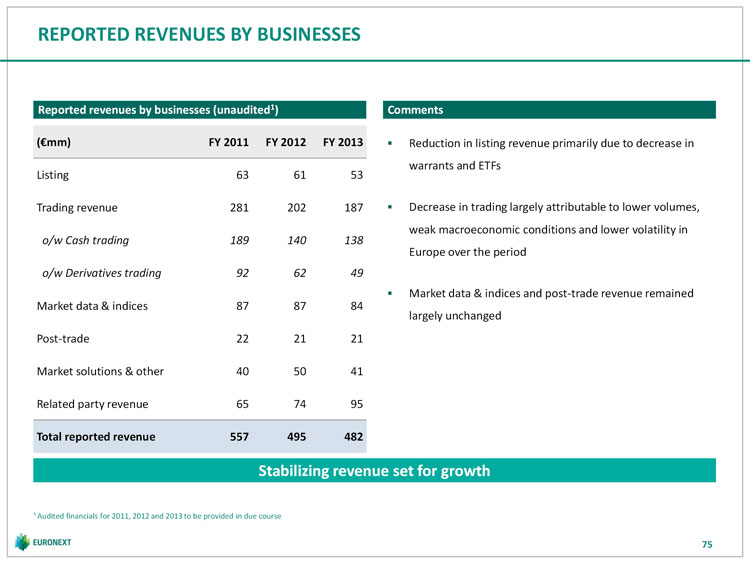 | REPORTED REVENUES BY BUSINESSES Reported revenues by businesses (unaudited1) Comments ( mm) FY 2011 FY 2012 FY 2013 Reduction in listing revenue primarily due to decrease in warrants and ETFs Listing 63 61 53 Trading revenue 281 202 187 Decrease in trading largely attributable to lower volumes, weak macroeconomic conditions and lower volatility in o/w Cash trading 189 140 138 Europe over the period o/w Derivatives trading 92 62 49 Market data & indices and post-trade revenue remained Market data & indices 87 87 84 largely unchanged Post-trade 22 21 21 Market solutions & other 40 50 41 Related party revenue 65 74 95 Total reported revenue 557 495 482 Stabilizing revenue set for growth ¹ Audited financials for 2011, 2012 and 2013 to be provided in due course 75 |
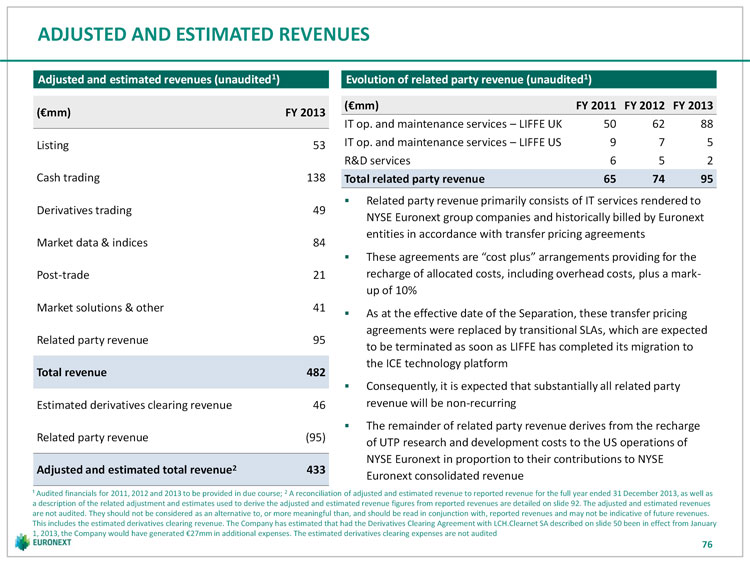 | ADJUSTED AND ESTIMATED REVENUES Adjusted and estimated revenues (unaudited1) Evolution of related party revenue (unaudited1) ( mm) FY 2011 FY 2012 FY 2013 ( mm) FY 2013 IT op. and maintenance services LIFFE UK 50 62 88 Listing 53 IT op. and maintenance services LIFFE US 9 7 5 R&D services 6 5 2 Cash trading 138 Total related party revenue 65 74 95 Related party revenue primarily consists of IT services rendered to Derivatives trading 49 NYSE Euronext group companies and historically billed by Euronext entities in accordance with transfer pricing agreements Market data & indices 84 These agreements are “cost plus” arrangements providing for the Post-trade 21 recharge of allocated costs, including overhead costs, plus a mark-up of 10% Market solutions & other 41 As at the effective date of the Separation, these transfer pricing agreements were replaced by transitional SLAs, which are expected Related party revenue 95 to be terminated as soon as LIFFE has completed its migration to the ICE technology platform Total revenue 482 Consequently, it is expected that substantially all related party Estimated derivatives clearing revenue 46 revenue will be non-recurring The remainder of related party revenue derives from the recharge Related party revenue (95) of UTP research and development costs to the US operations of NYSE Euronext in proportion to their contributions to NYSE Adjusted and estimated total revenue2 433 Euronext consolidated revenue ¹ Audited financials for 2011, 2012 and 2013 to be provided in due course; 2 A reconciliation of adjusted and estimated revenue to reported revenue for the full year ended 31 December 2013, as well as a description of the related adjustment and estimates used to derive the adjusted and estimated revenue figures from reported revenues are detailed on slide 92. The adjusted and estimated revenues are not audited. They should not be considered as an alternative to, or more meaningful than, and should be read in conjunction with, reported revenues and may not be indicative of future revenues. This includes the estimated derivatives clearing revenue. The Company has estimated that had the Derivatives Clearing Agreement with LCH.Clearnet SA described on slide 50 been in effect from January 1, 2013, the Company would have generated 27mm in additional expenses. The estimated derivatives clearing expenses are not audited 76 |
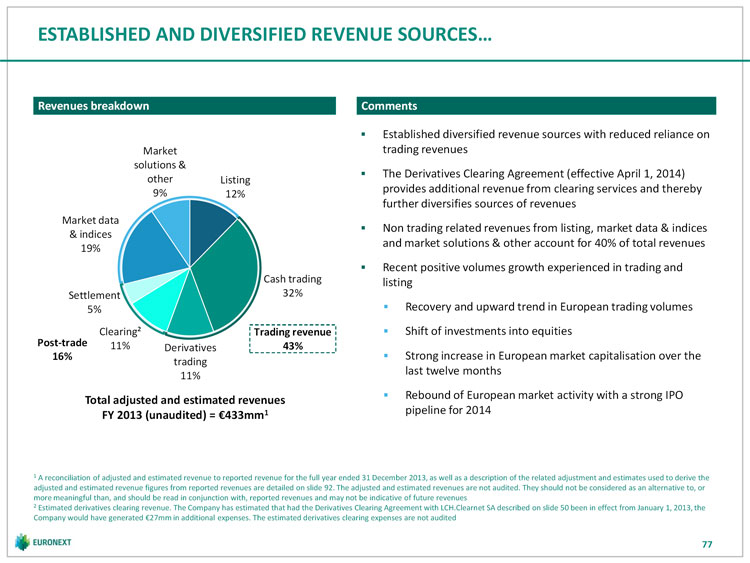 | ESTABLISHED AND DIVERSIFIED REVENUE SOURCES… Revenues breakdown Comments Established diversified revenue sources with reduced reliance on Market trading revenues solutions & The Derivatives Clearing Agreement (effective April 1, 2014) other Listing 9% provides additional revenue from clearing services and thereby 12% further diversifies sources of revenues Market data Non trading related revenues from listing, market data & indices & indices and market solutions & other account for 40% of total revenues 19% Recent positive volumes growth experienced in trading and Cash trading listing Settlement 32% 5% Recovery and upward trend in European trading volumes Clearing² Trading revenue Shift of investments into equities Post-trade 11% 43% Derivatives 16% Strong increase in European market capitalisation over the trading last twelve months 11% Rebound of European market activity with a strong IPO Total adjusted and estimated revenues pipeline for 2014 FY 2013 (unaudited) = 433mm1 1 A reconciliation of adjusted and estimated revenue to reported revenue for the full year ended 31 December 2013, as well as a description of the related adjustment and estimates used to derive the adjusted and estimated revenue figures from reported revenues are detailed on slide 92. The adjusted and estimated revenues are not audited. They should not be considered as an alternative to, or more meaningful than, and should be read in conjunction with, reported revenues and may not be indicative of future revenues 2 Estimated derivatives clearing revenue. The Company has estimated that had the Derivatives Clearing Agreement with LCH.Clearnet SA described on slide 50 been in effect from January 1, 2013, the Company would have generated 27mm in additional expenses. The estimated derivatives clearing expenses are not audited 77 |
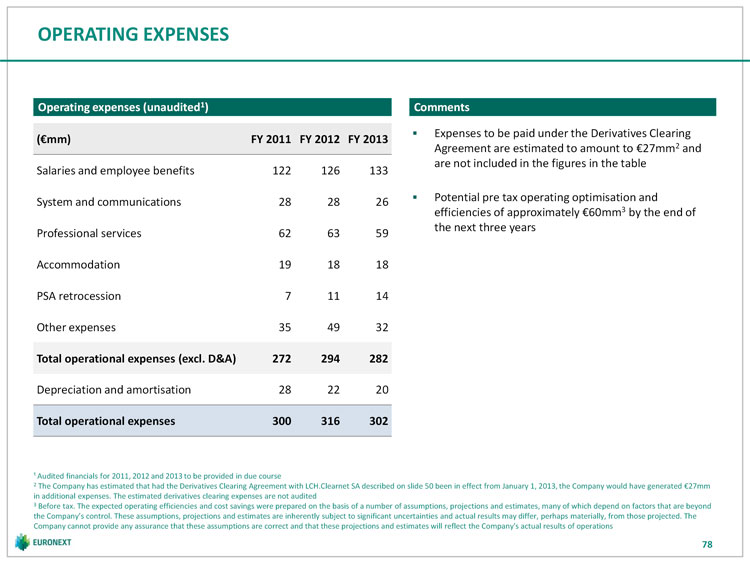 | OPERATING EXPENSES Operating expenses (unaudited1) Comments Expenses to be paid under the Derivatives Clearing ( mm) FY 2011 FY 2012 FY 2013 Agreement are estimated to amount to 27mm2 and are not included in the figures in the table Salaries and employee benefits 122 126 133 Potential pre tax operating optimisation and System and communications 28 28 26 efficiencies of approximately 60mm3 by the end of the next three years Professional services 62 63 59 Accommodation 19 18 18 PSA retrocession 7 11 14 Other expenses 35 49 32 Total operational expenses (excl. D&A) 272 294 282 Depreciation and amortisation 28 22 20 Total operational expenses 300 316 302 ¹ Audited financials for 2011, 2012 and 2013 to be provided in due course 2 The Company has estimated that had the Derivatives Clearing Agreement with LCH.Clearnet SA described on slide 50 been in effect from January 1, 2013, the Company would have generated 27mm in additional expenses. The estimated derivatives clearing expenses are not audited 3 Before tax. The expected operating efficiencies and cost savings were prepared on the basis of a number of assumptions, projections and estimates, many of which depend on factors that are beyond the Company’s control. These assumptions, projections and estimates are inherently subject to significant uncertainties and actual results may differ, perhaps materially, from those projected. The Company cannot provide any assurance that these assumptions are correct and that these projections and estimates will reflect the Company’s actual results of operations 78 |
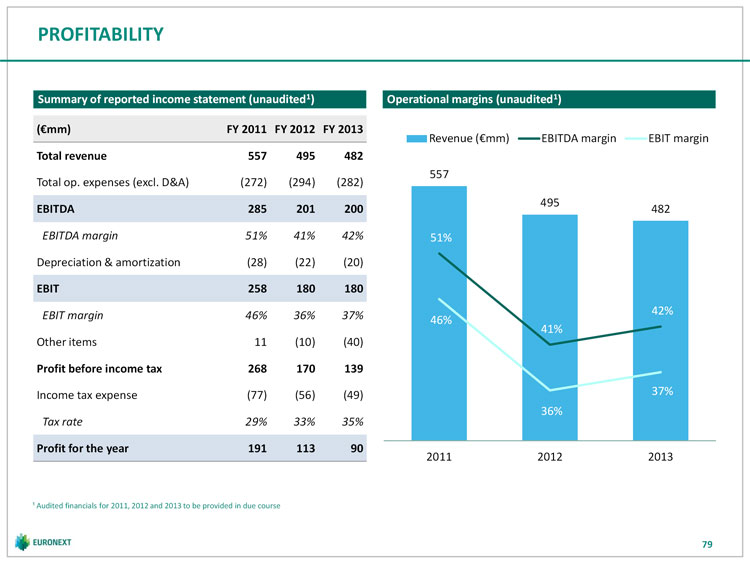 | PROFITABILITY Summary of reported income statement (unaudited1) Operational margins (unaudited Revenue evolution and profitability (unaudited 1) 1) ( mm) FY 2011 FY 2012 FY 2013 Revenue ( mm) EBITDA margin EBIT margin Total revenue 557 495 482 557 Total op. expenses (excl. D&A) (272) (294) (282) 495 EBITDA 285 201 200 482 EBITDA margin 51% 41% 42% 51% Depreciation & amortization (28) (22) (20) EBIT 258 180 180 EBIT margin 46% 36% 37% 42% 46% 41% Other items 11 (10) (40) Profit before income tax 268 170 139 Income tax expense (77) (56) (49) 37% 36% Tax rate 29% 33% 35% Profit for the year 191 113 90 2011 2012 2013 ¹ Audited financials for 2011, 2012 and 2013 to be provided in due course 79 |
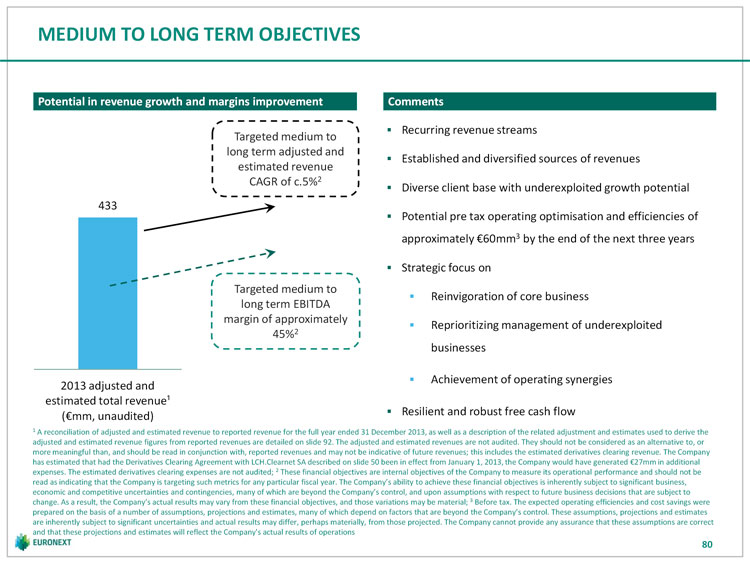 | MEDIUM TO LONG TERM OBJECTIVES Potential in revenue growth and margins improvement Comments Recurring revenue streams Targeted medium to long term adjusted and Established and diversified sources of revenues estimated revenue CAGR of c.5%2 Diverse client base with underexploited growth potential 433 Potential pre tax operating optimisation and efficiencies of approximately 60mm3 by the end of the next three years Strategic focus on Targeted medium to Reinvigoration of core business long term EBITDA margin of approximately Reprioritizing management of underexploited 45%2 businesses Achievement of operating synergies 2013 adjusted and estimated total revenue¹ Resilient and robust free cash flow ( mm, unaudited) 1 A reconciliation of adjusted and estimated revenue to reported revenue for the full year ended 31 December 2013, as well as a description of the related adjustment and estimates used to derive the adjusted and estimated revenue figures from reported revenues are detailed on slide 92. The adjusted and estimated revenues are not audited. They should not be considered as an alternative to, or more meaningful than, and should be read in conjunction with, reported revenues and may not be indicative of future revenues; this includes the estimated derivatives clearing revenue. The Company has estimated that had the Derivatives Clearing Agreement with LCH.Clearnet SA described on slide 50 been in effect from January 1, 2013, the Company would have generated 27mm in additional expenses. The estimated derivatives clearing expenses are not audited; 2 These financial objectives are internal objectives of the Company to measure its operational performance and should not be read as indicating that the Company is targeting such metrics for any particular fiscal year. The Company’s ability to achieve these financial objectives is inherently subject to significant business, economic and competitive uncertainties and contingencies, many of which are beyond the Company’s control, and upon assumptions with respect to future business decisions that are subject to change. As a result, the Company’s actual results may vary from these financial objectives, and those variations may be material; 3 Before tax. The expected operating efficiencies and cost savings were prepared on the basis of a number of assumptions, projections and estimates, many of which depend on factors that are beyond the Company’s control. These assumptions, projections and estimates are inherently subject to significant uncertainties and actual results may differ, perhaps materially, from those projected. The Company cannot provide any assurance that these assumptions are correct and that these projections and estimates will reflect the Company’s actual results of operations 80 |
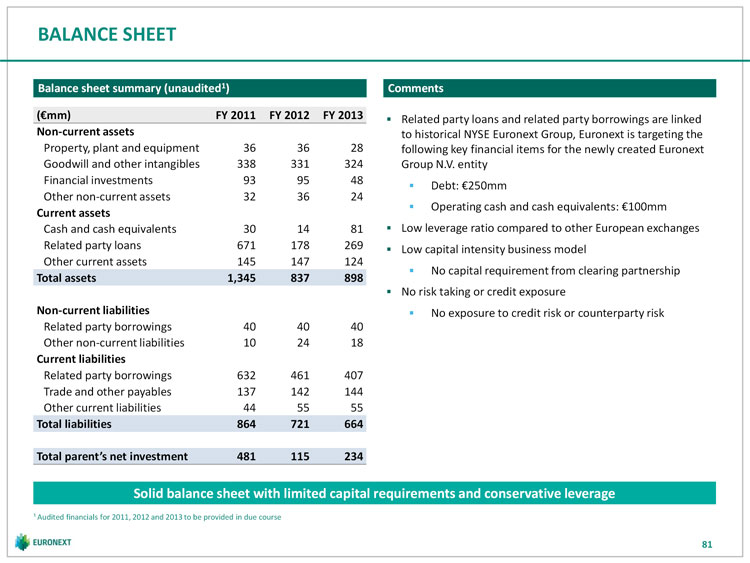 | BALANCE SHEET Balance sheet summary (unaudited1) Comments ( mm) FY 2011 FY 2012 FY 2013 Related party loans and related party borrowings are linked Non-current assets to historical NYSE Euronext Group, Euronext is targeting the Property, plant and equipment 36 36 28 following key financial items for the newly created Euronext Goodwill and other intangibles 338 331 324 Group N.V. entity Financial investments 93 95 48 Debt: 250mm Other non-current assets 32 36 24 Operating cash and cash equivalents: 100mm Current assets Cash and cash equivalents 30 14 81 Low leverage ratio compared to other European exchanges Related party loans 671 178 269 Low capital intensity business model Other current assets 145 147 124 No capital requirement from clearing partnership Total assets 1,345 837 898 No risk taking or credit exposure Non-current liabilities No exposure to credit risk or counterparty risk Related party borrowings 40 40 40 Other non-current liabilities 10 24 18 Current liabilities Related party borrowings 632 461 407 Trade and other payables 137 142 144 Other current liabilities 44 55 55 Total liabilities 864 721 664 Total parent’s net investment 481 115 234 Solid balance sheet with limited capital requirements and conservative leverage ¹ Audited financials for 2011, 2012 and 2013 to be provided in due course 81 |
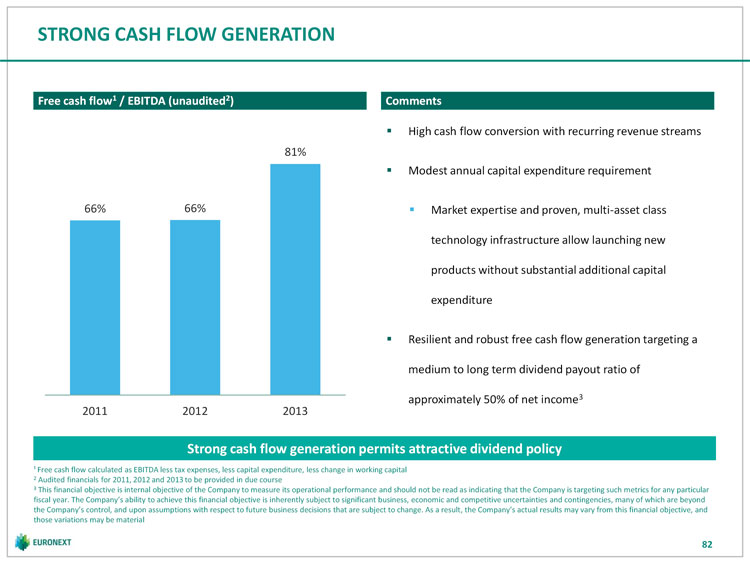 | STRONG CASH FLOW GENERATION Free cash flow1 / EBITDA (unaudited2) Comments High cash flow conversion with recurring revenue streams 81% Modest annual capital expenditure requirement 66% 66% Market expertise and proven, multi-asset class technology infrastructure allow launching new products without substantial additional capital expenditure Resilient and robust free cash flow generation targeting a medium to long term dividend payout ratio of approximately 50% of net income3 2011 2012 2013 Strong cash flow generation permits attractive dividend policy ¹ Free cash flow calculated as EBITDA less tax expenses, less capital expenditure, less change in working capital 2 Audited financials for 2011, 2012 and 2013 to be provided in due course 3 This financial objective is internal objective of the Company to measure its operational performance and should not be read as indicating that the Company is targeting such metrics for any particular fiscal year. The Company’s ability to achieve this financial objective is inherently subject to significant business, economic and competitive uncertainties and contingencies, many of which are beyond the Company’s control, and upon assumptions with respect to future business decisions that are subject to change. As a result, the Company’s actual results may vary from this financial objective, and those variations may be material 82 |
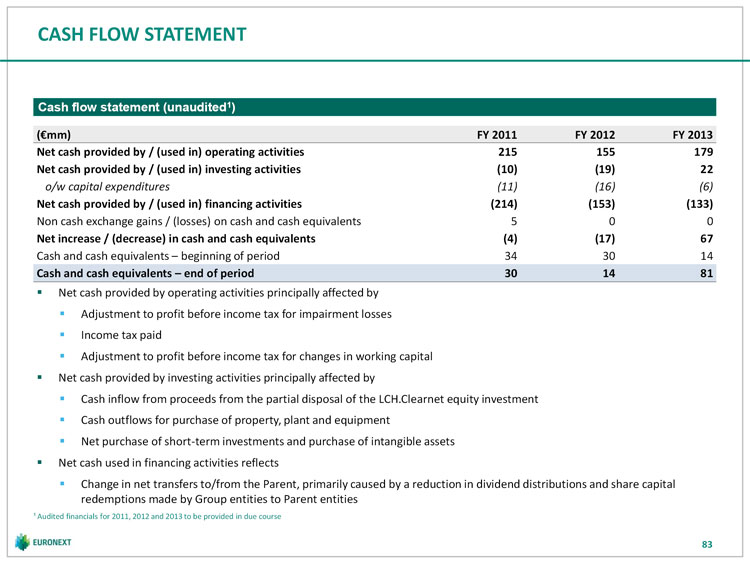 | CASH FLOW STATEMENT Cash flow statement (unaudited1) ( mm) FY 2011 FY 2012 FY 2013 Net cash provided by / (used in) operating activities 215 155 179 Net cash provided by / (used in) investing activities (10) (19) 22 o/w capital expenditures (11) (16) (6) Net cash provided by / (used in) financing activities (214) (153) (133) Non cash exchange gains / (losses) on cash and cash equivalents 5 0 0 Net increase / (decrease) in cash and cash equivalents (4) (17) 67 Cash and cash equivalents beginning of period 34 30 14 Cash and cash equivalents end of period 30 14 81 Net cash provided by operating activities principally affected by Adjustment to profit before income tax for impairment losses Income tax paid Adjustment to profit before income tax for changes in working capital Net cash provided by investing activities principally affected by Cash inflow from proceeds from the partial disposal of the LCH.Clearnet equity investment Cash outflows for purchase of property, plant and equipment Net purchase of short-term investments and purchase of intangible assets Net cash used in financing activities reflects Change in net transfers to/from the Parent, primarily caused by a reduction in dividend distributions and share capital redemptions made by Group entities to Parent entities ¹ Audited financials for 2011, 2012 and 2013 to be provided in due course 83 |
 | V Governance & regulation |
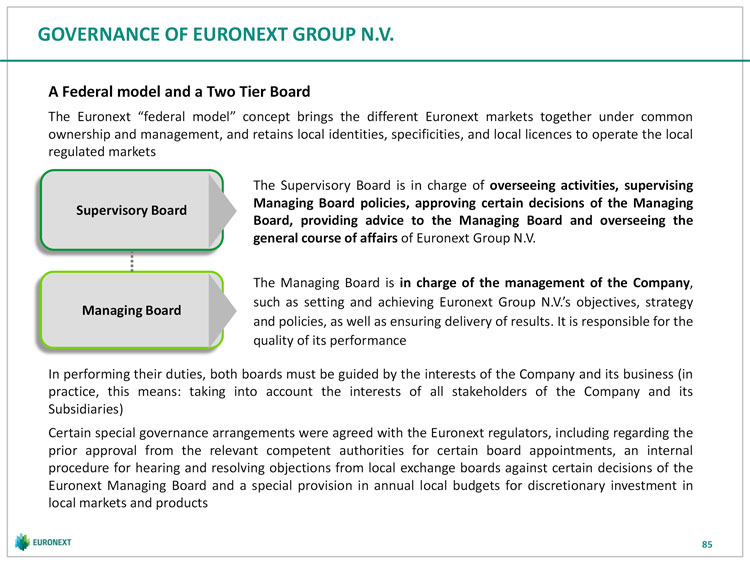 | GOVERNANCE OF EURONEXT GROUP N.V. A Federal model and a Two Tier Board The Euronext “federal model” concept brings the different Euronext markets together under common ownership and management, and retains local identities, specificities, and local licences to operate the local regulated markets The Supervisory Board is in charge of overseeing activities, supervising Managing Board policies, approving certain decisions of the Managing Supervisory Board Board, providing advice to the Managing Board and overseeing the general course of affairs of Euronext Group N.V. The Managing Board is in charge of the management of the Company, such as setting and achieving Euronext Group N.V.’s objectives, strategy Managing Board and policies, as well as ensuring delivery of results. It is responsible for the quality of its performance In performing their duties, both boards must be guided by the interests of the Company and its business (in practice, this means: taking into account the interests of all stakeholders of the Company and its Subsidiaries) Certain special governance arrangements were agreed with the Euronext regulators, including regarding the prior approval from the relevant competent authorities for certain board appointments, an internal procedure for hearing and resolving objections from local exchange boards against certain decisions of the Euronext Managing Board and a special provision in annual local budgets for discretionary investment in local markets and products 85 |
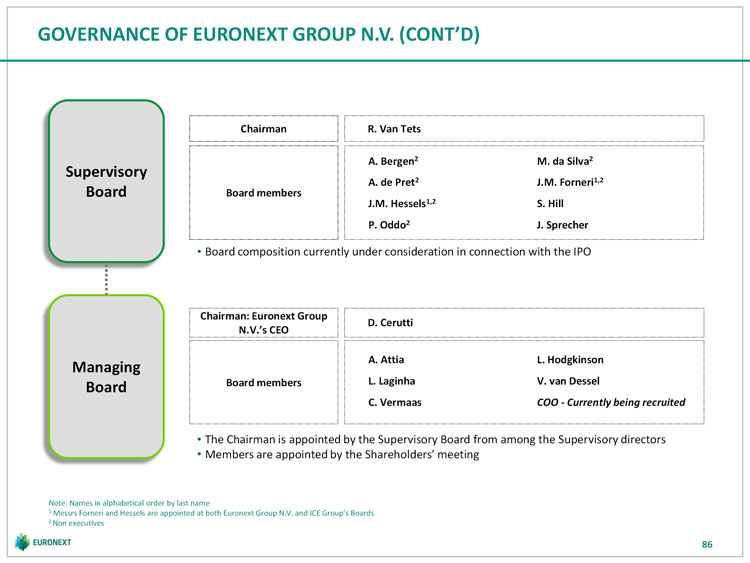 | GOVERNANCE OF EURONEXT GROUP N.V. (CONT’D) Chairman R. Van Tets A. Bergen2 M. da Silva2 Supervisory A. de Pret2 J.M. Forneri1,2 Board Board members J.M. Hessels1,2 S. Hill P. Oddo2 J. Sprecher Board composition currently under consideration in connection with the IPO Chairman: Euronext Group D. Cerutti N.V.’s CEO A. Attia L. Hodgkinson Managing Board Board members L. Laginha V. van Dessel C. Vermaas COO - Currently being recruited The Chairman is appointed by the Supervisory Board from among the Supervisory directors Members are appointed by the Shareholders’ meeting Note: Names in alphabetical order by last name 1 Messrs Forneri and Hessels are appointed at both Euronext Group N.V. and ICE Group’s Boards 2 Non executives 86 |
 | REGULATION GOVERNANCE: A FEDERAL MODEL One Holding Company (Euronext Group N.V.), with separate legal entities in each of the jurisdictions, having a national licence to operate markets College of Regulators (COR) Local Regulator Local Regulator Local Regulator Local Regulator Local Regulator AFM FSMA CMVM AMF FCA Euronext Group N.V. Euronext Euronext Euronext Euronext Euronext Amsterdam Brussels Lisbon Paris UK Markets Ltd* *Pending regulatory approvals Objectives of the MoU between the Euronext Regulators (updated MoU, June 2010) Co-ordinated supervision of the Euronext group Co-ordination with regard to approval of rules and regulations (dedicated working groups, Steering and Chairmen committees) Co-operation between Regulators enhances harmonization in the context of the E.U. directives implementation In addition, in the continental jurisdictions, also supervisory role and powers of the Ministries of Finance 87 |
 | VI Concluding remarks 88 |
 | EURONEXT: AN ATTRACTIVE INVESTMENT PROPOSITION 89 |
 | VII Appendices |
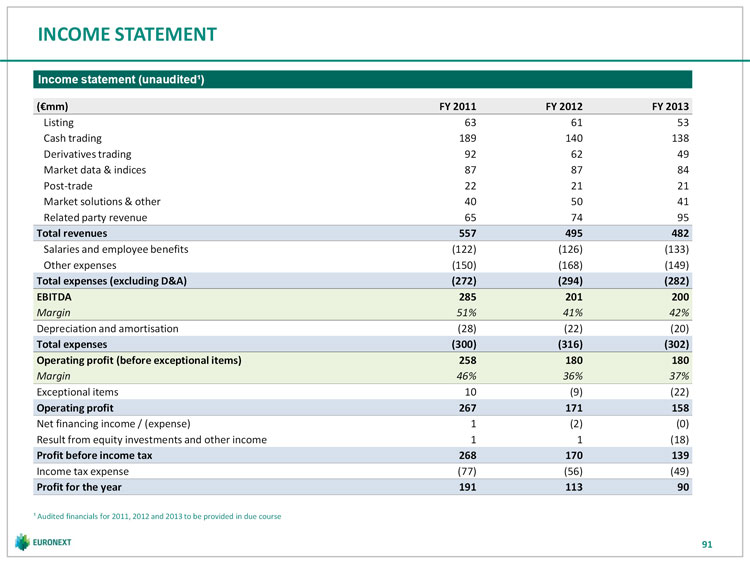 | INCOME STATEMENT Income statement (unaudited¹) ( mm) FY 2011 FY 2012 FY 2013 Listing 63 61 53 Cash trading 189 140 138 Derivatives trading 92 62 49 Market data & indices 87 87 84 Post-trade 22 21 21 Market solutions & other 40 50 41 Related party revenue 65 74 95 Total revenues 557 495 482 Salaries and employee benefits (122) (126) (133) Other expenses (150) (168) (149) Total expenses (excluding D&A) (272) (294) (282) EBITDA 285 201 200 Margin 51% 41% 42% Depreciation and amortisation (28) (22) (20) Total expenses (300) (316) (302) Operating profit (before exceptional items) 258 180 180 Margin 46% 36% 37% Exceptional items 10 (9) (22) Operating profit 267 171 158 Net financing income / (expense) 1 (2) (0) Result from equity investments and other income 1 1 (18) Profit before income tax 268 170 139 Income tax expense (77) (56) (49) Profit for the year 191 113 90 ¹ Audited financials for 2011, 2012 and 2013 to be provided in due course 91 |
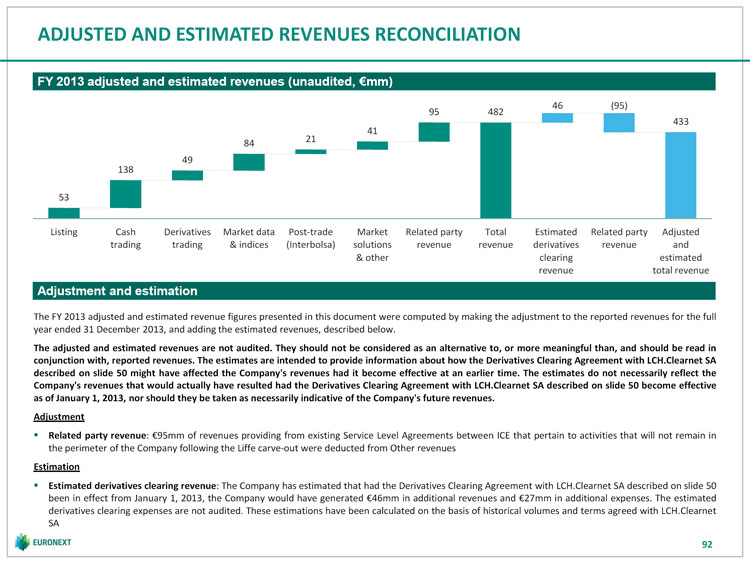 | ADJUSTED AND ESTIMATED REVENUES RECONCILIATION FY 2013 adjusted and estimated revenues (unaudited, mm) 46 (95) 95 482 433 41 21 84 49 138 53 Listing Cash Derivatives Market data Post-trade Market Related party Total Estimated Related party Adjusted trading trading & indices (Interbolsa) solutions revenue revenue derivatives revenue and & other clearing estimated revenue total revenue Adjustment and estimation The FY 2013 adjusted and estimated revenue figures presented in this document were computed by making the adjustment to the reported revenues for the full year ended 31 December 2013, and adding the estimated revenues, described below. The adjusted and estimated revenues are not audited. They should not be considered as an alternative to, or more meaningful than, and should be read in conjunction with, reported revenues. The estimates are intended to provide information about how the Derivatives Clearing Agreement with LCH.Clearnet SA described on slide 50 might have affected the Company’s revenues had it become effective at an earlier time. The estimates do not necessarily reflect the Company’s revenues that would actually have resulted had the Derivatives Clearing Agreement with LCH.Clearnet SA described on slide 50 become effective as of January 1, 2013, nor should they be taken as necessarily indicative of the Company’s future revenues. Adjustment Related party revenue: 95mm of revenues providing from existing Service Level Agreements between ICE that pertain to activities that will not remain in the perimeter of the Company following the Liffe carve-out were deducted from Other revenues Estimation Estimated derivatives clearing revenue: The Company has estimated that had the Derivatives Clearing Agreement with LCH.Clearnet SA described on slide 50 been in effect from January 1, 2013, the Company would have generated 46mm in additional revenues and 27mm in additional expenses. The estimated derivatives clearing expenses are not audited. These estimations have been calculated on the basis of historical volumes and terms agreed with LCH.Clearnet SA 92 |
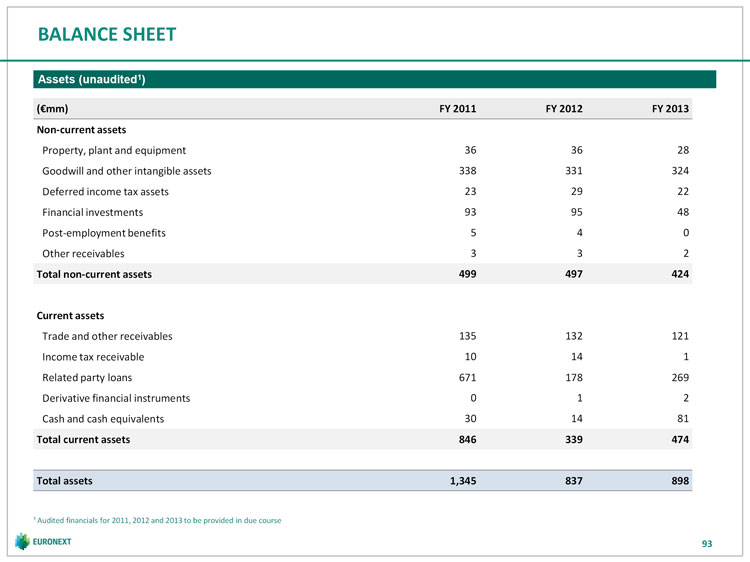 | BALANCE SHEET Assets (unaudited1) ( mm) FY 2011 FY 2012 FY 2013 Non-current assets Property, plant and equipment 36 36 28 Goodwill and other intangible assets 338 331 324 Deferred income tax assets 23 29 22 Financial investments 93 95 48 Post-employment benefits 5 4 0 Other receivables 3 3 2 Total non-current assets 499 497 424 Current assets Trade and other receivables 135 132 121 Income tax receivable 10 14 1 Related party loans 671 178 269 Derivative financial instruments 0 1 2 Cash and cash equivalents 30 14 81 Total current assets 846 339 474 Total assets 1,345 837 898 ¹ Audited financials for 2011, 2012 and 2013 to be provided in due course 93 |
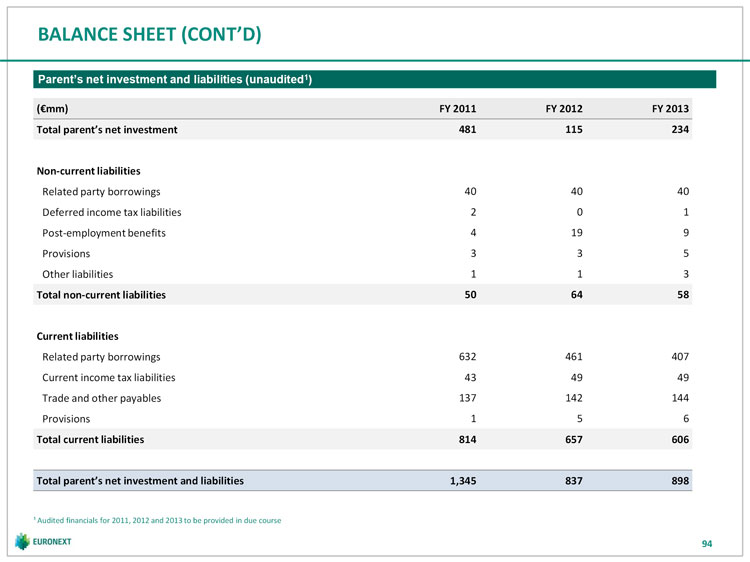 | BALANCE SHEET (CONT’D) Parentfs net investment and liabilities (unaudited1) ( mm) FY 2011 FY 2012 FY 2013 Total parent’s net investment 481 115 234 Non-current liabilities Related party borrowings 40 40 40 Deferred income tax liabilities 2 0 1 Post-employment benefits 4 19 9 Provisions 3 3 5 Other liabilities 1 1 3 Total non-current liabilities 50 64 58 Current liabilities Related party borrowings 632 461 407 Current income tax liabilities 43 49 49 Trade and other payables 137 142 144 Provisions 1 5 6 Total current liabilities 814 657 606 Total parent’s net investment and liabilities 1,345 837 898 ¹ Audited financials for 2011, 2012 and 2013 to be provided in due course 94 |
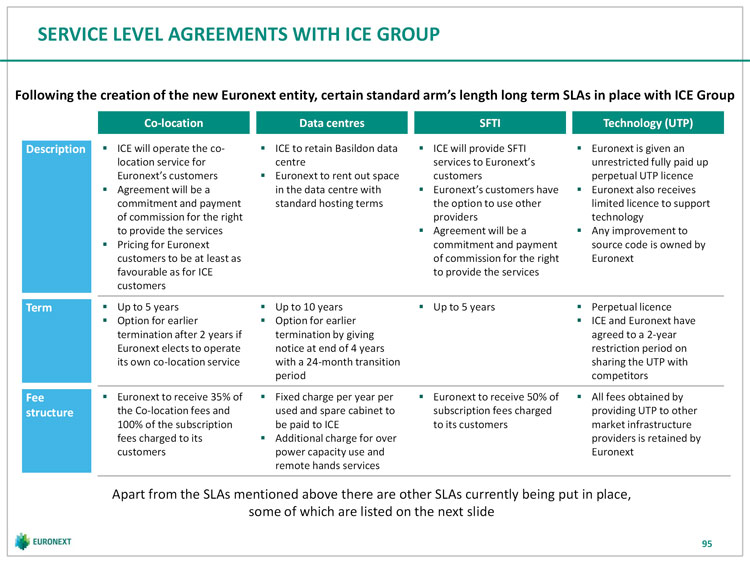 | SERVICE LEVEL AGREEMENTS WITH ICE GROUP Following the creation of the new Euronext entity, certain standard arm’s length long term SLAs in place with ICE Group Co-location Data centres SFTI Technology (UTP) Description ICE will operate the co- ICE to retain Basildon data ICE will provide SFTI Euronext is given an location service for centre services to Euronext’s unrestricted fully paid up Euronext’s customers Euronext to rent out space customers perpetual UTP licence Agreement will be a in the data centre with Euronext’s customers have Euronext also receives commitment and payment standard hosting terms the option to use other limited licence to support of commission for the right providers technology to provide the services Agreement will be a Any improvement to Pricing for Euronext commitment and payment source code is owned by customers to be at least as of commission for the right Euronext favourable as for ICE to provide the services customers Term Up to 5 years Up to 10 years Up to 5 years Perpetual licence Option for earlier Option for earlier ICE and Euronext have termination after 2 years if termination by giving agreed to a 2-year Euronext elects to operate notice at end of 4 years restriction period on its own co-location service with a 24-month transition sharing the UTP with period competitors Fee Euronext to receive 35% of Fixed charge per year per Euronext to receive 50% of All fees obtained by structure the Co-location fees and used and spare cabinet to subscription fees charged providing UTP to other 100% of the subscription be paid to ICE to its customers market infrastructure fees charged to its Additional charge for over providers is retained by customers power capacity use and Euronext remote hands services Apart from the SLAs mentioned above there are other SLAs currently being put in place, some of which are listed on the next slide 95 |
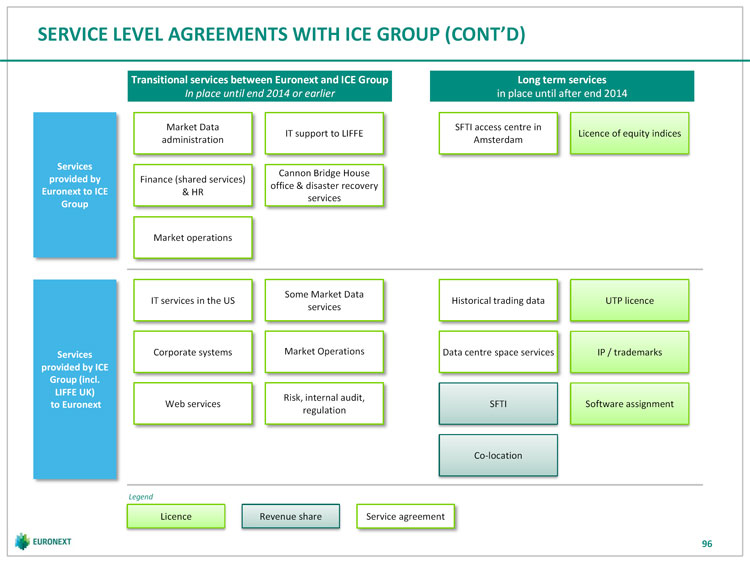 | SERVICE LEVEL AGREEMENTS WITH ICE GROUP (CONT’D) Transitional services between Euronext and ICE Group Long term services In place until end 2014 or earlier in place until after end 2014 Market Data SFTI access centre in IT support to LIFFE Licence of equity indices administration Amsterdam Services Cannon Bridge House provided by Finance (shared services) office & disaster recovery Euronext to ICE & HR services Group Market operations Some Market Data IT services in the US Historical trading data UTP licence services Services Corporate systems Market Operations Data centre space services IP / trademarks provided by ICE Group (incl. LIFFE UK) Risk, internal audit, to Euronext Web services SFTI Software assignment regulation Co-location Legend Licence Revenue share Service agreement 96 |
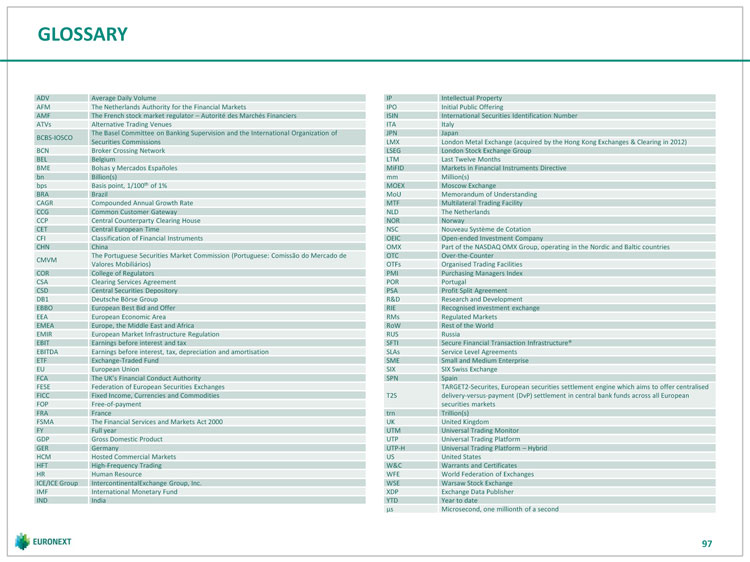 | GLOSSARY ADV Average Daily Volume IP Intellectual Property AFM The Netherlands Authority for the Financial Markets IPO Initial Public Offering AMF The French stock market regulator Autorité des Marchés Financiers ISIN International Securities Identification Number ATVs Alternative Trading Venues ITA Italy The Basel Committee on Banking Supervision and the International Organization of JPN Japan BCBS-IOSCO Securities Commissions LMX London Metal Exchange (acquired by the Hong Kong Exchanges & Clearing in 2012) BCN Broker Crossing Network LSEG London Stock Exchange Group BEL Belgium LTM Last Twelve Months BME Bolsas y Mercados Españoles MiFID Markets in Financial Instruments Directive bn Billion(s) mm Million(s) bps Basis point, 1/100th of 1% MOEX Moscow Exchange BRA Brazil MoU Memorandum of Understanding CAGR Compounded Annual Growth Rate MTF Multilateral Trading Facility CCG Common Customer Gateway NLD The Netherlands CCP Central Counterparty Clearing House NOR Norway CET Central European Time NSC Nouveau Système de Cotation CFI Classification of Financial Instruments OEIC Open-ended Investment Company CHN China OMX Part of the NASDAQ OMX Group, operating in the Nordic and Baltic countries The Portuguese Securities Market Commission (Portuguese: Comissão do Mercado de OTC Over-the-Counter CMVM Valores Mobiliários) OTFs Organised Trading Facilities COR College of Regulators PMI Purchasing Managers Index CSA Clearing Services Agreement POR Portugal CSD Central Securities Depository PSA Profit Split Agreement DB1 Deutsche Börse Group R&D Research and Development EBBO European Best Bid and Offer RIE Recognised investment exchange EEA European Economic Area RMs Regulated Markets EMEA Europe, the Middle East and Africa RoW Rest of the World EMIR European Market Infrastructure Regulation RUS Russia EBIT Earnings before interest and tax SFTI Secure Financial Transaction Infrastructure® EBITDA Earnings before interest, tax, depreciation and amortisation SLAs Service Level Agreements ETF Exchange-Traded Fund SME Small and Medium Enterprise EU European Union SIX SIX Swiss Exchange FCA The UK’s Financial Conduct Authority SPN Spain FESE Federation of European Securities Exchanges TARGET2-Securites, European securities settlement engine which aims to offer centralised FICC Fixed Income, Currencies and Commodities T2S delivery-versus-payment (DvP) settlement in central bank funds across all European FOP Free-of-payment securities markets FRA France trn Trillion(s) FSMA The Financial Services and Markets Act 2000 UK United Kingdom FY Full year UTM Universal Trading Monitor GDP Gross Domestic Product UTP Universal Trading Platform GER Germany UTP-H Universal Trading Platform Hybrid HCM Hosted Commercial Markets US United States HFT High-Frequency Trading W&C Warrants and Certificates HR Human Resource WFE World Federation of Exchanges ICE/ICE Group IntercontinentalExchange Group, Inc. WSE Warsaw Stock Exchange IMF International Monetary Fund XDP Exchange Data Publisher IND India YTD Year to date µs Microsecond, one millionth of a second 97 |