UNITED STATES SECURITIES AND EXCHANGE COMMISSION
Washington, D.C. 20549
FORM 10-K
| | | | | |
| |
| (Mark One) | |
| ☑ | ANNUAL REPORT PURSUANT TO SECTION 13 OR 15(d) OF THE SECURITIES EXCHANGE ACT OF 1934 |
For the fiscal year ended December 31, 2024
| | | | | |
| Or |
| ☐ | TRANSITION REPORT PURSUANT TO SECTION 13 OR 15(d)
OF THE SECURITIES EXCHANGE ACT OF 1934 |
| For the transition period from to |
Commission File Number 001-36198
INTERCONTINENTAL EXCHANGE, INC.
(Exact name of registrant as specified in its charter)
| | | | | |
| Delaware | 46-2286804 |
(State or other jurisdiction of
incorporation or organization) | (IRS Employer
Identification Number) |
| | | | | |
5660 New Northside Drive, Atlanta, Georgia | 30328 |
| (Address of principal executive offices) | (Zip Code) |
(770) 857-4700
Registrant’s telephone number, including area code
Securities registered pursuant to Section 12(b) of the Act:
| | | | | | | | |
| Title of Each Class | Trading Symbol(s) | Name of Each Exchange on Which Registered |
| Common Stock, $0.01 par value per share | ICE | New York Stock Exchange |
Securities registered pursuant to Section 12(g) of the Act: None
Indicate by check mark if the registrant is a well-known seasoned issuer, as defined in Rule 405 of the Securities Act. Yes ☑ No ☐
Indicate by check mark if the registrant is not required to file reports pursuant to Section 13 or Section 15(d) of the Act. Yes ☐ No ☑
Indicate by check mark whether the registrant: (1) has filed all reports required to be filed by Section 13 or 15(d) of the Securities Exchange Act of 1934 during the preceding 12 months (or for such shorter period that the registrant was required to file such reports); and (2) has been subject to such filing requirements for the past 90 days. Yes ☑ No ☐
Indicate by check mark whether the registrant has submitted electronically every Interactive Data File required to be submitted pursuant to Rule 405 of Regulation S-T (§232.405 of this chapter) during the preceding 12 months (or for such shorter period that the registrant was required to submit such files). Yes ☑ No ☐
Indicate by check mark whether the registrant is a large accelerated filer, an accelerated filer, a non-accelerated filer, a smaller reporting company, or an emerging growth company. See the definitions of “large accelerated filer,” “accelerated filer,” “smaller reporting company” and "emerging growth company" in Rule 12b-2 of the Exchange Act.
| | | | | | | | | | | | | | |
| Large accelerated filer | ☑ | | Accelerated filer | ☐ |
| Non-accelerated filer | ☐ | | Smaller reporting company | ☐ |
| | | Emerging growth company | ☐ |
If an emerging growth company, indicate by check mark if the registrant has elected not to use the extended transition period for complying with any new or revised financial accounting standards provided pursuant to Section 13(a) of the Exchange Act. ☐
Indicate by check mark whether the registrant has filed a report on and attestation to its management’s assessment of the effectiveness of its internal control over financial reporting under Section 404(b) of the Sarbanes-Oxley Act (15 U.S.C. 7262(b)) by the registered public accounting firm that prepared or issued its audit report. ☑
If securities are registered pursuant to Section 12(b) of the Act, indicate by check mark whether the financial statements of the registrant included in the filing reflect the correction of an error to previously issued financial statements. ☐
Indicate by check mark whether any of those error corrections are restatements that required a recovery analysis of incentive-based compensation received by any of the registrant's executive officers during the relevant recovery period pursuant to §240.10D-1(b). ☐
Indicate by check mark whether the registrant is a shell company (as defined in Rule 12b-2 of the Act). Yes ☐ No ☑
The aggregate market value of the registrant’s voting and non-voting common equity held by non-affiliates computed by reference to the price at which the common equity was last sold as of the last business day of the registrant’s most recently completed second fiscal quarter was $78.0 billion.
As of February 3, 2025, the number of shares of the registrant’s Common Stock outstanding was 574,564,858 shares.
DOCUMENTS INCORPORATED BY REFERENCE
Certain information contained in the registrant’s Proxy Statement for the 2025 Annual Meeting of Stockholders is incorporated herein by reference in Part III of this Annual Report on Form 10-K. The Proxy Statement will be filed with the Securities and Exchange Commission within 120 days after the end of the registrant’s fiscal year to which this report relates.
Intercontinental Exchange, Inc.
ANNUAL REPORT ON FORM 10-K
For the Fiscal Year Ended December 31, 2024
TABLE OF CONTENTS
| | | | | | | | |
| | |
Item Number | | Page Number |
| PART I | |
| 1. | | |
| 1(A). | | |
| 1(B). | | |
| 1(C). | | |
| 2. | | |
| 3. | | |
| 4. | | |
| | |
| PART II | |
| 5. | | |
| 6. | | |
| 7. | | |
| 7(A). | | |
| 8. | | |
| 9. | | |
| 9(A). | | |
| 9(B). | | |
| 9(C). | | |
| | |
| PART III | |
| 10. | | |
| 11. | | |
| 12. | | |
| 13. | | |
| 14. | | |
| | |
| PART IV | |
| 15. | | |
| 16. | | |
| |
| |
PART I
In this Annual Report on Form 10-K, or this Annual Report, and unless otherwise indicated, the terms “Intercontinental Exchange,” “ICE,” “we,” “us,” “our,” “our company” and “our business” refer to Intercontinental Exchange, Inc., together with its consolidated subsidiaries. All references to “options” or “options contracts” in the context of our futures products refer to options on futures contracts. Solely for convenience, references in this Annual Report to any trademarks, service marks and trade names owned by ICE are listed without the ®, ™ and © symbols, but we will assert, to the fullest extent under applicable law, our rights to these trademarks, service marks and trade names.
We also include references to third-party trademarks, trade names and service marks in this Annual Report. Except as otherwise expressly noted, our use or display of any such trademarks, trade names or service marks is not an endorsement or sponsorship and does not indicate any relationship between us and the parties that own such marks and names.
The following discussion should be read in conjunction with our consolidated financial statements and related notes included elsewhere in this Annual Report. Figures in tables may not recalculate or sum exactly due to rounding. Percentage changes are calculated based on unrounded numbers.
Forward-Looking Statements
This Annual Report, including the sections entitled “Business,” “Risk Factors,” “Legal Proceedings” and “Management’s Discussion and Analysis of Financial Condition and Results of Operations,” contains “forward-looking statements” as defined in the Private Securities Litigation Reform Act of 1995. Any statements contained herein that are not statements of historical fact may be forward-looking statements.
These forward-looking statements relate to future events or our future financial performance and are based on our present beliefs and assumptions, as well as the information currently available to us. They involve known and unknown risks, uncertainties and other factors that may cause our results, levels of activity, performance, cash flows, financial position or achievements to differ materially from those expressed or implied by these statements.
Forward-looking statements may be introduced by or contain terminology such as “may,” “will,” “should,” “could,” “would,” “targets,” “goal,” “expect,” “intend,” “plan,” “anticipate,” “believe,” “estimate,” “predict,” “potential,” “continue,” or the antonyms of these terms or other comparable terminology. Although we believe that the expectations reflected in the forward-looking statements are reasonable, we cannot guarantee future results, levels of activity, performance, cash flows, financial position or achievements. Accordingly, we caution you not to place undue reliance on any forward-looking statements we may make.
Factors that may affect our performance and the accuracy of any forward-looking statements include, but are not limited to, those listed below:
•conditions in global financial markets and domestic and international economic and social conditions, including inflation, risk of recession, political uncertainty and discord, geopolitical events or conflicts (including the conflicts in Ukraine and the Middle East), international trade policies and sanctions laws;
•global political conditions including the presidential election results in the United States, or U.S., and general election results in many jurisdictions in the U.S. and United Kingdom, or U.K.;
•the global impact of the introduction of, or any changes to laws, regulations, rules or government policies with respect to, among other things, financial markets and climate change, as well as increased regulatory scrutiny or enforcement actions;
•volatility in commodity prices and equity prices, and price volatility of financial benchmarks and instruments such as interest rates, credit spreads, equity indices, foreign exchange rates, and mortgage industry trends;
•the impact of climate change and the impact of, and uncertainty related to, the transition to renewable energy, including regulatory and legislative changes;
•the business environment in which we operate and trends in our industries, including trading volumes, prevalence of clearing, demand for data services, mortgage lending and servicing activity, mortgage delinquencies, fees, changing regulations, competition and consolidation;
•our ability to minimize the risks associated with operating clearing houses in multiple jurisdictions;
•our exchanges’ and clearing houses' compliance with their respective regulatory and oversight responsibilities;
•the resilience of our electronic platforms and soundness of our business continuity and disaster recovery plans, including in the event of cyberattacks and cyberterrorism;
•our ability to realize the expected benefits of our acquisitions and our investments, including our acquisition of Black Knight, Inc., or Black Knight;
•our ability to execute our growth strategy, identify and effectively pursue, implement and integrate acquisitions, including that of Black Knight, and strategic alliances and realize the synergies and benefits of such transactions within the expected time frame;
•the impacts of computer and communications systems failures and delays, inclusive of the performance and reliability of our trading, clearing, data services and mortgage technologies and those of third-party service providers;
•our ability to keep pace with technological developments and client preferences, including with regard to our emerging technology initiatives and the use of artificial intelligence in certain of our existing products;
•our ability to ensure that the technology we utilize is not vulnerable to cyberattacks, hacking and other cybersecurity risks or other disruptive events or to minimize the impact of any such events;
•our ability to keep information and data relating to the customers of the users of the software and services provided by our ICE Mortgage Technology business confidential;
•the impacts of a public health emergency or pandemic on our business, results of operations and financial condition as well as the broader business environment;
•our ability to identify trends and adjust our business to benefit from such trends, including trends in the U.S. mortgage industry such as inflation rates, interest rates, new home purchases, refinancing activity, servicing activity, delinquencies and home builder and buyer sentiment, among others;
•our ability to evolve our benchmarks and indices in a manner that maintains or enhances their reliability and relevance;
•the accuracy of our cost and other financial estimates and our belief that cash flows from operations will be sufficient to service our debt and to fund our operational and capital expenditure needs;
•our ability to incur additional debt and pay off our existing debt in a timely manner;
•our ability to maintain existing market participants and data and mortgage technology customers, and to attract new ones;
•our ability to offer additional products and services, leverage our risk management capabilities and enhance our technology in a timely and cost-effective fashion;
•our ability to attract, develop and retain key talent;
•our ability to protect our intellectual property rights and to operate our business without violating the intellectual property rights of others; and
•potential adverse results of threatened or pending litigation and regulatory actions and proceedings.
These risks and other factors include, among others, those set forth in Part 1, Item 1(A) under the caption “Risk Factors” and elsewhere in this Annual Report, as well as in other filings we make with the U.S. Securities and Exchange Commission, or SEC. Due to the uncertain nature of these factors, management cannot assess the impact of each factor on the business or the extent to which any factor, or combination of factors, may cause actual results to differ materially from those contained in any forward-looking statements.
Any forward-looking statement speaks only as of the date on which such statement is made, and we undertake no obligation to update any of these statements to reflect events or circumstances occurring after the date of this Annual Report. New factors may emerge and it is not possible to predict all factors that may affect our business and prospects.
ITEM 1. BUSINESS
Introduction
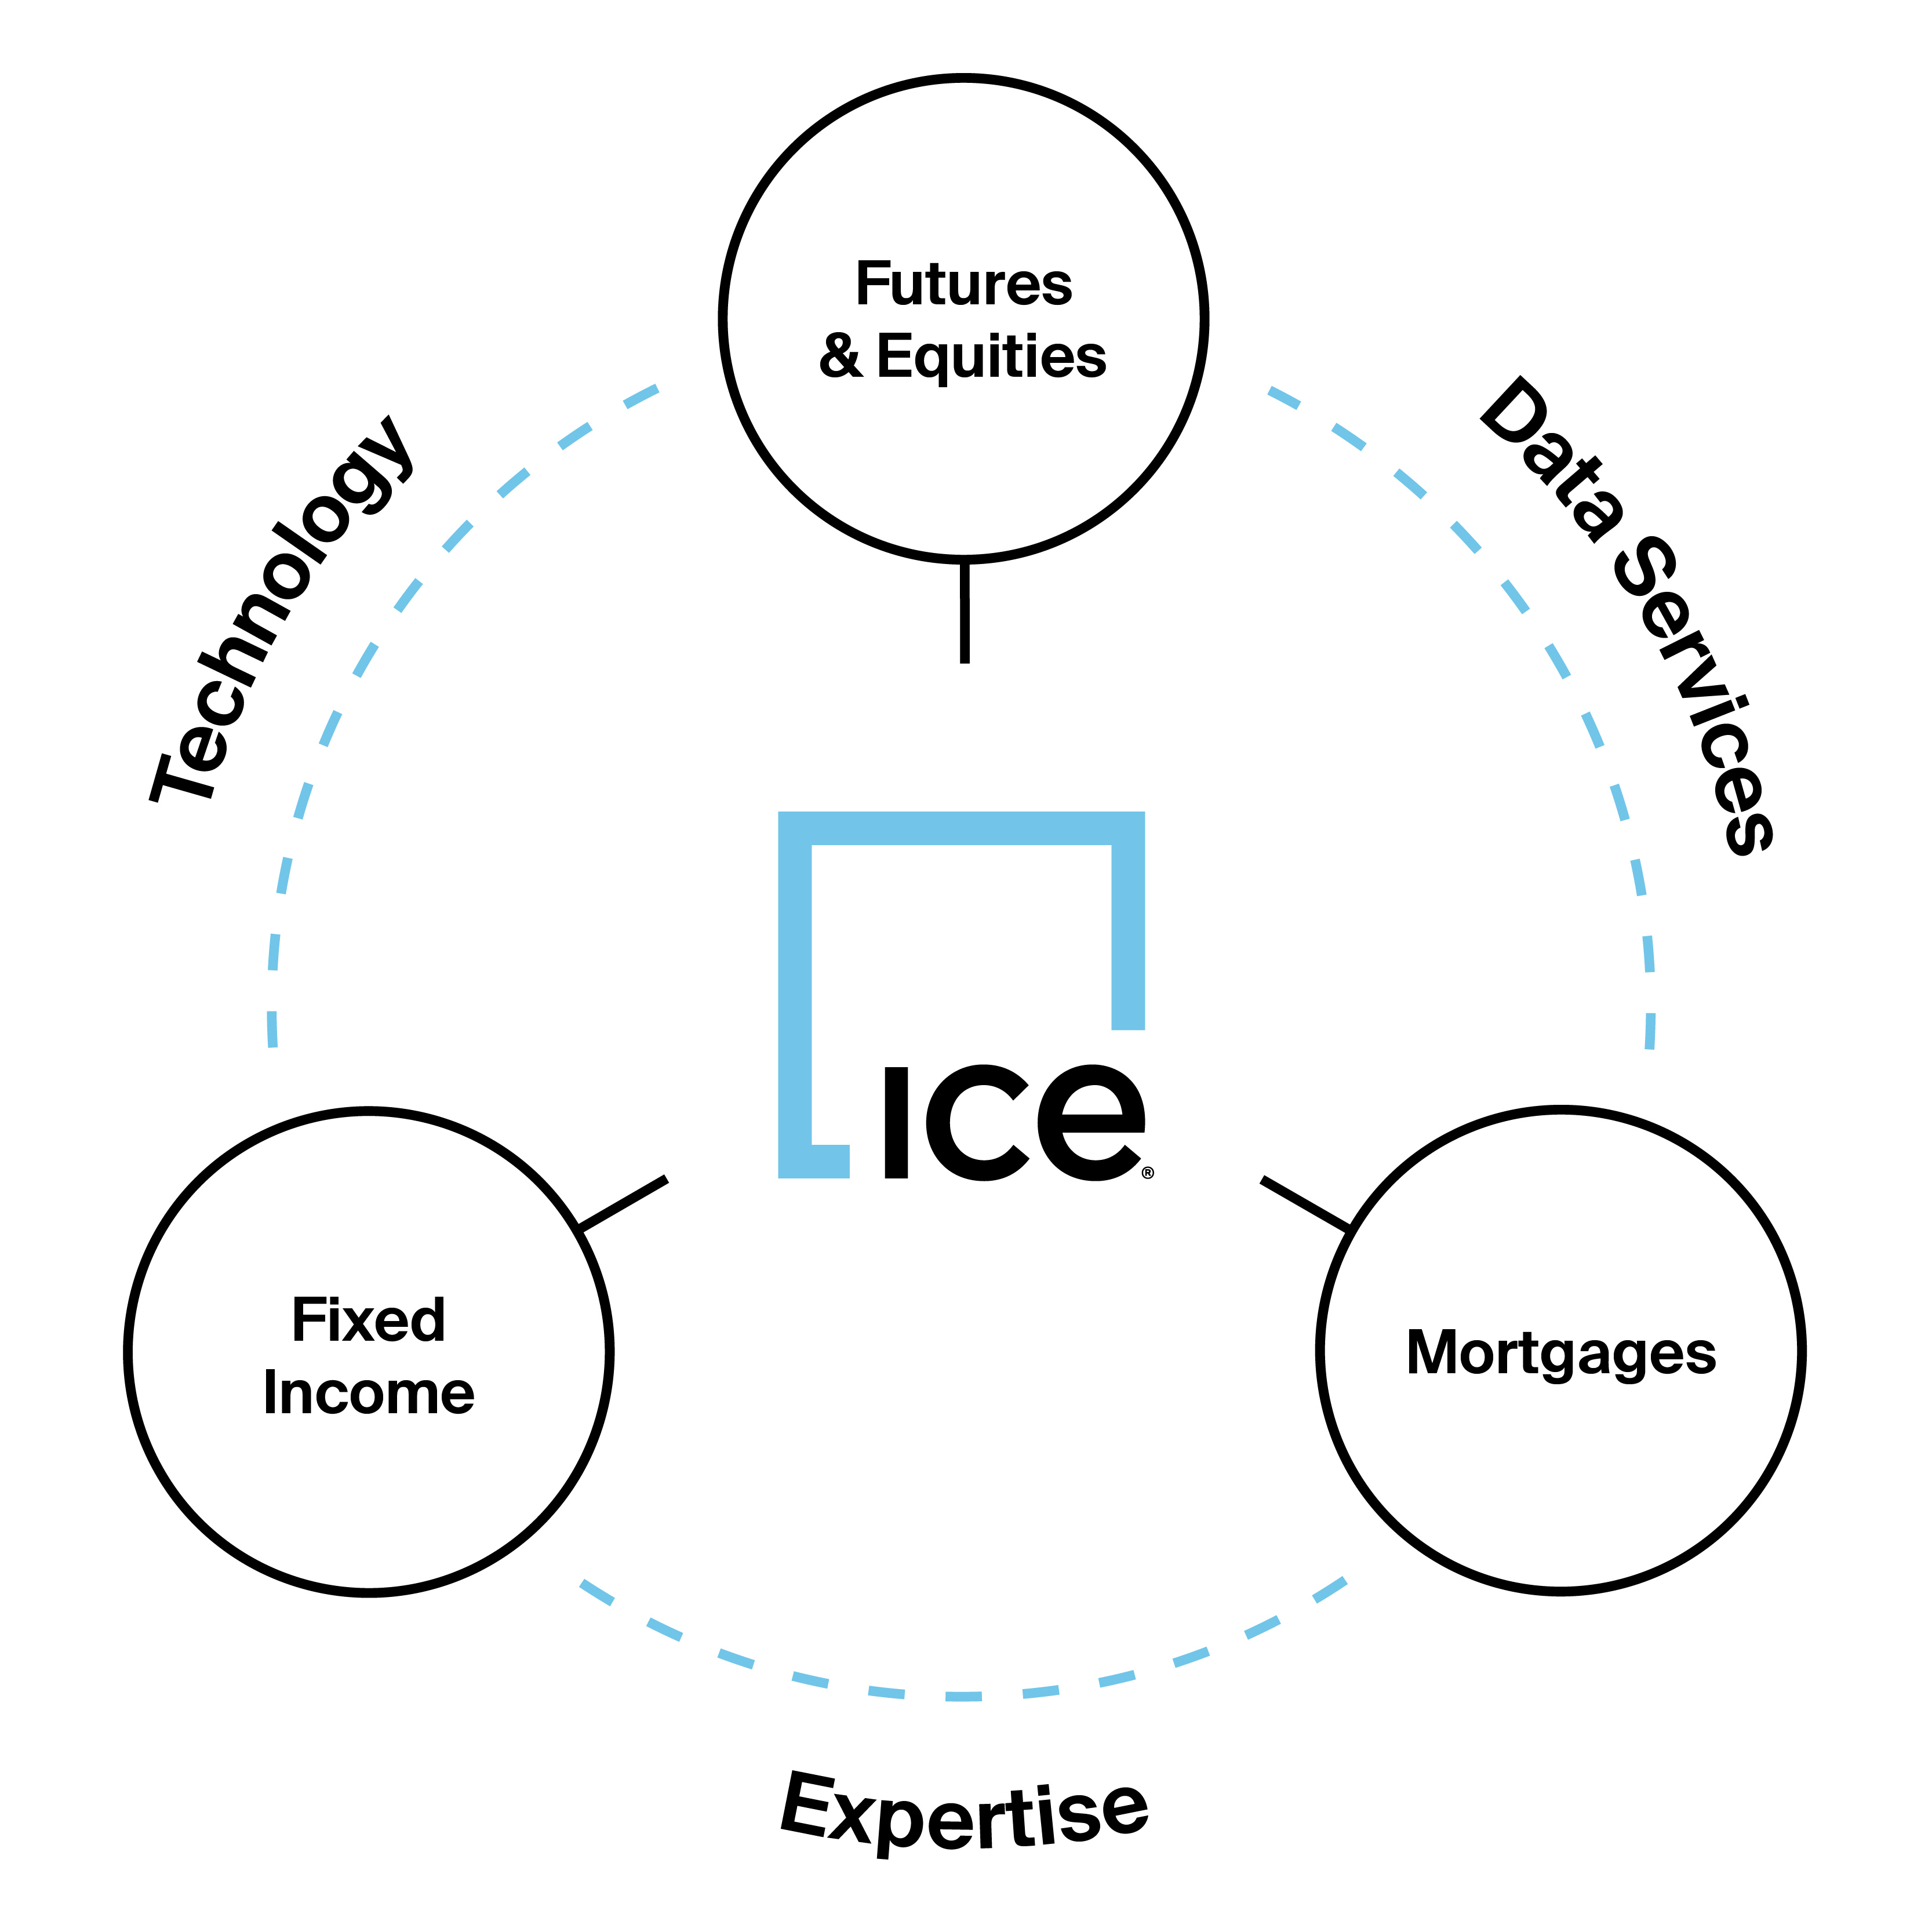
Intercontinental Exchange, Inc. is a leading global provider of technology and data to a broad range of customers including financial institutions, corporations and government entities. Our products, which span major asset classes including futures, equities, fixed income and U.S. residential mortgages, provide our customers with access to mission critical tools that are designed to increase asset class transparency and workflow efficiency. Although we report our results in three reportable business segments, we operate as one business, leveraging the collective expertise, particularly in data services and technology, that exists across our platforms to inform and enhance our operations. Our segments are as follows:
•Exchanges: We operate regulated marketplace technology for the listing, trading and clearing of a broad array of derivatives contracts and financial securities as well as data and connectivity services related to our exchanges and clearing houses.
•Fixed Income and Data Services: We provide fixed income pricing, reference data, indices, analytics and execution services as well as global credit default swaps, or CDS, clearing and multi-asset class data delivery technology.
•Mortgage Technology: We provide a technology platform that offers customers comprehensive, digital workflow tools that aim to address inefficiencies and mitigate risks that exist in the U.S. residential mortgage market life cycle, from application through closing, servicing and the secondary market.
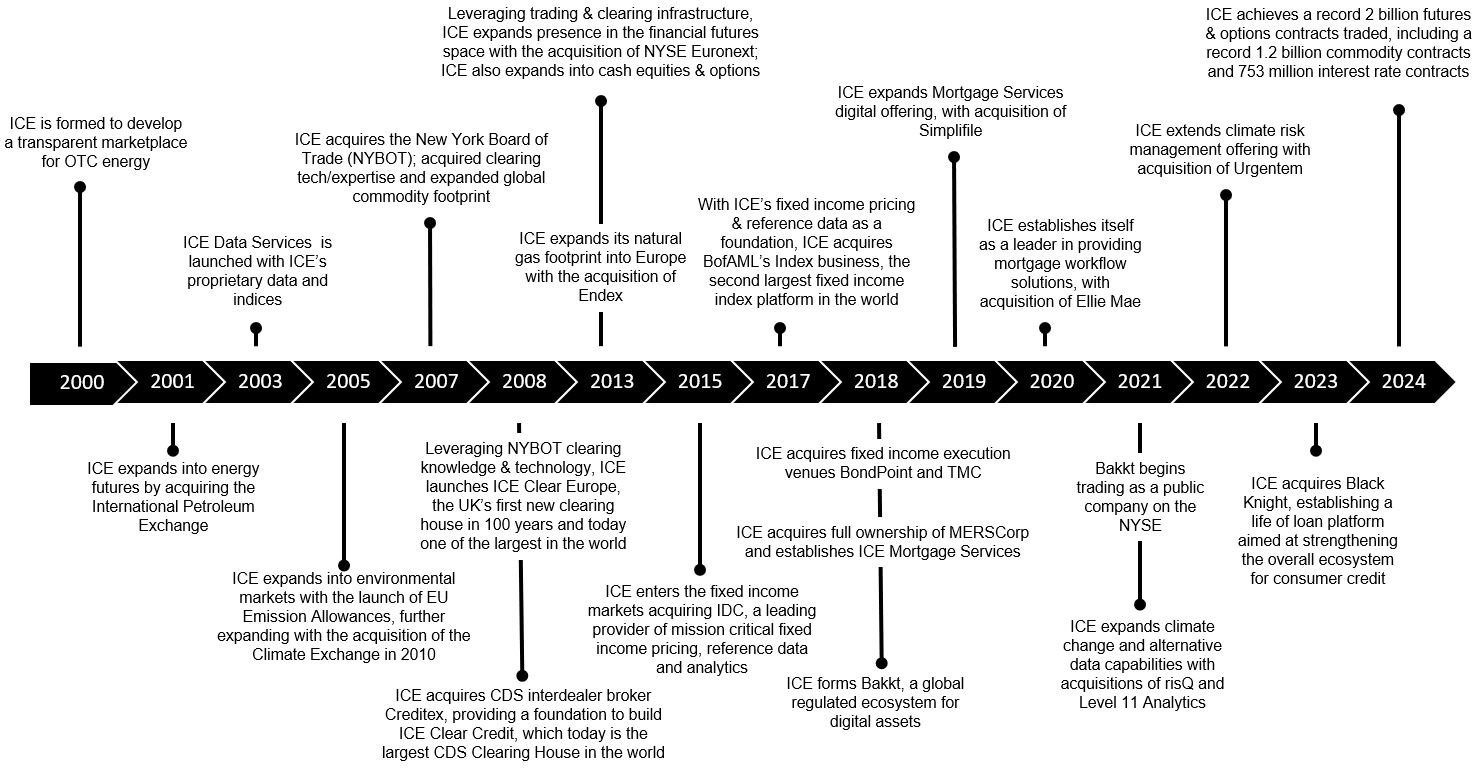
Our History
In 2000, ICE was founded with the idea of transforming energy markets by creating a network that removed barriers and provided greater transparency, efficiency and access. By staying close to our customers, we have expanded into new asset classes and services, while retaining a core mission of reducing friction in markets, bringing efficiency to our customers’ workflows and, ultimately, connecting our customers to opportunity.
Today, we are a Fortune 500 company, providing our customers with an array of technology solutions and data services that span a diverse set of asset classes.
Our Business Segments
Our business is conducted through three reportable business segments:
•Exchanges;
•Fixed Income and Data Services; and
•Mortgage Technology.
The majority of our identifiable assets are located in the U.S. and the U.K. For a summary of our revenues, net assets and net property and equipment by geographic region, see Note 19 to our consolidated financial statements included in this Annual Report.
Exchanges Segment
We operate regulated marketplaces for the listing, trading and clearing of a broad array of derivatives contracts and financial securities, such as commodities, interest rates, foreign exchange and equities as well as corporate and exchange-traded funds, or ETFs. We operate multiple trading venues, including 13 regulated exchanges and 6 clearing houses, which are strategically positioned in major market centers around the world, including the U.S., U.K., European Union, or EU, Canada, Asia Pacific and the Middle East.
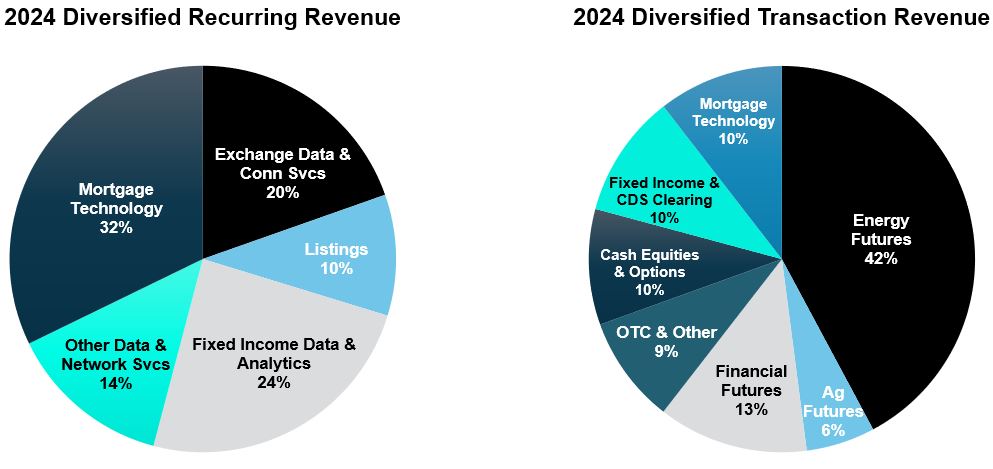
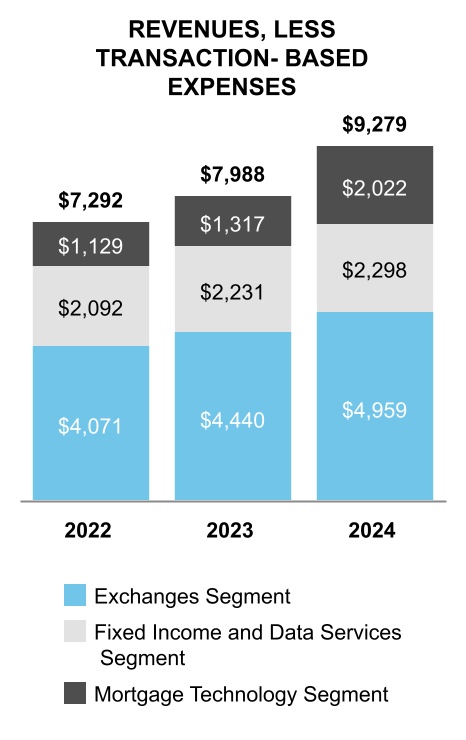
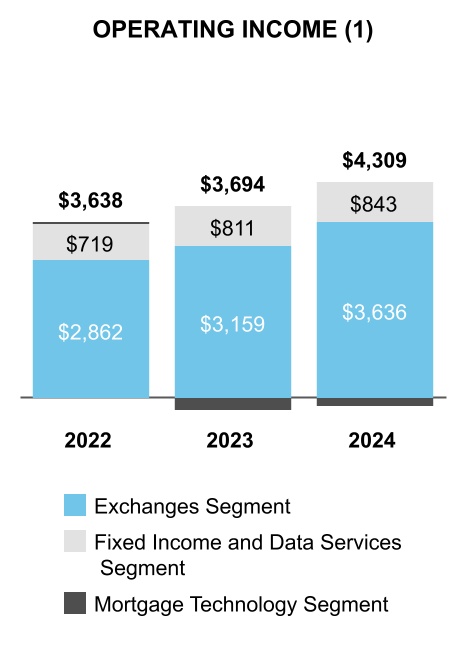
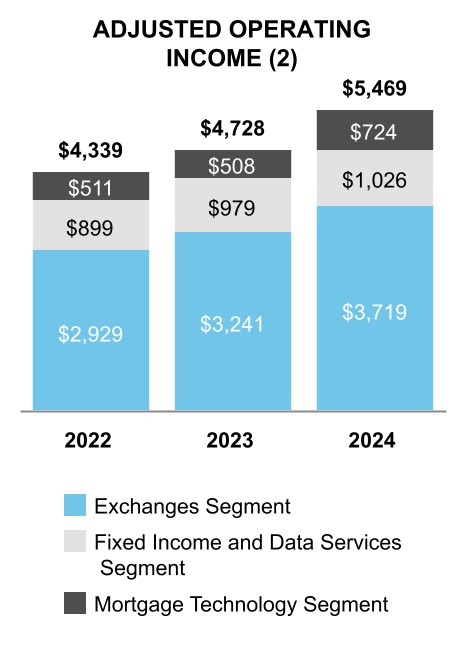
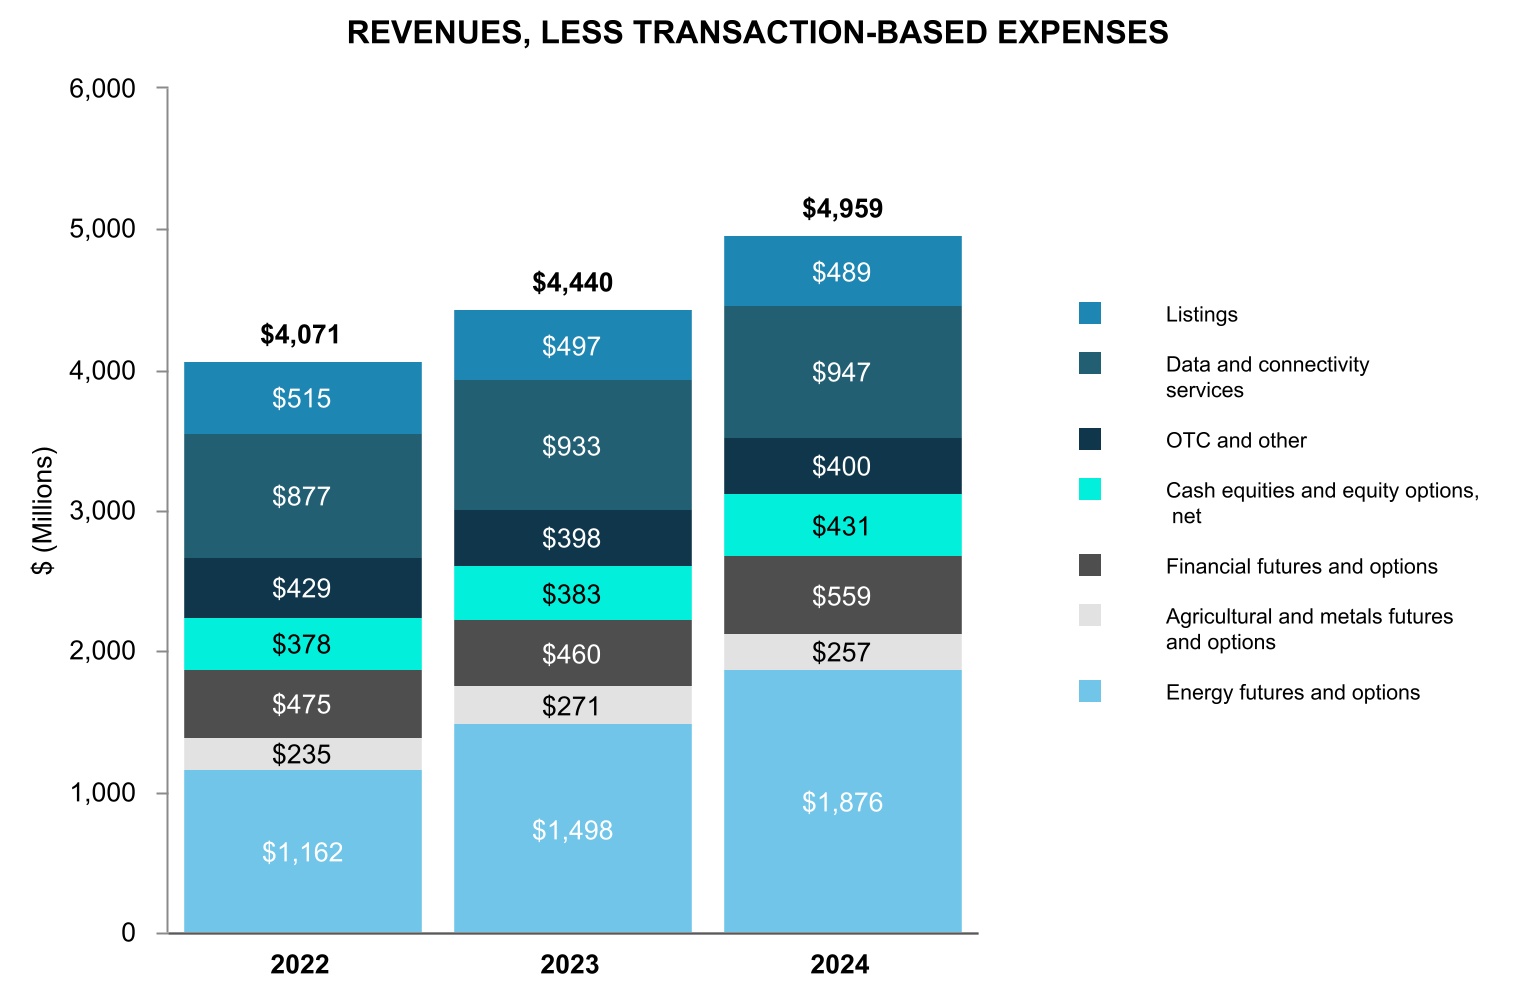
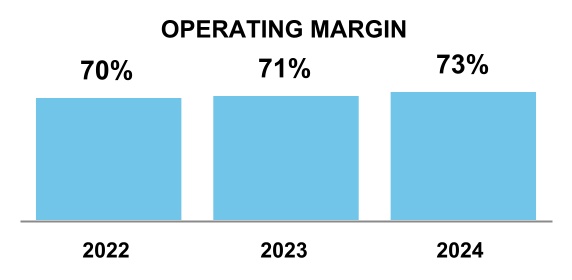
Our Exchanges segment includes trading and listings revenue from our global futures network and the New York Stock Exchange and other registered securities exchanges, or collectively, the NYSE, and various data and connectivity services that are directly related to those exchange platforms. Revenues reflect a mix of both diversified transaction revenues and recurring data and listings revenues. Our Exchanges segment generated revenues, less transaction-based expenses of $5.0 billion and accounted for 53% of our consolidated revenues, less transaction-based expenses in 2024. Key asset classes include:
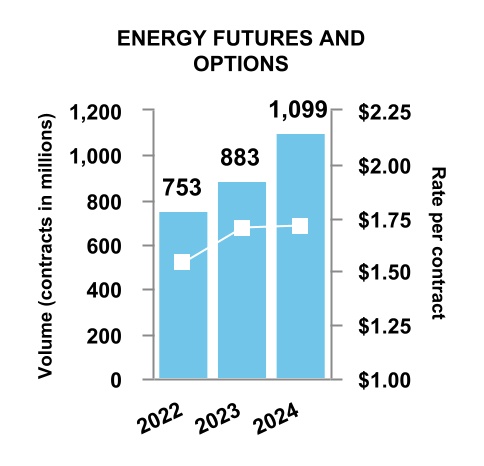
•Energy Futures and Options: We offer a range of futures and options products that are designed to enable our customers to manage their risk across global energy markets. Our flagship Brent crude oil contract serves as the cornerstone of a global oil network that today includes over 800 related crude and refined oil products including locational and refined spreads. In addition, as natural gas and Liquefied Natural Gas, or LNG, continue to globalize, we offer one of the broadest footprints of regional and global natural gas benchmarks, which spans North America, Europe and Asia. Our leading environmental and power markets round out our diverse global energy network. For over two decades, our environmental markets have provided customers risk management tools to meet carbon cap and trade program requirements and renewable fuel standards. Increasingly, market
participants are turning to our global environmental markets to help navigate and manage risk related to climate change, the energy transition and the move to net zero emissions.
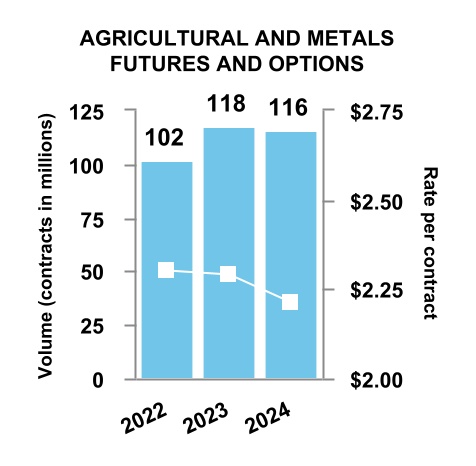
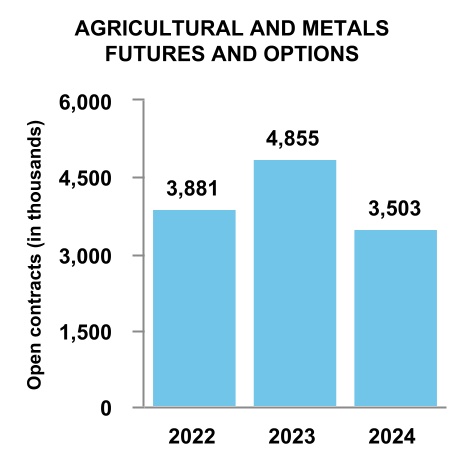
•Agricultural & Metals Futures and Options: We offer futures and options on the leading global soft commodity markets including coffee, cocoa, cotton and sugar. Our benchmark contracts offer one of the most globally relevant price markers for these agricultural markets and provide our customers with the tools to manage price and counterparty risk and facilitate price discovery.
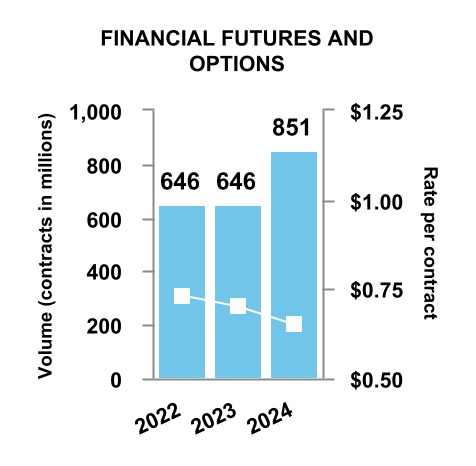
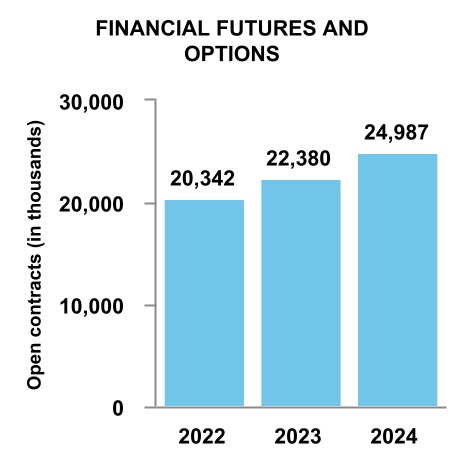
•Financial Futures and Options: We offer a diverse suite of equity futures and options contracts based on our own indices as well as those created by MSCI® and FTSE®. These contracts range from established global benchmarks, such as the MSCI® Emerging Market Index, to newer products, such as MSCI®’s suite of Environmental, Social and Governance, or ESG, indices and the NYSE FAANG+ Index. Our global interest rate complex spans geographies, currencies and tenors, providing participants around the world with tools to manage risk in a capital efficient manner. Key products include: Euribor, Gilts, Sterling Overnight Index Average, or SONIA, and Secured Overnight Financing Rates, or SOFR, among others.
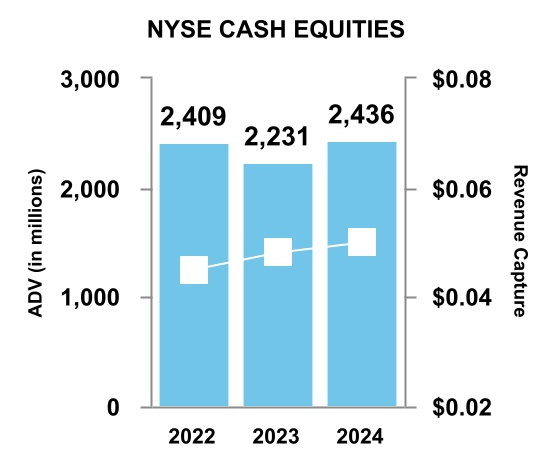
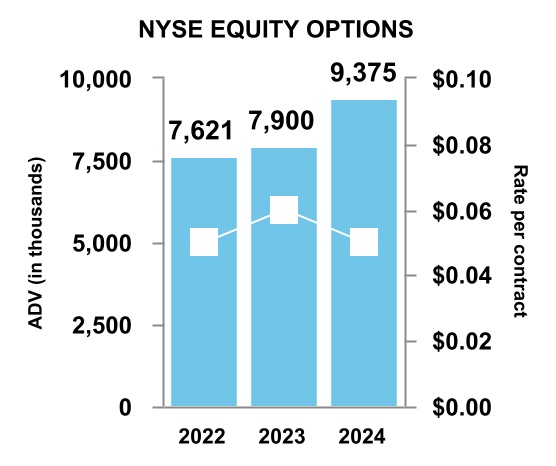
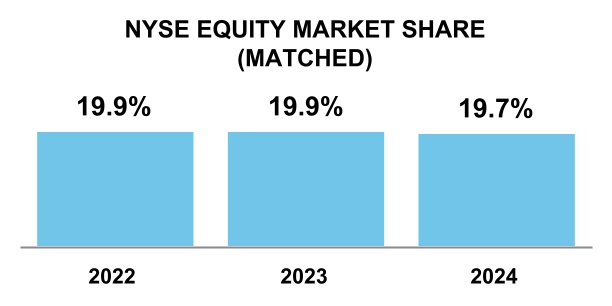
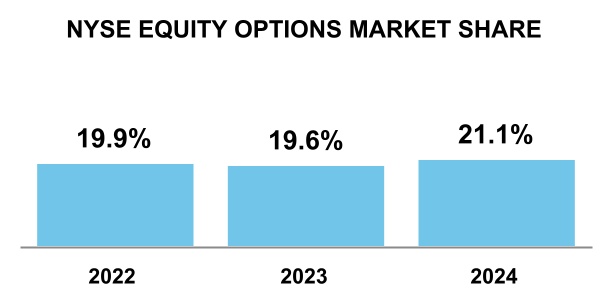
•Cash Equities and Equity Options: We offer securities trading services through our five registered securities exchanges, including the NYSE. Our securities exchanges are leading providers of transparent, efficient, and high quality markets for the securities issued by large and small companies, ETFs and equity options. These markets serve issuers, investors and other market participants across five cash equity and two options markets.
•OTC and Other: Our over-the-counter, or OTC, markets include bilateral energy markets that offer electronic trading of contracts based on physically-settled natural gas, power and refined oil contracts and other trade confirmation services. Our other revenues primarily include interest income on certain clearing margin deposits related to our futures business, regulatory penalties and fines, fees for use of our facilities, regulatory fees charged to member organizations of our U.S. securities exchanges, designated market maker service fees, exchange membership fees and agricultural grading and certification fees.
•Data and Connectivity Services: Our exchange data services include, among other offerings, proprietary real-time and historical pricing data, as well as order book and transaction information related to our global futures markets and the NYSE exchanges. In addition, we receive a share of revenue from the sale of consolidated U.S. equity and options market data by the National Market System Plans, or NMS Plans. Separately, we also provide connectivity services directly related to our futures, cash equity and options exchanges and clearing houses. Revenues from data and connectivity services fees are largely recurring in nature.
•Listings: The NYSE has been the venue of choice for innovators, visionaries and leaders for over 230 years. The NYSE offers a unique hybrid market model that combines leading technology with an accountable market maker to provide human judgment, a community of the world’s greatest companies and premium brand visibility. With over 70% of S&P 500 companies listed on the NYSE as of December 31, 2024, we are a leading listing venue across a range of sectors from technology and healthcare, to financials and energy. In addition to corporate listings, the NYSE is a global leader in ETF listings with 75%, or roughly $7.8 trillion, of ETF assets under management, or AUM, as of December 31, 2024. Revenues from listing fees are largely recurring in nature.
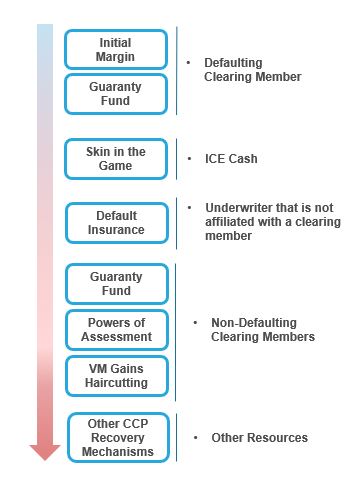
We operate 6 clearing houses, each of which acts as a central counterparty, or CCP, that, for its clearing members, becomes the buyer to every seller and the seller to every buyer. Through this CCP function, our clearing houses provide financial security for each transaction, for the duration of the position, by limiting counterparty credit risk. Our clearing houses are responsible for providing clearing services to each of our futures exchanges, and in some cases, to third-party execution venues.
Mechanisms have been created, called guaranty funds, to provide partial protection in the event of a clearing member default. Except for ICE NGX Canada Inc., or ICE NGX, each of the ICE Clearing Houses (as defined below) requires that each clearing member make deposits into a guaranty fund maintained by the relevant ICE Clearing House. In addition, we have contributed $370 million of our own cash to the guaranty funds which is one component of the table below, and such amounts are at risk and could be used in the event of a clearing member default. We also maintain default insurance as an additional layer of clearing member default protection, which is also reflected in the table below. The default insurance was renewed in September 2022 and has a three-year term for the following clearing houses in the following amounts: ICE Clear Europe - $100 million; ICE Clear U.S. - $25 million; and ICE Clear Credit - $75 million. In addition, the table below includes a guaranty fund of $215 million maintained by ICE NGX funded by the following: (1) a $200 million letter of credit issued by a major Canadian chartered bank, and backed by default insurance underwritten by Export Development Canada, a Crown corporation operated at arm’s length from the Canadian government, and (2) $15 million held as restricted cash to fund the first loss amount that ICE NGX is responsible for under the default insurance policy. Separately, ICE NGX has also set aside $30 million of its own capital that could be used for liquidity purposes in the event that a direct participant of the ICE NGX clearing house, or Contracting Party, defaults.
Our contributions to each clearing house as of December 31, 2024 are listed below and our clearing houses are referred to herein collectively as “the ICE Clearing Houses”:
| | | | | | | | | | | | | | | | | |
| Clearing House | Products Cleared | Location | Exchange where Executed | Reporting Segment | ICE's Contribution |
| ICE Clear Europe | Energy, agricultural, interest rates and equity index futures and options contracts | U.K. | ICE Futures Europe, ICE Futures U.S., ICE Endex and ICE Futures Abu Dhabi | Exchanges | $297 million |
| ICE Clear U.S. | Agricultural, metals, foreign exchange, or FX, interest rate, and equity index futures and options contracts | U.S. | ICE Futures U.S. | Exchanges | $100 million |
ICE Clear Credit(1) | OTC North American, European, Asian-Pacific and Emerging Market CDS instruments | U.S. | Creditex and third-party venues | Fixed Income and Data Services | $125 million |
| ICE Clear Netherlands | Derivatives on equities and equity indices traded on regulated markets | The Netherlands | ICE Endex | Exchanges | $2 million |
| ICE Clear Singapore | Energy, metals and financial futures products | Singapore | ICE Futures Singapore | Exchanges | $1 million |
| ICE NGX | Physical North American natural gas, environmental commodities and physical and financial electricity | Canada | ICE NGX | Exchanges | $245 million |
(1) Although ICE Clear Credit is included in the Fixed Income and Data Services reporting segment, it is included in the table as a part of our suite of global clearing houses.
Fixed Income and Data Services Segment
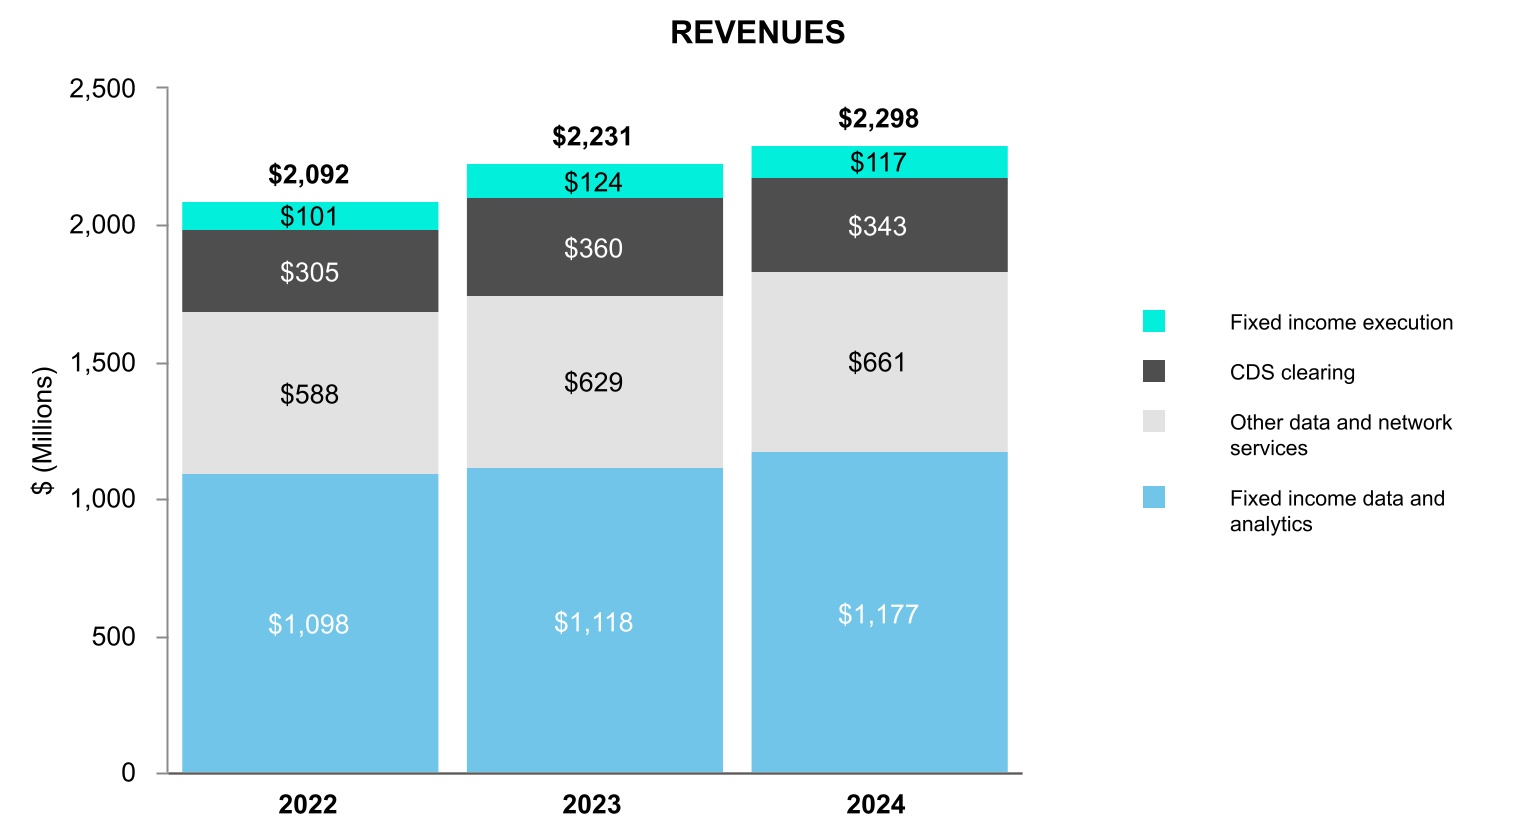
Our Fixed Income and Data Services segment includes our fixed income execution, or ICE Bonds, CDS clearing, our fixed income data and analytics offerings, and other multi-asset class data and network services. Our leading fixed income pricing and reference data offerings serve as the foundation for a broader fixed income network that provides our customers solutions that span the full workflow including pre- and post-trade analytics, a range of execution protocols and indices. In addition, our multi-asset class connectivity, feeds and desktop solutions, which comprise our Other Data and Network Services business, leverage a common sales force, which can enhance cross-selling opportunities across the Fixed Income and Data Services segment. The Fixed Income and Data Services segment generated revenues of $2.3 billion in 2024 and accounted for 25% of our consolidated revenues, less transaction-based expenses.
•Fixed Income Execution: Alongside our leading Fixed Income Data and Analytics offerings, ICE Bonds is focused on providing tools to improve efficiency in customers' workflows across fixed income markets. ICE Bonds provides customers with electronic markets that support multiple fixed income trading protocols including: click-to-trade, request for quotation, or RFQ, and auctions, including portfolio auctions/trading.
•CDS Clearing: ICE Clear Credit currently supports Single Names CDS on over 670 reference entities and over 180 Index CDS instruments. Revenues also include interest income on certain clearing margin deposits related to our CDS clearing business.
•Fixed Income Data and Analytics: We are a leading provider of end-of-day and continuous evaluated pricing services on nearly three million fixed income securities spanning approximately 150 countries and 80 currencies including sovereign, corporate and municipal bonds, mortgage and asset-backed securities as well as leveraged loans. Our reference data offering complements our evaluated pricing by providing our clients a broad range of descriptive information, covering millions of financial instruments that, when coupled with our pricing services, act as the foundation for our leading fixed income index complex, ICE Data Indices, LLC, or ICE Data Indices. We also offer a range of fixed income analytics and other workflow solutions including: best execution services, liquidity indicators, fixed income and derivatives portfolio analytics and our ETF Hub. Our fixed income customers use our data, indices and analytics to inform pre-trade decision making, support post-trade regulatory and compliance needs and improve operational efficiency. In addition, our newer offerings in this area include a variety of sustainable data and analytics offerings. Fixed Income Data and Analytics revenues are largely recurring in nature.
•Other Data and Network Services: We offer a multi-asset class connectivity solution called the ICE Global Network. The ICE Global Network offers highly secure, low latency connectivity solutions to reach over 150 trading venues and over 750 data sources. In addition, our consolidated feeds business provides data from a broad array of trading venues and news feeds through a common application programming interface, or API. Finally, our desktop solutions support commodity and energy traders, risk managers, financial advisors, wealth managers and retail traders, and include a robust instant messaging, or IM, system that protects the privacy of over 125,000 users, while also enabling greater collaboration. Other Data and Network Service revenues are largely recurring in nature.
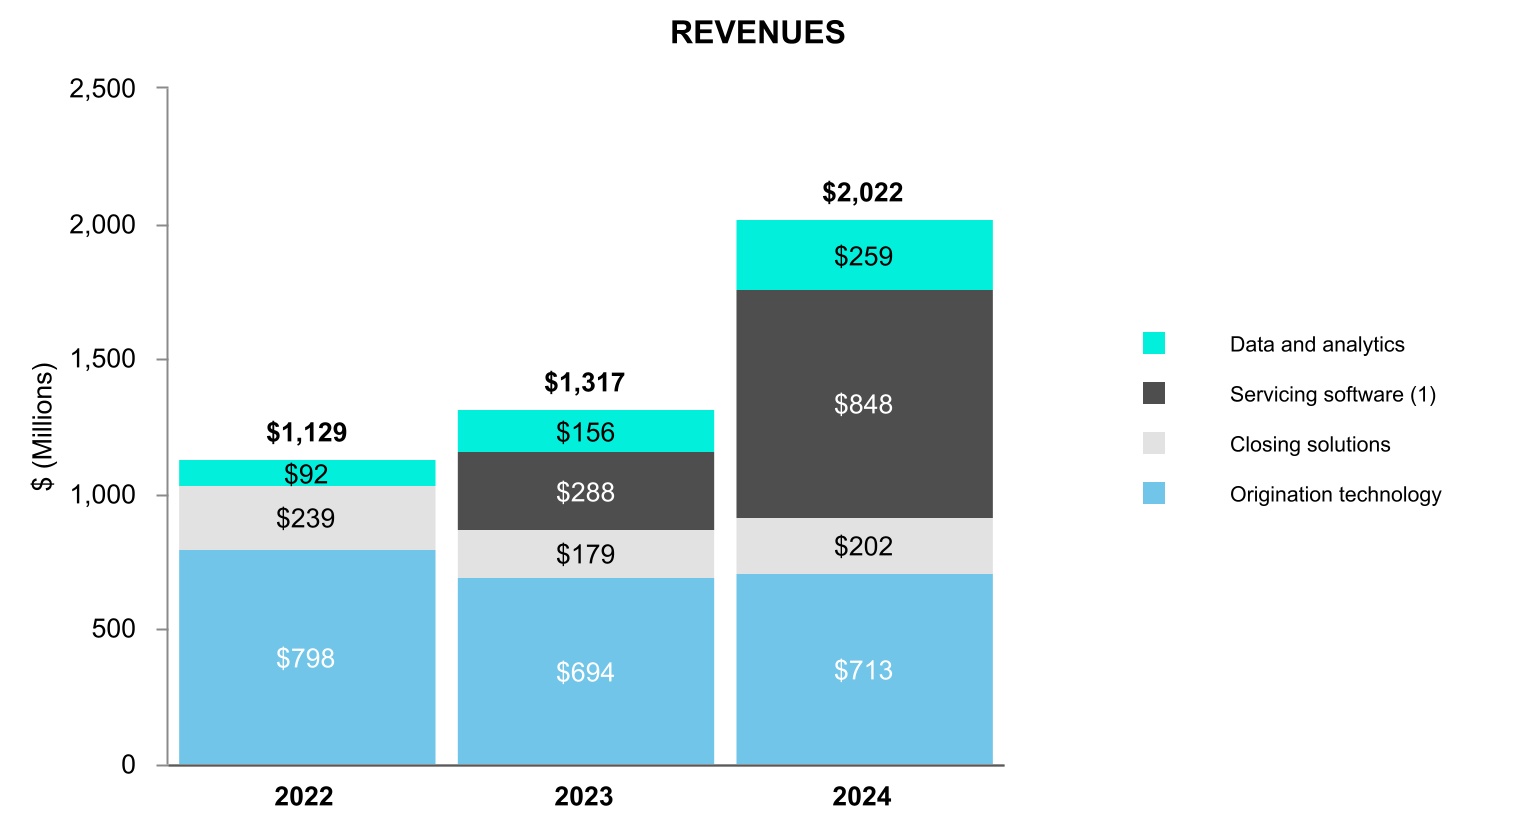
Mortgage Technology Segment
Over the last eight years, ICE has constructed a network aimed at identifying and solving the inefficiencies that exist in the U.S. residential mortgage market. From application through closing, servicing and the secondary market, our network is intended to connect the key stakeholders across the mortgage origination workflow and provide our customers with data services and technology that deliver greater transparency and enable significant customer efficiency gains. Our Mortgage Technology segment generated revenues of $2.0 billion in 2024 and accounted for 22% of our consolidated revenues, less transaction-based expenses.
•Origination Technology: Our origination technology acts as a system of record for the mortgage transaction, automating the gathering, reviewing, and verifying of mortgage-related information and enabling automated enforcement of rules and business practices designed to help ensure that each completed loan transaction is of high quality and adheres to secondary market standards. These revenues are based on recurring Software as a Service, or SaaS, subscription fees, with an additive transaction-based or success-based pricing fee as lenders exceed the number of loans closed that are included with their monthly base subscription, as well as professional services.
In addition, the ICE Mortgage Technology network provides originators connectivity to the mortgage supply chain and facilitates the secure exchange of information between our customers and a broad ecosystem of third-party service providers, as well as lenders and investors that are critical to consummating the millions of loan transactions that occur on our origination network each year. Revenue from the ICE Mortgage Technology network is largely transaction-based.
•Closing Solutions: Our closing solutions connect key participants, such as lenders, title and settlement agents and individual county recorders, to digitize the closing and recording process. Closing solutions also include revenues from our MERSCORP Holdings, Inc., or MERS, database, which provides a system of record for recording and tracking changes, servicing rights and beneficial ownership interests in loans secured by U.S. residential real estate. Revenues from closing solutions are largely transaction-based and are based on the volume of loan closings.
•Servicing Software: Our servicing offerings include integrated mortgage servicing solutions, which help automate all areas of the servicing process, from loan boarding to final payment or default, to help lower costs, reduce risk and improve financial performance.
Our servicing solutions support first lien mortgages, home equity loans and lines of credit on a single platform to manage all servicing processes, including loan setup and maintenance, escrow administration, investor reporting, and regulatory requirements. We also provide solutions that provide consumers with access to customized, timely information about their mortgages and allow our clients’ customer service representatives to access the same customer information, which is key to increasing borrower retention. Another servicing solution provides clients, third-party providers and their developers access to our growing catalog of APIs across the mortgage life cycle. Revenues related to our servicing software products are largely recurring in nature.
Our default servicing solutions help simplify the complex process for loans that move into default, while supporting servicers with their compliance requirements and to facilitate more efficient loss mitigation processes. We also offer advanced technology to support the bankruptcy and foreclosure process, and more efficiently manage claims related to properties in foreclosure, as well as tools to support loss analysis, to help servicers make the right decisions at the right time. Revenues from default servicing solutions are largely transaction-based and are based on the number of foreclosures.
•Data and Analytics: Our data and analytics offerings include those related to ICE Mortgage Technology’s Data & Document Automation, or DDA, Mortgage Analyzer solutions, or Analyzer, which offers customers greater efficiency by streamlining data collection and validation through our automated document recognition and data extraction capabilities. Analyzer revenues can be both recurring and transaction-based in nature. In addition, our data offerings include near real-time industry and peer benchmarking tools, which provide originators a granular view into the real-time trends in the U.S. residential mortgage market, as well as credit and prepayment models,
custom and proprietary analytics, valuation, and MLS solutions. We also provide de-identified mortgage origination data for lenders and industry participants to access industry data and origination information. The data and insights from these solutions inform, support and enhance our other solutions to help lenders and servicers make more informed decisions, improve performance, identify and predict risk and generate more qualified leads. Revenues related to our data products are largely subscription-based and recurring in nature.
Our data and analytics offerings include property ownership data, lien data, servicing data, automated valuation models and collateral risk scores, among others, provided to clients in the mortgage, real estate and capital markets verticals.
Product and Services Development
We leverage our customer relationships, global distribution, technology infrastructure and software development capabilities to diversify our products and services. We are continually developing, evaluating and testing new products to better serve our client base. The majority of our product development relates to evaluating new contracts, new data sets, new analytic offerings or new mortgage technologies. New contracts often must be reviewed and approved by relevant regulators. We expect to continue to invest in improving our data distribution and software services to meet the needs of our customers and improve their trading and connectivity experience by reducing latency, improving security and providing the most relevant information and data.
While we primarily develop our products and services internally, we also periodically evaluate and enter into strategic partnerships and licensing arrangements to develop new products and services. We intend to continue to invest to expand our exchanges, fixed income and data services, and mortgage technology offerings to serve the evolving needs of our global customer base.
Technology
Technology is a key component of our business strategy and competitive position and we regard effective execution of our technology initiatives as crucial to our sustainable business operations, market competitiveness, compliance and risk management and overall success. Our technology solutions support our customers' workflows: trading and clearing technology, multi-asset class analytics, risk assessment tools, robust data offerings, mortgage technology, instant messaging capabilities and flexible connectivity and delivery solutions. Where feasible, we design and build our own systems and write our own software programs as we believe that having control over our technology allows us to be more responsive to our customers’ needs, better support the dynamic nature of our business, provide the highest quality technology and deliver relevant, timely and actionable data to the markets and customers we serve.
•Trading Platforms and Technology: The ICE trading platform supports trading in our cleared futures and options markets as well as our bilateral OTC markets. We also offer voice brokers a facility for submitting block trades for products that are eligible for clearing. Speed, reliability, resilience, capacity and security are critical performance criteria for electronic trading platforms. Connectivity to our trading platform for our markets is available through our web-based front-end applications, as well as independent software vendors, or ISVs, and APIs.
The NYSE electronic trading platform features an open system architecture that allows users to access our system via front-end trading applications developed by ISVs. We developed core technology and architecture known as NYSE Pillar and have migrated all our Cash Equity Securities markets, Security Information Processor, or SIP, and Options Price Reporting Authority, or OPRA, NYSE Amex Options and Arca Options platforms to this architecture. This integrated platform was designed to improve performance and reduce the complexity of operating multiple trading systems for our customers, while enhancing consistency, performance and resiliency.
•Clearing Technology: A broad range of clearing and risk management services are offered through the integrated technology infrastructure that serves our clearing houses. ICE clearing technology is an integrated service-oriented platform that enables post-trade management, position management, management of the clearing house risk waterfall, contract settlement and treasury management functions. The primary focus of our derivatives clearing houses is the risk management of clearing members throughout all facets of the position management and settlement lifecycles. Our extensive technology and rules-based risk systems provide analytical tools that allow us to determine margin, evaluate credit risk and monitor the trading activities and overall risk of clearing members.
•Data Services Technology: ICE Data Services technology uses integrated platforms to capture, store and process information, perform analytics and maintain connectivity solutions using a single configurable data capture mechanism and flexible delivery capability. Together, the platforms are intended to enable real-time processing and delivery of information, accelerate new product development and improve production reliability.
Our data and analytics are delivered via real-time messaging, files, web services and other on-demand facilities and state-of-the-art front-ends. In addition, the technology underpinning our ICE Global Network supports scalable bandwidth and a wide variety of connectivity options including fiber, wireless, colocation and hosting.
•Mortgage Technology: The ICE Mortgage Technology platform provides software and hosting solutions that facilitate and automate many of the mission-critical business processes across the homeownership lifecycle. These solutions primarily consist of mortgage loan origination and servicing, processing and workflow management software applications, coupled with APIs and related data products. The platform is developed using industry-leading software technologies and third-party services, including hosting with a combination of public cloud and private data centers. The platform is integrated with multiple partner services necessary for loan origination and servicing, such as credit reporting and other services that lenders and servicers leverage through our network, which is offered through the platform. The platform includes industry leading information security infrastructure to protect the confidentiality and integrity of our customers' data.
Operations
We operate regionally diverse primary and backup data centers and maintain comprehensive business continuity and disaster recovery plans and facilities. These are designed to enable nearly continuous availability of our markets and other services in the event of a business disruption or disaster. We maintain incident and crisis management plans that address responses to disruptive events at any of our locations worldwide.
Cybersecurity
Our business is susceptible to cyberattacks due to our reliance on technology and software used by us and third parties, as well as due to our use and retention of confidential data. For further discussion of our cybersecurity activities and strategies, see Part I, Item 1(C), "Cybersecurity".
Intellectual Property
We rely on a wide range of intellectual property, both owned and licensed, in connection with the operation of our various businesses. We own the rights to a large number of trademarks, service marks, domain names and trade names in the U.S., Europe and in other parts of the world. We have registered many of our trademarks in the U.S. and in certain other countries. We hold the rights to a number of patents and have made a number of patent applications in the U.S. and other countries. We also own the copyright to a variety of material. Those copyrights, some of which are registered, include software code, printed and online publications, websites, advertisements, educational material, graphic presentations and other literature, both textual and electronic. We attempt to protect our intellectual property rights by relying on trademarks, patents, copyrights, database rights, trade secrets, confidentiality, know-how, contracts, restrictions on use and disclosure, and other methods.
FTSE® and the FTSE indexes are trademarks and service marks of the London Stock Exchange plc and the London Stock Exchange Group Holdings Limited and are used under license. MSCI® and the MSCI indexes are trademarks and service marks of MSCI Inc. or its affiliates and are used under license.
Human Capital Resources
Employees
As of December 31, 2024, we had a total of 12,920 employees. In the U.S., we had a total of 7,747 employees. Internationally, we had a total of 5,173 employees, including 3,394 in India, 789 in the U.K. and 399 in the rest of Europe. Of our total employee base, less than 1% is subject to collective bargaining agreements, and such relations are considered to be good.
We monitor voluntary attrition rates carefully, and over the past three years, our attrition rates have remained lower than the benchmarks in the finance and technology sectors. We review this data frequently and transparently report this information to our stakeholders via our Sustainability Report.
Corporate Culture
Highly capable and engaged teams are critically important to our ability to grow and innovate. Through our human capital management efforts, we strive to attract and retain the best talent in the world. Our industry is competitive, and the expectations are high. To achieve our business objectives, we aim to offer pay commensurate with performance, a diverse
and inclusive work environment, significant opportunities for career growth and a culture that prioritizes collaboration and drives results.
We use a mix of channels to gather input from employees throughout our organization. Formal methods include our employee surveys and an annual review process. Additionally, we actively strive to cultivate a work environment that encourages conversations across and within teams to provide informal and real-time feedback loops at all levels.
Employee Development
Employee development is an important element of our human capital management program. Career development and training opportunities are available throughout our ranks, including both structured course work across a variety of topics and situations, and self-directed learning from a wide array of available resources.
Compensation and Benefits
We strive to provide comprehensive packages of competitive compensation and benefits in each market in which we operate, which we believe is important to ensure our employees’ health, well-being and financial security. Through employee assistance plans, in most of our locations we provide free and discounted counseling services for dealing with traumatic life events, mental health issues and stress, as well as general wellness programs. We review the competitiveness of our compensation and benefits frequently.
As an equal opportunity employer, all qualified applicants receive consideration without regard to race, color, religion, gender, sexual orientation, gender identity, national origin or ancestry, age, disability or veteran status, or other protected status.
To promote our business objectives, we are focused on supporting inclusion and belonging across our broader employee population and the representation of diverse experiences and perspectives on our Board of Directors. We hold ourselves accountable via periodic data reporting to senior management, data reporting to our Board of Directors, and transparency in reporting data to our stakeholders via our annual Sustainability Report, including Equal Employment Opportunity, or EEO-1 data.
Corporate Giving
Financial education is the cornerstone of our corporate giving efforts, which include support for several organizations. We underwrite financial education programs in the U.S., U.K. and India. We make additional charitable contributions throughout the communities where we have offices and our employees are encouraged to do the same, including through a $5,000 annual match to employees for charities of their choice.
Corporate Citizenship
We strive to create long-term value for our stockholders, including by promoting sustainable business practices. That includes a focus on:
•Human capital management: Our people are our greatest asset and fostering a diverse, engaged workforce is critical.
•Risk management: From cybersecurity to operational resiliency to regulatory compliance, risk management is at the heart of how we operate.
•Environmental risks and opportunities: We are addressing our impact on the climate, the climate’s impact on our business and our opportunities to support a broader sustainability impact through our products and services.
For additional information, please refer to the human capital, risk management and sustainability sections of our website at www.ice.com.
Our Competitive Strengths
We believe that we compete favorably based on numerous factors, and that our deep, liquid markets, technology offerings, breadth of product offerings, new product development, customer relationships, efficient, secure settlement, clearing and other support services and our reputation distinguish us from our competitors. We believe that to maintain our competitive position, we must continue to develop new and innovative products and services, enhance our technology infrastructure, maintain liquidity and offer competitive pricing.
We believe our key strengths include our:
•Data Services: Across all three of our segments and our various networks, our data services aim to address the rising demand for independent, real-time information, which is being driven by regulation, market fragmentation and competition, increasing technology and data demands, increasing automation, as well as passive investing and indexation. We also believe our data services are uniquely relevant to our clients’ business operations and provide tools and services that enable greater workflow efficiency and, regardless of market conditions, are relied upon to serve the need for continuous information and analysis.
–In our Exchanges segment, we offer proprietary real-time and historical pricing data, as well as order book and transaction information related to our global futures markets and the NYSE. We also provide connectivity services directly related to those exchange platforms and clearing houses.
–In our Fixed Income and Data Services segment, we are a leading provider of end-of-day and continuous evaluated pricing services on nearly three million fixed income securities spanning approximately 150 countries and 80 currencies including sovereign, corporate and municipal bonds, mortgage and asset-backed securities, as well as leveraged loans. Our reference data offering complements our evaluated pricing by providing our clients with a broad range of descriptive information, covering millions of financial instruments that, when coupled with our pricing services, act as the foundation for our leading fixed income index complex.
–In our Mortgage Technology segment, our DDA and Analyzer offerings provide customers with greater efficiency by streamlining data collection and validation through our automated document recognition and data extraction capabilities. In addition, our Mortgage Technology’s data offerings include real-time industry and peer benchmarking tools, which provide originators a granular view into the real-time trends of the U.S. residential mortgage market.
•World Class Technology: Our proprietary systems are built using state-of-the-art technology and are designed to support our customers' workflows across the networks we operate. We employ a significant number of employees in technology-related activities, including product management, system architecture, software development, network engineering, server maintenance and continuity, cybersecurity, system and data performance, systems analysis, quality assurance, database administration and customer technical support. Speed, reliability, resilience, capacity and security are critical performance criteria for our electronic networks.
•Risk Management Expertise: We offer a range of central clearing and related risk management services to promote the liquidity and security of our markets in jurisdictions around the world and to meet local regulatory and operational needs in key financial market centers. The credit and performance assurance provided by our clearing houses to clearing members is designed to substantially reduce counterparty risk and is a critical component of our exchanges’ identities as reliable and secure marketplaces for global transactions. Our clearing houses are designed to protect the financial integrity of our markets by maintaining strong governance and rules, managing collateral, facilitating payments and collections, enhancing capital efficiency and limiting counterparty credit risk. In our Fixed Income and Data Services segment, we provide mission critical price transparency for nearly three million fixed income securities globally. Our fixed income customers rely on our data, indices and analytics to inform pre-trade decision making, support post-trade regulatory and compliance needs and improve operational efficiency. In our Mortgage Technology segment, our origination technology network acts as a system of record for mortgage transactions, automating the gathering, reviewing, and verifying of mortgage-related information, that in addition to other benefits, is intended to enable automated enforcement of rules and business practices that are designed to adhere to secondary market standards.
•Broad Distribution: We operate multiple trading venues, including 13 regulated exchanges, as well as 6 clearing houses, which are strategically positioned in major market centers around the world, including the U.S., U.K., EU, Canada, Asia Pacific and the Middle East. Our ICE Global Network provides connectivity to over 150 trading venues and data from over 750 data sources, including ICE-operated markets and data services. Through our fixed income execution, data and analytics offerings, we serve thousands of customers across global fixed income markets. In our Mortgage Technology segment, we have customer connectivity to thousands of participants across the mortgage ecosystem.
•Diverse Product Offerings: In our Exchanges segment, many of our futures contracts serve as global benchmarks for managing risk relating to exposure to price movements in the underlying products, including financial, energy and agricultural commodities. For example, we are a leading provider of global energy risk management products, ranging from global crude and refined oil products, to an array of global natural gas benchmarks and environmental markets. In our Fixed Income and Data Services segment, we offer customers solutions that span their workflows including pre-trade analytics, an array of execution protocols, and post-trade services all designed to improve asset class transparency and bring efficiency to customers' workflows. In our
Mortgage Technology segment, we provide customers with a comprehensive suite of technology offerings which we believe are critical to the underwriting, processing, closing and servicing of U.S. residential mortgage loans.
Competitors
The markets in which we operate are highly competitive. We face competition in all aspects of our business from a number of different enterprises, both domestic and international, including traditional exchanges, electronic trading platforms, investment banks, data vendors, voice brokers, and mortgage and other technology providers.
Exchanges Segment
•We face competition from other exchanges, electronic trading systems, third-party clearing houses, technology firms, market data vendors and trading facilities in the U.S. and globally. Some of the exchanges are consortiums formed by banks and exchanges.
•We face significant competition with respect to equities trading, and this competition is expected to remain intense. Our current and prospective competitors include regulated markets, dark pools and other alternative trading systems, or ATSs, market makers and other execution venues. We also face competition from large investment banks, brokers and customers that may assume the role of principal and act as counterparty to orders originating from retail customers, or match their respective order flows through bilateral trading arrangements, including through internalization of order flow. NYSE Arca Options and NYSE American Options face considerable competition in the equity options markets; their principal U.S. competitors are Nasdaq, Inc., or Nasdaq, and Cboe Global Markets, Inc., or Cboe.
•For corporate listings in the U.S., competitors include, but are not limited to, Nasdaq. For ETF listings, competitors included, but are not limited to, Nasdaq and Cboe. We also face competition for foreign issuer listings from a number of stock exchanges outside the U.S. When other liquidity venues and new entrants obtain exchange status, we face more competition for listings.
Fixed Income and Data Services Segment
•Our fixed income trading venues, or ICE Bonds, compete with other electronic trading venues. Our platforms also compete for volume traded bilaterally or trading activity that is not done through an electronic venue.
•Our data services offerings face intense competition in all aspects of the business. We broadly compete with purchased third-party information and services from large global suppliers of financial market data, including vendor firms, financial consortia, and individual financial institutions. Our Fixed Income Data and Analytics services compete with information obtained from informal industry relationships and sources as well as other index and portfolio analytics providers. Our ICE Global Network business competes with other extranet providers.
Mortgage Technology Segment
•Our origination technology, closing solutions, and servicing software compete with our clients' proprietary systems and other third-party digital mortgage solution providers. We also compete for mortgage activity that does not utilize digital solutions.
•Our data and analytics competitors are primarily third-party providers of similar data assets, including certain niche providers and lender in-house capabilities.
Our Growth Strategy
We seek to advance our leadership position by focusing our efforts on the following key strategies for growth:
•innovate and expand the networks we serve to address the rising demand for transparency and efficiency;
•further develop our technology and risk management infrastructure while also increasing our customer base; and
•strengthen our competitive position through select acquisitions and strategic relationships.
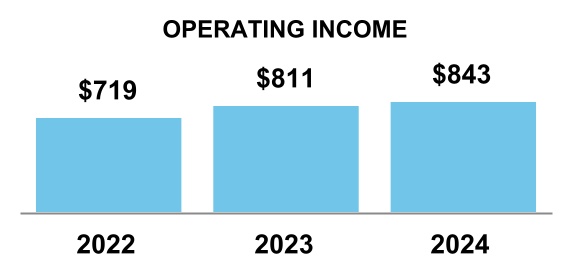
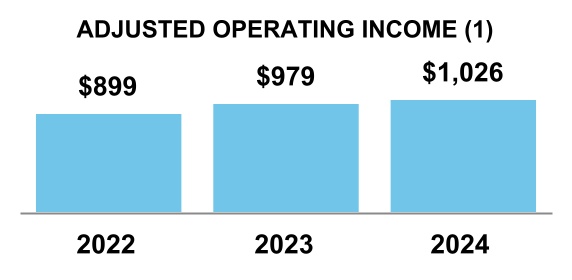
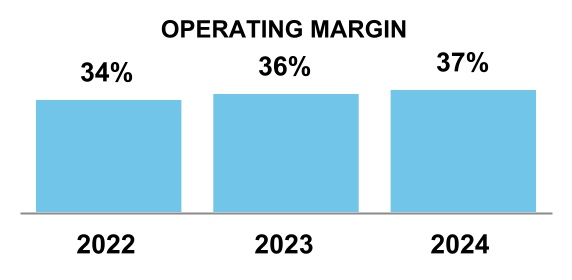
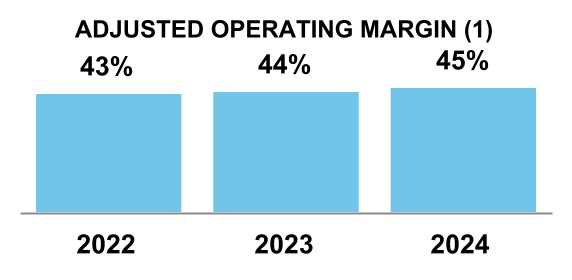
The record consolidated revenues, less transaction-based expenses, we achieved in 2024 reflect our focus on the implementation and execution of our long-term growth strategy.
Innovate and Expand the Networks We Serve to Address the Rising Demand for Transparency and Efficiency
Our growth strategy has been to expand the networks we serve by, in part, adding new data, technology, connectivity and other workflow tools. By bringing together leading technology with a wide range of data and analytics, as well as an array of delivery mechanisms, we offer customers a comprehensive and flexible solution to address the need for more transparency, efficiency and information across their respective workflows. Our growth has been driven by many factors, such as increased automation, regulation and demand for independent, secure, real-time information.
We will continue to look for strategic opportunities to grow our networks and expect to also continue to pursue opportunities in asset classes we do not currently serve.
Further Develop Our Technology and Risk Management Infrastructure While Also Increasing Our Customer Base
We develop and maintain our own infrastructure, electronic trading platforms, clearing systems, mortgage platforms and data and analytics platforms, which are designed to ensure scalability and the delivery of technology that meets our expanding customer base’s demands for price transparency, reliability, risk management and transaction efficiency. The systems that we operate support trading, clearing, the mortgage market life cycle, data and analytics across many data centers.
We expect to continue to develop our exchange technologies. We also expect to continue to invest in mortgage technology to streamline and automate more workflows and build new capabilities. Finally, we expect to add content and build new analytics to enable further electronification in fixed income markets.
Our customer base has grown and diversified as a result of several drivers, including the addition of new asset classes, products and services, the move toward increased risk management and increased automation, regulation and demand for independent, secure, real-time information. We continue to add new participants to our platforms, which bring additional demand for new products and services. We develop new products, but have also increased our capabilities through licenses and acquisitions of companies and intellectual property. We intend to continue to increase the ease of access and connectivity with our existing and prospective customers and expand our customer base by leveraging our existing relationships and our global sales and marketing team to promote participation on our platform, and by expanding our range of products and services.
Strengthen Our Competitive Position Through Select Acquisitions and Strategic Relationships
We were an early consolidator in global markets and we intend to continue to explore and pursue acquisitions and other strategic opportunities to strengthen our competitive position globally, broaden our product offerings and services and support the growth of our company while enhancing stockholder value as measured by return on invested capital, earnings accretion and cash flow growth. We may enter into business combinations, make acquisitions or enter into strategic partnerships, joint ventures or other alliances, any of which may be material. In addition to growing our business, we may enter into these transactions for a variety of additional reasons, including leveraging our existing strengths to enter new markets or related asset classes, expanding our products and services, diversifying our business, addressing underserved markets, advancing our technology and anticipating or responding to regulatory or other potential changes in our industry or other industries.
Information About Our Executive Officers
Information relating to our executive officers is included under “Executive Officers” in Part III, Item 10, “Directors, Executive Officers and Corporate Governance” of this Annual Report.
Regulation
Our activities and the markets in which we operate are subject to regulations that impact us as well as our customers, and, in turn, meaningfully influence our activities, the manner in which we operate and our strategy. We are primarily subject to the jurisdiction of regulatory agencies in the U.S., U.K., EU, Canada, Singapore and Abu Dhabi. Failure to satisfy regulatory requirements can or may give rise to sanctions by the applicable regulator. See the discussion below and Item 1(A) "-Risk Factors" in this Annual Report for additional descriptions of regulatory and legislative risks and uncertainties.
Regulation of our Derivatives Business
Our regulated derivatives markets and clearing houses are based primarily in the U.S., U.K., EU, Canada, Singapore and Abu Dhabi.
•Our U.S. futures exchange, ICE Futures U.S., is subject to extensive regulation by the Commodity Futures Trading Commission, or CFTC, under the Commodity Exchange Act, or CEA. The CEA generally requires that futures trading in the U.S. be conducted on a commodity exchange registered as a Designated Contract Market, or DCM. As a registered DCM, ICE Futures U.S. is a self-regulatory organization, or SRO, that has implemented rules and procedures to comply with the core principles applicable to it under the CEA.
•In the U.K., ICE Futures Europe is a Recognized Investment Exchange, or RIE, in accordance with the Financial Services and Markets Act 2000. Like U.S. regulated derivatives markets, RIEs are SROs with surveillance and compliance responsibilities.
•In the EU, ICE Endex is a regulated market in the Netherlands and its derivative markets are licensed under the Dutch Financial Services Act and supervised by the Dutch National Bank, or DNB, and the Netherlands Authority for the Financial Markets, or AFM.
•In Singapore, ICE Futures Singapore is an approved exchange supervised by the Monetary Authority of Singapore, or MAS.
•In Abu Dhabi, ICE Futures Abu Dhabi is an RIE and regulated by the Financial Services Regulatory Authority, or FSRA.
•In Canada, ICE NGX is recognized as an exchange and clearing house by the Alberta Securities Commission, or ASC, and is also registered by the CFTC as a Foreign Board of Trade and as a Derivatives Clearing Organization, or DCO.
•ICE Clear Credit and ICE Clear U.S. are regulated by the CFTC as DCOs. DCOs are subject to extensive regulation by the CFTC under the CEA. The Financial Stability Oversight Council, or FSOC, has designated ICE Clear Credit as a systemically-important financial market utility under Title VIII of the Dodd-Frank Wall Street Reform and Consumer Protection Act, or Dodd-Frank Act. As such, ICE Clear Credit has access to the Federal Reserve system. ICE Clear Credit is also regulated by the SEC as a clearing agency because it clears security-based swaps.
•ICE Clear Europe, which is primarily regulated in the U.K. by the Bank of England, or BOE, as a Recognized Clearing House, is also subject to regulation by the CFTC as a DCO and by the European Securities and Markets Authority, or ESMA.
•In the EU, ICE Clear Netherlands is an authorized CCP and is regulated by the DNB and AFM.
•In Singapore, ICE Clear Singapore is an approved clearing house supervised by the MAS.
Regulation of our Securities Business
•In our cash equities and options markets, NYSE, NYSE Arca, NYSE American, NYSE National and NYSE Chicago are national securities exchanges and, as such, are SROs and subject to oversight by the SEC. Accordingly, our U.S. securities exchanges are regulated by the SEC and, in turn, are the regulators of their members. As national securities exchanges, NYSE, NYSE Arca, NYSE American, NYSE National and NYSE Chicago must comply with, and enforce compliance by their members with, the Securities Exchange Act of 1934, or the Exchange Act.
•We operate a U.S.-based execution-oriented market for the trading of securities that are not exchange-listed (OTC securities) as an ATS by our SEC-registered broker-dealer, Archipelago Trading Services. Archipelago Trading Services is subject to oversight by the SEC and is a member of the Financial Industry Regulatory Authority, or FINRA. Our SEC-registered broker-dealer, Archipelago Securities, LLC, routes to other execution venues and clears trades on behalf of our national securities exchanges and Archipelago Trading Services. Archipelago Securities, LLC is subject to oversight by the SEC and FINRA and is a full clearing member of the National Securities Clearing Corporation and Options Clearing Corporation, or OCC.
•Our U.S.-based execution-oriented fixed income markets are operated by our SEC-registered broker-dealers, ICE Bonds Securities Corporation, or ICE Bonds, which operates two SEC registered ATSs, ICE BondPoint, and ICE TMC. ICE Bonds is subject to oversight by the SEC and is a member of FINRA and the Municipal Securities Rulemaking Board, or MSRB. FINRA and MSRB are SROs that regulate broker-dealers in the U.S. ICE Bonds is authorized to provide electronic trading services in Canada and Switzerland. ICE Securities Execution & Clearing, LLC, a full clearing member of the National Securities Clearing Corporation, the Fixed Income Clearing Corporation and The Depository Trust Corporation, provides correspondent clearing for ICE Bonds, Creditex Brokerage, L.L.P. and ICE Markets Limited and is subject to oversight by the SEC, FINRA and the MSRB.
•Our U.K.-based execution-oriented fixed income market is operated by Creditex Brokerage, L.L.P., which is an operator of a multilateral trading facility, or MTF, and ICE Markets Limited, which acts as the matched principal counterparty to bond transactions arranged on the MTF operated by Creditex Brokerage. Both Creditex Brokerage and ICE Markets Limited are regulated and authorized by the U.K.’s Financial Conduct Authority, or FCA. Creditex Brokerage is authorized to provide automated trading services in Hong Kong, Singapore and Switzerland and is subject to regulatory oversight by national competent authorities in each jurisdiction.
Regulation of our Data Business
We have a U.S. subsidiary, ICE Data Pricing & Reference, LLC, that is registered with the SEC under the Investment Advisers Act of 1940, or the Investment Advisers Act, for its evaluated pricing and other advisory services. The Investment Advisers Act imposes numerous regulatory obligations on registered investment advisers, including those relating to the management and distribution of products and services, record-keeping, compliance oversight, operational and marketing requirements, disclosure obligations and prohibitions on fraudulent activities. Investment advisers also are subject to certain state securities laws and regulations. ICE Data Services (Australia) Pty. Ltd. provides financial services in Australia and is licensed by the Australian Securities and Investment Commission, or ASIC. ICE Data Desktop Solutions (Europe) Limited provides certain financial services throughout Europe and is regulated by the FCA.
Regulation of our Index Business
We have an index business, ICE Data Indices, LLC, or ICE Data Indices, which includes equity, fixed income, commodity, volatility, mortgage, sustainability and foreign exchange indices. ICE Data Indices applies the International Organization of Securities Commissions, or IOSCO, Principles for Financial Benchmarks to its indices, and is recognized as a third-country benchmark administrator by the FCA under the U.K. Benchmarks Regulation, or U.K. BMR. In addition, ICE Benchmark Administration Limited, or IBA, applies the IOSCO Principles for Financial Benchmarks to its indices and is authorized and regulated by the FCA for the regulated activity of administering a benchmark and is authorized as a benchmark administrator under the U.K. BMR.
Regulation of our Mortgage Business
We have a mortgage technology business, ICE Mortgage Technology, that provides software, data, and electronic data processing to financial institutions and other stakeholders throughout the U.S. residential mortgage industry. ICE Mortgage Technology is subject to supervision and examination by the Federal Financial Institutions Examination Council, or FFIEC, and its member agencies because ICE Mortgage Technology is a third-party technology service provider to financial institutions directly regulated by the FFIEC's member agencies. In addition, our Mortgage Technology business provides loan origination and servicing technology to mortgage lenders and servicers and processes consumer financial information on behalf of our customers. As a result, ICE Mortgage Technology is subject to a variety of U.S. state and federal regulations governing the protection of consumer financial information, including federal consumer financial laws implemented and enforced by the Consumer Financial Protection Bureau, or CFPB. ICE Mortgage Technology is designated as an operator of "critical infrastructure" by the U.S. Department of Homeland Security and the U.S. Department of Treasury.
Regulatory Changes
Domestic and foreign policy makers continue to review their legal frameworks governing financial markets, and periodically change the laws and regulations that apply to our business and to our customers’ businesses. Our key areas of focus on these evolving efforts are:
•Increased Bank Capital Requirements. The Board of Governors of the Federal Reserve, or the Federal Reserve, the Office of the Comptroller of the Currency and the Federal Deposit Insurance Corporation proposed to implement various Basel Committee standards which would increase U.S. bank capital requirements (Basel III Endgame). The Basel III Endgame would apply credit valuation adjustment risk capital requirements to bank-affiliated clearing members' exposures to their clearing clients. The Federal Reserve also proposes to revise the risk-based capital surcharge for global systemically important bank holding companies to include bank-affiliated clearing members' exposures to their clearing clients in additional aspects of the surcharge calculation. Both proposals would increase capital requirements for client clearing activities, which could increase costs for clearing services, decrease clearing members' clearing capacity, and result in a reduction of cleared volumes at our clearing houses. The Basel III Endgame proposal could also discourage participation in mortgage lending and servicing, resulting in a reduction of mortgage volumes at ICE Mortgage Technology, negatively impact U.S. capital markets, end users' ability to hedge and raise financing through public markets and degrade liquidity. The Basel III Endgame received significant industry feedback, and in September 2024, Michael Barr, Vice Chairman for Supervision of the Federal Reserve, indicated that he intends to recommend that both the Basel III Endgame and G-SIB surcharge be re-proposed. Under the new administration, it is possible that the Basel III Endgame and G-SIB surcharge could be revised beyond the changes suggested by Michael Barr.
•EMIR 3.0. Under the European Market Infrastructure Regulation, or EMIR, known as EMIR 3.0, EU counterparties will need to establish accounts and clear a minimum number of trades (referred to as the active account requirement) in euro-denominated short-term interest rate products with an EU-based clearing house which will affect ICE Euribor and €STR contracts.
•Policy intervention to address high energy prices. Various legislative proposals in the EU have been adopted to address high energy prices and impact ICE Endex, the primary European exchange for the benchmark European gas contract, and ICE Clear Europe, which clears ICE Endex contracts. These policy interventions include a temporary price cap on certain Dutch Title Transfer Facility, or TTF, derivatives traded on ICE Endex, which expired on January 31, 2025. In addition, in December 2022, a coalition of G7 and other nations set the price of certain Russian crude oil at or below $60 a barrel, which remains in place and impacts the services we offer to clients.
•Recognition of our Businesses in Foreign Jurisdictions and Continued Access by Market Participants. In January 2025, the European Commission extended until June 2028 the temporary equivalence decision that allows continued access by EU firms to clear trades at U.K. CCPs.
•Regulation of ESG data and ratings. Many jurisdictions have adopted or are proposing or considering proposals to regulate environmental, social or governance, or ESG, data providers, as well as ESG ratings. In December 2024, the EU Regulation on ESG Ratings Providers was published in the Official Journal of the EU. The regulation introduces a regulatory regime for ESG rating providers operating in the EU and will take effect in July 2026. Certain ICE Data Service offerings will likely be in scope and will be required to become authorized and supervised by ESMA. The U.K. government has also published draft legislation proposing to regulate ESG data providers. If adopted, certain ICE Data Service offerings could be subject to increased regulation and oversight by the FCA.
•Equity Market Structure Rules. In September 2024, the SEC adopted new rules regarding equity market structure which changed the minimum pricing increments, or tick sizes, for the quoting of certain stocks to allow these stocks to be priced with tighter spreads and reduced current fee caps exchanges can charge market participants for access to protected quotations. These rules have been challenged in court and the SEC has stayed implementation of these rules pending judicial review. The SEC also adopted rules requiring all exchange fees charged and rebates paid for execution of an order to be determinable at the time of execution and accelerating the date by which market participants must make information available for smaller-sized orders, which will take effect in November 2025. These rules, including those currently stayed, could affect market and competitive dynamics for venues that facilitate trading of equity securities.
•EU Deforestation Regulation. In December 2024, the EU postponed the effective date of the EU Deforestation Regulation, or EUDR, from December 30, 2024 to December 30, 2025 for large companies and to June 30, 2026 for small entities. EUDR requires that certain commodities (including cocoa and coffee) and their products be from deforestation-free land and meet other requirements before they can be placed or made available on the EU
market, or exported from it. The EUDR requirements may decelerate the physical trade of cocoa and coffee, impact the usability of EU coffee and cocoa physical inventories, and reduce trading volumes on ICE Futures Europe of the Robusta Coffee Contract and London Cocoa Contract and on ICE Futures U.S. of the Coffee C Contract (Arabica).
•EU DORA Regulation. The Digital Operational Resilience Act, or DORA, is an EU regulation that establishes an information and communication technology, or ICT, risk management framework for the EU financial sector. DORA establishes technical standards that EU financial entities must implement by January 2025 and imposes requirements relating to risk management, reporting, and information and communications technology service provider oversight. ICE Endex and ICE Clear Netherlands are EU financial entities and, thus, directly subject to DORA requirements. In addition, EU financial entities using ICT services provided by ICE may be required to impose certain obligations on ICE entities. In January 2025, the European Commission provided guidance clarifying that financial services provided by a regulated entity (including those regulated outside the EU) should not be considered ICT services under DORA.
See the discussion below and Item 1(A) “- Risk Factors” in this Annual Report for additional description of regulatory and legislative risks and uncertainties.
Available Information
Our principal executive offices are located at 5660 New Northside Drive, 3rd Floor, Atlanta, Georgia 30328. Our main telephone number is 1-770-857-4700, and our website is www.ice.com.
We are required to file reports and other information with the SEC. A copy of this Annual Report on Form 10-K, as well as any future Quarterly Reports on Form 10-Q, Current Reports on Form 8-K and any amendments to such reports are available free of charge, on our website as soon as reasonably practicable after we file such reports with, or furnish such reports to, the SEC. A copy of these filings is also available at the SEC’s website (www.sec.gov). From time to time, we may use our website and/or social media, including X, formerly known as Twitter, as distribution channels of material information. The website to access our X account is https://x.com/ICE_Markets. References in this Annual Report to our website address, to the SEC’s website address and to our account on X do not constitute incorporation by reference of the information contained on the website and should not be considered part of this Annual Report.
In addition, we have posted on our website the charters for our (i) Audit Committee, (ii) Compensation Committee, (iii) Nominating and Corporate Governance Committee and (iv) Risk Committee, as well as our Global Code of Business Conduct, which includes information regarding our whistleblower hotline information, Board of Directors Governance Guidelines and Board Communication Policy. We will provide a copy of these documents without charge to stockholders upon request.
ITEM 1(A). RISK FACTORS
The risks and uncertainties described below are those that we currently believe could materially adversely affect us. Other risks and uncertainties that we do not presently consider to be material, or of which we are not presently aware, may become important factors that affect us in the future. If any of the risks discussed below actually occur or continue to occur, our business, financial condition, operating results or cash flows could be materially adversely affected. Accordingly, you should carefully consider the following risk factors, as well as other information contained in or incorporated by reference in this Annual Report.
SUMMARY
The following summarizes some of the key risks and uncertainties that could materially adversely affect us. You should read this summary together with the more detailed description of each risk factor contained below.
Business and Industry
• Global economic, political and financial market events or conditions have at times in the past negatively impacted and may in the future negatively impact our business.
• Our business is subject to the impact of interest rate and inflation levels and volatility and financial markets volatility, which are caused by conditions that are beyond our control.
• Our role in the global financial system positions us at a greater risk for cyberattacks, cyberterrorism and other cybersecurity risks.
• We may be at greater risk from terrorism than other companies.
• Systems failures in the derivatives and securities trading industry and mortgage technology industry have in the past negatively impacted us and could in the future negatively impact us.
• Owning clearing houses exposes us to risks, including risks related to defaults by clearing members, risks related to investing margin and guaranty funds and the cost of operating the clearing houses.
• If the value of securities held as margin or guaranty fund contributions by our clearing houses declines or a sovereign government issuer defaults, clearing members may be at risk of defaulting, which could adversely impact our clearing houses.
• Owning and operating cash equity and options exchanges exposes us to risks, including the regulatory responsibilities to which these businesses are subject.
• Fluctuations in foreign currency exchange rates could adversely affect our financial results.
• We may have difficulty executing our growth strategy and maintaining our growth effectively.
• We may not be successful in offering new products or technologies or in identifying opportunities.
• Climate change poses operational, commercial, reputational, regulatory and financial risks.
• We face reputational, regulatory and financial risks related to our ability to respond to diverse stakeholder expectations and requirements on sustainability-related topics, including in connection with a transition to clean and renewable energy.
• We have in the past been, and may in the future be, required to recognize impairments of our goodwill, other intangible assets or investments.
• Our majority investment in Bakkt Holdings, Inc., or Bakkt, may introduce additional risks to our business due to its evolving business model.
• Pandemics and other public health emergencies could adversely affect our business, results of operations and financial condition.
Legal and Regulatory
• Our businesses and those of many of our clients have been and continue to be subject to extensive legislation and regulatory scrutiny, and we face the risk of changes to our regulatory environment and business in the future.
• Our compliance and risk management methods, as well as our fulfillment of our regulatory obligations, may not be effective, which could lead to enforcement actions by our regulators or other legal proceedings.
• Regulatory developments or court rulings may have an adverse impact on our ability to derive revenue from market and mortgage data and technology and connectivity fees.
• Ongoing impacts and uncertainty following the U.K.'s exit from the EU, commonly referred to as Brexit, could adversely impact our business, results of operations and financial condition.
• Risks relating to the administration of benchmarks and indices, and changes to, cessations of, and the replacement of, or transition from, benchmarks and indices may result in legal risks and could adversely affect our business.
• We may face liability for content contained in our data products and services.
• We are subject to significant litigation and liability risks, including enforcement actions by our regulators.
Operational and Liquidity
• Our systems and those of our third-party service providers are vulnerable to cyberattacks, hacking and other cybersecurity risks, which could result in wrongful manipulation, disclosure, destruction, or use of our information or that of a third party, or which could make our customers unable or reluctant to use our electronic platforms or other products and services.
• Our business has in the past been, and may in the future be, harmed by computer and communication systems failures and delays.
• An interruption or cessation of an important service, data or content supplied by any third party, or the loss of an exclusive license, could have a material adverse effect on our business.
• Our emerging technology initiatives under development and the use of artificial intelligence in certain of our existing products may be unsuccessful and may give rise to various risks, which could adversely affect our business, reputation or operating results.
• Our success largely depends on key personnel, including our senior management, and having adequate succession plans in place. We may not be able to attract, retain and develop the highly skilled employees we need to support our business, which could harm our business.
• We currently have a substantial amount of outstanding indebtedness which could adversely affect our financial condition and operations and restrict our activities or our ability to satisfy our debt service obligations.
Competition and Reputational Harm
• We face intense competition, and if we fail to keep up with rapid changes in technology and client preferences, it could negatively impact our competitive position.
• Damage to our reputation could damage our business.
Mergers & Acquisitions and Common Stock
• We may fail to realize the anticipated cost savings, growth opportunities and synergies and other benefits anticipated from our past or future acquisitions and strategic investments, which could adversely affect our business and the value of our common stock.
• We are a holding company and depend on our subsidiaries for dividends, distributions and other payments.
• Provisions of our organizational documents and Delaware law may delay or deter a change of control of ICE.
Intellectual Property
• Our use of "open source" software could negatively impact our ability to sell our products and services and subject us to litigation.
• A failure to protect our intellectual property rights, or allegations that we have infringed the intellectual property rights of others, could adversely affect our business.
BUSINESS AND INDUSTRY
Global economic, political and financial market events or conditions have at times in the past negatively impacted and may in the future negatively impact our business.
Adverse macroeconomic conditions, including recessions, inflation, supply chain issues, labor shortages, government shutdowns, currency fluctuations, interest rate changes, increased mortgage foreclosure volume, decreased mortgage origination or servicing volume, geopolitical events or conflicts, political uncertainty and discord, international trade disputes and sanction laws, including the imposition of tariffs or other protectionist measures, actual or anticipated large-scale defaults or failures or slowdown of global trade and travel have in the past negatively impacted consumer and corporate confidence and resulted in reductions in consumer, government and corporate spending, and could have such effects in the future, and in turn impact our business. If our customers reduce spending, workforce, mortgage origination, mortgage servicing activity or trading activity, or if there is reduced demand for financial and property data as a result of adverse macroeconomic conditions, our revenues could decline.
During 2024, macroeconomic conditions, including interest rate, inflation and market volatility, the presidential election in the United States and general elections in many jurisdictions in the U.S. and abroad, along with geopolitical concerns, including the conflicts in Ukraine and the Middle East, created economic and political uncertainty and volatility in global markets, which resulted in a dynamic operating environment and impacted our operations and results. We expect these impacts may continue in 2025. Although inflation generally decreased in 2024 and central banks began modest reductions in interest rates, there remains uncertainty regarding, and volatility in, the inflation rate. Higher inflation levels could return, however, due to, among other things, potential tax cuts or tariffs, which could reduce the appetite for continued interest rate cuts and even necessitate interest rate increases in 2025, which could have a negative impact on our business. Changes in monetary policies resulting from contrasting election results in many of the countries in which we operate, such as the U.S., U.K. and EU, could impact our business. Beginning in 2022, the Russia-Ukraine conflict has been a catalyst for an energy crisis in Europe. Government interventions related to the energy crisis resulting from the Russia-Ukraine conflict, such as the Market Correction Mechanism (price cap), or interventions that may be proposed in the future related to the Russia-Ukraine conflict or the conflict in the Middle East have had and could in the future have a negative impact on our business. See Item 1 “- Business - Regulation” above for additional information on various legislative proposals in the EU to address high energy prices.
In addition, U.S. trade and diplomatic tensions, including trade disputes and tariffs as well as U.S. government policies toward China and Chinese government policies toward the U.S., are likely to impact our existing business and future opportunities. For example, the Holding Foreign Companies Accountable Act, or HFCAA, requires the SEC to suspend trading in the U.S. of any company whose accounting firm the Public Company Accounting Oversight Board, or PCAOB, is unable to inspect or investigate for three consecutive years. In November 2023, following inspections of audit firms for the Chinese and Hong Kong issuers the SEC had previously identified as using non-inspected audit firms, the PCAOB announced settlements related to these inspections, which could lead to fewer Chinese companies listing in the U.S. Moreover, there remains the risk that the SEC may suspend trading of NYSE-listed companies under the HFCAA, which would require us to suspend trading for those companies to comply with U.S. government policies, which could impact our business. Other political developments, including changes in China-Taiwan relations, trade disputes and tariffs on countries such as Canada or Mexico, may also impact our business and future opportunities.
The market and mortgage data subscriptions and trading volumes in our markets could decline substantially if our market participants reduce their level of spending or trading activity for any reason, including:
• adverse market conditions that curtail the addition of new customers or cause a decrease in purchases by our existing customers for our subscription-based products and services;
• weakness in the macroeconomic environment that causes our customers to delay or cancel existing orders or subscriptions;
• cost-cutting pressures across the industry or a decrease in demand for our subscription-based products and services that lead to a reduction in price;
• consolidation in our markets or the markets of our customers that results in a reduction in the number of market participants;
• a reduction in trading demand by customers or a decision to curtail or cease hedging or speculative trading;
• regulatory or legislative changes impacting our business, our customers and financial markets;
• political uncertainty and discord could negatively impact us if we are viewed as taking a political stance that is contrary to our customers’ beliefs or principles;
• the impact of climate change and the impact of, and uncertainty related to, the transition to renewable energy and away from fossil fuels, including regulatory or legislative changes;
• a prolonged decrease in volatility in the financial markets;
• heightened capital and margin requirements or mandated reductions in leverage resulting from new regulations;
• defaults by clearing or exchange members or the inability of participants to pay out contractual obligations;
• changes to our contract specifications that are not viewed favorably by our market participants; or
• reduced access to, or availability of, capital required to fund trading activities.
A reduction in our overall trading volume could render our markets less attractive to market participants as a source of liquidity, which could result in further loss of trading volume and associated transaction-based revenues. A reduction in trading volumes could also result in a corresponding decrease in demand for our market data, which would further reduce our overall revenue.
Further, NYSE’s revenue increases when more companies are seeking access to public markets, and on the NYSE specifically. Reduced demand for IPOs as compared to historical levels, or issuers choosing to list on venues other than the NYSE, have had and could continue to have an adverse effect on our revenues.
In addition, adverse conditions in the residential mortgage lending industry, including a substantial or prolonged decline in mortgage lending volume or an increase in mortgage foreclosure volume, have in the past increased our costs or had an adverse effect on our revenues and may do so in the future. For example, beginning in early 2022, in line with the Federal Reserve raising rates numerous times as part of its anti-inflation strategy, mortgage lending volume decreased substantially. Although this trend has stalled or partially reversed at times in 2023 and 2024, it could continue in the future, meaning we could see a further decline in mortgage origination volumes. This decrease in lending volume has adversely affected our revenues, in particular those of a transactional nature which are directly connected to the number of loans processed using our technology. Factors that are currently adversely impacting mortgage lending volumes include elevated mortgage interest rates, as well as housing affordability and availability. Additional factors that could now or in the future adversely impact mortgage lending volumes include reduced consumer and investor demand for mortgages, more stringent underwriting guidelines, decreased liquidity in the secondary mortgage market, high levels of unemployment,
high levels of consumer debt, lower consumer confidence, changes in tax and other regulatory policies, the number of existing mortgages eligible for refinancing, and other macroeconomic factors. Although certain of our mortgage technology products, in particular those supporting default management, may see higher demand during times of rising mortgage foreclosure volume, this increase in demand may be outweighed by the impacts of reduced mortgage lending volume and in the aggregate may have a material adverse effect on our business, financial condition, and results of operations. A reduction in mortgage volume could also result in a corresponding decrease in demand for mortgage data products, which would further reduce our revenues.
Our business is subject to the impact of interest rate and inflation levels and volatility and financial markets volatility, which are caused by conditions that are beyond our control.
Trading volume in our markets and products is largely driven by the degree of volatility - the magnitude and frequency of fluctuations - in prices and levels of the underlying commodities, securities, indices, financial benchmarks or other instruments. Volatility increases the need to hedge price risk and creates opportunities for investment and speculative or arbitrage trading. Were there to be a sustained period of stability in the prices or levels of the underlying commodities, securities, indices, benchmarks or other instruments of our products, we could experience lower trading volumes, slower growth or declines in revenues.
In addition, interest rates are a significant factor influencing mortgage loan production volumes and loan foreclosures, as discussed above. Rising or high interest rates generally reduce mortgage loan production volumes and increase loan foreclosures, which has in the past impacted and could in the future impact our transaction-based revenues.
Rapid increases in and high levels of inflation in recent years have impacted the credit health of market participants, increased the risk of default and increased the risk of companies not being able to comply with listing standards. An inflationary environment generally also reduces consumer optimism, resulting in lower demand for mortgage loans. Although inflation generally moderated in 2024, inflation rates have remained volatile and uncertainty remains regarding whether inflation will increase again in the future. Higher inflation levels could adversely affect our business, including by further increasing the cost of capital, resulting in a slowdown of the growth of early stage companies, causing companies to stay private longer.
Factors that are particularly likely to affect price and interest rate levels and volatility, and thus trading and mortgage loan production volumes, include:
• global economic and market conditions;
• global political conditions including political uncertainty and discord as a result of elections in many jurisdictions, including in the U.S. and the U.K.; and
• concerns over recession, inflation, deflation, legislative and regulatory changes, government fiscal and monetary policy, including actions by the Federal Reserve and other foreign monetary units governing bodies, developments related to the U.S. federal debt ceiling, including the possibility of a government shutdown, default by the U.S. government on its debt obligations or related credit rating downgrades, and investor and consumer confidence levels.
Factors that are particularly likely to affect trading volumes include:
• weather conditions including hurricanes and other significant events, natural and unnatural disasters like large oil spills that impact the production of commodities and, in the case of energy commodities, production, refining and distribution facilities for oil and natural gas;
• war, acts of terrorism and any unforeseen market closures or disruptions in trading;
• political developments impacting international trade, including trade disputes and increased tariffs, particularly between the U.S. and China, Canada or Mexico and imposition of protectionist measures;
• real and perceived changes in the supply and demand of commodities underlying our products, particularly energy and agricultural products, including changes as a result of technological improvements or the development of alternative energy sources; and
• credit quality of market participants, the availability of capital and the levels of assets under management.
Any one or more of these or other factors, which are beyond our control, may reduce volumes and trading activity. Further, lower market volatility could also result in more exchanges competing for trading volumes to maintain their growth. If any of these unfavorable conditions were to persist over a lengthy period of time and trading volumes were to decline substantially and for a long enough period, the critical mass of transaction volume necessary to support viable markets
could be jeopardized. Because our cost structure is largely fixed, if demand for our current products and services declines for any reason, we may not be able to adjust our cost structure to counteract the associated decline in revenues, which would cause our net income to decline.
Our role in the global financial system positions us at a greater risk for cyberattacks, cyberterrorism and other cybersecurity risks.
The cybersecurity threat landscape remains a macro concern for most organizations, and particularly those associated with the U.S. financial infrastructure. We may be more likely than other companies to be a target of cyberattacks and other cybersecurity risks due to our role in the global financial ecosystem and the high-profile nature of many of our businesses that deliver critical services to a broad range of financial market participants. For a discussion of our cyber risks, see “—Item 1- "Business—Cybersecurity". Our systems and those of our third-party service providers are vulnerable to cyberattacks, hacking and other cybersecurity risks, which could result in wrongful manipulation, disclosure, destruction, or use of our information or that of a third party, or which could make our customers unable or reluctant to use our electronic platforms or other products and services.”
It is impossible to precisely predict the likelihood or impact of any cyberattack on the securities industry generally, or on our business. In the event of a cyberattack or a threat of a cyberattack, our security measures and contingency plans may be inadequate to prevent significant disruptions in our business, technology or access to the infrastructure necessary to maintain our business. Any of these events could adversely affect our business, financial condition and operating results.
We may be at greater risk from terrorism than other companies.
Given our prominence in the global financial industry and the location of many of our properties and personnel in U.S., U.K. and European financial centers, including Manhattan, and our presence in India, Abu Dhabi and Israel, we may be more likely than other companies to be a direct target, or an indirect casualty, of attacks by terrorists or terrorist organizations, or other extremist organizations that employ threatening or harassing means to achieve their social or political objectives. Damage to our business or facilities due to such attacks may be significantly in excess of insurance coverage, and we may not be able to insure against some damage at a reasonable price or at all. The threat of terrorist attacks may also negatively affect our ability to attract and retain employees. In addition, terrorist attacks may cause instability or decreased trading in the markets we operate, including trading on our securities exchanges. Any of these events could adversely affect our business, financial condition and operating results.
Systems failures in the derivatives and securities trading industry and mortgage technology industry have in the past negatively impacted us and could in the future negatively impact us.
High-profile system failures in the derivatives and securities trading industry and mortgage technology industry, including due to cybersecurity disruptions and attacks, have in the past, and could in the future, negatively impact our business and result in a loss of confidence in our technology and our markets, regulatory investigations, fines and penalties and business activity slowdown or interruptions. Further, regulators have imposed requirements for trading platforms that have been costly for us to implement and could result in a decrease in demand for some of our services. In particular, the SEC’s Regulation Systems Compliance and Integrity, or Regulation SCI, and the CFTC’s system safeguards regulations subject portions of our securities and derivatives trading platforms and other technological systems related to our clearing houses, trade repositories and the U.S. Swap Execution Facility, or SEF, to extensive regulation and oversight. Ensuring our compliance with the requirements of Regulation SCI and the CFTC’s system safeguards regulations requires significant ongoing administrative and compliance expenses and burdens. The SEC’s expansion of the obligations under Regulation SCI, including to the ICE businesses or systems that are determined to be in the scope of the regulation, in the past has resulted, and in the future could result, in significant additional expenditures. In addition, the Digital Operational Resilience Act, or DORA, that went into effect on January 17, 2025, establishes an information and communication technology, or ICT, risk management framework for the EU financial sector and imposes risk management, reporting and information oversight for EU financial entities and their ICT third-party service providers. Some of our businesses are impacted by the compliance burdens and costs of DORA as EU financial entities or ICT third-party service providers to EU financial entities.
Owning clearing houses exposes us to risks, including risks related to defaults by clearing members, risks related to investing margin and guaranty funds and the cost of operating the clearing houses.
There are risks inherent in operating clearing houses, including exposure to the market and counterparty risk of clearing members, market liquidity risks, defaults by clearing members and risks associated with custody and investing margin or guaranty fund assets provided by clearing members to our clearing houses, which could subject our business to substantial losses. As of December 31, 2024, we custody a total of $84.3 billion of clearing members' margin and guaranty funds across all of our clearing houses. To the extent available, ICE clearing houses use Sovereign Central Banks to
custody assets. For example, ICE Clear Credit holds the U.S. dollar cash and U.S. Treasuries that clearing members transfer to satisfy their original margin and guaranty fund requirements at its account at the Federal Reserve. ICE clearing houses may also use third-party investment agents for investment of cash assets, subject to the guidelines provided by each clearing house, and may add or change the investment agents from time to time.
Although our clearing houses have policies and procedures to manage the risks to which they are exposed, including collecting margin and guaranty fund contributions from clearing members, such policies and procedures may not succeed in preventing losses after a member's or counterparty’s default. The processes for calculating and setting margins and financial safeguards is complex and there is no guarantee that our risk models that are utilized to calculate margin and our financial safeguard procedures will adequately protect us in all circumstances. In addition, from time to time, we may redesign the methodology of the risk models that are utilized to calculate margin. Redesigning and implementing a new risk model is a complex process, involving quantitative analysis, regulatory approval and implementation risk. We cannot guarantee that the measures and safeguards we have undertaken to design, implement and operate risk models, calculate and collect margin, and protect our clearing houses in the case of a clearing member default, will be sufficient. Accordingly, it is possible that we would be materially and adversely affected in the event of one or more significant defaults. We have contributed our own capital, or ‘Skin in the Game’, to the front of the guaranty fund of each of the clearing houses that could be used in the event of a default. We also have default insurance that resides after and in addition to the ICE Clear Credit, ICE Clear Europe, and ICE Clear U.S. ‘Skin in the Game’ contributions to the default waterfalls of each of the clearing houses and before the guaranty fund contributions of the non-defaulting clearing members. Notwithstanding these actions, the default of one or more of the clearing members could subject our business to substantial losses and/or cause our customers to lose confidence in our clearing houses and, as a result, in our exchange traded business in general.
If the value of securities held as margin or guaranty fund contributions by our clearing houses declines or a sovereign government issuer defaults, clearing members may be at risk of defaulting, which could adversely impact our clearing houses.
Our clearing houses hold a substantial amount of assets as margin or guaranty fund contributions, which comprise U.S. and other sovereign treasury securities. As of December 31, 2024, our clearing houses held $83.1 billion of non-cash margin or guaranty fund contributions in U.S. and other sovereign treasury securities: $72.0 billion of this amount was comprised of U.S. Treasury securities, $6.5 billion of various EU member country Treasury securities, $2.6 billion of U.K. Treasury securities and $1.9 billion of other European, Japanese, Canadian and Tri-Party Treasury securities. Sovereign treasury securities have historically been viewed as one of the safest and most liquid securities for clearing houses to hold due to the perceived credit worthiness of major governments. If there is a collapse in a specific currency relied upon by our clearing houses, our clearing houses could face significant expenses and such an event could cause a credit contraction and major swings in asset prices and exchange rates. To mitigate this risk, our clearing houses currently apply a discount or “haircut” to the market values for all sovereign securities held as margin or guaranty fund contributions; however, market conditions could change more quickly than we adjust the amount of the haircuts and the haircuts could be insufficient in the event of a sudden market event.
If the value of these securities declines significantly, our clearing houses will need to collect additional margin or guaranty fund contributions from their clearing members, which may be difficult for the members to supply in a time of financial stress affected by an actual or threatened default by a sovereign government. If a clearing member cannot supply the additional margin or guaranty fund contributions, which may include cash in a currency acceptable to the clearing house, the clearing house would deem the clearing member in default. If any clearing members default as a result of the reduction in the value of margin or guaranty fund contributions, our clearing houses and trading business could suffer substantial losses as a result of the loss of any capital that has been contributed to the clearing house’s guaranty funds and a loss of confidence by clearing members in the clearing house, resulting in a reduction in volumes of future cleared transactions.
Further, our clearing houses invest large sums through reverse repo transactions in connection with their clearing operations and hold sovereign securities as security in connection with such investment transactions. In the event that a reverse repo counterparty defaults, the value of the sovereign securities we hold as collateral might not be sufficient to cover our losses. Our clearing houses may also make demand deposits with commercial banks which could be lost in the event one of these banks becomes insolvent.
Owning and operating cash equity and options exchanges exposes us to risks, including the regulatory responsibilities to which these businesses are subject.
Owning and operating cash equity and options exchanges for which the revenues are primarily derived from trading activity, market data and listing fees, exposes us to risks. Adverse economic conditions and legal and regulatory changes
similar to those discussed elsewhere in this section could result in decreased trading volume on our exchanges, discourage or prohibit market participants from listing on our exchanges or cause them to forgo new offerings. Any of these could reduce our revenues, including market data and listing fee revenue.
Our cash equity and options exchanges also have certain regulatory responsibilities that must be fulfilled. For example, these exchanges are responsible for enforcing listed company compliance with applicable listing standards, enforcing members' compliance with exchange rules and federal securities laws, complying with terms of NMS Plans, filing of all material changes to exchanges' rules with the SEC, and operating our exchanges consistent with exchange rules, federal securities laws and other applicable laws. Any failure by one of our exchanges to comply with, and enforce compliance by their members with, exchange rules and securities laws could significantly harm our reputation, prompt regulatory scrutiny, result in the payment of fines or penalties and adversely affect our business, financial condition and operating results.
We must allocate significant resources to fulfill our regulatory and self-regulatory responsibilities. The business objectives of exchanges might conflict with the exchanges’ regulatory and self-regulatory responsibilities. In addition, the listing of our common stock on the NYSE could potentially create a conflict between the exchange’s regulatory responsibilities to vigorously oversee the listing and trading of securities, on the one hand, and our commercial and economic interest, on the other hand. While we have structural protections to minimize these potential conflicts, we cannot be sure that such measures will be successful.
Further, changes in the rules of our securities markets must be reviewed and approved by the SEC. Approval of such changes by the SEC cannot be guaranteed, and the SEC has in the past delayed and could in the future delay either the approval process or the initiation of the public comment process. Any denial or delay in approving changes, or a failure to file changes that regulators view as required, could significantly harm our reputation, prompt regulatory scrutiny, result in the payment of fines or penalties and adversely affect our business, financial condition and operating results. The SEC continues to challenge fee filings on securities market data, which has in the past negatively impacted and could in the future negatively impact the value of proprietary data products.
See Item 1 “- Business - Regulation” above for additional information regarding regulatory changes impacting our cash equities and options exchanges, including risks to our business associated with possible regulation of services offered by non-exchange affiliates.
Fluctuations in foreign currency exchange rates could adversely affect our financial results.
Since we conduct operations globally, substantial portions of our revenues, expenses, assets and liabilities are denominated in currencies other than the U.S. dollar. Because our consolidated financial statements are presented in U.S. dollars, we must translate non-U.S. dollar denominated revenues, income and expenses, as well as assets and liabilities, into U.S. dollars at exchange rates in effect during or at the end of each reporting period. Therefore, increases or decreases in the value of the U.S. dollar against the other currencies could affect our net operating revenues, operating income and the value of balance sheet items denominated in foreign currencies.
In an attempt to combat inflation, countries and regions have used monetary policy, through increasing central bank interest rates, and such actions have caused, and may continue to cause, volatility in currency exchange rates.
External events such as Brexit have caused, and may in the future cause, significant volatility in currency exchange rates, especially among the U.S. dollar, the British pound sterling and the euro. If global economic and market conditions, or economic conditions in the U.K., EU, the U.S. or other key markets deteriorate, the value of the pound sterling, euro or U.S. dollar may weaken. Further, financial instability in a particular country could have a contagion effect on the region in which it is located and contribute to general instability and uncertainty in that region. Events that adversely affect our clients and suppliers in a region could in turn have a materially adverse effect on our international business results and our operating results.
For additional information on our foreign currency exchange rate risk, refer to “- Foreign Currency Exchange Rate Risk” in Item 7A “- Quantitative and Qualitative Disclosures About Market Risk", which is included in this Annual Report.
We may have difficulty executing our growth strategy and maintaining our growth effectively.
We have achieved significant growth since becoming a public company in 2005. Our growth is highly dependent on customer demand for our core products and services, favorable economic conditions and our ability to invest in our personnel, facilities, infrastructure and financial and management systems and controls. Adverse economic conditions could reduce customer demand for our products and services, which may place a significant strain on our management and resources and could force us to defer existing or future planned opportunities. We regularly evaluate our existing operations, service capacity and business efficiencies and, as a result of such evaluations, we may undertake strategic
initiatives outside of and within our businesses. We may not be successful in executing on our strategies to support our growth organically or through acquisitions, other investments or strategic alliances.
We may not be successful in offering new products or technologies or in identifying opportunities.
We from time to time launch, and intend in the future to launch, new products, services and business ventures and continue to explore and pursue other opportunities to strengthen our business and grow our company. We have spent and may continue to spend substantial time and money developing new product or service offerings or improving current product or service offerings. If these offerings are not successful, we may miss a potential market opportunity and not be able to recover the costs of such initiatives. Obtaining any required regulatory approval associated with these offerings may also result in delays or restrictions on our ability to benefit fully from these offerings. Further, we have entered into and may seek in the future to enter into or increase our presence in markets that already possess established competitors who may enjoy the protection of high barriers to entry, among other advantages.
In addition, in light of consolidation in the exchange, data services, clearing and mortgage technology sectors and competition for opportunities, we may be unable to identify strategic opportunities, or we may be unable to negotiate or finance any future acquisition successfully. Our competitors could merge, making it more difficult for us to find appropriate entities to acquire or merge with and making it more difficult to compete in our industry due to the increased resources of our merged competitors. Also, offering new products and services and pursuing acquisitions requires substantial time and attention of our management team, which could prevent them from successfully overseeing other initiatives that are necessary for our success.
Climate change poses operational, commercial, reputational, regulatory and financial risks.
Climate change may increase the frequency or severity of extreme weather events and other natural disasters, and such events could negatively impact our activities and results of operations and impact the activities of our customers or third-party vendors or suppliers. The physical commodities and assets underlying certain of our markets may also be impacted by climate change, which could impact users of our markets. The risks associated with climate change may evolve rapidly and we expect that climate change-related risks may increase over time.
We face reputational, regulatory and financial risks related to our ability to respond to diverse stakeholder expectations and requirements on sustainability-related topics, including in connection with a transition to clean and renewable energy.
A variety of sustainability-related topics, including the transition to clean and renewable energy, involve rapidly changing and diverging expectations from our stakeholders, including consumers and institutional investors. Our ability to satisfy the preferences of our stakeholders around these topics (including on energy production and consumption) and the possible failure of our products or services to support the needs and meet the expectations of such stakeholders could adversely impact our business and revenues. Changing market demands and preferences could also have an adverse impact on the operations or financial condition of our customers, which could result in reduced revenues from those customers.
In addition, the uncertainty related to the transition to clean and renewable energy and away from fossil fuels, including regulatory or legislative changes by the U.S. government with regard to energy policy and related subsidies, incentives or penalties, may negatively impact trading on our markets and have an adverse effect on the activities of our customers or third-party vendors, which could negatively impact our revenues. Furthermore, lawmakers in many jurisdictions have proposed or adopted laws, regulations or policies on sustainability-related topics, including climate change and diversity, equity and inclusion, that diverge from, or potentially conflict with, laws in other jurisdictions in which we operate. In May 2024, the EU adopted the Corporate Sustainability Due Diligence Directive, which will become effective in 2027 and introduce comprehensive due diligence requirements regarding adverse impacts on human rights and the environment in a company’s and its business partners’ operations as well as the requirement to put into effect a climate transition plan. We are subject to risks related to this and other such laws, regulations or policies, which could impact us and our customers and result in increased regulatory, compliance, reputational or operational challenges and costs.
We have in the past been, and may in the future be, required to recognize impairments of our goodwill, other intangible assets or investments.
The determination of the value of goodwill and other intangible assets requires the use of estimates and assumptions that affect our consolidated financial statements. As of December 31, 2024, we had goodwill of $30.6 billion and net other intangible assets of $16.3 billion relating to our acquisitions, including our acquisition of Black Knight in September 2023, and our purchase of trademarks and Internet domain names from various third parties.
During 2024 and 2023, we recorded an impairment on certain developed technology trademark definite-lived intangible assets, respectively, and during 2022, we recorded an impairment of our equity investment in Bakkt. We cannot assure you that we will not experience future events that may result in these types of impairments. An impairment of the value of our existing goodwill, other intangible assets and other investments and assets could have a significant negative impact on our future operating results.
For additional information on our goodwill, other intangible assets and investments, refer to Notes 3, 4 and 9 to our consolidated financial statements and “- Critical Accounting Policies - Goodwill and Other Identifiable Intangible Assets” in Item 7 “- Management’s Discussion and Analysis of Financial Condition and Results of Operations,” which are included in this Annual Report.
Our majority investment in Bakkt may introduce additional risks to our business due to its evolving business model.
We have a majority equity ownership interest and a minority voting interest in Bakkt, which operates as a separate publicly-traded company listed on the NYSE. Due to our majority equity ownership interest in Bakkt, we face increased financial and reputational risks if there is a security or system failure or if Bakkt's business is unsuccessful. We may not realize the returns originally expected from this investment or it may take longer than expected for us to realize the expected returns. We have reviewed certain Bakkt performance indicators noting that, starting as of September 30, 2023, Bakkt has disclosed that it is monitoring its ability to continue as a going concern. Bakkt has continued to disclose that it is monitoring its ability to continue as a going concern in its 2024 SEC filings to date. The carrying value of our equity method investment in Bakkt has been reduced to zero as of December 31, 2024.
On August 12, 2024, we entered into a revolving credit agreement with Bakkt pursuant to which we have agreed to provide Bakkt with a $40 million secured revolving line of credit that matures on December 31, 2026. Although there were no amounts outstanding under the revolving credit agreement as of December 21, 2024, if Bakkt borrows on the line of credit and is unable to repay the borrowed amount, we will likely not recover the outstanding amounts.
We do not control or have direct oversight of Bakkt's operations and our investment in Bakkt entails numerous risks, including risks relating to our minority voting interest in Bakkt and risks relating to Bakkt’s ability to:
• manage the complexity of its business model to stay current with the industry;
• comply with existing or new laws, regulations or orders of any governmental authority related to the use of digital assets, which are currently under additional regulatory scrutiny following recent negative events in the cryptocurrency industry;
• obtain and maintain required licenses and regulatory approvals for its business;
• successfully enter categories and markets in which it may have limited or no prior experience;
• apply distributed ledger technology to a global ecosystem for digital assets;
• successfully develop and integrate products, systems or personnel into its business operations;
• maintain a risk management and compliance framework designed to detect illegal activity such as fraud, money laundering, tax evasion and ransomware scams and comply with anti-money laundering, counter-terrorist financing laws and regulations and anti-corruption laws globally; and
• maintain technology systems and processes that prevent cyberattacks and security vulnerabilities.
As digital assets and blockchain technologies evolve, Bakkt has added, modified or discontinued certain aspects of its business model relating to the product mix and service offerings and may do so in the future. Future additions and modifications to Bakkt’s business will increase the complexity of its business and place significant strain on Bakkt’s management, personnel, operations, systems, technical performance, financial resources and internal financial control and reporting functions. We cannot offer any assurance that these or any other additions or modifications will be successful or will not result in harm to Bakkt’s business. In addition, volatility in digital asset markets and bankruptcies relating to digital asset companies has in the past reduced and could in the future, among other things, reduce confidence in digital assets and blockchain technologies. These events are continuing to develop, and it is not possible to predict at this time all of the risks that they may pose to Bakkt or on the digital asset industry as a whole.
Pandemics and other public health emergencies could adversely affect our business, results of operations and financial condition.
The coronavirus (COVID-19) pandemic created economic and financial disruptions globally and led governmental authorities to take unprecedented measures to mitigate the spread of the disease. From an operational perspective, the
spread of COVID-19 resulted, and the emergence of a new pandemic or other health emergency could in the future result, in temporary closures of our office facilities and the office facilities of our customers and our third-party vendors. We cannot assure you that such measures will adequately protect our business, and such measures could introduce new operational risks, including, but not limited to, cybersecurity risk, and strain our technological resources and business continuity plans. If one or more of the third-party vendors to whom we outsource certain material activities claim that they cannot perform due to a force majeure or experience operational failures as a result of a pandemic or other public health emergency, it could have a material adverse effect on our business, results of operations and financial condition. A pandemic or other public health emergency could also impact, among other things, the availability of our executive officers, staff and primary facilities, and the viability of our customers.
COVID-19 has in the past resulted, and another pandemic or public health emergency could in the future result, in disruptions to global supply chains, which could negatively affect the flow or availability of certain hardware and related products for technology that we need to operate our business effectively and efficiently. Our inability to acquire suitable hardware and related products on acceptable terms or the loss of key suppliers could negatively affect our business. Pandemic and public health-related restrictions could also impact third-party providers' abilities to meet their contractual obligations to us and impact on our customers’ businesses, risk management needs and ability to trade, and, to the extent they do so, adversely affect our operations, business, financial condition or results of operations.
LEGAL AND REGULATORY
Our businesses and those of many of our clients have been and continue to be subject to extensive legislation and regulatory scrutiny, and we face the risk of changes to our regulatory environment and business in the future.
We are and will continue to be subject to extensive regulation in many jurisdictions around the world, and in particular in the U.S., the U.K. and the EU. We face the risk of significant actions by regulatory and taxing authorities in all jurisdictions in which we conduct our businesses and hold investments, which may affect our business, the activity of our market participants, and our results. Among other things, as a result of regulators and tax authorities enforcing existing laws and regulations, we have in the past been and could in the future be censured, fined, prohibited from pursuing certain acquisitions or engaging in some of our business activities, subjected to limitations or conditions on our business activities, including fair, reasonable and nondiscriminatory pricing restrictions, also known as FRAND, and prohibiting the inclusion of, or reliance on, “unfair” terms in certain customer contracts, or subjected to new or substantially higher taxes or other governmental charges in connection with the conduct of our business or with respect to our employees, including settlement payments, interest payments and penalty payments. In many cases, our activities are subject to overlapping and divergent regulation in different jurisdictions.
The adoption of new laws or regulations or changes in regulations or enforcement practices applicable to our businesses or those of our clients could adversely affect our ability to compete effectively with other institutions that are not affected in the same way or impact our clients’ overall trading volume through our exchanges and clearing houses and demand for our market data and connectivity offerings, mortgage technology and other services.
EU policymakers continue to adopt and propose changes to regulatory intervention related to energy markets, including pricing-limiting mechanisms on exchange-traded gas products and strengthening the EU’s market abuse framework for wholesale energy markets. Trading volumes on ICE Endex, the primary European exchange for the benchmark European gas contract, and ICE Clear Europe, which clears ICE Endex contracts, could be impacted. Additionally, in December 2022, a coalition of various nations set the price of Russian crude oil at or below $60 a barrel, which remains in place and impacts our businesses and those of our clients. There may be additional regulatory changes forthcoming and additional impacts to our business.
We are also subject to regulatory risks relating to the mortgage industry, which is heavily regulated in the U.S. Following the acquisition of Black Knight, we are subject to enhanced oversight from the FFIEC and CFPB related to the inclusion of Black Knight's services and product offerings in our portfolio. Changes to existing laws or regulations or adoption of new laws or regulations that affect the residential mortgage industry could reduce residential mortgage volume or otherwise limit the ability of users and participants of our mortgage technology services to operate their businesses, resulting in decreased usage of our solutions. Alternatively, reduced regulatory requirements could also reduce the demand for certain of our products and services, which are intended to enable our customers to satisfy existing regulatory requirements. Potential structural changes to federal agencies integral to the U.S. residential mortgage industry, in particular, those involving the roles of Fannie Mae and Freddie Mac, in addition to the regulatory roles of the CFPB and other banking regulators, could disrupt the residential mortgage market and have a material adverse effect on our business. Further, as a critical third-party service provider in the mortgage industry, we are subject to supervision and examination by certain regulators, which has resulted, and will continue to result, in additional operating costs.
There is ongoing public concern regarding data privacy and data protection in many jurisdictions in which ICE operates. Many of those jurisdictions have passed data privacy legislation, with many more contemplating new laws. The laws and regulations related to privacy and data protection are increasing in complexity and number, change frequently and increasingly conflict among the various countries in which we operate, which has resulted in greater compliance risk and cost for us. Privacy and data protection regulations often require monitoring of, and changes to, our data practices in regard to the collection, use, disclosure, storage, transfer and/or security of personal and sensitive information. Regulatory activity in the privacy area may also hinder our business, for example, by restricting use or sharing of data, including for marketing or advertising or limiting the use of, limiting our ability to provide certain data to our customers, or otherwise regulating artificial intelligence and machine learning, including the use of algorithms and automated processing in ways that could materially affect our business, or that may lead to significant increases in the cost of compliance. The expansion of our business in the U.S. residential mortgage market increases the impact of data privacy legislation on our business. These developments could impact our profitability in the affected jurisdictions, or even make it uneconomical for us to continue to conduct all or certain of our businesses in such jurisdictions, or could cause us to incur significant costs associated with changing our business practices, restructuring our businesses or moving all or certain of our businesses and our employees to other jurisdictions, including liquidating assets or raising capital in a manner that adversely increases our funding costs or otherwise adversely affects our stockholders and creditors.
U.S., U.K. and EU legal and regulatory developments, in particular EMIR, EMIR 3.0, U.K. Markets in Financial Instruments Directive II, or U.K. MiFID II, and EU Markets in Financial Instruments Directive II, or EU MiFID II, the U.K BMR and the EU Benchmarks Regulation, or EU BMR, including each such regulation as incorporated into U.K. law, have significantly altered and propose to further alter the regulatory framework within which we operate and may adversely affect our competitive position and profitability. These regulatory developments could also cause us to change our business practices, restructure our businesses or move certain of our businesses and employees. The enacted and proposed legal and regulatory changes, if implemented, most likely to affect our businesses are: operational account and clearing requirements for EU market participants in EMIR 3.0, the proposal by U.S. banking regulators to increase bank capital requirements under the Basel III Endgame impacting banking services and activities, including client clearing, lending and capital markets activities and the Federal Reserve proposed revisions to the surcharge on global systemically-important bank holding companies, access rules under the U.K. BMR and EU BMR, the non-harmonization of margin requirements, access to our benchmarks, U.K. CCP resolution enhancements and maintaining our exchanges’ abilities to operate as SROs with related immunity for the discharge of their regulatory functions. As the operator of global businesses, the divergence among countries' regulatory frameworks, including differences between the EU and the U.K. post-Brexit, could impact our business as our clearing houses and exchanges are subject to regulation in multiple jurisdictions.
The Dodd-Frank Act established enhanced regulatory requirements for non-bank financial institutions designated as “systemically important” by the FSOC. ICE Clear Credit has been designated as a systemically important financial market utility by the FSOC and, as a result, is subject to additional oversight by the CFTC. Compliance with these requirements has resulted in, and will continue to result in, additional operating costs.
In 2016, the SEC approved a plan to establish a market-wide consolidated audit trail, or the CAT, to improve regulators’ ability to monitor trading activity. In 2018, the first phase of implementation went live and required SRO participants to begin reporting to the CAT. In 2024, the final phase went live. In addition to increased risk in connection with our regulatory obligations, the implementation of the CAT could result in significant additional expenditures, which may not be reimbursed. Prior to SEC approval of billing of certain costs to broker-dealers beginning in 2024, funding for the CAT was provided primarily by the SROs, partly in exchange for promissory notes, which increased the risk that SROs, including us, will not be fully reimbursed for costs expended to build and operate the CAT. Due to the replacement of the original plan processor, we recorded promissory note impairment charges of $16 million, $2 million and $16 million in 2023, 2020 and 2019, respectively. The SEC approved a funding model that shares the cost of the CAT between SROs and broker-dealers in September 2023, however, that approval has been challenged in the United States Court of Appeals for the Eleventh Circuit, and another open litigation matter challenges the CAT as it currently exists. If either challenge is successful, there is a risk that SROs will not be partially or fully reimbursed. As of December 31, 2024, we have accrued approximately $118 million as a receivable in connection with our portion of expenses related to the CAT implementation. In addition, there are additional risks to SRO participants related to regulatory actions or fines in connection with the operation and use of the CAT, including the storage of sensitive and confidential information.
There is an increased focus on, and scrutiny of, ESG data and ratings providers by regulators and policymakers. Certain regulators and policymakers have indicated that extension of their regulatory oversight to ESG data service providers is possible. The EU adopted a regulation on the transparency and integrity of ESG rating activities, which aims to enhance the integrity, transparency, governance and independence of ESG ratings. The U.K. government has also published draft legislation proposing to regulate ESG data providers. If adopted, certain of our offerings could be subject to increased regulation and oversight by the FCA. In each instance, our ESG data products and services may be subject to additional
regulation and may require authorization and supervision by the relevant regulator, which could result in additional operating costs.
Legislative proposals in the EU and elsewhere are contemplating new or expanded requirements for data service providers such as conflict of interest and transparency rules, regulation of prices and fees and imposition of market access rules for third-country providers. These requirements may increase our regulatory burden and impact our ability to provide certain data related services in relevant jurisdictions.
We are subject to tax laws, regulations, rulings and audits in multiple U.S. and non-U.S. jurisdictions that could have a significant impact on our business and lead to additional expenditures for us or our customers. For example, there have been discussions in various jurisdictions around financial transaction or digital service tax frameworks as well as global minimum corporate income tax rates. Changes to tax frameworks in jurisdictions where we operate significant business, for example, the U.S., the U.K. and the EU have the potential to increase costs to us or to our market participants and discourage participation in the markets we operate. Furthermore, implementation of any new or amended tax laws or regulations could impact our global operations, trading volumes or financial results.
Other enacted and proposed legal and regulatory changes not discussed above may also adversely affect our competitive position and profitability. See Item 1 “- Business - Regulation” above for additional information regarding the current and proposed laws and regulations that impact our business, including risks to our business associated with these laws and regulations.
Our compliance and risk management methods, as well as our fulfillment of our regulatory obligations, may not be effective, which could lead to enforcement actions by our regulators or other legal proceedings.
Our ability to comply with existing and future rules, regulations and laws largely depends on our establishment and maintenance of compliance, audit and reporting systems that can quickly adapt and respond, as well as our ability to attract and retain qualified compliance and other risk management personnel. Regulators periodically review our ability to self-regulate and our compliance with a variety of laws and regulations including self-regulatory standards. Certain of our businesses associated with the NYSE are subject to public notice procedures prior to making changes in operations, policies and procedures. If we fail to comply with any of these obligations, regulators could take a variety of actions that could impair our ability to conduct our business.
Our acquisitions expose us to new regulatory requirements. For example, our acquisitions of Ellie Mae, Inc., or Ellie Mae, in 2020 and Black Knight in 2023 expose us to increased regulatory scrutiny from U.S. regulatory bodies that regulate the U.S. residential mortgage industry, including the FFIEC and its member agencies, and the CFPB, among others. Compliance with any such regulatory requirements increases our regulatory burden and gives rise to costs and expenses that may be material.
Our regulators have broad enforcement powers to censure, fine, issue cease-and-desist orders, embargo future business activity or prohibit us from engaging in some of our businesses. We continue to face the risk of significant intervention by regulatory authorities, including extensive examination and surveillance of our business. Any enforcement matters by regulators may result in material adverse consequences to our financial condition, operating results or ability to conduct our business, including adverse judgments, settlements, fines, penalties, injunctions, restrictions on our business activities or other relief. Our involvement in any such matters, even if the matters are ultimately determined to be in our favor, could also cause significant harm to our reputation and divert management attention from the operation of our business. Further, any settlement, consent order or adverse judgment in connection with any formal or informal proceeding or investigation by government or regulatory agencies may result in additional litigation, investigations or proceedings as other litigants and government or regulatory agencies begin independent reviews of the same businesses or activities. Finally, the implementation of new legislation or regulations, or changes in or unfavorable interpretations of existing regulations by courts or regulatory bodies, could require us to incur significant compliance costs and impede our ability to remain competitive and grow our business.
Regulatory developments or court rulings may have an adverse impact on our ability to derive revenue from market and mortgage data and technology and connectivity fees.
Regulatory developments or court rulings could reduce the amount of revenue that we obtain from exchange market data and connectivity fees related to our U.S. equity and options exchanges, and from mortgage data related to our mortgage technology businesses. With respect to our U.S. equities and equity options exchanges, our ability to assess fees for market data products and certain connectivity fees are subject to review by the SEC. There continue to be opposing industry viewpoints as to the extent that our U.S. equities and equity options exchanges should be able to charge for market data and market access, and the manner in which we set such exchange fees could be reassessed.
If new constraints are placed on our ability to charge for market data, mortgage data or market access in the U.S., it could have a negative impact on our revenues. We cannot predict whether, or in what form, any regulatory or other changes will take effect or their impact on our business. A determination by the SEC or a court, for example, that the SEC must link market data fees to marginal costs, take a more active role in the market data rate-setting process, or reduce the current levels of market data fees, could have an adverse effect on our market data revenues. Furthermore, there could also be an adverse effect on our mortgage data revenues if our use of such data were restricted through regulation.
Separately, our European exchanges are currently authorized to sell trade information on a non-discriminatory basis at a reasonable cost. This regulatory position could be modified or interpreted by the European Commission or future European court decisions in a manner that could have an adverse effect on our European market data revenues.
In addition, the FCA and IOSCO have both issued consultations to explore access to market data in financial markets. The results of these consultations may lead to a regulatory response that could affect our business. Similar to the U.S., if new constraints are placed on our ability to charge for market data or market access in the U.K. or other jurisdictions, it could have a negative impact on our revenues.
Ongoing impacts and uncertainty following the U.K.'s exit from the EU, commonly referred to as Brexit, could adversely impact our business, results of operations and financial condition.
The long-term effects of Brexit will depend, in part, on the agreement the U.K. made to retain access to EU markets, and whether the EU and U.K. continue to implement regulatory proposals related to the provision of financial services and the administration of benchmarks and indices in the EU and U.K. Following Brexit, matters of access in financial services are left to be addressed through declarations of equivalence under existing equivalence regimes contained in U.K. and EU law and through domestic laws. In February 2022, the European Commission extended its temporary equivalence decision for U.K. CCPs until June 30, 2025. ICE Clear Europe has been recognized by ESMA as a third-country CCP in accordance with EMIR and in March 2022, ESMA extended ICE Clear Europe's temporary recognition and tiering decision to June 2025. In January 2025, the European Union proposed to extend the equivalence decision for UK CCPs until June 30, 2028. In the absence of an extension of the temporary equivalence or permanent equivalence of U.K. CCPs by the European Commission, EU persons would be restricted in accessing clearing services at ICE Clear Europe, which could impact clearing revenues, and could also cause us to change our business practices, restructure our businesses or move certain of our businesses and employees.
In June 2023, the FSMA 2023 was enacted, which makes significant changes to U.K. financial services regulation and incorporates considerations of the HM Treasury's March 2022 Wholesale Markets Review. The FSMA 2023 expands the U.K.’s existing resolution regime for CCPs and enables the BOE to take full control of a CCP when necessary without relying on its existing powers, and permits the BOE to use a number of tools without reliance on the CCP’s rulebook.
As a result of the U.K. and EU trade and cooperation agreement not providing free trade arrangements for financial services, any equivalence determinations or any further transition period for financial services could include restrictions on access to our services by persons located in the EU or make access more expensive, which could adversely affect our operations and profitability or even make it uneconomical for us to continue to conduct all or certain of our businesses in such jurisdictions. The consequences of Brexit and the terms of the trade and cooperation agreement could also cause us to incur significant costs associated with changing our business practices, restructuring our businesses or moving certain of our businesses and our employees to other jurisdictions. See Item 1 “- Business - Regulation” above for additional information regarding Brexit, including risks to our business associated with Brexit.
Risks relating to the administration of benchmarks and indices, and changes to, cessations of and the replacement of, or transition from, benchmarks and indices may result in legal risks and could adversely affect our business.
Certain of our subsidiaries administer, produce and license a variety of benchmarks and indices across multiple asset classes, which are used globally and are referenced in certain of our trading and clearing products. To ensure continued trading and clearing in these benchmark-related products, and the continued licensing and use of these benchmarks and indices, our subsidiaries must be able to demonstrate that these benchmarks and indices are determined with integrity and are not readily subject to manipulation. Our subsidiaries must also continue to evolve these benchmarks and indices as necessary to maintain their reliability and relevance, and continue to administer, produce and license these benchmarks and indices in compliance with applicable laws and regulations. Any failures, negative publicity or lawsuits related to our subsidiaries' administration of benchmarks and indices could result in a loss of confidence in the administration of these benchmarks and indices and could harm our business and our reputation.
Changes to, cessations of, and the replacement of or transition from, our subsidiaries' benchmarks and indices or any other changes or reforms to the determination or administration of such benchmarks and indices, could result in legal risks
or risks to our reputation, and could have an adverse impact on our business, financial condition and operating results. Our subsidiary, IBA, administers various globally important benchmarks, including ICE Swap Rate. IBA was the administrator of LIBOR until the cessation of the benchmark at the end of September 2024. As a “critical” benchmark, LIBOR was subject to a wind-down prior to its ultimate cessation, which included a period during which IBA was compelled by the FCA to continue to publish certain LIBOR settings under a changed "synthetic" methodology. Any LIBOR settings published under a “synthetic” methodology were not representative of the underlying market or economic reality such settings were intended to measure prior to the period of compulsion.
On November 13, 2024, ICE Swap Rate was designated as a “critical” benchmark, and, as a result, administration of the benchmark is subject to additional obligations under the UK Benchmark Regulation. These include the ability of the FCA to compel continued administration of ICE Swap Rate for up to 10 years if the administrator intends to cease providing the benchmark, to impose changes in the way the benchmark is determined if the FCA believes the benchmark is unrepresentative or its representativeness is at risk and to apply prohibitions and restrictions on the use of the benchmark in certain circumstances.
Any failures, negative publicity or lawsuits related to IBA’s administration of LIBOR, including during the period of “synthetic” LIBOR, or ICE Swap Rate, could result in a loss of confidence in our subsidiaries’ administration of benchmarks and indices and could harm our business and our reputation.
Benchmarks administered by our subsidiaries outside of the EU may continue to be used by supervised entities in the EU under transitional provisions of the EU Benchmarks Regulation until December 31, 2025, after which time those subsidiaries, as administrators of "third-country" benchmarks, will need to utilize one of the mechanisms provided under that regulation in order for EU-supervised entities to continue to use their third-country benchmarks. To the extent our subsidiaries are unable to utilize one of those mechanisms for any reason once transitional provisions end, there is a risk that EU-supervised entities will not be able to continue to license and use their benchmarks, which could harm our business and our reputation.
In addition, certain authorities, including those in the U.S., the U.K. and the EU, have issued consultations to gather feedback on index provider businesses or are undertaking reviews of current regulations. The results of these consultations or reviews may lead to a regulatory response that could affect our business. Additional regulation on index providers in the U.S., U.K., EU or other jurisdictions, could have a negative impact on our revenues.
We may face liability for content contained in our data products and services.
We have been, and may in the future be, subject to claims for breach of contract, defamation, libel, copyright or trademark infringement, fraud or negligence or based on other theories of liability, in each case relating to the data, articles, commentary, ratings, information or other content we distribute in our financial data services. If such data or other content or information that we distribute has errors, is delayed or has design defects, we could be subject to liability or our reputation could suffer. We could also be subject to claims based upon the content that is accessible from our corporate website or those websites that we own and operate through links to other websites. Use of our products and services as part of the investment process creates the risk that clients, or the parties whose assets are managed by our clients, may pursue claims against us for significant amounts. Any such claim, even if the outcome were ultimately favorable to us, could involve a significant commitment of our management, personnel, financial and other resources. Such claims and lawsuits could have a material adverse effect on our business, financial condition and operating results and a negative impact on our reputation.
In addition, we license and redistribute data and content from various third-party sources and the terms of these licenses change frequently. Our third-party data and content suppliers may audit our use of and our clients’ use of and payment for data and content from time to time in the ordinary course of business, including audits currently underway. Such third-party data and content suppliers have asserted and may in the future assert that we or our clients owe additional amounts under the terms of the applicable license agreements, that we inappropriately distributed the third-party data or that we or our clients used the data or content in a manner that exceeded the scope of the applicable license agreement or without a license agreement. In some instances, where we have certain commercial relationships with third parties, we have assumed the responsibility for this third-party source liability. We have and expect to continue to spend and allocate resources to develop and acquire the use of technology and other intellectual property rights to manage these risks and track third-party data usage, but we cannot be assured that we will not incur liability. The costs and resources required to investigate any allegations could be material, and we may still be required to pay damages to or make unexpected large settlement payments to these data and content suppliers, which could also give rise to reputational harm.
We are subject to significant litigation and liability risks, including enforcement actions by our regulators.
Many aspects of our business, and the businesses of our market participants and data and mortgage technology customers, involve substantial risks of liability. These risks include, among others, potential liability from disputes over terms of a trade and the claim that a system failure or delay caused monetary loss to a participant or that an unauthorized trade occurred. For example, dissatisfied market participants that have traded on our electronic platforms or those on whose behalf such participants have traded may make claims regarding the quality of trade execution, or allege improperly confirmed or settled trades, abusive trading practices, security and confidentiality breaches, mismanagement or even fraud against us or our participants. In addition, because of the ease and speed with which sizable trades can be executed on our electronic platform, participants can lose substantial amounts by inadvertently entering trade orders or by entering them inaccurately. A large number of significant error trades could result in participant dissatisfaction and a decline in participant willingness to trade in our electronic markets. Matters relating to such trading events can also result in reviews, inspections, examinations and investigations by our regulators, any of which may result in claims, legal proceedings, assessments, fines, penalties, restrictions on our business or other sanctions.
In addition, we are subject to legal disputes that could result in the payment of fines, penalties or damages and could expose us to additional liability in the future. See Item 3 "Legal Proceedings" in this Annual Report for a general description of our legal proceedings and claims and Note 16 to our consolidated financial statements and related notes, which are included elsewhere in this Annual Report, for a summary of specific legal proceedings. The outcome of any of these legal proceedings that remain unresolved cannot be determined and adverse rulings in these matters could impact our financial condition and continued operations.
Further, we have incurred significant expenses defending the claims mentioned above and will likely incur significant expenses defending any future claims, even those without merit. An adverse resolution of any lawsuit or claim against us, including those we are involved with due to acquisition activity, has in the past required, and may in the future require, us to pay substantial damages or impose restrictions on how we conduct business, either of which could adversely affect our business, financial condition and operating results. In addition, from time to time we are required to establish accruals for those matters in circumstances when a loss contingency is considered probable and the related amount is reasonably estimable. Any such accruals may be adjusted as circumstances change.
OPERATIONAL AND LIQUIDITY
Our systems and those of our third-party service providers are vulnerable to cyberattacks, hacking and other cybersecurity risks, which could result in wrongful manipulation, disclosure, destruction, or use of our information or that of a third party, or which could make our customers unable or reluctant to use our electronic platforms or other products and services.
The secure transmission of confidential information and the ability to reliably transact on our electronic platforms and provide financial data services are critical elements of our operations. Some of our products and services involve the storage and transmission of proprietary information and sensitive or confidential client and other data, including client portfolio information or personally identifiable information. If anyone gains improper access to our electronic platforms, networks or databases, they may be able to steal, publish, delete or modify our confidential information or that of a third party. Breaches of our cybersecurity measures or the accidental loss, inadvertent disclosure or unapproved dissemination of proprietary information or sensitive or confidential data about us, our clients or our customers, including the potential loss or disclosure of such information or data could expose us, our customers or the individuals affected to a risk of loss or misuse of this information, resulting in litigation, regulatory action and potential liability for us, damaging our brand and reputation or otherwise harming our business. Our networks and those of our customers, third-party service providers and external market infrastructures may be vulnerable to compromise, unauthorized access, security technology failure, malware, social engineering, denial of service attacks, terrorism, ransomware attacks, supply chain attacks, firewall or encryption failures or other security problems resulting in loss of data integrity, information disclosure, unavailability or fraud. The financial services industry has been targeted for purposes of political protest, activism and financial gain and our role in the global marketplace places us at greater risk than other public companies for cyberattack and other information security threats. Further, former employees of companies in the financial sector have misappropriated trade secrets or stolen source code in the past and we could be a target for such illegal acts in the future. There also may be system or network disruptions if new or upgraded systems are defective or not tested and installed properly.
Although we have not been subject to cyberattacks or other cyber incidents that have had a material impact on our operations or financial condition, we have from time to time experienced cybersecurity events including distributed denial of service, or DDoS, attacks, malware infections, phishing, web attacks, zero day and/or emerging vulnerabilities with known exploits and other information technology incidents that are typical for a financial services company of our size. For example, although not material, we experienced DDoS attempts, brand misuse, and phishing attempts directed toward
employee systems and employee email accounts during 2024. While we operate an Information Security program that is designed to prevent, detect, track and mitigate cyber incidents and that has detected and mitigated such incidents in the past, we cannot assure you that these measures will be sufficient to protect our business against future attacks. Any such attacks could result in reputational damage, cause system failures or delays that could cause us to lose customers, cause us to experience lower current and future trading volumes or incur significant liabilities or have a negative impact on our competitive position. In addition, given the increasing complexity and sophistication of the techniques used to obtain unauthorized access or disable or degrade systems, a cyberattack could occur and persist for an extended period of time before being detected, and we may not anticipate these acts or respond adequately or timely. The extent of a particular cyber incident and the steps that we may need to take to investigate the incident may not be immediately clear, and it may take a significant amount of time before such investigation can be completed and full and reliable information about the incident is known. While such an investigation is ongoing, we may not necessarily know the extent of the harm or how best to remediate it, which may compound damages before the incident is discovered or remediated. Additionally, as threats continue to evolve and increase, and as the regulatory environment and regulations related to information security, disclosure of cyberattacks, data collection and use, and privacy becomes increasingly rigorous, we may be required to devote significant additional resources to modify and enhance our security controls and to identify, remediate and disclose any security vulnerabilities, which could adversely impact our net income.
Further, cybersecurity threats to, and incidents involving, vendors and other third parties who support our activities - particularly those with less-sophisticated defenses - could impact us.
Our business has in the past been, and may in the future be, harmed by computer and communication systems failures and delays.
Our business depends on the integrity, reliability and security of our infrastructure which is highly dependent on our and our third-party providers’ computer and communication systems. Our customers rely on us for the delivery of time-sensitive, up-to-date and high-quality financial market data, analytics and related solutions. Our timely, reliable delivery of high-quality products and services is dependent upon an array of technical production processes that enable our content delivery platforms. Our and our third-party providers’ redundant systems or disaster recovery plans, including our and our third-party providers’ ability to recover from the loss of one of our primary data centers, may prove to be inadequate in the event of a systems failure or cybersecurity breach. Our systems, or those of our third-party providers, may fail or be shut down or, due to capacity constraints, may operate slowly, causing one or more of the following or other issues:
• unanticipated disruption in service to our participants;
• slower response time and delays in our participants’ trade execution and processing;
• failed settlement by participants to whom we provide trade confirmation or clearing services;
• incomplete or inaccurate accounting, recording or processing of trades;
• failure to complete the clearing house margin settlement process resulting in significant financial risk;
• distribution of inaccurate or untimely market data;
• disruption to ICE Mortgage Technology and our loan origination and servicing systems; and
• financial loss to us or those who depend on our systems and data.
For example, our business was impacted by the CrowdStrike outage in July 2024, and although impact to us from the outage was limited in scope and not material, we cannot make assurances that we will not experience future events that may be material.
We have experienced system failures in the past due to telecommunication failures and hardware and software malfunctions and defects, and could experience future system failures due to power or telecommunications failures, human error on our part or on the part of our vendors or participants, natural disasters, fire, sabotage, hardware or software malfunctions or defects, computer viruses, cyberattacks, intentional acts of vandalism or terrorism and similar events. For example, on June 3, 2024, a defect in a new software release by NYSE subsidiary Securities Industry Automation Corporation, or SIAC, caused incorrect calculation of industry-wide trade price bands in certain securities symbols, leading to trades occurring at incorrect prices that were required to be reversed, the triggering of trading pauses based on the incorrect trade price bands, and member claims paid by the NYSE exchanges under their rules (in combination with SIAC) related to the same. NYSE and/or SIAC may also potentially be subject to additional claims from the SEC or other third parties as a result of this event. This event, and other system issues in the future, could result in damage to our business reputation and user dissatisfaction with our electronic platforms or technology services, which could prompt participants to trade elsewhere, use other technology vendors, and/or expose us to litigation or regulatory sanctions. As a consequence, our business, financial condition and operating results could suffer materially.
Our regulated business operations generally require that our trade execution and communications systems be able to handle anticipated present and future peak trading volume. Heavy use of computer systems during peak trading times or at times of unusual market volatility could exceed our available capacity based on estimated future trading volumes and cause those systems to operate slowly or even to fail for periods of time. If we cannot increase the capacity and capabilities of our systems to accommodate an increasing volume of transactions and to execute our business strategy, our ability to maintain or expand our businesses could be adversely affected.
An interruption or cessation of an important service, data or content supplied by any third party, or the loss of an exclusive license, could have a material adverse effect on our business.
We depend on a number of suppliers, such as online service providers, hosting service and software providers, data processors, data centers, software and hardware vendors, banks, local and regional utility providers, and telecommunications companies for elements of our trading, clearing, data services, mortgage technology applications and other systems. We rely on access to certain data used in our business through licenses with third parties, and we rely on a large international telecommunications company for the provision of hosting services. We also depend on third-party suppliers for data and content, including data received from certain competitors, clients, various government and public record services and financial institutions, used in our products and services. Some of this data is exclusive to particular suppliers and may not be obtained from other suppliers. In addition, our data suppliers could enter into exclusive contracts with our competitors without our knowledge. The general trend toward industry consolidation increases the risk that these services may not be available to us in the future. If these companies were to experience difficulties, discontinue providing services to us for any reason or be unable to or fail to provide the type of service agreed to for any reason, we would likely experience significant disruption to our business and may be subject to litigation by our clients, increased regulatory scrutiny or regulatory fines or damage to our reputation. It could require a significant amount of time and additional resources to transition to new third-party service providers or to enter into new commercial arrangements in order to offset loss of services to our clients. Our third-party data suppliers perform audits on us from time to time in the ordinary course of business to determine if data we license for use in our products and services or for redistribution has been properly accounted for in accordance with the terms of the applicable license agreement. As a result of these audits, we have incurred and may in the future incur additional expenses.
Many of our clients also rely on third parties to provide them with systems necessary to access our trading platform. If these companies were to discontinue providing services to our clients for any reason, we may experience a loss of revenue associated with our clients’ inability to transact with our businesses. We hold exclusive licenses to list various index futures and options contracts. In the future, litigation or regulatory action may limit the right of owners to grant exclusive licenses for index futures and options contracts trading to a single exchange, and our competitors may succeed in providing economically similar products in a manner or jurisdiction not otherwise covered by our exclusive license. MiFID II introduced a harmonized approach to the licensing of benchmarks in Europe and the legislation requires non-discriminatory access to any benchmarks registered in Europe. If unlicensed trading of any index product where we hold an exclusive license were permitted, we could lose trading volume for these products which would adversely affect our revenues associated with the license and the related index products.
Our emerging technology initiatives under development and the use of artificial intelligence in certain of our existing products may be unsuccessful and may give rise to various risks, which could adversely affect our business, reputation or operating results.
Our financial performance depends, in part, on our ability to develop and market new and innovative services and to adopt or develop new technologies that differentiate our products or provide cost efficiencies, while avoiding increased related expenses. Our adoption of emerging technologies, including artificial intelligence and machine learning tools, poses both risk of displacement and opportunity for innovation. As artificial intelligence is a new and evolving technology in the early stages of commercial use, there are significant risks involved in the development and deployment of artificial intelligence. Moreover, there can be no assurance that the use of artificial intelligence will enhance our products or services or augment our business or operating results. Market acceptance of artificial intelligence technologies is uncertain, and we may be unsuccessful in our product development efforts. Our artificial intelligence-related product initiatives and offerings, or use in our internal business operations, may give rise to risks related to accuracy, bias, discrimination, intellectual property infringement, misappropriation or leakage, defamation, data privacy and cybersecurity, among others. We are also exposed to risks related to the use of artificial intelligence technologies by third-party vendors, clients and other financial intermediaries. In addition, the use of such technologies is governed by an evolving set of laws and regulations, and there is no single global regulatory framework for artificial intelligence, which creates further uncertainties regarding compliance with such laws and regulations. As a result, our ability to leverage artificial intelligence could be restricted by burdensome and costly legal requirements. The use of artificial intelligence may also give rise to ethical concerns or negative public perceptions, which may cause brand or reputational harm. Additionally, our existing competitors or new entrants may be developing their own artificial intelligence products and technologies, which may be superior in features
or functionality, or cost, to our offerings, or could negatively impact our business by causing our clients to rely less on our products and services. Any of these factors could adversely affect our business, reputation or operating results.
Our success largely depends on key personnel, including our senior management, and having adequate succession plans in place. We may not be able to attract, retain and develop the highly skilled employees we need to support our business, which could harm our business.
Our future performance depends, in large part, on the continued services of our senior management and other key personnel, including our ability to attract, retain and motivate key personnel. Competition for key personnel in the various localities and business segments in which we operate is intense. Our ability to attract and retain key personnel, in particular senior management, will be dependent on a number of factors, including prevailing market conditions and compensation packages offered by companies competing for the same talent. Current economic, market, social, and political conditions and demand for hybrid working options have increased talent risk, which has led to higher employee attrition and made recruitment for certain positions more difficult, and could lead to a loss of top performers and make it more difficult to fill key positions. For example, our in-office requirements, as well as the location of our offices, and our remote working arrangements may not meet the needs or expectations of our employees, including senior management or other key employees, or may not be viewed as competitive, which could negatively impact our ability to attract and retain highly skilled employees. In addition, we operate globally and geopolitical events or conflicts in the countries or regions in which we operate could lead to physical risks to our personnel and disruption to business continuity that could negatively impact our ability to execute our business strategy. There is no guarantee that we will have the continued service of key employees who we rely upon to execute our business strategy and identify and pursue strategic opportunities and initiatives. The loss of the services of any of our senior management or other key personnel, or our inability to attract highly qualified senior management and other key personnel, could harm our business. In particular, we have to incur costs to replace senior officers or other key employees who leave, and our ability to execute our business strategy could be impaired if we are unable to replace such persons in a timely manner or at all.
Effective succession planning is also important to our long-term success. Failure to ensure effective transfer of knowledge and smooth transitions involving key employees and board members could hinder our strategic planning and execution. Further, changes in our management team may be disruptive to our business, and any failure to successfully integrate key new hires or promoted employees could adversely affect our business and results of operations.
We currently have a substantial amount of outstanding indebtedness which could adversely affect our financial condition and operations and restrict our activities or our ability to satisfy our debt service obligations.
As of December 31, 2024, we had $20.4 billion of outstanding debt, inclusive of approximately $19.8 billion of senior notes and approximately $529 million of commercial paper. This level of indebtedness could have important consequences to our business, including making it more difficult to satisfy our debt service obligations, increasing our vulnerability to general adverse economic and industry conditions, limiting our flexibility in planning for, or reacting to, changes in our business and the industry in which we operate, and placing us at a competitive disadvantage compared to our peers. In addition, the terms of our debt facilities contain affirmative and negative covenants, including a leverage ratio test and certain limitations on the incurrence of additional debt or the creation of liens and other matters. Further, a portion of our outstanding debt has historically been and may continue to be in commercial paper, which is subject to interest rate changes. Rising interest rates will result in an increase in our interest expense. We may incur additional indebtedness in the future, which could materially affect our financial condition.
Our long-term and short-term debt is currently rated by Moody’s Ratings and S&P Global Ratings. These ratings agencies regularly evaluate us and our credit ratings based on a number of quantitative and qualitative factors, including our financial strength and conditions affecting the financial services industry, generally. Our credit ratings remain subject to change at any time, and it is possible that a ratings agency may take action to downgrade our credit ratings in the future. A downgrade of our credit ratings in the future could impact customers’ willingness to use our clearing houses, make parties less willing to do business with us, and could negatively impact our ability to access the capital markets and increase the cost of our commercial paper and any future debt funding we may obtain.
COMPETITION AND REPUTATIONAL HARM
We face intense competition, and if we fail to keep up with rapid changes in technology and client preferences, it could negatively impact our competitive position.
We face intense competition in all aspects of our business and our competitors, both domestic and international, are numerous. We currently compete with:
• regulated, diversified futures exchanges that offer trading in a variety of asset classes similar to those offered by us, such as energy, agriculture, equity and equity index, credit, and interest rate derivatives markets and foreign exchange;
• exchanges offering listing and trading of cash equities, ETFs, closed-end funds and other structured products similar to those offered by us;
• market and mortgage data and information vendors, and financial firm consortia and single financial institutions selling such data and information;
• providers of digital solutions for the U.S. residential mortgage industry, including technology providers for loan origination, closing solutions and other ancillary solutions, and loan servicing;
• interdealer brokers active in the global credit derivatives markets;
• existing and newly formed electronic trading platforms, service providers and exchanges, some of which may utilize block chain technology or do not receive the same regulatory scrutiny as established market places;
• other clearing houses; and
• consortia of our customers, members or market participants that may work together to achieve more favorable terms or pool their trading activity to establish new exchanges, trading platforms or clearing facilities.
Trends towards the globalization of capital markets have resulted in greater mobility of capital, greater international participation in markets and increased competition among markets in different geographical areas. Competition in the market for derivatives trading and clearing and in the market for cash equity listings, trading and execution have intensified as a result of consolidation, as the markets become more global in connection with the increase in electronic trading platforms and the desire by existing exchanges to diversify their product offerings. Finally, many of our competitors are our largest customers or are owned by our customers and may prioritize their internalization and ATS businesses ahead of their exchange-based market making business. Some of our competitors may have greater capital and resources, offer a wide range of products and services or operate under less stringent regulatory regimes than we do.
In the mortgage technology sector, we compete against other technology providers for loan origination, closing solutions, and loan servicing, as well as the many ancillary products and services we offer to the U.S. residential mortgage industry. We also compete with traditional methods of exchanging data and documents among mortgage industry participants, such as email, facsimile, phone, courier, and mail. There is vigorous competition among providers of mortgage technology services, and we may be unsuccessful in differentiating our services to the extent necessary to effectively compete and may not succeed in convincing potential customers using other services or methods to switch to ours.
We also face pricing competition in many areas of our business. A decline in our fees due to competitive pressure or regulatory changes, the inability to successfully launch new products or the loss of customers due to competition could lower our revenues, which would adversely affect our profitability. For example, our data service offerings have benefited from a high renewal rate in its subscription-based services, but we cannot assure you that this will continue. We also cannot assure you that we will be able to continue to expand our product offerings, modify the pricing for our products or retain our current customers or attract new customers. If we are not able to compete successfully, our business could be materially impacted, including our ability to remain as an operating entity.
Our success depends on our ability to maintain and expand our product offerings, our customer base and our technology. To remain competitive, we must continue to enhance and improve the responsiveness, functionality, accessibility and reliability of our electronic platforms and our proprietary and acquired technology. The financial services industry is characterized by rapid technological change, change in use patterns, change in client preferences, frequent product and service introductions, the emergence of new industry standards and practices and increased consolidation through mergers and acquisitions activity that results in new competitors or expanded product offerings by current competitors. For example, financial institutions are investing significantly in new technologies involving artificial intelligence and machine learning to deliver solutions at lower prices, more efficiently or more conveniently. The development and use of these types of new technologies and other industry changes could render our existing proprietary technology or product offerings or services uncompetitive or obsolete.
We cannot assure you that we will successfully implement new technologies or adapt our proprietary technology, product offerings or services to our clients’ requirements or emerging industry standards in a timely and cost-effective manner. Any failure to remain abreast of industry standards in technology and to be responsive to client preferences could cause our market share to decline and negatively impact our results.
Damage to our reputation could damage our business.
Our business is highly competitive and our customers have options on where to conduct their business. Our management team and business operations benefit from being highly regarded in our industry. Maintaining our reputation is critical to attracting and retaining customers and investors and for maintaining our relationships with our regulators. Negative publicity regarding our company, especially given the speed with which false information can spread through social media channels, or actual, alleged or perceived issues regarding our products or services, operations, risk management, compliance with regulations, political affiliations or management team could give rise to reputational risk which could significantly harm our existing business and business prospects.
MERGERS & ACQUISITIONS AND COMMON STOCK
We may fail to realize the anticipated cost savings, growth opportunities and synergies and other benefits anticipated from our past or future acquisitions and strategic investments, which could adversely affect our business and the value of our common stock.
We have completed many acquisitions, and we expect to continue to pursue acquisitions and joint ventures. The success of our acquisitions will depend, in part, on our ability to integrate these businesses and realize anticipated cost savings, revenue synergies and growth opportunities. We generally set aggressive timelines for realizing savings, which assumes we successfully undertake a variety of actions (including, but not limited to, integrating technology, eliminating redundancies and effecting organizational restructurings) that are themselves subject to a variety of risks and may be subject to regulatory approvals that we do not control. The process of integrating acquired companies is time-consuming and could disrupt each company’s ongoing businesses, produce unforeseen regulatory and operating difficulties (including inconsistencies in standards, controls, procedures and policies that adversely affect relationships with market participants, regulators and others), require substantial resources and expenditures and divert the attention of management from the ongoing operation of the business.
There is also a risk that we may not integrate these acquired companies in a manner that permits our expected cost savings and revenue synergies to be fully realized in the time periods expected, or at all. In addition, a variety of factors, including but not limited to regulatory conditions, governmental competition approvals, cultural differences and difficulty integrating technology platforms, may adversely affect our ability to complete our acquisitions or realize our anticipated cost savings and synergies. For example, our acquisition of Black Knight closed in September 2023, and we are continuing to integrate the business of Black Knight into the ICE Mortgage Technology business as we pursue expected cost savings and revenue synergies from the acquisition. In addition, following the completion of the acquisition of Black Knight, we continue to be subject to periodic reviews by the Federal Trade Commission, or FTC, under the Consent Order we entered into with the FTC, and we are required to certify that we are in compliance with the restrictions contained in the Consent Order. If we are not able to successfully achieve our objectives from the Black Knight merger within the anticipated time frame, or at all, the anticipated benefits may not be realized fully or at all, may take longer to realize than expected, and our business or stock price may be adversely affected.
We also may not realize anticipated growth opportunities and other benefits from strategic investments or strategic joint ventures or alliances that we have entered into or may enter into for a number of reasons, including decline in value of the other company, regulatory or government approvals or changes, global market changes, contractual obligations, competing products and, in some instances, our lack of or limited control over the management of the business. Further, strategic initiatives that have historically been successful may not continue to be successful due to competitive threats, changing market conditions or the inability for the parties to extend the relationship into the future.
As a result of any future acquisition, we may issue additional shares of our common stock that dilute our stockholders’ ownership interest, expend cash, incur debt, assume actual and contingent liabilities, inherit existing or pending litigation or create additional expenses related to amortizing intangible assets. Further, we cannot assure you that any such financing or equity investments will be available with terms that will be favorable to us, or available at all.
We are a holding company and depend on our subsidiaries for dividends, distributions and other payments.
We are a legal entity separate and distinct from our operating subsidiaries. Our principal source of cash flow, including cash flow to pay dividends to our stockholders, principal and interest on our outstanding debt or repurchase shares of our common stock, is dividends from our subsidiaries. There are statutory and regulatory limitations on the payment of dividends by certain of our subsidiaries to us. If our subsidiaries are unable to make dividend payments to us and sufficient cash or liquidity is not otherwise available, we may not be able to make dividend payments to our stockholders, principal and interest payments on our outstanding debt or repurchase shares of our common stock, which could have a material adverse effect on our business, financial condition and operating results.
Provisions of our organizational documents and Delaware law may delay or deter a change of control of ICE.
Our organizational documents contain provisions that may have the effect of discouraging, delaying or preventing a change of control of, or unsolicited acquisition proposals for, ICE. These provisions make a change of control less likely, which may be contrary to the desires of certain of our stockholders. Many of these provisions are required by relevant regulators in connection with our ownership and operation of U.S. and European equity exchanges. For example, our organizational documents include provisions that generally restrict any person (either alone or together with its related persons) from (i) voting or causing the voting of shares of stock representing more than 10% of our outstanding voting capital stock (including as a result of any agreement by any other persons not to vote shares of stock) or (ii) beneficially owning shares of stock representing more than 20% of the outstanding shares of any class or series of our capital stock. Further, our organizational documents generally limit the ability of stockholders to act by written consent, and generally authorize our Board of Directors, without stockholder approval, to issue and fix the rights and preferences of one or more series of preferred stock. In addition, provisions of Delaware law may have a similar effect, such as provisions limiting the ability of certain interested stockholders, as defined under Delaware law, from causing the merger or acquisition of a corporation against the wishes of the Board of Directors.
INTELLECTUAL PROPERTY
Our use of "open source" software could negatively impact our ability to sell our products and services and subject us to litigation.
We use some open-source software in our technology, most often as small components within a larger product or service, to augment algorithms, functionalities or libraries we create, and we may use more open-source software in the future. Open-source code is also contained in some third-party software we rely on. We could be subject to suits by parties claiming breach of the terms of the license for such open-source software. The terms of many open-source licenses are ambiguous and have not been interpreted by U.S. or other courts, and these licenses could be construed in a manner that imposes unanticipated conditions or restrictions on our ability to commercialize our products and services. Further, open-source licensors generally do not provide technology support, maintenance, warranties or assurance of title or controls on the origin of the software, which can also lead to greater risks than use of third-party commercial software.
A failure to protect our intellectual property rights, or allegations that we have infringed the intellectual property rights of others, could adversely affect our business.
Our business is dependent on proprietary technology and other intellectual property that we own or license from third parties, including trademarks, service marks, trade names, trade secrets, copyrights and patents. We cannot assure you that the steps that we have taken or will take in the future will prevent misappropriation of our intellectual property. Certain artificial intelligence technology may give rise to increased intellectual property risks, such as compromises to proprietary intellectual property and intellectual property infringement. We may be unable to detect the misappropriation or unauthorized use of our confidential information and intellectual property. Our failure to adequately protect our intellectual property could harm our reputation and affect our ability to compete effectively. Further, we have resorted to litigation to enforce our intellectual property rights in the past, and may need to do so in the future, which requires significant financial and managerial resources.
In addition, our competitors, as well as other companies and individuals, have obtained, and may obtain in the future, intellectual property rights, including patents, related to the types of products and services we offer or plan to offer. We cannot assure you that we are or will be aware of all intellectual property rights that may pose a risk of infringement by our products and services. As a result, we have in the past faced and may in the future face allegations that we have infringed the intellectual property rights of third parties which may be costly for us to defend against. If one or more of our products or services is found to infringe intellectual property rights held by others, we may be subject to lawsuits or required to stop developing or marketing the products or services, obtain licenses to develop and market the products or services from the owners of the intellectual property or redesign the products or services in such a way as to avoid infringing the third-party intellectual property. We also have in the past, and could in the future, be required to pay damages if we are found to infringe intellectual property rights held by others, which could materially adversely affect our business, financial condition and operating results. We cannot assess the extent to which we may be required in the future to obtain licenses with respect to intellectual property rights held by others, whether such licenses would be available or, if available, whether we would be able to obtain such licenses on commercially reasonable terms. If we were unable to obtain such licenses, we may not be able to redesign our products or services at a reasonable cost to avoid infringement, which could materially adversely affect our business, financial condition and operating results.
ITEM 1 (B). UNRESOLVED STAFF COMMENTS
None.
ITEM 1 (C). CYBERSECURITY
Our business activities rely extensively on technology and software, including the systems used by our business partners, regulators and customers. In addition, our activities involve the use and retention of confidential data and information. These activities make us susceptible to cyberattacks. We employ the following activities, processes and strategies to help evaluate, manage and address these risks.
•Strategy: We maintain a Cybersecurity Strategy, or CSS, which emphasizes consideration of the nature of our business, ongoing intelligence collection regarding cybersecurity threats, and initiatives to specifically address prominent areas of cybersecurity risk. The CSS outlines the key priorities for our cybersecurity program and the methods by which our Information Security department seeks to accomplish those goals.
•Governance and Leadership: Our Board of Directors is responsible for overseeing ICE’s risk management process, which includes management of general risks as well as specific risks, such as those relating to cybersecurity, facing our business. The Risk Committee of our Board of Directors has been delegated the primary responsibility for overseeing management’s identification and mitigation of cybersecurity risk. The Risk Committee is composed of board members with diverse expertise including cybersecurity, risk management, technology, business operations, regulatory and finance. The Risk Committee receives presentations on at least a quarterly basis from our Chief Information Security Officer, or CISO, and senior members of the Enterprise Risk Management, or ERM, team, and the Chair of the Risk Committee provides reports to the full Board of Directors following such presentations. Our Information Security department is led by our CISO, who, in addition to quarterly presentations to the Risk Committee of our Board of Directors, also provides comprehensive reports to a dedicated internal governance committee at least quarterly outlining threat assessment, control performance, and ongoing enhancements. Our current CISO has served in the role since September 2021 and leads the cybersecurity program across our regulated futures and options exchanges, CCPs, trade repositories, equities venues, systemically important financial market utilities (SIFMUs) and our data services network and mortgage technology platforms. Prior to joining ICE, our CISO served as CISO of the White House Military Office and as CISO for two technology companies, and has more than 20 years of experience in cybersecurity, national security, and intelligence. Additionally, cybersecurity matters are reported to and discussed with a cross-subsidiary leadership committee and subsidiary boards. The Cyber Threat Intelligence team monitors multiple cybersecurity intelligence feeds and curates the applicable data. In the event we identify a cybersecurity threat applicable to us, we have a process to evaluate, escalate to Senior Management and respond to the threat faced. In addition, our CISO and other senior security leaders conduct periodic cybersecurity education sessions with our employees and directors. These sessions cover general cybersecurity topics as well as specific details regarding our cybersecurity program.
•Risk Management: Cybersecurity risk management is integrated into our broader ERM framework. Our cybersecurity leadership team, in concert with our ERM team, assess threats and risks at least annually through the Enterprise Technology Risk Assessment process, which includes threat objective inherent risk score determination, identification of key and supporting controls, and resulting residual threat objective risk scores. Additionally, thematic threats such as sabotage, fraud, and theft of assets or customer data are used to frame our risk management activities. Asset theft often involves organized crime or financially motivated nations staging sophisticated, well-planned campaigns to steal significant cash, cryptocurrency, or equivalent assets. Our thematic threats, along with others, are evaluated by our Board of Directors as well as our Risk Committee, Corporate Risk Officer and our CISO. The CSS provides the framework we use for assessing risk, prioritizing testing, identifying remedial actions and validating improvements. The CSS also provides for the deployment of external and internal teams of ethical hackers that operate alongside our traditional vulnerability detection processes.
•Information Sharing: We recognize the importance of collaboration and information sharing among private sector firms in the financial services sector, across sectors, and with global public-sector agencies, when appropriate. Our cybersecurity leaders hold memberships and/or positions within the Financial Services Information Sharing and Analysis Center, or FS-ISAC, and the cross-sector Analysis and Resiliency Center, or ARC, in the U.S., the Financial Sector Cyber Collaboration Centre, or FSCCC, in the U.K., and similar organizations across the Europe, Middle East and Africa, or EMEA, and Asia Pacific, or APAC, regions.
•Third-Party Risk Oversight: We maintain a third-party risk management program. Our Information Security team provides subject matter expertise to our vendor management team to help assess a vendors' cybersecurity processes. Vendors are assessed before we engage them, and once engaged, are monitored periodically to ensure that they maintain compliance with our cybersecurity standards.
•Independent Security Attestation: We utilize both internal assessments and assessments by third parties, including external security assessors, consultants and auditors, to evaluate and test our cybersecurity program.
ICE’s Internal Audit, ERM, and Information Security Assurance teams conduct frequent assessments of varying scope to validate that our cybersecurity program controls and remediation processes are operating effectively. External auditors are contracted to perform annual Service Organization Controls, or SOC, report attestations of both business and security controls. In addition, our Cybersecurity Incident Response Plan is tested at least annually. Our internal "red team" conducts multiple tests each year driven by key cybersecurity risks. The results of these reviews alongside frequent regulatory and customer examinations are assessed, with any resulting mitigation activity assigned and tracked to remediation.
•Controls: Our identification of risks and selection of cyber-related controls is performed in the context of the critical financial infrastructure we maintain and operate. Our ongoing threat assessments are intended to identify changes in external events and in our activities, infrastructure and processes that could necessitate reprioritization of risks and controls. The nature of our business activities mandates an emphasis on sabotage and asset theft as primary threats in addition to contemporary themes of data theft. Our focus on these threats leads to an emphasis on network security, social engineering controls, behavioral detection of insider threat, and deliberate and rehearsed recovery strategies.
Although we do not believe that our business strategy, results of operations or financial condition have been materially adversely affected by any cybersecurity threats, we have been, and expect to continue to be, subject to cyberattacks, hacking and other cybersecurity risks. For further information on our cybersecurity risks, see Part I, Item 1(A), "Risk Factors", including the risk factor entitled “Our systems and those of our third-party service providers are vulnerable to cyberattacks, hacking and other cybersecurity risks, which could result in wrongful manipulation, disclosure, destruction, or use of our information or that of a third party, or which could make our customers unable or reluctant to use our electronic platforms,” included elsewhere in this Annual Report.
ITEM 2. PROPERTIES
Our intellectual property is described under the heading in Item 1 “- Business -Technology” and "-Business-Intellectual Property." In addition to our intellectual property, our other primary assets include buildings, computer equipment, corporate aircraft, software, and internally developed software. We own an array of computers and related equipment.
Our headquarters and principal executive offices are located in Atlanta, Georgia and New York, New York. We currently occupy 370,000 square feet of office space in Atlanta in two buildings that we own that serve as our Atlanta headquarters. Our New York headquarters are located at 11 Wall Street, where we occupy 370,000 square feet of office space in a building we own. In total, we maintain approximately 3.4 million square feet in offices primarily throughout the U.S., U.K., and India, with smaller offices located throughout the world. Generally, our properties are not earmarked for use by a particular business segment. Our principal offices consist of the properties described below.
| | | | | | | | | | | | | | | | | | | | |
| Location | | Owned/Leased | | Lease Expiration | | Approximate Size |
5660 New Northside Drive Atlanta, Georgia | | Owned | | N/A | | 273,000 sq. ft. |
5680 New Northside Drive
Atlanta, Georgia | | Owned | | N/A | | 97,000 sq. ft. |
11 Wall Street New York, New York | | Owned | | N/A | | 370,000 sq. ft. |
| Basildon, U.K. | | Owned | | N/A | | 539,000 sq. ft. |
601 Riverside Avenue Jacksonville, FL | | Owned | | N/A | | 327,000 sq. ft. |
Skyview Tower Hyderabad, India | | Leased | | 2025 - 2029 | | 442,000 sq. ft. |
| Mahwah, New Jersey | | Leased | | 2029 | | 396,000 sq. ft. |
1345 6th Avenue
New York, New York | | Leased | | 2040 | | 143,000 sq. ft. |
Sancroft Paternoster Square London, U.K. | | Leased | | 2038 | | 127,000 sq. ft. |
In addition to the above, we currently lease an aggregate of nearly 680,000 square feet of data center, administrative, sales and disaster preparedness facilities in various cities around the word. We believe that our facilities are adequate for our current operations and that we will be able to obtain additional space as and when it is needed.
ITEM 3. LEGAL PROCEEDINGS
We are subject to legal proceedings, claims and investigations that arise in the ordinary course of our business. We establish accruals for those matters in circumstances when a loss contingency is considered probable and the related amount is reasonably estimable. Any such accruals may be adjusted as circumstances change. Assessments of losses are inherently subjective and involve unpredictable factors. We do not believe that the resolution of these legal matters, including the matters described in this Annual Report, will have a material adverse effect on our consolidated financial condition, results of operations, or liquidity. It is possible, however, that future results of operations for any particular quarterly or annual period could be materially and adversely affected by any developments relating to the legal proceedings, claims and investigations. See Note 16 to the consolidated financial statements in Part II, Item 8 of this Annual Report for a summary of our legal proceedings and claims.
ITEM 4. MINE SAFETY DISCLOSURES
Not applicable.
PART II
ITEM 5. MARKET FOR REGISTRANT’S COMMON EQUITY, RELATED STOCKHOLDER MATTERS AND ISSUER PURCHASES OF EQUITY SECURITIES
Approximate Number of Holders of Common Stock
As of February 3, 2025, there were approximately 647 holders of record of our common stock. Our common stock trades on the New York Stock Exchange under the ticker symbol “ICE.”
Dividends
Our Board of Directors has adopted a quarterly dividend declaration policy providing that the declaration of any dividends will be determined quarterly by the Board or Audit Committee of the Board of Directors taking into account such factors as our evolving business model, prevailing business conditions and our financial results and capital requirements, without a predetermined annual net income payout ratio. The declaration of dividends is subject to the discretion of our Board of Directors, and may be affected by various factors, including our future earnings, financial condition, capital requirements, share repurchase activity, current and future planned strategic growth initiatives, levels of indebtedness, credit ratings and other considerations our Board of Directors deems relevant.
Equity Compensation Plan Information
The following provides information about our common stock that has been or may be issued under our equity compensation plans as of December 31, 2024:
•Intercontinental Exchange, Inc. 2022 Omnibus Employee Incentive Plan
•Intercontinental Exchange, Inc. 2022 Omnibus Non-Employee Director Incentive Plan
•Intercontinental Exchange, Inc. 2018 Employee Stock Purchase Plan
•Intercontinental Exchange, Inc. 2017 Omnibus Employee Incentive Plan
•Black Knight, Inc. Amended and Restated 2015 Omnibus Incentive Plan
•Intercontinental Exchange, Inc. 2013 Omnibus Employee Incentive Plan
•Intercontinental Exchange, Inc. 2003 Restricted Stock Deferral Plan for Outside Directors
The 2013 Omnibus Employee Incentive Plan was retired in May 2017 upon adoption of the 2017 Omnibus Employee Incentive Plan. The 2017 Omnibus Employee Incentive Plan was retired in May 2022 upon adoption of the 2022 Omnibus Employee Incentive Plan. The Black Knight, Inc. Amended and Restated 2015 Omnibus Incentive Plan was retired in September 2023 following completion of the Black Knight merger. No future grants will be made from the retired plans. All future grants to employees will be made under the Intercontinental Exchange, Inc. 2022 Omnibus Employee Incentive Plan and to directors under the Intercontinental Exchange, Inc. 2022 Omnibus Non-Employee Director Incentive Plan. All purchases made pursuant to the Employee Stock Purchase Plan are made from the 2018 Employee Stock Purchase Plan.
| | | | | | | | | | | | | | | | | |
| Plan Category | Number of securities to be issued upon exercise of outstanding options and rights (in thousands)
(a) | | Weighted average exercise price of outstanding options
(b) | | Number of securities
available for future
issuance under equity
compensation plans
(excluding securities
reflected in column (a)) (in thousands)
(c) |
Equity compensation plans approved by security holders(1) | 6,853 | | | $ | 93.90 | | | 36,202 | |
Equity compensation plans not approved by security holders(2) | 5 | | | — | | | — | |
| Total | 6,858 | | | $ | 93.90 | | | 36,202 | |
(1) The 2013 Omnibus Employee Incentive Plan was approved by our stockholders in May 2013. The Black Knight, Inc. Amended and Restated 2015 Omnibus Employee Incentive Plan was approved by stockholders of Black Knight in June 2017. The 2017 Omnibus Employee Incentive Plan was approved by our stockholders in May 2017. The 2022 Omnibus Employee Incentive Plan and the 2022 Omnibus Non-Employee Director Incentive Plan were approved by our stockholders in May 2022. Of the 6.9 million securities to be issued upon exercise, 2.2 million are options with a
weighted average exercise price of $93.90 and the remaining securities are restricted stock shares that do not have an exercise price. The 2018 Employee Stock Purchase Plan was approved by stockholders in May 2018.
(2) This category includes the 2003 Restricted Stock Deferral Plan for Outside Directors. All of the 5,000 securities to be issued are restricted stock shares that do not have an exercise price. For more information concerning these plans, see Note 11 to our consolidated financial statements, which are included in this Annual Report.
Stock Repurchases
In December 2021, our Board approved an aggregate of $3.15 billion for future repurchases of our common stock with no fixed expiration date that became effective January 1, 2022. With respect to purchases made by or on behalf of ICE or any "affiliated purchaser" (as defined in Rule 10b-18(a)(3) under the Exchange Act), in December 2021 we entered into a new Rule 10b5-1 trading plan that became effective in February 2022 and that governed some of our repurchases of shares of our common stock. In connection with our acquisition of Black Knight, on May 4, 2022 we terminated our Rule 10b5-1 trading plan and suspended share repurchases. We did not have any stock repurchases during 2024.
Refer to Note 12 to our consolidated financial statements, included in this Annual Report, for additional details on our stock repurchase plans and our repurchase activity during 2024.
ITEM 6. [RESERVED]
ITEM 7. MANAGEMENT’S DISCUSSION AND ANALYSIS OF FINANCIAL CONDITION AND RESULTS OF OPERATIONS
The following discussion contains forward-looking statements that involve risks and uncertainties. Our actual results could differ materially from those anticipated in these forward-looking statements for many reasons. See the factors set forth under the heading “Forward Looking Statements” at the beginning of Part 1 of this Annual Report and in Item 1(A) under the heading “Risk Factors.” For discussion related to the results of operations and changes in financial condition for 2023 compared to 2022 refer to Part II, Item 7. Management's Discussion and Analysis of Financial Condition and Results of Operations in our 2023 Annual Report on Form 10-K, which was filed with the U.S. Securities and Exchange Commission on February 8, 2024.
Overview
We are a leading global provider of technology and data to a broad range of customers including financial institutions, corporations and government entities. Our products, which span major asset classes including futures, equities, fixed income and U.S. residential mortgages, provide our customers with access to mission critical tools that are designed to increase asset class transparency and workflow efficiency. The majority of our identifiable assets are located in the U.S. and U.K. We report our results in the following three segments:
•Exchanges: We operate regulated marketplace technology for the listing, trading and clearing of a broad array of derivatives contracts and financial securities as well as data and connectivity services related to our exchanges and clearing houses.
•Fixed Income and Data Services: We provide fixed income pricing, reference data, indices, analytics and execution services as well as global CDS clearing and multi-asset class data delivery technology.
•Mortgage Technology: We provide a technology platform that offers customers comprehensive, digital workflow tools that aim to address inefficiencies and mitigate risks that exist in the U.S. residential mortgage market life cycle from application through closing, servicing and the secondary market.
Recent Developments
Global Market Conditions
Our results of operations are affected by global economic conditions, including macroeconomic conditions and geopolitical events and conflicts. Since 2022, macroeconomic conditions, including changes in interest rates, inflation and significant market volatility, along with geopolitical concerns, have created ongoing uncertainty and volatility in the global economy and resulted in a dynamic operating environment.
Our business has been impacted positively and negatively by these global economic conditions. For instance, due to market and interest rate volatility, we have seen increased trading across a number of our products, such as interest rate and equity futures, credit default swaps and bonds. Conversely, increases in mortgage interest rates in 2023 and to a
lesser extent, 2024, have resulted in reduced consumer and investor demand for mortgages and adversely impacted the transaction-based revenues in our Mortgage Technology segment. If mortgage rates remain high or further increase, or if mortgage lending practices change, our Mortgage Technology segment revenues may be further impacted. In addition, higher interest rates have resulted, and may continue to result, in higher interest rates for our debt instruments as we refinance our existing indebtedness.
From an operational perspective, our businesses, including our exchanges, clearing houses, listings venues, data services businesses and mortgage platforms, have not suffered a material negative impact as a result of the events in Ukraine and the Middle East and surrounding regions.
We expect the macroeconomic environment to remain dynamic in the near-term, and we continue to monitor macroeconomic conditions, including interest rates, inflation rates, geopolitical events and military conflicts, including repercussions from the conflicts in Ukraine and the Middle East, and the impact that any of the foregoing may have on the global economy and on our business. We also continue to closely monitor credit worthiness of our counterparties, clearing members and our financial service providers and take risk management measures in line with established risk management frameworks.
Consolidated Financial Highlights
The following summarizes our results and significant changes in our consolidated financial performance for the periods presented (dollars in millions, except per share amounts):
(1) Operating income/(loss) from our Mortgage Technology segment was $(170) million, $(276) million and $57 million in 2024, 2023 and 2022, respectively.
(2) The adjusted figures exclude items that are not reflective of our ongoing core operations and business performance. Adjusted net income attributable to ICE is presented net of taxes. These adjusted numbers are not calculated in accordance with U.S. Generally Accepted Accounting Principles, or U.S. GAAP. See “—Non-GAAP Financial Measures” below.
| | | | | | | | | | | | | | | | | | | | | | | | | | | | | | | | | | | |
| Year Ended December 31, | | | | Year Ended December 31, | | |
| 2024 | | 2023 | | Change | | 2023 | | 2022 | | Change |
| Revenues, less transaction-based expenses | $ | 9,279 | | | $ | 7,988 | | | 16 | % | | $ | 7,988 | | | $ | 7,292 | | | 10 | % |
Recurring revenues(1) | $ | 4,829 | | | $ | 4,138 | | | 17 | % | | $ | 4,138 | | | $ | 3,721 | | | 11 | % |
Transaction revenues, net(1) | $ | 4,450 | | | $ | 3,850 | | | 16 | % | | $ | 3,850 | | | $ | 3,571 | | | 8 | % |
| Operating expenses | $ | 4,970 | | | $ | 4,294 | | | 16 | % | | $ | 4,294 | | | $ | 3,654 | | | 18 | % |
Adjusted operating expenses(2) | $ | 3,810 | | | $ | 3,260 | | | 17 | % | | $ | 3,260 | | | $ | 2,953 | | | 10 | % |
| Operating income | $ | 4,309 | | | $ | 3,694 | | | 17 | % | | $ | 3,694 | | | $ | 3,638 | | | 2 | % |
Adjusted operating income(2) | $ | 5,469 | | | $ | 4,728 | | | 16 | % | | $ | 4,728 | | | $ | 4,339 | | | 9 | % |
| Operating margin | 46 | % | | 46 | % | | — | | | 46 | % | | 50 | % | | (4 pts) |
Adjusted operating margin(2) | 59 | % | | 59 | % | | — | | | 59 | % | | 59 | % | | — | |
| Other income/(expense), net | $ | (681) | | | $ | (800) | | | (15) | % | | $ | (800) | | | $ | (1,830) | | | (56) | % |
| Income tax expense | $ | 826 | | | $ | 456 | | | 81 | % | | $ | 456 | | | $ | 310 | | | 47 | % |
| Effective tax rate | 23 | % | | 16 | % | | 7 pts | | 16 | % | | 17 | % | | (1 pt) |
| Net income attributable to ICE | $ | 2,754 | | | $ | 2,368 | | | 16 | % | | $ | 2,368 | | | $ | 1,446 | | | 64 | % |
Adjusted net income attributable to ICE(2) | $ | 3,497 | | | $ | 3,177 | | | 10 | % | | $ | 3,177 | | | $ | 2,974 | | | 7 | % |
| Diluted earnings per share attributable to ICE common stockholders | $ | 4.78 | | | $ | 4.19 | | | 14 | % | | $ | 4.19 | | | $ | 2.58 | | | 62 | % |
Adjusted diluted earnings per share attributable to ICE common stockholders(2) | $ | 6.07 | | | $ | 5.62 | | | 8 | % | | $ | 5.62 | | | $ | 5.30 | | | 6 | % |
| Cash flows from operating activities | $ | 4,609 | | | $ | 3,542 | | | 30 | % | | $ | 3,542 | | | $ | 3,554 | | | — | % |
Free cash flow(3) | $ | 3,857 | | | $ | 3,053 | | | 26 | % | | $ | 3,053 | | | $ | 3,072 | | | (1) | % |
Adjusted free cash flow(3) | $ | 3,620 | | | $ | 3,197 | | | 13 | % | | $ | 3,197 | | | $ | 2,906 | | | 10 | % |
(1) We define recurring revenues as the portion of our revenues that are generally predictable, stable, and can be expected to occur at regular intervals in the future with a relatively high degree of certainty and visibility. We define transaction revenues as those associated with a more specific point-in-time service, such as a trade execution.
(2) The adjusted figures exclude items that are not reflective of our ongoing core operations and business performance. Adjusted net income attributable to ICE and adjusted diluted earnings per share attributable to ICE common stockholders are presented net of taxes. These adjusted figures are not calculated in accordance with U.S. GAAP. See “- Non-GAAP Financial Measures” below.
(3) We believe these non-GAAP liquidity measures provide useful information to management and investors to analyze cash resources generated from our operations. We believe that free cash flow is useful as one of the bases for comparing our performance with our competitors and demonstrates our ability to convert the reinvestment of capital expenditures and capitalized software development costs required to maintain and grow our business. We believe that adjusted free cash flow eliminates the impact of timing differences related to the payment of Section 31 fees. These figures are not calculated in accordance with U.S. GAAP. See “—Non-GAAP Liquidity Measures” below.
•Revenues, less transaction-based expenses, increased $1.3 billion in 2024 from 2023. The increase in revenues includes $18 million in favorable foreign exchange effects arising from fluctuations in the U.S. dollar in 2024 as compared to 2023.
•Revenues, less transaction-based expenses, increased $696 million in 2023 from 2022. The increase in revenues includes $17 million in favorable foreign exchange effects arising from fluctuations in the U.S. dollar in 2023 as compared to 2022.
•Operating expenses increased $676 million in 2024 from 2023. The increase in operating expenses includes $8 million in unfavorable foreign exchange effects arising from fluctuations in the U.S. dollar in 2024 as compared to 2023.
•Operating expenses increased $640 million in 2023 from 2022. The increase in operating expenses includes $4 million in unfavorable foreign exchange effects arising from fluctuations in the U.S. dollar in 2023 as compared to 2022.
•Other income/(expense), net, in 2024 primarily includes interest income of $141 million, interest expense of $910 million, our equity earnings in OCC of $25 million, estimated equity losses in our investment in Bakkt of $83 million, a gain of $160 million related to the PennyMac arbitration final award payment, a gain of $6 million related to the sale of certain fixed assets and FX remeasurement losses of $15 million.
•Other income/(expense), net, in 2023 primarily includes interest income of $319 million, interest expense of $808 million, our equity earnings in OCC of $16 million, estimated equity losses in our investment in Bakkt of $135 million, a fair value loss of $160 million related to the Black Knight Promissory Note, an impairment related to our CAT loan receivable of $16 million, FX remeasurement losses of $12 million, and a loss on the sale of the Dun & Bradstreet investment of $3 million, net of dividends received, that we acquired through the acquisition of Black Knight.
•The 23% effective tax rate in 2024 was above the statutory federal income tax rate primarily due to state and local income taxes, including the impacts of recording valuation allowances on certain state deferred tax assets, partially offset by favorable state apportionment changes and statutes of limitations expirations.
•The 16% effective tax rate in 2023 was below the statutory federal income tax rate primarily driven by the following factors: favorable audit settlements for historical years, favorable state apportionment changes, and the application of the high-tax exception to Global Intangible Low-Taxed Income. These benefits were partially offset by the impact of the U.K. corporate income tax increase from 19% to 25% effective April 1, 2023, and the tax impact of certain non-deductible Black Knight acquisition costs.
•The 17% effective tax rate in 2022 was below the statutory federal income tax rate primarily driven by the deferred income tax benefit from the impairment of our equity investment in Bakkt.
Business Environment and Market Trends
Our business environment has been characterized by:
•globalization of marketplaces, customers and competitors;
•growing customer demand for workflow efficiency and automation;
•commodity, interest rate, inflation rate and financial markets volatility and uncertainty;
•growing demand for data to inform customers' risk management and investment decisions;
•evolving, increasing and disparate regulation across multiple jurisdictions;
•price volatility increasing customers' demand for risk management services;
•increasing focus on capital and cost efficiencies;
•customers' preference to manage risk in markets demonstrating the greatest depth of liquidity and product diversity;
•the evolution of existing products and new product innovation to serve emerging customer needs and changing industry agreements;
•emerging technology initiatives and offerings in our markets, including the use of artificial intelligence and machine learning;
•rising demand for speed, data, data capacity and connectivity by market participants, necessitating increased investment in technology; and
•consolidation and increasing competition among global markets for trading, clearing and listings.
Recent changes with regard to global financial reform have emphasized the importance of transparent markets, centralized clearing and access to data, all of which are important aspects of our product offering. However, some of the proposed rules have yet to be implemented and some rules that have already been partially implemented are being reconsidered, have been stayed or are subject to challenges in court. In addition, some of the global regulations have not been fully harmonized and several non-U.S. regulations are inconsistent with U.S. rules. As the evolution continues, legislative and regulatory actions may change the way we conduct our business and may create uncertainty for market participants, which could affect trading volumes or demand for market data. As a result, it is difficult to predict all of the effects that the legislation and its implementing regulations will have on us. As discussed more fully in Item 1 “- Business - Regulation” included in this Annual Report, Brexit, MiFID II and other regulations have resulted in operational, regulatory and/or business risk.
We have diversified our business so that we are not dependent on volatility or transaction activity in any one asset class. In addition, we have increased our portion of recurring revenues from 34% in 2014 to 52% in 2024. These recurring revenues include data services, listings and various mortgage technology solutions.
Many of the data products we sell and services we provide are required for our clients’ business operations regardless of market volatility or shifts in business profitability levels. We anticipate that there will continue to be growth in the financial information services sector driven by a number of global trends, including the following:
•increasing or evolving global regulatory demands;
•greater use of fair value accounting standards and reliance on independent valuations;
•greater emphasis on risk management;
•market fragmentation driven by regulatory changes;
•the move to passive investing and indexation;
•ongoing growth in the size and diversity of financial markets;
•increased automation of fixed income, mortgage and other less automated markets;
•the development of new data products;
•greater use of emerging technologies, including artificial intelligence and machine learning;
•the demand for greater data capacity and connectivity;
•new entrants; and
•increasing demand for outsourced services by financial institutions.
We continue to focus on our strategy to grow each of our revenue streams, and prudently manage expenses, in order to mitigate these uncertainties and to build on our growth opportunities by leveraging our proprietary data, clearing, markets and technology solutions.
Segment Results
Our business is conducted through three reportable business segments: Exchanges, Fixed Income and Data Services and Mortgage Technology. Segments are discussed more in detail in "Item 1- Business". While revenues are recorded specifically in the segment in which they are earned or to which they relate, a significant portion of our operating expenses are not solely related to a specific segment because the expenses serve functions that are necessary for the operation of more than one segment. We directly allocate expenses when reasonably possible to do so. Otherwise, we use a pro-rata revenue approach as the allocation method for the expenses that do not relate solely to one segment and serve functions that are necessary for the operation of all segments. Our segments do not engage in intersegment transactions.
For details on trends in recent prior-year periods, refer to our 2023 and 2022 Annual Reports on Form 10-K.
Exchanges Segment
The following presents selected statements of income data for our Exchanges segment (dollars in millions):
(1) The adjusted figures in the charts above are calculated by excluding items that are not reflective of our cash operations and core business performance. As a result, these adjusted figures are not calculated in accordance with U.S. GAAP. See “- Non-GAAP Financial Measures” below.
| | | | | | | | | | | | | | | | | | | | | | | | | | | | | | | | | | | |
| Year Ended December 31, | | | | Year Ended December 31, | | |
| 2024 | | 2023 | | Change | | 2023 | | 2022 | | Change |
| Revenues: | | | | | | | | | | | |
| Energy futures and options | $ | 1,876 | | | $ | 1,498 | | | 25 | % | | $ | 1,498 | | | $ | 1,162 | | | 29 | % |
| Agricultural and metals futures and options | 257 | | | 271 | | | (5) | | | 271 | | | 235 | | | 15 | |
| Financial futures and options | 559 | | | 460 | | | 22 | | | 460 | | | 475 | | | (3) | |
| Futures and options | 2,692 | | | 2,229 | | | 21 | | | 2,229 | | | 1,872 | | | 19 | |
| Cash equities and equity options | 2,913 | | | 2,298 | | | 27 | | | 2,298 | | | 2,722 | | | (16) | |
| OTC and other | 400 | | | 398 | | | — | | | 398 | | | 429 | | | (7) | |
| Transaction and clearing, net | 6,005 | | | 4,925 | | | 22 | | | 4,925 | | | 5,023 | | | (2) | |
| Data and connectivity services | 947 | | | 933 | | | 2 | | | 933 | | | 877 | | | 6 | |
| Listings | 489 | | | 497 | | | (2) | | | 497 | | | 515 | | | (4) | |
| Revenues | 7,441 | | | 6,355 | | | 17 | | | 6,355 | | | 6,415 | | | (1) | |
Transaction-based expenses(1) | 2,482 | | | 1,915 | | | 30 | | | 1,915 | | | 2,344 | | | (18) | |
| Revenues, less transaction-based expenses | 4,959 | | | 4,440 | | | 12 | | | 4,440 | | | 4,071 | | | 9 | |
| Other operating expenses | 1,063 | | | 1,033 | | | 3 | | | 1,033 | | | 968 | | | 7 | |
| Depreciation and amortization | 260 | | | 248 | | | 5 | | | 248 | | | 240 | | | 3 | |
| Acquisition-related transaction and integration costs | — | | | — | | | n/a | | — | | | 1 | | | n/a |
| Operating expenses | 1,323 | | | 1,281 | | | 3 | | | 1,281 | | | 1,209 | | | 6 | |
| Operating income | $ | 3,636 | | | $ | 3,159 | | | 15 | % | | $ | 3,159 | | | $ | 2,862 | | | 10 | % |
| | | | | | | | | | | |
| Recurring revenues | $ | 1,436 | | | $ | 1,430 | | | — | % | | $ | 1,430 | | | $ | 1,392 | | | 3 | % |
| Transaction revenues, net | $ | 3,523 | | | $ | 3,010 | | | 17 | % | | $ | 3,010 | | | $ | 2,679 | | | 12 | % |
*Percentage changes in the table above deemed "n/a" are not meaningful.
(1) Transaction-based expenses are largely attributable to our cash equities and options business.
Exchanges Revenues
Our Exchanges segment includes transaction and clearing revenues from our futures and NYSE exchanges, related data and connectivity services, and our listings business. Transaction and clearing revenues consist of fees collected from derivatives, cash equities and equity options trading and derivatives clearing, and are reported on a net basis, except for the NYSE transaction-based expenses discussed below. Rates per-contract, or RPC, are driven by the number of contracts or securities traded and the fees charged per contract, net of certain rebates. Our per-contract transaction and clearing revenues will depend upon many factors, including, but not limited to, market conditions, transaction and clearing volume, product mix, pricing, applicable revenue sharing and market making agreements, and new product introductions.
Transaction and clearing revenues are generally assessed on a per-contract basis and revenues and profitability fluctuate with changes in contract volume and product mix. We consider data and connectivity services revenues and listings revenues to be recurring revenues. Our data and connectivity services revenues are recurring subscription fees related to the various data and connectivity services that we provide which are directly attributable to our exchange venues. Our listings revenues are also recurring subscription fees that we earn for the provision of NYSE listings services for public companies and ETFs, and related corporate actions for listed companies.
In 2024 and 2023, 23% and 20%, respectively, of our Exchanges segment revenues, less transaction-based expenses, were billed in pounds sterling or euros. Due to the fluctuations of the pound sterling and euro compared to the U.S. dollar, our Exchanges segment revenues, less transaction-based expenses, were higher by $15 million in 2024 from 2023.
Our exchange transaction and clearing revenues are presented net of rebates. We recorded rebates of $1.3 billion and $989 million in 2024 and 2023, respectively. We offer rebates in certain of our markets primarily to support market liquidity and trading volume by providing qualified participants in those markets a discount to the applicable commission rate. Such rebates are calculated based on volumes traded. The increase in rebates is primarily due to higher volumes traded as compared to 2023.
•Energy Futures and Options: Total volume in our energy futures and options markets increased 25% and revenues increased 25% in 2024 from 2023.
–Oil futures and options volume increased 21% in 2024 from 2023, in part, due to geopolitical risk in the Middle East and uncertainty regarding oil supply and demand dynamics.
–Global natural gas futures and options volume increased 30% in 2024 from 2023. The volume increase in our North American gas products was driven by increased volatility related to shifting weather and fundamentals. In addition, growth in our TTF and Asian JKM gas complexes was driven by the continued globalization of the commodity, coupled with price volatility related to geopolitical risks and supply and demand dynamics.
–Environmentals and other futures and options volume increased 38% in 2024 from 2023, due to record environmental volumes driven by price volatility related to geopolitical risk in the Middle East, continued demand for market-based mechanisms to price climate risk and help enable greenhouse gas reduction goals, and higher power volumes driven by increased volatility as compared to the prior year.
•Agricultural and Metals Futures and Options: Total volume in our agricultural and metals futures and options markets decreased 2% and revenues decreased 5% in 2024 from 2023. The overall decrease in agricultural volumes was due to reduced market volatility impacting our Sugar markets following an El Niño year, as well as a global supply shortage impacting our Cocoa markets, with Cocoa prices reaching an all-time high in 2024.
–Sugar futures and options volumes decreased 9% in 2024 from 2023.
–Other agricultural and metal futures and options volumes increased 4% in 2024 from 2023.
•Financial Futures and Options: Total volume in our financial futures and options markets increased 32% and revenues increased 22% in 2024 from 2023, including the impacts of foreign exchange effects.
–Interest rate futures and options volume increased 39% and revenue increased 33% in 2024 from 2023 driven by interest rate volatility and divergence of rate paths by central banks. Interest rate futures and options revenues were $399 million and $299 million in 2024 and 2023, respectively.
–Other financial futures and options volume, which includes our MSCI®, FTSE® and NYSE FANG+ equity index products, decreased 6% and revenue decreased 1% in 2024 from 2023. Other financial futures and options volume decreased due to overall lower equity market volatility than in the prior year. Other financial futures and options revenues were $160 million and $161 million in 2024 and 2023, respectively.
•Cash Equities and Equity Options: Cash equities volume increased 9% in 2024 from 2023 due to increased participation in U.S. equity markets. Cash equities revenues, net of transaction-based expenses, were $307 million and $268 million in 2024 and 2023, respectively. Equity options volume increased 19% in 2024 from 2023 driven by increased participation and higher market share. Equity options revenues, net of transaction-based expenses, were $124 million and $115 million in 2024 and 2023, respectively.
•OTC and Other: OTC and other transactions include revenues from our OTC energy business and other trade confirmation services, as well as net interest income and fees on certain clearing margin deposits, regulatory penalties and fines, fees for use of our facilities, regulatory fees charged to member organizations of our U.S. securities exchanges, designated market maker service fees, exchange membership fees and agricultural grading and certification fees. Our OTC and other revenues were flat in 2024 compared to 2023.
•Data and Connectivity Services: Our data and connectivity services revenues increased 2% in 2024 from 2023. The increase in revenue was driven by the strong retention rate of existing customers, the addition of new customers and increased purchases by existing customers.
•Listings Revenues: Through NYSE, NYSE American and NYSE Arca, we generate listings revenue related to the provision of listings services for public companies and ETFs, and related corporate actions for listed companies. Listings revenues decreased 2% in 2024 from 2023, due to the continued roll-off of initial listing fees from the strong initial public offerings, or IPO, market in 2021 and special purpose acquisition company, or SPAC, delistings. All listings fees are billed upfront and the identified performance obligations are satisfied over time.
Selected Operating Data
Volume of contracts traded, futures and options rate per contract and open interest are measures that we use in analyzing the performance of our futures and options contracts. Handled volume, matched volume and cash equities and equity options rate per contract are measures that we use in analyzing our NYSE cash equities and equity options performance. We believe each of these measures provides useful information for management and investors in understanding our performance. Management considers these metrics when making financial and operating decisions. Our calculation of these metrics may not be comparable to similarly titled measures used by other companies.
The following charts and tables present trading activity in our futures and options markets by commodity type based on the total number of contracts traded, as well as futures and options rate per contract (in millions, except for percentages and rate per contract amounts):
| | | | | | | | | | | | | | |
| Volume and Rate per Contract |
| | | | | | | | | | | | | | | | | | | | | | | | | | | | | | | | | | | |
| Year Ended
December 31, | | | | Year Ended
December 31, | | |
| 2024 | | 2023 | | Change | | 2023 | | 2022 | | Change |
| Number of contracts traded (in millions): | | | | | | | | | | | |
| Energy futures and options | 1,099 | | | 883 | | | 25 | % | | 883 | | | 753 | | | 17 | % |
| Agricultural and metals futures and options | 116 | | | 118 | | | (2) | % | | 118 | | | 102 | | | 16 | % |
| Financial futures and options | 851 | | | 646 | | | 32 | % | | 646 | | | 646 | | | — | % |
| Total | 2,066 | | | 1,647 | | | 26 | % | | 1,647 | | | 1,501 | | | 10 | % |
| Average Daily Volume of contracts traded (in thousands): | | | | | | | | | | | |
| Energy futures and options | 4,361 | | | 3,530 | | | 24 | % | | 3,530 | | | 3,000 | | | 18 | % |
| Agricultural and metals futures and options | 462 | | | 474 | | | (3) | % | | 474 | | | 407 | | | 16 | % |
| Financial futures and options | 3,309 | | | 2,532 | | | 31 | % | | 2,532 | | | 2,524 | | | — | % |
| Total | 8,132 | | | 6,536 | | | 24 | % | | 6,536 | | | 5,931 | | | 10 | % |
| Rate per contract: | | | | | | | | | | | |
| Energy futures and options | $ | 1.71 | | | $ | 1.70 | | | 1 | % | | $ | 1.70 | | | $ | 1.54 | | | 10 | % |
| Agricultural and metals futures and options | $ | 2.21 | | | $ | 2.29 | | | (3) | % | | $ | 2.29 | | | $ | 2.30 | | | — | % |
| Financial futures and options | $ | 0.65 | | | $ | 0.70 | | | (8) | % | | $ | 0.70 | | | $ | 0.73 | | | (3) | % |
Open interest is the aggregate number of contracts (long or short) that clearing members hold either for their own account or on behalf of their clients. Open interest refers to the total number of contracts that are currently “open,” – in other words, contracts that have been entered into but not yet liquidated by either an offsetting trade, exercise, expiration or assignment. Open interest is also a measure of the future activity remaining to be closed out in terms of the number of contracts that members and their clients continue to hold in the particular contract and by the number of contracts held for each contract month listed by the exchange. The following charts and table present our year-end open interest for our futures and options contracts (in thousands, except for percentages):
| | | | | | | | | | | | | | | | | | | | | | | | | | | | | | | | | | | |
| As of December 31, | | | | As of December 31, | | |
| 2024 | | 2023 | | Change | | 2023 | | 2022 | | Change |
| Open interest — in thousands of contracts: | | | | | | | | | | | |
| Energy futures and options | 58,973 | | | 51,556 | | | 14 | % | | 51,556 | | | 42,524 | | | 21 | % |
| Agricultural and metals futures and options | 3,503 | | | 4,855 | | | (28) | % | | 4,855 | | | 3,881 | | | 25 | % |
| Financial futures and options | 24,987 | | | 22,380 | | | 12 | % | | 22,380 | | | 20,342 | | | 10 | % |
| Total | 87,463 | | | 78,791 | | | 11 | % | | 78,791 | | | 66,747 | | | 18 | % |
The following charts and tables present selected cash and equity options trading data. All trading volume below is presented as average net daily trading volume, or ADV, and is single counted:
| | | | | | | | | | | | | | | | | | | | | | | | | | | | | | | | | | | |
| Year Ended December 31, | | | | Year Ended December 31, | | |
| 2024 | | 2023 | | Change | | 2023 | | 2022 | | Change |
| NYSE cash equities (shares in millions): | | | | | | | | | | | |
| Total cash handled volume | 2,436 | | | 2,231 | | | 9 | % | | 2,231 | | | 2,409 | | | (7) | % |
| Total cash market share matched | 19.7 | % | | 19.9 | % | | (0.2 pts) | | 19.9 | % | | 19.9 | % | | — | |
| NYSE equity options (contracts in thousands): | | | | | | | | | | | |
| NYSE equity options volume (ADV) | 9,375 | | | 7,900 | | | 19 | % | | 7,900 | | | 7,621 | | | 4 | % |
| Total equity options volume (ADV) | 44,360 | | | 40,369 | | | 10 | % | | 40,369 | | | 38,244 | | | 6 | % |
| NYSE share of total equity options | 21.1 | % | | 19.6 | % | | 1.5 pts | | 19.6 | % | | 19.9 | % | | (0.3 pts) |
| Revenue capture or rate per contract: | | | | | | | | | | | |
| Cash equities rate per contract (per 100 shares) | $0.050 | | $0.048 | | 4 | % | | $0.048 | | $0.045 | | 6 | % |
| Equity options rate per contract | $0.05 | | $0.06 | | (10) | % | | $0.06 | | $0.05 | | 7 | % |
Handled volume represents the total number of shares of equity securities, ETFs and crossing session activity internally matched on our exchanges or routed to and executed on an external market center. Matched volume represents the total number of shares of equity securities, ETFs and crossing session activity executed on our exchanges.
Transaction-Based Expenses
Our equities and equity options markets pay fees to the SEC pursuant to Section 31 of the Exchange Act. Section 31 fees are recorded on a gross basis as a component of transaction and clearing fee revenue. These Section 31 fees are
assessed to recover the government’s costs of supervising and regulating the securities markets and professionals and are subject to change. We, in turn, collect corresponding activity assessment fees from member organizations clearing or settling trades on the equities and options exchanges, and recognize these amounts in our transaction and clearing revenues when invoiced. The activity assessment fees are designed to equal the Section 31 fees. As a result, activity assessment fees and the corresponding Section 31 fees do not have an impact on our net income, although the timing of payment by us will vary from collections. Section 31 fees were $679 million and $293 million in 2024 and 2023, respectively. The increase in Section 31 fees was primarily due to an increase in rates and volumes. The fees we collect are included in cash at the time of receipt and we remit the amounts to the SEC semi-annually as required. The total amount is included in current liabilities and was $316 million as of December 31, 2024.
We make liquidity payments to cash and options trading customers, as well as routing charges made to other exchanges which are included in transaction-based expenses. We incur routing charges when we do not have the best bid or offer in the market for a security that a customer is trying to buy or sell on one of our securities exchanges. In that case, we route the customer’s order to the external market center that displays the best bid or offer. The external market center charges us a fee per share (denominated in tenths of a cent per share) for routing to its system. We record routing charges on a gross basis as a component of transaction and clearing fee revenue. Cash liquidity payments, routing and clearing fees were $1.8 billion and $1.6 billion in 2024 and 2023, respectively.
Operating Expenses, Operating Income and Operating Margin
The following chart summarizes our Exchanges segment's operating expenses, operating income and operating margin (dollars in millions). See “- Consolidated Operating Expenses” below for a discussion of the significant changes in our operating expenses.
| | | | | | | | | | | | | | | | | | | | | | | | | | | | | | | | | | | |
| Exchanges Segment: | Year Ended December 31, | | | | Year Ended December 31, | | |
| 2024 | | 2023 | | Change | | 2023 | | 2022 | | Change |
| Operating expenses | $ | 1,323 | | | $ | 1,281 | | | 3 | % | | $ | 1,281 | | | $ | 1,209 | | | 6 | % |
Adjusted operating expenses(1) | $ | 1,240 | | | $ | 1,199 | | | 3 | % | | $ | 1,199 | | | $ | 1,142 | | | 5 | % |
| Operating income | $ | 3,636 | | | $ | 3,159 | | | 15 | % | | $ | 3,159 | | | $ | 2,862 | | | 10 | % |
Adjusted operating income(1) | $ | 3,719 | | | $ | 3,241 | | | 15 | % | | $ | 3,241 | | | $ | 2,929 | | | 11 | % |
| Operating margin | 73 | % | | 71 | % | | 2 pts | | 71 | % | | 70 | % | | 1 pt |
Adjusted operating margin(1) | 75 | % | | 73 | % | | 2 pts | | 73 | % | | 72 | % | | 1 pt |
(1) The adjusted figures exclude items that are not reflective of our ongoing core operations and business performance. These adjusted numbers are not calculated in accordance with GAAP. See “- Non-GAAP Financial Measures” below.
Fixed Income and Data Services Segment
The following charts and table present our selected statements of income data for our Fixed Income and Data Services segment (dollars in millions):
(1) The adjusted figures exclude items that are not reflective of our ongoing core operations and business performance. These adjusted numbers are not calculated in accordance with GAAP. See “- Non-GAAP Financial Measures” below.
| | | | | | | | | | | | | | | | | | | | | | | | | | | | | | | | | | | |
| Year Ended December 31, | | | | Year Ended December 31, | | |
| 2024 | | 2023 | | Change | | 2023 | | 2022 | | Change |
| Revenues: | | | | | | | | | | | |
| Fixed income execution | $ | 117 | | | $ | 124 | | | (6) | % | | $ | 124 | | | $ | 101 | | | 23 | % |
| CDS clearing | 343 | | | 360 | | | (5) | | | 360 | | | 305 | | | 18 | |
| Fixed income data and analytics | 1,177 | | | 1,118 | | | 5 | | | 1,118 | | | 1,098 | | | 2 | |
| Fixed income and credit | 1,637 | | | 1,602 | | | 2 | | | 1,602 | | | 1,504 | | | 7 | |
| Other data and network services | 661 | | | 629 | | | 5 | | | 629 | | | 588 | | | 7 | |
| Revenues | 2,298 | | | 2,231 | | | 3 | | | 2,231 | | | 2,092 | | | 7 | |
| Other operating expenses | 1,129 | | | 1,079 | | | 5 | | | 1,079 | | | 1,023 | | | 5 | |
| Depreciation and amortization | 326 | | | 341 | | | (4) | | | 341 | | | 349 | | | (2) | |
| Acquisition-related transaction and integration costs | — | | | — | | | — | | | — | | | 1 | | | (95) | |
| Operating expenses | 1,455 | | | 1,420 | | | 2 | | | 1,420 | | | 1,373 | | | 3 | |
| Operating income | $ | 843 | | | $ | 811 | | | 4 | % | | $ | 811 | | | $ | 719 | | | 13 | % |
| | | | | | | | | | | |
| Recurring revenues | $ | 1,838 | | | $ | 1,747 | | | 5 | % | | $ | 1,747 | | | $ | 1,686 | | | 4 | % |
| Transaction revenues | $ | 460 | | | $ | 484 | | | (5) | % | | $ | 484 | | | $ | 406 | | | 20 | % |
In the table above, we consider fixed income data and analytics revenues and other data and network services revenues to be recurring revenues.
In both 2024 and 2023, 11% of our Fixed Income and Data Services segment revenues were billed in pounds sterling or euros. As the pound sterling or euro exchange rate changes, the U.S. equivalent of revenues denominated in foreign currencies changes accordingly. Due to the fluctuations of the pound sterling and euro compared to the U.S. dollar during 2024, our Fixed Income and Data Services revenues were higher by $3 million in 2024 than in 2023.
Fixed Income and Data Services Revenues
Our Fixed Income and Data Services revenues increased 3% in 2024 from 2023 primarily due to strength in our fixed income data and analytics products and our other data and network services.
•Fixed Income Execution: Fixed income execution includes revenues from ICE Bonds. Execution fees are reported net of rebates, which were $7 million and $5 million in 2024 and 2023, respectively. Our fixed income execution revenues decreased 6% in 2024 from 2023 as higher revenues from record corporate and municipal bond trading were more than offset by lower levels of U.S. treasury activity.
•CDS Clearing: CDS clearing revenues decreased 5% in 2024 from 2023. The notional value of CDS cleared, including index options, was $19.8 trillion and $19.0 trillion in 2024 and 2023, respectively. The overall decrease in revenues was primarily due to lower net interest income on collateral balances.
•Fixed Income Data and Analytics: Our fixed income data and analytics revenues increased 5% in 2024 from 2023 primarily due to growth in our pricing and reference data business and strength in our index business.
•Other Data and Network Services: Our other data and network services revenues increased 5% in 2024 from 2023. The increase in revenues was primarily driven by growth in our ICE Global Network offering, coupled with strength in our consolidated feeds and desktop revenues.
Annual Subscription Value, or ASV, represents, at a point in time, the data services revenues, which includes Fixed Income Data and Analytics as well as Other Data and Network Services, subscribed for the succeeding 12 months. ASV does not include new sales, contract terminations or price changes that may occur during that 12-month period. However, while it is an indicative forward-looking metric, it does not provide a precise growth forecast of the next 12 months of data services revenues. Management considers ASV metrics when making financial and operating decisions and believes ASV is useful for management and investors in understanding our data services business performance.
As of December 31, 2024, ASV was $1.838 billion, which increased 4.9% compared to the ASV as of December 31, 2023. ASV represents nearly 100% of total data services revenues for this segment. This does not adjust for year-over-year foreign exchange fluctuations.
Operating Expenses, Operating Income and Operating Margin
The following chart summarizes our Fixed Income and Data Services segment's operating expenses, operating income and operating margin (dollars in millions). See “- Consolidated Operating Expenses” below for a discussion of the significant changes in our operating expenses.
| | | | | | | | | | | | | | | | | | | | | | | | | | | | | | | | | | | |
| Fixed Income and Data Services Segment: | Year Ended December 31, | | | | Year Ended December 31, | | |
| 2024 | | 2023 | | Change | | 2023 | | 2022 | | Change |
| Operating expenses | $ | 1,455 | | | $ | 1,420 | | | 2 | % | | $ | 1,420 | | | $ | 1,373 | | | 3 | % |
Adjusted operating expenses(1) | $ | 1,272 | | | $ | 1,252 | | | 2 | % | | $ | 1,252 | | | $ | 1,193 | | | 5 | % |
| Operating income | $ | 843 | | | $ | 811 | | | 4 | % | | $ | 811 | | | $ | 719 | | | 13 | % |
Adjusted operating income(1) | $ | 1,026 | | | $ | 979 | | | 5 | % | | $ | 979 | | | $ | 899 | | | 9 | % |
| Operating margin | 37 | % | | 36 | % | | 1 pt | | 36 | % | | 34 | % | | 2 pts |
Adjusted operating margin(1) | 45 | % | | 44 | % | | 1 pt | | 44 | % | | 43 | % | | 1 pt |
(1) The adjusted figures exclude items that are not reflective of our ongoing core operations and business performance. These adjusted numbers are not calculated in accordance with GAAP. See “- Non-GAAP Financial Measures” below.
Mortgage Technology Segment
The following charts and table present our selected statements of income data for our Mortgage Technology segment (dollars in millions):
(1) Servicing Software was a new revenue category beginning in 2023 following completion of the Black Knight acquisition.
(2) The adjusted figures exclude items that are not reflective of our ongoing core operations and business performance. These adjusted numbers are not calculated in accordance with GAAP. See “- Non-GAAP Financial Measures” below.
| | | | | | | | | | | | | | | | | | | | | | | | | | | | | | | | | | | |
| Year Ended December 31, | | | | Year Ended December 31, | | |
| 2024 | | 2023 | | Change | | 2023 | | 2022 | | Change |
| Revenues: | | | | | | | | | | | |
| Origination technology | $ | 713 | | | 694 | | | 3 | % | | 694 | | | 798 | | | (13) | % |
| Closing solutions | 202 | | | 179 | | | 13 | | | 179 | | | 239 | | | (25) | |
| Servicing software | 848 | | | 288 | | | 194 | | 288 | | | — | | | n/a |
| Data and analytics | 259 | | | 156 | | | 66 | | | 156 | | | 92 | | | 69 | |
| Revenues | 2,022 | | | 1,317 | | | 54 | | | 1,317 | | | 1,129 | | | 17 | |
| Other operating expenses | 1,137 | | | 698 | | | 63 | | | 698 | | | 539 | | | 30 | |
| Depreciation and amortization | 951 | | | 626 | | | 52 | | | 626 | | | 442 | | | 41 | |
| Acquisition-related transaction and integration costs | 104 | | | 269 | | | (61) | | | 269 | | | 91 | | | 194 | |
| Operating expenses | 2,192 | | | 1,593 | | | 38 | | | 1,593 | | | 1,072 | | | 49 | |
| Operating income/(loss) | $ | (170) | | | $ | (276) | | | (38)% | | $ | (276) | | | $ | 57 | | | n/a |
| | | | | | | | | | | |
| Recurring revenues | $ | 1,555 | | | $ | 961 | | | 62 | % | | $ | 961 | | | $ | 643 | | | 50 | % |
| Transaction revenues | $ | 467 | | | $ | 356 | | | 31 | % | | $ | 356 | | | $ | 486 | | | (27) | % |
*Percentage changes in the table above deemed "n/a" are not meaningful.
In the table above, we consider subscription fee and certain other revenues to be recurring revenues. Each revenue classification above contains a mix of recurring and transaction revenues, based on the various service offerings described in more detail below.
Mortgage Technology Revenues
Our mortgage technology revenues are derived from our comprehensive, end-to-end U.S. residential mortgage platform. Our mortgage technology business is intended to enable greater workflow efficiency and mitigate risks for customers throughout the mortgage life cycle. Black Knight contributed $1.1 billion and $363 million of revenues in 2024 and 2023, respectively, following completion of the acquisition.
•Origination technology: Our origination technology revenues increased 3% in 2024 from 2023 primarily due to incremental origination technology revenue contributed by Black Knight following completion of our acquisition in September 2023. Our origination technology acts as a system of record for the mortgage transaction, automating the gathering, reviewing, and verifying of mortgage-related information and enabling automated enforcement of rules and business practices designed to help ensure that each completed loan transaction is of high quality and adheres to secondary market standards. These revenues are based on recurring Software as a Service, or SaaS, subscription fees, with an additive transaction-based or success-based pricing fee as lenders exceed the number of loans closed that are included with their monthly base subscription, as well as professional services.
In addition, the ICE Mortgage Technology network provides originators connectivity to the mortgage supply chain and facilitates the secure exchange of information between our customers and a broad ecosystem of third-party service providers, as well as lenders and investors that are critical to consummating the millions of loan transactions that occur on our origination network each year. Revenue from the ICE Mortgage Technology network is largely transaction-based.
•Closing solutions: Our closing solutions revenues increased 13% in 2024 from 2023 primarily driven by increased market share and continued adoption of digital solutions. Our closing solutions connect key participants, such as lenders, title and settlement agents and individual county recorders, to digitize the closing and recording process. Closing solutions also include revenues from our MERSCORP Holdings, Inc., or MERS database, which provides a system of record for recording and tracking changes, servicing rights and beneficial ownership interests in loans secured by U.S. residential real estate. Revenues from closing solutions are largely transaction-based and are based on the volume of loans closed.
•Servicing software: Our servicing software revenues increased $560 million in 2024 from 2023 due to a full year of servicing software revenue contributed by Black Knight following completion of our acquisition in September 2023. Our servicing software revenues include integrated mortgage servicing solutions, which help automate all areas of the servicing process, from loan boarding to final payment or default, to help lower costs, reduce risk and improve financial performance. Our servicing solutions support first lien mortgages, home equity loans and lines of credit on a single platform to manage all servicing processes, including loan setup and maintenance, escrow administration, investor reporting, and regulatory requirements. We also provide solutions that provide consumers with access to customized, timely information about their mortgages and allow our clients’ customer service representatives to access the same customer information, which is key to increasing borrower retention. Another
servicing solution provides clients, third-party providers and their developers access to our growing catalog of APIs across the mortgage life cycle. Revenues from servicing solutions are largely subscription-based and recurring in nature based on number of loans serviced.
Our default servicing solutions help simplify the complex process for loans that move into default, while supporting servicers with their compliance requirements and to facilitate more efficient loss mitigation processes.
We also offer advanced technology to support the bankruptcy and foreclosure process, and more efficiently manage claims related to properties in foreclosure, as well as tools to support loss analysis, to help servicers make the right decisions at the right time. Revenues from default servicing solutions are largely transaction-based and are based on number of foreclosures.
•Data and Analytics: Our Data and Analytics revenues increased 66% in 2024 from 2023 primarily due to the incremental revenue contributed by Black Knight following completion of our acquisition in September 2023. Data and Analytics revenues include those related to ICE Mortgage Technology's Data & Document Automation and Mortgage Analyzer solutions, or Analyzer, which offers customers greater efficiency by streamlining data collection and validation through our automated document recognition and data extraction capabilities. Analyzer revenues can be both recurring and transaction-based in nature. In addition, our data offerings include real-time industry and peer benchmarking tools, which provide originators a granular view into the real-time trends of the U.S. residential mortgage market, as well as credit and prepayment models, custom and proprietary analytics, valuation, and MLS solutions. We also provide de-identified mortgage origination data for lenders and industry participants to access industry data and origination information. Revenues related to our data products are largely subscription-based and recurring in nature. The data and insights from these solutions inform, support and enhance our other solutions to help lenders and servicers make more informed decisions, improve performance, identify and predict risk and generate more qualified leads.
Our data and analytics offerings include property ownership data, lien data, servicing data, automated valuation models and collateral risk scores, among others, provided to clients in the mortgage, real estate and capital markets verticals.
Operating Expenses, Operating Income and Operating Margin
The following chart summarizes our Mortgage Technology segment's operating expenses, operating income and operating margin (dollars in millions). The primary driver of the increase in operating expenses is related to the impact of the Black Knight acquisition and the corresponding Black Knight related operating expenses. The resulting operating losses and negative margins are primarily related to the acquisition-related transaction and integration costs incurred during the years presented. See “- Consolidated Operating Expenses” below for a discussion of the significant changes in our operating expenses.
| | | | | | | | | | | | | | | | | | | | | | | | | | | | | | | | | | | |
| Mortgage Technology Segment: | Year Ended December 31, | | | | Year Ended December 31, | | |
| 2024 | | 2023 | | Change* | | 2023 | | 2022 | | Change |
| Operating expenses | $ | 2,192 | | | $ | 1,593 | | | 38 | % | | $ | 1,593 | | | $ | 1,072 | | | 49 | % |
Adjusted operating expenses(1) | $ | 1,298 | | | $ | 809 | | | 60 | % | | $ | 809 | | | $ | 618 | | | 31 | % |
| Operating income/(loss) | $ | (170) | | | $ | (276) | | | (38) | % | | $ | (276) | | | $ | 57 | | | n/a |
Adjusted operating income(1) | $ | 724 | | | $ | 508 | | | 43 | % | | $ | 508 | | | $ | 511 | | | (1) | % |
| Operating margin | (8) | % | | (21) | % | | 13 pts | | (21) | % | | 5 | % | | (26 pts) |
Adjusted operating margin(1) | 36 | % | | 39 | % | | (3 pts) | | 39 | % | | 45 | % | | (6 pts) |
*Percentage changes in the table above deemed "n/a" are not meaningful.
(1) The adjusted figures exclude items that are not reflective of our ongoing core operations and business performance. These adjusted numbers are not calculated in accordance with GAAP. See “- Non-GAAP Financial Measures” below.
Consolidated Operating Expenses
The following presents our consolidated operating expenses (dollars in millions):
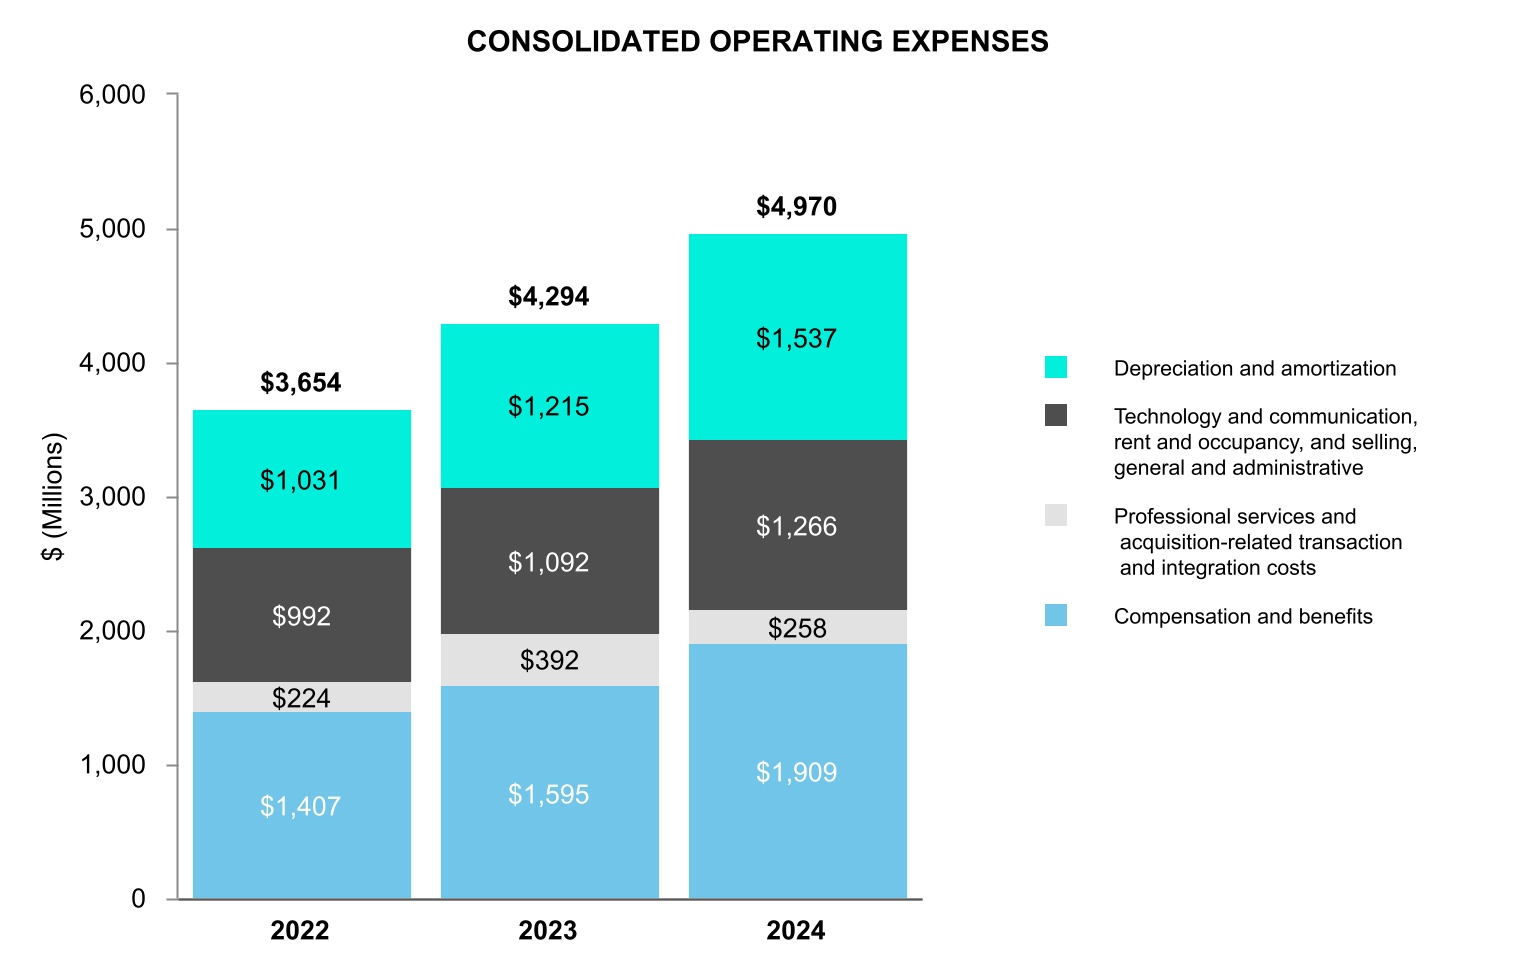
| | | | | | | | | | | | | | | | | | | | | | | | | | | | | | | | | | | |
| Year Ended December 31, | | | | Year Ended December 31, | | |
| 2024 | | 2023 | | Change | | 2023 | | 2022 | | Change |
| Compensation and benefits | $ | 1,909 | | | $ | 1,595 | | | 20 | % | | $ | 1,595 | | | $ | 1,407 | | | 13 | % |
| Professional services | 154 | | | 123 | | 25 | % | | 123 | | | 131 | | | (6) | |
| Acquisition-related transaction and integration costs | 104 | | | 269 | | (61) | % | | 269 | | | 93 | | | 189 | |
| Technology and communication | 848 | | | 734 | | 16 | % | | 734 | | | 683 | | | 8 | |
| Rent and occupancy | 111 | | | 92 | | 21 | % | | 92 | | | 83 | | | 10 | |
| Selling, general and administrative | 307 | | | 266 | | 15 | % | | 266 | | | 226 | | | 17 | |
| Depreciation and amortization | 1,537 | | | 1,215 | | 27 | % | | 1,215 | | | 1,031 | | | 18 | |
| Total operating expenses | $ | 4,970 | | | $ | 4,294 | | | 16 | % | | $ | 4,294 | | | $ | 3,654 | | | 18 | % |
The majority of our operating expenses do not vary directly with changes in our volume and revenues, except for certain technology and communication expenses, including data acquisition costs, licensing and other fee-related arrangements and a portion of our compensation expense that is tied directly to our data sales or overall financial performance.
We expect our operating expenses to increase in absolute terms in future periods in connection with the growth of our business, and to vary from year-to-year based on the type and level of our acquisitions, integration of acquisitions, and other investments.
In 2024 and 2023, 8% and 9%, respectively, of our operating expenses were billed in pounds sterling or euros. Due to fluctuations in the U.S. dollar compared to the pound sterling and euro, our consolidated operating expenses were $8 million higher in 2024 than in 2023. See Item 7(A) “- Quantitative and Qualitative Disclosures About Market Risk - Foreign Currency Exchange Rate Risk” below for additional information.
Compensation and Benefits Expenses
Compensation and benefits expense is our most significant operating expense and includes non-capitalized employee wages, bonuses, non-cash or stock compensation, certain severance costs, benefits and employer payroll taxes. The bonus and stock compensation components of our compensation and benefits expense are based on both our financial performance and individual employee performance. Therefore, our compensation and benefits expense will vary year-to-year based on our financial performance and fluctuations in our number of employees. The below chart summarizes the significant drivers of our compensation and benefits expense results for the periods presented (dollars in millions, except employee headcount).
| | | | | | | | | | | | | | | | | | |
| Year Ended December 31, | | | |
| 2024 | | 2023 | | | Change |
| Employee headcount | 12,920 | | | 13,046 | | | | (1) | % |
| Stock-based compensation expenses | $ | 212 | | | $ | 197 | | | | 8 | % |
Compensation and benefits expense increased $314 million in 2024 from 2023 primarily due to incremental expense of $269 million attributable to our acquisition of Black Knight and higher payroll, bonus and noncash performance-based restricted stock compensation expenses due to merit and performance, partially offset by higher capitalized labor. The stock-based compensation expenses in the table above relate to employee stock option and restricted stock awards and exclude stock-based compensation related to acquisition-related transaction and integration costs.
Professional Services Expenses
Professional services expense includes fees for consulting services received on strategic and technology initiatives, temporary labor, as well as regulatory, legal and accounting fees, and may fluctuate as a result of changes in our use of these services in our business.
Professional services expenses increased $31 million in 2024 from 2023 primarily due to $6 million in incremental expense attributable to our acquisition of Black Knight, combined with increases in NYSE regulatory consulting and general legal matter expenses.
Acquisition-Related Transaction and Integration Costs
In 2024, we incurred $104 million in acquisition-related transaction and integration costs primarily due to integration expenses related to Black Knight. In 2023, we incurred $269 million in acquisition-related transaction and integration costs primarily due to legal, banker, consulting and integration expenses related to our acquisition and integration of Black Knight and our integration of Ellie Mae. Included in the acquisition-related transaction and integration costs in 2023 were $55 million of Black Knight replacement restricted stock awards that accelerated due to the Divestitures and certain terminations.
We expect to continue to explore and pursue various potential acquisitions and other strategic opportunities to strengthen our competitive position and support our growth. As a result, we may incur acquisition-related transaction costs in future periods.
Technology and Communication Expenses
Technology support services consist of costs for running our wholly-owned data centers, hosting costs paid to third-party data centers, and maintenance of our computer hardware and software required to support our technology and cybersecurity. These costs are driven by system capacity, functionality and redundancy requirements. Communication expenses consist of costs for network connections for our electronic platforms and telecommunications costs.
Technology and communications expense also includes fees paid for access to external market data, licensing and other fee agreement expenses. Technology and communications expenses may be impacted by growth in electronic contract volume, our capacity requirements, changes in the number of telecommunications hubs and connections with customers to access our electronic platforms directly.
Technology and communications expenses increased by $114 million in 2024 from 2023, primarily due to hardware and software support costs and data services expenses, mainly at Black Knight, combined with rising revenues on certain products causing an increase in our revenue share.
Rent and Occupancy Expenses
Rent and occupancy expense relates to leased and owned property and includes rent, maintenance, real estate taxes, utilities and other related costs. We have significant operations located in the U.S., U.K., and India, with smaller offices located throughout the world.
Rent and occupancy expenses increased $19 million in 2024 from 2023, primarily due to duplicate rent expenses related to our London and New York leased offices and incremental increases attributable to Black Knight offices. See Item 2 “- Properties” above for additional information regarding our leased and owned property.
Selling, General and Administrative Expenses
Selling, general and administrative expenses include marketing, advertising, public relations, insurance, bank service charges, dues and subscriptions, travel and entertainment, non-income taxes and other general and administrative costs.
Selling, general and administrative expenses increased $41 million in 2024 from 2023, primarily due to $20 million in incremental costs attributable to Black Knight and increases in other underlying costs, including customer acquisition costs from higher IPO activity, marketing, travel and entertainment. In addition, we also incurred a $10 million expense in 2024 for valid claims made following an equity trading issue at NYSE that occurred in June 2024, which is net of insurance proceeds, and $15 million of accruals related to a regulatory matters. These increases were partially offset by 2023 expenses, including a $6 million expense for claims made following a NYSE system outage in January 2023, and an $11 million regulatory matter expense.
Depreciation and Amortization Expenses
Depreciation and amortization expense results from depreciation of long-lived assets such as buildings, leasehold improvements, aircraft, hardware and networking equipment, purchased software, internally-developed software, furniture, fixtures and equipment over their estimated useful lives. This expense includes amortization of intangible assets obtained in our acquisitions of businesses over their estimated useful lives. Intangible assets subject to amortization consist primarily of customer relationships, technology, data and databases and trademarks and trade names.
We recorded amortization expenses on intangible assets acquired as part of our acquisitions, as well as on other intangible assets, of $1.0 billion and $749 million in 2024 and 2023, respectively. During 2024, $427 million in amortization expense was related to intangible assets acquired in connection with our Black Knight acquisition, as compared to $141 million in 2023. Amortization expense includes a $3 million impairment charge related to developed technology and a $7 million impairment charge related to a trademark intangible for 2024 and 2023, respectively.
We recorded depreciation expenses on our fixed assets of $525 million and $466 million in 2024 and 2023, respectively. The increase in 2024 over 2023 was primarily due to depreciation of fixed assets in connection with our Black Knight acquisition of $37 million in 2024, as compared to $9 million in 2023, and increases in internally developed software and leasehold improvements.
Consolidated Non-Operating Income/(Expense)
Income and expenses incurred through activities outside of our core operations are considered non-operating. The following tables present our non-operating income/(expenses) (dollars in millions):
| | | | | | | | | | | | | | | | | | | | | | | | | | | | | | | | | | | |
| Year Ended
December 31, | | | | Year Ended
December 31, | | |
| 2024 | | 2023 | | Change | | 2023 | | 2022 | | Change* |
| Other income/(expense): | | | | | | | | | | | |
| Interest income | $ | 141 | | | $ | 319 | | | (56) | % | | $ | 319 | | | $ | 108 | | | 195 | % |
| Interest expense | (910) | | | (808) | | | 13 | | | (808) | | | (616) | | | 31 | |
| Other income/(expense), net | 88 | | | (311) | | | n/a | | (311) | | | (1,322) | | | (76) | |
| Total other income/(expense), net | $ | (681) | | | $ | (800) | | | (15) | % | | $ | (800) | | | $ | (1,830) | | | (56) | % |
| Net income attributable to non-controlling interests | $ | (48) | | | $ | (70) | | | (31) | % | | $ | (70) | | | $ | (52) | | | 35 | % |
*Percentage changes in the table above deemed "n/a" are not meaningful.
Interest Income
During 2024 and 2023 we earned interest income of $141 million and $319 million, respectively. Interest income decreased in 2024 from 2023 primarily due to decreased investment balances following the Black Knight acquisition.
In 2024 we earned $18 million in interest income on short term investments related to $500 million of the net proceeds from the 2031 Notes which we intend to use to repay a portion of the aggregate principal amount of the 2025 Notes at their maturity.
In 2023 we earned $213 million in interest income on the short-term investments related to the $5.0 billion of senior notes issued in connection with, and the operating cash accumulated for, the Black Knight acquisition.
In addition, our clearing houses also earned interest income of $93 million in 2024 and $88 million in 2023. The remainder primarily relates to interest earned on various unrestricted and restricted cash balances held within our other group entities.
Interest Expense
In 2024 and 2023, we incurred interest expense of $910 million and $808 million, respectively. Interest expense increased primarily due to increased borrowings raised to fund the Black Knight acquisition. In 2024 and 2023, we incurred Interest expense of $763 million and $703 million, respectively, on our senior notes. In 2024 and 2023, we incurred interest expense of $132 million and $88 million, respectively, on borrowings under our Commercial Paper Program and Term Loan facility (each as defined in "Liquidity and Capital Resources—Debt"), both of which partially funded the Black Knight acquisition. The remainder primarily relates to fees incurred on maintaining our revolving credit facility and other facilities within our group entities. See “— Debt” below.
Other Income/(Expense), net
Equity investments and equity method investments
Our equity method investments include OCC and Bakkt, among others. We recognized losses of $62 million and $122 million during 2024 and 2023, respectively, of our share of estimated equity method investment losses, net, which are included in other income/(expense), net. The estimated losses during 2024 and 2023 are primarily related to our investment in Bakkt, partially offset by the estimated profits related to our investment in OCC. Both 2024 and 2023 include adjustments to reflect the difference between reported prior period actual results from our original estimates.
For our equity investments that do not have readily determinable fair values, in 2024 we recorded a net $1 million fair value loss.
In connection with our acquisition of Black Knight, we acquired an investment in Dun & Bradstreet, which we classified as an equity investment. Subsequent to the Black Knight acquisition and prior to December 31, 2023, we sold the entire investment for a total of $187 million and realized a total loss of $3 million on the sales, net of dividends received, which is included in other income/(expense), net, in 2023.
Legal & regulatory
In 2024, we recorded a gain of $160 million related to the Penny Mac arbitration final award payment.
Other
In connection with our sale of Black Knight’s Optimal Blue and Empower LOS businesses we received a Promissory Note as part of the sale proceeds that was originally valued at $235 million on the Divestiture Date. As we elected the fair value option for the Promissory Note, we were required to mark the asset to fair value each reporting period. For subsequent measurement as of December 31, 2023, we wrote down the value of the Promissory Note, resulting in a fair value loss of $160 million, which was included in other income/(expense), net, in 2023.
In 2023, we recorded an impairment related to our CAT loan receivable of $16 million.
In 2024, we recorded a $6 million gain on a sale of property and equipment.
We incurred foreign currency transaction losses of $15 million and $12 million in 2024 and 2023, respectively. This was primarily attributable to the fluctuations of the pound sterling and euro relative to the U.S. dollar. Foreign currency transaction gains and losses are recorded in other income/(expense), net, when the settlement of foreign currency assets, liabilities and payables occur in non-functional currencies and there is an increase or decrease in the period-end foreign
currency exchange rates between periods. See Item 7A “- Quantitative and Qualitative Disclosures About Market Risk -Foreign Currency Exchange Rate Risk” included elsewhere in this Annual Report for more information on these items.
We recognized the other components of net benefit cost of our defined benefit plans in the income statement as non-operating income. The combined net periodic impact of these plans was a $1 million expense and a $2 million benefit in 2024 and 2023, respectively.
Non-Controlling Interests
For consolidated subsidiaries in which our ownership is less than 100%, and for which we have control over the assets, liabilities and management of the entity, the outside stockholders’ interests are shown as non-controlling interests. As of December 31, 2024, our non-controlling interests include those related to the non-ICE limited partners' interest in our CDS clearing subsidiaries and non-controlling interest in ICE Futures Abu Dhabi.
As of December 31, 2024, we also had redeemable non-controlling interests, reflected in temporary equity within our consolidated balance sheet, related to a put right held by non-ICE members to require us to purchase their interests in an entity acquired by us in 2024.
Consolidated Income Tax Provision
Consolidated income tax expense was $826 million and $456 million in 2024 and 2023, respectively. The increase in our consolidated income tax expense between years is primarily due to higher pre-tax income and a higher effective tax rate.
Our effective tax rate was 23% and 16% in 2024 and 2023, respectively. The 23% effective tax rate in 2024 was above the statutory federal income tax rate primarily due to state and local income taxes, including the impacts of recording valuation allowances on certain state deferred tax assets, partially offset by favorable state apportionment changes and statutes of limitations expirations.
The 16% effective tax rate in 2023 was below the statutory federal income tax rate primarily driven by the following factors: favorable audit settlements for historical years, favorable state apportionment changes and the application of the high-tax exception to Global Intangible Low-Taxed Income. These benefits were partially offset by the impact of the U.K. corporate income tax increase from 19% to 25% effective April 1, 2023, and the tax impact of certain non-deductible Black Knight acquisition costs.
The Organisation for Economic Cooperation and Development, or OECD, Global Anti-Base Erosion Pillar Two minimum tax rules, or Pillar Two, which generally provide for a minimum effective tax rate of 15%, are intended to apply to tax years beginning in 2024. The EU member states and many other countries, including the U.K., our most significant non-U.S. jurisdiction, have committed to implement or have already enacted legislation adopting the Pillar Two rules. In July 2023, the U.K. enacted the U.K. Finance Act 2023, effective as of January 1, 2024, which included provisions to implement certain portions of the OECD Global Anti-Base Erosion Pillar Two minimum tax rules and included an election to apply a transitional safe harbor to extend certain effective dates to accounting periods commencing on or before December 31, 2026 and ending on or before June 30, 2028. These Pillar Two rules, including those in the U.K., did not have a material impact on our income tax provision as of December 31, 2024 or 2023.
See Note 13 to our consolidated financial statements and related notes, which are included in this Annual Report, for additional information on these tax items.
Liquidity and Capital Resources
Below are charts that reflect our outstanding debt and capital allocation. The acquisition and integration costs in the chart below include cash paid for acquisitions, net of cash acquired and cash received for divestitures, cash paid for equity and equity method investments, and acquisition-related transaction and integration costs, in each year.
(1) 2022 and 2023 acquisition and integration costs, net of divestitures excludes $741 million and $187 million of proceeds from sales of our Euroclear and Dun & Bradstreet investments, respectively.
We have financed our operations, growth and cash needs primarily through income from operations and borrowings under our various debt facilities. Our principal capital requirements have been to fund capital expenditures, working capital, strategic acquisitions and investments, stock repurchases, dividends and the development of our technology platforms. We believe that our cash on hand and cash flows from operations will be sufficient to repay our outstanding debt, but we may also incur additional debt or issue additional equity securities in the future. See “- Future Capital Requirements” below.
See “- Cash Flow” below for a discussion of our capital expenditures and capitalized software development costs.
Consolidated cash and cash equivalents were $844 million and $899 million as of December 31, 2024 and 2023, respectively. We had $1.5 billion and $871 million in short-term and long-term restricted cash and cash equivalents as of December 31, 2024 and 2023, respectively. We had $594 million and $680 million in short-term restricted investments as of December 31, 2024 and 2023, respectively. We had $82.1 billion and $79.0 billion of cash and cash equivalent margin deposits and guaranty funds as of December 31, 2024 and 2023, respectively.
As of December 31, 2024, the amount of unrestricted cash held by our non-U.S. subsidiaries was $370 million. Due to the application of Global Intangible Low-Taxed Income as of January 1, 2018, the majority of our foreign earnings for the period January 1, 2018 through December 31, 2022 have been subject to immediate U.S. income taxation, and can be distributed to the U.S. in the future with no material additional U.S. income tax consequences. We made and intend to apply the high tax exception to Global Intangible Low-Taxed Income in 2023 and 2024, respectively, and thus the majority of our foreign earnings in 2023 and 2024 are not expected to be subject to immediate U.S. income taxation. However, these foreign earnings can also generally be distributed to the U.S. with no material additional U.S. income tax consequences, primarily due to the availability of dividend received deductions.
Our cash and cash equivalents and financial investments are managed as a global treasury portfolio of non-speculative financial instruments that are readily convertible into cash, such as overnight deposits, term deposits, money market funds, mutual funds for treasury investments, short duration fixed income investments and other money market instruments, thus ensuring high liquidity of financial assets. We may invest a portion of our cash in excess of short-term operating needs in investment-grade marketable debt securities, including government or government-sponsored agencies and corporate debt securities.
Cash Flow
The following table presents the major components of net changes in cash and cash equivalents, and restricted cash and cash equivalents (in millions):
| | | | | | | | | | | | | | | | | | |
| Year Ended December 31, |
| 2024 | | 2023 | | 2022 | |
| Net cash provided by/(used in): | | | | | | |
| Operating activities | $ | 4,609 | | | $ | 3,542 | | | $ | 3,554 | | |
| Investing activities | (921) | | | (8,797) | | | 677 | | |
| Financing activities | 79 | | | (64,345) | | | (1,841) | | |
| Effect of exchange rate changes | (14) | | | 7 | | | (23) | | |
| Net increase/(decrease) in cash, cash equivalents, restricted cash and cash equivalents, and cash and cash equivalent margin deposits and guaranty funds | $ | 3,753 | | | $ | (69,593) | | | $ | 2,367 | | |
Operating Activities
Net cash provided by operating activities primarily consists of net income adjusted for certain non-cash items, including depreciation and amortization, deferred taxes, stock-based compensation and the effects of changes in working capital.
The $1.1 billion increase in net cash provided by operating activities during the year ended December 31, 2024 from the comparable period in 2023 was primarily driven by the following:
•An increase in net income, excluding depreciation and amortization, of $686 million which is primarily related to the full period impact of the Black Knight acquisition combined with increases in operating income from the Exchanges segment.
•An increase in changes in working capital accounts of $451 million, including the following:
◦A change of $381 million related to the timing of the Section 31 fee rate changes and payments; and
◦A net increase of $70 million related to changes in other underlying working capital accounts, primarily due to timing of payments and receipts.
Investing Activities
The $7.9 billion decrease in cash used in investing activities during the year ended December 31, 2024 from the comparable period in 2023 was primarily driven by the following:
•A decrease in cash paid for acquisitions, net of cash acquired, of $10.2 billion primarily related to the Black Knight acquisition in September 2023;
•Net proceeds from our restricted investments of $103 million during the year ended December 31, 2024 as compared to net purchases of $671 million during the year ended December 31, 2023. The net purchases of $671 million during the year ended December 31, 2023 primarily consisted of short-term restricted investments purchased by ICE Clear Europe for regulatory capital requirements of which $680 million matured during the year ended December 31, 2024. This was partially offset by the $500 million of net proceeds from the offering of our 2031 Notes during the year ended December 31, 2024 that have been invested and will be used to repay our senior notes maturing in May 2025;
•Proceeds of $75 million that we received from the sale of the Promissory Note during the year ended December 31, 2024;
•Capital expenditures and capitalized software development costs increased $263 million driven by full period Black Knight activity combined with leasehold improvements and build-out of our new offices and one of our existing data centers;
•During the year ended December 31, 2024, we had purchases of equity and equity method investments of $29 million as compared to net proceeds of $179 million during the year ended December 31, 2023. The net proceeds were due to the sale of our Dun & Bradstreet investment for $187 million, partially offset by equity investment purchases; and
•During the year ended December 31, 2024, we had net purchases of $294 million from the invested margin deposit activity compared to net proceeds of $2.4 billion during the year ended December 31, 2023. These amounts fluctuate based on clearinghouse treasury investment activity related to collateral and liquidity management.
Financing Activities
The $64.4 billion change in financing cash flows from cash used in financing activities in 2023 to cash provided by financing activities in 2024 was primarily driven by the following:
•The change in cash and cash equivalent margin deposits and guaranty fund liability of $68.9 billion due to reduced volatility from 2022 to 2023 which impacted the prior year change;
•During the year ended December 31, 2024, we had net repayments of debt of $861 million, primarily due to the repayment of the Term Loan, partially offset by the issuance of the 2031 Notes. During the year ended December 31, 2023, we had net proceeds from debt issuances of $114 million primarily due to funding of the Black Knight acquisition;
•During the year ended December 31, 2024, we had net redemptions of commercial paper of $1.4 billion as compared to net proceeds of $2.0 billion during the year ended December 31, 2023. Our commercial paper issuances and subsequent redemptions were related to financing the Black Knight acquisition; and
•Dividends paid to stockholders increased $84 million primarily due to the increase in the dividend per share for the year ended December 31, 2024 as compared to the year ended December 31, 2023.
Debt
As of December 31, 2024, we had $20.4 billion in outstanding debt, consisting of $19.8 billion of senior notes and $529 million under our Commercial Paper Program. As of December 31, 2024, our senior notes of $19.8 billion had a weighted average maturity of 13 years and a weighted average cost of 3.7% per annum. As of December 31, 2024, our Commercial Paper notes outstanding had original maturities ranging from 6 to 20 days with a weighted average interest rate of 4.6% per annum, and a weighted average remaining maturity of 14 days.
As of December 31, 2023, we had $22.6 billion in outstanding debt, consisting of $19.0 billion of senior notes, $2.0 billion under our Commercial Paper Program and $1.6 billion under our Term Loan. As of December 31, 2023, our senior notes of $19.0 billion had a weighted average maturity of 15 years and a weighted average cost of 3.6% per annum. This included the $1.0 billion principal amount of Black Knight InfoServ LLC's 3.625% senior notes due 2028, or the Black Knight Notes, that became part of ICE's consolidated long-term debt on the acquisition date of September 5, 2023 and remained outstanding as of December 31, 2023. Our Commercial Paper notes had original maturities of 4 to 45 days, with a weighted average interest rate of 5.70% per annum and a weighted average maturity of 32 days. Our Term Loan had a maturity date of August 31, 2025 and bore interest at a rate of 6.3% as of December 31, 2023.
We have a $3.9 billion senior unsecured revolving credit facility, or the Credit Facility, with a maturity date of May 31, 2029. As of December 31, 2024, of the $3.9 billion that was available for borrowing under the Credit Facility, $529 million was required to backstop the amount outstanding under the Commercial Paper Program and $172 million was required to support certain broker-dealer and other subsidiary commitments. Amounts required to backstop notes outstanding under the Commercial Paper Program will fluctuate as we increase or decrease our commercial paper borrowings. The remaining $3.2 billion is available for working capital and general corporate purposes, including, but not limited to, acting as a backstop to future increases in the amounts outstanding under the Commercial Paper Program.
On May 23, 2022, we issued $8.0 billion in aggregate principal amount of new senior notes, comprised of the following:
•$1.25 billion in aggregate principal amount of 3.65% senior notes due in 2025, or the 2025 Notes;
•$1.5 billion in aggregate principal amount of 4.00% senior notes due in 2027, or the 2027 Notes;
•$1.25 billion in aggregate principal amount of 4.35% senior notes due in 2029, or the 2029 Notes;
•$1.5 billion in aggregate principal amount of 4.60% senior notes due in 2033, or the 2033 Notes;
•$1.5 billion in aggregate principal amount of 4.95% senior notes due in 2052, or the 2052 Notes; and
•$1.0 billion in aggregate principal amount of 5.20% senior notes due in 2062, or the 2062 Notes.
We used the net proceeds of our senior notes due in 2025, 2027, 2029 and 2062, or collectively, the Notes, together with the issuance of commercial paper, cash on hand and borrowings under the Term Loan, to finance the cash portion of the purchase price for Black Knight. For additional information regarding this transaction, refer to Note 3 to our consolidated unaudited financial statements, included in this Annual Report.
We used the $3.0 billion of net proceeds from the offering of the 2033 Notes and the 2052 Notes to redeem $2.7 billion aggregate principal amount of four series of senior notes that would have matured in 2022 and 2023. The balance of the net proceeds was used for general corporate purposes, which included paying down a portion of the amounts outstanding under our Commercial Paper Program. We recorded $30 million in costs associated with the extinguishment and re-financing of our existing debt in connection with our May 2022 debt refinancing. These costs are included in interest expense in our consolidated statements of income for 2022. For additional information regarding this transaction, refer to Note 3 to our consolidated unaudited financial statements, included in this Annual Report.
On June 5, 2024, we completed a private offer to exchange the $1 billion aggregate principal amount of the outstanding 3.625% senior notes due 2028 issued by Black Knight InfoServ, LLC, or the Black Knight Notes, for new senior notes issued by ICE. As a result of the settlement of the private exchange offer, approximately $998 million in aggregate principal amount of outstanding Black Knight Notes were cancelled, and ICE issued approximately $998 million in aggregate principal amount of new senior notes, or the ICE Original Exchange Notes, with the same interest payment, maturity dates and interest rate as the Black Knight Notes.
On September 10, 2024, we completed a registered exchange offer in which virtually all previously outstanding ICE Original Exchange Notes were exchanged for identical new senior notes that were registered under the Securities Act of 1933, or the ICE Registered Exchange Notes, and thereby became freely transferable, subject to certain restrictions applicable to affiliates and broker dealers.
On May 13, 2024, we issued $750 million in aggregate principal amount of 5.25% senior notes due 2031, or the 2031 Notes. We intend to use $500 million of the net proceeds from the offering of the 2031 Notes to repay a portion of the aggregate principal amount of the senior notes maturing in May 2025, or the 2025 Notes. The net proceeds intended to repay the 2025 Notes have been invested and recorded as short-term restricted investments in our consolidated balance sheet as of December 31, 2024. We used the remaining net proceeds to assist with the repayments of the outstanding borrowings under the senior unsecured delayed draw term loan facility, or the Term Loan.
We previously had a $2.4 billion two-year Term Loan, that we entered into on May 25, 2022. Draws under the Term Loan bore interest on the principal amount outstanding at either (a) Term Secured Overnight Financing Rate, or Term SOFR,
plus an applicable margin of 87.5 basis points plus a credit spread adjustment of 10 basis points or (b) a "base rate" plus an applicable margin. The applicable margin ranged from 0.625% to 1.125% for Term SOFR loans and from 0.000% to 0.125% for base rate loans, in each case, based on a ratings-based pricing grid. The proceeds from borrowings under the Term Loan were used to fund a portion of the purchase price for the Black Knight acquisition. During the second quarter of 2024, we fully repaid our outstanding obligations under the Term Loan and debt issuance costs incurred related to the Term Loan were fully amortized at the time of repayment.
Our Commercial Paper Program enables us to borrow efficiently at reasonable short-term interest rates and provides us with the flexibility to de-lever using our strong annual cash flows from operating activities whenever our leverage becomes elevated as a result of investment or acquisition activities.
Upon maturity of our commercial paper and to the extent old issuances are not repaid by cash on hand, we are exposed to the rollover risk of not being able to issue new commercial paper. To mitigate this risk, we maintain the Credit Facility for an aggregate amount which meets or exceeds the amount issued under our Commercial Paper Program at any time. If we were not able to issue new commercial paper, we have the option of drawing on the backstop revolving facility. However, electing to do so would result in higher interest expense.
For additional details of our debt instruments, refer to Note 10 to our consolidated financial statements, included in this Annual Report.
Capital Return
In December 2021, our Board approved an aggregate of $3.15 billion for future repurchases of our common stock with no fixed expiration date that became effective January 1, 2022. The approval of our Board for stock repurchases does not obligate us to acquire any particular amount of our common stock. In addition, our Board may increase or decrease the amount available for repurchases from time to time. Shares repurchased are held in treasury stock.
In December 2021 we entered into a new Rule 10b5-1 trading plan that became effective in February 2022. In connection with our acquisition of Black Knight, on May 4, 2022, we terminated our Rule 10b5-1 trading plan and suspended share repurchases. Therefore, we did not have any share repurchases in 2024 and 2023. During 2022 we repurchased 5.0 million shares of our outstanding common stock at a cost of $632 million, excluding shares withheld upon vesting of equity awards, including 4.6 million shares at a cost of $582 million under our Rule 10b5-1trading plan and 0.4 million shares at a cost of $50 million on the open market. Open market repurchases are only made during an open trading period. The remaining balance of Board approved funds for future repurchase as of December 31, 2024 was $2.5 billion. In December 2024, our Board reauthorized the remaining balance of $2.5 million for future repurchases.
We may begin or discontinue stock repurchases at any time and may enter into, amend or terminate a Rule 10b5-1 trading plan at any time, subject to applicable rules. From time to time, we have entered, and in the future may enter, into Rule 10b5-1 trading plans, as authorized by our Board, to govern some or all of the repurchases of our shares of common stock. We expect funding for any stock repurchases to come from our operating cash flow or borrowings under our Commercial Paper Program or our debt facilities. The timing and extent of future repurchases that are not made pursuant to a Rule 10b5-1 trading plan will be at our discretion and will depend upon many conditions. In making a determination regarding any stock repurchases, management considers multiple factors, including overall stock market conditions, our common stock price performance, the remaining amount authorized for repurchases by our Board, the potential impact of a stock repurchase program on our corporate debt ratings, our expected free cash flow and working capital needs, our current and future planned strategic growth initiatives, and other potential uses of our cash and capital resources.
During 2024, we paid cash dividends of $1.80 per share of our common stock in the aggregate, including quarterly dividends of $0.45 per share, for an aggregate payout of $1.0 billion, which includes the payment of dividend equivalents on unvested employee restricted stock units. Refer to Note 12 to our consolidated financial statements included in this Annual Report, for details on the amounts of our quarterly dividend payouts for the last three years.
Future Capital Requirements
Our future capital requirements will depend on many factors, including the rate of growth across our segments, strategic plans and acquisitions, available sources for financing activities, required and discretionary technology and clearing initiatives, regulatory requirements, the timing and introduction of new products and enhancements to existing products, the geographic mix of our business and potential stock repurchases.
We currently expect to incur capital expenditures (including operational and real estate capital expenditures) and to incur software development costs that are eligible for capitalization ranging in the aggregate between $730 million and
$780 million in 2025, which we believe will support the enhancement of our technology, business integration and the continued growth of our businesses.
As of December 31, 2024, we had $2.5 billion authorized for future repurchases of our common stock, which amount was reauthorized by our board in December 2024. We expect to resume repurchases of our common stock in the first quarter of 2025. Refer to Note 12 to our consolidated financial statements included in this Annual Report for additional details on our stock repurchase program.
Our Board has adopted a quarterly dividend policy providing that dividends will be approved quarterly by the Board or the Audit Committee taking into account factors such as our evolving business model, prevailing business conditions, our current and future planned strategic growth initiatives and our financial results and capital requirements, without a predetermined net income payout ratio. On February 6, 2025, we announced a $0.48 per share dividend for the first quarter of 2025 payable on March 31, 2025 to stockholders of record as of March 17, 2025.
Other than the facilities for the ICE Clearing Houses, our Credit Facility and our Commercial Paper Program are currently the only significant agreements or arrangements that we have for liquidity and capital resources with third parties. See Notes 10 and 14 to our consolidated financial statements for further discussion. In the event of any strategic acquisitions, mergers or investments, or if we are required to raise capital for any reason or desire to return capital to our stockholders, we may incur additional debt, issue additional equity to raise necessary funds, repurchase additional shares of our common stock or pay a dividend. However, we cannot provide assurance that such financing or transactions will be favorable to us. See “-Risk Factors" and Note 10 to our consolidated financial statements, included in this Annual Report.
Non-GAAP Measures
We use certain financial measures internally to evaluate our performance and make financial and operational decisions that are presented in a manner that adjusts from their equivalent GAAP measures or that supplement the information provided by our GAAP measures. We use these adjusted results because we believe they more clearly highlight trends in our business that may not otherwise be apparent when relying solely on GAAP financial measures, since these measures eliminate from our results specific financial items that have less bearing on our core operating performance.
We use these measures in communicating certain aspects of our results and performance, including in this Annual Report, and believe that these measures, when viewed in conjunction with our GAAP results and the accompanying reconciliation, can provide investors with greater transparency and a greater understanding of factors affecting our financial condition and results of operations than GAAP measures alone. In addition, we believe the presentation of these measures is useful to investors for making period-to-period comparisons of results because the adjustments to GAAP are not reflective of our core business performance.
These financial measures are not presented in accordance with, or as an alternative to, GAAP financial measures and may be different from non-GAAP measures used by other companies. We encourage investors to review the GAAP financial measures included in this Annual Report, including our consolidated financial statements, to aid in their analysis and understanding of our performance and in making comparisons.
The table below outlines our adjusted operating expenses, adjusted operating income, adjusted operating margin, adjusted net income attributable to ICE and adjusted diluted earnings per share, which are non-GAAP measures that are calculated by making adjustments for items we view as not reflective of our cash operations and core business performance. These measures, including the adjustments and their related income tax effect and other tax adjustments (in millions, except for percentages and per share amounts), are as follows:
| | | | | | | | | | | | | | | | | | | | | | | | | | | | | | | | | | | | | | | | | | | | | | | | | | | | | | | | | | | | | | | | | | | | | | | |
| Exchanges Segment | | Fixed Income and Data Services Segment | | Mortgage Technology
Segment | | Consolidated |
| Year Ended December 31, |
| Operating income adjustments: | 2024 | | 2023 | | 2022 | | 2024 | | 2023 | | 2022 | | 2024 | | 2023 | | 2022 | | 2024 | | 2023 | | 2022 |
| Total revenues, less transaction-based expenses | $ | 4,959 | | | $ | 4,440 | | | $ | 4,071 | | | $ | 2,298 | | | $ | 2,231 | | | $ | 2,092 | | | $ | 2,022 | | | $ | 1,317 | | | $ | 1,129 | | | $ | 9,279 | | | $ | 7,988 | | | $ | 7,292 | |
| Operating expenses | 1,323 | | | 1,281 | | | 1,209 | | | 1,455 | | | 1,420 | | | 1,373 | | | 2,192 | | | 1,593 | | | 1,072 | | | 4,970 | | | 4,294 | | | 3,654 | |
| Less: Amortization of acquisition-related intangibles | 67 | | | 65 | | | 67 | | | 152 | | | 168 | | | 180 | | | 792 | | | 515 | | | 363 | | | 1,011 | | | 748 | | | 610 | |
| Less: Transaction and integration costs | — | | | — | | | — | | | — | | | — | | | — | | | 102 | | | 269 | | | 91 | | | 102 | | | 269 | | | 91 | |
| Less: Regulatory matters | 5 | | | 11 | | | — | | | 10 | | | — | | | — | | | — | | | — | | | — | | | 15 | | | 11 | | | — | |
| Less: Other | 11 | | | 6 | | | — | | | 21 | | | — | | | — | | | — | | | — | | | — | | | 32 | | | 6 | | | — | |
| Adjusted operating expenses | $ | 1,240 | | | $ | 1,199 | | | $ | 1,142 | | | $ | 1,272 | | | $ | 1,252 | | | $ | 1,193 | | | $ | 1,298 | | | $ | 809 | | | $ | 618 | | | $ | 3,810 | | | $ | 3,260 | | | $ | 2,953 | |
| Operating income/(loss) | $ | 3,636 | | | $ | 3,159 | | | $ | 2,862 | | | $ | 843 | | | $ | 811 | | | $ | 719 | | | $ | (170) | | | $ | (276) | | | $ | 57 | | | $ | 4,309 | | | $ | 3,694 | | | $ | 3,638 | |
| Adjusted operating income | $ | 3,719 | | | $ | 3,241 | | | $ | 2,929 | | | $ | 1,026 | | | $ | 979 | | | $ | 899 | | | $ | 724 | | | $ | 508 | | | $ | 511 | | | $ | 5,469 | | | $ | 4,728 | | | $ | 4,339 | |
| Operating margin | 73 | % | | 71 | % | | 70 | % | | 37 | % | | 36 | % | | 34 | % | | (8) | % | | (21) | % | | 5 | % | | 46 | % | | 46 | % | | 50 | % |
| Adjusted operating margin | 75 | % | | 73 | % | | 72 | % | | 45 | % | | 44 | % | | 43 | % | | 36 | % | | 39 | % | | 45 | % | | 59 | % | | 59 | % | | 59 | % |
| | | | | | | | | | | | | | | | | | | | | | | |
| Net income adjustments: | | | | | | | | | | | | | | | | | | | | | | | |
| Net income attributable to ICE | | $ | 2,754 | | | $ | 2,368 | | | $ | 1,446 | |
| Add: Amortization of acquisition-related intangibles | | 1,011 | | | 748 | | | 610 | |
| Add: Transaction and integration costs | | 102 | | | 269 | | | 91 | |
| (Less)/Add: Litigation and regulatory matters | | (145) | | | 11 | | | 9 | |
| Add: Net losses from and impairment of unconsolidated investees | | 62 | | | 122 | | | 1,340 | |
| Add/(Less): Loss/(Gain) on sale and fair value adjustments of equity investments and dividends received | | 1 | | | 3 | | | (41) | |
| (Less)/Add: Net interest (income)/expense on pre-acquisition-related debt and debt extinguishment | | — | | | (12) | | | 89 | |
| Add: Other | | 26 | | | 182 | | | — | |
| Less: Net income tax effect for the above items and deferred tax adjustments | | (268) | | | (309) | | | (579) | |
| (Less)/Add: Deferred tax adjustments on acquisition-related intangibles | | (43) | | | (126) | | | 9 | |
| Less: Other tax adjustments | | (3) | | | (79) | | | — | |
| Adjusted net income attributable to ICE | | $ | 3,497 | | | $ | 3,177 | | | $ | 2,974 | |
| Diluted earnings per share attributable to ICE common stockholders | | $ | 4.78 | | | $ | 4.19 | | | $ | 2.58 | |
| Adjusted diluted earnings per share attributable to ICE common stockholders | | $ | 6.07 | | | $ | 5.62 | | | $ | 5.30 | |
| Diluted weighted average common shares outstanding | | 576 | | | 565 | | | 561 | |
Amortization of acquisition-related intangibles are included in non-GAAP adjustments as excluding these non-cash expenses provides greater clarity regarding our financial strength and stability of cash operating results. In 2024 and 2023, amortization of acquisition-related intangibles includes a $3 million impairment charge related to developed technology within our Exchanges Segment and a $7 million impairment charge related to a trademark intangible within our Mortgage Technology Segment, respectively.
Transaction and integration costs are included as part of our core business expenses, except for those that are directly related to the announcement, closing, financing or termination of a transaction. However, we adjust for the acquisition-related transaction and integration costs for acquisitions such as Black Knight and Ellie Mae given the magnitude of the $11.8 and $11.4 billion, respectively, purchase prices of the acquisitions.
Litigation and regulatory matters include the following as we do not consider events of this type to be reflective of our core business:
•In 2024, a $160 million gain related to the PennyMac arbitration award resolution and payment received. Separately in 2024, regulatory accruals of $15 million;
•In 2023, an accrual related to a regulatory settlement of $11 million; and
•In 2022, an accrual related to legal and regulatory matters of $9 million.
We adjust for our share of net income/(losses) and impairment charges related to our equity method investments, which primarily include OCC and Bakkt. We believe these adjustments provide greater clarity of our performance given that equity method investments are non-cash and not a part of our core operations. Our share of total Bakkt net losses was $83 million, $135 million, and $1.4 billion in 2024, 2023 and 2022, respectively. During 2022, after recording our share of Bakkt's equity method losses, which included an impairment charge recorded by Bakkt, we recorded an impairment in our investment in Bakkt to its fair value as other expense. Our share of OCC net income was $25 million, $16 million and $15 million in 2024, 2023 and 2022, respectively.
Similarly, and as included in the table above, we adjust for gains and losses on investment transactions and changes in the fair value of our investments. Our investments are not considered to be a part of our core business operations and the impacts of changes in our investments are often non-cash in nature.
The following non-GAAP adjustments are reported in the table above related to investments:
•In 2024, we excluded a net $1 million fair value loss on our equity investments without readily determinable fair values;
•In 2023, we excluded the combined realized loss of $3 million related to our sales of the Dun & Bradstreet investment, net of dividends; and
•In 2022, we excluded the $41 million gain on the sale of our Euroclear investment.
We adjust for certain items related to our debt. Certain debt activities, such as the early termination of notes, pre-acquisition interest and expense and accelerated amortization of debt costs are not considered to be a part of our core business operations and the impacts of changes in our investments are often non-cash in nature. The following non-GAAP adjustments are reported in the table above related to our debt:
•In 2023, we excluded $12 million of net interest income on pre-acquisition-related debt from our May 2022 debt refinancing related to the Black Knight acquisition. This consisted of $170 million of interest income earned on investments from the pre-acquisition debt proceeds net of $158 million of interest expense on pre-acquisition-related debt.
•In 2022, we excluded $59 million of net interest expense on pre-acquisition-related debt from our May 2022 debt refinancing related to the Black Knight acquisition. This consisted of $135 million of interest expense on pre-acquisition-related debt net of $76 million of interest income earned on investments from the pre-acquisition debt proceeds.
•In 2022, we adjusted for costs of $30 million associated with the May and June 2022 extinguishment of four series of senior notes that would have matured in 2022 and 2023 using proceeds from our May 2022 issuance of new senior notes.
Other adjustments not considered to be a part of our core business operations include:
•In 2024, duplicate rent expense of $22 million related to our new London and New York leased office space. We took possession of the new London and New York leases during the 2023 and 2024, respectively. Both the London and New York office transitions were completed in 2024. We view these duplicate non-cash rent expenses during the transitions to be incremental, non-recurring, and not related to our normal operations;
•In 2024, a net $10 million expense for valid claims made following an equity trading issue at NYSE in June 2024. This includes $30 million of expense related to these claims, net of $20 million in insurance proceeds received;
•In 2024, a $6 million gain related to the sale of certain of our property and equipment;
•In 2023, a fair value loss of $160 million related to the Black Knight Promissory Note;
•In 2023, a $6 million expense for claims made following a NYSE system outage that occurred in January 2023; and
•In 2023, an impairment related to our CAT loan receivable of $16 million. The CAT was approved by the SEC in 2016 to improve regulators’ ability to monitor trading activity.
Non-GAAP tax adjustments include the tax impacts of the pre-tax non-GAAP adjustments, deferred tax adjustments on acquisition-related intangibles and other tax adjustments. Deferred tax adjustments on acquisition-related intangibles include the impact of tax law changes and apportionment updates resulting in a deferred tax benefit of $43 million, a deferred tax benefit of $126 million and a deferred tax expense of $9 million in 2024, 2023 and 2022, respectively.
The $3 million other tax adjustments in 2024 were primarily related to pre-acquisition tax matters, including releases of historical unrecognized tax benefits due to statutes of limitations expirations, mostly offset by valuation allowances of certain deferred tax assets that are not realizable in the foreseeable future.
The $79 million other tax adjustments in 2023 were primarily related to audit settlements for pre-acquisition tax matters as well as state apportionment charges in prior years.
For additional information on these items, refer to our consolidated financial statements included in this Annual Report and “- Recent Developments,” “- Consolidated Operating Expenses”, “- Consolidated Non-Operating Income/(Expense)” and “-Consolidated Income Tax Provision” above.
Non-GAAP Liquidity Measures
We consider free cash flow and adjusted free cash flow to be non-GAAP liquidity measures that provide useful information to management and investors to analyze cash resources generated from our operations. We believe that free cash flow and adjusted free cash flow are useful as the bases for comparing our performance with our competitors and demonstrate our ability to convert the reinvestment of capital expenditures and capitalized software development costs required to maintain and grow our business, as well as adjust for timing differences related to the payment of Section 31 fees. These non-GAAP liquidity measures are not presented in accordance with, or as an alternative to, GAAP liquidity measures and may be different from non-GAAP measures used by other companies. Free cash flow and adjusted free cash flow, including the related adjustments are as follows (in millions):
| | | | | | | | | | | | | | | | | |
| Year Ended December 31, |
| 2024 | | 2023 | | 2022 |
| Net cash provided by operating activities | $ | 4,609 | | | $ | 3,542 | | | $ | 3,554 | |
| Less: Capital expenditures | (406) | | | (190) | | | (225) | |
| Less: Capitalized software development costs | (346) | | | (299) | | | (257) | |
| Free cash flow | 3,857 | | | 3,053 | | | 3,072 | |
| (Less)/Add: Section 31 fees, net | (237) | | | 144 | | | (166) | |
| Adjusted free cash flow | $ | 3,620 | | | $ | 3,197 | | | $ | 2,906 | |
For additional information on these items, refer to our consolidated financial statements included in this Annual Report and “—Consolidated Operating Expenses” above.
Off-Balance Sheet Arrangements
As described in Note 14 to our consolidated financial statements, which are included elsewhere in this Annual Report, certain clearing house collateral is reported off-balance sheet. We do not have any relationships with unconsolidated entities or financial partnerships, often referred to as structured finance or special purpose entities.
Contractual Obligations and Commercial Commitments
We intend to fund our contractual obligations and commercial commitments from existing cash and cash flow from operations. As of December 31, 2024, our primary cash requirements include the following contractual and other obligations.
As of December 31, 2024, we had $20.4 billion in outstanding debt, including $3.0 billion of short-term debt. Our outstanding debt consists of $19.8 billion of fixed rate senior notes and $529 million in commercial paper.
Our operating leases primarily relate to our leased office space and data center facilities, and as of December 31, 2024, we had fixed lease payment obligations of $509 million, with $56 million payable within one-year.
We have other purchase obligations to purchase various goods and services that we believe are enforceable and legally binding.
In addition, we have $84.3 billion in cash and cash equivalent margin deposits and guaranty funds, invested deposits, delivery contracts payable and unsettled variation margin. Clearing members of our clearing houses are required to deposit original margin and variation margin and to make deposits to a guaranty fund. The cash and cash equivalent deposits made to these margin accounts and to the guaranty fund are recorded in the consolidated balance sheets as current assets with corresponding current liabilities to the clearing members that deposited them. ICE NGX administers the physical delivery of energy trading contracts. It has an equal and offsetting claim to and from its respective participants on opposite sides of the physically-settled contract, each of which is reflected as a delivery contract receivable with an offsetting delivery contract payable. See Note 14 to our consolidated financial statements included in this Annual Report for additional information on our clearing houses and the margin deposits, guaranty funds, invested deposits, delivery contracts payable and unsettled variation margin.
We also have unrecognized tax benefits, or UTBs. As of December 31, 2024, our cumulative UTBs were $274 million, and accrued interest and penalties related to UTBs were $47 million. We are under examination by various tax authorities. We are unable to make a reasonable estimate of the periods of cash settlement because it is not possible to reasonably predict the amount of tax, interest and penalties, if any, that might be assessed by a tax authority or the timing of an assessment or payment. It is also not possible to reasonably predict whether or not the applicable statutes of limitations
might expire without us being examined by any particular tax authority. See Note 13 to our consolidated financial statements for additional information on our UTBs.
As of December 31, 2024, we, through NYSE, have net obligations of $82 million related to our pension and other benefit programs. The date of payment under these net obligations cannot be determined. See Note 17 to our consolidated financial statements for additional information on our pension and other benefit programs.
New and Recently Adopted Accounting Pronouncements
Refer to Note 2 to our consolidated financial statements included in this Annual Report for information on the new and recently adopted accounting pronouncements that are applicable to us.
Critical Accounting Policies
We have identified the policies below as critical to our business operations and the understanding of our results of operations. The impact of, and any associated risks related to, these policies on our business operations is discussed throughout “- Management’s Discussion and Analysis of Financial Condition and Results of Operations.” For a detailed discussion on the application of these and other accounting policies, see Note 2 to our consolidated financial statements included in this Annual Report.
Our discussion and analysis of our financial condition and results of operations are based upon our consolidated financial statements, which have been prepared in accordance with U.S. GAAP. The preparation of financial statements in conformity with these accounting principles requires us to make estimates and assumptions that affect the reported amount of assets and liabilities, and the disclosure of contingent assets and liabilities at the date of our financial statements, and the reported amounts of revenues and expenses during the reporting period.
We base our estimates and judgments on our historical experience and other factors that we believe to be reasonable under the circumstances when we make these estimates and judgments and re-evaluate them on a periodic basis. Based on these factors, we make estimates and judgments about, among other things, the carrying values of assets and liabilities that are not readily apparent from market prices or other independent sources and about the recognition and characterization of our revenues and expenses. The values and results based on these estimates and judgments could differ significantly under different assumptions or conditions and could change materially in the future.
We believe that the following critical accounting policies, among others, affect our more significant judgments and estimates used in the preparation of our consolidated financial statements and could materially increase or decrease our reported results, assets and liabilities.
Goodwill and Other Identifiable Intangible Assets
Assets acquired and liabilities assumed in connection with our acquisitions are recorded at their estimated fair values. Goodwill represents the excess of the purchase price of an acquired company over the fair value of its identifiable net assets, including identified intangible assets. We recognize specifically identifiable intangibles, such as customer relationships, developed technology, trading products, data and databases, trademarks and trade names, exchange registrations, backlog, and licenses when a specific right or contract is acquired. Our determination of the fair value of the intangible assets and whether or not these assets may be impaired following their acquisition requires us to apply significant judgments and make significant estimates and assumptions regarding future cash flows. If we change our strategy or if market conditions shift, our judgments and estimates may change, which may result in adjustments to recorded asset balances. Intangible assets with finite useful lives are amortized over their estimated useful lives whereas goodwill and intangible assets with indefinite useful lives are not.
In performing the allocation of the acquisitions' purchase price to assets and liabilities, we consider, among other factors, the intended use of the acquired assets, analysis of past financial performance and estimates of future performance of the acquired business. At the acquisition date, a preliminary allocation of the purchase price is recorded based upon a preliminary valuation performed with the assistance of a third-party valuation specialist. We continue to review and assess our estimates, assumptions and valuation methodologies during the measurement period provided by GAAP, which ends as soon as we receive the information about facts and circumstances that existed as of the acquisition date or we learn that more information is not obtainable, which usually does not exceed one year from the date of acquisition. Accordingly, these estimates and assumptions are subject to change, which could have a material impact on our consolidated financial statements. Estimation uncertainty may exist due to the sensitivity of the respective fair value to underlying assumptions about the future performance of an acquired business in our discounted cash flow models. Significant assumptions
typically include revenue growth rates and expense synergies that form the basis of the forecasted results and the discount rate.
Our goodwill and other indefinite-lived intangible assets are evaluated for impairment annually in our fiscal fourth quarter or more frequently if conditions exist that indicate that the value may be impaired. We test our goodwill for impairment at the reporting unit level, and we have identified four reporting units. Our reporting units identified for our goodwill testing are the NYSE, Other Exchanges, Fixed Income and Data Services, and Mortgage Technology reporting units. These impairment evaluations are performed by comparing the carrying value of the goodwill or other indefinite-lived intangibles to its estimated fair value.
In accordance with ASU 2017-04, Simplifying the Test for Goodwill Impairment, for both goodwill and indefinite-lived intangible impairment testing, we have the option to first perform a qualitative assessment to determine whether it is more likely than not that the fair value of a reporting unit or indefinite-lived intangible asset is less than its carrying amount. Alternatively, we may choose to bypass the qualitative option and perform quantitative testing to determine if the fair value is less than the carrying value. If the fair value of the goodwill or indefinite-lived intangible asset is less than its carrying value, an impairment loss is recognized in earnings in an amount equal to the difference. For our goodwill impairment testing, we have elected to bypass the qualitative assessment and apply the quantitative approach. The current year goodwill impairment test was performed with the assistance of a third-party valuation specialist. For our testing of indefinite-lived intangible assets, we apply qualitative and quantitative approaches.
Application of the impairment test requires judgment, including the identification of reporting units, assignment of assets and liabilities to reporting units, assignment of goodwill to reporting units, and determination of the fair value of each reporting unit. We have historically determined the fair value of our reporting units based on various valuation techniques, including discounted cash flow analysis and a multiple of earnings approach. In assessing whether goodwill and other intangible assets are impaired, we must make estimates and assumptions regarding future cash flows, long-term growth rates of our business, operating margins, discount rates, weighted average cost of capital and other factors to determine the fair value of our assets. These estimates and assumptions require management’s judgment, and changes to these estimates and assumptions, as a result of changing economic and competitive conditions, could materially affect the determination of fair value and/or impairment. We considered potential indicators of impairment to goodwill and other intangible assets for each of our reporting units, which included continued global inflation concerns and changing interest rates, including their effect on our forecasts and discount rates, among other things. We did not record any impairments in 2024, 2023 or 2022 as a result of our goodwill and indefinite-lived intangible assets impairment testing.
We are also required to evaluate other finite-lived intangible assets for impairment by first determining whether events or changes in circumstances indicate that the carrying value of these assets to be held and used may not be recoverable. If impairment indicators are present, then an estimate of undiscounted future cash flows produced by these long-lived assets is compared to the carrying value of those assets to determine if the asset is recoverable. If an asset is not recoverable, the loss is measured as the difference between fair value and carrying value of the impaired asset. Fair value of these assets is based on various valuation techniques, including discounted cash flow analysis, which are assessed and conducted in accordance with our internal impairment analysis policies. Other than impairments in 2024 and 2023 of developed technology and certain trademark intangible assets, respectively, we did not record any impairments in 2024, 2023 or 2022 as a result of our definite-lived impairment asset testing.
Income Taxes
We are subject to income taxes in the U.S., U.K. and other foreign jurisdictions where we operate. The determination of our provision for income taxes and related accruals, deferred tax assets and liabilities requires the use of significant judgment, estimates, and the interpretation and application of complex tax laws. We recognize a current tax liability or tax asset for the estimated taxes payable or refundable on tax returns for the current year. We recognize deferred tax assets and liabilities for the expected future tax consequences of temporary differences between the financial statement carrying amounts and the tax bases of our assets and liabilities. We establish valuation allowances if we believe that it is more likely than not that some or all of our deferred tax assets will not be realized. Deferred tax assets and liabilities are measured using current enacted tax rates in effect for the years in which those temporary differences and carryforwards are expected to reverse.
The Financial Accounting Standards Board, or FASB, Staff has provided additional guidance to address the accounting for the effects of the provisions related to the taxation of Global Intangible Low-Taxed Income noting that companies should make an accounting policy election to recognize deferred taxes for temporary basis differences expected to reverse in future years or to include the tax expense in the year it is incurred. We have made a policy election to recognize such taxes as current period expenses when incurred.
We do not recognize a tax benefit unless we conclude that it is more likely than not that the benefit will be sustained on audit by the taxing authority based solely on the technical merits of the associated tax position. If the recognition threshold is met, we recognize a tax benefit measured at the largest amount of the tax benefit that, in our judgment, is greater than 50 percent likely to be realized. We recognize accrued interest and penalties related to uncertain income tax positions as income tax expense in the consolidated statements of income.
We operate within multiple domestic and foreign taxing jurisdictions and are subject to audit in these jurisdictions by domestic and foreign tax authorities. These audits include questions regarding our tax filing positions, including the timing and amount of deductions taken and the allocation of income among various tax jurisdictions. We record accruals for the estimated outcomes of these audits, and the accruals may change in the future due to new developments in each matter. At any point in time, many tax years are subject to or in the process of being audited by various taxing authorities. To the extent our estimates of settlements change or the final tax outcome of these matters is different from the amounts recorded, such differences will impact the income tax provision in the period in which such determinations are made. Our income tax expense includes changes in our estimated liability for exposures associated with our various tax filing positions. Determining the income tax expense for these potential assessments requires management to make assumptions that are subject to factors such as proposed assessments by tax authorities, changes in facts and circumstances, issuance of new regulations, and resolution of tax audits.
We believe the judgments and estimates discussed above are reasonable. However, if actual results are not consistent with our estimates or assumptions, we may be exposed to losses or gains that could be material.
ITEM 7 (A). QUANTITATIVE AND QUALITATIVE DISCLOSURES ABOUT MARKET RISK
As a result of our operating and financing activities, we are exposed to market risks such as interest rate risk, foreign currency exchange rate risk and credit risk. We have implemented policies and procedures designed to measure, manage, monitor and report risk exposures, which are regularly reviewed by the appropriate management and supervisory bodies.
Interest Rate Risk
We have exposure to market risk for changes in interest rates relating to our cash and cash equivalents, short-term and long-term restricted cash and cash equivalents, short-term and long-term investments and indebtedness. As of December 31, 2024 and 2023, our cash and cash equivalents and short-term and long-term restricted cash and cash equivalents and investments were $3.0 billion and $2.5 billion, respectively. We do not use our investment portfolio for trading or other speculative purposes. A hypothetical 100 basis points decrease in short-term interest rates would decrease our annual interest income by $25 million as of December 31, 2024, assuming no change in the amount or composition of our cash and cash equivalents and short-term and long-term restricted cash and cash equivalents.
As of December 31, 2024, we had $20.4 billion in outstanding debt, consisting of $19.8 billion of unsecured senior notes and $529 million in commercial paper. See Part II, Item 7, "Management's Discussion and Analysis of Financial Condition and Results of Operations – Debt," and Note 10 to our consolidated financial statements included in this Annual Report.
The interest rates on our Commercial Paper Program are currently evaluated based upon current maturities and market conditions. The weighted average interest rate on notes outstanding under our Commercial Paper Program was 4.6% and 5.7% as of December 31, 2024 and December 31, 2023, respectively. The effective interest rate of issuances under our Commercial Paper Program will continue to fluctuate based on the movement in short-term interest rates along with shifts in supply and demand within the commercial paper market.
Foreign Currency Exchange Rate Risk
As an international business, we are subject to foreign currency exchange rate risk. We may experience gains or losses from foreign currency transactions in the future given that a significant part of our assets and liabilities are recorded in pounds sterling, Canadian dollars or euros, and a significant portion of our revenues and expenses are recorded in pounds sterling or euros. Certain assets, liabilities, revenues and expenses of foreign subsidiaries are denominated in the local functional currency of such subsidiaries. Our exposure to foreign denominated earnings in 2024 and 2023 is presented by primary foreign currency in the following table (dollars in millions, except exchange rates):
| | | | | | | | | | | | | | | | | | | | | | | |
| | Year Ended December 31, 2024 | | Year Ended December 31, 2023 |
| | Pound Sterling | | Euro | | Pound Sterling | | Euro |
| Average exchange rate to the U.S. dollar in the current year | $ | 1.2781 | | | $ | 1.0820 | | | $ | 1.2438 | | | $ | 1.0817 | |
| Average exchange rate to the U.S. dollar in the prior year | $ | 1.2438 | | | $ | 1.0817 | | | $ | 1.2376 | | | $ | 1.0540 | |
| Average exchange rate increase/(decrease) | 3 | % | | — | % | | 1 | % | | 3 | % |
| Foreign denominated percentage of: | | | | | | | |
| Revenues, less transaction-based expenses | 7 | % | | 8 | % | | 7 | % | | 7 | % |
| Operating expenses | 6 | % | | 2 | % | | 7 | % | | 2 | % |
| Operating income | 8 | % | | 15 | % | | 7 | % | | 14 | % |
Impact of the currency fluctuations(1) on: | | | | | | | |
| Revenues, less transaction-based expenses | $ | 18 | | | $ | — | | | $ | 1 | | | $ | 16 | |
| Operating expenses | $ | 8 | | | $ | — | | | $ | 2 | | | $ | 2 | |
| Operating income | $ | 10 | | | $ | — | | | $ | (1) | | | $ | 14 | |
(1) Represents the impact of currency fluctuation for the year compared to the same period in the prior year.
We have a significant part of our assets, liabilities, revenues and expenses recorded in pounds sterling or euros. In 2024 and 2023, 15% and 14%, respectively, of our consolidated revenues, less transaction-based expenses, were denominated in pounds sterling or euros, and in 2024 and 2023, 8% and 9%, respectively, of our consolidated operating expenses were denominated in pounds sterling or euros. As the pound sterling or euro exchange rate changes, the U.S. equivalent of revenues and expenses denominated in foreign currencies changes accordingly.
Foreign currency transaction risk related to the settlement of foreign currency denominated assets, liabilities and payables occurs through our operations, which are received in or paid in pounds sterling, Canadian dollars, or euros, due to the increase or decrease in the foreign currency exchange rates between periods. We incurred foreign currency transaction losses of $15 million and $12 million in 2024 and 2023, respectively, inclusive of the impact of foreign currency hedging transactions. The foreign currency transaction losses were primarily attributable to the fluctuations of the pound sterling and euro relative to the U.S. dollar. A 10% adverse change in the underlying foreign currency exchange rates as of December 31, 2024, assuming no change in the composition of the foreign currency denominated assets, liabilities and payables and assuming no hedging activity, would result in a foreign currency loss of $9 million.
We entered into foreign currency hedging transactions during 2024 and 2023 as economic hedges to help mitigate a portion of our foreign exchange risk exposure and may enter into additional hedging transactions in the future to help mitigate our foreign exchange risk exposure. Although we may enter into additional hedging transactions in the future, these hedging arrangements may not be effective, particularly in the event of imprecise forecasts of the levels of our non-U.S. denominated assets and liabilities.
We have foreign currency translation risk equal to our net investment in our foreign subsidiaries. The financial statements of these subsidiaries are translated into U.S. dollars using a current rate of exchange, with gains or losses included in the cumulative translation adjustment account, a component of equity. Our exposure to the net investment in foreign currencies is presented by primary foreign currencies in the table below (in millions):
| | | | | | | | | | | | | | | | | |
| | As of December 31, 2024 |
| | Position in
pounds sterling | | Position in
Canadian dollars | | Position in euros |
| Assets | £ | 758 | | | C$ | 2,904 | | | € | 192 | |
| of which goodwill represents | 518 | | | 387 | | | 92 | |
| Liabilities | 149 | | | 2,459 | | | 48 | |
| Net currency position | £ | 609 | | | C$ | 445 | | | € | 144 | |
| Net currency position, in $USD | $ | 761 | | | $ | 310 | | | $ | 150 | |
| Negative impact on consolidated equity of a 10% decrease in foreign currency exchange rates | $ | 76 | | | $ | 31 | | | $ | 15 | |
Foreign currency translation adjustments are included as a component of accumulated other comprehensive income/(loss) within our balance sheet. See the table below for the portion of equity attributable to foreign currency translation adjustments as well as the activity by year included within our statement of other comprehensive income. The impact of the foreign currency exchange rate differences in the table below were primarily driven by fluctuations of the pound sterling as compared to the U.S. dollar which were 1.2514, 1.2732 and 1.2093 as of December 31, 2024, 2023, and 2022,
respectively. | | | | | |
| Changes in Accumulated Other Comprehensive Income/ (Loss) from Foreign Currency Translation Adjustments (in millions) |
| Balance, as of January 1, 2022 | $ | (150) | |
| Net current period other comprehensive loss | (128) | |
| Balance, as of December 31, 2022 | (278) | |
| Net current period other comprehensive income | 48 | |
| Balance, as of December 31, 2023 | (230) | |
| Net current period other comprehensive loss | (55) | |
| Balance, as of December 31, 2024 | $ | (285) | |
The future impact on our business relating to the U.K. leaving the EU and the corresponding regulatory changes are uncertain at this time, including future impacts on currency exchange rates.
Credit Risk
We are exposed to credit risk in our operations in the event of a counterparty default. We limit our exposure to credit risk by rigorously selecting the counterparties with which we make our investments, monitoring them on an ongoing basis and executing agreements to protect our interests.
Clearing House Cash Deposit Risks
The ICE Clearing Houses hold material amounts of clearing member margin deposits which are held or invested primarily to provide security of capital while minimizing credit, market and liquidity risks. Refer to Note 14 to our consolidated financial statements for more information on the ICE Clearing Houses' cash and cash equivalent margin deposits and guaranty funds, invested deposits, delivery contracts receivable and unsettled variation margin which were $84.3 billion as of December 31, 2024. While we seek to achieve a reasonable rate of return which may generate interest income for our clearing members, we are primarily concerned with preservation of capital and managing the risks associated with these deposits. As the ICE Clearing Houses may pass on interest revenues (minus costs) to the clearing members, this could include negative or reduced yield due to market conditions. The following is a summary of the risks associated with these deposits and how these risks are mitigated:
•Credit Risk: When a clearing house has the ability to hold cash collateral at a central bank, the clearing house utilizes its access to the central bank system to minimize credit risk exposures. Credit risk is managed by using exposure limits depending on the credit profile of the counterparty as well as the nature and maturity of transactions. Our investment objective is to invest in securities that preserve principal while maximizing yields, without significantly increasing risk. We seek to substantially mitigate the credit risk associated with investments by placing them with governments, well-capitalized financial institutions and other creditworthy counterparties.
An ongoing review is performed to evaluate changes in the financial status of counterparties. In addition to the intrinsic creditworthiness of counterparties, our policies require diversification of counterparties (banks, financial institutions, bond issuers and funds) so as to avoid a concentration of risk.
•Liquidity Risk: Liquidity risk is the risk a clearing house may not be able to meet its payment obligations in the right currency, in the right place and at the right time. To mitigate this risk, the clearing houses monitor liquidity requirements closely and maintain funds and assets in a manner which minimizes the risk of loss or delay in the access by the clearing house to such funds and assets. For example, holding funds with a central bank where possible or making only short term investments such as overnight reverse repurchase agreements serves to reduce liquidity risks.
•Interest Rate Risk: Interest rate risk is the risk that interest rates rise and cause the value of securities we hold or invest in to decline. If we were required to sell securities prior to maturity, and interest rates had risen, the sale might be made at a loss relative to the carrying value. Our clearing houses seek to manage this risk by making short term investments. For example, where possible and in accordance with regulatory requirements, the clearing houses invest cash pursuant to overnight reverse repurchase agreements or term reverse repurchase agreements with short dated maturities. In addition, the clearing house investment guidelines allow for direct purchases of high quality sovereign debt (for example, U.S. Treasury securities) and supranational debt instruments (Euro cash deposits only) with short dated maturities.
•Security Issuer Risk: Security issuer risk is the risk that an issuer of a security defaults on the payment when the security matures or debt is serviced. This risk is mitigated by limiting allowable investments under the reverse repurchase agreements to high quality sovereign or government agency debt and limiting any direct investments to high quality sovereign debt instruments.
•Investment Counterparty Risk: Investment counterparty risk is the risk that a reverse repurchase agreement counterparty might become insolvent and, thus, fail to meet its obligations to our clearing houses. We mitigate this risk by only engaging in transactions with high credit quality counterparties and by limiting the acceptable collateral to securities of high quality issuers. When engaging in reverse repurchase agreements, our clearing houses take delivery of the securities underlying the reverse repurchase arrangement in custody accounts under clearing house control. Additionally, the securities purchased subject to reverse repurchase have a market value greater than the reverse repurchase amount. Thus, in the event that a reverse repurchase counterparty defaults on its obligation to repurchase the underlying reverse repurchase securities, our clearing house will have possession of a security with a value potentially greater than the counterparty’s obligation.
The ICE Clearing Houses may use third-party investment advisors who make investments subject to the guidelines provided by each clearing house. Clearing house property is held in custody accounts under clearing house control with credit worthy custodians. The ICE Clearing Houses employ (or may employ) multiple investment advisors and custodians to ensure that in the event a single advisor or custodian is unable to fulfill its role, additional advisors or custodians are available as alternatives.
•Cross-Currency Margin Deposit Risk: Each of the ICE Clearing Houses may permit posting of cross-currency collateral to satisfy margin requirements (for example, accepting margin deposits denominated in U.S. dollars to secure a Euro margin obligation). The ICE Clearing Houses mitigate the risk of a currency value exposure by applying a “haircut” to the currency posted as margin at a level viewed as sufficient to provide financial protection during periods of currency volatility. Cross-currency balances are marked-to-market on a daily basis. Should the currency posted to satisfy margin requirements decline in value, the clearing member is required to increase its margin deposit on a same-day basis.
Impact of Inflation
We have not been materially adversely affected by inflation as technological advances and competition have generally caused prices for the hardware and software that we use for our electronic platforms to remain constant. In the event of continued or increased inflation, we believe that we will be able to pass on any price increases to our participants, as the prices that we charge are not governed by long-term contracts.
ITEM 8. FINANCIAL STATEMENTS AND SUPPLEMENTARY DATA
INDEX TO CONSOLIDATED FINANCIAL STATEMENTS
| | | | | |
| Page |
| Intercontinental Exchange, Inc. and Subsidiaries: | |
| |
| |
| |
| |
| |
| |
| |
| |
| |
REPORT OF MANAGEMENT ON INTERNAL CONTROL OVER FINANCIAL REPORTING
Our management is responsible for the preparation and integrity of the consolidated financial statements appearing in our Annual Report on Form 10-K. The financial statements were prepared in conformity with generally accepted accounting principles appropriate in the circumstances and, accordingly, include certain amounts based on our best judgments and estimates.
Our management is responsible for establishing and maintaining adequate internal control over financial reporting as such term is defined in Rule 13a-15(f) and 15d-a5(f) under the Securities Exchange Act of 1934 (“Exchange Act”). Our internal control over financial reporting is designed to provide reasonable assurance regarding the reliability of financial reporting and the preparation of the consolidated financial statements. Our internal control over financial reporting is supported by a program of internal audits and appropriate reviews by management, written policies and guidelines, careful selection and training of qualified personnel and a written Global Code of Business Conduct adopted by our Board of Directors, applicable to all of our directors and all officers and all of our employees.
Because of its inherent limitations, internal control over financial reporting may not prevent or detect misstatements and even when determined to be effective, can only provide reasonable assurance with respect to financial statement preparation and presentation. Also, projections of any evaluation of effectiveness to future periods are subject to the risk that controls may become inadequate because of changes in conditions, or that the degree of compliance with the policies or procedures may deteriorate.
Management assessed the effectiveness of our internal control over financial reporting as of December 31, 2024. In making this assessment, management used the criteria set forth by the Committee of Sponsoring Organizations of the Treadway Commission (“COSO”) in Internal Control - Integrated Framework (2013 framework). Based on our assessment, management believes that we maintained effective internal control over financial reporting as of December 31, 2024.
Our independent auditors, Ernst & Young LLP, a registered public accounting firm, are appointed by the Audit Committee, subject to ratification by our stockholders. Ernst & Young LLP has audited and reported on our consolidated financial statements and the effectiveness of our internal control over financial reporting. The reports of our independent registered public accounting firm are contained in this Annual Report.
| | | | | | | | |
| /s/ Jeffrey C. Sprecher | | /s/ A. Warren Gardiner |
| Jeffrey C. Sprecher | | A. Warren Gardiner |
| Chair and Chief Executive Officer | | Chief Financial Officer |
| | |
| | |
| February 6, 2025 | | February 6, 2025 |
REPORT OF INDEPENDENT REGISTERED PUBLIC ACCOUNTING FIRM
ON INTERNAL CONTROL OVER FINANCIAL REPORTING
To the Stockholders and the Board of Directors of Intercontinental Exchange, Inc.
Opinion on Internal Control over Financial Reporting
We have audited Intercontinental Exchange, Inc. and Subsidiaries’ internal control over financial reporting as of December 31, 2024, based on criteria established in Internal Control—Integrated Framework issued by the Committee of Sponsoring Organizations of the Treadway Commission (2013 framework) (the COSO criteria). In our opinion, Intercontinental Exchange, Inc. and Subsidiaries (the Company) maintained, in all material respects, effective internal control over financial reporting as of December 31, 2024, based on the COSO criteria.
We also have audited, in accordance with the standards of the Public Company Accounting Oversight Board (United States) (PCAOB), the consolidated balance sheets of the Company as of December 31, 2024 and 2023, the related consolidated statements of income, comprehensive income, changes in equity and redeemable non-controlling interest, and cash flows for each of the three years in the period ended December 31, 2024, and the related notes, and our report dated February 6, 2025 expressed an unqualified opinion thereon.
Basis for Opinion
The Company’s management is responsible for maintaining effective internal control over financial reporting and for its assessment of the effectiveness of internal control over financial reporting included in the accompanying “Report of Management on Internal Control over Financial Reporting”. Our responsibility is to express an opinion on the Company’s internal control over financial reporting based on our audit. We are a public accounting firm registered with the PCAOB and are required to be independent with respect to the Company in accordance with the U.S. federal securities laws and the applicable rules and regulations of the Securities and Exchange Commission and the PCAOB.
We conducted our audit in accordance with the standards of the PCAOB. Those standards require that we plan and perform the audit to obtain reasonable assurance about whether effective internal control over financial reporting was maintained in all material respects.
Our audit included obtaining an understanding of internal control over financial reporting, assessing the risk that a material weakness exists, testing and evaluating the design and operating effectiveness of internal control based on the assessed risk, and performing such other procedures as we considered necessary in the circumstances. We believe that our audit provides a reasonable basis for our opinion.
Definition and Limitations of Internal Control Over Financial Reporting
A company’s internal control over financial reporting is a process designed to provide reasonable assurance regarding the reliability of financial reporting and the preparation of financial statements for external purposes in accordance with generally accepted accounting principles. A company’s internal control over financial reporting includes those policies and procedures that (1) pertain to the maintenance of records that, in reasonable detail, accurately and fairly reflect the transactions and dispositions of the assets of the company; (2) provide reasonable assurance that transactions are recorded as necessary to permit preparation of financial statements in accordance with generally accepted accounting principles, and that receipts and expenditures of the company are being made only in accordance with authorizations of management and directors of the company; and (3) provide reasonable assurance regarding prevention or timely detection of unauthorized acquisition, use, or disposition of the company’s assets that could have a material effect on the financial statements.
Because of its inherent limitations, internal control over financial reporting may not prevent or detect misstatements. Also, projections of any evaluation of effectiveness to future periods are subject to the risk that controls may become inadequate because of changes in conditions, or that the degree of compliance with the policies or procedures may deteriorate.
/s/ Ernst & Young LLP
New York, New York
February 6, 2025
REPORT OF INDEPENDENT REGISTERED PUBLIC ACCOUNTING FIRM
ON THE FINANCIAL STATEMENTS
To the Stockholders and the Board of Directors of Intercontinental Exchange, Inc.
Opinion on the Financial Statements
We have audited the accompanying consolidated balance sheets of Intercontinental Exchange, Inc. and Subsidiaries (the Company) as of December 31, 2024 and 2023, the related consolidated statements of income, comprehensive income, changes in equity and redeemable non-controlling interest, and cash flows for each of the three years in the period ended December 31, 2024, and the related notes (collectively referred to as the “consolidated financial statements”). In our opinion, the consolidated financial statements present fairly, in all material respects, the financial position of the Company at December 31, 2024 and 2023, and the results of its operations and its cash flows for each of the three years in the period ended December 31, 2024, in conformity with U.S. generally accepted accounting principles.
We also have audited, in accordance with the standards of the Public Company Accounting Oversight Board (United States) (PCAOB), the Company’s internal control over financial reporting as of December 31, 2024, based on criteria established in Internal Control-Integrated Framework issued by the Committee of Sponsoring Organizations of the Treadway Commission (2013 framework), and our report dated February 6, 2025 expressed an unqualified opinion thereon.
Basis for Opinion
These financial statements are the responsibility of the Company’s management. Our responsibility is to express an opinion on the Company’s financial statements based on our audits. We are a public accounting firm registered with the PCAOB and are required to be independent with respect to the Company in accordance with the U.S. federal securities laws and the applicable rules and regulations of the Securities and Exchange Commission and the PCAOB.
We conducted our audits in accordance with the standards of the PCAOB. Those standards require that we plan and perform the audit to obtain reasonable assurance about whether the financial statements are free of material misstatement, whether due to error or fraud. Our audits included performing procedures to assess the risks of material misstatement of the financial statements, whether due to error or fraud, and performing procedures that respond to those risks. Such procedures included examining, on a test basis, evidence regarding the amounts and disclosures in the financial statements. Our audits also included evaluating the accounting principles used and significant estimates made by management, as well as evaluating the overall presentation of the financial statements. We believe that our audits provide a reasonable basis for our opinion.
Critical Audit Matter
The critical audit matter communicated below is a matter arising from the current period audit of the financial statements that was communicated or required to be communicated to the audit committee and that: (1) relates to accounts or disclosures that are material to the financial statements and (2) involved our especially challenging, subjective or complex judgments. The communication of the critical audit matter does not alter in any way our opinion on the consolidated financial statements, taken as a whole, and we are not, by communicating the critical audit matter below, providing a separate opinion on the critical audit matter or on the accounts or disclosures to which it relates.
Accounting for Income Taxes
Description of the Matter As discussed in Note 13 to the consolidated financial statements, the Company operates globally and files income tax returns in the U.S. and in various state, local and foreign jurisdictions. Uncertainty in a tax position may arise because tax laws and rulings are subject to interpretation in each jurisdiction. The Company uses significant judgment to (1) determine whether, based on the technical merits, a tax position is more likely than not to be sustained and (2) measure the amount of tax benefit that qualifies for recognition. As of December 31, 2024, the total amount of unrecognized tax benefits was $274 million, of which $228 million, if recognized, would impact the Company's effective tax rate.
Auditing management's analysis of the Company's uncertain tax positions and the related unrecognized tax benefits was challenging as the analysis involved significant judgment due to the complex interpretations and application of tax laws and rulings.
How We Addressed the
Matter in Our Audit We obtained an understanding, evaluated the design and tested the operating effectiveness of the controls related to management's accounting for uncertain tax positions. For example, we tested controls relating to the completeness of management’s identification of uncertain tax positions and the application of the recognition and measurement principles, including management's review of the inputs and calculations of unrecognized tax benefits.
Our audit procedures included, among others, testing management's assessment of which uncertain tax positions are more likely than not to be sustained and the measurement of the amount of tax benefit that is more likely than not to be realized. To test management's assessment, we performed procedures that included, among others, evaluating management's analysis by jurisdiction, including any communications with taxing authorities, tax controversy and litigation trends, and the technical merits of the uncertain tax positions. We involved our tax professionals with specialized skills and knowledge to evaluate the recognition of the uncertain tax positions and the measurement of the unrecognized tax benefit based on the relevant tax laws, rulings and guidance issued by taxing authorities, as well as their experience with the taxing authorities. We also evaluated the adequacy of the Company’s disclosures included in Note 13 in relation to these tax matters.
/s/ Ernst & Young LLP
We have served as the Company’s auditor since 2002.
New York, New York
February 6, 2025
Intercontinental Exchange, Inc. and Subsidiaries
Consolidated Balance Sheets
(In millions, except per share amounts)
| | | | | | | | | | | |
| As of December 31, |
| 2024 | | 2023 |
| Assets: | | | |
| Current assets: | | | |
| Cash and cash equivalents | $ | 844 | | | $ | 899 | |
| Short-term restricted cash and cash equivalents | 1,142 | | | 531 | |
| Short-term restricted investments | 594 | | | 680 | |
| Cash and cash equivalent margin deposits and guaranty funds | 82,149 | | | 78,980 | |
| Invested deposits, delivery contracts receivable and unsettled variation margin | 2,163 | | | 1,814 | |
| Customer accounts receivable, net of allowance for doubtful accounts of $21 at December 31, 2024 and 2023 | 1,490 | | | 1,366 | |
| Prepaid expenses and other current assets | 713 | | | 703 | |
| Total current assets | 89,095 | | | 84,973 | |
| Property and equipment, net | 2,153 | | | 1,923 | |
| Other non-current assets: | | | |
| Goodwill | 30,595 | | | 30,553 | |
| Other intangible assets, net | 16,306 | | | 17,317 | |
| Long-term restricted cash and cash equivalents | 368 | | | 340 | |
| | | |
| Other non-current assets | 911 | | | 978 | |
| Total other non-current assets | 48,180 | | | 49,188 | |
| Total assets | $ | 139,428 | | | $ | 136,084 | |
| Liabilities and Equity: | | | |
| Current liabilities: | | | |
| Accounts payable and accrued liabilities | $ | 1,051 | | | $ | 1,003 | |
| Section 31 fees payable | 316 | | | 79 | |
| Accrued salaries and benefits | 438 | | | 459 | |
| Deferred revenue | 236 | | | 200 | |
| Short-term debt | 3,027 | | | 1,954 | |
| Margin deposits and guaranty funds | 82,149 | | | 78,980 | |
| Invested deposits, delivery contracts payable and unsettled variation margin | 2,163 | | | 1,814 | |
| Other current liabilities | 173 | | | 137 | |
| Total current liabilities | 89,553 | | | 84,626 | |
| Non-current liabilities: | | | |
| Non-current deferred tax liability, net | 3,904 | | | 4,080 | |
| Long-term debt | 17,341 | | | 20,659 | |
| Accrued employee benefits | 170 | | | 193 | |
| Non-current operating lease liability | 335 | | | 299 | |
| Other non-current liabilities | 405 | | | 441 | |
| Total non-current liabilities | 22,155 | | | 25,672 | |
| Total liabilities | 111,708 | | | 110,298 | |
| Commitments and contingencies | | | |
| Redeemable non-controlling interest in consolidated subsidiaries | 22 | | | — | |
Intercontinental Exchange, Inc. and Subsidiaries
Consolidated Balance Sheets (Continued)
(In millions, except per share amounts)
| | | | | | | | | | | |
| As of December 31, |
| 2024 | | 2023 |
| Equity: | | | |
| Intercontinental Exchange, Inc. stockholders’ equity: | | | |
| Preferred stock, $0.01 par value; 100 shares authorized; none issued or outstanding | — | | | — | |
| Common stock, $0.01 par value; 1,500 authorized; 651 and 574 shares issued and outstanding at December 31, 2024, respectively, and 649 and 573 shares issued and outstanding at December 31, 2023, respectively | 7 | | | 6 | |
| Treasury stock, at cost; 77 and 76 shares at December 31, 2024 and December 31, 2023, respectively | (6,385) | | | (6,304) | |
| Additional paid-in capital | 16,292 | | | 15,953 | |
| Retained earnings | 18,071 | | | 16,356 | |
| Accumulated other comprehensive loss | (338) | | | (294) | |
| Total Intercontinental Exchange, Inc. stockholders’ equity | 27,647 | | | 25,717 | |
| Non-controlling interests in consolidated subsidiaries | 51 | | | 69 | |
| Total equity | 27,698 | | | 25,786 | |
| Total liabilities and equity | $ | 139,428 | | | $ | 136,084 | |
See accompanying notes.
Intercontinental Exchange, Inc. and Subsidiaries
Consolidated Statements of Income
(In millions, except per share amounts)
| | | | | | | | | | | | | | | | | |
| Year Ended December 31, |
| 2024 | | 2023 | | 2022 |
| Revenues: | | | | | |
| Exchanges | $ | 7,441 | | | $ | 6,355 | | | $ | 6,415 | |
| Fixed income and data services | 2,298 | | | 2,231 | | | 2,092 | |
| Mortgage technology | 2,022 | | | 1,317 | | | 1,129 | |
| Total revenues | 11,761 | | | 9,903 | | | 9,636 | |
| Transaction-based expenses: | | | | | |
| Section 31 fees | 679 | | | 293 | | | 499 | |
| Cash liquidity payments, routing and clearing | 1,803 | | | 1,622 | | | 1,845 | |
| Total revenues, less transaction-based expenses | 9,279 | | | 7,988 | | | 7,292 | |
| Operating expenses: | | | | | |
| Compensation and benefits | 1,909 | | | 1,595 | | | 1,407 | |
| Professional services | 154 | | | 123 | | | 131 | |
| Acquisition-related transaction and integration costs | 104 | | | 269 | | | 93 | |
| Technology and communication | 848 | | | 734 | | | 683 | |
| Rent and occupancy | 111 | | | 92 | | | 83 | |
| Selling, general and administrative | 307 | | | 266 | | | 226 | |
| Depreciation and amortization | 1,537 | | | 1,215 | | | 1,031 | |
| Total operating expenses | 4,970 | | | 4,294 | | | 3,654 | |
| Operating income | 4,309 | | | 3,694 | | | 3,638 | |
| Other income/(expense): | | | | | |
| Interest income | 141 | | | 319 | | | 108 | |
| Interest expense | (910) | | | (808) | | | (616) | |
| Other income/(expense), net | 88 | | | (311) | | | (1,322) | |
| Total other income/(expense), net | (681) | | | (800) | | | (1,830) | |
| Income before income tax expense | 3,628 | | | 2,894 | | | 1,808 | |
| Income tax expense | 826 | | | 456 | | | 310 | |
| Net income | $ | 2,802 | | | $ | 2,438 | | | $ | 1,498 | |
| Net income attributable to non-controlling interests | (48) | | | (70) | | | (52) | |
| Net income attributable to Intercontinental Exchange, Inc. | $ | 2,754 | | | $ | 2,368 | | | $ | 1,446 | |
| Earnings per share attributable to Intercontinental Exchange, Inc. common stockholders: | | | | | |
| Basic | $ | 4.80 | | | $ | 4.20 | | | $ | 2.59 | |
| Diluted | $ | 4.78 | | | $ | 4.19 | | | $ | 2.58 | |
| Weighted average common shares outstanding: | | | | | |
| Basic | 573 | | | 564 | | | 559 | |
| Diluted | 576 | | | 565 | | | 561 | |
See accompanying notes.
Intercontinental Exchange, Inc. and Subsidiaries
Consolidated Statements of Comprehensive Income
(In millions)
| | | | | | | | | | | | | | | | | |
| Year Ended December 31, |
| 2024 | | 2023 | | 2022 |
| Net income | $ | 2,802 | | | $ | 2,438 | | | $ | 1,498 | |
| Other comprehensive income/(loss): | | | | | |
| Foreign currency translation adjustments, net of tax | (55) | | | 48 | | | (128) | |
| Change in equity method investment, net of tax | 7 | | | — | | | — | |
| Employee benefit plan net gains/(losses), net of tax | 4 | | | (11) | | | (7) | |
| Other comprehensive income/(loss) | (44) | | | 37 | | | (135) | |
| Comprehensive income | $ | 2,758 | | | $ | 2,475 | | | $ | 1,363 | |
| Comprehensive income attributable to non-controlling interests | (48) | | | (70) | | | (52) | |
| Comprehensive income attributable to Intercontinental Exchange, Inc. | $ | 2,710 | | | $ | 2,405 | | | $ | 1,311 | |
See accompanying notes.
Intercontinental Exchange, Inc. and Subsidiaries
Consolidated Statements of Changes in Equity and Redeemable Non-Controlling Interest
(In millions)
| | | | | | | | | | | | | | | | | | | | | | | | | | | | | | | | | | | | | | | | | | | | | | | | | | | | | | | | | | | |
| Intercontinental Exchange, Inc. Stockholders' Equity | | Non-
Controlling
Interests in
Consolidated
Subsidiaries | | Total
Equity | | Redeemable Non-Controlling Interest |
| Common
Stock | | Treasury Stock | | Additional
Paid-in
Capital | | Retained
Earnings | | Accumulated
Other
Comprehensive
Income/(Loss) | |
| Shares | | Value | | Shares | | Value | |
| Balance, as of December 31, 2021 | 631 | | | $ | 6 | | | (70) | | | $ | (5,520) | | | $ | 14,069 | | | $ | 14,350 | | | $ | (196) | | | $ | 39 | | | $ | 22,748 | | | $ | — | |
| Other comprehensive loss | — | | | — | | | — | | | — | | | — | | | — | | | (135) | | | — | | | (135) | | | — | |
| Exercise of common stock options | — | | | — | | | — | | | — | | | 22 | | | — | | | — | | | — | | | 22 | | | — | |
| Repurchases of common stock | — | | | — | | | (4) | | | (632) | | | — | | | — | | | — | | | — | | | (632) | | | — | |
| Payments relating to treasury shares | — | | | — | | | (1) | | | (73) | | | — | | | — | | | — | | | — | | | (73) | | | — | |
| Stock-based compensation | — | | | — | | | — | | | — | | | 172 | | | — | | | — | | | — | | | 172 | | | — | |
| Issuance under the employee stock purchase plan | 1 | | | — | | | — | | | — | | | 50 | | | — | | | — | | | — | | | 50 | | | — | |
| | | | | | | | | | | | | | | | | | | |
| Issuance of restricted stock | 2 | | | — | | | — | | | — | | | — | | | — | | | — | | | — | | | — | | | — | |
| Distributions of profits | — | | | — | | | — | | | — | | | — | | | — | | | — | | | (36) | | | (36) | | | — | |
| Dividends paid to stockholders | — | | | — | | | — | | | — | | | — | | | (853) | | | — | | | — | | | (853) | | | — | |
| Net income attributable to non-controlling interests | — | | | — | | | — | | | — | | | — | | | (52) | | | — | | | 52 | | | — | | | — | |
| Net income | — | | | — | | | — | | | — | | | — | | | 1,498 | | | — | | | — | | | 1,498 | | | — | |
| Balance, as of December 31, 2022 | 634 | | | $ | 6 | | | (75) | | | $ | (6,225) | | | $ | 14,313 | | | $ | 14,943 | | | $ | (331) | | | $ | 55 | | | $ | 22,761 | | | $ | — | |
| Other comprehensive income | — | | | — | | | — | | | — | | | — | | | — | | | 37 | | | — | | | 37 | | | — | |
| Stock consideration issued for acquisition | 11 | | | — | | | — | | | — | | | 1,274 | | | — | | | — | | | — | | | 1,274 | | | — | |
| Exercise of common stock options | 1 | | | — | | | — | | | — | | | 30 | | | — | | | — | | | — | | | 30 | | | — | |
| | | | | | | | | | | | | | | | | | | |
| Payments relating to treasury shares | — | | | — | | | (1) | | | (79) | | | — | | | — | | | — | | | — | | | (79) | | | — | |
| Stock-based compensation | — | | | — | | | — | | | — | | | 293 | | | — | | | — | | | — | | | 293 | | | — | |
| Issuance under the employee stock purchase plan | 1 | | | — | | | — | | | — | | | 43 | | | — | | | — | | | — | | | 43 | | | — | |
| Contribution from equity partners | — | | | — | | | — | | | — | | | — | | | — | | | — | | | 9 | | | 9 | | | — | |
| Issuance of restricted stock | 2 | | | — | | | — | | | — | | | — | | | — | | | — | | | — | | | — | | | — | |
| Distributions of profits | — | | | — | | | — | | | — | | | — | | | — | | | — | | | (65) | | | (65) | | | — | |
| Dividends paid to stockholders | — | | | — | | | — | | | — | | | — | | | (955) | | | — | | | — | | | (955) | | | — | |
| Net income attributable to non-controlling interests | — | | | — | | | — | | | — | | | — | | | (70) | | | — | | | 70 | | | — | | | — | |
| Net income | — | | | — | | | — | | | — | | | — | | | 2,438 | | | — | | | — | | | 2,438 | | | — | |
| Balance, as of December 31, 2023 | 649 | | | $ | 6 | | | (76) | | | $ | (6,304) | | | $ | 15,953 | | | $ | 16,356 | | | $ | (294) | | | $ | 69 | | | $ | 25,786 | | | $ | — | |
| Other comprehensive loss | — | | | — | | | — | | | — | | | — | | | — | | | (44) | | | — | | | (44) | | | — | |
| | | | | | | | | | | | | | | | | | | |
| Exercise of common stock options | 1 | | | — | | | — | | | — | | | 34 | | | — | | | — | | | — | | | 34 | | | — | |
| | | | | | | | | | | | | | | | | | | |
| Payments relating to treasury shares | — | | | — | | | (1) | | | (81) | | | — | | | — | | | — | | | — | | | (81) | | | — | |
| Stock-based compensation | — | | | — | | | — | | | — | | | 251 | | | — | | | — | | | — | | | 251 | | | — | |
| Issuance under the employee stock purchase plan | — | | | — | | | — | | | — | | | 54 | | | — | | | — | | | — | | | 54 | | | — | |
| | | | | | | | | | | | | | | | | | | |
| Issuance of restricted stock | 1 | | | 1 | | | — | | | — | | | — | | | — | | | — | | | — | | | 1 | | | — | |
| Acquisition of redeemable non-controlling interest | — | | | — | | | — | | | — | | | — | | | — | | | — | | | — | | | — | | | 22 | |
| Distributions of profits | — | | | — | | | — | | | — | | | — | | | — | | | — | | | (66) | | | (66) | | | — | |
| Dividends paid to stockholders | — | | | — | | | — | | | — | | | — | | | (1,039) | | | — | | | — | | | (1,039) | | | — | |
| Net income attributable to non-controlling interests | — | | | — | | | — | | | — | | | — | | | (48) | | | — | | | 48 | | | — | | | — | |
| Net income | — | | | — | | | — | | | — | | | — | | | 2,802 | | | — | | | — | | | 2,802 | | | — | |
| Balance, as of December 31, 2024 | 651 | | | $ | 7 | | | (77) | | | $ | (6,385) | | | $ | 16,292 | | | $ | 18,071 | | | $ | (338) | | | $ | 51 | | | $ | 27,698 | | | $ | 22 | |
See accompanying notes.
Intercontinental Exchange, Inc. and Subsidiaries
Consolidated Statements of Cash Flows
(In millions)
| | | | | | | | | | | | | | | | | |
| Year Ended December 31, |
| 2024 | | 2023 | | 2022 |
| Operating activities: | | | | | |
| Net income | $ | 2,802 | | | $ | 2,438 | | | $ | 1,498 | |
| Adjustments to reconcile net income to net cash provided by operating activities: | | | | | |
| Depreciation and amortization | 1,537 | | | 1,215 | | | 1,031 | |
| Stock-based compensation | 231 | | | 257 | | | 155 | |
| Deferred taxes | (142) | | | (329) | | | (593) | |
| Fair value loss on Promissory Note | — | | | 160 | | | — | |
| (Gain)/loss on investments | 1 | | | 4 | | | (41) | |
| Net losses from and impairment of unconsolidated investees | 62 | | | 122 | | | 1,340 | |
| Other | 55 | | | 63 | | | 41 | |
| Changes in assets and liabilities: | | | | | |
| Customer accounts receivable | (149) | | | (71) | | | 20 | |
| Other current and non-current assets | (106) | | | (41) | | | (196) | |
| Section 31 fees payable | 237 | | | (144) | | | 166 | |
| Deferred revenue | 27 | | | (16) | | | (27) | |
| Other current and non-current liabilities | 54 | | | (116) | | | 160 | |
| Total adjustments | 1,807 | | | 1,104 | | | 2,056 | |
| Net cash provided by operating activities | 4,609 | | | 3,542 | | | 3,554 | |
| Investing activities: | | | | | |
| Capital expenditures | (406) | | | (190) | | | (225) | |
| Capitalized software development costs | (346) | | | (299) | | | (257) | |
| Cash paid for acquisitions, net of cash acquired | (38) | | | (10,198) | | | (59) | |
| Proceeds from sale of Promissory Note | 75 | | | — | | | — | |
| Purchases of invested margin deposits | (1,391) | | | (1,588) | | | (6,935) | |
| Proceeds from sales of invested margin deposits | 1,097 | | | 3,974 | | | 7,483 | |
| Purchases of equity and equity method investments | (29) | | | (8) | | | (73) | |
| Proceeds from the sale of equity investments | — | | | 187 | | | 741 | |
| Purchases of restricted investments | (752) | | | (1,312) | | | — | |
| Proceeds from sales of restricted investments | 855 | | | 641 | | | — | |
| Proceeds from/(purchases of) other investments, net | — | | | (4) | | | 2 | |
| Other investing activities | 14 | | | — | | | — | |
| Net cash provided by/(used in) investing activities | (921) | | | (8,797) | | | 677 | |
| Financing activities: | | | | | |
| Proceeds from debt issuances | 739 | | | 2,400 | | | 7,891 | |
| Repayments of debt | (1,600) | | | (2,286) | | | (2,705) | |
| (Redemption of)/proceeds from commercial paper, net | (1,424) | | | 1,954 | | | (1,012) | |
| Repurchases of common stock | — | | | — | | | (632) | |
| | | | | |
| Dividends paid to stockholders | (1,039) | | | (955) | | | (853) | |
| Change in cash and cash equivalent margin deposits and guaranty funds liability | 3,463 | | | (65,396) | | | (4,493) | |
| Payments relating to treasury shares received for restricted stock tax payments and stock option exercises | (81) | | | (78) | | | (73) | |
| Other financing activities | 21 | | | 16 | | | 36 | |
| Net cash provided by/(used in) financing activities | 79 | | | (64,345) | | | (1,841) | |
| Effect of exchange rate changes on cash, cash equivalents, restricted cash and cash equivalents, and cash and cash equivalent margin deposits and guaranty funds | (14) | | | 7 | | | (23) | |
| Net increase/(decrease) in cash, cash equivalents, restricted cash and cash equivalents, and cash and cash equivalent margin deposits and guaranty funds | 3,753 | | | (69,593) | | | 2,367 | |
| Cash, cash equivalents, restricted cash and cash equivalents, and cash and cash equivalent margin deposits and guaranty funds at beginning of period | 80,750 | | | 150,343 | | | 147,976 | |
| Cash, cash equivalents, restricted cash and cash equivalents, and cash and cash equivalent margin deposits and guaranty funds at end of period | $ | 84,503 | | | $ | 80,750 | | | $ | 150,343 | |
Intercontinental Exchange, Inc. and Subsidiaries
Consolidated Statements of Cash Flows (Continued)
(In millions)
| | | | | | | | | | | | | | | | | |
| Year Ended December 31, |
| 2024 | | 2023 | | 2022 |
| Supplemental cash flow disclosure: | | | | | |
| Cash paid for income taxes | $ | 957 | | | $ | 909 | | | $ | 882 | |
| Cash paid for interest | $ | 870 | | | $ | 727 | | | $ | 550 | |
| | | | | |
| As of December 31, |
| Reconciliation of the components of cash, cash equivalents, restricted cash and cash equivalents, and cash and cash equivalent margin deposits and guaranty funds to the consolidated balance sheets: | 2024 | | 2023 | | 2022 |
| Cash and cash equivalents | $ | 844 | | | $ | 899 | | | $ | 1,799 | |
| Short-term restricted cash and cash equivalents | 1,142 | | | 531 | | | 6,149 | |
| Long-term restricted cash and cash equivalents | 368 | | | 340 | | | 405 | |
| Cash and cash equivalent margin deposits and guaranty funds | 82,149 | | | 78,980 | | | 141,990 | |
| Total | $ | 84,503 | | | $ | 80,750 | | | $ | 150,343 | |
See accompanying notes.
Intercontinental Exchange, Inc. and Subsidiaries
Notes to Consolidated Financial Statements
1.Description of Business
Nature of Business and Organization
Intercontinental Exchange, Inc. is a leading global provider of technology and data to a broad range of customers including financial institutions, corporations and government entities. Our products, which span major asset classes including futures, equities, fixed income and United States, or U.S., residential mortgages, provide our customers with access to mission critical tools that are designed to increase asset class transparency and workflow efficiency. Our business is conducted through three reportable business segments:
•Exchanges: We operate regulated marketplace technology for the listing, trading and clearing of a broad array of derivatives contracts and financial securities as well as data and connectivity services related to our exchanges and clearing houses.
•Fixed Income and Data Services: We provide fixed income pricing, reference data, indices, analytics and execution services as well as global credit default swap, or CDS, clearing and multi-asset class data delivery technology.
•Mortgage Technology: We provide a technology platform that offers customers comprehensive, digital workflow tools that aim to address inefficiencies and mitigate risks that exist in the U.S. residential mortgage market life cycle from application through closing, servicing and the secondary market.
We operate marketplaces, technology and provide data services in the U.S., United Kingdom, or U.K., European Union, or EU, Canada, Asia Pacific and the Middle East.
2.Summary of Significant Accounting Policies
Basis of Presentation
The accompanying consolidated financial statements have been prepared by us in accordance with U.S. generally accepted accounting principles, or U.S. GAAP. These statements include the accounts of our wholly-owned and controlled subsidiaries. For consolidated subsidiaries in which our ownership is less than 100% and for which we have control over the assets and liabilities and the management of the entity, the non-ICE interests are shown as non-controlling interests. When non-controlling interests hold an option to require us to repurchase their interests, these amounts are shown as redeemable non-controlling interests and could be subject to remeasurement.
All intercompany balances and transactions between us and our wholly-owned and controlled subsidiaries have been eliminated in consolidation. The financial results of companies we acquire are included from the acquisition dates and the results of companies we sold are included up to the disposition dates. The accounting policies used to prepare these financial statements are the same as those used to prepare the consolidated financial statements in prior years.
Use of Estimates
Preparing financial statements in conformity with U.S. GAAP requires us to make certain estimates and assumptions that affect the amounts reported in our consolidated financial statements and accompanying disclosures. Actual amounts could differ from those estimates.
Comprehensive Income
Other comprehensive income includes foreign currency translation adjustments, our proportionate share of our equity method investments' other comprehensive income, and amortization of the difference in the projected benefit obligation and the accumulated benefit obligation associated with benefit plan liabilities, each of which is net of tax.
Segment and Geographic Information
As of December 31, 2024, our business is conducted through three reportable business segments: Exchanges, Fixed Income and Data Services, and Mortgage Technology. This presentation is reflective of how our chief operating decision maker reviews and operates our business. The majority of our identifiable assets are located in the U.S and U.K. (see Note 19).
Cash and Cash Equivalents, Short-Term and Long-Term Restricted Cash and Cash Equivalents, and Cash and Cash Equivalent Margin Deposits and Guaranty Funds
Cash and Cash Equivalents
We consider all short-term, highly liquid investments with maturities of three months or less at the time of purchase to be cash equivalents.
Short-Term and Long-Term Restricted Cash and Cash Equivalents
We classify all cash and cash equivalents that are not available for immediate or general business use by us as restricted in the accompanying consolidated balance sheets (see Note 7). This includes amounts set aside due to regulatory requirements, earmarked for specific purposes, or restricted by specific agreements. We also invest a portion of funds in excess of short-term operating needs in term deposits and investment-grade marketable debt securities, including government or government-sponsored agencies and corporate debt securities. These are classified as cash equivalents, are short-term in nature and carrying amount approximates fair value.
Cash and Cash Equivalent Margin Deposits and Guaranty Funds (Cash and Cash Equivalent Margin)
Original margin, variation margin and guaranty funds received by our clearing houses may be in the form of cash, invested deposits, government obligations, letters of credit at ICE NGX, European emission allowance certificates, or gold (see Note 14). We hold the cash deposits at central banks, highly-rated financial institutions or at times secure the cash through reverse repurchase agreements or direct investments, certain of which are not cash equivalents. See "Credit Risk and Significant Customers", below. Although not included in short term restricted cash and cash equivalents, cash and cash equivalent margin represents a form of restricted cash, and excludes invested deposits, delivery contracts receivable and unsettled variation margin since those amounts represent invested cash and not a form of restricted cash.
Investments
We have made various investments in debt securities and equity securities of other companies. We also invest in mutual funds and fixed income securities. We classify all other investments that are not cash equivalents with original maturity dates of less than one year as short-term investments and all investments that we intend to hold for more than one year as long-term investments. Short-term and long-term investments are included in other current and other non-current assets, respectively, in the accompanying consolidated balance sheets.
Debt Securities
We periodically purchase debt securities including U.S. Treasury securities or other high quality sovereign debt for purposes of meeting regulatory capital requirements at certain of our clearing houses. We classify these investments as held-to-maturity securities recorded at amortized cost with amortization of any premium or discount included in interest income in the consolidated statements of income. These short term debt securities are primarily included in restricted short-term investments in the accompanying consolidated balance sheets. As of December 31, 2024, we did not have any held-to-maturity debt securities with maturity dates at the time of purchase that exceeded one year.
Equity Investments
Investments in equity securities, or equity investments, with a readily determinable fair value that are not accounted for under the equity method are carried at fair value with changes in fair value, whether realized or unrealized, recognized in net income.
For equity investments that are not accounted for under the equity method and do not have readily determinable fair market values, such as those which are not publicly-listed companies, we apply the measurement alternative. Under the measurement alternative, these investments are recorded at cost minus impairment and adjusted to fair value if and when there is an observable price change in an orderly transaction of a similar or identical investment, with any change in fair value recognized in net income.
Our equity investments are included in other non-current assets in the accompanying consolidated balance sheets.
Equity Method Investments
When we do not have a controlling financial interest in an entity but exercise significant influence over the entity’s operating and financial policies, such investments are accounted for using the equity method and included in other non-current assets. We recognize dividends when declared as a reduction in the carrying value of our equity method investments. At the end of each reporting period, we record our share of profits or losses of our equity method
investments as equity earnings included in other income. We evaluate our equity method investments for impairment whenever events or changes in circumstances indicate that a decline in value has occurred that is other than temporary. If the investment is determined to have a decline in value deemed to be other than temporary it is written down to estimated fair value. We did not record any impairment charges on our equity method investments in 2024.
Property and Equipment
Property and equipment is recorded at cost, reduced by accumulated depreciation (see Note 8). Depreciation and amortization is computed using the straight-line method based on estimated useful lives of the assets, or in the case of leasehold improvements, the shorter of the remaining lease term or the estimated useful life of the improvement. We review the remaining estimated useful lives at each balance sheet date and make adjustments whenever events or changes in circumstances indicate that the remaining useful lives have changed. Gains on disposals are included in other income and losses on disposals are included in depreciation expense. Maintenance and repair costs are expensed as incurred.
Allowance for Doubtful Accounts
The allowance for doubtful accounts is maintained at a level that we believe to be sufficient to absorb probable losses over the expected life in our accounts receivable portfolio in accordance with ASC 326, Financial Instruments - Credit Losses. We estimate our allowance for doubtful accounts using an aging method, disaggregated based on major revenue stream categories as well as other unique revenue stream factors. The allowance is based on several factors, including continuous assessments of risk characteristics, specific customer events that may impact its ability to meet its financial obligations, and other reasonable and supportable economic characteristics. Accounts receivable are written-off against the allowance for doubtful accounts when collection efforts cease.
A reconciliation of the beginning and ending amount of allowance for doubtful accounts is as follows for the years ended December 31, 2024, 2023, and 2022 (in millions):
| | | | | | | | | | | | | | | | | |
| Year Ended December 31, |
| 2024 | | 2023 | | 2022 |
| Beginning balance of allowance for doubtful accounts | $ | 21 | | | $ | 22 | | | $ | 24 | |
| Bad debt expense | 17 | | | 17 | | | 11 | |
| Charge-offs | (17) | | | (18) | | | (13) | |
| Ending balance of allowance for doubtful accounts | $ | 21 | | | $ | 21 | | | $ | 22 | |
Charge-offs in the table above represent the write-off of uncollectible receivables, net of recoveries. These amounts also include the impact of foreign currency translation adjustments.
Software Development Costs
We capitalize costs related to software we develop or obtain for internal use. The costs capitalized include both internal and external direct and incremental costs. General and administrative costs related to developing or obtaining such software are expensed as incurred. Development costs incurred during the preliminary or maintenance project stages are expensed as incurred. Costs incurred during the application development stage are capitalized and amortized using the straight-line method over the useful life of the software, generally not exceeding three years (except for certain software which has a seven-year useful life). Amortization begins when the software is ready for its intended use.
Accrued Employee Benefits
We have a defined benefit pension plan and other postretirement benefit plans, or collectively the “benefit plans,” covering certain of our U.S. operations. The benefit accrual for the pension plan is frozen. We recognize the funded status of the benefit plans in our consolidated balance sheets, measure the fair value of plan assets and benefit obligations as of the date of our fiscal year-end, and provide additional disclosures in the footnotes (see Note 17).
Benefit plan costs and liabilities are dependent on assumptions used in calculating such amounts. These are provided by a third-party specialist and include discount rates, health care cost trend rates, benefits earned, interest cost, expected return on assets, mortality rates and other factors. Actual results that differ from the assumptions are accumulated and amortized over future periods and, therefore, generally affect recognized expense and the recorded obligation in future periods. However, certain of these unrecognized amounts are recognized when triggering events occur, such as when a settlement of pension obligations in excess of total interest and service costs occurs. While we believe that the assumptions used are appropriate, differences in actual experience or changes in assumptions may affect our pension and other post-retirement obligations and future expense recognized.
Goodwill and Indefinite-Lived Intangible Assets
Goodwill represents the excess of the purchase price of our acquisitions over the fair value of identifiable net assets acquired, including other identified intangible assets (see Note 9). We recognize specifically-identifiable intangibles when a specific right or contract is acquired. That value is determined with the assistance of third-party valuation specialists. Goodwill has been allocated to our reporting units for purposes of impairment testing based on the portion of synergy, cost savings and other expected future cash flows expected to benefit the reporting units at the time of the acquisition. The reporting units identified for our goodwill testing are: the New York Stock Exchange, or NYSE, Other Exchanges, Fixed Income and Data Services, and Mortgage Technology. Goodwill impairment testing is performed annually at the reporting unit level in the fiscal fourth quarter or more frequently if conditions exist that indicate that it may be impaired, or if changes are made to the reporting units.
For both goodwill and indefinite-lived impairment testing we have the option to first perform a qualitative assessment to determine whether it is more likely than not that the fair value of a reporting unit or indefinite lived intangible asset is less than its carrying amount. If the fair value of the reporting unit or indefinite-lived intangible asset is less than its carrying value, an impairment loss is recognized in earnings in an amount equal to the difference. Alternatively, we may choose to bypass the qualitative option and perform quantitative testing to determine if the fair value is less than carrying value. For our goodwill impairment testing, we have elected to bypass the qualitative assessment and apply the quantitative approach. For our testing of indefinite-lived intangible assets, we apply both qualitative and quantitative approaches.
Long-Lived Assets and Finite-Lived Intangible Assets
We review our long-lived and finite-lived intangible assets for impairment whenever events or changes in circumstances indicate that the carrying amount may not be fully recoverable. When these indicators exist, we project undiscounted net future cash flows over the remaining life of such assets. If the sum of the projected cash flows is less than the carrying amount, an impairment would exist, measured based upon the difference between the carrying amount and the fair value of the assets. Finite-lived intangible assets are generally amortized using the straight-line method over the lesser of their contractual or estimated useful lives.
All costs related to internally developed patents and trademarks are expensed as incurred. All costs related to purchased patents, trademarks and internet domain names are recorded as other intangible assets and are amortized using a straight-line method over their estimated useful lives. All costs related to licensed patents are capitalized and amortized using a straight-line method over the term of the license.
Derivatives and Hedging Activity
Periodically, we may use derivative financial instruments to manage exposure to changes in currency exchange rates. All derivatives are recorded at fair value. We generally do not designate these derivatives as hedges for accounting purposes. Accordingly, changes in fair value are recognized in income.
We entered into foreign currency hedging transactions during 2024, 2023 and 2022 as economic hedges to help mitigate a portion of our foreign exchange risk exposure. The gains and losses on these transactions were not material during these years.
Income Taxes
We recognize income taxes under the liability method. We recognize a current tax liability or tax asset for the estimated taxes payable or refundable on tax returns for the current year. We recognize deferred tax assets and liabilities for the expected future tax consequences of temporary differences between the financial statement carrying amounts and the tax bases of assets and liabilities. We establish valuation allowances if we believe that it is more likely than not that some or all of our deferred tax assets will not be realized. Deferred tax assets and liabilities are measured using current enacted tax rates in effect. We do not recognize a tax benefit unless we conclude that it is more likely than not that the benefit will be sustained on audit by the taxing authority based solely on the technical merits of the associated tax position. If the recognition threshold is met, we recognize a tax benefit measured at the largest amount of the tax benefit that, in our judgment, is greater than 50 percent likely to be realized. We recognize accrued interest and penalties related to uncertain tax positions as a component of income tax expense. We recognize the tax effects related to Global Intangible Low-Taxed Income in the period it is incurred.
We are subject to tax in numerous domestic and foreign jurisdictions primarily based on our operations in these jurisdictions. Significant judgment is required in assessing the future tax consequences of events that have been recognized in our financial statements or tax returns. Fluctuations in the actual outcome of these future tax consequences could have a material impact on our financial position or results of operations.
We use a portfolio approach with respect to pension, postretirement benefits plan obligations and currency translation matters when we determine the timing and extent to which stranded income tax effects from items that were previously recorded in accumulated other comprehensive income are released.
Revenue Recognition
Our revenues primarily consist of revenues for transactions executed and/or cleared through our global electronic derivatives trading and clearing exchanges and cash equities trading as well as revenues related to our fixed income, data services, mortgage technology services and listings. We recognize revenue when we transfer promised goods or services to customers in an amount that reflects the consideration to which we expect to be entitled in exchange for those goods or services. We enter into contracts that can include various combinations of products and services, which are generally capable of being distinct and accounted for as separate performance obligations. We also evaluate all contracts in order to determine appropriate gross versus net revenue reporting.
Substantially all of our revenues are considered to be revenues from contracts with customers. The related accounts receivable balances are recorded in our balance sheets as customer accounts receivable. We do not have obligations for warranties, returns or refunds to customers, other than rebates, which are settled each period and therefore do not result in variable consideration. We do not have significant revenue recognized from performance obligations that were satisfied in prior periods. Certain judgments and estimates are used in the identification and timing of satisfaction of performance obligations and the related allocation of transaction price. We believe that these represent a faithful depiction of the transfer of services to our customers.
A contract asset represents our expectation of receiving consideration in exchange for products or services that we have provided to our customers, but invoicing is contingent on our completion of other performance obligations or contractual milestones. Substantially all of our contract assets are related to contracts with customers in our Mortgage Technology segment and are assessed for impairment periodically.
Deferred revenue represents our contract liabilities related to our annual, original and other listings revenues, certain data services, clearing services, mortgage technology services and other revenues. See Note 6 for our discussion of deferred revenue balances, activity, and expected timing of recognition.
Our disclosure of transaction price allocated to unsatisfied performance obligations excludes amounts from contracts with durations of one year or less and amounts not required to be estimated as part of the transaction price. For all of our contracts with customers, except for listings and certain data, mortgage and clearing services, our performance obligations are short term in nature and there is no significant variable consideration. In addition, we have elected the practical expedient of excluding sales taxes from transaction prices.
We capitalize incremental contract acquisition costs that relate directly to an existing contract or a specific anticipated contract and are expected to be recovered. Costs that would have been incurred regardless of whether the contract was obtained are expensed as incurred. As a practical expedient, we expense incremental costs of obtaining a contract if the amortization period of the asset would be one year or less. We also consider whether to capitalize costs to fulfill a contract that may be incurred before we commence performance on an obligation. These costs represent incremental, recoverable external costs and certain internal costs that are directly related to the contract and are primarily associated with costs of resources involved in installation of systems, processes and data conversion. These capitalized costs are amortized on a systematic basis consistent with the transfer to the customer of the solutions or services to which the asset relates. We consider the explicit term of the contract with the customer, expected renewals and the rate of change related to our solutions in determining the amortization period. The balance of our deferred contract costs as of December 31, 2024 and 2023 was $45 million and $26 million, respectively.
Activity Assessment Fees and Section 31 Fees
We pay the Securities and Exchange Commission, or SEC, fees pursuant to Section 31 of the Securities Exchange Act of 1934 for transactions executed on our U.S. equities and options exchanges. These Section 31 fees are designed to recover the costs to the government for supervising and regulating the securities markets and securities professionals. We (or the Options Clearing Corporation, or OCC, on our behalf), in turn, collect activity assessment fees, which are included in exchanges revenues in the accompanying consolidated statements of income, from member organizations clearing or settling trades on the U.S. equities and options exchanges and recognize these amounts as revenue. Fees received are included in cash at the time of receipt and, as required by law, the amount due to the SEC is remitted semi-annually and recorded as an accrued liability until paid. The activity assessment fees are designed so that they are equal to the Section 31 fees paid by us to the SEC. As a result, Section 31 fees do not have an impact on our net income.
Interest on Margin Deposits and Fees Charged for Non-cash Margin
For purposes of safeguarding customer funds, guaranty fund and original margin deposits of clearing members and their customers are maintained in accounts with national banks and highly-rated financial institutions or secured through other vehicles. Interest earned on these deposits is provided back to clearing members net of certain costs and administrative fees charged and retained by ICE. The ICE Clearing Houses also charge fees for clearing members pledging non-cash margin in lieu of cash margin, and these fees are fully retained by ICE. The safeguarding of clearing member funds is considered a core part of the clearing houses' operations, and therefore, the net interest and fees are included in total revenues within the consolidated statements of income.
Stock-Based Compensation
We currently have employee and non-employee director incentive plans from which we grant stock options, restricted shares, and restricted stock units with various service, performance, and/or market conditions. We also have an Employee Stock Purchase Plan, or ESPP, to provide additional and incentive-based compensation to our employees and directors (see Note 11). Stock options and restricted stock are granted at the discretion of the Compensation Committee of the Board of Directors. We measure and recognize compensation expense for share-based payment awards, including employee stock options, restricted stock and shares purchased under the ESPP based on estimated fair values on the date of grant, while factoring in an estimated forfeiture rate. The value of the portion of the award that is ultimately expected to vest is recognized as stock-based compensation expense over the requisite service period.
We use the Black-Scholes pricing model to value stock option awards as well as shares purchased as part of our ESPP. The values estimated by the model are affected by the price of our stock as well as subjective variables that include assumed interest rates, our expected dividend yield, our expected share price volatility over the term of the awards and actual and projected employee stock option exercise behavior. Under our ESPP, employees may purchase shares of our common stock at a price equal to 85% of the lesser of the fair market value of the stock on the first or the last trading day of each offering period. We record compensation expenses related to the discount given to our participating employees.
Treasury Stock
We record treasury stock activities under the cost method whereby the cost of the acquired stock is recorded as treasury stock (see Note 12). In the event it occurs in the future, our accounting policy upon the formal retirement of treasury stock is to deduct the par value from common stock and to reflect any excess of cost over par value as a deduction from additional paid-in capital (to the extent created by previous issuances of the shares) and retained earnings.
Credit Risk and Significant Customers
Our clearing houses are exposed to credit risk as a result of maintaining clearing member cash deposits at various financial institutions (see Note 14). Cash deposit accounts are established at large, highly-rated financial institutions and entered into so that they restrict the rights of offset or imposition of liens by the banks. We also limit our risk of loss by holding the majority of the cash deposits in cash accounts at certain central banks, short-term reverse repurchase agreements with various counterparties securitized by highly rated sovereign debt or direct investments in short-term high quality sovereign and supranational debt issues primarily with original maturities of three months or less at the time of purchase. While we seek to achieve a reasonable rate of return which may generate interest income for our clearing members, we are primarily concerned with preservation of capital and managing the risks associated with these deposits. As the clearing houses may pass on interest revenues, minus costs, to the members, this could include negative or reduced yield due to market conditions.
When engaging in reverse repurchase agreements, our clearing houses take delivery of the underlying securities in custody accounts under clearing house control. Additionally, the securities purchased have a market value greater than the reverse repurchase amount. The typical haircut received for high quality sovereign debt is 2% of the reverse repurchase amount. Thus, in the event that a reverse repurchase counterparty defaults on its obligation to repurchase the underlying reverse repurchase securities, our clearing house will have possession of securities with a value potentially greater than the reverse repurchase counterparty’s obligation to the clearing house.
ICE Clear Credit, a systemically important financial market utility as designated by the Financial Stability Oversight Council, maintains a U.S. dollar account at the Federal Reserve Bank of Chicago as of December 31, 2024. ICE Clear Europe maintains a euro-denominated account at the European Central Bank, or ECB, the central bank of the EU countries, as well as pounds sterling- and euro-denominated accounts at the Bank of England, or BOE, the central bank of the U.K. These accounts provide the flexibility for ICE Clear Europe to place euro- and pounds sterling-denominated cash margin securely at national banks, in particular during periods when liquidity in the euro and pounds sterling repo markets
may temporarily become contracted. Such accounts are intended to decrease ICE Clear Credit and ICE Clear Europe’s custodial, liquidity and operational risk as compared to alternative custodial and investment arrangements.
Our futures businesses have minimal credit risk as the majority of their transaction revenues are currently cleared through our clearing houses. Our accounts receivable related to fixed income and data services revenues, cash trading, listing revenues, technology revenues, CDS and bilateral over-the-counter, or OTC, energy transaction revenues and mortgage technology services subjects us to credit (collection) risk, as we do not require these customers to post collateral. We limit our risk of loss by terminating a customer's ability to remain listed or receive data or terminating other services for entities with delinquent accounts. The concentration of risk on accounts receivable is also mitigated by the large number of entities comprising our customer base. There were no individual accounts receivable balances greater than 10% of total consolidated accounts receivable as of December 31, 2024 or December 31, 2023. Our accounts receivable are stated at the billed amount.
Clearing members are primarily intermediaries and represent a broad range of principal trading firms. If a clearing member ceased its operations, we believe that the trading firms would continue to conduct transactions and would clear those transactions through another clearing member firm.
Leases
We record our leases in accordance with ASC 842, Leases. At lease inception, we review the service arrangement and components of a contract to identify if a lease or embedded lease arrangement exists. An indicator of a contract containing a lease is when we have the right to control and use an identified asset over a period of time in exchange for consideration. Operating lease right-of-use assets and liabilities are recorded at the lease commencement date based on the present value of the lease payments to be made over the lease term. As the rate implicit in the lease is not readily determinable in most of our leases, we use our incremental borrowing rate based on the information available at the commencement date in determining the present value of lease payments. Certain lease agreements include options to extend, renew or terminate the lease agreement and these terms are evaluated at inception and on an ongoing basis to determine the lease term.
We have elected the short-term lease policy to recognize leases with a term of 12 months or less as rent expense on a straight-line basis over the lease term and do not recognize these short-term leases on our balance sheet. We have elected the practical expedient of not separating lease and non-lease components as our lease arrangements are not highly dependent on other underlying assets. Our lease agreements do not contain any residual value guarantees. Rent expense is recognized on a straight-line basis over the lease term. Rent expense is included in rent and occupancy expenses and technology and communication expenses in the accompanying consolidated statements of income (see Note 15).
Acquisition-Related Transaction and Integration Costs
We incur incremental costs relating to our completed and potential acquisitions and other strategic opportunities. This includes fees for investment banking advisors, lawyers, accountants, tax advisors and public relations firms, as well as costs associated with credit facilities and other external costs directly related to the proposed or closed transactions. Integration costs include costs incurred to achieve acquisition synergies including certain severance and retention costs, stock-based compensation, advisory fees and duplicative costs, among others. In accordance with ASC 805, Business Combinations, acquisition-related transaction and integration costs, excluding costs to issue debt or equity securities, are expensed in the period in which these costs are incurred and the services are received and are not included in the purchase price.
The acquisition-related transaction and integration costs incurred during 2024 and 2023 were primarily due to direct costs incurred related to our acquisition and integration of Black Knight and our integration of Ellie Mae Inc., or Ellie Mae (see Note 3) and the acquisition-related transaction and integration costs incurred during 2022 were primarily due to direct costs related to our integration of Ellie Mae.
Fair Value of Financial Instruments
Fair value is the price that would be received from selling an asset or paid to transfer a liability (an exit price) in the principal or most advantageous market for the asset or liability in an orderly transaction between market participants at the measurement date. Our financial instruments consist primarily of certain short-term and long-term assets and liabilities, customer accounts receivable, margin deposits and guaranty funds, equity and equity method investments, and short-term and long-term debt (see Note 18).
The fair value of our financial instruments is measured based on a three-level hierarchy:
•Level 1 inputs — quoted prices for identical assets or liabilities in active markets.
•Level 2 inputs — observable inputs other than Level 1 inputs such as quoted prices for similar assets and liabilities in active markets or inputs other than quoted prices that are directly observable.
•Level 3 inputs — unobservable inputs supported by little or no market activity and that are significant to the fair value of the assets or liabilities.
Foreign Currency Translation Adjustments and Foreign Currency Transaction Gains and Losses
Our functional and reporting currency is the U.S. dollar. We have exposure to foreign currency translation gains and losses arising from our net investment in certain U.K., continental European, Asian and Canadian subsidiaries. The revenues, expenses and financial results of these subsidiaries are recorded in the functional currency of the countries that these subsidiaries are located in, which are primarily pounds sterling and euros. The financial statements of these subsidiaries are translated into U.S. dollars using a current rate of exchange, with gains or losses, net of tax as applicable, included in the cumulative translation adjustment account, a component of equity. As of December 31, 2024 and 2023, the portion of our equity attributable to accumulated other comprehensive loss from foreign currency translation adjustments was $285 million and $230 million, respectively.
We have foreign currency transaction gains and losses related to the settlement of foreign currency denominated assets, liabilities and payables that occur through our operations. These transaction gains and losses are due to the increase or decrease in the foreign currency exchange rates between periods. Forward contracts on foreign currencies are entered into to manage the foreign currency exchange rate risk. Gains and losses from foreign currency transactions are included in other income/(expense) in the accompanying consolidated statements of income and resulted in net losses of $15 million, $12 million and $9 million in 2024, 2023 and 2022, respectively.
Earnings Per Common Share
Basic earnings per common share is calculated using the weighted average common shares outstanding during the year. Common equivalent shares from stock options and restricted stock awards, using the treasury stock method, are included in the diluted per share calculations unless the effect of inclusion would be antidilutive (see Note 20).
Recently Adopted Accounting Pronouncements
| | | | | | | | |
| Standard/Description | Adoption Considerations | Effect on Financial Statements |
ASU 2021-08, Business Combinations (Topic 805), Accounting for Contract Assets and Contract Liabilities from Contracts with Customers, requires the recognition and measurement of contract assets and contract liabilities acquired in a business combination in accordance with ASC 606, Revenue from Contracts with Customers. Considerations to determine the amount of contract assets and contract liabilities to record at the acquisition date include the terms of the acquired contract, such as timing of payment, identification of each performance obligation in the contract and allocation of the contract transaction price to each identified performance obligation on a relative standalone selling price basis as of contract inception.
This standard was effective beginning in the first quarter of 2023 and should be applied prospectively for acquisitions occurring on or after the effective date of the amendment, with early adoption permitted. | We adopted this ASU early as of December 31, 2022. | We applied the recently adopted pronouncement to our evaluation of the contract assets acquired and contract liabilities assumed as part of the Black Knight acquisition. Refer to Note 3 for more information. |
ASU 2023-07, Segment Reporting (Topic 280): Improvements to Reportable Segment Disclosures, requires enhanced disclosures primarily regarding significant segment expenses that are regularly provided to the chief operating decision maker and a description of other segment expense details. The ASU also requires all annual disclosures required by Topic 280 to be included in interim periods.
This standard is effective for our 2024 fiscal year and interim periods beginning in the first quarter of 2025, with early adoption permitted. This standard should be applied retrospectively once adopted. | We adopted this ASU as of December 31, 2024 in our annual financial statements. | We applied the recently adopted pronouncement and expanded our segment disclosures by disclosing the title and position of our chief operating decision maker and adding additional segment expense details to align with how our chief operating decision maker reviews expenses. Refer to Note 19 for more information. |
| | |
| | |
| | |
Accounting Pronouncements Not Yet Adopted in These Financial Statements
| | | | | | | | |
| Standard/Description | Adoption Considerations | Effect on Financial Statements |
ASU 2023-09, Income Taxes (Topic 740): Improvements to Income Tax Disclosures, requires greater disaggregation of income tax disclosures related to the income tax rate reconciliation and income taxes paid. The ASU also requires disclosure of income (or loss) from continuing operations before income tax expense (or benefit) disaggregated between domestic and foreign and disclosure of income tax expense (or benefit) from continuing operations broken out between federal, state/local and foreign.
This standard is effective for our annual periods beginning after December 15, 2024, with early adoption permitted. The ASU applies on a prospective basis to the annual financial statements for the periods beginning after the effective date. Retrospective application in all prior periods presented is permitted. | We do not expect to adopt this ASU early and plan to adopt the ASU for our 2025 annual financial statements. | We are currently evaluating the impact of adopting this ASU on our income taxes disclosures. |
ASU 2024-03, Income Statement- Reporting Comprehensive Income- Expense Disaggregation Disclosures (Topic 220): Disaggregation of Income Statement Expenses requires disclosures about specific types of expenses included in the expense captions presented on the face of the income statement, as well disclosures about selling expenses.
This standard is effective for our annual periods beginning after December 15, 2026 and interim periods beginning after December 15, 2027, with early adoption permitted. Prospective application is required and retrospective application is permitted. | We do not expect to adopt this ASU early and plan to adopt the ASU for our 2027 annual financial statements. | We are currently evaluating the impact of adopting this ASU on our income statement disaggregation disclosures. |
3.Acquisitions and Divestitures
Black Knight, Inc. Acquisition
On September 5, 2023, we acquired 100% of the equity interests in Black Knight, Inc., or Black Knight, for aggregate transaction consideration of approximately $11.8 billion. The aggregate cash component of the transaction consideration was $10.5 billion. We issued 10.9 million shares of ICE common stock to Black Knight stockholders, which was based on the market price of our common stock and the average of the volume weighted averages of the trading prices of our common stock on each of the ten consecutive trading days ending three trading days prior to the closing of the merger. We expect that this transaction will build on our position as a provider of end-to-end electronic workflow solutions for the rapidly evolving U.S. residential mortgage industry. We believe the Black Knight ecosystem adds value for clients of all sizes across the mortgage and real estate lifecycles by helping organizations lower costs, increase efficiencies, grow their businesses, and reduce risk.
On September 14, 2023, or the Divestiture Date, in connection with the merger agreement, we sold Black Knight's Optimal Blue and Empower loan origination system, or LOS, businesses, or the Divestitures, to subsidiaries of Constellation Software, Inc. The cash proceeds from the Divestitures were $241 million. The structure of the Optimal Blue transaction also included a promissory note with a face value of $500 million, or the Promissory Note, issued by the purchaser to Black Knight, as a subsidiary of ICE, at the closing of the transaction. The Promissory Note had a 40-year term with a maturity date of September 5, 2063, and a coupon interest rate of 7.0% per year. The Promissory Note was valued at $235 million on the Divestiture Date. In accordance with Accounting Standards Codification, or ASC, 805, Business Combinations, or ASC 805, as well as ASC 360, Impairment and Disposal of Long-Lived Assets, we are required to measure an acquired long-lived asset or disposal group that is classified as held for sale at the acquisition date at fair value less cost to sell. Accordingly, there was no gain or loss recognized on the Divestitures.
For the period between the acquisition date of September 5, 2023 through the Divestiture Date, the discontinued
operations of Empower and Optimal Blue were immaterial.
Pursuant to the Agreement Containing Consent Orders entered into between the Federal Trade Commission, or the FTC, and ICE and Black Knight, the Promissory Note was required to be sold within six months of the Divestiture Date. We elected the fair value option for the right to receive the net proceeds of the sale of the Promissory Note. As of December 31, 2023, we wrote down the value of the Promissory Note to $75 million based on Level 3 inputs (Note 18), resulting in a fair value loss of $160 million. In February 2024, the FTC approved the buyer of the Promissory Note, and we completed the sale of the Promissory Note and received the $75 million of proceeds thereafter.
The net fair value of the consideration transferred for Black Knight was approximately $11.4 billion as of the acquisition date, which consisted of the following (in millions):
| | | | | |
| Transaction Consideration |
| Cash | $ | 10,542 | |
| ICE common stock* | 1,274 | |
| Converted vested Black Knight awards | 22 | |
| Total purchase price | $ | 11,838 | |
| Less: Divestitures | (476) | |
| Total net purchase price | $ | 11,362 | |
* Fair value of the ICE common stock was based on the ICE closing stock price on September 1, 2023, the last business day prior to the closing of the Black Knight acquisition.
The purchase price has been allocated to the net tangible and identifiable intangible assets and liabilities based on the respective estimated fair values on the date of acquisition. The excess of the purchase price over the net tangible and identifiable intangible assets has been recorded as goodwill, of which $186 million is expected to be deductible for tax purposes. Goodwill represents potential revenue synergies related to new product development, various expense synergies and opportunities to enter new markets, and is assigned to our Mortgage Technology business segment. The net purchase price allocation is as follows (in millions):
| | | | | |
| Net Purchase Price Allocation |
| Cash and cash equivalents | $ | 108 | |
| Property and equipment | 120 | |
| Goodwill | 9,441 | |
| Identifiable intangibles | 4,948 | |
| Debt acquired | (2,397) | |
| Other assets and liabilities, net | 25 | |
| Deferred tax liabilities on identifiable intangibles | (1,270) | |
| Other deferred tax assets | 387 | |
| Net purchase price | $ | 11,362 | |
In performing the net purchase price allocation, we considered, among other factors, the intended future use of acquired assets, analysis of historical financial performance and estimates of future performance of the Black Knight business. For the identified intangible assets, the fair values have been determined using the income and cost approaches and are partially based on inputs that are unobservable including forecasted future cash flows, revenue and margin growth rates, customer attrition rates and discount rates that require judgement.
The following table sets forth the components of the intangible assets associated with the acquisition as of December 31, 2024 (in millions, except years):
| | | | | | | | | | | |
| Acquisition-Date Fair Value | | Weighted average life (Years) |
| Developed Technology | $ | 1,176 | | | 10 |
| Trademarks and Trade names | 159 | | | 19 |
| Customer Relationships | 3,034 | | | 13 |
| Data and Databases | 579 | | | 10 |
| Total | $ | 4,948 | | | 12 |
From the acquisition date through December 31, 2023, Black Knight revenues of $363 million, which are included in our mortgage technology revenues, and operating expenses of $470 million were recorded in our consolidated statements of income.
The financial information in the table below combines the historical results for us and Black Knight for 2023 and 2022, on a pro forma basis, as though the companies had been combined as of the beginning of the periods presented (in millions). The unaudited pro forma financial information is presented for informational purposes only and is not indicative of the results of operations that would have been achieved if the acquisition had taken place at the beginning of the periods presented. This unaudited pro forma financial information is based on estimates and assumptions that have been made solely for purposes of developing such unaudited pro forma information, including, without limitation, purchase accounting adjustments, interest expense on debt incurred to finance the purchase price, acquisition-related transaction costs, the removal of historical Black Knight intangible asset amortization and the addition of intangible asset amortization related to this acquisition. The unaudited pro forma financial information does not reflect any synergies or operating cost reductions that have been and may be achieved from the combined operations (in millions).
| | | | | | | | | | | |
| Year Ended December 31, |
| | 2023 | | 2022 |
| Total revenues, less transaction-based expenses | $ | 8,735 | | | $ | 8,416 | |
| Net income attributable to ICE | $ | 2,128 | | | $ | 1,110 | |
Transaction-based expenses included within total revenues, less transaction-based expenses in the table above, were not impacted by pro forma adjustments and agree to the amounts presented historically in our consolidated statements of income as they relate solely to ICE and not to Black Knight.
Other Acquisitions
During 2024, 2023 and 2022, we acquired multiple companies which were not material to our operations.
4.Investments
Equity Investments
Dun & Bradstreet
In connection with our acquisition of Black Knight, we acquired an investment in Dun & Bradstreet Holdings, Inc., or D&B, a global provider of business decisioning data and analytics, which we classified as an equity investment. Subsequent to the Black Knight acquisition and prior to December 31, 2023, we sold the entire investment for a total of $187 million and realized a total loss of $3 million on the sale, net of dividends received, which is included in other income/(expense), net in our consolidated statement of income in 2023.
Euroclear
We previously owned a 9.8% stake in Euroclear, plc, or Euroclear, that we originally purchased for $631 million. We participated on the Euroclear Board of Directors, and we classified our investment in Euroclear as an equity investment.
On May 20, 2022, we completed the sale of our 9.8% stake in Euroclear. The carrying value of our investment was $700 million at the time of the sale. We recorded a net gain on the sale of $41 million, which is included in other income/(expense), net in our consolidated statement of income in 2022.
Equity Method Investments
Our equity method investments include OCC and Bakkt Holdings, Inc., and Bakkt Opco Holdings, LLC, or collectively, Bakkt, among others. We recognized $62 million, $122 million and $1.3 billion as our share of estimated losses, net, from our equity method investments included in other income/(expense), net in our consolidated statements of income during 2024, 2023 and 2022, respectively. The estimated losses during 2024, 2023 and 2022 are primarily related to our investment in Bakkt, partially offset by our share of OCC profits. In addition, during 2022, after recording our share of Bakkt's equity method losses, which included an impairment charge recorded by Bakkt, we recorded an impairment in our investment in Bakkt to its fair value as other expense. Each period includes adjustments to reflect the difference between reported prior period actual results from our original estimates.
When performing our assessment of the carrying value of our investments, we consider, among other things, the length of time and the extent to which the market value has been less than our cost basis, if applicable, the investee's financial condition and near-term prospects, the economic or technological environment in which our investees operate, weakening of the general market condition of the related industry, whether an investee can continue as a going concern, any impairment charges recorded by an investee on goodwill, intangible or long-lived assets, and our intent and ability to retain the investment for a period of time sufficient to allow for any anticipated recovery in market value.
OCC
We own a 40% interest in OCC through a direct investment by the NYSE. OCC is regulated by the SEC as a registered clearing agency and by the Commodity Futures Trading Commission, or CFTC, as a derivatives clearing organization. OCC serves as a clearing house for securities options, security futures, commodity futures and options on futures traded on various independent exchanges. OCC clears securities options traded on NYSE Arca and NYSE Amex Options, along with other non-affiliated exchanges.
Bakkt
As of December 31, 2024, and December 31, 2023, we held an approximate 54% and 64% economic interest in Bakkt, respectively. As a result of limitations on ICE from the Bakkt voting agreement entered into in connection with Bakkt's merger with Victory Park Capital Impact Acquisition Holdings, or VIH, we hold a minority voting interest in Bakkt and treat it as an equity method investment. The decrease in ownership during 2024 was related to Bakkt's offering of shares of its Class A common stock and warrants to purchase shares of its Class A common stock, which diluted our ownership. As part of the offering, on February 29, 2024, we entered into a securities purchase agreement to purchase shares of Bakkt's Class A common stock and warrants to purchase additional shares of Bakkt's Class A common stock for a total of $10 million.
As of December 31, 2024, we do not have any value assigned to the equity method investment carrying value for Bakkt primarily due to our continued recording of our share of losses. As Bakkt is a public company with a readily available market price, the fair value of our investment was $185 million as of December 31, 2024, which was based on the quoted market price of Bakkt Class A common stock as of December 31, 2024.
On August 12, 2024, we entered into a revolving credit agreement with Bakkt pursuant to which we have agreed to provide Bakkt with a $40 million secured revolving line of credit that matures on December 31, 2026. The $40 million is available in defined commitment amounts for specified time periods in the future. No amounts were permitted to be borrowed without our consent prior to December 31, 2024, after which date the amount Bakkt may borrow will increase over time up to a maximum of $40 million on or after September 30, 2025. As an equity method investee, Bakkt is a related party of ICE. There were no amounts outstanding under the revolving credit agreement as of December 31, 2024.
We recorded estimated equity losses and impairment of $1.4 billion during 2022 related to our investment in Bakkt, which included the impairment discussed above, and was based on what we consider to be an other-than-temporary decline in fair value as a result of the factors noted above, and included consideration for the impairment charge recorded by Bakkt.
We concluded that Bakkt met the significance test under Rule 3-09 of Regulation S-X for 2022. Bakkt's total assets and liabilities as of December 31, 2022 were $455 million and $119 million, respectively, and Bakkt's net revenues and net loss in 2022 were $55 million and $2.0 billion, respectively. Bakkt no longer met the significance test in 2024 or 2023. However, in accordance with Rule 3-09 of Regulation S-X, since Bakkt met the significance test for a prior year presented in these financial statements, Bakkt financial statements as of and for the year ended December 31, 2024 will be filed by us subsequent to the filing of our Form 10-K as an amendment to this Form 10-K.
5.Revenue Recognition
Our primary revenue contract classifications are described below. These categories best represent those with similar economic characteristics of the nature, amount, timing and uncertainty of our revenues and cash flows.
Exchanges Revenues
•Futures and Options: Revenues in our futures and options trading businesses primarily represent fees charged for the performance obligations of derivatives trading and clearing. In our derivatives markets, we earn transaction and clearing revenues from both counterparties to each contract that is traded and/or cleared.
Our transaction and clearing revenues are primarily included in our Exchanges segment with the exception of our CDS and fixed income transaction and clearing revenues which are discussed below and are included in our Fixed Income and Data Services segment. Derivatives trading and clearing fees contain two performance obligations: (1) trade execution/clearing novation and (2) risk management of open interest. While we allocate the transaction price between these two performance obligations, since they generally are satisfied almost simultaneously, there is no significant deferral of revenue. Our Exchanges segment futures and options transaction and clearing revenues are reported net of rebates. Rebates were $1.3 billion, $928 million and $815 million in 2024, 2023 and 2022, respectively. Transaction and clearing fees can be variable based on trade volume discounts used in the determination of rebates, however virtually all volume discounts are calculated and recorded on a monthly basis. Transaction and clearing fees, as well as any volume discounts rebated to our customers, are calculated and billed monthly in accordance with our published fee schedules.
•Cash Equities and Equity Options: Revenues in our cash equity and equity options markets represent trade execution fees. Cash trading and equity options contain one performance obligation related to each transaction which occurs instantaneously, and the revenue is recorded at the point in time of the transaction. We make liquidity payments to certain customers, as well as charge routing fees related to orders in our markets which are routed to other markets for execution and recognize those payments as a cost of revenue. In addition, we pay NYSE regulatory oversight fees to the SEC and collect equal amounts from our customers. These are also considered a cost of revenue, and both of these NYSE-related fees are included in transaction-based expenses. For one of our equity option exchanges, revenues are reported net of rebates. Rebates for that exchange were $40 million, $61 million and $50 million in 2024, 2023 and 2022, respectively.
•Listings: Our listings revenues include original and annual listings fees, and other corporate action fees. Each distinct listing fee is allocated to multiple performance obligations including original and incremental listing and investor relations services, as well as a customer’s material right to renew the option to list on our exchanges. In performing this allocation, the standalone selling price of the listing services is based on the original and annual listing fees and the standalone selling price of the investor relations services is based on its market value. All listings fees are billed upfront and the identified performance obligations are satisfied over time. Revenue related to the investor relations performance obligation is recognized ratably over the period these services are provided, with the remaining revenue recognized ratably over time as customers continue to list on our exchanges. Listings fees related to other corporate actions are considered contract modifications of our listing contracts and are recognized ratably over time as customers continue to list on our exchanges.
•Data and Connectivity Services: Our data and connectivity services revenues are related to the various data and connectivity services that we provide which are directly attributable to our exchange venues. Exchange data services include, among other offerings, proprietary real-time and historical pricing data, as well as order book and transaction information related to our global futures markets and the NYSE exchanges. In addition, we receive a share of revenue from the National Market System, or NMS, Plan. Separately, we also provide connectivity services directly related to our futures, cash equity and options exchanges and clearing houses. Data and connectivity services revenues are primarily subscription-based, billed monthly, quarterly or annually in advance and recognized ratably over time as our performance obligations of data delivery are met consistently throughout the period. Considering that these contracts primarily consist of single performance obligations with fixed prices, there is no variable consideration and no need to allocate the transaction price.
•OTC and Other: Our OTC revenues are generated in our bilateral energy markets where we offer electronic trading on contracts based on physically settled natural gas, power and refined oil contracts. Other revenues primarily include interest income on certain clearing margin deposits, regulatory penalties and fines, fees for use of our facilities, regulatory fees charged to member organizations of our U.S. securities exchanges, designated market maker service fees, exchange membership fees and agricultural grading and certification fees. Generally, fees for OTC and other revenues contain one performance obligation. Because these contracts primarily consist of single performance obligations with fixed prices, there is no variable consideration and no need to allocate the transaction price. Services for OTC and other revenues are primarily satisfied at a point in time. Therefore, there
is no need to allocate the fee and no deferral results since we have no further obligation to the customer at that time.
In certain of our revenue share arrangements with third parties we control the delivered contract; in these arrangements we are acting as a principal and the revenue is recorded gross.
Fixed Income and Data Services Revenues
•Fixed Income Execution: Execution fees, which include revenues from ICE Bonds, are reported net of rebates, and can be variable based on trade volume discounts used in the determination of rebates, however virtually all volume discounts are calculated and recorded on a monthly basis. Execution fees and rebates are calculated and billed monthly in accordance with our published fee schedules. Fixed income execution rebates were $7 million, $5 million and $3 million in 2024, 2023 and 2022, respectively. In addition, we earn fixed income transaction fees on the trade execution of agency trades, commissions and net markups and markdowns on riskless principal trades. Fixed income execution fees contain one performance obligation related to each transaction which occurs instantaneously, and the revenue is recorded at a point in time.
•CDS Clearing: CDS clearing revenues are reported net of rebates. There were no rebates in 2024, and rebates were nominal in 2023 and 2022. We provide clearing services to the global CDS market and the timing and nature of our CDS transaction and clearing revenue is similar in nature to the Exchanges Segment transaction and clearing revenues discussed above. The CDS derivatives trading and clearing fees contain two performance obligations: (1) trade execution/clearing novation and (2) risk management of open interest. While we allocate the transaction price between these two performance obligations, since they generally are satisfied almost simultaneously, there is no significant deferral of revenue. CDS clearing revenues also include interest income on certain clearing margin deposits related to our CDS clearing business which are satisfied at a point in time and consists of a single performance obligation.
•Fixed Income Data and Analytics, and Other Data and Network Services: Fixed income data and analytics services revenues are recurring in nature and include evaluated pricing and reference data and analytics including sovereign, corporate and municipal bonds, mortgage and asset-backed securities, as well as leveraged loans. Other data and network services include those related to the ICE Global Network and our consolidated feeds business, as well as desktops and other multi-asset class analytics.
The nature and timing of each contract type for the data services above are similar in nature. Data services revenues are primarily subscription-based, billed monthly, quarterly or annually in advance and recognized ratably over time as our performance obligations of data delivery are met consistently throughout the period. Considering that these contracts primarily consist of single performance obligations with fixed prices, there is no variable consideration and no need to allocate the transaction price. In certain of our data contracts, where third parties are involved, we either arrange for the third party to transfer the services to our customers, or we transfer third-party data to our customers; in these arrangements we are acting as an agent and revenue is recorded net.
Mortgage Technology Revenues
•Origination Technology: Our origination technology acts as a system of record for the mortgage transaction. These revenues are based on recurring Software as a Service, or SaaS, subscription fees, with an additive transaction-based success-based pricing fee as lenders exceed the number of loans closed that are included with their monthly base subscription. In addition, the ICE Mortgage Technology network provides originators connectivity to the mortgage supply chain and facilitates the secure exchange of information between our customers and third-party service providers, lenders and investors. Revenue from the ICE Mortgage Technology network is largely transaction-based.
Performance obligations consist of a series of distinct services and support services. Mortgage subscription customers simultaneously receive and consume benefits from our performance and revenues are recognized over time using a time elapsed measure of progress as our performance obligations are met consistently throughout the period. Contracts generally range from one year to five years. Success-based contracts are subject to monthly billing calculations whereby customers are obligated to pay the greater of a contractual base fee or variable closed loan fee based on the number of closed loan transactions processed by the customer in the specific month. Under success-based contracts, monthly base fees are recognized ratably over the contract terms as subscription performance obligations are satisfied and closed loan fees in excess of base fees are considered variable consideration.
For the majority of contracts that include variable consideration, such fees meet the variable consideration allocation exception and are recognized in the month in which they are earned because the terms of the variable payments relate specifically to the outcome from transferring the distinct time increment (one month) of service
and because such amounts reflect the fees to which we expect to be entitled for providing access to the Encompass platform for that period. For certain contracts where the variable consideration allocation exception would not be met, total variable consideration to be received is estimated at contract inception and recognized ratably over the contract term. The amount of variable consideration included in the transaction price is constrained to ensure that it is probable that a significant reversal in the amount of cumulative revenue recognized will not occur when the amount of variable consideration is subsequently resolved. When agreements involve multiple distinct performance obligations, we allocate arrangement consideration to all performance obligations at the inception of an arrangement based on the relative standalone selling prices of each performance obligation.
•Closing Solutions: Our closing solutions connect key participants to digitize the closing and recording process. For these services, we act as agent and revenues are recorded net. Revenues for these services primarily contain one performance obligation related to each transaction which occurs instantaneously, and the revenues are primarily recorded at the point in time of the transaction. Closing solutions also includes revenues from our MERSCORP Holdings, Inc., or MERS, database, which provides a system of record for recording and tracking changes and servicing rights and beneficial ownership interests in loans secured by U.S. residential real estate. MERS database revenues contain multiple performance obligations related to each new loan registration and future transfers, and the revenues are primarily recorded at the point in time of each transaction. Closing solutions revenues may include a fixed-fee subscription component recognized ratably over the contract term, as this method best depicts our pattern of performance.
•Servicing software: Our servicing software revenues include Black Knight’s integrated mortgage servicing solutions, which help automate all areas of the servicing process. Our servicing software includes business intelligence, mortgage default and servicing technology, digital mortgage solutions and related professional services. These revenues are primarily comprised of recurring SaaS offerings for various platforms. Contracts for software and hosting solutions typically span five to seven years.
For our SaaS offerings, we promise our clients to stand ready to provide continuous access to our processing platforms. For this reason, processing services are generally viewed as a stand-ready performance obligation comprised of a series of distinct daily services. We typically satisfy these performance obligations over time as the services are provided. A time-elapsed output method is used to measure progress because our efforts are expended evenly throughout the period. We evaluate our variable payment terms related to these revenues, and they generally meet the criteria for allocating variable consideration entirely to one or more, but not all, performance obligations in a contract. Accordingly, when the criteria are met, variable amounts based on the number and type of services performed during a period are allocated to and recognized on the day in which we perform the related services. Fixed fees for processing services are generally recognized ratably over the contract period.
•Data and Analytics: Revenues include those related to ICE Mortgage Technology’s Analyzer and Black Knight's suite of data and analytics products and services. ICE Mortgage Technology's Analyzer streamlines data collection and validation through our automated document recognition and data extraction capabilities. Analyzer revenues can be both recurring and transaction-based in nature. In addition, our data offerings include near real-time industry and peer benchmarking tools and de-identified mortgage origination data offering for lenders to access industry data and origination information. Revenues related to our data products are largely subscription-based and recurring in nature and recognized ratably over time as our performance obligations are met consistently throughout the period.
Black Knight's data and analytics revenues are primarily from licenses for new and historical property ownership data and valuation-related analytical services and are generally distinct. License fees are recognized at a point in time upon delivery. Revenues allocated to data updates are recognized ratably over the period the updates are provided.
The following table depicts the disaggregation of our revenue according to business line and segment (in millions). Amounts here have been aggregated as they follow consistent revenue recognition patterns, and are consistent with the segment information in Note 19:
| | | | | | | | | | | | | | | | | | | | | | | |
| | Exchanges Segment | | Fixed Income and Data Services Segment | | Mortgage Technology Segment | | Total Consolidated |
| Year ended December 31, 2024 | | | | | | | |
Total revenues(1) | $ | 7,441 | | | $ | 2,298 | | | $ | 2,022 | | | $ | 11,761 | |
| Transaction-based expenses | 2,482 | | | — | | | — | | | 2,482 | |
| Total revenues, less transaction-based expenses | $ | 4,959 | | | $ | 2,298 | | | $ | 2,022 | | | $ | 9,279 | |
| | | | | | | |
| Timing of Revenue Recognition | | | | | | | |
| Services transferred at a point in time | $ | 3,030 | | | $ | 427 | | | $ | 451 | | | $ | 3,908 | |
| Services transferred over time | 1,929 | | | 1,871 | | | 1,571 | | | 5,371 | |
| Total revenues, less transaction-based expenses | $ | 4,959 | | | $ | 2,298 | | | $ | 2,022 | | | $ | 9,279 | |
(1) Included in total revenues is revenue related to net interest income earned on cash margin received from clearing members at certain ICE clearing houses. These amounts were $100 million and $137 million recorded in Exchanges and Fixed Income and Data Services segments, respectively.
| | | | | | | | | | | | | | | | | | | | | | | |
| | Exchanges Segment | | Fixed Income and Data Services Segment | | Mortgage Technology Segment | | Total Consolidated |
| Year ended December 31, 2023 | | | | | | | |
Total revenues(1) | $ | 6,355 | | | $ | 2,231 | | | $ | 1,317 | | | $ | 9,903 | |
| Transaction-based expenses | 1,915 | | | — | | | — | | | 1,915 | |
| Total revenues, less transaction-based expenses | $ | 4,440 | | | $ | 2,231 | | | $ | 1,317 | | | $ | 7,988 | |
| | | | | | | |
| Timing of Revenue Recognition | | | | | | | |
| Services transferred at a point in time | $ | 2,576 | | | $ | 453 | | | $ | 341 | | | $ | 3,370 | |
| Services transferred over time | 1,864 | | | 1,778 | | | 976 | | | 4,618 | |
| Total revenues, less transaction-based expenses | $ | 4,440 | | | $ | 2,231 | | | $ | 1,317 | | | $ | 7,988 | |
(1) Included in total revenues is revenue related to net interest income earned on cash margin received from clearing members at certain ICE clearing houses. These amounts were $84 million and $157 million recorded in Exchanges and Fixed Income and Data Services segments, respectively.
| | | | | | | | | | | | | | | | | | | | | | | |
| | Exchanges Segment | | Fixed Income and Data Services Segment | | Mortgage Technology Segment | | Total Consolidated |
| Year ended December 31, 2022 | | | | | | | |
Total revenues(1) | $ | 6,415 | | | $ | 2,092 | | | $ | 1,129 | | | $ | 9,636 | |
| Transaction-based expenses | 2,344 | | | — | | | — | | | 2,344 | |
| Total revenues, less transaction-based expenses | $ | 4,071 | | | $ | 2,092 | | | $ | 1,129 | | | $ | 7,292 | |
| | | | | | | |
| Timing of Revenue Recognition | | | | | | | |
| Services transferred at a point in time | $ | 2,307 | | | $ | 370 | | | $ | 455 | | | $ | 3,132 | |
| Services transferred over time | 1,764 | | | 1,722 | | | 674 | | | 4,160 | |
| Total revenues, less transaction-based expenses | $ | 4,071 | | | $ | 2,092 | | | $ | 1,129 | | | $ | 7,292 | |
(1) Included in total revenues is revenue related to net interest income earned on cash margin received from clearing members at certain ICE clearing houses. These amounts were $149 million and $86 million recorded in Exchanges and Fixed Income and Data Services segments, respectively.
The Exchanges segment and the Fixed Income and Data Services segment revenues above include data services revenues. Our data services revenues are transferred over time, and a majority of those revenues are performed over a short period of time of one month or less and relate to subscription-based data services billed monthly, quarterly or annually in advance. These revenues are recognized ratably over time as our data delivery performance obligations are met consistently throughout the period.
The Exchanges segment revenues transferred over time in the tables above also include services related to listings, risk management of open interest performance obligations and regulatory fees, trading permits, and software licenses.
The Fixed Income and Data Services segment revenues transferred over time in the tables above also include services related to risk management of open interest performance obligations, primarily in our CDS business.
The Mortgage Technology segment revenues transferred over time in the tables above primarily relate to our origination and servicing technology revenue where performance obligations consist of a series of distinct services and are recognized over the contract terms as performance obligations are satisfied and, to a lesser extent, professional services revenues and revenues from certain of our data and analytics offerings.
The components of services transferred over time for each of our segments are as follows:
| | | | | | | | | | | | | | | | | |
| Year ended December 31, |
| | 2024 | | 2023 | | 2022 |
| Exchanges Segment: | | | | | |
| Data services revenues | $ | 947 | | | $ | 933 | | | $ | 877 | |
| Services transferred over time related to risk management of open interest performance obligations | $ | 376 | | | $ | 312 | | | $ | 262 | |
| Services transferred over time related to listings | $ | 489 | | | $ | 497 | | | $ | 515 | |
| Services transferred over time related to regulatory fees, trading permits, and software licenses | $ | 117 | | | $ | 122 | | | $ | 110 | |
| Total | $ | 1,929 | | | $ | 1,864 | | | $ | 1,764 | |
| | | | | |
| Fixed Income Data Services Segment: | | | | | |
| Data services revenues | $ | 1,838 | | | $ | 1,747 | | | $ | 1,686 | |
| Services transferred over time related to risk management of open interest performance obligations in our CDS business | $ | 33 | | | $ | 31 | | | $ | 36 | |
| Total | $ | 1,871 | | | $ | 1,778 | | | $ | 1,722 | |
| | | | | |
| Mortgage Technology Segment: | | | | | |
| Recurring revenues | $ | 1,555 | | | $ | 961 | | | $ | 643 | |
| Other | $ | 16 | | | $ | 15 | | | $ | 31 | |
| Total | $ | 1,571 | | | $ | 976 | | | $ | 674 | |
| | | | | |
| Total consolidated revenues transferred over time | $ | 5,371 | | | $ | 4,618 | | | $ | 4,160 | |
Transaction Price Allocated to Future Performance Obligations
Our disclosure of transaction price allocated to future performance obligations excludes the following:
•Volume-based fees in excess of contractual minimums and other usage-based fees to the extent they are part of a single performance obligation and meet certain variable consideration allocation criteria;
•Performance obligations that are part of a contract with an original expected duration of one year or less; and
•Transactional fees based on a fixed fee per transaction when we have the right to invoice once we have completed the performance obligation.
As of December 31, 2024, the aggregate amount of the transaction price that is allocated to our future performance obligations was approximately $3.5 billion and was primarily related to contracts with customers in the Mortgage Technology segment. We expect this amount to be recognized as revenue as follows: 38% by December 31, 2025, 83% by December 31, 2027, 97% by December 31, 2029 and the rest thereafter.
Contract Assets
A contract asset represents our expectation of receiving consideration in exchange for products or services that we have provided to our customers where invoicing is contingent on our completion of other performance obligations or contractual milestones. Substantially all of our contract assets are related to contracts with customers in our Mortgage Technology segment. As of December 31, 2024 and December 31, 2023, the balance of our contract assets was $87 million and $80 million, respectively.
6. Deferred Revenue
Our contract liabilities, or deferred revenue, represent consideration received that is yet to be recognized as revenue. Total deferred revenue was $333 million as of December 31, 2024, including $236 million in current deferred revenue and $97 million in other non-current liabilities in our consolidated balance sheets. Total deferred revenue was $307 million as of December 31, 2023, including $200 million in current deferred revenue and $107 million in other non-current liabilities in our consolidated balance sheets. See Note 5 for a description of our listings, data services and mortgage technology services revenues and the revenue recognition policy for each of these revenue streams. The changes in our deferred revenue during 2024 and 2023 are as follows (in millions):
| | | | | | | | | | | | | | | | | | | | | | | |
| Listing Revenues | | Data Services and Other Revenues | | Mortgage Technology | | Total |
| Deferred revenue balance at January 1, 2023 | $ | 115 | | | $ | 88 | | | $ | 51 | | | $ | 254 | |
Additions(1) | 490 | | | 401 | | | 177 | | | 1,068 | |
| Amortization | (497) | | | (396) | | | (122) | | | (1,015) | |
| Deferred revenue balance at December 31, 2023 | 108 | | | 93 | | | 106 | | | 307 | |
| Additions | 500 | | | 400 | | | 147 | | | 1,047 | |
| Amortization | (489) | | | (363) | | | (169) | | | (1,021) | |
| Deferred revenue balance at December 31, 2024 | $ | 119 | | | $ | 130 | | | $ | 84 | | | $ | 333 | |
(1) Additions in our Mortgage Technology segment in the table above include $68 million of deferred revenue acquired on the date of the Black Knight acquisition (Note 3) and $37 million of Black Knight related deferred revenue added in the period after the date of acquisition through December 31, 2023.
Included in the amortization recognized in 2024 is $196 million related to the deferred revenue balance as of January 1, 2024. Included in the amortization recognized in 2023 is $167 million related to the deferred revenue balance as of January 1, 2023. As of December 31, 2024, the remaining deferred revenue balance will be recognized over the period of time we satisfy our performance obligations. As of December 31, 2024, we estimate that our deferred revenue will be recognized in the following years (in millions):
| | | | | | | | | | | | | | | | | | | | | | | |
| Listing Revenues | | Data Services and Other Revenues | | Mortgage Technology | | Total |
| 2025 | $ | 41 | | | $ | 122 | | | $ | 74 | | | $ | 237 | |
| 2026 | 36 | | | 5 | | | 5 | | | 46 | |
| 2027 | 25 | | | 2 | | | 2 | | | 29 | |
| 2028 | 12 | | | 1 | | | 2 | | | 15 | |
| 2029 | 4 | | | — | | | 1 | | | 5 | |
| Thereafter | 1 | | | — | | | — | | | 1 | |
| Total | $ | 119 | | | $ | 130 | | | $ | 84 | | | $ | 333 | |
7. Short-Term and Long-Term Restricted Cash, Cash Equivalents and Investments
Our total restricted cash, cash equivalents and investments including short-term and long-term portions, consisted of the following (in millions):
| | | | | | | | | | | |
| As of December 31, |
| 2024 | | 2023 |
| Restricted cash, cash equivalents and investments: | | | |
| Short-term restricted cash, cash equivalents and investments: | | | |
| ICE Futures Europe | $ | 125 | | | $ | 100 | |
| ICE Clear Europe | 755 | | | 730 | |
| CFTC Regulated Entities | 290 | | | 292 | |
| Other Regulated Entities | 56 | | | 79 | |
| Other | 510 | | | 10 | |
Total short-term restricted cash, cash equivalents and investments(1) | 1,736 | | | 1,211 | |
| Long-term restricted cash, cash equivalents and investments: | | | |
| ICE Clearing House Portion of the Guaranty Fund Contribution | 370 | | | 340 | |
Total long-term restricted cash, cash equivalents and investments(2) | 370 | | | 340 | |
| Total restricted cash, cash equivalents and investments | $ | 2,106 | | | $ | 1,551 | |
(1) Included in the total short-term restricted cash, cash equivalents, and investments are certain investments that have maturities of greater than three months at the time of purchase and therefore are included in short-term restricted investments in the consolidated balance sheet. The total short-term restricted investments as of December 31, 2024 and 2023 was $594 million and $680 million, respectively.
(2) Included in the total long-term restricted cash, cash equivalents, and investments are certain investments that have maturities greater than three months at the time of purchase and therefore are included in Other non-current assets in the consolidated balance sheet. The total long-term restricted investments as of December 31, 2024 was $2 million. There were no long-term restricted investments as of December 31, 2023.
Short-Term Restricted Cash, Cash Equivalents and Investments
Our short-term restricted cash and cash equivalents and restricted short-term investments in the table above consist of the following:
•ICE Futures Europe: ICE Futures Europe operates as a U.K. Recognized Investment Exchange, and is required by the U.K. Financial Conduct Authority to maintain financial resources sufficient to properly perform its relevant functions equivalent to a minimum of six months of operating costs, subject to certain deductions.
•ICE Clear Europe: ICE Clear Europe operates as a U.K. Recognized Clearing House. As such, ICE Clear Europe is required by the BOE and the European Market Infrastructure Regulation, or EMIR, to restrict as cash, cash equivalents or investments in an amount to reflect an estimate of the capital required to wind down or restructure the activities of the clearing house, cover operational, legal and business risks and to reserve capital to meet credit, counterparty and market risks not covered by the members' margin and guaranty funds. As such, it is calculated taking into account the operating expenditures, revenues and credit exposures associated with the assets and investments. ICE Clear Europe, in addition to being regulated by the BOE, is also regulated by the CFTC as a U.S. Derivatives Clearing Organization, or DCO, and by the European Securities and Markets Authority, or ESMA, as a third-country central counterparty. The regulatory capital available to ICE Clear Europe, as described above, exceeds the CFTC requirements.
•CFTC Regulated Entities: Our CFTC regulated U.S. Designated Contract Market, or DCM, ICE Futures U.S., our CFTC regulated U.S. DCOs, ICE Clear U.S. and ICE Clear Credit, our CFTC regulated U.S. Swap Data Repository, or SDR, ICE Trade Vault, LLC, and our U.S. Swap Execution Facility, or SEF, ICE Swap Trade, are required to maintain financial resources including cash, in an amount that would cover certain operating costs for a one-year period, subject to certain deductions, to satisfy at least six months of such operating costs at all times. For our U.S. DCOs, ICE Clear U.S. and ICE Clear Credit, these amounts include voluntarily-held additional reserves consistent with the EMIR requirements to cover operational, legal and business risks and to reserve capital to meet credit, counterparty and market risks not covered by the member margin and guaranty funds. ICE Clear Credit is also regulated by the SEC as a clearing agency because it clears security-based swaps. In addition, ICE NGX is registered by the CFTC as a Foreign Board of Trade and a DCO and the CFTC requires ICE
NGX to maintain financial resources including cash, in an amount that would cover certain operating costs for a one-year period. ICE NGX is regulated by both the CFTC and the Alberta Securities Commission.
•Other Regulated Entities: Restricted cash on our various regulated entities and exchanges includes ICE Endex, ICE Benchmark Administration, ICE Clear Netherlands, ICE Futures Abu Dhabi, ICE Trade Vault Europe Limited, ICE Bonds Securities Corporation, among others.
•Other: Other restricted cash, cash equivalents and investments as of December 31, 2024 was primarily related to the new senior notes issued in May 2024 of which $500 million of the net proceeds has been invested and will be used to repay a portion of the aggregate principal amount of the senior notes maturing in May 2025.
Long-Term Restricted Cash, Cash Equivalents and Investments
Our long-term restricted cash, cash equivalents and investments in the table above consist of the following:
•ICE Clearing House Portion of the Guaranty Fund Contribution: Our clearing houses, other than ICE NGX, require each clearing member to make deposits to a fund known as the guaranty fund. We have a $15 million first-loss amount related to ICE NGX insurance and included in our contribution to its guaranty fund. ICE NGX has also set aside $30 million of its own capital that could be used for liquidity purposes in the event of a Contracting Party default. See Note 14 for additional information on the guaranty funds and our contributions of cash to our clearing houses' guaranty funds.
8. Property and Equipment
Property and equipment consisted of the following (in millions):
| | | | | | | | | | | | | | | | | |
| As of December 31, | | Depreciation
Period
(Years) |
| 2024 | | 2023 | |
| Software and internally developed software | $ | 2,061 | | | $ | 1,834 | | | 3 to 7 |
| Computer and network equipment | 1,073 | | | 1,033 | | | 3 to 5 |
| Land | 180 | | | 180 | | | N/A |
| Buildings and building improvements | 436 | | | 389 | | | 15 to 30 |
| Right-of-use lease assets | 295 | | | 305 | | | 1 to 30 |
| Leasehold improvements | 455 | | | 372 | | | 4 to 15 |
| Equipment, aircraft and office furniture | 192 | | | 156 | | | 4 to 12 |
| Total property and equipment | 4,692 | | | 4,269 | | | |
| Less accumulated depreciation and amortization | (2,539) | | | (2,346) | | | |
| Property and equipment, net | $ | 2,153 | | | $ | 1,923 | | | |
In 2024, 2023 and 2022, amortization of software and internally developed software was $324 million, $284 million and $247 million, respectively, and depreciation of all other property and equipment was $201 million, $182 million and $174 million, respectively. As of December 31, 2024 and 2023, unamortized software and internally developed software was $598 million and $535 million, respectively.
9. Goodwill and Other Intangible Assets
The following is a summary of the activity in our goodwill balance by segment (in millions):
| | | | | | | | | | | | | | | | | | | | | | | |
| Exchanges Segment | | Fixed Income and Data Services Segment | | Mortgage Technology Segment | | Total Consolidated |
| Goodwill balance at January 1, 2023 | $ | 8,134 | | | $ | 4,850 | | | $ | 8,127 | | | $ | 21,111 | |
| Acquisitions | — | | | — | | | 9,417 | | | 9,417 | |
| | | | | | | |
| Foreign currency translation | 21 | | | 3 | | | — | | | 24 | |
| Other activity, net | — | | | 1 | | | — | | | 1 | |
| Goodwill balance at December 31, 2023 | $ | 8,155 | | | $ | 4,854 | | | $ | 17,544 | | | $ | 30,553 | |
| Acquisitions | — | | | — | | | 39 | | | 39 | |
| | | | | | | |
| Foreign currency translation | (19) | | | (1) | | | (1) | | | (21) | |
| Other activity, net | — | | | — | | | 24 | | | 24 | |
| Goodwill balance at December 31, 2024 | $ | 8,136 | | | $ | 4,853 | | | $ | 17,606 | | | $ | 30,595 | |
The following is a summary of the activity in our other intangible assets balance (in millions):
| | | | | |
| Other intangible assets balance at January 1, 2023 | $ | 13,090 | |
| Acquisitions | 4,953 | |
| |
| Foreign currency translation | 21 | |
| Amortization of other intangible assets | (749) | |
| Other activity, net | 2 | |
| Other intangible assets balance at December 31, 2023 | $ | 17,317 | |
| Acquisitions | 21 | |
| |
| Foreign currency translation | (20) | |
| Amortization of other intangible assets | (1,012) | |
| |
| Other intangible assets balance at December 31, 2024 | $ | 16,306 | |
We completed our acquisition of Black Knight during 2023 (see Note 3).
Foreign currency translation adjustments result from a portion of our goodwill and other intangible assets primarily being held at our U.K., EU and Canadian subsidiaries, whose functional currencies are not the U.S. dollar. The changes in other activity, net, in the tables above primarily relate to adjustments to the fair value of the net tangible and intangible assets made within one year of acquisitions, with a corresponding adjustment to goodwill.
Other intangible assets and the related accumulated amortization consisted of the following (in millions):
| | | | | | | | | | | | | | | | | | | | | | | | | | | | | | | | | | | |
| As of December 31, 2024 | | As of December 31, 2023 |
| Gross | | Accumulated Amortization | | Net Book Value | | Gross | | Accumulated Amortization | | Net Book Value |
| Finite-lived intangible assets: | | | | | | | | | | | |
| Customer relationships | $ | 10,874 | | | $ | (3,299) | | | $ | 7,575 | | | $ | 10,870 | | | $ | (2,641) | | | $ | 8,229 | |
| Technology | 2,549 | | | (1,191) | | | 1,358 | | | 2,497 | | | (934) | | | 1,563 | |
| Trading products with finite lives | 202 | | | (149) | | | 53 | | | 205 | | | (141) | | | 64 | |
| Data and databases | 746 | | | (230) | | | 516 | | | 745 | | | (170) | | | 575 | |
| Trademarks and trade names | 386 | | | (87) | | | 299 | | | 386 | | | (67) | | | 319 | |
| Other | 51 | | | (43) | | | 8 | | | 51 | | | (42) | | | 9 | |
| Total finite-lived intangible assets | 14,808 | | | (4,999) | | | 9,809 | | | 14,754 | | | (3,995) | | | 10,759 | |
| Indefinite-lived intangible assets: | | | | | | | | | | | |
| Exchange registrations, licenses and contracts with indefinite lives | 6,209 | | | — | | | $ | 6,209 | | | 6,223 | | | — | | | 6,223 | |
| Trademarks and trade names with indefinite lives | 280 | | | — | | | $ | 280 | | | 280 | | | — | | | 280 | |
| In-process research and development | — | | | — | | | $ | — | | | 47 | | | — | | | 47 | |
| Other | 8 | | | — | | | $ | 8 | | | 8 | | | — | | | 8 | |
| Total indefinite-lived intangible assets | 6,497 | | | — | | | 6,497 | | | 6,558 | | | — | | | 6,558 | |
| Total other intangible assets | $ | 21,305 | | | $ | (4,999) | | | $ | 16,306 | | | $ | 21,312 | | | $ | (3,995) | | | $ | 17,317 | |
In 2024, 2023 and 2022, amortization expense of other intangible assets was $1.0 billion, $749 million and $610 million, respectively, and is recorded in depreciation and amortization expense in our consolidated statements of income. Collectively, the remaining weighted average useful lives of the finite-lived intangible assets is 13.5 years as of December 31, 2024. We expect future amortization expense from the finite-lived intangible assets as of December 31, 2024 to be as follows (in millions):
| | | | | |
| 2025 | $ | 991 | |
| 2026 | 943 | |
| 2027 | 897 | |
| 2028 | 800 | |
| 2029 | 766 | |
| Thereafter | 5,412 | |
| $ | 9,809 | |
We performed an analysis of impairment indicators as of December 31, 2024, and other than a $7 million impairment on certain trademark intangible assets within our Mortgage Technology Segment in 2023 and a $3 million impairment of developed technology within our Exchanges Segment in 2024 for assets no longer in use, we did not recognize any impairment losses on goodwill or other intangible assets in 2024, 2023 or 2022. The impairment charges described above are included in depreciation and amortization expense within the consolidated statements of income. We considered potential indicators of impairment to goodwill and other intangible assets for each of our reporting units, which included continued global inflation concerns and changing interest rates, including their effect on our forecasts and discount rates, among other things.
10.Debt
The carrying value of our total debt, including short-term and long-term debt, consisted of the following (in millions):
| | | | | | | | | | | | |
| As of December 31, | |
| 2024 | | 2023 | |
| Debt: | | | | |
| Short-term debt: | | | | |
| Commercial Paper | $ | 529 | | | $ | 1,954 | | |
| 2025 Senior Notes (3.65%; unsecured due May 23, 2025) | 1,249 | | | — | | |
| 2025 Senior Notes (3.75% senior notes due December 1, 2025) | 1,249 | | | — | | |
| Total short-term debt | 3,027 | | | 1,954 | | |
| Long-term debt: | | | | |
| 2025 Term Loan due August 31, 2025 | — | | | 1,600 | | |
| 2025 Senior Notes (3.65% senior notes due May 23, 2025) | — | | | 1,246 | | |
| 2025 Senior Notes (3.75% senior notes due December 1, 2025) | — | | | 1,248 | | |
| 2027 Senior Notes (4.00% senior notes due September 15, 2027) | 1,492 | | | 1,489 | | |
| 2027 Senior Notes (3.10% senior notes due September 15, 2027) | 498 | | | 498 | | |
| 2028 Senior Notes (3.625% senior notes due September 1, 2028) | 937 | | | 920 | | |
| 2028 Senior Notes (3.75% senior notes due September 21, 2028) | 596 | | | 596 | | |
| 2029 Senior Notes (4.35% senior notes due June 15, 2029) | 1,243 | | | 1,241 | | |
| 2030 Senior Notes (2.10% senior notes due June 15, 2030) | 1,240 | | | 1,238 | | |
| 2031 Senior Notes (5.25% senior notes due June 15, 2031) | 743 | | | — | | |
| 2032 Senior Notes (1.85% senior notes due September 15, 2032) | 1,488 | | | 1,486 | | |
| 2033 Senior Notes (4.60% senior notes due March 15, 2033) | 1,490 | | | 1,489 | | |
| 2040 Senior Notes (2.65% senior notes due September 15, 2040) | 1,233 | | | 1,232 | | |
| 2048 Senior Notes (4.25% senior notes due September 21, 2048) | 1,233 | | | 1,232 | | |
| 2050 Senior Notes (3.00% senior notes due June 15, 2050) | 1,223 | | | 1,222 | | |
| 2052 Senior Notes (4.95% senior notes due June 15, 2052) | 1,467 | | | 1,466 | | |
| 2060 Senior Notes (3.00% senior notes due September 15, 2060) | 1,473 | | | 1,472 | | |
| 2062 Senior Notes (5.20% senior notes due June 15, 2062) | 985 | | | 984 | | |
| Total long-term debt | 17,341 | | | 20,659 | | |
| Total debt | $ | 20,368 | | | $ | 22,613 | | |
Credit Facilities
•Credit Facility: We have a $3.9 billion senior unsecured revolving credit facility, or the Credit Facility, with future capacity to increase our borrowings under the Credit Facility by an additional $1.0 billion, subject to the consent of the lenders funding the increase and certain other conditions. On May 31, 2024, we agreed with the lenders to extend the maturity date of the Credit Facility from May 25, 2027, to May 31, 2029, among other items. We incurred new debt issuance costs of $4 million in 2024 relating to the Credit Facility which increased unamortized deferred debt issuance costs carried forward from previous Credit Facility extensions, and these costs are represented in the consolidated balance sheet as other non-current assets and will be amortized over the remaining life of the Credit Facility. No amounts were outstanding under the Credit Facility as of December 31, 2024.
As of December 31, 2024, of the $3.9 billion that was available for borrowing under the Credit Facility, $529 million was required to back-stop the notes outstanding under our U.S. dollar commercial paper program, or the Commercial Paper Program, and $172 million was required to support certain broker-dealer and other subsidiary commitments. Amounts required to back-stop notes outstanding under the Commercial Paper Program will fluctuate as we increase or decrease our commercial paper borrowings. The remaining $3.2 billion is available for working capital and general corporate purposes including, but not limited to, acting as a back-stop to future amounts outstanding under the Commercial Paper Program.
We also pay an annual commitment fee for unutilized amounts under the Credit Facility, payable in arrears at a rate that ranges from 0.08% to 0.20% determined based on our current long-term debt rating. As of December 31, 2024, the applicable rate for commitments to May 2029 was 0.125%. Amounts borrowed under the Credit Facility may be prepaid at any time without premium or penalty.
The Credit Facility also contains customary representations and warranties, covenants and events of default, including a leverage ratio, limitations on liens on our assets, indebtedness of non-obligor subsidiaries, the sale of all or substantially all of our assets, and other matters.
•2022 Term Loan: We previously had a $2.4 billion two-year senior unsecured delayed draw term loan facility, or the Term Loan, that we entered into on May 25, 2022. Draws under the Term Loan bore interest on the principal amount outstanding at either (a) Term Secured Overnight Financing Rate, or Term SOFR, plus an applicable margin of 87.5 basis points plus a credit spread adjustment of 10 basis points or (b) a "base rate" plus an applicable margin. The applicable margin ranged from 0.625% to 1.125% for Term SOFR loans and from 0.000% to 0.125% for base rate loans, in each case, based on a ratings-based pricing grid. The proceeds from borrowings under the Term Loan were used to fund a portion of the purchase price for the Black Knight acquisition. During the second quarter of 2024, we fully repaid our outstanding obligations under the Term Loan and debt issuance costs incurred related to the Term Loan were fully amortized at the time of repayment.
•Other: Our India subsidiaries maintain $14 million of credit lines for their general corporate purposes. As of December 31, 2024, there were no outstanding borrowings.
Commercial Paper Program
Our Commercial Paper Program is currently backed by the borrowing capacity available under the Credit Facility, as described above. The effective interest rate of commercial paper issuances does not materially differ from short-term interest rates, which fluctuate due to market conditions and as a result may impact our interest expense.
In 2024 we had net repayments of $1.4 billion under the Commercial Paper Program. In 2023 we issued $2.6 billion under the Commercial Paper Program to fund a portion of the purchase price for the Black Knight acquisition, partially offset by net repayments of $600 million funded primarily by cash flows from operations.
As of December 31, 2024, commercial paper notes of $529 million with original maturities ranging from 6 to 20 days were outstanding with a weighted average interest rate of 4.6% per annum, and a weighted average remaining maturity of 14 days. As of December 31, 2023, commercial paper notes of $2.0 billion with original maturities ranging from 4 to 45 days were outstanding with a weighted average interest rate of 5.7% per annum, and a weighted average remaining maturity of 32 days.
Senior Notes
As of December 31, 2024, our senior notes of $19.8 billion had a weighted average maturity of 13 years and a weighted average cost of 3.7% per annum.
•Exchange Offers: On June 5, 2024, we completed a private offer to exchange the $1 billion aggregate principal amount of the outstanding 3.625% senior notes due 2028 issued by Black Knight InfoServ, LLC, or the Black Knight Notes, for new senior notes issued by ICE. As a result of the settlement of the private exchange offer, approximately $998 million in aggregate principal amount of outstanding Black Knight Notes were cancelled, and ICE issued approximately $998 million in aggregate principal amount of new senior notes, or the ICE Original Exchange Notes, with the same interest payment, maturity dates and interest rate as the Black Knight Notes.
On September 10, 2024, we completed a registered exchange offer in which virtually all previously outstanding ICE Original Exchange Notes were exchanged for identical new senior notes that were registered under the Securities Act of 1933, or the ICE Registered Exchange Notes, and thereby became freely transferable, subject to certain restrictions applicable to affiliates and broker dealers.
•Senior Notes Issued in May 2024: On May 13, 2024, we issued $750 million in aggregate principal amount of 5.25% senior notes due 2031, or the 2031 Notes. We intend to use $500 million of the net proceeds from the offering of the 2031 Notes to repay a portion of the aggregate principal amount of the senior notes maturing in May 2025, or the 2025 Notes. The net proceeds intended to repay the 2025 Notes have been invested and recorded as short-term restricted investments in our consolidated balance sheet as of December 31, 2024. We used the remaining net proceeds to assist with the repayments of the outstanding borrowings under the Term Loan.
We incurred debt issuance costs of $6 million relating to the issuance of the 2031 Notes and these costs are presented in the accompanying consolidated balance sheet as a deduction from the carrying amount of the related debt liability and will be amortized over the remaining term of the 2031 Notes.
•Senior Notes Issued in May 2022: On May 23, 2022, we issued $8.0 billion in aggregate principal amount of new fixed rate senior notes, comprised of the following:
–$1.25 billion in aggregate principal amount of 3.65% senior notes due in 2025, or the 2025 Notes;
–$1.5 billion in aggregate principal amount of 4.00% senior notes due in 2027, or the 2027 Notes;
–$1.25 billion in aggregate principal amount of 4.35% senior notes due in 2029, or the 2029 Notes;
–$1.5 billion in aggregate principal amount of 4.60% senior notes due in 2033, or the 2033 Notes;
–$1.5 billion in aggregate principal amount of 4.95% senior notes due in 2052, or the 2052 Notes; and
–$1.0 billion in aggregate principal amount of 5.20% senior notes due in 2062, or the 2062 Notes, collectively, the Notes.
We used the net proceeds of $4.9 billion from the offering of the 2025 Notes, the 2027 Notes, the 2029 Notes and the 2062 Notes, together with the issuance of commercial paper and/or borrowings under the Credit Facility, cash on hand and borrowings under the Term Loan to finance the cash portion of the purchase price for Black Knight.
We used the $3.0 billion of net proceeds from the offering of the 2033 Notes and the 2052 Notes to redeem $2.7 billion aggregate principal amount of four series of senior notes that would have matured in 2022 and 2023. The balance of the net proceeds was used for general corporate purposes, which included paying down a portion of the amounts outstanding under our Commercial Paper Program. We recorded $30 million in costs associated with the extinguishment and re-financing of our existing debt in connection with our May 2022 debt refinancing which included a make-whole redemption of $18 million, duplicative interest of $7 million and $5 million of accelerated unamortized deferred debt costs. These costs were included in interest expense in our consolidated statements of income for 2022.
We incurred debt issuance costs of $67 million relating to the issuance of the Notes and these costs are presented in the accompanying consolidated balance sheet as a deduction from the carrying amount of the related debt liability and will be amortized over the remaining term of each series of the Notes.
•Remaining Outstanding Senior Notes: All of our other outstanding Senior Notes were issued at a discount, and we incurred debt issuance costs with each issuance. The amounts in the table above reflect the carrying value of each Senior Note which consists of the aggregate principal amount, less the unamortized debt issuance costs and discounts. The unamortized debt issuance costs and discounts are being accreted through interest expense over the life of the applicable notes. All of the Senior Notes pay interest semi-annually.
All of our Senior Notes contain affirmative and negative covenants, including, but not limited to, certain redemption rights, limitations on liens and indebtedness and limitations on certain mergers, sales, dispositions and lease-back transactions.
Debt Repayment Schedule
As of December 31, 2024, the outstanding debt repayment schedule is as follows (in millions):
| | | | | |
| 2025 | $ | 3,030 | |
| 2026 | — | |
| 2027 | 2,000 | |
| 2028 | 1,600 | |
| 2029 | 1,250 | |
| Thereafter | 12,750 | |
| Principal amounts repayable | 20,630 | |
| Unamortized debt issuance costs and discounts | (262) | |
| Total debt outstanding | $ | 20,368 | |
11.Share-Based Compensation
The non-cash compensation expenses recognized in our consolidated statements of income for stock options, restricted stock units and under our employee stock purchase plan were $231 million, $257 million and $155 million in 2024, 2023 and 2022, respectively, net of $21 million, $18 million and $16 million, respectively, that was capitalized as software development costs. The 2023 expense includes the expense related to the portion of the Black Knight replacement awards that were accelerated on the Divestiture Date, described below. As of December 31, 2024, we had 36.2 million shares in total under various equity plans available for future issuance as stock option and restricted stock awards.
Stock Options
Stock options are granted with an exercise price equal to the fair value of our common stock on the grant date. We may grant, under provisions of the plans, both incentive stock options and nonqualified stock options. The options generally vest over three years and may generally be exercised up to ten years after the date of grant, but generally expire either 14 or 60 days after termination of employment. The shares of common stock issued under our stock option plans are made available from authorized and unissued common stock or treasury shares.
The fair value is based on our closing stock price on the date of grant as well as certain other assumptions. Compensation expense arising from option grants is recognized ratably over the vesting period based on the grant date fair value, net of estimated forfeitures.
The following is a summary of our stock option activity:
| | | | | | | | | | | |
| Number of
Options
(in thousands) | | Weighted
Average
Exercise Price per Option |
| Outstanding at January 1, 2022 | 2,964 | | | $ | 68.77 | |
| Granted | 266 | | | $ | 129.76 | |
| Exercised | (417) | | | $ | 53.30 | |
| Forfeited | (26) | | | $ | 123.77 | |
| Outstanding at December 31, 2022 | 2,787 | | | $ | 76.38 | |
| Granted | 280 | | | $ | 107.66 | |
| Exercised | (508) | | | $ | 58.05 | |
| Forfeited | (20) | | | $ | 114.19 | |
| Outstanding at December 31, 2023 | 2,539 | | | $ | 83.20 | |
| Granted | 212 | | | $ | 135.46 | |
| Exercised | (561) | | | $ | 61.21 | |
| | | |
| Outstanding at December 31, 2024 | 2,190 | | | $ | 93.90 | |
Details of stock options outstanding as of December 31, 2024 are as follows:
| | | | | | | | | | | | | | | | | | | | | | | |
| Number of
Options
(in thousands) | | Weighted
Average
Exercise Price | | Weighted
Average
Remaining
Contractual Life
(Years) | | Aggregate
Intrinsic
Value
(In millions) |
| Vested or expected to vest | 2,190 | | $ | 93.90 | | 5.3 | | $ | 121 |
| Exercisable | 1,715 | | $ | 85.59 | | 4.4 | | $ | 109 |
Details of stock options exercised during 2024, 2023 and 2022 are as follows:
| | | | | | | | | | | | | | | | | |
| Year Ended December 31, |
| Options exercised: | 2024 | | 2023 | | 2022 |
| Total intrinsic value of options exercised (in millions) | $ | 42 | | | $ | 25 | | $ | 28 |
| | | | | | | | | | | | | | | | | |
| As of December 31, |
| Options outstanding: | 2024 | | 2023 | | 2022 |
| Number of options exercisable (in thousands) | 1,715 | | | 2,000 | | | 2,205 | |
| Weighted-average exercise price | $ | 85.59 | | | $ | 74.49 | | | $ | 65.97 | |
As of December 31, 2024, there were $9 million in total unrecognized compensation costs related to stock options, which are expected to be recognized over a weighted average period of 1.4 years as the stock options vest.
We use the Black-Scholes option pricing model to value our stock option awards. During 2024, 2023 and 2022, we used the assumptions in the table below to compute the value:
| | | | | | | | | | | | | | | | | |
| Year Ended December 31, |
| Assumptions: | 2024 | | 2023 | | 2022 |
| Risk-free interest rate | 4.14% | | 3.47% | | 1.72% |
| Expected life in years | 6.0 | | 6.1 | | 6.0 |
| Expected volatility | 24% | | 24% | | 23% |
| Expected dividend yield | 1.33% | | 1.56% | | 1.17% |
| Estimated weighted-average fair value of options granted per share | $37.56 | | $27.39 | | $28.18 |
The risk-free interest rate is based on the zero-coupon U.S. Treasury yield curve in effect at the date of grant. The expected life is derived from historical and anticipated future exercise patterns. Expected volatility is based on historical volatility data of our stock.
Restricted Stock
Restricted stock units are used as an incentive to attract and retain qualified employees and to align our and our stockholders' interests by linking actual performance to both short and long-term stockholder return. We issue awards that may contain a combination of time, performance and/or market conditions. The grant date fair value of each award is based on the closing stock price of our stock at the date of grant and our stock compensation expense is recorded net of estimated forfeitures based on historical forfeiture rates.
Granted but unvested shares are generally forfeited upon termination of employment, whereby compensation costs previously recognized for unvested shares are reversed. Until the shares vest and are issued, participants have no voting or dividend rights and the shares may not be sold, assigned, transferred, pledged or otherwise encumbered. Unvested restricted stock earns dividend equivalents which are paid in cash on the vesting date.
The grant date fair value of time-based restricted stock units is recognized as expense ratably over the vesting period, which is typically three or four years, net of forfeitures. Our equity plans include a change in control provision that may accelerate vesting on both the time-based and performance-based restricted shares if the awards are not assumed by an acquirer in the case of a change in control.
For awards with performance conditions, we recognize compensation costs, net of forfeitures, using an accelerated attribution method over the vesting period. Compensation costs are recognized only if it is probable that the performance condition will be satisfied. If we initially determine that it is not probable of being satisfied and later determine that it is, or vice versa, a cumulative catch-up adjustment is recorded in the period of change based on the new estimate. We recognize the remaining compensation costs over the remaining vesting period.
For awards with a market condition, fair value is estimated based on a simulation of various outcomes and includes inputs such as our stock price at the beginning of the period subject to the market condition, the risk-free interest rate, the time period of the market condition and the expected volatility of ICE's stock and the underlying equity securities of the S&P 500 benchmark index subject to the market condition.
In February 2024, we reserved a maximum of 0.7 million restricted shares for potential issuance as performance-based restricted shares to certain of our employees. The number of shares ultimately granted under this award is based on our actual financial performance as compared to financial performance targets set by our Board and the Compensation Committee for the year ending December 31, 2024. In 2024, we performed at a performance level "above-target". Based on our actual 2024 financial performance as compared to the 2024 financial performance level thresholds, 0.5 million restricted shares will be awarded. This results in $62 million in compensation expenses that will be expensed over the three-year accelerated vesting period, including $33 million expensed during 2024.
In October 2023, we granted performance-based restricted awards to certain of our employees. We reserved shares for potential issuance of these awards with vesting terms over five years.
The following is a summary of nonvested restricted shares under all plans discussed above:
| | | | | | | | | | | |
| Number of
Restricted
Stock Shares
(in thousands) | | Weighted
Average
Grant-Date Fair
Value per Share |
| Nonvested at January 1, 2022 | 3,317 | | $ | 101.72 | |
| Granted | 1,477 | | 126.98 | |
| Vested | (1,541) | | 93.94 | |
| Forfeited | (307) | | 118.23 | |
| Nonvested at December 31, 2022 | 2,946 | | 117.14 | |
| Granted | 3,561 | | 110.96 | |
| Vested | (1,942) | | 112.39 | |
| Forfeited | (269) | | 114.88 | |
| Nonvested at December 31, 2023 | 4,296 | | 114.31 | |
| Granted | 1,761 | | 136.03 | |
| Vested | (1,700) | | 115.50 | |
| Forfeited | (258) | | 120.94 | |
| Nonvested at December 31, 2024 | 4,099 | | 121.10 | |
| | | | | | | | | | | | | | | | | |
| Year Ended December 31, |
| 2024 | | 2023 | | 2022 |
Time-based restricted stock units granted (in thousands)(1) | 1,031 | | 1,191 | | 1,067 |
| Total fair value of restricted stock vested under all restricted stock plans (in millions) | $ | 227 | | | $ | 150 | | | $ | 191 | |
(1) The remaining shares granted are performance-based.
Performance-based restricted shares have been presented in the table above to reflect the actual shares issued based on the achievement of past performance targets, also considering the impact of any market conditions. Non-vested performance-based restricted shares granted are presented in the table above at the target number of restricted shares that would vest if the performance targets are met. Time-based awards reflected in the table above include Black Knight unvested awards that converted to our awards on the date of acquisition, as discussed below. As of December 31, 2024, there were $239 million in total unrecognized compensation costs related to time-based and performance-based restricted stock. These costs are expected to be recognized over a weighted-average period of 1.6 years as the restricted stock vests.
Black Knight Restricted Stock Awards
In connection with our Black Knight acquisition in September 2023, certain restricted stock awards held by Black Knight employees were converted to ICE restricted stock awards and included in the table above. The replacement awards contain the same terms and conditions as were applicable to the awards immediately prior to the merger. These awards will be fully vested by 2026. Our stock compensation expense for December 31, 2024 and 2023 related to these awards was $25 million and $18 million, respectively. In connection with the Divestitures and certain terminations, $55 million of replacement restricted stock awards accelerated for the period between the acquisition date of September 5, 2023, through December 31, 2023, which we recorded as acquisition-related costs (see Note 3).
Employee Stock Purchase Plan
We offer our employees participation in our ESPP, under which we have reserved and may sell up to 25 million shares of our common stock to employees. The ESPP grants participating employees the right to acquire our stock in increments of 1% of eligible pay, with a maximum contribution of 25% of eligible pay, subject to applicable annual Internal Revenue Service, or IRS, limitations. Under our ESPP, participating employees are limited to $25,000 of common stock annually, and a maximum of 1,250 shares of common stock each offering period. There are two offering periods each year, from January 1st (or the first trading day thereafter) through June 30th (or the last trading day prior to such date) and from July 1st (or the first trading day thereafter) through December 31st (or the last trading day prior to such date). The purchase price per share of common stock is 85% of the lesser of the fair market value of the stock on the first or the last trading day of each offering period. We recorded compensation expenses of $14 million, $13 million and $13 million during 2024, 2023 and 2022, respectively, related to the discount given to our participating employees.
12.Equity
Common Stock
We are authorized to issue 1.5 billion shares with a par value of $0.01 per share. Each holder of common stock is entitled to one vote for each share of common stock held of record by such holder on all matters on which stockholders are entitled to vote, including the election and removal of directors. There were 651 million and 574 million shares of common stock issued and outstanding, respectively, as of December 31, 2024. There were 649 million and 573 million shares of common stock issued and outstanding, respectively, as of December 31, 2023.
Preferred Stock
We are authorized to issue 100 million shares of preferred stock with a par value of $0.01 per share. The holders of a series of preferred stock shall be entitled only to such voting rights as shall expressly be granted thereto by the Certificate of Incorporation (including any certificate of designation relating to such series of preferred stock). As of December 31, 2024, no shares of preferred stock have been issued.
Treasury Stock
During each of 2024, 2023 and 2022, we received 1 million shares of common stock from employees to satisfy tax withholdings we made on their behalf for restricted stock and stock option exercises. We recorded the receipt of the shares as treasury stock.
Non-Controlling Interests
For consolidated subsidiaries in which our ownership is less than 100%, and for which we have control over the assets, liabilities and management of the entity, the non-ICE interests are shown as non-controlling interests. As of December 31, 2024, our non-controlling interests included those related to the non-ICE limited partners' interest in our CDS clearing subsidiaries and non-controlling interest in ICE Futures Abu Dhabi.
As of December 31, 2024, we had redeemable non-controlling interests, reflected in temporary equity within our consolidated balance sheet, related to a put right held by non-ICE members to require us to purchase their interests in an entity acquired by us in 2024.
Stock Repurchase Program
We periodically review whether to repurchase our stock. In December 2021, our Board approved an aggregate of $3.15 billion for future repurchases of our common stock with no fixed expiration date that became effective January 1, 2022. The approval of our Board for stock repurchases does not obligate us to acquire any particular amount of our common stock. In addition, our Board may increase or decrease the amount available for repurchases from time to time. In making a determination regarding the timing and extent of any stock repurchases, we consider multiple factors that may include: overall stock market conditions, our common stock price performance, the remaining amount authorized for repurchases by our Board, the potential impact of a stock repurchase program on our debt ratings, our expected free cash flow and working capital needs, our current and future planned strategic growth initiatives, and other potential uses of our cash and capital resources.
Repurchases may be made from time to time on the open market, through established trading plans, in privately-negotiated transactions or otherwise, in accordance with all applicable securities laws, rules and regulations. In December 2021 we entered into a new Rule 10b5-1 trading plan that became effective in February 2022. In connection with our acquisition of Black Knight, on May 4, 2022, we terminated our Rule 10b5-1 trading plan and suspended share repurchases.
We did not have any share repurchases in 2024 or 2023. During 2022 we repurchased 5.0 million shares of our outstanding common stock at a cost of $632 million excluding shares withheld upon vesting of equity awards. The shares repurchased are held in treasury stock.
We may begin or discontinue stock repurchases at any time and may amend or terminate a Rule 10b5-1 trading plan at any time or enter into additional plans. As of December 31, 2024, the remaining balance of Board approved funds for future repurchase was $2.5 billion.
The table below sets forth the information with respect to purchases made by or on behalf of ICE or any “affiliated purchaser” (as defined in Rule 10b-18(a)(3) under the Exchange Act) of our common stock during the periods presented as follows:
| | | | | | | | | | | | | | | | | | | | | | | | | | | | | |
| Shares Repurchased
(in thousands) | | Average Repurchase Price Per Share | | Amount of Repurchases
(in millions) | | Total cumulative year-to-date shares purchased as part of publicly announced plans or programs
(in thousands) | | Approximate dollar
value of shares that
may yet be
purchased under the
plans or programs as of the end of the quarter
(in millions) |
| 2024 | | | | | | | | | |
| Fourth quarter | — | | | $ | — | | | $ | — | | | — | | | $ | 2,518 | |
| Third quarter | — | | | $ | — | | | $ | — | | | — | | | $ | 2,518 | |
| Second quarter | — | | | $ | — | | | $ | — | | | — | | | $ | 2,518 | |
| First quarter | — | | | $ | — | | | $ | — | | | — | | | $ | 2,518 | |
| Total common stock repurchases | — | | | $ | — | | | $ | — | | | | | |
| | | | | | | | | |
| 2023 | | | | | | | | | |
| Fourth quarter | — | | | $ | — | | | $ | — | | | — | | | $ | 2,518 | |
| Third quarter | — | | | $ | — | | | $ | — | | | — | | | $ | 2,518 | |
| Second quarter | — | | | $ | — | | | $ | — | | | — | | | $ | 2,518 | |
| First quarter | — | | | $ | — | | | $ | — | | | — | | | $ | 2,518 | |
| Total common stock repurchases | — | | | $ | — | | | $ | — | | | | | |
| | | | | | | | | |
| 2022 | | | | | | | | | |
| Fourth quarter | — | | | $ | — | | | $ | — | | | 4,955 | | | $ | 2,518 | |
| Third quarter | — | | | $ | — | | | — | | | 4,955 | | | $ | 2,518 | |
| Second quarter | 1,281 | | | $ | 122.54 | | | 157 | | | 4,955 | | | $ | 2,518 | |
| First quarter | 3,674 | | | $ | 129.30 | | | 475 | | | 3,674 | | | $ | 2,675 | |
Total common stock repurchases(1) | 4,955 | | | $ | 127.56 | | | $ | 632 | | | | | |
(1) Includes 0.4 million shares purchased on the open market at a cost of $50 million and 4.6 million shares purchased under our Rule 10b5-1 trading plan at a cost of $582 million.
Dividends
Our Board has adopted a quarterly dividend declaration policy providing that the declaration of any dividends will be approved quarterly by the Board or the Audit Committee, taking into account such factors as our evolving business model, prevailing business conditions, our current and future planned strategic growth initiatives, our financial results and capital requirements, and other considerations which our Board deems relevant, without a predetermined annual net income payout ratio. We declared and paid cash dividends per share during the periods presented as follows:
| | | | | | | | | | | |
| Dividends Per Share | | Amount
(in millions) |
| 2024 | | | |
| Fourth quarter | $ | 0.45 | | | $ | 259 | |
| Third quarter | 0.45 | | | 261 | |
| Second quarter | 0.45 | | | 261 | |
| First quarter | 0.45 | | | 258 | |
| Total cash dividends declared and paid | $ | 1.80 | | | $ | 1,039 | |
| | | |
| 2023 | | | |
| Fourth quarter | $ | 0.42 | | | $ | 242 | |
| Third quarter | 0.42 | | | 241 | |
| Second quarter | 0.42 | | | 236 | |
| First quarter | 0.42 | | | 236 | |
| Total cash dividends declared and paid | $ | 1.68 | | | $ | 955 | |
| | | |
| 2022 | | | |
| Fourth quarter | $ | 0.38 | | | $ | 214 | |
| Third quarter | 0.38 | | | 213 | |
| Second quarter | 0.38 | | | 213 | |
| First quarter | 0.38 | | | 213 | |
| Total cash dividends declared and paid | $ | 1.52 | | | $ | 853 | |
Accumulated Other Comprehensive Income/(Loss)
The following tables present changes in the accumulated balances for each component of other comprehensive income/(loss) (in millions):
| | | | | | | | | | | | | | | | | | | | | | | |
| Changes in Accumulated Other Comprehensive Income/(Loss) by Component |
| Foreign currency translation adjustments | | Comprehensive income from equity method investment | | Employee benefit plans adjustments | | Total |
| Balance, as of January 1, 2022 | $ | (150) | | | $ | 2 | | | $ | (48) | | | $ | (196) | |
| Other comprehensive loss | (130) | | | — | | | (10) | | | (140) | |
| Income tax benefit | 2 | | | — | | | 3 | | | 5 | |
| Net current period other comprehensive loss | (128) | | | — | | | (7) | | | (135) | |
| Balance, as of December 31, 2022 | (278) | | | 2 | | | (55) | | | (331) | |
| Other comprehensive income/(loss) | 49 | | | — | | | (15) | | | 34 | |
| Income tax benefit/(expense) | (1) | | | — | | | 4 | | | 3 | |
| Net current period other comprehensive income/(loss) | 48 | | | — | | | (11) | | | 37 | |
| Balance, as of December 31, 2023 | (230) | | | 2 | | | (66) | | | (294) | |
| Other comprehensive income/(loss) | (55) | | | 9 | | | 5 | | | (41) | |
| Income tax expense | — | | | (2) | | | (1) | | | (3) | |
| Net current period other comprehensive income/(loss) | (55) | | | 7 | | | 4 | | | (44) | |
| Balance, as of December 31, 2024 | $ | (285) | | | $ | 9 | | | $ | (62) | | | $ | (338) | |
13.Income Taxes
Income before income taxes and the income tax provision consisted of the following (in millions):
| | | | | | | | | | | | | | | | | |
| Year Ended December 31, |
| 2024 | | 2023 | | 2022 |
| Income before income taxes | | | | | |
| Domestic | $ | 1,291 | | | $ | 1,016 | | | $ | 184 | |
| Foreign | 2,337 | | | 1,878 | | | 1,624 | |
| Total | $ | 3,628 | | | $ | 2,894 | | | $ | 1,808 | |
| | | | | |
| Income tax provision | | | | | |
| Current tax expense: | | | | | |
| Federal | $ | 212 | | | $ | 287 | | | $ | 366 | |
| State | 158 | | | 27 | | | 206 | |
| Foreign | 598 | | | 471 | | | 331 | |
| Total | $ | 968 | | | $ | 785 | | | $ | 903 | |
| Deferred tax benefit: | | | | | |
| Federal | $ | (47) | | | $ | (124) | | | $ | (413) | |
| State | (86) | | | (197) | | | (165) | |
| Foreign | (9) | | | (8) | | | (15) | |
| Total | $ | (142) | | | $ | (329) | | | $ | (593) | |
| Total income tax expense | $ | 826 | | | $ | 456 | | | $ | 310 | |
A reconciliation of the statutory U.S. federal income tax rate to our effective income tax rate is as follows:
| | | | | | | | | | | | | | | | | |
| Year Ended December 31, |
| 2024 | | 2023 | | 2022 |
| Statutory federal income tax rate | 21 | % | | 21 | % | | 21 | % |
| State and local income taxes, net of federal benefit | 3 | | | 2 | | | 5 | |
| Foreign tax rate differential | 3 | | | 2 | | | (1) | |
| Current year tax benefit from foreign derived intangible income | (2) | | | (2) | | | (3) | |
| Unrecognized tax benefits | — | | | (1) | | | 1 | |
| State apportionment changes | (1) | | | (6) | | | — | |
| State deferred benefit of Bakkt impairment | — | | | — | | | (5) | |
| Federal research tax credits | (1) | | | (1) | | | (1) | |
| Other | — | | | 1 | | | — | |
| Total provision for income taxes | 23 | % | | 16 | % | | 17 | % |
The 23% effective tax rate in 2024 was above the statutory federal income tax rate primarily due to state and local income taxes, including the impacts of recording valuation allowances on certain state deferred tax assets, partially offset by favorable state apportionment changes and statutes of limitations expirations.
The 16% effective tax rate in 2023 was below the statutory federal income tax rate primarily due to favorable audit settlements for historical years, favorable state apportionment changes and the application of the high-tax exception to Global Intangible Low-Taxed Income. These tax benefits were partially offset by the impact of the U.K. corporate income tax increase from 19% to 25% effective April 1, 2023 and the tax impact of certain non-deductible Black Knight acquisition costs.
The 17% effective tax rate in 2022 was below the statutory federal income tax rate primarily due to the deferred income tax benefit from the impairment of equity investment in Bakkt in 2022.
The Organisation for Economic Cooperation and Development, or OECD, Global Anti-Base Erosion Pillar Two minimum tax rules, or Pillar Two, which generally provide for a minimum effective tax rate of 15%, are intended to apply to tax years beginning in 2024. The European Union member states and many other countries, including the U.K., our most significant non-U.S. jurisdiction, have committed to implement or have already enacted legislation adopting the Pillar Two rules. In July 2023, the U.K. enacted the U.K. Finance Act 2023, effective as of January 1, 2024, which included provisions to implement certain portions of the OECD Global Anti-Base Erosion Pillar Two minimum tax rules and included an election to apply a transitional safe harbor to extend certain effective dates to accounting periods commencing on or before
December 31, 2026 and ending on or before June 30, 2028. These Pillar Two rules, including those in the U.K., did not have a material impact on our income tax provision as of December 31, 2024 or 2023.
Deferred Tax Assets and Liabilities
Deferred income taxes reflect the net tax effects of temporary differences between the carrying amounts of assets and liabilities for financial reporting purposes and the amounts used for income tax purposes. Certain unrecognized tax benefits associated with our acquisition of Ellie Mae are presented as a reduction to related deferred tax assets in our consolidated balance sheets. The following table summarizes the significant components of our deferred tax assets and liabilities as of December 31, 2024 and 2023 (in millions):
| | | | | | | | | | | |
| As of December 31, |
| 2024 | | 2023 |
| Deferred tax assets: | | | |
| Deferred and stock-based compensation | $ | 93 | | | $ | 98 | |
| Liability reserve | 74 | | | 60 | |
| Tax credits | 10 | | | 10 | |
| Loss carryforward | 207 | | | 275 | |
| Deferred revenue | 23 | | | 25 | |
| Lease liability | 66 | | | 64 | |
| Property and equipment | 178 | | | 118 | |
| Other | 6 | | | 81 | |
| Total | 657 | | | 731 | |
| Valuation allowance | (200) | | | (166) | |
| Total deferred tax assets, net of valuation allowance | $ | 457 | | | $ | 565 | |
| Deferred tax liabilities: | | | |
| | | |
| Acquired intangibles | (4,239) | | | (4,507) | |
| Right of use asset | (46) | | | (48) | |
| Equity investment | (76) | | | (90) | |
| Total deferred tax liabilities | $ | (4,361) | | | $ | (4,645) | |
| Net deferred tax liabilities | $ | (3,904) | | | $ | (4,080) | |
| Reported as: | | | |
| Net non-current deferred tax liabilities | $ | (3,904) | | | $ | (4,080) | |
A reconciliation of the beginning and ending amount of deferred income tax valuation allowance is as follows (in millions):
| | | | | | | | | | | | | | | | | |
| Year Ended December 31, |
| 2024 | | 2023 | | 2022 |
| Beginning balance of deferred income tax valuation allowance | $ | 166 | | | $ | 92 | | | $ | 99 | |
| Charges against goodwill | (27) | | | 102 | | | — | |
| Increases/(decreases) | 61 | | | (28) | | | (7) | |
| Ending balance of deferred income tax valuation allowance | $ | 200 | | | $ | 166 | | | $ | 92 | |
We recognize valuation allowances on deferred tax assets if, based on the weight of the evidence, we believe that it is more likely than not that some or all of the deferred tax assets will not be realized. We recorded a valuation allowance for deferred tax assets of $200 million and $166 million as of December 31, 2024 and 2023, respectively. The net increase of our valuation allowance in 2024 is primarily due to certain tax attributes that are not more likely than not to be utilized prior to expiration in the future, partially offset by purchase accounting adjustments recorded through goodwill related to the Black Knight acquisition. The increase of valuation allowance charged against goodwill in 2023 is primarily related to certain deferred tax assets arising from the Black Knight acquisition that we believe are not more likely than not to be realized in the foreseeable future. The decrease of valuation allowance in 2023 is primarily due to certain foreign subsidiaries being liquidated in the current period with associated deferred tax assets being extinguished.
The majority of our undistributed earnings of our non-U.S. subsidiaries for the period from January 1, 2018 through December 31, 2022 were subject to the Global Intangible Low-Taxed Income provisions and, as such, were subject to immediate U.S. income taxation and can be distributed to the U.S. with no material additional income tax consequences in the future. Due to the application of the high-tax exception to Global Intangible Low-Taxed Income, the majority of the earnings of our non-U.S. subsidiaries in 2024 and 2023 are not subject to U.S. income taxation. However, the majority of
these 2024 and 2023 foreign earnings can also be distributed to the U.S. with no material additional U.S. income tax consequences due to the availability of full dividends received deductions.
We remain indefinitely reinvested in our non-U.S. subsidiaries’ cumulative undistributed earnings as of December 31, 2024 that are not subject to the Global Intangible Low-Taxed Income provisions and would be subject to additional U.S. income tax consequences upon distribution to the U.S. Accordingly, no provision for U.S. federal and state income taxes has been made in the accompanying consolidated financial statements. Further, a determination of the unrecognized deferred tax liability is not practicable. An estimate of these indefinitely reinvested undistributed earnings as of December 31, 2024, based on post-income tax earnings under U.S. GAAP, is $5.8 billion.
As of December 31, 2024 and 2023, we have gross U.S. federal net operating loss carryforwards of $92 million and $88 million, respectively, and gross state and local net operating loss carryforwards of $251 million and $76 million for 2024 and 2023, respectively. In addition, we had $127 million and $204 million of deferred tax assets related to federal and state capital losses as of December 31, 2024 and 2023, respectively. The net operating loss carryforwards and credit carryforwards are available to offset future taxable income until they begin to expire in 2027. In addition, as of December 31, 2024 and 2023, we have gross foreign net operating loss carryforwards of $219 million and $214 million, respectively. The majority of the remaining gross foreign net operating losses are not expected to be realizable in future periods and have related valuation allowances.
A reconciliation of the beginning and ending amount of unrecognized tax benefits is as follows (in millions):
| | | | | | | | | | | | | | | | | |
| Year Ended December 31, |
| 2024 | | 2023 | | 2022 |
| Beginning balance of unrecognized tax benefits | 268 | | | 247 | | | $ | 229 | |
| Additions related to acquisitions | 9 | | | 25 | | | — | |
| Additions based on tax positions taken in current year | 32 | | | 31 | | | 30 | |
| Additions based on tax positions taken in prior years | 1 | | | 33 | | | — | |
| Reductions based on tax positions taken in prior years | (9) | | | (18) | | | (3) | |
| Reductions resulting from statutes of limitations lapses | (27) | | | (7) | | | (9) | |
| Reductions related to settlements with taxing authorities | — | | | (43) | | | — | |
| Ending balance of unrecognized tax benefits | 274 | | | $ | 268 | | | $ | 247 | |
As of December 31, 2024 and 2023, the balance of unrecognized tax benefits which would, if recognized, affect our effective tax rate was $228 million for both years. It is reasonably possible, as a result of settlements of ongoing audits or statutes of limitations expirations, that unrecognized tax benefits could increase as much as $32 million and decrease as much as $81 million within the next 12 months. Of the $274 million in unrecognized tax benefits as of December 31, 2024, $196 million is recorded within other non-current liabilities and $78 million is recorded within other current liabilities.
We recognize interest and penalties accrued on income tax uncertainties as a component of income tax expense/benefit. In 2024, 2023 and 2022, we recognized an expense of $14 million, a benefit of $30 million and an expense of $12 million, respectively, for interest and penalties. As of December 31, 2024 and 2023, accrued interest and penalties were $47 million and $32 million, respectively. Of the $47 million in accrued interest and penalties as of December 31, 2024, $29 million is recorded within other non-current liabilities and $18 million is recorded within other current liabilities in the accompanying consolidated balance sheet.
We or one of our subsidiaries files income tax returns in the U.S. federal jurisdiction and various state and foreign jurisdictions. The following table summarizes open tax years by major jurisdiction:
| | | | | |
| Jurisdiction | Open Tax Years |
| U.S. Federal | 2021 - 2024 |
| U.S. States | 2013 - 2024 |
| U.K. | 2023 - 2024 |
We have filed amended U.S. federal returns for the years prior to 2021 to claim additional credits and deductions and the associated refund claims are subject to review by the U.S. taxing authorities. Although the outcome of tax audits is always uncertain, we believe that adequate amounts of tax, including interest and penalties, have been provided for any adjustments expected to result from open tax years.
14.Clearing Operations
We operate six clearing houses, each of which acts as a central counterparty that becomes the buyer to every seller and the seller to every buyer for its clearing members or participants, or Members. Through this central counterparty function, the clearing houses provide financial security for each transaction for the duration of the position by limiting counterparty credit risk.
Our clearing houses are responsible for providing clearing services to each of our futures exchanges, and in some cases to third-party execution venues, and are as follows, referred to herein collectively as "the ICE Clearing Houses":
| | | | | | | | | | | | | | | | | | | | |
| Clearing House | | Products Cleared | | Exchange where Executed | | Location |
| ICE Clear Europe | | Energy, agricultural, interest rates and equity index futures and options contracts | | ICE Futures Europe, ICE Futures U.S., ICE Endex and ICE Futures Abu Dhabi | | U.K. |
| ICE Clear U.S. | | Agricultural, metals, foreign exchange, or FX, interest rate and equity index futures and/or options contracts | | ICE Futures U.S. | | U.S. |
| ICE Clear Credit | | OTC North American, European, Asian-Pacific and Emerging Market CDS instruments | | Creditex and third-party venues | | U.S. |
| ICE Clear Netherlands | | Derivatives on equities and equity indices traded on regulated markets | | ICE Endex | | The Netherlands |
| ICE Clear Singapore | | Energy, metals and financial futures products | | ICE Futures Singapore | | Singapore |
| ICE NGX | | Physical North American natural gas, environmental commodities and physical and financial electricity | | ICE NGX | | Canada |
Original and Variation Margin
Each of the ICE Clearing Houses generally requires all Members to deposit collateral in cash or certain pledged assets. The collateral deposits are known as “original margin.” In addition, the ICE Clearing Houses may make intraday original margin calls in circumstances where market conditions require additional protection. The daily profits and losses to and from the ICE Clearing Houses due to the marking-to-market of open contracts is known as “variation margin.” The ICE Clearing Houses mark all outstanding contracts to market, and, with the exception of ICE NGX’s physical natural gas, physical environmental and physical power products discussed separately below, pay and collect variation margin at least once daily.
The amounts that Members are required to maintain are determined by proprietary risk models established by each ICE Clearing House and reviewed by the relevant regulators, independent model validators, risk committees and the boards of directors of the respective ICE Clearing House. The amounts required may fluctuate over time. Each of the ICE Clearing Houses is a separate legal entity and is not subject to the liabilities of the others, or the obligations of Members of the other ICE Clearing Houses.
Should a particular Member fail to deposit its original margin or fail to make a variation margin payment, when and as required, the relevant ICE Clearing House may liquidate or hedge the defaulting Member's open positions and use their original margin and guaranty fund deposits to pay any amount owed. In the event that the defaulting Member's deposits are not sufficient to pay the amount owed in full, the ICE Clearing Houses will first use their respective contributions to the guaranty fund, often referred to as Skin In The Game, or SITG, to pay any remaining amount owed. In the event that the SITG is not sufficient, the ICE Clearing Houses may utilize the respective guaranty fund deposits and default insurance or collect limited additional funds from their respective non-defaulting Members on a pro-rata basis to pay any remaining amount owed.
As of December 31, 2024 and 2023, the ICE Clearing Houses had received or had been pledged $173.1 billion and $175.9 billion, respectively, in cash and non-cash collateral in original margin and guaranty fund deposits to cover price movements of underlying contracts for both periods.
Guaranty Funds and ICE Contribution
As described above, mechanisms have been created, called guaranty funds, to provide partial protection in the event of a Member default. With the exception of ICE NGX, each of the ICE Clearing Houses requires that each Member make deposits into a guaranty fund.
In addition, we have contributed our own capital that could be used if a defaulting Member’s original margin and guaranty fund deposits are insufficient. Such amounts are recorded as long-term restricted cash and cash equivalents in our balance sheets and are as follows (in millions):
| | | | | | | | | | | | | | | | | | | | | | | | | | | | |
| | | ICE Portion of Guaranty Fund Contribution | | Default insurance | |
| | | As of December 31, | | As of December 31, | |
| Clearing House | | | 2024 | | 2023 | | 2024 | | 2023 | |
| ICE Clear Europe | | | $197 | | $197 | | $100 | | $100 | |
| ICE Clear U.S. | | | 75 | | | 75 | | | 25 | | | 25 | | |
| ICE Clear Credit | | | 50 | | | 50 | | | 75 | | | 75 | | |
| ICE Clear Netherlands | | | 2 | | | 2 | | | N/A | | N/A | |
| ICE Clear Singapore | | | 1 | | | 1 | | | N/A | | N/A | |
| ICE NGX | | | 45 | | | 15 | | | 200 | | | 200 | | |
| Total | | | $370 | | $340 | | $400 | | $400 | |
We also maintain default insurance at ICE Clear Europe, ICE Clear U.S. and ICE Clear Credit as an additional layer of clearing member default protection, which is reflected in the table above. The default insurance was renewed in September 2022 and has a three-year term. The default insurance layer resides after and in addition to the ICE Clear Europe, ICE Clear U.S. and ICE Clear Credit SITG contributions and before the guaranty fund contributions of the non-defaulting Members.
Similar to SITG, the default insurance layer is not intended to replace or reduce the position risk-based amount of the guaranty fund. As a result, the default insurance layer is not a factor that is included in the calculation of the Members’ guaranty fund contribution requirement. Instead, it serves as an additional, distinct, and separate default resource that should serve to further protect the non-defaulting Members’ guaranty fund contributions from being mutualized in the event of a default.
As of December 31, 2024, ICE NGX maintained a guaranty fund of $215 million, comprised of $15 million in cash and a $200 million letter of credit backed by a default insurance policy of the same amount, discussed below. Separately, ICE NGX has also set aside $30 million of its own capital that could be used for liquidity purposes if a direct participant of the ICE NGX clearing house, or Contracting Party, defaulted.
Below is a depiction of our Default Waterfall which summarizes the lines of defense and layers of protection we maintain for our mutualized clearing houses.
ICE Clearing House Default Waterfall
Cash and Invested Margin Deposits
We have recorded cash and invested margin and guaranty fund deposits and amounts due in our balance sheets as current assets with corresponding current liabilities to the Members. As of December 31, 2024, our cash and invested margin deposits were as follows (in millions):
| | | | | | | | | | | | | | | | | | | | | | | | | | | | | | | | | | | |
| ICE Clear Europe | | ICE Clear
Credit | | ICE Clear U.S. | | ICE NGX | | Other ICE Clearing Houses | | Total |
| Original margin | $ | 45,427 | | | $ | 23,843 | | | $ | 7,069 | | | $ | — | | | $ | 4 | | | $ | 76,343 | |
| Unsettled variation margin, net | — | | | — | | | — | | | 934 | | | — | | | 934 | |
| Guaranty fund | 2,353 | | | 3,312 | | | 660 | | | — | | | 5 | | | 6,330 | |
| Delivery contracts receivable/payable, net | — | | | — | | | — | | | 705 | | | — | | | 705 | |
| Total | $ | 47,780 | | | $ | 27,155 | | | $ | 7,729 | | | $ | 1,639 | | | $ | 9 | | | $ | 84,312 | |
As of December 31, 2023, our cash and invested margin deposits, were as follows (in millions):
| | | | | | | | | | | | | | | | | | | | | | | | | | | | | | | | | | | |
| ICE Clear Europe | | ICE Clear
Credit | | ICE Clear U.S. | | ICE NGX | | Other ICE Clearing Houses | | Total |
| Original margin | $ | 40,170 | | | $ | 28,353 | | | $ | 4,693 | | | $ | — | | | $ | 5 | | | $ | 73,221 | |
| Unsettled variation margin, net | — | | | — | | | — | | | 984 | | | — | | | 984 | |
| Guaranty fund | 2,358 | | | 3,017 | | | 609 | | | — | | | 5 | | | 5,989 | |
| Delivery contracts receivable/payable, net | — | | | — | | | — | | | 600 | | | — | | | 600 | |
| Total | $ | 42,528 | | | $ | 31,370 | | | $ | 5,302 | | | $ | 1,584 | | | $ | 10 | | | $ | 80,794 | |
Our cash and invested margin and guaranty fund deposits are maintained in accounts with national banks and highly-rated financial institutions or secured through direct investments, primarily in U.S. Treasury and other highly-rated foreign government securities, or reverse repurchase agreements with primarily overnight maturities. Reverse repos are valued daily and are subject to collateral maintenance provisions pursuant to which the counterparty must provide additional collateral if the underlying securities lose value in an amount sufficient to maintain collateralization of at least 102%. We primarily use Level 1 inputs when evaluating the fair value of the non-cash equivalent direct investments, as highly-rated government securities are quoted in active markets. The carrying value of these deposits is deemed to approximate fair value.
To provide a tool to address the liquidity needs of our clearing houses and manage the liquidation of margin and guaranty fund deposits held in the form of cash and high quality sovereign debt, ICE Clear Europe, ICE Clear Credit and ICE Clear U.S. have entered into Committed Repurchase Agreement Facilities, or Committed Repo. Additionally, ICE Clear Credit and ICE Clear Netherlands have entered into Committed FX Facilities to support these liquidity needs. As of December 31, 2024 the following facilities were in place:
•ICE Clear Europe: $1.0 billion in Committed Repo to have the ability to convert securities held as collateral into U.S. dollar, euro and pound sterling deposits with same day liquidity.
•ICE Clear Credit: $300 million in Committed Repo (U.S. dollar based) to have the ability to convert U.S. dollar\euro denominated sovereign debt held as collateral into U.S. dollar\euro deposits with same day liquidity, €250 million in Committed Repo (euro based) to have the ability to convert euro\U.S. dollar denominated sovereign debt deposits held as collateral into euro\U.S. dollar denominated deposits with same day liquidity, and €1.9 billion in Committed FX Facilities to have the ability to convert available U.S. dollar denominated cash into euro denominated cash to meet a euro denominated payment obligation with same day liquidity.
•ICE Clear U.S.: $250 million in Committed Repo to have the ability to convert U.S. dollar denominated sovereign debt deposits held as collateral into U.S. dollar deposits with same day liquidity.
•ICE Clear Netherlands: €10 million in Committed FX Facilities to have the ability to convert available non-euro denominated cash into euro denominated cash to meet euro denominated payment obligations with same day liquidity.
Details of our deposits are as follows (in millions):
| | | | | | | | | | | | | | | | | | | | |
| Cash and Cash Equivalent Margin Deposits and Guaranty Funds |
| | | | As of December 31, |
| Clearing House | | Investment Type | | 2024 | | 2023 |
| ICE Clear Europe | | National bank account(1) | | $ | 4,817 | | | $ | 5,819 | |
| ICE Clear Europe | | Reverse repo | | 37,276 | | | 32,695 | |
| ICE Clear Europe | | Sovereign debt | | 4,515 | | | 3,745 | |
| ICE Clear Europe | | Demand deposits | | 648 | | | 40 | |
| ICE Clear Credit | | National bank account | | 20,369 | | | 22,754 | |
| ICE Clear Credit | | Reverse repo | | 4,089 | | | 5,381 | |
| ICE Clear Credit | | Demand deposits | | 2,697 | | | 3,235 | |
| ICE Clear U.S. | | Reverse repo | | 7,382 | | | 4,955 | |
| ICE Clear U.S. | | Sovereign debt | | 347 | | | 347 | |
| Other ICE Clearing Houses | | Demand deposits | | 9 | | | 9 | |
| Total cash and cash equivalent margin deposits and guaranty funds | | $ | 82,149 | | | $ | 78,980 | |
| | | | | | |
| Invested Deposits, Delivery Contracts Receivable and Unsettled Variation Margin |
| | | | As of December 31, |
| Clearing House | | Investment Type | | 2024 | | 2023 |
| ICE NGX | | Unsettled variation margin and delivery contracts receivable | | $ | 1,639 | | | $ | 1,584 | |
| ICE Clear Europe | | Invested deposits - sovereign debt | | 524 | | | 230 | |
| Total invested deposits, delivery contracts receivable and unsettled variation margin | | $ | 2,163 | | | $ | 1,814 | |
(1) As of December 31, 2024, ICE Clear Europe held £3.8 billion ($4.8 billion based on the pound sterling/U.S. dollar exchange rate of 1.2514 as of December 31, 2024) at the Bank of England, or BOE. As of December 31, 2023, ICE Clear Europe held €11 million ($12 million based on the euro/U.S. dollar exchange rate of 1.1037 as of December 31, 2023) at the European Central Bank, or ECB, £4.6 billion ($5.8 billion based on the pound sterling/U.S. dollar exchange rate of 1.2732 as of December 31, 2023) at the BOE and €10 million ($11 million based on the above exchange rate) at the BOE.
Other Deposits
In addition to the cash and invested deposits above, the ICE Clearing Houses have also received other assets from Members, which include government obligations, and may include other non-cash collateral such as letters of credit at ICE NGX, European emission allowance certificates or gold at ICE Clear Europe, to mitigate credit risk. For certain deposits, we may impose discount or “haircut” rates to ensure adequate collateral if market values fluctuate. These other deposits are not reflected in our consolidated balance sheets as the risks and rewards of these assets remain with the Members unless the clearing houses have sold or re-pledged the assets or in the event of a clearing member default, where the Member is no longer entitled to redeem the assets. Any income, gain or loss accrues to the Members. The ICE Clearing Houses do not, in the ordinary course, rehypothecate or re-pledge these assets. These pledged assets are not reflected in our balance sheets, and are as follows (in millions):
| | | | | | | | | | | | | | | | | | | | | | | | | | | | | | | |
| As of December 31, 2024 |
| ICE Clear
Europe | | ICE Clear
Credit | | ICE Clear U.S. | | ICE NGX | | | | Total |
| Original margin: | | | | | | | | | | | |
| Government securities at face value | $ | 33,884 | | | $ | 31,590 | | | $ | 15,186 | | | $ | — | | | | | $ | 80,660 | |
| Letters of credit | — | | | — | | | — | | | 4,391 | | | | | 4,391 | |
| Emissions certificates at fair value | 585 | | | — | | | — | | | — | | | | | 585 | |
| ICE NGX cash deposits | — | | | — | | | — | | | 723 | | | | | 723 | |
| Total | $ | 34,469 | | | $ | 31,590 | | | $ | 15,186 | | | $ | 5,114 | | | | | $ | 86,359 | |
| Guaranty fund: | | | | | | | | | | | |
| Government securities at face value | $ | 747 | | | $ | 1,389 | | | $ | 281 | | | $ | — | | | | | $ | 2,417 | |
| | | | | | | | | | | | | | | | | | | | | | | | | | | | | | | |
| | As of December 31, 2023 |
| ICE Clear
Europe | | ICE Clear
Credit | | ICE Clear U.S. | | ICE NGX | | | | Total |
| Original margin: | | | | | | | | | | | |
| Government securities at face value | $ | 45,698 | | | $ | 26,992 | | | $ | 13,062 | | | $ | — | | | | | $ | 85,752 | |
| Letters of credit | — | | | — | | | — | | | 5,006 | | | | | 5,006 | |
| Emissions certificates at fair value | 904 | | | — | | | — | | | — | | | | | 904 | |
| ICE NGX cash deposits | — | | | — | | | — | | | 1,219 | | | | | 1,219 | |
| Total | $ | 46,602 | | | $ | 26,992 | | | $ | 13,062 | | | $ | 6,225 | | | | | $ | 92,881 | |
| Guaranty fund: | | | | | | | | | | | |
| Government securities at face value | $ | 765 | | | $ | 1,119 | | | $ | 345 | | | $ | — | | | | | $ | 2,229 | |
ICE NGX
ICE NGX owns a clearing house which administers the physical delivery of energy and environmental trading contracts. ICE NGX is the central counterparty to Members on opposite sides of its physically-settled contracts, and the balance related to delivered but unpaid contracts is recorded as a delivery contract net receivable, with an offsetting delivery contract net payable in our balance sheets. Unsettled variation margin equal to the fair value of open contracts is recorded as of each balance sheet date. There is no impact on our consolidated statements of income as an equal amount is recognized as both an asset and a liability. ICE NGX marks all of its outstanding physical natural gas, physical environmental and physical power contracts to market daily and requires full collateralization of net accrued variation losses. Due to the highly liquid nature and the short period of time to maturity, the fair values of our delivery contract net payable and net receivable are determined to approximate carrying value.
ICE NGX requires Members to maintain cash or letters of credit to serve as collateral in the event of default. The cash is maintained in a segregated bank account for the benefit of the Member, and remains the property of the Member and, therefore, it is not included in our consolidated balance sheets. ICE NGX maintains a committed daylight-overnight liquidity facility in the amount of $100 million with an additional $200 million uncommitted with a third-party Canadian chartered bank which provides liquidity in the event of a settlement shortfall, subject to certain conditions.
As of December 31, 2024, ICE NGX maintains a guaranty fund of $215 million funded by a $200 million letter of credit issued by a major Canadian chartered bank and backed by default insurance underwritten by Export Development Canada, or EDC, a Crown corporation operated at arm’s length from the Canadian government, plus $15 million held as restricted cash to fund the first loss amount that ICE NGX is responsible for under the default insurance policy. In the event of a participant default where the Member’s collateral is depleted, the shortfall would be covered by a draw down on the letter of credit following which ICE NGX would file a claim under the default insurance to recover additional losses up
to $200 million beyond the $15 million first-loss amount that ICE NGX is responsible for under the default insurance policy. ICE NGX has also set aside $30 million of its own capital that could be used for liquidity purposes in the event of a Contracting Party default.
Clearing House Exposure
Each ICE Clearing House bears financial counterparty credit risk and provides a central counterparty guarantee, or performance guarantee, to its Members. In its guarantor role, each ICE Clearing House has equal and offsetting claims to and from Members on opposite sides of each contract, standing as an intermediary on every contract cleared. To reduce their exposure, the ICE Clearing Houses have a risk management program with both initial and ongoing membership standards. The ICE Clearing Houses mark all outstanding contracts to market and, with the exception of ICE NGX, pay and collect variation margin at least once daily.
Excluding the effects of original and variation margin, guaranty fund and collateral requirements and default insurance, the ICE Clearing Houses’ maximum estimated exposure for this guarantee would be the intra-day or full day change in fair value if all Members who have open positions with unrealized losses simultaneously defaulted, which is an extremely unlikely scenario. The levels of original margin are calibrated such that a portfolio the ICE Clearing House may be required to liquidate post Member default can be closed or auctioned without recourse to resources other than those deposited by the defaulting Member, assuming an appropriate risk confidence level and liquidation period. In addition to the base margin model, each ICE Clearing House, depending on its products, employs a number of margin add-ons related to position concentration, clearing member capital, volatility, spread responses, recovery rate sensitivity, jump-to-default, and wrong-way risk.
We also performed calculations to determine the fair value of our counterparty performance guarantee taking into consideration factors such as daily settlement of contracts, margining and collateral requirements, other elements of our risk management program, historical evidence of default payments, and estimated probability of potential default payouts by the ICE Clearing Houses. Based on these analyses, the estimated counterparty performance guarantee liability was determined to be nominal, and no liability was recorded as of December 31, 2024 or 2023. The ICE Clearing Houses have never experienced an incident of a clearing member default which has required the use of the guaranty funds of non-defaulting clearing members or the assets of the ICE Clearing Houses.
15. Leases
We have lease agreements for office space and data center facilities. All of our leases are classified as operating leases, and we do not have any significant leases classified as finance leases.
As of December 31, 2024, the weighted-average remaining lease term was 9.4 years and the weighted average discount rate was 5.9%. As of December 31, 2023, the weighted-average remaining lease term was 6.7 years and the weighted average discount rate was 5.1%.
We recognized $62 million, $58 million and $52 million of rent expense for office space as rent and occupancy expense in 2024, 2023, and 2022, respectively, and $27 million, $32 million and $26 million for data center facilities as technology and communication expense in 2024, 2023, and 2022, respectively, within our consolidated income statements. We do not have any significant variable lease costs.
Our lease assets are included within property, plant and equipment and our lease liabilities are included in current and noncurrent liabilities within our consolidated balance sheets. Details of our lease asset and liability balances are as follows (in millions):
| | | | | | | | | | | | | | | | | |
| As of December 31, 2024 | | As of December 31, 2023 | | As of January 1, 2023 |
| Right-of-use lease assets | $ | 295 | | | $ | 305 | | | $ | 278 | |
| | | | | |
Current operating lease liability | 37 | | | 60 | | | 65 | |
| Non-current operating lease liability | 335 | | | 299 | | | 254 | |
| Total operating lease liability | $ | 372 | | | $ | 359 | | | $ | 319 | |
As of December 31, 2024, we estimate that our operating lease liability will be recognized in the following years (in millions):
| | | | | |
| 2025 | $ | 56 | |
| 2026 | 62 | |
| 2027 | 70 | |
| 2028 | 45 | |
| 2029 | 29 | |
| Thereafter | 247 | |
| Lease liability amounts repayable | $ | 509 | |
| Interest costs | (137) | |
| Total operating lease liability | $ | 372 | |
Supplemental cash flow information and non-cash activity related to our operating leases are as follows:
| | | | | | | | | | | | | |
| Year Ended December 31, | | |
| 2024 | | 2023 | | |
| Cash paid for amounts included in the measurement of operating lease liability | $ | 90 | | | $ | 85 | | | |
| Right-of-use assets obtained in exchange for operating lease obligations | $ | 88 | | | $ | 115 | | | |
16. Commitments and Contingencies
Legal Proceedings
In the ordinary course of our business, from time to time we are subject to legal proceedings, lawsuits, government investigations and other claims with respect to a variety of matters. In addition, we are subject to periodic reviews, inspections, examinations and investigations by regulators in the U.S. and other jurisdictions, any of which may result in claims, legal proceedings, assessments, fines, penalties, restrictions on our business or other sanctions. We record estimated expenses and reserves for legal or regulatory matters or other claims when these matters present loss contingencies that are probable and the related amount is reasonably estimable, and gain contingencies when they become certain. Any such accruals may be adjusted as circumstances change. Assessments of losses are inherently subjective and involve unpredictable factors. While the outcome of legal and regulatory matters is inherently difficult to predict and/or the range of loss often cannot be reasonably estimable, we do not believe that the liabilities, if any, which may ultimately result from the resolution of the various legal and regulatory matters that arise in the ordinary course of our business, including the matter described below, are likely to have a material adverse effect on our consolidated financial condition, results of operations, or liquidity. It is possible, however, that future results of operations for any particular quarterly or annual period could be materially and adversely affected by any developments relating to these legal and regulatory matters.
PennyMac Arbitration
In 2019, Black Knight Servicing Technologies, LLC, or BKST, an indirect, wholly-owned subsidiary of Black Knight, filed a Complaint and Demand for Jury Trial, or the Black Knight Complaint, against PennyMac Loan Services, LLC, or PennyMac, in Florida state court. The Black Knight Complaint included causes of action for breach of contract and misappropriation of MSP® System trade secrets by PennyMac for it to develop a mortgage servicing system (known as SSE) intended to replace the MSP® System. The Black Knight Complaint sought damages for breach of contract and misappropriation of trade secrets, injunctive relief under the Florida Uniform Trade Secrets Act and a declaratory judgment that BKST owns all intellectual property and software developed by or on behalf of PennyMac as a result of its wrongful use of and access to the MSP® System and related trade secret and confidential information. PennyMac filed a motion to compel arbitration of the action, and the trial court granted the motion in 2020. The trial court’s order compelling arbitration was confirmed on appeal.
Shortly after the filing of the Black Knight Complaint, PennyMac filed an Antitrust Complaint, or the PennyMac Complaint, against Black Knight in the United States District Court for the Central District of California. The PennyMac Complaint included causes of action for alleged monopolization and attempted monopolization under Section 2 of the Sherman Antitrust Act, violation of California’s Cartwright Act, violation of California’s Unfair Competition Law and common law unfair competition under California law. The PennyMac Complaint sought equitable remedies, damages and other monetary relief, including treble and punitive damages. Generally, PennyMac alleged that Black Knight relied on various anticompetitive, unfair and discriminatory practices to maintain and to enhance its dominance in the mortgage servicing platform market and in an attempt to monopolize the platform software applications market. Black Knight moved to
dismiss the PennyMac Complaint or have the action transferred to Florida based upon a forum selection clause in the agreement with BKST. In 2020, the judge granted Black Knight's motion to transfer the case to Florida and denied as moot the motion to dismiss, and PennyMac filed a notice of dismissal of this action without prejudice and indicated that it intended to bring the claims raised in the dismissed PennyMac Complaint as defenses, third-party claims and/or counterclaims in arbitration. Following PennyMac’s submission of this matter in 2020 to the American Arbitration Association, PennyMac filed an amended arbitration demand and Black Knight filed an answering statement. A multi-week arbitration hearing was held on Black Knight’s and PennyMac’s respective claims, and the hearing concluded in June 2023.
On November 29, 2023, the arbitrator issued an Interim Award that, among other things, found that PennyMac, in developing its SSE software, engaged in the unauthorized use of Black Knight’s confidential information; granted Black Knight’s breach of contract claim on this basis; and awarded Black Knight $155 million in damages (reduced to $150 million by a subsequent order dated January 3, 2024 clarifying the period through which damages applied). The Interim Award denied Black Knight’s claim for misappropriation of trade secrets and granted or denied (or denied as moot) various of the parties’ respective other claims. On January 12, 2024, the arbitrator entered a Final Award stating that an additional $7 million was owed to Black Knight for prejudgment interest for a total award of $157 million. On February 14, 2024, PennyMac paid Black Knight $160 million in satisfaction of the final award (inclusive of applicable interest). In the same arbitration, PennyMac also brought claims under the Sherman and Clayton Acts, seeking $65 million in damages, subject to trebling. The arbitrator awarded PennyMac zero dollars in damages on its claims. The arbitrator also found unenforceable a legacy provision in Black Knight contracts preventing clients from servicing loans on multiple systems simultaneously. Black Knight never enforced that provision against any customer and has alerted current customers that this provision will not be enforced.
Tax Audits
We are engaged in ongoing discussions and audits with taxing authorities on various tax matters, the resolutions of which are uncertain. Currently, there are matters that may lead to assessments involving us or one of our subsidiaries, some of which may not be resolved for several years. Based on currently available information, we believe we have adequately provided for any assessments that could result from those proceedings where it is more likely than not that we will be assessed. We continuously review our positions as these matters progress.
17. Pension and Other Benefit Programs
Defined Benefit Pension Plan
We have a pension plan covering employees in certain of our U.S. operations whose benefit accrual has been frozen. Retirement benefits are derived from a formula, which is based on length of service and compensation.
We did not make any contributions to our pension plan during 2024, 2023 or 2022. The plan’s target allocation is 5% equity securities and 95% fixed income securities. The fixed income allocation includes corporate bonds of companies from diversified industries and U.S. government bonds. Our long-term objective is to keep the plan at or near full funding, while minimizing the risk inherent in pension plans. As a result, we don't anticipate that there will be a strong need for contributions in future years, and the pension plan will not be required to pay the Pension Benefit Guaranty Corporation variable rate premiums. We do not expect to make contributions to the pension plan in 2025. We will continue to monitor the plan’s funded status, and we will consider modifying the plan’s investment policy based on the actuarial and funding characteristics of the retirement plan, the demographic profile of plan participants, and our business objectives.
The fair values of our plan assets as of December 31, 2024, by asset category, are as follows (in millions):
| | | | | | | | | | | | | | | | | | | | | | | |
| Fair Value Measurements |
| Asset Category | Quoted Prices in
Active Markets for
Identical Assets
(Level 1) | | Significant
Observable Inputs
(Level 2) | | Significant
Unobservable
Inputs
(Level 3) | | Total |
| Cash | $ | 8 | | | $ | — | | | $ | — | | | $ | 8 | |
| Equity securities: | | | | | | | |
| U.S. large-cap | — | | | 20 | | | — | | | 20 | |
| U.S. small-cap | — | | | 5 | | | — | | | 5 | |
| International | — | | | 10 | | | — | | | 10 | |
| Fixed income securities | 153 | | | 507 | | | 6 | | | 666 | |
| Total | $ | 161 | | | $ | 542 | | | $ | 6 | | | $ | 709 | |
The above table includes a total of $56 million of net unsettled securities purchases as of December 31, 2024. These trades settled in January 2025.
The fair values of our plan assets as of December 31, 2023, by asset category, are as follows (in millions):
| | | | | | | | | | | | | | | | | | | | | | | |
| Fair Value Measurements |
| Asset Category | Quoted Prices in
Active Markets for
Identical Assets
(Level 1) | | Significant
Observable Inputs
(Level 2) | | Significant
Unobservable
Inputs
(Level 3) | | Total |
| Cash | $ | 8 | | | $ | — | | | $ | — | | | $ | 8 | |
| Equity securities: | | | | | | | |
| U.S. large-cap | — | | | 18 | | | — | | | 18 | |
| U.S. small-cap | — | | | 6 | | | — | | | 6 | |
| International | — | | | 11 | | | — | | | 11 | |
| Fixed income securities | 154 | | | 542 | | | 5 | | | 701 | |
| Total | $ | 162 | | | $ | 577 | | | $ | 5 | | | $ | 744 | |
The above table includes a total of $50 million of net unsettled securities purchases as of December 31, 2023. These trades settled in January 2024.
The measurement dates for the pension plan are December 31, 2024 and 2023. The following table provides a summary of the changes in the pension plan’s benefit obligations and the fair value of assets measured using the valuation techniques described in Note 18, as of December 31, 2024 and 2023 and a statement of funded status of the pension plan as of December 31, 2024 and 2023 (in millions):
| | | | | | | | | | | |
| As of December 31, |
| 2024 | | 2023 |
| Change in benefit obligation: | | | |
| Benefit obligation at beginning of year | $ | 644 | | | $ | 647 | |
| Interest cost | 29 | | | 30 | |
| Actuarial (gain)/loss | (28) | | | 14 | |
| Benefits paid | (47) | | | (47) | |
| Benefit obligation at year end | $ | 598 | | | $ | 644 | |
| Change in plan assets: | | | |
| Fair value of plan assets at beginning of year | $ | 694 | | | $ | 687 | |
| Actual return on plan assets | 6 | | | 54 | |
| | | |
| Benefits paid | (47) | | | (47) | |
| Fair value of plan assets at end of year | $ | 653 | | | $ | 694 | |
| Funded status | $ | 55 | | | $ | 50 | |
| Accumulated benefit obligation | $ | 598 | | | $ | 644 | |
| Amounts recognized in the accompanying consolidated balance sheets: | | | |
| Other non-current assets | $ | 55 | | | $ | 50 | |
The following shows the components of the pension plan expense for 2024, 2023 and 2022 (in millions):
| | | | | | | | | | | | | | | | | |
| Year Ended December 31, |
| 2024 | | 2023 | | 2022 |
| Interest cost | $ | 29 | | | $ | 30 | | | $ | 17 | |
| Estimated return on plan assets | (33) | | | (35) | | | (21) | |
| Amortization of loss | — | | | — | | | 2 | |
| Aggregate pension (benefit)/expense | $ | (4) | | | $ | (5) | | | $ | (2) | |
We use a market-related value of plan assets when determining the estimated return on plan assets. Gains/losses on plan assets are amortized over a four-year period and accumulate in other comprehensive income. We recognize deferred gains and losses in future net income based on a “corridor” approach, where the corridor is equal to 10% of the greater of the benefit obligation or the market-related value of plan assets at the beginning of the year.
The following shows the projected payments for the pension plan based on actuarial assumptions (in millions):
| | | | | |
| 2025 | $ | 52 | |
| 2026 | 51 | |
| 2027 | 51 | |
| 2028 | 50 | |
| 2029 | 50 | |
| Next 5 years | 229 | |
Supplemental Executive Retirement Plan
We have a U.S. nonqualified supplemental executive retirement plan, or SERP, which provides supplemental retirement benefits for certain employees. The future benefit accrual of the SERP plan is frozen. To provide for the future payments of these benefits, we have purchased insurance on the lives of certain of the participants through company-owned policies. As of both December 31, 2024 and 2023, the cash surrender value of such policies was $60 million and is included in other non-current assets in the accompanying consolidated balance sheets. We also acquired a SERP through both the ICE NGX and Chicago Stock Exchange acquisitions. The following table provides a summary of the changes in the SERP benefit obligations (in millions):
| | | | | | | | | | | |
| As of December 31, |
| 2024 | | 2023 |
| Change in benefit obligation: | | | |
| Benefit obligation at beginning of year | $ | 23 | | | $ | 26 | |
| Interest cost | 1 | | | 1 | |
| | | |
| Benefits paid | (3) | | | (4) | |
| Benefit obligation at year end | $ | 21 | | | $ | 23 | |
| Funded status | $ | (21) | | | $ | (23) | |
| Amounts recognized in the accompanying consolidated balance sheets: | | | |
| Other current liabilities | $ | (3) | | | $ | (4) | |
| Accrued employee benefits | (18) | | | (19) | |
SERP plan expense in the accompanying consolidated statements of income was $1 million each year in 2024, 2023 and 2022 and primarily consisted of interest cost. The following table shows the projected payments for the SERP plan based on the actuarial assumptions (in millions):
| | | | | |
| Projected SERP Plan Payments | |
| 2025 | $ | 3 | |
| 2026 | 3 | |
| 2027 | 3 | |
| 2028 | 2 | |
| 2029 | 2 | |
| Next 5 years | 8 | |
Pension and SERP Plans Assumptions
The weighted-average assumptions used to develop the actuarial present value of the projected benefit obligation and net periodic pension/SERP costs in 2024, 2023 and 2022 are set forth below:
| | | | | | | | | | | | | | | | | |
| Year Ended December 31, |
| 2024 | | 2023 | | 2022 |
| Weighted-average discount rate for determining benefit obligations (pension/SERP plans) | 5.4% / 5.2% | | 4.7% / 4.6% | | 4.9% / 4.8% |
| Weighted-average discount rate for determining interest costs (pension/SERP plans) | 4.6% / 4.6% | | 4.8% / 4.7% | | 2.1% / 1.6% |
| Expected long-term rate of return on plan assets (pension/SERP plans) | 4.3% / N/A | | 4.4% / N/A | | 2.5% / N/A |
| Rate of compensation increase | N/A | | N/A | | N/A |
The assumed discount rate reflects the market rates for high-quality corporate bonds currently available. The discount rate was determined by considering the average of pension yield curves constructed on a large population of high quality corporate bonds. The resulting discount rates reflect the matching of plan liability cash flows to yield curves. To develop
the expected long-term rate of return on assets assumption, we considered the historical returns and the future expectations for returns for each asset class as well as the target asset allocation of the pension portfolio.
The determination of the interest cost component utilizes a full yield curve approach by applying the specific spot rates along the yield curve used in the determination of the benefit obligation to each year’s discounted cash flow.
Post-retirement Benefit Plans
Our defined benefit plans provide certain health care and life insurance benefits for certain eligible retired NYSE U.S. employees. These post-retirement benefit plans, which may be modified in accordance with their terms, are fully frozen. The net periodic post-retirement benefit costs were $5 million, $3 million and $3 million in 2024, 2023 and 2022, respectively. The defined benefit plans are unfunded, and we currently do not expect to fund the post-retirement benefit plans. The weighted-average discount rate for determining the benefit obligation as of December 31, 2024 and 2023 was 5.3% and 4.7%, respectively. The weighted-average discount rate for determining the interest cost as of December 31, 2024 and 2023 was 4.6% and 4.8%, respectively. The following table provides a summary of the changes in the benefit obligation (in millions):
| | | | | | | | | | | |
| As of December 31, |
| Change in benefit obligation: | 2024 | | 2023 |
| Benefit obligation at beginning of year | $ | 129 | | | $ | 116 | |
| Interest cost | 5 | | | 5 | |
| Actuarial (gain)/loss | (7) | | | 19 | |
| Employee contributions | 2 | | | 2 | |
| Benefits paid | (13) | | | (13) | |
| Benefit obligation at the end of year | $ | 116 | | | $ | 129 | |
| Funded status | $ | (116) | | | $ | (129) | |
| Amounts recognized in the accompanying consolidated balance sheets: | | | |
| Other current liabilities | $ | (9) | | | $ | (9) | |
| Accrued employee benefits | $ | (107) | | | $ | (120) | |
The following table shows the payments projected for our post-retirement benefit plans (net of expected Medicare subsidy receipts of $8 million in aggregate over the next ten fiscal years) based on actuarial assumptions (in millions):
| | | | | |
| Projected Post-Retirement Benefit by Year: | Projected Payment |
| 2025 | $ | 9 | |
| 2026 | 10 | |
| 2027 | 10 | |
| 2028 | 10 | |
| 2029 | 10 | |
| Next 5 years | 48 | |
For measurement purposes, we assumed a 7.7% annual rate of increase in the per capita cost of covered health care benefits in 2024 which will decrease on a graduated basis to 3.9% in the year 2048 and thereafter.
Accumulated Other Comprehensive Loss
The accumulated other comprehensive loss, after tax, as of December 31, 2024, consisted of the following amounts that have not yet been recognized in net periodic benefit cost (in millions):
| | | | | | | | | | | | | | | | | | | | | | | |
| Pension Plans | | SERP Plans | | Post-retirement Benefit Plans | | Total |
| Unrecognized net actuarial losses/(gains), after tax | $ | 77 | | | $ | 3 | | | $ | (18) | | | $ | 62 | |
Other Benefit Plans and Defined Contribution Plans
Our U.S. employees are eligible to participate in 401(k) and profit sharing plans and our non-U.S. employees are eligible to participate in defined contribution pension plans. Total contributions under the 401(k), profit sharing and defined contribution pension plans were $74 million, $69 million and $64 million in 2024, 2023 and 2022, respectively. No discretionary or profit sharing contributions were made during 2024, 2023 or 2022.
18. Fair Value Measurements
Financial assets and liabilities recorded or disclosed at fair value in the accompanying consolidated balance sheets as of December 31, 2024 and 2023 were classified in their entirety based on the lowest level of input that is significant to the asset or liability’s fair value measurement.
Recurring Fair Value Measurements
Our mutual funds are equity and fixed income mutual funds held for the purpose of providing future payments for the supplemental executive savings plan and SERP. These mutual funds are classified as equity investments and measured at fair value using Level 1 inputs with adjustments recorded in net income (see Note 17).
Excluding our equity investments without a readily determinable fair value, all other financial instruments are determined to approximate carrying value due to the short period of time to their maturities. Our equity investment in D&B (Note 4) was measured at fair value on a recurring basis using Level 2 inputs including the directly observable D&B stock price, adjusted for a lack of marketability factor associated with the investment. We sold this investment in 2023 and no longer held it as of December 31, 2024.
As described in Note 3, we measured the Promissory Note obtained in connection with the Optimal Blue sale using Level 3 inputs as of December 31, 2023. The valuation technique used was a discounted cash flow model using key unobservable assumptions included an estimated prepayment rate of 2%, a discount rate of 30.8% and indicative price points from the ongoing Promissory Note sale process. In February 2024, the FTC approved the buyer of the Promissory Note, and we completed the sale of the Promissory Note and received the $75 million of proceeds thereafter. Subsequent to the sale and as of December 31, 2024, we did not use Level 3 inputs to determine the fair value of assets or liabilities measured at fair value on a recurring basis.
See Note 14 for the fair value considerations related to our margin deposits, guaranty funds and delivery contracts receivable.
Non-Recurring Fair Value Measurements
We measure certain assets, such as intangible assets and equity method investments, at fair value on a non-recurring basis. These assets are recognized at fair value if they are deemed to be impaired. During 2024, we recorded a $3 million impairment of a developed technology intangible asset within the Exchanges segment. During 2023, we recorded a $7 million impairment on certain trademark intangible assets within the Mortgage Technology segment. During 2022, we determined that the value of our equity method investment in Bakkt was impaired using a Level 1 input, which was the publicly-traded closing stock price of Bakkt on December 30, 2022, the last trading day of 2022. As of December 31, 2024 and 2023, no other intangible assets or equity method investments were required to be recorded at fair value since no other impairments were recorded.
We measure certain equity investments at fair value on a non-recurring basis using our policy election under ASC 321, Investments - Equity Securities. During 2024, we recorded a net $1 million fair value loss consisting of a $3 million fair value loss from impairment separately offset by a $2 million fair value gain from identifying an observable price change in one of our investments. These were recorded within other income/(expense), net, in the consolidated statement of income. With the exception of the items noted above, no other adjustments were necessary. As of December 31, 2024, the carrying amount of our investments without readily determinable fair values was $104 million.
Financial Instruments Not Measured at Fair Value
The table below displays the fair value of our debt as of December 31, 2024 and December 31, 2023. The fair values of our fixed rate notes were estimated using Level 2 inputs including quoted market prices for these instruments. The fair value of our commercial paper was estimated using Level 2 inputs. The commercial paper includes a discount and fair value was determined to approximate the carrying value due to the short term to maturity.
| | | | | | | | | | | | | | | | | | | | | | | |
| As of December 31, 2024 | | As of December 31, 2023 |
| (in millions) | | (in millions) |
| Carrying Amount | | Fair value | | Carrying Amount | | Fair value |
| Debt: | | | | | | | |
| Commercial Paper | $ | 529 | | | $ | 529 | | | $ | 1,954 | | | $ | 1,954 | |
| 2025 Term Loan due August 31, 2025 | — | | | — | | | 1,600 | | | 1,600 | |
| 3.65% Senior Notes due May 23, 2025 | 1,249 | | | 1,245 | | | 1,246 | | | 1,227 | |
| 3.75% Senior Notes due December 1, 2025 | 1,249 | | | 1,241 | | | 1,248 | | | 1,229 | |
| 4.00% Senior Notes due September 15, 2027 | 1,492 | | | 1,478 | | | 1,489 | | | 1,474 | |
| 3.10% Senior Notes due September 15, 2027 | 498 | | | 481 | | | 498 | | | 477 | |
| 3.625% Senior Notes due September 1, 2028 | 937 | | | 960 | | | 920 | | | 915 | |
| 3.75% Senior Notes due September 21, 2028 | 596 | | | 578 | | | 596 | | | 584 | |
| 4.35% Senior Notes due June 15, 2029 | 1,243 | | | 1,224 | | | 1,241 | | | 1,246 | |
| 2.10% Senior Notes due June 15, 2030 | 1,240 | | | 1,081 | | | 1,238 | | | 1,082 | |
| 5.25% Senior Notes due June 15, 2031 | 743 | | | 758 | | | — | | | — | |
| 1.85% Senior Notes due September 15, 2032 | 1,488 | | | 1,190 | | | 1,486 | | | 1,205 | |
| 4.60% Senior Notes due March 15, 2033 | 1,490 | | | 1,441 | | | 1,489 | | | 1,499 | |
| 2.65% Senior Notes due September 15, 2040 | 1,233 | | | 874 | | | 1,232 | | | 935 | |
| 4.25% Senior Notes due September 21, 2048 | 1,233 | | | 1,011 | | | 1,232 | | | 1,125 | |
| 3.00% Senior Notes due June 15, 2050 | 1,223 | | | 798 | | | 1,222 | | | 898 | |
| 4.95% Senior Notes due June 15, 2052 | 1,467 | | | 1,343 | | | 1,466 | | | 1,503 | |
| 3.00% Senior Notes due September 15, 2060 | 1,473 | | | 877 | | | 1,472 | | | 1,019 | |
| 5.20% Senior Notes due June 15, 2062 | 985 | | | 911 | | | 984 | | | 1,026 | |
| Total debt | $ | 20,368 | | | $ | 18,020 | | | $ | 22,613 | | | $ | 20,998 | |
19. Segment Reporting
Our business is conducted through three reportable business segments, comprised of the following:
•Exchanges: We operate regulated marketplace technology for the listing, trading and clearing of a broad array of derivatives contracts and financial securities as well as data and connectivity services related to our exchanges and clearing houses;
•Fixed Income and Data Services: We provide fixed income pricing, reference data, indices, analytics and execution services, as well as global CDS clearing and multi-asset class data delivery technology; and
•Mortgage Technology: We provide a technology platform that offers customers comprehensive, digital workflow tools that aim to address inefficiencies and mitigate risks that exist in the U.S. residential mortgage market life cycle, from application through closing, servicing and the secondary market.
Our Chief Operating Decision Maker, or CODM, is Jeffrey Sprecher, our Chair and Chief Executive Officer. The CODM uses operating income/(loss) to assess performance and allocate resources for each segment including decisions on product pricing and new products, strategic mergers and acquisitions, marketing costs, capital expenditures, employee headcount and compensation. The CODM evaluates both budgeted and actual operating income/(loss) and the related growth when assessing performance and making decisions about allocating resources as described above. The accounting policies of the reportable segments are the same as those described in Note 2.
The information and amounts presented in the tables below align with the segment-level information regularly provided to the CODM. While revenues are recorded specifically in the segment in which they are earned or to which they relate, a significant portion of our operating expenses are not solely related to a specific segment because the expenses serve functions that are necessary for the operation of more than one segment. We directly allocate expenses when reasonably possible to do so. Otherwise, we use a pro-rata revenue approach as the allocation method for the expenses that do not relate solely to one segment and serve functions that are necessary for the operation of all segments. The significant expense categories are other operating expenses, acquisition-related transaction and integration costs and depreciation and amortization. Other operating expenses include the aggregation of compensation and benefits, professional services, technology and communication, rent and occupancy and selling, general and administrative expenses.
Our chief operating decision maker does not review total assets or statements of income below operating income by segments; therefore, such information is not presented below. Our three segments do not engage in intersegment transactions.
Financial data for our business segments is as follows for 2024, 2023 and 2022 (in millions):
| | | | | | | | | | | | | | | | | | | | | | | |
| Year Ended December 31, 2024 |
| Exchanges | | Fixed Income and Data Services | | Mortgage Technology | | Consolidated |
| Revenues: | | | | | | | |
| Energy futures and options | $ | 1,876 | | | $ | — | | | $ | — | | | $ | 1,876 | |
| Agricultural and metals futures and options | 257 | | | — | | | — | | | 257 | |
| Financial futures and options | 559 | | | — | | | — | | | 559 | |
| Cash equities and equity options | 2,913 | | | — | | | — | | | 2,913 | |
| OTC and other | 400 | | | — | | | — | | | 400 | |
| Data and connectivity services | 947 | | | — | | | — | | | 947 | |
| Listings | 489 | | | — | | | — | | | 489 | |
| Fixed income execution | — | | | 117 | | | — | | | 117 | |
| CDS clearing | — | | | 343 | | | — | | | 343 | |
| Fixed income data and analytics | — | | | 1,177 | | | — | | | 1,177 | |
| Other data and network services | — | | | 661 | | | — | | | 661 | |
| Origination technology | — | | | — | | | 713 | | | 713 | |
| Closing solutions | — | | | — | | | 202 | | | 202 | |
| Servicing software | — | | | — | | | 848 | | | 848 | |
| Data and analytics | — | | | — | | | 259 | | | 259 | |
| Revenues | 7,441 | | | 2,298 | | | 2,022 | | | 11,761 | |
| Transaction-based expenses | 2,482 | | | — | | | — | | | 2,482 | |
| Revenues, less transaction-based expenses | 4,959 | | | 2,298 | | | 2,022 | | | 9,279 | |
| Other operating expenses | 1,063 | | | 1,129 | | | 1,137 | | | 3,329 | |
| Depreciation and amortization | 260 | | | 326 | | | 951 | | | 1,537 | |
| Acquisition-related transaction and integration costs | — | | | — | | | 104 | | | 104 | |
| Operating expenses | 1,323 | | | 1,455 | | | 2,192 | | | 4,970 | |
| Operating income/(loss) | $ | 3,636 | | | $ | 843 | | | $ | (170) | | | $ | 4,309 | |
| Total other income/(expense), net | | | | | | | (681) | |
| Income before income tax expense | | | | | | | $ | 3,628 | |
| | | | | | | | | | | | | | | | | | | | | | | |
| Year Ended December 31, 2023 |
| Exchanges | | Fixed Income and Data Services | | Mortgage Technology | | Consolidated |
| Revenues: | | | | | | | |
| Energy futures and options | $ | 1,498 | | | $ | — | | | $ | — | | | $ | 1,498 | |
| Agricultural and metals futures and options | 271 | | | — | | | — | | | 271 | |
| Financial futures and options | 460 | | | — | | | — | | | 460 | |
| Cash equities and equity options | 2,298 | | | — | | | — | | | 2,298 | |
| OTC and other | 398 | | | — | | | — | | | 398 | |
| Data and connectivity services | 933 | | | — | | | — | | | 933 | |
| Listings | 497 | | | — | | | — | | | 497 | |
| Fixed income execution | — | | | 124 | | | — | | | 124 | |
| CDS clearing | — | | | 360 | | | — | | | 360 | |
| Fixed income data and analytics | — | | | 1,118 | | | — | | | 1,118 | |
| Other data and network services | — | | | 629 | | | — | | | 629 | |
| Origination technology | — | | | — | | | 694 | | | 694 | |
| Closing solutions | — | | | — | | | 179 | | | 179 | |
| Servicing software | — | | | — | | | 288 | | | 288 | |
| Data and analytics | — | | | — | | | 156 | | | 156 | |
| Revenues | 6,355 | | | 2,231 | | | 1,317 | | | 9,903 | |
| Transaction-based expenses | 1,915 | | | — | | | — | | | 1,915 | |
| Revenues, less transaction-based expenses | 4,440 | | | 2,231 | | | 1,317 | | | 7,988 | |
| Other operating expenses | 1,033 | | | 1,079 | | | 698 | | | 2,810 | |
| Depreciation and amortization | 248 | | | 341 | | | 626 | | | 1,215 | |
| Acquisition-related transaction and integration costs | — | | | — | | | 269 | | | 269 | |
| Operating expenses | 1,281 | | | 1,420 | | | 1,593 | | | 4,294 | |
| Operating income/(loss) | $ | 3,159 | | | $ | 811 | | | $ | (276) | | | $ | 3,694 | |
| Total other income/(expense), net | | | | | | | (800) | |
| Income before income tax expense | | | | | | | $ | 2,894 | |
| | | | | | | | | | | | | | | | | | | | | | | |
| Year Ended December 31, 2022 |
| Exchanges | | Fixed Income and Data Services | | Mortgage Technology | | Consolidated |
| Revenues: | | | | | | | |
| Energy futures and options | $ | 1,162 | | | $ | — | | | $ | — | | | $ | 1,162 | |
| Agricultural and metals futures and options | 235 | | | — | | | — | | | 235 | |
| Financial futures and options | 475 | | | — | | | — | | | 475 | |
| Cash equities and equity options | 2,722 | | | — | | | — | | | 2,722 | |
| OTC and other | 429 | | | — | | | — | | | 429 | |
| Data and connectivity services | 877 | | | — | | | — | | | 877 | |
| Listings | 515 | | | — | | | — | | | 515 | |
| Fixed income execution | — | | | 101 | | | — | | | 101 | |
| CDS clearing | — | | | 305 | | | — | | | 305 | |
| Fixed income data and analytics | — | | | 1,098 | | | — | | | 1,098 | |
| Other data and network services | — | | | 588 | | | — | | | 588 | |
| Origination technology | — | | | — | | | 798 | | | 798 | |
| Closing solutions | — | | | — | | | 239 | | | 239 | |
| Servicing software | — | | | — | | | — | | | — | |
| Data and analytics | — | | | — | | | 92 | | | 92 | |
| Revenues | 6,415 | | | 2,092 | | | 1,129 | | | 9,636 | |
| Transaction-based expenses | 2,344 | | | — | | | — | | | 2,344 | |
| Revenues, less transaction-based expenses | 4,071 | | | 2,092 | | | 1,129 | | | 7,292 | |
| Other operating expenses | 968 | | | 1,023 | | | 539 | | | 2,530 | |
| Depreciation and amortization | 240 | | | 349 | | | 442 | | | 1,031 | |
| Acquisition-related transaction and integration costs | 1 | | | 1 | | | 91 | | | 93 | |
| Operating expenses | 1,209 | | | 1,373 | | | 1,072 | | | 3,654 | |
| Operating income | $ | 2,862 | | | $ | 719 | | | $ | 57 | | | $ | 3,638 | |
| Total other income/(expense), net | | | | | | | (1,830) | |
| Income before income tax expense | | | | | | | $ | 1,808 | |
No customer accounted for more than 10% of our consolidated revenues, less transaction-based expenses during 2024, 2023, or 2022.
Geographical Information
The following represents our revenues, less transaction-based expenses, net assets and net property and equipment based on the geographic location (in millions):
| | | | | | | | | | | | | | | | | |
| United States | | Foreign Countries | | Total |
| Revenues, less transaction-based expenses: | | | | | |
| Year ended December 31, 2024 | $ | 6,038 | | | $ | 3,241 | | | $ | 9,279 | |
| Year ended December 31, 2023 | $ | 5,246 | | | $ | 2,742 | | | $ | 7,988 | |
| Year ended December 31, 2022 | $ | 4,867 | | | $ | 2,425 | | | $ | 7,292 | |
| Net assets: | | | | | |
| As of December 31, 2024 | $ | 20,235 | | | $ | 7,485 | | | $ | 27,720 | |
| As of December 31, 2023 | $ | 18,327 | | | $ | 7,459 | | | $ | 25,786 | |
| Property and equipment, net: | | | | | |
| As of December 31, 2024 | $ | 1,865 | | | $ | 288 | | | $ | 2,153 | |
| As of December 31, 2023 | $ | 1,688 | | | $ | 235 | | | $ | 1,923 | |
The foreign countries category above primarily relates to the U.K. and to a lesser extent, EU, India, Israel, Canada and Singapore.
20. Earnings Per Common Share
The following is a reconciliation of the numerators and denominators of the basic and diluted earnings per common share computations in 2024, 2023 and 2022 (in millions, except per share amounts):
| | | | | | | | | | | | | | | | | |
| Year Ended December 31, |
| 2024 | | 2023 | | 2022 |
| Basic: | | | | | |
| Net income attributable to Intercontinental Exchange, Inc. | $ | 2,754 | | | $ | 2,368 | | | $ | 1,446 | |
| Weighted average common shares outstanding | 573 | | | 564 | | | 559 | |
| Basic earnings per common share | $ | 4.80 | | | $ | 4.20 | | | $ | 2.59 | |
| Diluted: | | | | | |
| Weighted average common shares outstanding | 573 | | | 564 | | | 559 | |
| Effect of dilutive securities - stock options and restricted stock | 3 | | | 1 | | | 2 | |
| Diluted weighted average common shares outstanding | 576 | | | 565 | | | 561 | |
| Diluted earnings per common share | $ | 4.78 | | | $ | 4.19 | | | $ | 2.58 | |
Basic earnings per common share is calculated using the weighted average common shares outstanding during the periods. Changes in the weighted average common shares outstanding between years was primarily due to stock repurchases in 2022 and the Black Knight acquisition in 2023.
Common equivalent shares from stock options and restricted stock awards, calculated using the treasury stock method, are included in the diluted per share calculations unless the effect of their inclusion would be antidilutive. During 2024, 2023 and 2022 outstanding stock options of 188,000, 791,000 and 531,000, respectively, were not included in the computation of diluted earnings per common share because to do so would have had an antidilutive effect. As of December 31, 2024 and 2023, there were 5,000 and 4,000, respectively, restricted stock units that were vested but have not been issued that are included in the computation of diluted earnings per share. Certain figures in the table above may not recalculate due to rounding.
21. Subsequent Events
We have evaluated subsequent events and determined that no events or transactions met the definition of a subsequent event for purposes of recognition or disclosure in the accompanying financial statements.
ITEM 9. CHANGES IN AND DISAGREEMENTS WITH ACCOUNTANTS ON ACCOUNTING AND FINANCIAL DISCLOSURE
None.
ITEM 9 (A). CONTROLS AND PROCEDURES
(a) Evaluation of Disclosure Controls and Procedures. As of the end of the period covered by this report, an evaluation was carried out by our management, with the participation of our Chief Executive Officer and Chief Financial Officer, of the effectiveness of our disclosure controls and procedures (as defined in Rule 13a-15(e) under the Securities Exchange Act of 1934). Based upon that evaluation, our Chief Executive Officer and Chief Financial Officer concluded that these disclosure controls and procedures were effective as of the end of the period covered by this report.
(b) Management’s Annual Report on Internal Control over Financial Reporting and the Attestation Report of the Independent Registered Public Accounting Firm. Management is responsible for establishing and maintaining adequate control over financial reporting and has evaluated the effectiveness of the system of internal control using the Committee of Sponsoring Organizations of the Treadway Commission 2013 framework. Management’s report on its assessment of the effectiveness of our internal control over financial reporting as of December 31, 2024 and the attestation report of Ernst & Young LLP on our internal control over financial reporting are set forth in Part II, Item 8 of this Annual Report.
(c) Changes in Internal Controls over Financial Reporting. There were no changes in our internal controls over financial reporting that occurred during our most recent fiscal quarter that have materially affected, or are reasonably likely to materially affect, our internal controls over financial reporting. As a result, no corrective actions were taken.
ITEM 9 (B). OTHER INFORMATION
The following officers and directors adopted plans intended to satisfy the affirmative defense conditions of Rule 10b5-1(c) under the Exchange Act:
(a) On November 20, 2024, Andrew J. Surdykowski, our General Counsel, adopted a trading plan for the sale of shares of ICE common stock, which is intended to satisfy the affirmative defense conditions of Rule 10b5-1(c) under the Exchange Act. The plan expires on the earlier of (i) January 31, 2026 or (ii) upon the completion of the sale of the maximum number of shares under the plan. The aggregate number of shares to be sold under the plan is 11,080 shares plus an undetermined number of shares to be sold resulting from the vesting of performance-based restricted stock units less the amount of shares that will be withheld to satisfy the payment of Mr. Surdykowski's tax withholding obligations.
(b) On November 22, 2024, Douglas A. Foley, our SVP, Human Resources & Administration, adopted a trading plan for the sale of shares of ICE common stock, which is intended to satisfy the affirmative defense conditions of Rule 10b5-1(c) under the Exchange Act. The plan expires on the earlier of (i) December 17, 2025 or (ii) upon the completion of the sale of the maximum number of shares under the plan. The aggregate number of shares to be sold under the plan is 6,400 shares.
(c) On November 29, 2024, A. Warren Gardiner, our Chief Financial Officer, adopted a trading plan for the sale of shares of ICE common stock, which is intended to satisfy the affirmative defense conditions of Rule 10b5-1(c) under the Exchange Act. The plan expires on the earlier of (i) December 31, 2025 or (ii) upon the completion of the sale of the maximum number of shares under the plan. The aggregate number of shares to be sold under the plan is an undetermined number of shares to be sold resulting from the vesting of performance-based restricted stock units less the amount of shares that will be withheld to satisfy the payment of Mr. Gardiner's tax withholding obligations.
(d) On December 4, 2024, Stuart G. Williams, our Chief Operating Officer, adopted a trading plan for the sale of shares of ICE common stock, which is intended to satisfy the affirmative defense conditions of Rule 10b5-1(c) under the Exchange Act. The plan expires on the earlier of (i) December 31, 2025 or (ii) upon the completion of the sale of the maximum number of shares under the plan. The aggregate number of shares to be sold under the plan is an undetermined number of shares to be sold resulting from the vesting of performance-based restricted stock units less the amount of shares that will be withheld to satisfy the payment of Mr. Williams' tax withholding obligations.
(e) On December 5, 2024, James W. Namkung, our Chief Accounting Officer, adopted a trading plan for the sale of shares of ICE common stock, which is intended to satisfy the affirmative defense conditions of Rule 10b5-1(c) under the Exchange Act. The plan expires on the earlier of (i) February 28, 2026 or (ii) upon the completion of the sale of the maximum number of shares under the plan. The aggregate number of shares to be sold under the plan is 3,108 shares
plus an undetermined number of shares to be sold resulting from the vesting of performance-based restricted stock units less the amount of shares that will be withheld to satisfy the payment of Mr. Namkung's tax withholding obligations.
(f) On December 6, 2024, Judith A. Sprieser, one of our directors, adopted a trading plan for the sale of shares of ICE common stock, which is intended to satisfy the affirmative defense conditions of Rule 10b5-1(c) under the Exchange Act. The plan expires on the earlier of (i) December 31, 2025 or (ii) upon the completion of the sale of the maximum number of shares under the plan. The aggregate number of shares to be sold under the plan is 6,654 shares.
Certain of our officers or directors have made elections to participate in, and are participating in, our dividend reinvestment plan and employee stock purchase plan and have made, and may from time to time make, elections to have shares withheld to cover withholding taxes or pay the exercise price of options, which may be designed to satisfy the affirmative defense conditions of Rule 10b5-1 under the Exchange Act or may constitute non-Rule 10b5–1 trading arrangements (as defined in Item 408(c) of Regulation S-K).
ITEM 9 (C). DISCLOSURE REGARDING FOREIGN JURISDICTIONS THAT PREVENT INSPECTIONS
Not applicable.
PART III
ITEM 10. DIRECTORS, EXECUTIVE OFFICERS AND CORPORATE GOVERNANCE
Information relating to our Board of Directors set forth under the caption “Proposal 1 — Election of Directors — Nominees for Election as Directors at the 2025 Annual Meeting” in our Proxy Statement for our 2025 Annual Meeting of Stockholders, or the 2025 Proxy Statement, is incorporated herein by reference. Information relating to our executive officers is, pursuant to General Instruction G(3) of Form 10-K, set forth below under the caption “Executive Officers.” Information regarding compliance by our directors and executive officers and owners of more than ten percent of our Common Stock with the reporting requirements of Section 16(a) of the Exchange Act (Item 405 of Regulation S-K), set forth under the caption “Delinquent Section 16(a) Reports” in the 2025 Proxy Statement is incorporated herein by reference. Information relating to our financial expert serving on our Audit Committee (Item 407(d)(5) of Regulation S-K), our Nominating and Corporate Governance Committee (Item 407(c)(3) of Regulation S-K), and our Audit Committee (Item 407(d)(4) of Regulation S-K) is set forth under the caption “Meetings and Committees of the Board of Directors” in our 2025 Proxy Statement and is incorporated herein by reference.
Executive Officers
| | | | | | | | |
| Name | Age | Title |
| Jeffrey C. Sprecher | 69 | Chair and Chief Executive Officer |
| A. Warren Gardiner | 44 | Chief Financial Officer |
| Christopher S. Edmonds | 55 | President, Fixed Income & Data Services |
| Douglas A. Foley | 53 | SVP, Human Resources & Administration |
| Benjamin R. Jackson | 52 | President |
| Mayur V. Kapani | 56 | Chief Technology Officer |
| Elizabeth K. King | 57 | Global Head of Clearing & Chief Regulatory Officer |
| Lynn C. Martin | 48 | President, NYSE Group and Chair, ICE Fixed Income & Data Services |
| Andrew J. Surdykowski | 54 | General Counsel |
| Stuart G. Williams | 48 | Chief Operating Officer |
Jeffrey C. Sprecher. Mr. Sprecher has been a director and our Chief Executive Officer since our inception and has served as Chair of our Board of Directors since November 2002. As our Chief Executive Officer, he is responsible for our strategic direction and operational and financial performance. Mr. Sprecher acquired CPEX, our predecessor company, in 1997. Prior to acquiring CPEX, Mr. Sprecher held a number of positions, including President, over a fourteen-year period with Western Power Group, Inc., a developer, owner and operator of large central-station power plants. While with Western Power, he was responsible for a number of significant financings. Mr. Sprecher holds a Bachelor of Science degree in Chemical Engineering from the University of Wisconsin and a Master of Business Administration from Pepperdine University.
A. Warren Gardiner. Mr. Gardiner has served as Chief Financial Officer since May 2021. He is responsible for all aspects of ICE’s finance and accounting functions, treasury, tax, audit and controls and investor relations. Additionally, Mr. Gardiner coordinates the Company’s marketing and public relations endeavors. Mr. Gardiner served as VP, Investor Relations from July 2017 to May 2021. Prior to joining ICE, Mr. Gardiner served in various positions at Evercore ISI, including Director, Equity Research from February 2016 through May 2017 and Vice President, Equity Research from April 2013 through February 2016. Prior to that, he was an equity research analyst at Barclays. Mr. Gardiner is a CFA Charterholder and holds a Bachelor of Arts degree in Managerial Economics from Union College.
Christopher S. Edmonds. Mr. Edmonds has served as President, Fixed Income & Data Services since January 2024. He is responsible for managing ICE’s global fixed income and data business, including pricing and analytics, reference data, indices, desktop solutions, consolidated feeds, connectivity services and the ICE Bonds execution venues. In this role, Mr. Edmonds also oversees ICE’s product initiative around sustainable investing. Mr. Edmonds previously served as Chief Development Officer from January 2022 to December 2023, where he oversaw all of ICE’s clearing house operations and the global risk management team and coordinated ICE's marketing and public relations endeavors. He previously served as Global Head of Clearing & Risk and Senior Vice President of Financial Markets from January 2014 to December 2021, and President of ICE Clear Credit, ICE’s credit default swap clearing house, from February 2010 to December 2013. Prior to joining ICE in February 2010, Mr. Edmonds served as CEO of the International Derivatives Exchange Group, a clearing house for interest rate swaps. His professional career began at APB Energy, focusing on advising businesses on strategic planning in technology, sales and marketing. He earned a Bachelor of Arts degree in Political Science from the University of Alabama at Birmingham.
Douglas A. Foley. Mr. Foley has served as Senior Vice President of Human Resources & Administration since November 2013. In addition to other duties, Mr. Foley has overall responsibility for ICE’s global human resource and real estate functions. Prior to joining ICE in 2008, Mr. Foley worked in the Performance & Reward practice at Ernst & Young LLP in Atlanta. He previously worked at Delta Air Lines in their Global Compensation & Reward Department. He began his career as a pension actuary at both Ernst & Young LLP and Arthur Anderson LLP. Mr. Foley holds a Bachelor of Science in Mathematics and a Master of Science in Risk Management & Insurance from Georgia State University.
Benjamin R. Jackson. Mr. Jackson has served as President since November 2017. Mr. Jackson is responsible for ICE's global technology, information security and operations and is responsible for coordinating global futures and OTC trading businesses. Additionally, he leads the integration planning and execution of ICE's acquisitions and joint ventures and serves as the Chair of ICE Mortgage Technology Holdings, Inc. Mr. Jackson previously served as Chief Commercial Officer, and prior to that President and Chief Operating Officer of ICE Futures U.S. Mr. Jackson joined ICE in July 2011 from SunGard, a leading software and technology provider to commodity market participants. At SunGard, he led the company’s energy and commodities business segment as Senior Executive Vice President. Prior to that, Mr. Jackson served as President of SunGard’s Kiodex commodity risk management platform. Mr. Jackson earned a Bachelor of Science degree in economics from John Carroll University with supporting studies at the London School of Economics and Political Science.
Mayur V. Kapani. Mr. Kapani has served as Chief Technology Officer, overseeing all global technology development groups within ICE, since June 2016. In addition, he leads technical diligence for all of ICE’s acquisitions. After joining ICE in 2006, Mr. Kapani served as Senior Vice President, Trading Technology, assuming technology responsibility for all ICE futures and options exchange platforms, ICE Trade Vault, ICE Benchmark Administration and ICE Data Derivatives. Mr. Kapani has been recognized by Institutional Investor in the Trading Technology 40, an industry ranking of the leading technology executives in the financial markets, in 2016, 2017 and 2018. Prior to joining ICE, Mr. Kapani served as Vice President of Options Development at the Philadelphia Stock Exchange, where he focused on the transition of trading from a floor-based model to a high performance electronic platform. Mr. Kapani earned a Bachelor's of Technology degree from the Indian Institute of Technology Kharagpur and completed the Wharton Management Program.
Elizabeth K. King. Ms. King has served as Global Head of Clearing and Chief Regulatory Officer since January 2024 and as Chief Regulatory Officer since October 2018. She is responsible for overseeing all of ICE’s clearing house operations and the global risk management team. As ICE’s Chief Regulatory Officer, Ms. King oversees the Company’s global regulatory and government affairs strategies and initiatives. Ms. King previously served as President, Sustainable Finance. In this role, she led ICE’s product initiative around sustainable investing, including overseeing the NYSE's Board Advisory Council, which addresses the critical need for inclusive leadership by NYSE-listed and prospective listed companies. Prior to 2022, Ms. King was General Counsel and Corporate Secretary of NYSE Group and, prior to joining ICE in March 2014, Deputy General Counsel and Global Head of Regulatory Affairs at securities trading firm KCG Holdings, Inc. Before joining KCG, she was Associate Director, Division of Trading and Markets at the SEC, where she was responsible for the SEC’s regulatory program for oversight of the securities markets. Ms. King holds a J.D. from the University of Pennsylvania, and an A.B. from Duke University.
Lynn C. Martin. Ms. Martin has served as President of NYSE Group, a wholly-owned subsidiary of ICE, since January 2022. NYSE Group includes the New York Stock Exchange, the world’s largest stock market and premier venue for capital raising, as well as four fully electronic equity markets and two options exchanges. In addition, Ms. Martin serves as Chair of Fixed Income & Data Services at ICE, which includes ICE Bonds execution venues, securities pricing and analytics, reference data, indices, desktop solutions, consolidated feeds and connectivity services that cover all major asset classes. Previously, Ms. Martin served as President of Fixed Income & Data Services from 2020 to 2022 and President of ICE Data Services from 2015 to 2020. Prior to her roles with ICE Data Services, Ms. Martin served as Chief Operating Officer of ICE Clear US, Inc. Ms. Martin joined NYSE Euronext in 2001 and served in a number of leadership roles, including CEO of NYSE Liffe U.S. and Chief Executive Officer of New York Portfolio Clearing. Prior to joining NYSE Euronext, Ms. Martin worked at IBM in its Global Services organization. Ms. Martin holds a Bachelor of Science degree in Computer Science from Manhattan College and a Master of Arts in Statistics from Columbia University. Ms. Martin serves on the Manhattan College Board of Trustees as well as the Advisory Board of the School of Science and is a member of the Phi Beta Kappa National Honor Society.
Andrew J. Surdykowski. Mr. Surdykowski has served as General Counsel since October 2018. He is responsible for overseeing our legal affairs globally, including public company compliance, corporate governance matters and serving as ICE's key legal advisor. Previously Mr. Surdykowski was SVP, Associate General Counsel and Assistant Corporate Secretary. Prior to joining ICE in 2005, Mr. Surdykowski was a corporate attorney at McKenna, Long & Aldridge LLP, a national law firm now known as Dentons. At McKenna, Long & Aldridge, he practiced in the corporate law group and represented a broad array of clients in matters dealing with securities, mergers and acquisitions, corporate governance, finance and private equity. Mr. Surdykowski holds a Juris Doctor degree from the Georgia State University College of Law, and a Bachelor of Science degree in Management from the Georgia Institute of Technology.
Stuart G. Williams. Mr. Williams has served as Chief Operating Officer since July 2022. He is responsible for the day-to-day operations and support of the global infrastructure, data centers, networks and corporate IT systems that support ICE and its subsidiaries. In addition, he is responsible for the customer service teams and oversees all disaster recovery and business continuity planning and operations. He also serves on the Commodity Futures Trading Commission Global Markets Advisory Committee. Previously, Mr. Williams held several leadership roles at ICE Futures Europe, the London-based global futures and options exchange, including President from October 2017 to July 2022, Chief Operating Officer from July 2016 to September 2017 and Director of Corporate Development from January 2013 to June 2016. Prior to joining ICE in 2013, he spent ten years consulting with Protiviti and Accenture, working on a broad range of initiatives with exchanges, clearing houses and other financial sector clients. Mr. Williams earned a Bachelor of Engineering degree from the University of Pretoria.
Code of Ethics
We have adopted a Global Code of Business Conduct that applies to all of our employees, officers and directors. Our Global Code of Business Conduct meets the requirements of a “code of ethics” as defined by Item 406 of Regulation S-K, and applies to our Chief Executive Officer and Chief Financial Officer (who is the principal financial officer), as well as all other employees, as indicated above. Our Global Code of Business Conduct also meets the requirements of a code of ethics and business conduct under the New York Stock Exchange listing standards. Our Global Code of Business Conduct is available on our website at www.ice.com under the heading “Investor Relations” “Governance” then "Governance Overview." Within the time period required by the SEC, we intend to disclose on our website any substantive amendments to our Global Code of Business Conduct and any waiver of our Global Code of Business Conduct applicable to any executive officer, director or senior financial officer. We will also provide a copy of the Global Code of Business Conduct to stockholders at no charge upon written request.
Insider Trading Policy
We have adopted the Intercontinental Exchange, Inc. Global Personal Trading Policy, which governs, among other things, the purchase, sale and/or other disposition of our securities by our directors, officers and employees, as well as by the Company itself, that we believe is reasonably designed to promote compliance with insider trading laws, rules and regulations and New York Stock Exchange listing standards. A copy of the Intercontinental Exchange, Inc. Global Personal Trading Policy is filed as Exhibit 19.1 to this Annual Report.
ITEM 11. EXECUTIVE COMPENSATION
Information relating to executive compensation set forth under the captions “Compensation Discussion & Analysis,” “2023 Executive Compensation,” “Compensation Committee Interlocks and Insider Participation,” “Non-Employee Director Compensation,” and “Compensation Committee Report” in our 2025 Proxy Statement is incorporated herein by reference.
ITEM 12. SECURITY OWNERSHIP OF CERTAIN BENEFICIAL OWNERS AND MANAGEMENT AND RELATED STOCKHOLDER MATTERS
Information regarding ownership of our common stock by certain persons as set forth under the caption “Security Ownership of Certain Beneficial Owners and Management” in our 2025 Proxy Statement is incorporated herein by reference. In addition, information in tabular form relating to securities authorized for issuance under our equity compensation plans is set forth under the caption “Equity Compensation Plan Information” in this Annual Report and “Share-Based Compensation” and “Pension and Other Benefit Programs” as described in Notes 11 and 17 to our consolidated financial statements in this Annual Report.
ITEM 13. CERTAIN RELATIONSHIPS AND RELATED TRANSACTIONS, AND DIRECTOR INDEPENDENCE
Information regarding certain relationships and transactions between our company and certain of our affiliates as set forth under the caption “Certain Relationships and Related Transactions” in our 2025 Proxy Statement is incorporated herein by reference. In addition, information regarding our directors’ independence (Item 407(a) of Regulation S-K) as set forth under the caption “Item 1 — Election of Directors — Nominees for Election as Directors at the 2025 Annual Meeting” in our 2025 Proxy Statement is incorporated herein by reference.
ITEM 14. PRINCIPAL ACCOUNTANT FEES AND SERVICES
Information regarding principal accountant fees and services of our independent registered public accounting firm, Ernst & Young LLP, is set forth under the caption “Information About Our Independent Registered Public Accounting Firm Fees and Services” in our 2025 Proxy Statement and is incorporated herein by reference.
PART IV
ITEM 15. EXHIBITS AND FINANCIAL STATEMENT SCHEDULES
(a) Documents Filed as Part of this Report.
(1) Financial Statements
Our consolidated financial statements and the related reports of management and our independent registered public accounting firm which are required to be filed as part of this Report are included in this Annual Report on Form 10-K. These consolidated financial statements are as follows:
•Consolidated Balance Sheets as of December 31, 2024 and 2023.
•Consolidated Statements of Income for the years ended December 31, 2024, 2023 and 2022.
•Consolidated Statements of Comprehensive Income for the years ended December 31, 2024, 2023 and 2022.
•Consolidated Statements of Changes in Equity and Redeemable Non-Controlling Interest for the years ended December 31, 2024, 2023 and 2022.
•Consolidated Statements of Cash Flows for the years ended December 31, 2024, 2023 and 2022.
•Notes to Consolidated Financial Statements.
(2) Financial Statement Schedules
Schedules have been omitted because they are not applicable or the required information is included in the consolidated financial statements or notes, thereto.
(3) Exhibits
See (b) below.
(b) Exhibits
The exhibits listed below under “Index to Exhibits” are filed with or incorporated by reference in this Report. Where such filing is made by incorporation by reference to a previously filed registration statement or report, such registration statement or report is identified in parentheses. We will furnish any exhibit upon request to Investor Relations, 5660 New Northside Drive, Atlanta, Georgia 30328.
ITEM 16. FORM 10-K SUMMARY
Not applicable.
INDEX TO EXHIBITS
The following exhibits are filed with this Annual Report. We will furnish any exhibit upon request to Intercontinental Exchange, Inc., Investor Relations, 5660 New Northside Drive, Third Floor, Atlanta, Georgia 30328.
| | | | | | | | |
| Exhibit Number | | Description of Document |
| 3.1 | — | |
| 3.2 | — | |
| 4.1 | — | Indenture dated as of November 24, 2015 among Intercontinental Exchange, Inc., as issuer, NYSE Holdings LLC, as guarantor, and Wells Fargo Bank, National Association, as trustee (incorporated by reference to Exhibit 4.1 to Intercontinental Exchange, Inc.’s Current Report on Form 8-K filed with the SEC on November 24, 2015, File No. 001-36198). |
| 4.2 | — | First Supplemental Indenture dated as of November 24, 2015 among Intercontinental Exchange, Inc., as issuer, NYSE Holdings LLC, as guarantor, and Wells Fargo Bank, National Association, as trustee (incorporated by reference to Exhibit 4.2 to Intercontinental Exchange, Inc.’s Current Report on Form 8-K filed with the SEC on November 24, 2015, File No. 001-36198). |
| 4.3 | — | |
| 4.4 | — | Second Supplemental Indenture dated as of August 17, 2017 among Intercontinental Exchange, Inc., as issuer, NYSE Holdings LLC, as guarantor, and Wells Fargo Bank, National Association, as trustee (incorporated by reference to Exhibit 4.1 to Intercontinental Exchange, Inc.’s Current Report on Form 8-K filed with the SEC on August 17, 2017, File No. 001-36198). |
| 4.5 | — | |
| 4.6 | — | |
| 4.7 | — | |
| 4.8 | — | |
| 4.9 | — | |
| 4.10 | — | |
| 4.11 | — | |
| 4.12 | — | |
| 4.13 | — | |
| | | | | | | | |
| 4.14 | — | |
| 4.15 | — | |
| 4.16 | — | |
| 4.17 | — | |
| 4.18 | — | |
| 4.19 | — | |
| 4.20 | — | |
| 4.21 | — | |
| 4.22 | — | |
| 4.23 | — | |
| 4.24 | — | |
| 4.25 | — | |
| 4.26 | — | |
| 4.27 | — | Fifth Supplemental Indenture, dated as of May 13, 2024, between Intercontinental Exchange, Inc., as issuer, and Computershare Trust Company, N.A., as trustee (incorporated by reference to Exhibit 4.1 to Intercontinental Exchange, Inc.'s Current Report on Form 8-K filed with the SEC on May 13, 2024, File No. 001-36198). |
| 4.28 | — | |
| 4.29 | — | |
| 4.30 | — | |
| | | | | | | | |
| 4.31 | — | Registration Rights Agreement, dated as of June 5, 2024, between Intercontinental Exchange, Inc. and Goldman Sachs & Co. LLC, J.P. Morgan Securities LLC and Wells Fargo Securities, LLC, as dealer managers (incorporated by reference to Exhibit 4.4 to Intercontinental Exchange, Inc.'s Current Report on Form 8-K filed with the SEC on June 5, 2024, File No. 001-36198). |
| 4.32 | — | |
| 10.1 | — | |
| 10.2 | — | |
| 10.3 | — | |
| 10.4 | — | |
| 10.5 | — | |
| 10.6 | — | |
| 10.7 | — | |
| 10.8 | — | |
| 10.9 | — | |
| 10.10 | — | |
| 10.11 | — |
|
| 10.12 | — | |
| 10.13 | — | |
| 10.14 | — | |
| 10.15 | — | |
| 10.16 | — | |
| | | | | | | | |
| 10.17* | — | |
| 10.18* | — | |
| 10.19* | — | |
| 10.20 | — | Contribution and Asset Transfer Agreement, dated as of May 11, 2000, by and between IntercontinentalExchange, LLC, Continental Power Exchange, Inc., and Jeffrey C. Sprecher (incorporated by reference to Exhibit 10.31 to Intercontinental Exchange Holdings, Inc.’s Registration Statement on Form S-1 filed with the SEC on October 25, 2005, File No. 333-123500). |
| 10.21 | — | First Amendment to Contribution and Asset Transfer Agreement, dated as of May 17, 2000, by and among IntercontinentalExchange, LLC, Continental Power Exchange, Inc., and Jeffrey C. Sprecher (incorporated by reference to Exhibit 10.32 to Intercontinental Exchange Holdings, Inc.’s Registration Statement on Form S-1 filed with the SEC on October 25, 2005, File No. 333-123500). |
| 10.22 | — | Second Amendment to Contribution and Asset Transfer Agreement, dated as of October 24, 2005, by and among Intercontinental Exchange Holdings, Inc., Continental Power Exchange, Inc., and Jeffrey C. Sprecher (incorporated by reference to Exhibit 10.33 to Intercontinental Exchange Holdings, Inc.’s Registration Statement on Form S-1 filed with the SEC on October 25, 2005, File No. 333-123500). |
| 10.23 | — | |
| 10.24 | — | |
| 10.25 | — | |
| 10.26 | — | |
| 10.27 | — | |
| 10.28 | — | |
| 10.29 | — | Credit Agreement dated as of April 3, 2014 among Intercontinental Exchange, Inc. and ICE Europe Parent Limited, as borrowers, Wells Fargo Bank, National Association, as administrative agent, issuing lender and swingline lender, Bank of America, N.A., as syndication agent, and each of the lenders party thereto for an aggregate $3.0 billion five-year senior unsecured revolving credit facility (incorporated by reference to Exhibit 10.1 to Intercontinental Exchange, Inc.’s Current Report on Form 8-K filed with the SEC on April 7, 2014). |
| 10.30 | — | First Amendment to Credit Agreement dated as of May 15, 2015 amending Credit Agreement originally dated April 3, 2014 among Intercontinental Exchange, Inc. (formerly known as IntercontinentalExchange Group, Inc.) and ICE Europe Parent Limited, as borrowers, Wells Fargo Bank, National Association, as administrative agent, issuing lender and swingline lender, Bank of America N.A., as syndication agent, and each of the lenders party thereto for an aggregate $3.0 billion five-year senior unsecured revolving credit facility (incorporated by reference to Exhibit 10.1 to Intercontinental Exchange, Inc.’s Current Report on Form 8-K filed with the SEC on May 19, 2015, File No. 001-36198). |
| 10.31 | — | Second Amendment to Credit Agreement dated as of November 9, 2015 among Intercontinental Exchange, Inc. and ICE Europe Parent Limited, as borrowers, the lenders party thereto and Wells Fargo Bank, National Association, as administrative agent, amending that certain Credit Agreement, dated April 3, 2014 (as amended by the First Amendment to Credit Agreement, dated as of May 15, 2015) among Intercontinental Exchange, Inc. and ICE Europe Parent Limited, as borrowers, the lenders party thereto and Wells Fargo Bank, National Association, as administrative agent, (incorporated by reference to Exhibit 10.1 to Intercontinental Exchange, Inc.’s Current Report on Form 8-K filed with the SEC on November 13, 2015, File No. 001-36198). |
| | | | | | | | |
| 10.32 | — | Third Amendment to Credit Agreement dated as of November 13, 2015 among Intercontinental Exchange, Inc. and ICE Europe Parent Limited, as borrowers, the lenders party thereto and Wells Fargo Bank, National Association, as administrative agent, amending that certain Credit Agreement, dated as of April 3, 2014 (as amended by the First Amendment to Credit Agreement, dated as of May 15, 2015 and the Second Amendment to Credit Agreement, dated as of November 9, 2015) among Intercontinental Exchange, Inc. and ICE Europe Parent Limited, as borrowers, the lenders party thereto and Wells Fargo Bank, National Association, as administrative agent, (incorporated by reference to Exhibit 10.2 to Intercontinental Exchange, Inc.’s Current Report on Form 8-K filed with the SEC on November 13, 2015, File No. 001-36198). |
| 10.33 | — | The Fourth Amendment to Credit Agreement, dated as of August 18, 2017 among Intercontinental Exchange, Inc. as borrower, NYSE Holdings LLC as guarantor, the lenders party thereto and Wells Fargo Bank, National Association, as administrative agent, amending that certain Credit Agreement, dated as of April 3, 2014 among Intercontinental Exchange, Inc. and ICE Europe Parent Limited, as borrowers, the lenders party thereto and Wells Fargo Bank, National Association, as administrative agent (as amended by the First Amendment to Credit Agreement, dated as of May 15, 2015, the Second Amendment to Credit Agreement, dated as of November 9, 2015, and the Third Amendment to Credit Agreement, dated as of November 13, 2015) (incorporated by reference to Exhibit 10.1 to Intercontinental Exchange, Inc.’s Current Report on Form 8-K filed with the SEC on August 21, 2017, File No. 001-36198). |
| 10.34 | — | The Fifth Amendment to Credit Agreement, dated as of August 18, 2017 among Intercontinental Exchange, Inc. as borrower, NYSE Holdings LLC as guarantor, the lenders party thereto and Wells Fargo Bank, National Association, as administrative agent, amending that certain Credit Agreement, dated as of April 3, 2014 among Intercontinental Exchange, Inc. and ICE Europe Parent Limited, as borrowers, the lenders party thereto and Wells Fargo Bank, National Association, as administrative agent (as amended by the First Amendment to Credit Agreement, dated as of May 15, 2015, the Second Amendment to Credit Agreement, dated as of November 9, 2015, the Third Amendment to Credit Agreement, dated as of November 13, 2015 and the Fourth Amendment to Credit Agreement, dated as of August 18, 2017) (incorporated by reference to Exhibit 10.2 to Intercontinental Exchange, Inc.’s Current Report on Form 8-K filed with the SEC on August 21, 2017, File No. 001-36198). |
| 10.35 | — | The Sixth Amendment to Credit Agreement, dated as of August 9, 2018 among Intercontinental Exchange, Inc. as borrower, the lenders party thereto and Wells Fargo Bank, National Association, as administrative agent, amending that certain Credit Agreement, dated as of April 3, 2014 among Intercontinental Exchange, Inc., as borrower, the lenders party thereto and Wells Fargo Bank, National Association, as administrative agent (as amended by the First Amendment to Credit Agreement, dated as of May 15, 2015, the Second Amendment to Credit Agreement, dated as of November 9, 2015, the Third Amendment to Credit Agreement, dated as of November 13, 2015, the Fourth Amendment to Credit Agreement, dated as of August 18, 2017, and the Fifth Amendment to Credit Agreement, dated as of August 18, 2017) (incorporated by reference to Exhibit 10.1 to Intercontinental Exchange, Inc.’s Current Report on Form 8-K filed with the SEC on August 9, 2018, File No. 001-36198). |
| 10.36 | — | The Seventh Amendment to Credit Agreement, dated as of August 14, 2020 among Intercontinental Exchange, Inc. as borrower, the lenders party thereto and Wells Fargo Bank, National Association, as administrative agent, amending that certain Credit Agreement, dated as of April 3, 2014 among Intercontinental Exchange, Inc., as borrower, the lenders party thereto and Wells Fargo Bank, National Association, as administrative agent (as amended by the First Amendment to Credit Agreement, dated as of May 15, 2015, the Second Amendment to Credit Agreement, dated as of November 9, 2015, the Third Amendment to Credit Agreement, dated as of November 13, 2015, the Fourth Amendment to Credit Agreement, dated as of August 18, 2017, the Fifth Amendment to Credit Agreement, dated as of August 18, 2017 and the Sixth Amendment to Credit Agreement, dated as of August 9, 2018) (incorporated by reference to Exhibit 10.1 to Intercontinental Exchange, Inc.’s Current Report on Form 8-K filed with the SEC on August 18, 2020, File No. 001-36198). |
| 10.37 | — | The Eighth Amendment to Credit Agreement, dated as of August 21, 2020 among Intercontinental Exchange, Inc. as borrower, the lenders party thereto and Wells Fargo Bank, National Association, as administrative agent, amending that certain Credit Agreement, dated as of April 3, 2014 among Intercontinental Exchange, Inc., as borrower, the lenders party thereto and Wells Fargo Bank, National Association, as administrative agent (as amended by the First Amendment to Credit Agreement, dated as of May 15, 2015, the Second Amendment to Credit Agreement, dated as of November 9, 2015, the Third Amendment to Credit Agreement, dated as of November 13, 2015, the Fourth Amendment to Credit Agreement, dated as of August 18, 2017, the Fifth Amendment to Credit Agreement, dated as of August 18, 2017, the Sixth Amendment to Credit Agreement, dated as of August 9, 2018 and the Seventh Amendment to Credit Agreement, dated as of August 14, 2020) (incorporated by reference to Exhibit 10.1 to Intercontinental Exchange, Inc.’s Current Report on Form 8-K filed with the SEC on August 25, 2020, File No. 001-36198). |
| | | | | | | | |
| 10.38 | — | The Ninth Amendment, dated as of March 8, 2021, by and among Intercontinental Exchange, Inc., as borrower, the lenders party thereto and Wells Fargo Bank, National Association, as administrative agent, amending that certain Credit Agreement, dated as of April 3, 2014, by and among Intercontinental Exchange, Inc., as borrower, the lenders party thereto and Wells Fargo Bank, National Association, as administrative agent (as amended by the First Amendment to Credit Agreement, dated as of May 15, 2015, the Second Amendment to Credit Agreement, dated as of November 9, 2015, the Third Amendment to Credit Agreement, dated as of November 13, 2015, the Fourth Amendment to Credit Agreement, dated as of August 18, 2017, the Fifth Amendment to Credit Agreement, dated as of August 18, 2017, the Sixth Amendment to Credit Agreement, dated as of August 9, 2018, the Seventh Amendment to Credit Agreement, dated as of August 14, 2020 and the Eighth Amendment to Credit Agreement, dated as of August 21, 2020) (incorporated by reference to Exhibit 10.1 to Intercontinental Exchange, Inc.'s Quarterly Report on Form 10-Q filed with the SEC on April 29, 2021, File No. 001-36198). |
| 10.39 | — | The Tenth Amendment, dated as of October 15, 2021, by and among Intercontinental Exchange, Inc., as borrower, the lenders party thereto and Wells Fargo Bank, National Association, as administrative agent, amending that certain Credit Agreement, dated as of April 3, 2014, by and among Intercontinental Exchange, Inc., as borrower, the lenders party thereto and Wells Fargo Bank, National Association, as administrative agent (as amended by the First Amendment to Credit Agreement, dated as of May 15, 2015, the Second Amendment to Credit Agreement, dated as of November 9, 2015, the Third Amendment to Credit Agreement, dated as of November 13, 2015, the Fourth Amendment to Credit Agreement, dated as of August 18, 2017, the Fifth Amendment to Credit Agreement, dated as of August 18, 2017, the Sixth Amendment to Credit Agreement, dated as of August 9, 2018, the Seventh Amendment to Credit Agreement, dated as of August 14, 2020, the Eighth Amendment to Credit Agreement, dated as of August 21, 2021, and the Ninth Amendment to Credit Agreement, dated as of March 8, 2021) (incorporated by reference to Exhibit 10.1 to Intercontinental Exchange, Inc.'s Current Report on Form 8-K filed with the SEC on October 18, 2021, File No. 001-36198). |
| 10.40 | — | The Eleventh Amendment, dated as of May 11, 2022, by and among Intercontinental Exchange, Inc., as borrower, the lenders party thereto and Wells Fargo Bank, National Association, as administrative agent, amending that certain Credit Agreement, dated as of April 3, 2014, by and among Intercontinental Exchange, Inc., as borrower, the lenders party thereto and Wells Fargo Bank, National Association, as administrative agent (as amended by the First Amendment to Credit Agreement, dated as of May 15, 2015, the Second Amendment to Credit Agreement, dated as of November 9, 2015, the Third Amendment to Credit Agreement, dated as of November 13, 2015, the Fourth Amendment to Credit Agreement, dated as of August 18, 2017, the Fifth Amendment to Credit Agreement, dated as of August 18, 2017, the Sixth Amendment to Credit Agreement, dated as of August 9, 2018, the Seventh Amendment to Credit Agreement, dated as of August 14, 2020, the Eighth Amendment to Credit Agreement, dated as of August 21, 2020, the Ninth Amendment to Credit Agreement, dated as of March 8, 2021 and the Tenth Amendment to Credit Agreement, dated as of October 15, 2021) (incorporated by reference to Exhibit 10.3 to Intercontinental Exchange, Inc.'s Quarterly Report on Form 10-Q filed with the SEC on August 4, 2022, File No. 001-36198). |
| 10.41 | — | The Twelfth Amendment, dated as of May 25, 2022, by and among Intercontinental Exchange, Inc., as borrower, the lenders party thereto and Wells Fargo Bank, National Association, as administrative agent, amending that certain Credit Agreement, dated as of April 3, 2014, by and among Intercontinental Exchange, Inc., as borrower, the lenders party thereto and Wells Fargo Bank, National Association, as administrative agent (as amended by the First Amendment to Credit Agreement, dated as of May 15, 2015, the Second Amendment to Credit Agreement, dated as of November 9, 2015, the Third Amendment to Credit Agreement, dated as of November 13, 2015, the Fourth Amendment to Credit Agreement, dated as of August 18, 2017, the Fifth Amendment to Credit Agreement, dated as of August 18, 2017, the Sixth Amendment to Credit Agreement, dated as of August 9, 2018, the Seventh Amendment to Credit Agreement, dated as of August 14, 2020, the Eighth Amendment to Credit Agreement, dated as of August 21, 2020, the Ninth Amendment to Credit Agreement, dated as of March 8, 2021, the Tenth Amendment to Credit Agreement, dated as of October 15, 2021, and the Eleventh Amendment to Credit Agreement, dated as of May 11, 2022) (incorporated by reference to Exhibit 10.1 to Intercontinental Exchange, Inc.’s Current Report on Form 8-K filed with the SEC on June 1, 2022, File No. 001-36198). |
| | | | | | | | |
| 10.42 | — | The Thirteenth Amendment, dated as of May 31, 2024, by and among Intercontinental Exchange, Inc., as borrower, the lenders party thereto and Wells Fargo Bank, National Association, as administrative agent, amending that certain Credit Agreement, dated as of April 3, 2014, by and among Intercontinental Exchange, Inc., as borrower, the lenders party thereto and Wells Fargo Bank, National Association, as administrative agent (as amended by the First Amendment to Credit Agreement, dated as of May 15, 2015, the Second Amendment to Credit Agreement, dated as of November 9, 2015, the Third Amendment to Credit Agreement, dated as of November 13, 2015, the Fourth Amendment to Credit Agreement, dated as of August 18, 2017, the Fifth Amendment to Credit Agreement, dated as of August 18, 2017, the Sixth Amendment to Credit Agreement, dated as of August 9, 2018, the Seventh Amendment to Credit Agreement, dated as of August 14, 2020, the Eighth Amendment to Credit Agreement, dated as of August 21, 2020, the Ninth Amendment to Credit Agreement, dated as of March 8, 2021, the Tenth Amendment to Credit Agreement, dated as of October 15, 2021, the Eleventh Amendment to Credit Agreement, dated as of May 11, 2022, and the Twelfth Amendment to Credit Agreement, dated as of May 25, 2022) (incorporated by reference to Exhibit 10.1 to Intercontinental Exchange, Inc.'s Current Report on Form 8-K filed with the SEC on June 5, 2024), File No. 001-36198). |
| 10.43 | — | Term Loan Credit Agreement, dated as of May 25, 2022, by and among Intercontinental Exchange, Inc., as borrower, the lenders party thereto and Wells Fargo Bank, National Association, as administrative agent (incorporated by reference to Exhibit 10.2 to Intercontinental Exchange, Inc.’s Current Report on Form 8-K filed with the SEC on June 1, 2022, File No. 001-36198). |
| 19.1* | — | |
| 21.1* | — | |
| 23.1* | — | |
| 24.1 | — | |
| 31.1* | — | |
| 31.2* | — | |
| 32.1** | — | |
| 32.2** | — | |
| 97 | — | |
| 101 | — | The following materials from Intercontinental Exchange, Inc.’s Annual Report on Form 10-K for the year ended December 31, 2024 formatted in Inline XBRL (Extensible Business Reporting Language): (i) the Consolidated Balance Sheets, (ii) the Consolidated Statements of Income, (iii) the Consolidated Statements of Changes in Equity and Redeemable Non-Controlling Interest, (iv) the Consolidated Statements of Comprehensive Income, (v) Consolidated Statements of Cash Flows and (vi) Notes to Consolidated Financial Statements, tagged as blocks of text. |
| 104 | — | The cover page from Intercontinental Exchange, Inc.'s Annual Report on Form 10-K for the fiscal year ended December 31, 2024, formatted in Inline XBRL. |
* Filed herewith.
** Furnished herewith. These exhibits shall not be deemed “filed” for purposes of Section 18 of the Securities Exchange Act of 1934, or otherwise subject to the liability of that Section. Such exhibits shall not be deemed incorporated into any filing under the Securities Act of 1933 or the Securities Exchange Act of 1934.
SIGNATURES
Pursuant to the requirements of Section 13 or 15(d) of the Securities Exchange Act of 1934, the Registrant has duly caused this Report to be signed on its behalf by the undersigned, thereunto duly authorized.
| | | | | | | | | | | |
| | Intercontinental Exchange, Inc.
(Registrant) |
| | | |
| Date: February 6, 2025 | | By: | /s/ Jeffrey C. Sprecher |
| | | Jeffrey C. Sprecher |
| | | Chair and Chief Executive Officer |
KNOW ALL MEN BY THESE PRESENTS, that each person whose signature appears below constitutes and appoints Jeffrey C. Sprecher and A. Warren Gardiner, and each of them his or her true and lawful attorneys-in-fact and agents, with full power of substitution and resubstitution, for him or her and in his or her name, place and stead, in any and all capacities, to sign any and all amendments to this Annual Report in 2024 and to file the same, with all exhibits thereto and other documents in connection therewith, with the Securities and Exchange Commission, granting unto said attorneys-in-fact and agents, and each of them, full power and authority to do and perform each and every act and thing requisite or necessary to be done, as fully to all intents and purposes as he might or could do in person, hereby ratifying and confirming all that said attorneys-in-fact and agents or any of them, or their or his substitute or substitutes, may lawfully do or cause to be done by virtue hereof.
Pursuant to the requirements of the Securities Exchange Act of 1934, this Report has been signed below by the following persons on behalf of the Registrant and in the capacities indicated as of the date indicated.
| | | | | | | | |
| Signatures | Title | Date |
| | |
| /s/ Jeffrey C. Sprecher | Chair and Chief Executive Officer (principal executive officer) | February 6, 2025 |
| Jeffrey C. Sprecher | |
| | |
| /s/ A. Warren Gardiner | Chief Financial Officer (principal financial officer) | February 6, 2025 |
| A. Warren Gardiner | |
| | |
| /s/ James W. Namkung | Chief Accounting Officer and Corporate Controller (principal accounting officer) | February 6, 2025 |
| James W. Namkung | |
| | |
| /s/ Sharon Y. Bowen | Director | February 6, 2025 |
| Sharon Y. Bowen | | |
| | |
| /s/ Shantella E. Cooper | Director | February 6, 2025 |
| Shantella E. Cooper | | |
| | |
| | |
| | |
| | |
| /s/ Duriya M. Farooqui | Director | February 6, 2025 |
| Duriya M. Farooqui | | |
| | |
| | | | | | | | |
| | |
| /s/ Lord Hague of Richmond | Director | February 6, 2025 |
| The Rt. Hon. the Lord Hague of Richmond | | |
| | |
| /s/ Mark F. Mulhern | Director | February 6, 2025 |
| Mark F. Mulhern | | |
| | |
| | | | | | | | |
| | |
| /s/ Thomas E. Noonan | Director | February 6, 2025 |
| Thomas E. Noonan | | |
| | |
| /s/ Caroline L. Silver | Director | February 6, 2025 |
| Caroline L. Silver | | |
| | |
| /s/ Judith A. Sprieser | Director | February 6, 2025 |
| Judith A. Sprieser | | |
| | |
| /s/ Martha A. Tirinnanzi | Director | February 6, 2025 |
| Martha A. Tirinnanzi | | |