Exhibit 99.1

FOR IMMEDIATE RELEASE
VIRGINIA NATIONAL BANKSHARES CORPORATION
ANNOUNCES FOURTH QUARTER AND FULL-YEAR FINANCIAL RESULTS
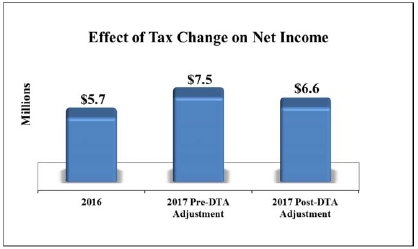
Charlottesville, VA – January 23, 2018 – Virginia National Bankshares Corporation (OTCQX: VABK) (the “Company”) today reported fourth quarter 2017 net income of $1.2 million or $0.47 per diluted share. This fourth quarter net income is net of a $963 thousand re-measurement of and adjustment to deferred tax assets (“DTA”) as a result of the enactment of the Tax Cuts and Jobs Act (“Tax Reform”) in December 2017. This DTA adjustment represents the impact of reducing the federal tax rate applicable to the Company’s DTAs to 21% in 2018 from 34% previously, which the Company was required to take as a one-time, non-cash tax charge in the Company’s consolidated financial statements for 2017 when the Tax Reform was enacted. Excluding the impact of Tax Reform, the Company would have realized $2.1 million in net income for the fourth quarter, which would have been a 42% increase compared to net income of $1.5 million or $0.62 per diluted share recognized during the fourth quarter of 2016.
For the full year, the Company had net income of $6.6 million, an $806 thousand or 14% increase over the amount recognized for the full year 2016. Net income per diluted share was $2.71 for 2017 compared to $2.41 per share for 2016. Excluding the impact of Tax Reform, the Company would have recorded a year-over-year increase of 31% in net income, which would have risen to $7.5 million, or $3.11 per diluted share.
"We concluded another year with strong loan growth, increasing our loan portfolio in volume and yield while preserving our high standards of credit quality,” said Glenn W. Rust, President and Chief Executive Officer. “Growth in revenue, including net interest margin, and solid expense management, led us to a full year efficiency ratio of 58%, an improvement of 6 percentage points over the 64% realized during 2016. We achieved a return on average assets (ROAA) of 1.05% for the year, even after the DTA adjustment, which negatively impacted our ROAA by 15 basis points. Our focus continues to remain on improving interest and noninterest income revenue sources and attaining an effective mix of earning assets.”
Fourth Quarter and Full-Year 2017 Financial Highlights
| ● | Gross loans outstanding at the end of the year totaled $528.8 million, which represented an increase of $27.8 million or 5.5% over the prior quarter and an increase of $46.6 million or 9.7% compared to December 31, 2016.
|
| ● | The efficiency ratio on a fully tax equivalent basis (FTE) was 57.5% for the fourth quarter, improving from 58.6% for the third quarter of 2017 and from 60.1% for the fourth quarter of 2016.
|
| ● | Return on average assets (ROAA) for the quarter amounted to 0.73% (1.34% prior to the DTA adjustment) compared to the 1.11% recorded in the prior quarter and 1.03% realized during the fourth quarter of 2016. ROAA for the year ended December 31, 2017 was 1.05% (1.20% prior to the DTA adjustment), compared to the return of 1.02% for the year ended December 31, 2016.
|
| ● | Net interest margin (FTE) increased 9 basis points to 3.79% on a sequential quarter basis and improved 23 basis points compared to the fourth quarter of 2016. Net interest margin (FTE) for the year increased to 3.63%, an improvement of 14 basis points over the 3.49% attained in 2016.
|
| ● | Total assets of $643.9 million were 5.5% higher than the prior quarter balance of $610.3 million and 6.4% higher than the prior year-end balance of $605.0 million. The quarter-over-quarter and year-over-year net growth in assets was funded by expansion in core deposits and short-term borrowings.
|
| ● | The loan-to-deposit ratio was 97.4% as of December 31, 2017, compared to 98.8% as of September 30, 2017 and 91.9% at December 31, 2016. This year-over-year increase is in line with our strategy to achieve an effective mix of earning assets and liabilities on our balance sheet.
|
| ● | Net interest income for the quarter increased $720 thousand or 15.0% compared to the fourth quarter of 2016.
|
| ● | The period-end allowance for loan losses as a percentage of total loans remained consistent with the prior quarter at 0.76% and decreased 1 basis point from the 0.77% level at December 31, 2016.
|
| ● | A provision for loan losses of $205 thousand was recognized in the fourth quarter of 2017 due to increased loan growth during the quarter. With the $213 thousand provision recognized through the first nine months, the total provision for loan losses recognized for 2017 was $418 thousand, compared to $111 thousand recognized during the year ended December 31, 2016.
|
| ● | Noninterest income for the fourth quarter increased $988 thousand, or 85.3%, on a sequential quarter basis, primarily due to the recognition of wealth management performance fees. Noninterest income for the year ended December 31, 2017 improved $397 thousand, or 7.2%, over the prior year.
|
| ● | Noninterest expense for the fourth quarter increased $510 thousand, or 13.0%, on a sequential quarter basis, due largely to bonuses associated with wealth management fees. Noninterest expense for the year ended December 31, 2017 increased over the prior year expense by $586 thousand or 3.8%.
|
| ● | The cost of funds of 22 basis points for the year ended December 31, 2017 increased a modest three basis points from 19 basis points in the prior year, remaining low compared to peers. Low-cost deposits, which include both noninterest and interest-bearing checking accounts, as well as money market accounts, remained in excess of 77% of total deposits at the end of both 2017 and 2016.
|
| ● | Tangible book value per share was $26.61, compared to $26.50 as of the end of the prior quarter, and $24.49 at December 31, 2016. Dividends of $458 thousand were declared during the fourth quarter of 2017, while the remaining net income of $696 thousand, or 60.3%, was retained. (Note that these figures include the DTA adjustment of $963 thousand.)
|
| ● | Capital ratios continue to be well in excess of regulatory requirements for well-capitalized banks, even after a near $1 million reduction of capital due to the DTA adjustment. |
Page2of6
About Virginia National Bankshares Corporation
Virginia National Bankshares Corporation, headquartered in Charlottesville, Virginia, is the bank holding company for Virginia National Bank (the “Bank”). The Bank has four banking offices in Charlottesville, one in Winchester and one in Orange, as well as a loan production office in Harrisonburg. The Bank offers a full range of banking and related financial services to meet the needs of individuals, businesses and charitable organizations. Investment management, wealth advisory, and trust and estate services are offered through VNB Wealth Management, the trade name of VNBTrust, N.A., the Bank’s wholly owned subsidiary. Retail brokerage and investment advisory services are offered under the name of VNB Investment Services.
The Company’s stock trades on the OTC Markets Group’s OTCQX Market under the symbol “VABK.” Additional information on the Company is also available atwww.vnbcorp.com.
The following graph compares the cumulative total shareholder return of VABK common stock for the period from December 31, 2012 through December 31, 2017 to the NASDAQ Composite Market Index, the SNL Index of U.S. Banks $500M - $1B and the SNL Index of Mid-Atlantic U.S. Banks. The graph assumes that $100 was invested on December 31, 2012 in the Company’s common stock and in each of the indices and that dividends were invested. S&P Global Market Intelligence supplied the information to construct the following graph, and reserves all of its copyright rights therein.
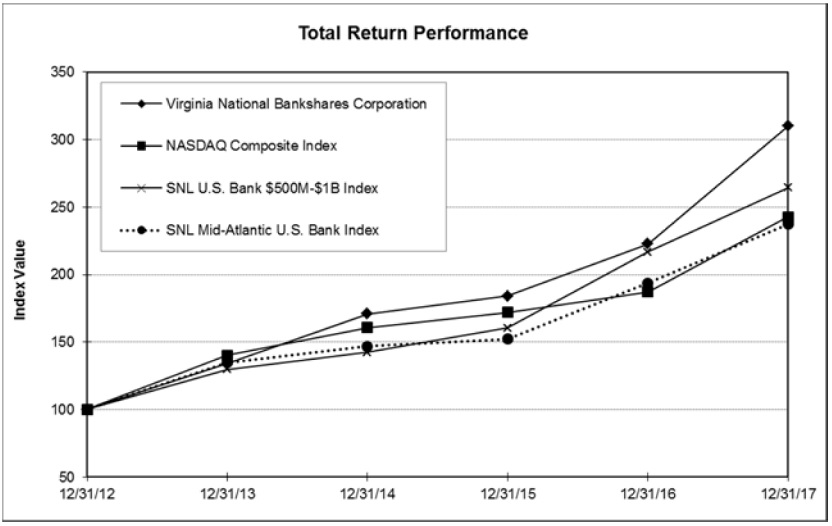 |
Source: S&P Global Market Intelligence
© 2017 |
Forward-Looking Statements; Other Information
Statements which express or imply a view about projections, predictions or the expected future performance of Virginia National Bankshares Corporation are “forward-looking statements.” Such statements are often characterized by use of qualified words such as “expect,” “believe,” “estimate,” “project,” “anticipate,” “intend,” “will,” “should,” or words of similar meaning or other statements concerning the opinions or judgment of the Company and its management about future events. While Company management believes such statements to be reasonable, future events and predictions are subject to circumstances that are not within the control of the Company and its management, and actual events in the future may be substantially different from those expressed. The Company’s past results are not necessarily indicative of future performance. Factors that could cause future performance to differ from past performance or anticipated performance could include, but are not limited to, changes in national and local economies, employment or market conditions; changes in interest rates, deposits, loan demand, and asset quality; competition; changes in banking regulations and accounting principles or guidelines; and performance of assets under management. These statements speak only as of the date made, and the Company does not undertake to update any forward-looking statements to reflect changes or events that may occur after this release.
Certain information contained in the foregoing press release is derived from the unaudited consolidated financial statements of Virginia National Bankshares Corporation. The Company filed audited consolidated financial statements in its Annual Report on Form 10-K for the year ended December 31, 2016 with the Securities and Exchange Commission on March 27, 2017. Information based on other sources is believed by management of the Company to be reliable, but has not been independently verified.
Page3of6
VIRGINIA NATIONAL BANKSHARES CORPORATION
CONSOLIDATED BALANCE SHEETS
(dollars in thousands, except per share data)
| | December 31, 2017 | | December 31, 2016 * |
| | (Unaudited) | | | | |
| ASSETS | | | | | | | | |
| Cash and due from banks | | $ | 11,390 | | | $ | 10,047 | |
| Federal funds sold | | | 6,887 | | | | 28,453 | |
| Securities: | | | | | | | | |
| Available for sale, at fair value | | | 67,501 | | | | 56,662 | |
| Restricted securities, at cost | | | 2,284 | | | | 1,709 | |
| Total securities | | | 69,785 | | | | 58,371 | |
| Loans | | | 528,784 | | | | 482,135 | |
| Allowance for loan losses | | | (4,043 | ) | | | (3,688 | ) |
| Loans, net | | | 524,741 | | | | 478,447 | |
| Premises and equipment, net | | | 7,371 | | | | 8,046 | |
| Bank owned life insurance | | | 16,344 | | | | 13,917 | |
| Goodwill | | | 372 | | | | 372 | |
| Other intagible assets, net | | | 579 | | | | 680 | |
| Accrued interest receivable and other assets | | | 6,417 | | | | 6,697 | |
| Total assets | | $ | 643,886 | | | $ | 605,030 | |
| LIABILITIES AND SHAREHOLDERS' EQUITY | | | | | | | | |
| Liabilities: | | | | | | | | |
| Demand deposits: | | | | | | | | |
| Noninterest-bearing | | $ | 193,081 | | | $ | 176,098 | |
| Interest-bearing | | | 102,583 | | | | 96,869 | |
| Money market deposit accounts | | | 138,065 | | | | 136,658 | |
| Certificates of deposit and other time deposits | | | 109,233 | | | | 115,026 | |
| Total deposits | | | 542,962 | | | | 524,651 | |
| Repurchase agreements and other borrowings | | | 34,092 | | | | 19,700 | |
| Accrued interest payable and other liabilities | | | 1,727 | | | | 1,625 | |
| Total liabilities | | | 578,781 | | | | 545,976 | |
| Shareholders' equity: | | | | | | | | |
| Preferred stock, $2.50 par value, 2,000,000 shares authorized, no shares outstanding | | | - | | | | - | |
| Common stock, $2.50 par value, 10,000,000 shares authorized; 2,410,680 and 2,368,777 issued and outstanding at December 31, 2017 and December 31, 2016, respectively | | | 6,027 | | | | 5,922 | |
| Capital surplus | | | 22,038 | | | | 21,152 | |
| Retained earnings | | | 37,778 | | | | 32,759 | |
| Accumulated other comprehensive income (loss) | | | (738 | ) | | | (779 | ) |
| Total shareholders' equity | | | 65,105 | | | | 59,054 | |
| Total liabilities and shareholders' equity | | $ | 643,886 | | | $ | 605,030 | |
* Derived from audited consolidated financial statements
Page4of6
VIRGINIA NATIONAL BANKSHARES CORPORATION
CONSOLIDATED STATEMENTS OF INCOME
(dollars in thousands, except per share data)
(Unaudited)
| | For the three months ended | | For the twelve months ended |
| | December 31, 2017 | | December 31, 2016 | | December 31, 2017 | | December 31, 2016 |
| Interest and dividend income: | | | | | | | | | | | | | | | |
| Loans, including fees | | $ | 5,410 | | | $ | 4,679 | | $ | 20,864 | | | $ | 17,691 | |
| Federal funds sold | | | 33 | | | | 28 | | | 241 | | | | 129 | |
| Investment securities: | | | | | | | | | | | | | | | |
| Taxable | | | 277 | | | | 216 | | | 1,115 | | | | 978 | |
| Tax exempt | | | 85 | | | | 71 | | | 288 | | | | 313 | |
| Dividends | | | 27 | | | | 22 | | | 96 | | | | 89 | |
| Other | | | - | | | | 4 | | | 7 | | | | 11 | |
| Total interest and dividend income | | | 5,832 | | | | 5,020 | | | 22,611 | | | | 19,211 | |
| |
| Interest expense: | | | | | | | | | | | | | | | |
| Demand and savings deposits | | | 126 | | | | 72 | | | 467 | | | | 275 | |
| Certificates and other time deposits | | | 147 | | | | 145 | | | 663 | | | | 619 | |
| Repurchase agreements and other borrowings | | | 46 | | | | 10 | | | 104 | | | | 43 | |
| Total interest expense | | | 319 | | | | 227 | | | 1,234 | | | | 937 | |
| Net interest income | | | 5,513 | | | | 4,793 | | | 21,377 | | | | 18,274 | |
| Provision for loan losses | | | 205 | | | | 402 | | | 418 | | | | 111 | |
| Net interest income after provision for loan losses | | | 5,308 | | | | 4,391 | | | 20,959 | | | | 18,163 | |
| |
| Noninterest income: | | | | | | | | | | | | | | | |
| Trust income | | | 1,236 | | | | 795 | | | 2,407 | | | | 1,969 | |
| Advisory and brokerage income | | | 133 | | | | 102 | | | 520 | | | | 389 | |
| Royalty income | | | 32 | | | | 20 | | | 230 | | | | 40 | |
| Customer service fees | | | 249 | | | | 237 | | | 927 | | | | 923 | |
| Debit/credit card and ATM fees | | | 214 | | | | 221 | | | 864 | | | | 874 | |
| Earnings/increase in value of bank owned life insurance | | | 115 | | | | 110 | | | 427 | | | | 441 | |
| Fees on mortgage sales | | | 34 | | | | 74 | | | 138 | | | | 230 | |
| Gains (losses) on sales of securities | | | (1 | ) | | | 8 | | | (75 | ) | | | 197 | |
| Gains (losses) on sales of other assets | | | - | | | | 2 | | | - | | | | (19 | ) |
| Other | | | 134 | | | | 127 | | | 442 | | | | 439 | |
| Total noninterest income | | | 2,146 | | | | 1,696 | | | 5,880 | | | | 5,483 | |
| |
| Noninterest expense: | | | | | | | | | | | | | | | |
| Salaries and employee benefits | | | 2,511 | | | | 2,110 | | | 8,281 | | | | 7,814 | |
| Net occupancy | | | 470 | | | | 459 | | | 1,860 | | | | 1,872 | |
| Equipment | | | 143 | | | | 157 | | | 541 | | | | 558 | |
| Other | | | 1,303 | | | | 1,193 | | | 5,200 | | | | 5,052 | |
| Total noninterest expense | | | 4,427 | | | | 3,919 | | | 15,882 | | | | 15,296 | |
| |
| Income before income taxes | | | 3,027 | | | | 2,168 | | | 10,957 | | | | 8,350 | |
| Provision for income taxes | | | 1,873 | | | | 681 | | | 4,403 | | | | 2,602 | |
| Net income | | $ | 1,154 | | | $ | 1,487 | | $ | 6,554 | | | $ | 5,748 | |
| Net income per common share, basic | | $ | 0.48 | | | $ | 0.63 | | $ | 2.74 | | | $ | 2.43 | |
| Net income per common share, diluted | | $ | 0.47 | | | $ | 0.62 | | $ | 2.71 | | | $ | 2.41 | |
| Weighted average common shares outstanding, basic | | | 2,410,680 | | | | 2,368,777 | | | 2,393,687 | | | | 2,369,331 | |
| Weighted average common shares outstanding, diluted | | | 2,430,233 | | | | 2,384,169 | | | 2,414,845 | | | | 2,384,031 | |
Page5of6
VIRGINIA NATIONAL BANKSHARES CORPORATION
Financial Highlights
(dollars in thousands, except per share data)
(Unaudited)
| | At or For the Three Months Ended |
| | December 31, | | September 30, | | June 30, | | March 31, | | December 31, |
| | 2017 | | 2017 | | 2017 | | 2017 | | 2016 |
| Per Common Share Data: | | | | | | | | | | | | | | | | | | | | |
| Net income per weighted average share, basic | | $ | 0.48 | | | $ | 0.73 | | | $ | 0.80 | | | $ | 0.73 | | | $ | 0.63 | |
| Net income per weighted average share, diluted | | $ | 0.47 | | | $ | 0.72 | | | $ | 0.80 | | | $ | 0.72 | | | $ | 0.62 | |
| Weighted average shares outstanding, basic | | | 2,410,680 | | | | 2,401,083 | | | | 2,386,721 | | | | 2,375,798 | | | | 2,368,777 | |
| Weighted average shares outstanding, diluted | | | 2,430,233 | | | | 2,422,048 | | | | 2,409,410 | | | | 2,394,943 | | | | 2,384,169 | |
| Actual shares outstanding | | | 2,410,680 | | | | 2,410,680 | | | | 2,392,011 | | | | 2,381,909 | | | | 2,368,777 | |
| Tangible book value per share at period end | | $ | 26.61 | | | $ | 26.50 | | | $ | 25.98 | | | $ | 25.19 | | | $ | 24.49 | |
| Key Ratios: | | | | | | | | | | | | | | | | | | | | |
| Return on average assets1 | | | 0.73 | % | | | 1.11 | % | | | 1.19 | % | | | 1.14 | % | | | 1.03 | % |
| Return on average equity1 | | | 7.24 | % | | | 10.75 | % | | | 12.33 | % | | | 11.66 | % | | | 9.90 | % |
| Net interest margin (FTE)1,2 | | | 3.79 | % | | | 3.70 | % | | | 3.50 | % | | | 3.54 | % | | | 3.56 | % |
| Efficiency ratio (FTE)3 | | | 57.48 | % | | | 58.63 | % | | | 55.53 | % | | | 60.39 | % | | | 60.05 | % |
| Loan-to-deposit ratio | | | 97.39 | % | | | 98.77 | % | | | 92.91 | % | | | 86.64 | % | | | 91.90 | % |
| Net Interest Income: | | | | | | | | | | | | | | | | | | | | |
| Net interest income | | $ | 5,513 | | | $ | 5,483 | | | $ | 5,327 | | | $ | 5,054 | | | $ | 4,793 | |
| Net interest income (FTE)2 | | $ | 5,556 | | | $ | 5,523 | | | $ | 5,360 | | | $ | 5,085 | | | $ | 4,830 | |
| Capital Ratios: | | | | | | | | | | | | | | | | | | | | |
| Tier 1 leverage ratio | | | 10.55 | % | | | 10.30 | % | | | 9.65 | % | | | 9.84 | % | | | 10.31 | % |
| Total risk-based capital ratio | | | 12.96 | % | | | 13.51 | % | | | 13.09 | % | | | 12.98 | % | | | 12.66 | % |
| Assets and Asset Quality: | | | | | | | | | | | | | | | | | | | | |
| Average Earning Assets | | $ | 581,006 | | | $ | 591,908 | | | $ | 613,992 | | | $ | 582,630 | | | $ | 540,368 | |
| Average Gross Loans | | $ | 499,550 | | | $ | 496,983 | | | $ | 489,806 | | | $ | 481,217 | | | $ | 449,528 | |
| Allowance for loan losses: | | | | | | | | | | | | | | | | | | | | |
| Beginning of period | | $ | 3,824 | | | $ | 3,701 | | | $ | 3,633 | | | $ | 3,688 | | | $ | 3,278 | |
| Provision for (recovery of) loan losses | | | 205 | | | | 168 | | | | 115 | | | | (70 | ) | | | 402 | |
| Charge-offs | | | - | | | | 53 | | | | 58 | | | | - | | | | - | |
| Recoveries | | | (14 | ) | | | (8 | ) | | | (11 | ) | | | (15 | ) | | | (8 | ) |
| Net charge-offs (recoveries) | | | (14 | ) | | | 45 | | | | 47 | | | | (15 | ) | | | (8 | ) |
| End of period | | $ | 4,043 | | | $ | 3,824 | | | $ | 3,701 | | | $ | 3,633 | | | $ | 3,688 | |
| Nonaccrual loans | | $ | 177 | | | $ | 186 | | | $ | 153 | | | $ | 160 | | | $ | 167 | |
| OREO | | | - | | | | - | | | | - | | | | - | | | | - | |
| Total nonperforming assets (NPA) | | $ | 177 | | | $ | 186 | | | $ | 153 | | | $ | 160 | | | $ | 167 | |
| NPA as a % of total assets | | | 0.03 | % | | | 0.03 | % | | | 0.02 | % | | | 0.03 | % | | | 0.03 | % |
| NPA as a % of total loans plus OREO | | | 0.03 | % | | | 0.04 | % | | | 0.03 | % | | | 0.03 | % | | | 0.03 | % |
| Allowance for loan losses to total loans | | | 0.76 | % | | | 0.76 | % | | | 0.75 | % | | | 0.75 | % | | | 0.77 | % |
| Non-accruing loans to total loans | | | 0.03 | % | | | 0.04 | % | | | 0.03 | % | | | 0.03 | % | | | 0.03 | % |
| Net charge-offs (recoveries) to average loans1 | | | -0.01 | % | | | 0.04 | % | | | 0.04 | % | | | -0.01 | % | | | -0.01 | % |
1Ratio is computed on an annualized basis.
2The net interest margin and net interest income are reported on a fully tax equivalent basis (FTE), using a Federal income tax rate of 34%.
3The efficiency ratio is computed as a percentage of noninterest expense divided by the sum of fully tax equivalent (FTE) net interest income and noninterest income. This is a non-GAAP financial measure that management believes provides investors with important information regarding operational efficiency. Management believes such financial information is meaningful to the reader in understanding operating performance, but cautions that such information should not be viewed as a substitute for GAAP. Comparison of our efficiency ratio with those of other companies may not be possible because other companies may calculate them differently.
| Virginia National Bankshares Corporation Contact: | | Tara Y. Harrison |
| | 434.817.8587 |
Page6of6