Free Writing Prospectus Filed Pursuant to Rule 433
File No. 333-177891-04

Free Writing Prospectus
Structural and Collateral Term Sheet
$876,739,752
(Approximate Aggregate Cut-off Date Balance of Mortgage Pool)
$710,778,000
(Approximate Aggregate Principal Balance of Offered Certificates)
WFRBS Commercial Mortgage Trust 2013-C13
as Issuing Entity
RBS Commercial Funding Inc.
as Depositor
Wells Fargo Bank, National Association
The Royal Bank of Scotland
Liberty Island Group I LLC
NCB, FSB
Basis Real Estate Capital II, LLC
C-III Commercial Mortgage LLC
as Sponsors and Mortgage Loan Sellers
Commercial Mortgage Pass-Through Certificates
Series 2013-C13
April 12, 2013
| RBS | WELLS FARGO SECURITIES
| |
Co-Lead Manager and
Co-Bookrunner | Co-Lead Manager and
Co-Bookrunner |
Citigroup
Co-Manager
STATEMENT REGARDING THIS FREE WRITING PROSPECTUS
The depositor has filed a registration statement (including a prospectus) with the Securities and Exchange Commission (“SEC”) (SEC File No. 333-177891) for the offering to which this communication relates. Before you invest, you should read the prospectus in the registration statement and other documents the depositor has filed with the SEC for more complete information about the depositor, the issuing entity and this offering. You may get these documents for free by visiting EDGAR on the SEC Web site at www.sec.gov. Alternatively, the depositor, any underwriter, or any dealer participating in the offering will arrange to send you the prospectus after filing if you request it by calling toll free 1-866-884-2071 (8 a.m. – 5 p.m. EST) or by emailing rbscmbs@rbs.com.
Nothing in this document constitutes an offer to sell or a solicitation to buy securities in any jurisdiction where such offer, solicitation or sale is not permitted. The information contained herein is preliminary as of the date hereof, supersedes any such information previously delivered to you and will be superseded by any information subsequently delivered and ultimately by the final prospectus relating to the securities. These materials are subject to change, completion, supplement or amendment from time to time.
STATEMENT REGARDING ASSUMPTIONS AS TO SECURITIES, PRICING ESTIMATES AND OTHER INFORMATION
The attached information contains certain tables and other statistical analyses (the “Computational Materials”) which have been prepared in reliance upon information furnished by the Mortgage Loan Sellers. Numerous assumptions were used in preparing the Computational Materials, which may or may not be reflected herein. As such, no assurance can be given as to the Computational Materials’ accuracy, appropriateness or completeness in any particular context; or as to whether the Computational Materials and/or the assumptions upon which they are based reflect present market conditions or future market performance. The Computational Materials should not be construed as either projections or predictions or as legal, tax, financial or accounting advice. You should consult your own counsel, accountant and other advisors as to the legal, tax, business, financial and related aspects of a purchase of these securities. Any weighted average lives, yields and principal payment periods shown in the Computational Materials are based on prepayment and/or loss assumptions, and changes in such prepayment and/or loss assumptions may dramatically affect such weighted average lives, yields and principal payment periods. In addition, it is possible that prepayments or losses on the underlying assets will occur at rates higher or lower than the rates shown in the attached Computational Materials. The specific characteristics of the securities may differ from those shown in the Computational Materials due to differences between the final underlying assets and the preliminary underlying assets used in preparing the Computational Materials. The principal amount and designation of any security described in the Computational Materials are subject to change prior to issuance. None of RBS Securities Inc. (“RBSSI”), Wells Fargo Securities, LLC (“WFS”), Citigroup Global Markets Inc. or any of their respective affiliates make any representation or warranty as to the actual rate or timing of payments or losses on any of the underlying assets or the payments or yield on the securities. The information in this presentation is based upon management forecasts and reflects prevailing conditions and management’s views as of this date, all of which are subject to change. In preparing this presentation, we have relied upon and assumed, without independent verification, the accuracy and completeness of all information available from public sources or which was provided to us by or on behalf of the Mortgage Loan Sellers or which was otherwise reviewed by us.
This free writing prospectus contains certain forward-looking statements. If and when included in this free writing prospectus, the words “expects”, “intends”, “anticipates”, “estimates” and analogous expressions and all statements that are not historical facts, including statements about our beliefs or expectations, are intended to identify forward-looking statements. Any forward-looking statements are made subject to risks and uncertainties which could cause actual results to differ materially from those stated. Those risks and uncertainties include, among other things, declines in general economic and business conditions, increased competition, changes in demographics, changes in political and social conditions, regulatory initiatives and changes in customer preferences, many of which are beyond our control and the control of any other person or entity related to this offering. The forward-looking statements made in this free writing prospectus are made as of the date stated on the cover. We have no obligation to update or revise any forward-looking statement.
RBS is a trade name for the investment banking business of RBSSI. Securities, syndicated loan arranging, financial advisory and other investment banking activities are performed by RBSSI and their securities affiliates. Lending, derivatives and other commercial banking activities are performed by The Royal Bank of Scotland plc and their banking affiliates. RBSSI is a member of SIPC, FINRA and the NYSE.
Wells Fargo Securities is the trade name for the capital markets and investment banking services of Wells Fargo & Company and its subsidiaries, including Wells Fargo Securities, LLC, a member of FINRA, NYSE, NFA and SIPC, Wells Fargo Institutional Securities, LLC, a member of FINRA and SIPC, Wells Fargo Prime Services, LLC, a member of FINRA, NFA and SIPC and Wells Fargo Bank, N.A.
IRS CIRCULAR 230 NOTICE
THIS TERM SHEET IS NOT INTENDED OR WRITTEN TO BE USED, AND CANNOT BE USED, FOR THE PURPOSE OF AVOIDING U.S. FEDERAL, STATE OR LOCAL TAX PENALTIES. THIS TERM SHEET IS WRITTEN AND PROVIDED BY THE DEPOSITOR IN CONNECTION WITH THE PROMOTION OR MARKETING BY THE DEPOSITOR AND THE CO-LEAD BOOKRUNNING MANAGERS OF THE TRANSACTION OR MATTERS ADDRESSED HEREIN. INVESTORS SHOULD SEEK ADVICE BASED ON THEIR PARTICULAR CIRCUMSTANCES FROM AN INDEPENDENT TAX ADVISOR.
IMPORTANT NOTICE REGARDING THE OFFERED CERTIFICATES
The offered certificates referred to in these materials and the asset pool backing them are subject to modification or revision (including the possibility that one or more classes of certificates may be split, combined or eliminated at any time prior to issuance or availability of a final prospectus) and are offered on a “when, as and if issued” basis. Prospective investors should understand that, when considering the purchase of the offered certificates, a contract of sale will come into being no sooner than the date on which the relevant class of certificates has been priced and the underwriters have confirmed the allocation of certificates to be made to investors; any “indications of interest” expressed by any prospective investor, and any “soft circles” generated by the underwriters, will not create binding contractual obligations for such prospective investors, on the one hand, or the underwriters, the depositor or any of their respective agents or affiliates, on the other hand.
As a result of the foregoing, a prospective investor may commit to purchase certificates that have characteristics that may change, and each prospective investor is advised that all or a portion of the certificates referred to in these materials may be issued that differ from the characteristics described in these materials. The underwriters’ obligation to sell certificates to any prospective investor is conditioned on the certificates and the transaction having the characteristics described in these materials. If the underwriters determine that a condition is not satisfied in any material respect, such prospective investor will be notified, and neither the depositor nor the underwriters will have any obligation to such prospective investor to deliver any portion of the offered certificates which such prospective investor has committed to purchase, and there will be no liability between the underwriters, the depositor or any of their respective agents or affiliates, on the one hand, and such prospective investor, on the other hand, as a consequence of the non-delivery.
Each prospective investor has requested that the underwriters provide to such prospective investor information in connection with such prospective investor’s consideration of the purchase of the certificates described in these materials. These materials are being provided to each prospective investor for informative purposes only in response to such prospective investor’s specific request. The underwriters described in these materials may from time to time perform investment banking services for, or solicit investment banking business from, any company named in these materials. The underwriters and/or their affiliates or respective employees may from time to time have a long or short position in any security or contract discussed in these materials.
The information contained herein supersedes any previous such information delivered to any prospective investor and will be superseded by information delivered to such prospective investor prior to the time of sale.
IMPORTANT NOTICE RELATING TO AUTOMATICALLY-GENERATED EMAIL DISCLAIMERS
Any legends, disclaimers or other notices that may appear at the bottom of, or attached to, any email communication to which this free writing prospectus is attached relating to (1) these materials not constituting an offer (or a solicitation of an offer), (2) no representation that these materials are accurate or complete and may not be updated or (3) these materials possibly being confidential, are not applicable to these materials and should be disregarded. Such legends, disclaimers or other notices have been automatically generated as a result of these materials having been sent via Bloomberg or another system.
THE INFORMATION IN THIS STRUCTURAL AND COLLATERAL TERM SHEET IS NOT COMPLETE AND MAY BE AMENDED PRIOR TO THE TIME OF SALE. THIS TERM SHEET IS NOT AN OFFER TO SELL THESE SECURITIES AND IT IS NOT A SOLICITATION OF AN OFFER TO BUY THESE SECURITIES IN ANY JURISDICTION WHERE THE OFFER OR SALE IS NOT PERMITTED.
2
| WFRBS Commercial Mortgage Trust 2013-C13 | Issue Characteristics |
| I. | Certificate Structure |
Class | Expected Ratings (Fitch/Moody’s)(1) | Approximate Initial Certificate Principal Balance or Notional Amount(2) | Approx. Initial Credit Support(3) | Pass-Through Rate Description | Weighted Average Life (Years)(4) | Expected Principal Window(4) | Certificate Principal to Value Ratio(5) | Certificate Principal U/W NOI Debt Yield(6) | ||||||||||||||||||||||
| Offered Certificates | ||||||||||||||||||||||||||||||
A-1 | AAA(sf)/Aaa(sf) | $ | 56,222,000 | 30.000 | % | (7) | 2.66 | 06/13 – 03/18 | 31.0 | % | 19.4 | % | ||||||||||||||||||
A-2 | AAA(sf)/Aaa(sf) | $ | 79,549,000 | 30.000 | % | (7) | 4.86 | 03/18 – 04/18 | 31.0 | % | 19.4 | % | ||||||||||||||||||
A-3 | AAA(sf)/Aaa(sf) | $ | 125,000,000 | 30.000 | % | (7) | 9.85 | 02/23 – 03/23 | 31.0 | % | 19.4 | % | ||||||||||||||||||
A-4 | AAA(sf)/Aaa(sf) | $ | 206,479,000 | 30.000 | % | (7) | 9.93 | 03/23 – 04/23 | 31.0 | % | 19.4 | % | ||||||||||||||||||
A-SB | AAA(sf)/Aaa(sf) | $ | 71,467,000 | 30.000 | % | (7) | 7.43 | 04/18 – 02/23 | 31.0 | % | 19.4 | % | ||||||||||||||||||
A-S | AAA(sf)/Aaa(sf) | $ | 90,962,000 | 19.625 | % | (7) | 9.93 | 04/23 – 04/23 | 35.6 | % | 16.9 | % | ||||||||||||||||||
B | AA-(sf)/Aa3(sf) | $ | 51,509,000 | 13.750 | % | (7) | 9.98 | 04/23 – 05/23 | 38.2 | % | 15.7 | % | ||||||||||||||||||
C | A-(sf)/A3(sf) | $ | 29,590,000 | 10.375 | % | (7) | 10.02 | 05/23 – 05/23 | 39.7 | % | 15.1 | % | ||||||||||||||||||
| Non-Offered Certificates | ||||||||||||||||||||||||||||||
A-3FL(8) | AAA(sf)/Aaa(sf)(9) | $ | 75,000,000 | (8) | 30.000 | % | Libor Plus | (10) | 9.85 | 02/23 – 03/23 | 31.0 | % | 19.4 | % | ||||||||||||||||
A-3FX(8) | AAA(sf)/Aaa(sf) | $ | 0 | (8) | 30.000 | % | (7) | 9.85 | 02/23 – 03/23 | 31.0 | % | 19.4 | % | |||||||||||||||||
X-A | AAA(sf)/Aaa(sf) | $ | 704,679,000 | (11) | N/A | Variable | (12) | N/A | N/A | N/A | N/A | |||||||||||||||||||
X-B | A-(sf)/A2(sf) | $ | 81,099,000 | (13) | N/A | Variable | (14) | N/A | N/A | N/A | N/A | |||||||||||||||||||
X-C | NR/NR | $ | 42,741,751 | (15) | N/A | Variable | (16) | N/A | N/A | N/A | N/A | |||||||||||||||||||
D | BBB-(sf)/Baa3(sf) | $ | 32,877,000 | 6.625 | % | (7) | 10.02 | 05/23 – 05/23 | 41.3 | % | 14.5 | % | ||||||||||||||||||
E | BB(sf)/Ba2(sf) | $ | 15,343,000 | 4.875 | % | (7) | 10.02 | 05/23 – 05/23 | 42.1 | % | 14.3 | % | ||||||||||||||||||
F | B(sf)/B2(sf) | $ | 16,439,000 | 3.000 | % | (7) | 10.02 | 05/23 – 05/23 | 42.9 | % | 14.0 | % | ||||||||||||||||||
G | NR/NR | $ | 26,302,751 | 0.000 | % | (7) | 10.02 | 05/23 – 05/23 | 44.2 | % | 13.6 | % | ||||||||||||||||||
Notes:
| (1) | The expected ratings presented are those of Fitch, Inc. (“Fitch”), and Moody’s Investors Service, Inc. (“Moody’s”), which the depositor hired to rate the rated offered certificates. One or more other nationally recognized statistical ratings organizations, as defined in Section 3(a)(62) of the Securities Exchange Act of 1934, as amended (the “Exchange Act”), that were not hired by the depositor may use information they receive pursuant to Rule 17g-5 under the Securities Exchange Act or otherwise to rate or provide market reports and/or published commentary related to the offered certificates. We cannot assure you as to what ratings a non-hired nationally recognized statistical rating organization would assign or that its reports will not express differing, possibly negative, views of the mortgage loans and/or the offered certificates. See “Risk Factors – Risks Related to the Offered Certificates – Nationally Recognized Statistical Rating Organizations May Assign Different Ratings to the Certificates; Ratings of the Certificates Reflect Only the Views of the Applicable Rating Agencies as of the Dates Such Ratings Were Issued; Ratings May Affect ERISA Eligibility; Ratings May be Downgraded” in the free writing prospectus, dated April 12, 2013 (the “Free Writing Prospectus”). |
| (2) | The principal balances and notional amounts set forth in the table are approximate. The actual initial principal balances and notional amounts may be larger or smaller depending on the aggregate cut-off date principal balance of the mortgage loans definitively included in the pool of mortgage loans, which aggregate cut-off date principal balance may be as much as 5% larger or smaller than the amount presented in the Free Writing Prospectus. |
| (3) | The approximate initial credit support with respect to the Class A-1, A-2, A-3, A-3FL, A-3FX, A-4 and A-SB Certificates represents the approximate credit enhancement for the Class A-1, A-2, A-3, A-3FL, A-3FX, A-4 and A-SB Certificates in the aggregate. No class of Certificates will provide any credit support to the Class A-3FL Certificates for any failure by the swap counterparty to make the payment under the related swap contract. |
| (4) | Weighted Average Lives and Expected Principal Windows are calculated based on an assumed prepayment rate of 0% CPR and the “Structuring Assumptions” described on Annex D to the Free Writing Prospectus. |
| (5) | The Certificate Principal to Value Ratio for each Class of Certificates (other than the Class A-1, A-2, A-3, A-3FL, A-3FX, A-4, A-SB, X-A, X-B and X-C Certificates) is calculated by dividing the aggregate principal balance of such class of certificates and all classes of certificates (other than Class X-A, X-B and X-C Certificates) senior to such class by the aggregate appraised value of $1,981,663,318 (calculated as described in the Free Writing Prospectus) of the mortgaged properties securing the mortgage loans (excluding, with respect to the 301 South College Street loan combination, a pro rata portion of the related appraised value allocated to the related companion loan based on its cut-off date principal balance). The Certificate Principal to Value Ratios for each of the Class A-1, A-2, A-3, A-3FL, A-3FX, A-4 and A-SB Certificates are calculated by dividing the aggregate principal balance of the Class A-1, A-2, A-3, A-3FL, A-3FX, A-4 and A-SB Certificates by such aggregate appraised value (excluding, with respect to the 301 South College Street loan combination, a pro rata portion of the related appraised value allocated to the related companion loan based on its cut-off date principal balance). However, excess mortgaged property value associated with a mortgage loan will not be available to offset losses on any other mortgage loan (unless such mortgage loans are cross-collateralized and the cross-collateralization remains in effect). |
| (6) | The Certificate Principal U/W NOI Debt Yield for each Class of Certificates (other than the Class A-1, A-2, A-3, A-3FL, A-3FX, A-4, A-SB, X-A, X-B and X-C Certificates) is calculated by dividing the underwritten net operating income (which excludes, with respect to the 301 South College Street loan combination, a pro rata portion of the related underwritten net operating income allocated to the related companion loan based on its cut-off date principal balance) for the mortgage pool of $118,877,341 (calculated as described in the Free Writing Prospectus) by the aggregate principal balance of such class of certificates and all classes of certificates (other than Class X-A, X-B and X-C Certificates) senior to such class of certificates. The Certificate Principal U/W NOI Debt Yield for each of the Class A-1, A-2, A-3, A-3FL, A-3FX, A-4 and A-SB Certificates is calculated by dividing such mortgage pool underwritten net operating income (which excludes, with respect to the 301 South College Street loan combination, a pro rata portion of the related underwritten net operating income allocated to the related companion loan based on its cut-off date principal balance) by the aggregate principal balance of the Class A-1, A-2, A-3, A-3FL, A-3FX, A-4 and A-SB Certificates. However, cash flow from each mortgaged property supports only the related mortgage loan and will not be available to support any other mortgage loan (unless such mortgage loans are cross-collateralized and the cross-collateralization remains in effect). |
| (7) | The pass-through rates for the Class A-1, A-2, A-3, A-3FX, A-4, A-SB, A-S, B, C, D, E, F and G Certificates and the Class A-3FX Regular Interest in each case will be one of the following: (i) a fixed rate per annum, (ii) the WAC Rate (as defined in the Free Writing Prospectus) for the related distribution date, (iii) a variable rate per annum equal to the lesser of (a) a fixed rate and (b) the WAC Rate for the related distribution date or (iv) a variable rate per annum equal to the WAC Rate for the related distribution date minus a specified percentage. |
| (8) | The Class A-3FL Certificates will evidence a beneficial interest in a grantor trust that includes the Class A-3FX Regular Interest and an interest rate swap contract. Under certain circumstances, holders of the Class A-3FL Certificates may exchange all or a portion of their certificates for a like principal amount of Class A-3FX Certificates having the same pass-through rate as the Class A-3FX Regular Interest. The aggregate principal balance of the Class A-3FL Certificates may be adjusted from time to time as a result of such an exchange. The aggregate principal balance of the Class A-3FX Certificates and Class A-3FL Certificates will at all times equal the principal balance of the Class A-3FX Regular Interest. The principal balance of the Class A-3FX Certificates will initially be $0. |
| (9) | The ratings assigned to the Class A-3FL Certificates reflect only the receipt of interest up to the fixed rate of interest at a rate equal to the applicable pass-through rate for the Class A-3FX Regular Interest. The ratings of Fitch, Inc. and Moody’s Investors Service, Inc. do not address any shortfalls or delays in payment that investors in the Class A-3FL Certificates may experience as a result of the conversion of the pass-through rate on the Class A-3FX Regular |
THE INFORMATION IN THIS STRUCTURAL AND COLLATERAL TERM SHEET IS NOT COMPLETE AND MAY BE AMENDED PRIOR TO THE TIME OF SALE. THIS TERM SHEET IS NOT AN OFFER TO SELL THESE SECURITIES AND IT IS NOT A SOLICITATION OF AN OFFER TO BUY THESE SECURITIES IN ANY JURISDICTION WHERE THE OFFER OR SALE IS NOT PERMITTED.
3
| WFRBS Commercial Mortgage Trust 2013-C13 | Issue Characteristics |
| Interest from a fixed interest rate to a floating interest rate. |
| (10) | The pass-through rate on the Class A-3FL Certificates will be a perannumrate equal to LIBOR plus a specified percentage; provided, however, that under certain circumstances, the pass-through rate on the Class A-3FL Certificates may convert to the pass-through rate applicable to the Class A-3FX Regular Interest. The initial LIBOR rate will be determined two LIBOR business days prior to the Closing Date, and subsequent LIBOR rates for the Class A-3FL Certificates will be determined two LIBOR business days before the start of the related interest accrual period. |
| (11) | The Class X-A Certificates are notional amount certificates. The Notional Amount of the Class X-A Certificates will be equal to the aggregate principal balance of the Class A-1, A-2, A-3, A-4, A-SB and A-S Certificates and the Class A-3FX Regular Interest outstanding from time to time. The Class X-A Certificates will not be entitled to distributions of principal. |
| (12) | The pass-through rate for the Class X-A Certificates for any distribution date will be a perannumrate equal to the excess, if any, of (a) the WAC Rate for the related distribution date, over (b) the weighted average of the pass-through rates on the Class A-1, A-2, A-3, A-4, A-SB and A-S Certificates and the Class A- 3FX Regular Interest for the related distribution date, weighted on the basis of their respective aggregate principal balances outstanding immediately prior to that distribution date. |
| (13) | The Class X-B Certificates are notional amount certificates. The Notional Amount of the Class X-B Certificates will be equal to the aggregate principal balance of the Class B and C Certificates outstanding from time to time. The Class X-B Certificates will not be entitled to distributions of principal. |
| (14) | The pass-through rate for the Class X-B Certificates for any distribution date will be a perannumrate equal to the excess, if any, of (a) the WAC Rate for the related distribution date, over (b) the weighted average of the pass-through rates on the Class B and C Certificates for the related distribution date, weighted on the basis of their respective aggregate principal balances outstanding immediately prior to that distribution date. |
| (15) | The Class X-C Certificates are notional amount certificates. The Notional Amount of the Class X-C Certificates will be equal to the aggregate principal balance of the Class F and G Certificates outstanding from time to time. The Class X-C Certificates will not be entitled to distributions of principal. |
| (16) | The pass-through rate for the Class X-C Certificates for any distribution date will be a perannumrate equal to the excess, if any, of (a) the WAC Rate for the related distribution date, over (b) the weighted average of the pass-through rates on the Class F and G Certificates for the related distribution date, weighted on the basis of their respective aggregate principal balances outstanding immediately prior to that distribution date. |
THE INFORMATION IN THIS STRUCTURAL AND COLLATERAL TERM SHEET IS NOT COMPLETE AND MAY BE AMENDED PRIOR TO THE TIME OF SALE. THIS TERM SHEET IS NOT AN OFFER TO SELL THESE SECURITIES AND IT IS NOT A SOLICITATION OF AN OFFER TO BUY THESE SECURITIES IN ANY JURISDICTION WHERE THE OFFER OR SALE IS NOT PERMITTED.
4
| WFRBS Commercial Mortgage Trust 2013-C13 | Issue Characteristics |
| II. | Transaction Highlights |
Mortgage Loan Sellers:
Mortgage Loan Seller | Number of Mortgage Loans | Number of Mortgaged Properties | Aggregate Cut-off Date Balance | % of Cut-off Date Pool Balance | ||||||||||||
Wells Fargo Bank, National Association | 37 | 53 | $ | 533,017,079 | 60.8 | % | ||||||||||
The Royal Bank of Scotland(1) | 10 | 10 | 121,327,252 | 13.8 | ||||||||||||
Liberty Island Group I LLC | 8 | 8 | 79,693,825 | 9.1 | ||||||||||||
NCB, FSB | 21 | 21 | 60,560,290 | 6.9 | ||||||||||||
Basis Real Estate Capital II, LLC | �� | 8 | 8 | 43,252,366 | 4.9 | |||||||||||
C-III Commercial Mortgage LLC | 11 | 13 | 38,888,939 | 4.4 | ||||||||||||
|
|
|
|
|
|
|
| |||||||||
Total | 95 | 113 | $ | 876,739,752 | 100.0 | % | ||||||||||
|
|
|
|
|
|
|
| |||||||||
| (1) | The mortgage loan seller referred to herein as The Royal Bank of Scotland is comprised of two affiliated companies: The Royal Bank of Scotland plc and RBS Financial Products Inc. With respect to the mortgage loans being sold for deposit into the trust by The Royal Bank of Scotland: (a) 9 mortgage loans, having an aggregate cut-off date principal balance of $112,327,252 and representing approximately 12.8% of the aggregate principal balance of the pool of mortgage loans as of the cut-off date, were originated, and are being sold to the issuing entity, only by The Royal Bank of Scotland plc, and (b) 1 mortgage loan, having an aggregate cut-off date principal balance of $9,000,000 and representing approximately 1.0% of the aggregate principal balance of the pool of mortgage loans as of the cut-off date, was originated, and is being sold to the issuing entity, only by RBS Financial Products Inc. |
Loan Pool:
Cut-off Date Balance: | $ | 876,739,752 | ||
Number of Mortgage Loans: | 95 | |||
Average Cut-off Date Balance per Mortgage Loan: | $ | 9,228,839 | ||
Number of Mortgaged Properties: | 113 | |||
Average Cut-off Date Balance per Mortgaged Property(1): | $ | 7,758,759 | ||
Weighted Average Mortgage Interest Rate: | 4.179 | % | ||
Ten Largest Mortgage Loans as % of Cut-off Date Pool Balance: | 44.7 | % | ||
Weighted Average Original Term to Maturity or ARD (months): | 114 | |||
Weighted Average Remaining Term to Maturity or ARD (months): | 113 | |||
Weighted Average Original Amortization Term (months)(2): | 345 | |||
Weighted Average Remaining Amortization Term (months)(2): | 345 | |||
Weighted Average Seasoning (months): | 1 |
| (1) | Information regarding mortgage loans secured by multiple properties is based on an allocation according to relative appraised values or the allocated loan amounts or property-specific release prices set forth in the related loan documents or such other allocation as the related mortgage loan seller deemed appropriate. |
| (2) | Excludes any mortgage loan that does not amortize. |
Credit Statistics:
Weighted Average U/W Net Cash Flow DSCR(1): | 2.34x | |||
Weighted Average U/W Net Operating Income Debt Yield Ratio(1): | 13.5 | % | ||
Weighted Average Cut-off Date Loan-to-Value Ratio(1): | 59.1 | % | ||
Weighted Average Balloon or ARD Loan-to-Value Ratio(1): | 49.8 | % | ||
% of Mortgage Loans with Additional Subordinate Debt(2): | 5.8 | % | ||
% of Mortgage Loans with Single Tenants(3): | 8.6 | % |
| (1) | With respect to 301 South College Street, loan-to-value ratio, debt service coverage ratio, debt yield and cut-off date balance per square foot calculations include the relatedpari passucompanion loan (unless otherwise stated) in total debt. The information for each mortgaged property that relates to a mortgage loan that is cross-collateralized with other mortgage loans is based upon the principal balance of that mortgage loan, except that the applicable loan-to-value ratio, debt service coverage ratio, debt yield or cut-off date balance per square foot for each such mortgaged property is based upon the ratio, yield or balance (as applicable) for the aggregate indebtedness evidenced by all loans in the group. On an individual basis, without regard to the cross-collateralization feature, any mortgaged property securing a mortgage loan that is part of a cross-collateralized group of mortgage loans may have a higher loan-to-value ratio, lower debt service coverage ratio and/or lower debt yield than is presented herein. Information for each residential cooperative mortgage loan is calculated using underwritten net cash flow for the related residential cooperative property which is the projected net cash flow reflected in the most recent appraisal obtained by or otherwise in the possession of the related mortgage loan seller as of the cut-off date, and the loan-to value ratio information for each residential cooperative mortgage loan is based upon the appraised value of the residential cooperative property determined as if such residential cooperative property is operated as a residential cooperative. See Annex A to the Free Writing Prospectus. Debt service coverage ratio, debt yield and loan-to-value ratio information takes no account of subordinate debt (whether or not secured by the mortgaged property), if any, that is allowed under the terms of any mortgage loan. |
| (2) | Seventeen (17) of the mortgage loans, each of which are secured by residential cooperative properties, currently have in place subordinate secured lines of credit to the related mortgage borrowers that permit future advances (such loans, collectively, the “Subordinate Coop LOCs”). The percentage figure expressed as “% of Mortgage loans with Additional Subordinate Debt” is determined as a percentage of cut-off date principal balance and does not take into account future subordinate debt (whether or not secured by the mortgaged property), if any, that may be permitted under the terms of any mortgage loan or the Pooling and Servicing Agreement. See “Description of the Mortgage Pool – Subordinate and/or Other Financing” and “ – Additional Debt Financing for Mortgage Loans Secured by Residential Cooperatives” in the Free Writing Prospectus. |
| (3) | Excludes mortgage loans that are secured by multiple single-tenant properties with different tenants at such properties. |
THE INFORMATION IN THIS STRUCTURAL AND COLLATERAL TERM SHEET IS NOT COMPLETE AND MAY BE AMENDED PRIOR TO THE TIME OF SALE. THIS TERM SHEET IS NOT AN OFFER TO SELL THESE SECURITIES AND IT IS NOT A SOLICITATION OF AN OFFER TO BUY THESE SECURITIES IN ANY JURISDICTION WHERE THE OFFER OR SALE IS NOT PERMITTED.
5
| WFRBS Commercial Mortgage Trust 2013-C13 | Issue Characteristics |
Loan Structural Features:
Amortization:Based on the Cut-off Date Pool Balance, 86.2% of the mortgage pool (87 mortgage loans) has scheduled amortization, as follows:
54.1% (73 mortgage loans) requires amortization during the entire loan term
32.0% (13 mortgage loans) provides for an interest-only period followed by an amortization period
0.7% (1 mortgage loan) requires amortization during the entire loan initial term followed by hyper-amortization thereafter
Interest-Only: Based on the Cut-off Date Pool Balance, 13.8% of the mortgage pool (8 mortgage loans) provides for interest-only payments during the entire loan term. The Weighted Average Cut-off Date Loan-to-Value Ratio and Weighted Average U/W Net Cash Flow DSCR for those mortgage loans is 46.8% and 4.46x, respectively.
Hard Lockboxes: Based on the Cut-off Date Pool Balance, 37.1% of the mortgage pool (17 mortgage loans) has hard lockboxes in place.
Reserves: The mortgage loans require amounts to be escrowed monthly as follows (excluding any mortgage loans with springing provisions):
Real Estate Taxes: | 82.0 | % of the pool | ||
Insurance Premiums: | 41.5 | % of the pool | ||
Capital Replacements: | 79.0 | % of the pool | ||
TI/LC: | 55.4 | % of the pool(1) |
| (1) | The percentage of Cut-off Date Balance for loans with TI/LC reserves is based on the aggregate principal balance allocable to office, retail, mixed use and industrial properties. |
Call Protection/Defeasance: Based on the Cut-off Date Pool Balance, the mortgage pool has the following call protection and defeasance features:
74.2% of the mortgage pool (67 mortgage loans) features a lockout period, then defeasance only until an open period
9.7% of the mortgage pool (1 mortgage loan) features a lockout period, then defeasance or the greater of a prepayment premium or yield maintenance until an open period
9.2% of the mortgage pool (6 mortgage loans) features a lockout period, then the greater of a prepayment premium or yield maintenance until an open period
6.9% of the mortgage pool (21 mortgage loans) features no lockout period, but requires the greater of a prepayment premium or yield maintenance for a period, then a prepayment premium until an open period
Please refer to Annex A to the Free Writing Prospectus for further description of individual loan call protection.
THE INFORMATION IN THIS STRUCTURAL AND COLLATERAL TERM SHEET IS NOT COMPLETE AND MAY BE AMENDED PRIOR TO THE TIME OF SALE. THIS TERM SHEET IS NOT AN OFFER TO SELL THESE SECURITIES AND IT IS NOT A SOLICITATION OF AN OFFER TO BUY THESE SECURITIES IN ANY JURISDICTION WHERE THE OFFER OR SALE IS NOT PERMITTED.
6
| WFRBS Commercial Mortgage Trust 2013-C13 | Issue Characteristics |
III. | Issue Characteristics | |||
| Securities Offered: | $710,778,000 approximate monthly pay, multi-class, commercial mortgage REMIC pass-through certificates consisting of eight classes (Classes A-1, A-2, A-3, A-4, A-SB, A-S, B and C), which are offered pursuant to a registration statement filed with the SEC. | |||
| Mortgage Loan Sellers: | Wells Fargo Bank, National Association (“WFB”); The Royal Bank of Scotland (“RBS”); Liberty Island Group I LLC (“LIG I”); NCB, FSB; Basis Real Estate Capital II, LLC (“Basis”) and C-III Commercial Mortgage LLC (“CIIICM”) | |||
| Co-lead Bookrunning Managers: | RBS Securities Inc. and Wells Fargo Securities, LLC | |||
| Co-Manager: | Citigroup Global Markets Inc. | |||
| Rating Agencies: | Fitch, Inc. and Moody’s Investors Service, Inc. | |||
| Master Servicers: | Wells Fargo Bank, National Association and NCB, FSB | |||
| Special Servicers: | LNR Partners, LLC and NCB, FSB | |||
| Certificate Administrator: | Wells Fargo Bank, National Association | |||
| Trustee: | U.S. Bank National Association | |||
| Trust Advisor: | Trimont Real Estate Advisors, Inc. | |||
| Cut-off Date: | The Cut-off Date with respect to each mortgage loan is the due date for the monthly debt service payment that is due in May 2013 (or, in the case of any mortgage loan that has its first due date in June 2013, the date that would have been its due date in May 2013 under the terms of that mortgage loan if a monthly debt service payment were scheduled to be due in that month). | |||
| Expected Closing Date: | On or about May 9, 2013. | |||
| Determination Dates: | The 11th day of each month (or if that day is not a business day, the next succeeding business day), commencing in June 2013. | |||
| Distribution Dates: | The fourth business day following the Determination Date in each month, commencing in June 2013. | |||
| Rated Final Distribution Date: | The Distribution Date in May 2045. | |||
| Interest Accrual Period: | With respect to any Distribution Date, the calendar month preceding the month in which such Distribution Date occurs. | |||
| Day Count: | The Offered Certificates will accrue interest on a 30/360 basis. | |||
| Minimum Denominations: | $10,000 for each Class of Offered Certificates. Investments may also be made in any whole dollar denomination in excess of the applicable minimum denomination. | |||
| Clean-up Call: | 1% | |||
| Delivery: | DTC, Euroclear and Clearstream Banking | |||
| ERISA/SMMEA Status: | Each Class of Offered Certificates is expected to be eligible for exemptive relief under ERISA. No Class of Offered Certificates will be SMMEA eligible. | |||
| Risk Factors: | THE CERTIFICATES INVOLVE CERTAIN RISKS AND MAY NOT BE SUITABLE FOR ALL INVESTORS. SEE THE “RISK FACTORS” SECTION OF THE FREE WRITING PROSPECTUS. | |||
| Bond Analytics Information: | The Certificate Administrator will be authorized to make distribution date settlements, CREFC reports and certain supplemental reports (other than confidential information) available to certain financial modeling and data provision services, including Bloomberg Financial Markets L.P., Trepp LLC, Intex Solutions, Inc., Markit Group Limited, Interactive Data Corp. and BlackRock Financial Management Inc. | |||
THE INFORMATION IN THIS STRUCTURAL AND COLLATERAL TERM SHEET IS NOT COMPLETE AND MAY BE AMENDED PRIOR TO THE TIME OF SALE. THIS TERM SHEET IS NOT AN OFFER TO SELL THESE SECURITIES AND IT IS NOT A SOLICITATION OF AN OFFER TO BUY THESE SECURITIES IN ANY JURISDICTION WHERE THE OFFER OR SALE IS NOT PERMITTED.
7
| WFRBS Commercial Mortgage Trust 2013-C13 | Characteristics of the Mortgage Pool |
| IV. | Characteristics of the Mortgage Pool(1) |
| A. | Ten Largest Mortgage Loans |
Mortgage | Mortgage Loan Name | City | State | Number of Mortgage Loans / Mortgaged Properties | Mortgage Loan Cut- off Date Balance ($) | % of Cut- off Date Pool Balance (%) | Property Type | Number of SF, Rooms or Pads | Cut-off Date Balance Per SF, Room or Pad($) | Cut-off Date LTV Ratio (%) | Balloon or ARD LTV Ratio (%) | U/W NCF DSCR (x) | U/W NOI Debt Yield (%) | |||||||||||||||||||||||||||||
WFB | 188 Spear Street and 208 Utah Street | San Francisco | CA | 1 / 2 | $ | 87,000,000 | 9.9 | % | Office | 291,549 | $ | 298 | 57.0 | % | 47.7 | % | 1.61x | 9.7 | % | |||||||||||||||||||||||
WFB | 301 South College Street | Charlotte | NC | 1 / 1 | 85,000,000 | 9.7 | Office | 988,646 | 177 | 70.0 | 63.5 | 1.80 | 10.6 | |||||||||||||||||||||||||||||
WFB | GSA Portfolio | Various | Various | 1 / 14 | 50,000,000 | 5.7 | Various | 341,412 | 146 | 52.7 | 52.7 | 2.51 | 11.7 | |||||||||||||||||||||||||||||
WFB | 825-845 Lincoln Road | Miami Beach | FL | 1 / 1 | 30,000,000 | 3.4 | Retail | 38,843 | 772 | 45.3 | 45.3 | 2.97 | 12.5 | |||||||||||||||||||||||||||||
RBS | Hampton Inn & Suites Oceanfront | Myrtle Beach | SC | 1 / 1 | 29,947,006 | 3.4 | Hospitality | 227 | 131,925 | 63.7 | 47.1 | 1.56 | 12.0 | |||||||||||||||||||||||||||||
RBS | Ashford Place Apartments | West Monroe | LA | 1 / 1 | 24,575,000 | 2.8 | Multifamily | 338 | 72,707 | 74.5 | 62.2 | 1.55 | 9.4 | |||||||||||||||||||||||||||||
LIG I | Blue Diamond Ranch | Las Vegas | NV | 1 / 1 | 22,970,041 | 2.6 | Retail | 104,450 | 220 | 59.6 | 48.3 | 1.56 | 10.0 | |||||||||||||||||||||||||||||
WFB | Bimbo Bakeries Distribution Center | Maspeth | NY | 1 / 1 | 22,500,000 | 2.6 | Industrial | 56,966 | 395 | 57.7 | 57.7 | 2.72 | 10.6 | |||||||||||||||||||||||||||||
WFB | Hampton Inn & Suites – Beale Street | Memphis | TN | 1 / 1 | 22,415,761 | 2.6 | Hospitality | 144 | 155,665 | 67.9 | 59.6 | 1.78 | 12.6 | |||||||||||||||||||||||||||||
WFB | Southport Commons | Indianapolis | IN | 1 / 1 | 17,118,390 | 2.0 | Retail | 200,056 | 86 | 71.9 | 52.6 | 1.44 | 10.5 | |||||||||||||||||||||||||||||
Top Three Total/Weighted Average | 3 / 17 | $ | 222,000,000 | 25.3 | % | 61.0 | % | 54.9 | % | 1.89x | 10.5 | % | ||||||||||||||||||||||||||||||
Top Five Total/Weighted Average | 5 / 19 | $ | 281,947,006 | 32.2 | % | 59.6 | % | 53.0 | % | 1.97x | 10.9 | % | ||||||||||||||||||||||||||||||
Top Ten Total/Weighted Average | 10 / 24 | $ | 391,526,199 | 44.7 | % | 61.5 | % | 54.0 | % | 1.93x | 10.8 | % | ||||||||||||||||||||||||||||||
Non-Top Ten Total/Weighted Average | 85 / 89 | $ | 485,213,553 | 55.3 | % | 57.2 | % | 46.4 | % | 2.67x | 15.8 | % | ||||||||||||||||||||||||||||||
| (1) | With respect to 301 South College Street, Cut-off Date Balance per square foot, loan-to-value ratio, debt service coverage ratio and debt yield calculations include the relatedpari passu companion loan (unless otherwise stated) in total debt. |
| B. | Summary ofPari Passu Split Loan Structures |
Property Name | Mortgage Loan Seller | Related Notes in Loan Group (Original Balance) | Holder of Note | Whether Note is Lead Servicing for the Entire Loan Combination | Current Master Servicer Under Related | Current Special Servicer Under Related | ||||||||||||
301 South College Street | WFB | $ | 85,000,000 | WFRBS 2013-C13 | No | Wells Fargo Bank, National Association | LNR Partners, LLC | |||||||||||
| WFB | $ | 90,000,000 | (1) | (2) | TBD | TBD | ||||||||||||
| (1) | The relatedpari passu companion loan is currently held by the mortgage loan seller for the mortgage loan included in the WFRBS 2013-C13 trust. |
| (2) | The 301 South College Street loan combination will be serviced under the WFRBS 2013-C13 pooling and servicing agreement until the securitization of the relatedpari passu companion loan, after which such loan combination will be serviced under the pooling and servicing agreement related to the securitization of thatpari passu companion loan. The master servicer and special servicer under the latter pooling and servicing agreement will be identified in a notice, report or statement to holders of the WFRBS 2013-C13 certificates after the securitization of the 301 South College Streetpari passu companion loan. |
THE INFORMATION IN THIS STRUCTURAL AND COLLATERAL TERM SHEET IS NOT COMPLETE AND MAY BE AMENDED PRIOR TO THE TIME OF SALE. THIS TERM SHEET IS NOT AN OFFER TO SELL THESE SECURITIES AND IT IS NOT A SOLICITATION OF AN OFFER TO BUY THESE SECURITIES IN ANY JURISDICTION WHERE THE OFFER OR SALE IS NOT PERMITTED.
8
| WFRBS Commercial Mortgage Trust 2013-C13 | Characteristics of the Mortgage Pool |
| C. | Previous Securitization History(1) |
Loan No. | Mortgage Loan Seller | Mortgage Loan or | City | State | Property Type | Mortgage Loan or Mortgaged Property Cut-off Date Balance ($) | % of Cut-off Date Pool Balance (%) | Previous | ||||||||||||||
| 4 | WFB | 825-845 Lincoln Road | Miami Beach | FL | Retail | $ | 30,000,000 | 3.4 | % | WBCMT 2003-C5 | ||||||||||||
| 10 | WFB | Southport Commons | Indianapolis | IN | Retail | 17,118,390 | 2.0 | GCCFC 2003-C1 | ||||||||||||||
| 11 | WFB | Merrick Commons | Merrick | NY | Retail | 16,474,928 | 1.9 | GECMC 2002-3A | ||||||||||||||
| 16 | RBS | Water Tower | Portland | OR | Mixed Use | 12,583,305 | 1.4 | MLMT 2004-BPC1 | ||||||||||||||
| 19 | WFB | Simi Valley Promenade | Simi Valley | CA | Retail | 11,834,395 | 1.3 | LBUBS 2004-C4 | ||||||||||||||
| 21 | RBS | Garwood Plaza | Garwood | NJ | Retail | 11,600,000 | 1.3 | JPMCC 2003-CB7; JPMCC 2003-LN1 | ||||||||||||||
| 25 | CIIICM | Bit O Home MHC | Santa Ana | CA | Manufactured Housing Community | 4,644,128 | 0.5 | WBCMT 2003-C5 | ||||||||||||||
| 26 | CIIICM | Liberty MHC | Santa Ana | CA | Manufactured Housing Community | 4,644,128 | 0.5 | WBCMT 2003-C5 | ||||||||||||||
| 38 | CIIICM | Buckhorn Ranch Estates MHC | Des Plaines | IL | Manufactured Housing Community | 6,991,112 | 0.8 | JPMCC 2003-PM1A | ||||||||||||||
| 42 | NCB, FSB | 1523 Central Park Avenue Owners, Inc. | Yonkers | NY | Multifamily | 6,519,382 | 0.7 | MSC 2005 IQ-9 | ||||||||||||||
| 52 | NCB, FSB | Kensington Gate Owners Incorporated | Great Neck | NY | Multifamily | 5,265,000 | 0.6 | MSC 2005 IQ-9 | ||||||||||||||
| 60 | NCB, FSB | 21 N. Chatsworth Owners Corp. | Larchmont | NY | Multifamily | 4,093,997 | 0.5 | CSFB 2003-C3 | ||||||||||||||
| 66 | NCB, FSB | 2035 Central Park Ave. Owners Corp. | Yonkers | NY | Multifamily | 3,244,691 | 0.4 | CSFB 2004-C4 | ||||||||||||||
| 67 | NCB, FSB | 632 Palmer Road Owners, Inc. | Yonkers | NY | Multifamily | 3,094,950 | 0.4 | CSFB 2004-C4 | ||||||||||||||
| 69 | CIIICM | Country Breeze MHC | Yuma | AZ | Manufactured Housing Community | 3,015,832 | 0.3 | CSFB 2003-C3 | ||||||||||||||
| 70 | NCB, FSB | Caribbean House, Inc. | Edgewater | NJ | Multifamily | 2,991,594 | 0.3 | CSFB 2003-C3 | ||||||||||||||
| 71 | NCB, FSB | 325 House Inc. | New York | NY | Multifamily | 2,845,623 | 0.3 | CSFB 2004-C4 | ||||||||||||||
| 72 | NCB, FSB | Mutual Housing Association, Inc. | Bronx | NY | Multifamily | 2,796,762 | 0.3 | CSFB 2004-C4 | ||||||||||||||
| 73 | NCB, FSB | Georgian House Owners Corp. | Kew Gardens | NY | Multifamily | 2,795,857 | 0.3 | CSFB 2003-C3 | ||||||||||||||
| 80 | WFB | Shreveport Plaza | Shreveport | LA | Retail | 2,294,595 | 0.3 | GECMC 2003-C1 | ||||||||||||||
| 83 | NCB, FSB | 51 West 81stStreet Corp. | New York | NY | Multifamily | 2,000,000 | 0.2 | CSFB 2004-C4 | ||||||||||||||
| 84 | NCB, FSB | 110-34 73rdOwners Corp. | Forest Hills | NY | Multifamily | 1,897,253 | 0.2 | MSC 2005 IQ-9 | ||||||||||||||
| 87 | CIIICM | Coachella MHC | Coachella | CA | Manufactured Housing Community | 1,647,116 | 0.2 | WBCMT 2003-C5 | ||||||||||||||
| 89 | NCB, FSB | Claridge Apartment Corporation | Great Neck | NY | Multifamily | 1,593,608 | 0.2 | MSC 2003 IQ-6 | ||||||||||||||
| 90 | NCB, FSB | Fountain Gardens Owners Corp. | Bronx | NY | Multifamily | 1,547,525 | 0.2 | CSFB 2004-C1 | ||||||||||||||
| 94 | NCB, FSB | 120-10-12 85thAve. Owners Corp. | Kew Gardens | NY | Multifamily | 1,248,240 | 0.1 | MSC 2005 IQ-9 | ||||||||||||||
|
|
|
| |||||||||||||||||||
| Total | $ | 164,782,411 | 18.8 | % | ||||||||||||||||||
|
|
|
| |||||||||||||||||||
| (1) | The table above represents the most recent securitization with respect to the mortgaged property securing the related mortgage loan, based on information provided by the related borrower or obtained through searches of a third-party database. While the above mortgage loans may have been securitized multiple times in prior transactions, mortgage loans are only listed in the above chart if the mortgage loan paid off a mortgage loan in another securitization. The information has not otherwise been confirmed by the mortgage loan sellers. |
THE INFORMATION IN THIS STRUCTURAL AND COLLATERAL TERM SHEET IS NOT COMPLETE AND MAY BE AMENDED PRIOR TO THE TIME OF SALE. THIS TERM SHEET IS NOT AN OFFER TO SELL THESE SECURITIES AND IT IS NOT A SOLICITATION OF AN OFFER TO BUY THESE SECURITIES IN ANY JURISDICTION WHERE THE OFFER OR SALE IS NOT PERMITTED.
9
| WFRBS Commercial Mortgage Trust 2013-C13 | Characteristics of the Mortgage Pool |
| D. | Mortgage Loans with Scheduled Balloon Payments and Related Classes |
Class A-2(1)
Loan | Mortgage Loan Seller | Mortgage Loan Name | State | Property Type | Mortgage Loan Cut- off Date Balance ($) | % of Cut-off Date Pool Balance (%) | Mortgage Loan Balance at Maturity ($) | % of Class A-2 Certificate Principal Balance (%)(2) | SF/ Rooms/ Pads | Loan per SF/ Room/ Pad ($) | U/W NCF DSCR (x) | U/W NOI Debt Yield (%) | Cut-off Date LTV Ratio (%) | Balloon LTV Ratio (%) | Rem. IO Period (mos.) | Rem. Term to Maturity (mos.) | ||||||||||||||||||||||||||||||||||||||||
| 9 | WFB | Hampton Inn & Suites – Beale Street | TN | Hospitality | $ | 22,415,761 | 2.6 | % | $ | 19,692,550 | 24.8 | % | 144 | $ | 155,665 | 1.78x | 12.6 | % | 67.9 | % | 59.6 | % | 0 | 58 | ||||||||||||||||||||||||||||||||
| 13 | WFB | The Henry – Autograph Collection by Marriott | MI | Hospitality | 14,472,723 | 1.7 | 12,727,684 | 16.0 | 308 | 46,989 | 2.00 | 17.6 | 39.9 | 35.1 | 0 | 59 | ||||||||||||||||||||||||||||||||||||||||
| 15 | WFB | Hampton Inn & Suites – Atlanta | GA | Hospitality | 13,600,000 | 1.6 | 12,280,293 | 15.4 | 119 | 114,286 | 1.78 | 12.8 | 67.0 | 60.5 | 10 | 58 | ||||||||||||||||||||||||||||||||||||||||
| 23 | WFB | Hilton Garden Inn – Baton Rouge | LA | Hospitality | 9,800,000 | 1.1 | 8,849,035 | 11.1 | 131 | 74,809 | 1.77 | 13.0 | 63.2 | 57.1 | 10 | 58 | ||||||||||||||||||||||||||||||||||||||||
| 24 | WFB | Hampton Inn – Birmingham | AL | Hospitality | 9,400,000 | 1.1 | 8,487,849 | 10.7 | 133 | 70,677 | 1.75 | 12.6 | 65.8 | 59.5 | 10 | 58 | ||||||||||||||||||||||||||||||||||||||||
| 27 | WFB | Hampton Inn & Suites – Legacy Park | TX | Hospitality | 9,200,000 | 1.0 | 8,307,257 | 10.4 | 105 | 87,619 | 1.74 | 12.5 | 68.1 | 61.5 | 10 | 58 | ||||||||||||||||||||||||||||||||||||||||
| 34 | LIG I | Sheridan Building | PA | Office | 7,479,751 | 0.9 | 6,822,883 | 8.6 | 97,456 | 77 | 1.62 | 11.8 | 69.3 | 63.2 | 0 | 58 | ||||||||||||||||||||||||||||||||||||||||
|
|
|
|
|
|
|
|
|
|
|
|
|
|
|
|
|
|
|
| |||||||||||||||||||||||||||||||||||||
Total/Weighted Average | $ | 86,368,235 | 9.9 | % | $ | 77,167,551 | 97.0 | % | 1.79x | 13.4 | % | 62.4 | % | 55.9 | % | 5 | 58 | |||||||||||||||||||||||||||||||||||||||
|
|
|
|
|
|
|
|
|
|
|
|
|
|
|
|
|
|
|
| |||||||||||||||||||||||||||||||||||||
| (1) | The table above presents the mortgage loans whose balloon payments would be applied to pay down the principal balance of the Class A-2 Certificates, assuming a 0% CPR and applying the “Structuring Assumptions” described in the Free Writing Prospectus, including the assumptions that (i) none of the mortgage loans in the pool experience prepayments, defaults or losses; (ii) there are no extensions of maturity dates of any mortgage loans in the pool; and (iii) each mortgage loan in the pool is paid in full on its stated maturity date. Each class of Certificates, including the Class A-2 Certificates, evidences undivided ownership interests in the entire pool of mortgage loans. |
| (2) | Reflects the percentage of the Mortgage Loan Balance at Maturity divided by the initial Class A-2 Certificate Principal Balance. |
THE INFORMATION IN THIS STRUCTURAL AND COLLATERAL TERM SHEET IS NOT COMPLETE AND MAY BE AMENDED PRIOR TO THE TIME OF SALE. THIS TERM SHEET IS NOT AN OFFER TO SELL THESE SECURITIES AND IT IS NOT A SOLICITATION OF AN OFFER TO BUY THESE SECURITIES IN ANY JURISDICTION WHERE THE OFFER OR SALE IS NOT PERMITTED.
10
| WFRBS Commercial Mortgage Trust 2013-C13 | Characteristics of the Mortgage Pool |
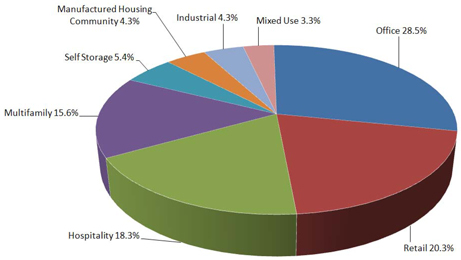
| E. | Property Type Distribution(1) |
Property Type | Number of Mortgaged Properties | Aggregate Cut-off Date Balance ($) | % of Cut-off Date Balance (%) | Weighted Average Cut-off Date LTV Ratio (%) | Weighted Average Balloon or ARD LTV Ratio (%) | Weighted Average U/W NCF DSCR (x) | Weighted Average U/W NOI Debt Yield (%) | Weighted Average U/W NCF Debt Yield (%) | Weighted Average Mortgage Rate (%) | |||||||||||||||||||||||||||
Office | 22 | $ | 249,616,614 | 28.5 | % | 62.5 | % | 55.5 | % | 1.83x | 10.6 | % | 9.8 | % | 3.955 | % | ||||||||||||||||||||
CBD | 4 | 179,479,751 | 20.5 | 63.7 | 55.8 | 1.70 | 10.2 | 9.5 | 3.842 | |||||||||||||||||||||||||||
Suburban | 17 | 67,589,718 | 7.7 | 59.4 | 54.5 | 2.20 | 11.5 | 10.3 | 4.201 | |||||||||||||||||||||||||||
Medical | 1 | 2,547,145 | 0.3 | 64.5 | 53.7 | 1.60 | 12.4 | 10.8 | 5.380 | |||||||||||||||||||||||||||
Retail | 16 | 178,067,400 | 20.3 | 62.5 | 51.3 | 1.79 | 10.6 | 9.9 | 4.277 | |||||||||||||||||||||||||||
Anchored | 9 | 115,576,602 | 13.2 | 65.6 | 52.0 | 1.56 | 10.3 | 9.4 | 4.288 | |||||||||||||||||||||||||||
Unanchored | 1 | 30,000,000 | 3.4 | 45.3 | 45.3 | 2.97 | 12.5 | 12.0 | 3.990 | |||||||||||||||||||||||||||
Shadow Anchored(2) | 5 | 29,700,401 | 3.4 | 67.5 | 55.2 | 1.53 | 10.2 | 9.4 | 4.444 | |||||||||||||||||||||||||||
Single Tenant | 1 | 2,790,397 | 0.3 | 64.9 | 48.8 | 1.42 | 10.5 | 10.1 | 5.130 | |||||||||||||||||||||||||||
Hospitality | 14 | 160,657,431 | 18.3 | 62.8 | 50.8 | 1.76 | 13.5 | 11.8 | 4.424 | |||||||||||||||||||||||||||
Limited Service | 9 | 115,940,206 | 13.2 | 65.6 | 53.3 | 1.69 | 12.5 | 11.1 | 4.395 | |||||||||||||||||||||||||||
Full Service | 3 | 31,160,964 | 3.6 | 52.5 | 44.8 | 1.85 | 15.0 | 12.1 | 4.344 | |||||||||||||||||||||||||||
Extended Stay | 2 | 13,556,261 | 1.5 | 63.1 | 43.5 | 2.19 | 18.1 | 16.4 | 4.855 | |||||||||||||||||||||||||||
Multifamily | 30 | 136,518,405 | 15.6 | 42.2 | 34.6 | 5.05 | 25.6 | 25.2 | 4.045 | |||||||||||||||||||||||||||
Garden | 8 | 69,981,455 | 8.0 | 64.0 | 52.2 | 1.82 | 11.2 | 10.6 | 4.129 | |||||||||||||||||||||||||||
Cooperative | 21 | 60,560,290 | 6.9 | 15.0 | 12.8 | 9.13 | 43.6 | 43.6 | 3.872 | |||||||||||||||||||||||||||
High Rise | 1 | 5,976,660 | 0.7 | 61.6 | 50.5 | 1.39 | 9.8 | 8.8 | 4.800 | |||||||||||||||||||||||||||
Self Storage | 12 | 47,243,236 | 5.4 | 60.0 | 48.3 | 1.70 | 10.8 | 10.5 | 4.497 | |||||||||||||||||||||||||||
Self Storage | 12 | 47,243,236 | 5.4 | 60.0 | 48.3 | 1.70 | 10.8 | 10.5 | 4.497 | |||||||||||||||||||||||||||
Manufactured Housing Community | 11 | 37,917,594 | 4.3 | 58.9 | 47.3 | 1.89 | 11.9 | 11.7 | 4.520 | |||||||||||||||||||||||||||
Manufactured Housing Community | 11 | 37,917,594 | 4.3 | 58.9 | 47.3 | 1.89 | 11.9 | 11.7 | 4.520 | |||||||||||||||||||||||||||
Industrial | 4 | 37,900,000 | 4.3 | 62.7 | 56.7 | 2.33 | 10.6 | 10.3 | 3.820 | |||||||||||||||||||||||||||
Warehouse | 4 | 37,900,000 | 4.3 | 62.7 | 56.7 | 2.33 | 10.6 | 10.3 | 3.820 | |||||||||||||||||||||||||||
Mixed Use | 4 | 28,819,072 | 3.3 | 61.3 | 53.9 | 2.04 | 11.2 | 10.0 | 4.289 | |||||||||||||||||||||||||||
Office/Retail | 3 | 22,219,072 | 2.5 | 63.9 | 54.2 | 1.91 | 11.1 | 9.8 | 4.331 | |||||||||||||||||||||||||||
Office/Industrial | 1 | 6,600,000 | 0.8 | 52.7 | 52.7 | 2.51 | 11.7 | 10.6 | 4.150 | |||||||||||||||||||||||||||
|
|
|
|
|
|
|
|
|
|
|
|
|
|
|
|
|
| |||||||||||||||||||
Total/Weighted Average | 113 | $ | 876,739,752 | 100.0 | % | 59.1 | % | 49.8 | % | 2.34x | 13.5 | % | 12.7 | % | 4.179 | % | ||||||||||||||||||||
|
|
|
|
|
|
|
|
|
|
|
|
|
|
|
|
|
| |||||||||||||||||||
| (1) | Because this table presents information relating to the mortgaged properties and not the mortgage loans, (a) the information for mortgage loans secured by more than one mortgaged property (other than through cross-collateralization with other mortgage loans) is based on allocated amounts (allocating the mortgage loan principal balance to each of those properties according to the relative appraised values of the mortgaged properties or the allocated loan amounts or property-specific release prices set forth in the related mortgage loan documents or such other allocation as the related mortgage loan seller deemed appropriate), and (b) the information for each mortgaged property that relates to a mortgage loan that is cross-collateralized with other mortgage loans is based upon the principal balance of that mortgage loan, except that the applicable loan-to-value ratio, debt service coverage ratio or debt yield for each such mortgaged property is based upon the ratio or yield (as applicable) for the aggregate indebtedness evidenced by all loans in the group. On an individual basis, without regard to the cross-collateralization feature, any mortgaged property securing a mortgage loan that is part of a cross-collateralized group of mortgage loans may have a higher loan-to-value ratio, lower debt service coverage ratio and/or lower debt yield than is presented herein. For mortgaged properties securing residential cooperative mortgage loans, the debt service coverage ratio or debt yield for each such mortgaged property are calculated using underwritten net cash flow for the related residential cooperative property which is the projected net cash flow reflected in the most recent appraisal obtained by or otherwise in the possession of the related mortgage loan seller as of the cut-off date, and the loan-to-value ratio is calculated based upon the appraised value of the residential cooperative property determined as if such residential cooperative property is operated as a residential cooperative. Debt service coverage ratio, debt yield and loan-to-value ratio information takes no account of subordinate debt (whether or not secured by the mortgaged property), if any, that is allowed under the terms of any mortgage loan. With respect to 301 South College Street, loan-to-value ratio, debt service coverage ratio and debt yield calculations include the relatedpari passucompanion loan (unless otherwise stated) in total debt. |
| (2) | A mortgaged property is classified as shadow anchored if it is located in close proximity to an anchored retail property. |
THE INFORMATION IN THIS STRUCTURAL AND COLLATERAL TERM SHEET IS NOT COMPLETE AND MAY BE AMENDED PRIOR TO THE TIME OF SALE. THIS TERM SHEET IS NOT AN OFFER TO SELL THESE SECURITIES AND IT IS NOT A SOLICITATION OF AN OFFER TO BUY THESE SECURITIES IN ANY JURISDICTION WHERE THE OFFER OR SALE IS NOT PERMITTED.
11
| WFRBS Commercial Mortgage Trust 2013-C13 | Characteristics of the Mortgage Pool |
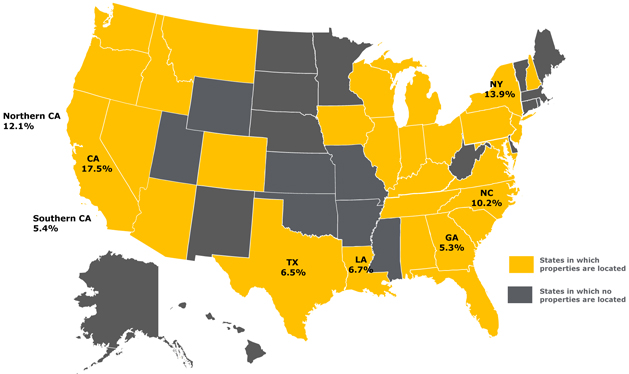
| F. | Geographic Distribution(1)(2) |
Location(3) | Number of Mortgaged Properties | Aggregate Cut-off Date Balance ($) | % of Cut-off Date Balance | Weighted Average Cut-off Date LTV Ratio (%) | Weighted Average Balloon or ARD LTV Ratio (%) | Weighted Average U/W NCF DSCR (x) | Weighted Average U/W NOI Debt Yield (%) | Weighted Average U/W NCF Debt Yield (%) | Weighted Average Mortgage Rate (%) | |||||||||||||||||||||||||||
California | 15 | $ | 153,563,410 | 17.5 | % | 58.9 | % | 48.4 | % | 1.65x | 10.2 | % | 9.6 | % | 4.010 | % | ||||||||||||||||||||
Northern | 6 | 106,193,219 | 12.1 | 59.0 | 48.6 | 1.63 | 9.9 | 9.1 | 3.765 | |||||||||||||||||||||||||||
Southern | 9 | 47,370,191 | 5.4 | 58.7 | 47.8 | 1.70 | 10.9 | 10.5 | 4.558 | |||||||||||||||||||||||||||
New York | 27 | 121,752,152 | 13.9 | 36.5 | 32.2 | 5.63 | 27.1 | 26.8 | 3.962 | |||||||||||||||||||||||||||
North Carolina | 2 | 89,800,000 | 10.2 | 69.1 | 62.9 | 1.84 | 10.7 | 10.2 | 3.946 | |||||||||||||||||||||||||||
Louisiana | 7 | 58,899,595 | 6.7 | 68.0 | 58.2 | 1.74 | 10.9 | 10.1 | 4.205 | |||||||||||||||||||||||||||
Texas | 10 | 57,284,591 | 6.5 | 66.3 | 53.9 | 1.85 | 13.0 | 11.7 | 4.412 | |||||||||||||||||||||||||||
Georgia | 4 | 46,050,000 | 5.3 | 66.9 | 53.7 | 1.73 | 12.3 | 10.9 | 4.250 | |||||||||||||||||||||||||||
Other States(4) | 48 | 349,390,004 | 39.9 | 60.8 | 50.6 | 1.88 | 11.7 | 10.6 | 4.337 | |||||||||||||||||||||||||||
|
|
|
|
|
|
|
|
|
|
|
|
|
|
|
|
|
| |||||||||||||||||||
Total/Weighted Average | 113 | $ | 876,739,752 | 100.0 | % | 59.1 | % | 49.8 | % | 2.34x | 13.5 | % | 12.7 | % | 4.179 | % | ||||||||||||||||||||
|
|
|
|
|
|
|
|
|
|
|
|
|
|
|
|
|
| |||||||||||||||||||
| (1) | The Mortgaged Properties are located in 29 states. |
| (2) | Because this table presents information relating to the mortgaged properties and not the mortgage loans, (a) the information for mortgage loans secured by more than one mortgaged property (other than through cross-collateralization with other mortgage loans) is based on allocated amounts (allocating the mortgage loan principal balance to each of those properties according to the relative appraised values of the mortgaged properties or the allocated loan amounts or property-specific release prices set forth in the related mortgage loan documents or such other allocation as the related mortgage loan seller deemed appropriate), and (b) the information for each mortgaged property that relates to a mortgage loan that is cross-collateralized with other mortgage loans is based upon the principal balance of that mortgage loan, except that the applicable loan-to-value ratio, debt service coverage ratio or debt yield for each such mortgaged property is based upon the ratio or yield (as applicable) for the aggregate indebtedness evidenced by all loans in the group. On an individual basis, without regard to the cross-collateralization feature, any mortgaged property securing a mortgage loan that is part of a cross-collateralized group of mortgage loans may have a higher loan-to-value ratio, lower debt service coverage ratio and/or lower debt yield than is presented herein. For mortgaged properties securing residential cooperative mortgage loans, the debt service coverage ratio or debt yield for each such mortgaged property are calculated using underwritten net cash flow for the related residential cooperative property which is the projected net cash flow reflected in the most recent appraisal obtained by or otherwise in the possession of the related mortgage loan seller as of the cut-off date, and the loan-to-value ratio is calculated based upon the appraised value of the residential cooperative property determined as if such residential cooperative property is operated as a residential cooperative. Debt service coverage ratio, debt yield and loan-to-value ratio information takes no account of subordinate debt (whether or not secured by the mortgaged property), if any, that is allowed under the terms of any mortgage loan. With respect to 301 South College Street, loan-to-value ratio, debt service coverage ratio, debt yield and cut-off date balance per square foot calculations include the relatedpari passucompanion loan (unless otherwise stated) in total debt. |
| (3) | For purposes of determining whether a mortgaged property is in Northern California or Southern California, Northern California includes areas with zip codes above 93600 and Southern California includes areas with zip codes of 93600 and below. |
| (4) | Includes 23 other states. |
THE INFORMATION IN THIS STRUCTURAL AND COLLATERAL TERM SHEET IS NOT COMPLETE AND MAY BE AMENDED PRIOR TO THE TIME OF SALE. THIS TERM SHEET IS NOT AN OFFER TO SELL THESE SECURITIES AND IT IS NOT A SOLICITATION OF AN OFFER TO BUY THESE SECURITIES IN ANY JURISDICTION WHERE THE OFFER OR SALE IS NOT PERMITTED.
12
| WFRBS Commercial Mortgage Trust 2013-C13 | Characteristics of the Mortgage Pool |
| G. | Characteristics of the Mortgage Pool(1) |
CUT-OFF DATE BALANCE
Range of Cut-off Date Balances ($) | Number of Mortgage Loans | Aggregate Cut-off Date Balance ($) | % of Cut-off Date Balance | |||||||||
850,000 – 1,000,000 | 1 | $ | 850,000 | 0.1 | % | |||||||
1,000,001 – 2,000,000 | 12 | 19,488,785 | 2.2 | |||||||||
2,000,001 – 3,000,000 | 13 | 33,697,643 | 3.8 | |||||||||
3,000,001 – 4,000,000 | 9 | 30,481,203 | 3.5 | |||||||||
4,000,001 – 5,000,000 | 10 | 44,858,086 | 5.1 | |||||||||
5,000,001 – 6,000,000 | 7 | 39,800,930 | 4.5 | |||||||||
6,000,001 – 7,000,000 | 8 | 52,571,269 | 6.0 | |||||||||
7,000,001 – 8,000,000 | 7 | 52,897,727 | 6.0 | |||||||||
8,000,001 – 9,000,000 | 3 | 25,867,674 | 3.0 | |||||||||
9,000,001 – 10,000,000 | 4 | 38,384,885 | 4.4 | |||||||||
10,000,001 – 15,000,000 | 9 | 114,440,423 | 13.1 | |||||||||
15,000,001 – 20,000,000 | 3 | 48,993,319 | 5.6 | |||||||||
20,000,001 – 30,000,000 | 6 | 152,407,808 | 17.4 | |||||||||
30,000,001 – 50,000,000 | 1 | 50,000,000 | 5.7 | |||||||||
50,000,001 – 87,000,000 | 2 | 172,000,000 | 19.6 | |||||||||
|
|
|
|
|
| |||||||
Total: | 95 | $ | 876,739,752 | 100.0 | % | |||||||
|
|
|
|
|
| |||||||
Average: | $ | 9,228,839 | ||||||||||
|
| |||||||||||
UNDERWRITTEN NOI DEBT SERVICE COVERAGE RATIO
Range of U/W NOI DSCRs (x) | Number of Mortgage Loans | Aggregate Cut-off Date Balance ($) | % of Cut-off Date Balance | |||||||||
1.34 – 1.40 | 1 | $ | 11,600,000 | 1.3 | % | |||||||
1.41 – 1.50 | 1 | 2,790,397 | 0.3 | |||||||||
1.51 – 1.60 | 8 | 65,076,890 | 7.4 | |||||||||
1.61 – 1.70 | 9 | 87,305,628 | 10.0 | |||||||||
1.71 – 1.80 | 11 | 179,807,844 | 20.5 | |||||||||
1.81 – 1.90 | 11 | 149,715,932 | 17.1 | |||||||||
1.91 – 2.00 | 15 | 123,079,371 | 14.0 | |||||||||
2.01 – 2.25 | 8 | 45,505,386 | 5.2 | |||||||||
2.26 – 2.50 | 3 | 19,909,885 | 2.3 | |||||||||
2.51 – 2.75 | 3 | 38,619,839 | 4.4 | |||||||||
2.76 – 3.00 | 1 | 50,000,000 | 5.7 | |||||||||
3.01 – 3.50 | 6 | 55,523,956 | 6.3 | |||||||||
3.51 – 32.64 | 18 | 47,804,624 | 5.5 | |||||||||
|
|
|
|
|
| |||||||
Total: | 95 | $ | 876,739,752 | 100.0 | % | |||||||
|
|
|
|
|
| |||||||
Weighted Average: | 2.48x | |||||||||||
|
| |||||||||||
UNDERWRITTEN NCF DEBT SERVICE COVERAGE RATIO
Range of U/W NCF DSCRs (x) | Number of Mortgage Loans | Aggregate Cut-off Date Balance ($) | % of Cut-off Date Balance | |||||||||
1.21 – 1.30 | 1 | $ | 11,600,000 | 1.3 | % | |||||||
1.31 – 1.40 | 2 | 13,926,660 | 1.6 | |||||||||
1.41 – 1.50 | 6 | 55,408,976 | 6.3 | |||||||||
1.51 – 1.60 | 12 | 135,574,377 | 15.5 | |||||||||
1.61 – 1.70 | 16 | 179,105,657 | 20.4 | |||||||||
1.71 – 1.80 | 14 | 205,436,885 | 23.4 | |||||||||
1.81 – 1.90 | 6 | 36,694,950 | 4.2 | |||||||||
1.91 – 2.00 | 4 | 22,081,033 | 2.5 | |||||||||
2.01 – 2.25 | 5 | 25,125,635 | 2.9 | |||||||||
2.26 – 2.50 | 2 | 14,309,885 | 1.6 | |||||||||
2.51 – 2.75 | 3 | 74,147,116 | 8.5 | |||||||||
2.76 – 3.00 | 3 | 42,768,289 | 4.9 | |||||||||
3.01 – 3.50 | 3 | 12,755,667 | 1.5 | |||||||||
3.51 – 32.64 | 18 | 47,804,624 | 5.5 | |||||||||
|
|
|
|
|
| |||||||
Total: | 95 | $ | 876,739,752 | 100.0 | % | |||||||
|
|
|
|
|
| |||||||
Weighted Average: | 2.34x | |||||||||||
|
| |||||||||||
LOAN PURPOSE
Loan Purpose | Number of Mortgage Loans | Aggregate Cut-off Date Balance ($) | % of Cut-off Date Balance | |||||||||
Refinance | 78 | $ | 623,409,817 | 71.1 | % | |||||||
Acquisition | 16 | 250,272,287 | 28.5 | |||||||||
Various | 1 | 3,057,648 | 0.3 | |||||||||
|
|
|
|
|
| |||||||
Total: | 95 | $ | 876,739,752 | 100.0 | % | |||||||
|
|
|
|
|
| |||||||
MORTGAGE RATE
Range of Mortgage Rates (%) | Number of Mortgage Loans | Aggregate Cut-off Date Balance ($) | % of Cut-off Date Balance | |||||||||
3.640 – 3.750 | 6 | $ | 120,695,806 | 13.8 | % | |||||||
3.751 – 4.000 | 24 | 228,339,386 | 26.0 | |||||||||
4.001 – 4.250 | 17 | 216,545,228 | 24.7 | |||||||||
4.251 – 4.500 | 15 | 124,987,964 | 14.3 | |||||||||
4.501 – 4.750 | 21 | 132,807,291 | 15.1 | |||||||||
4.751 – 5.000 | 9 | 46,553,831 | 5.3 | |||||||||
5.001 – 5.250 | 1 | 2,790,397 | 0.3 | |||||||||
5.251 – 5.500 | 2 | 4,019,848 | 0.5 | |||||||||
|
|
|
|
|
| |||||||
Total: | 95 | $ | 876,739,752 | 100.0 | % | |||||||
|
|
|
|
|
| |||||||
Weighted Average: | 4.179 | % | ||||||||||
|
| |||||||||||
UNDERWRITTEN NOI DEBT YIELD
Range of U/W NOI Debt Yields (%) | Number of Mortgage Loans | Aggregate Cut-off Date Balance ($) | % of Cut-off Date Balance | |||||||||
7.8 – 8.9 | 1 | $ | 11,600,000 | 1.3 | % | |||||||
9.0 – 9.9 | 8 | 157,418,543 | 18.0 | |||||||||
10.0 – 10.9 | 21 | 278,516,040 | 31.8 | |||||||||
11.0 – 11.9 | 11 | 102,834,816 | 11.7 | |||||||||
12.0 – 12.9 | 22 | 197,495,290 | 22.5 | |||||||||
13.0 – 13.9 | 6 | 39,253,942 | 4.5 | |||||||||
14.0 – 14.9 | 1 | 5,000,000 | 0.6 | |||||||||
15.0 – 15.9 | 1 | 3,244,691 | 0.4 | |||||||||
16.0 – 16.9 | 2 | 7,992,085 | 0.9 | |||||||||
17.0 – 17.9 | 1 | 14,472,723 | 1.7 | |||||||||
18.0 – 19.9 | 2 | 4,638,709 | 0.5 | |||||||||
20.0 – 132.4 | 19 | 54,272,912 | 6.2 | |||||||||
|
|
|
|
|
| |||||||
Total: | 95 | $ | 876,739,752 | 100.0 | % | |||||||
|
|
|
|
|
| |||||||
Weighted Average: | 13.5 | % | ||||||||||
|
| |||||||||||
UNDERWRITTEN NCF DEBT YIELD
Range of U/W NCF Debt Yields | Number of Mortgage Loans | Aggregate Cut-off Date Balance ($) | % of Cut-off Date Balance | |||||||||
7.6 – 7.9 | 1 | $ | 11,600,000 | 1.3 | % | |||||||
8.0 – 8.9 | 5 | 121,998,792 | 13.9 | |||||||||
9.0 – 9.9 | 16 | 161,700,781 | 18.4 | |||||||||
10.0 – 10.9 | 18 | 273,619,598 | 31.2 | |||||||||
11.0 – 11.9 | 23 | 166,047,098 | 18.9 | |||||||||
12.0 – 12.9 | 6 | 53,808,307 | 6.1 | |||||||||
13.0 – 13.9 | 2 | 17,816,780 | 2.0 | |||||||||
15.0 – 15.9 | 2 | 4,717,394 | 0.5 | |||||||||
16.0 – 16.9 | 1 | 6,519,382 | 0.7 | |||||||||
18.0 – 19.9 | 2 | 4,638,709 | 0.5 | |||||||||
20.0 – 132.4 | 19 | 54,272,912 | 6.2 | |||||||||
|
|
|
|
|
| |||||||
Total: | 95 | $ | 876,739,752 | 100.0 | % | |||||||
|
|
|
|
|
| |||||||
Weighted Average: | 12.7 | % | ||||||||||
|
| |||||||||||
| (1) | Information regarding mortgage loans that are cross-collateralized with other mortgage loans is based upon the individual loan balances, except that the applicable loan-to value ratio, debt service coverage ratio or debt yield for each such mortgage loan is based upon the ratio or yield (as applicable) for the aggregate indebtedness evidenced by all loans in the group. On an individual basis, without regard to the cross-collateralization feature, any mortgage loan that is part of a cross-collateralized group of mortgage loans may have a higher loan-to-value ratio, lower debt service coverage ratio and/or lower debt yield than is presented herein. For mortgaged properties securing residential cooperative mortgage loans, the debt service coverage ratio or debt yield for each such mortgaged property are calculated using underwritten net cash flow for the related residential cooperative property which is the projected net cash flow reflected in the most recent appraisal obtained by or otherwise in the possession of the related mortgage loan seller as of the cut-off date, and the loan-to-value ratio is calculated based upon the appraised value of the residential cooperative property determined as if such residential cooperative property is operated as a residential cooperative. Debt service coverage ratio, debt yield and loan-to-value ratio information takes no account of subordinate debt (whether or not secured by the mortgaged property), if any, that is allowed under the terms of any mortgage loan. With respect to 301 South College Street loan-to-value ratio, debt service coverage ratio and debt yield calculations include the relatedpari passu companion loan (unless otherwise stated) in total debt. |
13
| WFRBS Commercial Mortgage Trust 2013-C13 | Characteristics of the Mortgage Pool |
ORIGINAL TERM TO MATURITY OR ARD
Range of Original Terms to | Number of Mortgage Loans | Aggregate Cut-off Date Balance ($) | % of Cut-off Date Balance | |||||||||
60 | 7 | $ | 86,368,235 | 9.9 | % | |||||||
120 | 88 | 790,371,517 | 90.1 | |||||||||
|
|
|
|
|
| |||||||
Total: | 95 | $ | 876,739,752 | 100.0 | % | |||||||
|
|
|
|
|
| |||||||
Weighted Average: | 114 months | |||||||||||
REMAINING TERM TO MATURITY OR ARD
Range of Remaining Terms to | Number of Mortgage Loans | Aggregate Cut-off Date Balance ($) | % of Cut-off Date Balance | |||||||||
58 – 60 | 7 | $ | 86,368,235 | 9.9 | % | |||||||
85 – 120 | 88 | 790,371,517 | 90.1 | |||||||||
|
|
|
|
|
| |||||||
Total: | 95 | $ | 876,739,752 | 100.0 | % | |||||||
|
|
|
|
|
| |||||||
Weighted Average: | 113 months | |||||||||||
ORIGINAL AMORTIZATION TERM(1)
Range of Original Amortization | Number of Mortgage Loans | Aggregate Cut-off Date Balance ($) | % of Cut-off Date Balance | |||||||||
Non-Amortizing | 8 | $ | 121,415,000 | 13.8 | % | |||||||
240 – 300 | 23 | 199,962,599 | 22.8 | |||||||||
301 – 360 | 59 | 538,158,843 | 61.4 | |||||||||
361 – 480 | 5 | 17,203,310 | 2.0 | |||||||||
|
|
|
|
|
| |||||||
Total: | 95 | $ | 876,739,752 | 100.0 | % | |||||||
|
|
|
|
|
| |||||||
Weighted Average(2): | 345 months | |||||||||||
| (1) | The original amortization term shown for any mortgage loan that is interest-only for part of its term does not include the number of months in its interest-only period and reflects only the number of months as of the commencement of amortization remaining from the end of such interest-only period. |
| (2) | Excludes the non-amortizing loans. |
REMAINING AMORTIZATION TERM(3)
Range of Remaining Amortization | Number of Mortgage Loans | Aggregate Cut-off Date Balance ($) | % of Cut-off Date Balance | |||||||||
Non-Amortizing | 8 | $ | 121,415,000 | 13.8 | % | |||||||
238 – 300 | 23 | 199,962,599 | 22.8 | |||||||||
301 – 360 | 59 | 538,158,843 | 61.4 | |||||||||
361 – 479 | 5 | 17,203,310 | 2.0 | |||||||||
|
|
|
|
|
| |||||||
Total: | 95 | $ | 876,739,752 | 100.0 | % | |||||||
|
|
|
|
|
| |||||||
Weighted Average(4): | 345 months | |||||||||||
| (3) | The remaining amortization term shown for any mortgage loan that is interest-only for part of its term does not include the number of months in its interest-only period and reflects only the number of months as of the commencement of amortization remaining from the end of such interest-only period. |
| (4) | Excludes the non-amortizing loans. |
LOCKBOXES
Type of Lockbox | Number of Mortgage Loans | Aggregate Cut-off Date Balance ($) | % of Cut-off Date Balance | |||||||||
None | 46 | $ | 192,657,800 | 22.0 | % | |||||||
Springing (W/Out Estab. Account) | 16 | 183,041,772 | 20.9 | |||||||||
Soft/Springing Cash Management | 16 | 175,645,897 | 20.0 | |||||||||
Hard/Upfront Cash Management | 3 | 174,790,397 | 19.9 | |||||||||
Hard/Springing Cash Management | 14 | 150,603,887 | 17.2 | |||||||||
|
|
|
|
|
| |||||||
Total: | 95 | $ | 876,739,752 | 100.0 | % | |||||||
|
|
|
|
|
| |||||||
PREPAYMENT PROVISION SUMMARY
Prepayment Provision | Number of Mortgage Loans | Aggregate Cut-off Date Balance ($) | % of Cut-off Date Balance | |||||||||
Lockout/Defeasance/Open | 67 | $ | 650,348,012 | 74.2 | % | |||||||
Lockout/Defeasance or YM%/Open | 1 | 85,000,000 | 9.7 | |||||||||
Lockout/YM%/Open | 6 | 80,831,450 | 9.2 | |||||||||
YM%/1%/Open | 21 | 60,560,290 | 6.9 | |||||||||
|
|
|
|
|
| |||||||
Total: | 95 | $ | 876,739,752 | 100.0 | % | |||||||
|
|
|
|
|
| |||||||
CUT-OFF DATE LOAN-TO-VALUE RATIO
Range of Cut-off Date LTV Ratios | Number of Mortgage Loans | Aggregate Cut-off Date Balance ($) | % of Cut-off Date Balance | |||||||||
2.5 – 30.0 | 19 | $ | 50,796,217 | 5.8 | % | |||||||
30.1 – 35.0 | 3 | 11,411,189 | 1.3 | |||||||||
35.1 – 40.0 | 1 | 14,472,723 | 1.7 | |||||||||
45.1 – 50.0 | 4 | 62,759,814 | 7.2 | |||||||||
50.1 – 55.0 | 7 | 79,932,958 | 9.1 | |||||||||
55.1 – 60.0 | 12 | 179,705,957 | 20.5 | |||||||||
60.1 – 65.0 | 20 | 127,610,902 | 14.6 | |||||||||
65.1 – 70.0 | 17 | 237,715,270 | 27.1 | |||||||||
70.1 – 75.0 | 11 | 100,500,327 | 11.5 | |||||||||
75.1 – 75.9 | 1 | 11,834,395 | 1.3 | |||||||||
|
|
|
|
|
| |||||||
Total: | 95 | $ | 876,739,752 | 100.0 | % | |||||||
|
|
|
|
|
| |||||||
Weighted Average: | 59.1 | % | ||||||||||
|
| |||||||||||
BALLOON OR ARD LOAN-TO-VALUE RATIO
Range of Balloon or ARD LTV | Number of Mortgage Loans | Aggregate Cut-off Date Balance ($) | % of Cut-off Date Balance | |||||||||
2.5 – 25.0 | 20 | $ | 52,443,333 | 6.0 | % | |||||||
25.1 – 30.0 | 2 | 9,764,073 | 1.1 | |||||||||
35.1 – 40.0 | 5 | 45,749,296 | 5.2 | |||||||||
40.1 – 45.0 | 6 | 29,027,707 | 3.3 | |||||||||
45.1 – 50.0 | 24 | 286,361,363 | 32.7 | |||||||||
50.1 – 55.0 | 11 | 116,401,787 | 13.3 | |||||||||
55.1 – 60.0 | 20 | 181,967,281 | 20.8 | |||||||||
60.1 – 63.5 | 7 | 155,024,913 | 17.7 | |||||||||
|
|
|
|
|
| |||||||
Total: | 95 | $ | 876,739,752 | 100.0 | % | |||||||
|
|
|
|
|
| |||||||
Weighted Average: | 49.8 | % | ||||||||||
|
| |||||||||||
AMORTIZATION TYPE
Type of Amortization | Number of Mortgage Loans | Aggregate Cut-off Date Balance ($) | % of Cut-off Date Balance | |||||||||
Amortizing Balloon | 73 | $ | 468,598,092 | 53.4 | % | |||||||
Interest-only, Amortizing Balloon | 13 | 280,750,000 | 32.0 | |||||||||
Interest-only, Balloon | 8 | 121,415,000 | 13.8 | |||||||||
Amortizing Balloon, ARD | 1 | 5,976,660 | 0.7 | |||||||||
|
|
|
|
|
| |||||||
Total: | 95 | $ | 876,739,752 | 100.0 | % | |||||||
|
|
|
|
|
| |||||||
ORIGINAL TERM OF INTEREST-ONLY PERIOD FOR PARTIAL IO LOANS
IO Term (months) | Number of Mortgage Loans | Aggregate Cut-off Date Balance ($) | % of Cut-off Date Balance | |||||||||
12 | 4 | $ | 42,000,000 | 4.8 | % | |||||||
13 – 24 | 8 | 153,750,000 | 17.5 | |||||||||
60 | 1 | 85,000,000 | 9.7 | |||||||||
|
|
|
|
|
| |||||||
Total: | 13 | $ | 280,750,000 | 32.0 | % | |||||||
|
|
|
|
|
| |||||||
Weighted Average: | 33 months | |||||||||||
SEASONING
Seasoning (months) | Number of Mortgage Loans | Aggregate Cut-off Date Balance ($) | % of Cut-off Date Balance | |||||||||
0 | 11 | $ | 177,500,000 | 20.2 | % | |||||||
1 – 3 | 84 | 699,239,752 | 79.8 | |||||||||
|
|
|
|
|
| |||||||
Total: | 95 | $ | 876,739,752 | 100.0 | % | |||||||
|
|
|
|
|
| |||||||
Weighted Average: | 1 month | |||||||||||
THE INFORMATION IN THIS STRUCTURAL AND COLLATERAL TERM SHEET IS NOT COMPLETE AND MAY BE AMENDED PRIOR TO THE TIME OF SALE. THIS TERM SHEET IS NOT AN OFFER TO SELL THESE SECURITIES AND IT IS NOT A SOLICITATION OF AN OFFER TO BUY THESE SECURITIES IN ANY JURISDICTION WHERE THE OFFER OR SALE IS NOT PERMITTED.
14
| WFRBS Commercial Mortgage Trust 2013-C13 | Certain Terms and Conditions |
| V. | Certain Terms and Conditions |
| Interest Entitlements: | The interest entitlement of each Class of Offered Certificates on each Distribution Date generally will be the interest accrued during the related Interest Accrual Period on the related Certificate Principal Balance or Notional Amount at the related pass-through rate, net of any prepayment interest shortfalls allocated to that Class for such Distribution Date as described below. If prepayment interest shortfalls arise from voluntary prepayments (without special servicer consent) on non-specially serviced mortgage loans during any collection period, the applicable Master Servicer is required to make a compensating interest payment to offset those shortfalls, generally up to an amount equal to the portion of its master servicing fees that accrue at one basis pointper annum. The remaining amount of prepayment interest shortfalls will be allocated to reduce the interest entitlement on all Classes of Certificates (other than the Class X-A, X-B and X-C Certificates),pro rata, based on their respective amounts of accrued interest for the related Distribution Date. If a Class receives less than the entirety of its interest entitlement on any Distribution Date, then the shortfall will be added to its interest entitlement for the next succeeding Distribution Date. Interest entitlements on the Class D, C and B Certificates, in that order, may be reduced by certain Trust Advisor expenses. | |||
| Principal Distribution Amount: | The Principal Distribution Amount for each Distribution Date generally will be the aggregate amount of principal received or advanced in respect of the mortgage loans, net of any non-recoverable advances and interest thereon that are reimbursed to the applicable Master Servicer, the applicable Special Servicer or the Trustee during the related collection period. Non-recoverable advances and interest thereon are reimbursable from principal collections and advances before reimbursement from other amounts. The Principal Distribution Amount may also be reduced, with a corresponding loss, to the Class D, C, B and A-S Certificates, then to the Class A-1, A-2, A-3, A-4 and A-SB Certificates and Class A-3FX Regular Interest (and therefore, to the Class A-3FX and A-3FL Certificates) (with any losses on the Class A-1, A-2, A-3, A-4 and A-SB Certificates and Class A-3FX Regular Interest (and therefore, on the Class A-3FX and A-3FL Certificates) allocatedpro rataaccording to their respective Certificate Principal Balances immediately prior to that Distribution Date), in that order, in connection with certain Trust Advisor expenses to the extent that interest entitlements on the Class B, C and D Certificates are insufficient to absorb the effect of the expense on any particular Distribution Date. | |||
| Distributions: | On each Distribution Date, funds available for distribution from the mortgage loans, net of specified trust fees, expenses and reimbursements will generally be distributed in the following amounts and order of priority (in each case to the extent of remaining available funds): | |||
1. | Class A-1, A-2, A-3, A-4, A-SB, X-A, X-B and X-C Certificates and Class A-3FX Regular Interest: To interest on the Class A-1, A-2, A-3, A-4, A-SB, X-A, X-B and X-C Certificates and Class A-3FX Regular Interest, pro rata, according to their respective interest entitlements. | |||
2. | Class A-1, A-2, A-3, A-4 and A-SB Certificates and Class A-3FX Regular Interest: To principal on the Class A-1, A-2, A-3, A-4 and A-SB Certificates and the Class A-3FX Regular Interest in the following amounts and order of priority: (i) first, to principal on the Class A-SB Certificates, in an amount up to the Principal Distribution Amount for such Distribution Date until their Certificate Principal Balance is reduced to the Class A-SB Planned Principal Balance for such Distribution Date; (ii) second, to principal on the Class A-1 Certificates until their Certificate Principal Balance is reduced to zero, up to the remainder of the Principal Distribution Amount for such Distribution Date; (iii) third, to principal on the Class A-2 Certificates until their Certificate Principal Balance is reduced to zero, up to the remainder of the Principal Distribution Amount for such Distribution Date; (iv) fourth, on apro ratabasis, to principal on the Class A-3 Certificates and Class A-3FX Regular Interest (and therefore, to holders of the Class A-3FX and A-3FL Certificates) until their Certificate Principal Balance is reduced to zero, up to the remainder of the Principal Distribution Amount for such Distribution Date; (v) fifth, to principal on the Class A-4 Certificates until their Certificate Principal Balance is reduced to zero, up to the remainder of the Principal Distribution Amount for such Distribution Date; and (vi) sixth, to principal on the Class A-SB Certificates until their Certificate Principal Balance is reduced to zero, up to the remainder of the Principal Distribution Amount for such Distribution Date. However, if the Certificate Principal Balance of each and every Class of Principal Balance Certificates, other than the Class A-1, A-2, A-3, A-4 and A-SB Certificates and Class A-3FX Regular Interest, has been reduced to zero as a result of the allocation of Mortgage Loan losses and expenses and any of the Class A-1, A-2, A-3, A-4 and A-SB Certificates and Class A-3FX Regular Interest remains outstanding, then the Principal Distribution Amount will be distributed on the Class A-1, A-2, A-3, A-4 and A-SB Certificates and Class A-3FX Regular Interest,pro rata, based on their respective | |||
THE INFORMATION IN THIS STRUCTURAL AND COLLATERAL TERM SHEET IS NOT COMPLETE AND MAY BE AMENDED PRIOR TO THE TIME OF SALE. THIS TERM SHEET IS NOT AN OFFER TO SELL THESE SECURITIES AND IT IS NOT A SOLICITATION OF AN OFFER TO BUY THESE SECURITIES IN ANY JURISDICTION WHERE THE OFFER OR SALE IS NOT PERMITTED.
15
| WFRBS Commercial Mortgage Trust 2013-C13 | Certain Terms and Conditions |
| outstanding Certificate Principal Balances, until their Certificate Principal Balances have been reduced to zero. | ||||
3. | Class A-1, A-2, A-3, A-4, A-SB Certificates and Class A-3FX Regular Interest: To reimburse the holders of the Class A-1, A-2, A-3, A-4 and A-SB Certificates and the Class A-3FX Regular Interest (and, therefore, to reimburse the holders of the Class A-3FX Certificates and the Class A-3FL Certificates),pro rata, for any previously unreimbursed losses (other than certain Trust Advisor expenses) on the mortgage loans that were previously allocated in reduction of the Certificate Principal Balances of such Classes. | |||
4. | Class A-S Certificates: To make distributions on the Class A-S Certificates as follows: (a) first, to interest on Class A-S Certificates in the amount of the interest entitlement for that Class; (b) next, to the extent of the portion of the Principal Distribution Amount remaining after distributions in respect of principal to each Class with a higher distribution priority (in this case, the Class A-1, A-2, A-3, A-4 and A-SB Certificates and the Class A- 3FX Regular Interest), to principal on the Class A-S Certificates until their Certificate Principal Balance is reduced to zero; and (c) next, to reimburse the holders of the Class A-S Certificates for any previously unreimbursed losses (other than certain Trust Advisor expenses) on the mortgage loans that were previously allocated to that Class in reduction of its Certificate Principal Balance. | |||
5. | Class B Certificates: To make distributions on the Class B Certificates as follows: (a) first, to interest on Class B Certificates in the amount of the interest entitlement for that Class; (b) next, to the extent of the portion of the Principal Distribution Amount remaining after distributions in respect of principal to each Class with a higher distribution priority (in this case, the Class A-1, A-2, A-3, A-4, A-SB and A-S Certificates and the Class A-3FX Regular Interest), to principal on the Class B Certificates until their Certificate Principal Balance is reduced to zero; and (c) next, to reimburse the holders of the Class B Certificates for any previously unreimbursed losses (other than certain Trust Advisor expenses) on the mortgage loans that were previously allocated to that Class in reduction of its Certificate Principal Balance. | |||
6. | Class C Certificates: To make distributions on the Class C Certificates as follows: (a) first, to interest on Class C Certificates in the amount of the interest entitlement for that Class; (b) next, to the extent of the portion of the Principal Distribution Amount remaining after distributions in respect of principal to each Class with a higher distribution priority (in this case, the Class A-1, A-2, A-3, A-4, A-SB, A-S and B Certificates and the Class A-3FX Regular Interest), to principal on the Class C Certificates until their Certificate Principal Balance is reduced to zero; and (c) next, to reimburse the holders of the Class C Certificates for any previously unreimbursed losses (other than certain Trust Advisor expenses) on the mortgage loans that were previously allocated to that Class in reduction of its Certificate Principal Balance. | |||
7. | After the Class A-1, A-2, A-3, A-4, A-SB, A-S, B and C Certificates and Class A-3FX Regular Interest are paid all amounts to which they are entitled, the remaining funds available for distribution will be used to pay interest, principal and loss reimbursement amounts (other than certain Trust Advisor expenses) on the Class D, E, F and G Certificates sequentially in that order in a manner analogous to the Class C Certificates.
Amounts distributed in respect of the Class A-3FX Regular Interest will generally be allocated between the Class A-3FX and A-3FL Certificates in accordance with their class percentage interests. | |||
| Allocation of Yield Maintenance and Prepayment Premiums: | If any yield maintenance charges and prepayment premiums are collected during any particular collection period with respect to any mortgage loan, then on the distribution date corresponding to that collection period, the certificate administrator will pay a portion of the yield maintenance charges and prepayment premiums (net of liquidation fees payable therefrom) in the following manner: (1)pro rata, between the (x) the group (the “YM Group A”) of the Class A-1, A-2, A-3, A- 4, A-SB, A-S and X-A Certificates and the Class A-3FX Regular Interest and (y) the group (the “YM Group B” and, collectively with the YM Group A, the “YM Groups”) of the Class B, C, D and X-B Certificates, based upon the aggregate amount of principal distributed to the classes of principal balance certificates (other than the Class A-3FL and Class A-3FX Certificates) and the Class A-3FX Regular Interest in each YM Group for that distribution date, and (2) among the classes of certificates in each YM Group, in the following manner, up to an amount equal to the product of (a) the yield maintenance or prepayment premium allocated to such YM Group, (b) the related Base Interest Fraction (as defined in the Free Writing Prospectus), and (c) a fraction, which in no | |||
THE INFORMATION IN THIS STRUCTURAL AND COLLATERAL TERM SHEET IS NOT COMPLETE AND MAY BE AMENDED PRIOR TO THE TIME OF SALE. THIS TERM SHEET IS NOT AN OFFER TO SELL THESE SECURITIES AND IT IS NOT A SOLICITATION OF AN OFFER TO BUY THESE SECURITIES IN ANY JURISDICTION WHERE THE OFFER OR SALE IS NOT PERMITTED.
16
| WFRBS Commercial Mortgage Trust 2013-C13 | Certain Terms and Conditions |
| event may be greater than 1.0, the numerator of which is equal to the amount of principal distributed to the holder(s) of such class or regular interest for that distribution date, and the denominator of which is the aggregate amount of principal distributed to all the certificates (other than Class A-3FL and A-3FX Certificates) and the Class A-3FX Regular Interest in that YM Group for that distribution date. Any yield maintenance charges or prepayment premium allocated to such YM Group remaining after such distributions will be distributed to the Class X-A and/or Class X-B Certificates, as applicable, in such YM Group. | ||
| No prepayment premiums or yield maintenance charges will be distributed to the holders of the Class E, F, G, X-C, V or R Certificates. The holders of the Class X-B Certificates will be entitled to all prepayment premiums and yield maintenance charges collected after the Class A-1, A-2, A-3, A-4, A-SB, A-S, X-A, B, C and D Certificates and Class A-3FX Regular Interest (and, therefore, the Class A-3FX and A-3FL Certificates) are retired. For a description of when prepayment premiums and yield maintenance charges are generally required on the mortgage loans, see Annex A to the Free Writing Prospectus. See also “Risk Factors – Risks Related to the Offered Certificates – Your Yield May Be Affected by Defaults, Prepayments and Other Factors” in the Free Writing Prospectus. Prepayment premiums and yield maintenance charges will be distributed on each Distribution Date only to the extent they are actually received on the mortgage loans as of the related Determination Date. | ||
| Realized Losses: | The Certificate Principal Balances of the Class A-1, A-2, A-3, A-4, A-SB, A-S, B, C, D, E, F and G Certificates and Class A-3FX Regular Interest (and, therefore, the Class A-3FX and A-3FL Certificates) will be reduced without distribution on any Distribution Date as a write-off to the extent of any losses realized on the mortgage loans allocated to such Class on such Distribution Date. Such losses (other than certain Trust Advisor expenses) will be applied in the following order, in each case until the related Certificate Principal Balance is reduced to zero: first, to Class G; second, to Class F; third, to Class E; fourth, to Class D; fifth, to Class C; sixth, to Class B; seventh, to Class A-S; and, finally,pro rata, to Classes A-1, A-2, A-3, A-4 and A-SB Certificates and the Class A-3FX Regular Interest (and, therefore, to holders of the Class A-3FX and the Class A-3FL Certificates) based on their outstanding Certificate Principal Balances. Certain Trust Advisor expenses (if not absorbed by reductions of interest entitlements on Classes D, C and B Certificates) will be applied as write-offs in a similar manner, except that such write-offs will be applied only to the Class D, C, B, A-S, A-1, A-2, A-3, A-4 and A-SB Certificates and the Class A- 3FX Regular Interest (and, therefore, the Class A-3FX and A-3FL Certificates) (with any write-offs on the Class A-1, A-2, A-3, A-4 and A-SB Certificates and the Class A-3FX Regular Interest to be allocatedpro rataaccording to their respective Certificate Principal Balances immediately prior to that Distribution Date). The notional amount of the Class X-A Certificates will be reduced by the amount of all losses that are allocated to the Class A-1, A-2, A-3, A-4, A-SB or A-S Certificates or the Class A-3FX Regular Interest as write-offs in reduction of their Certificate Principal Balances. The notional amount of the Class X-B Certificates will be reduced by the amount of all losses that are allocated to the Class B or C Certificates as write-offs in reduction of their Certificate Principal Balances. The notional amount of the Class X-C Certificates will be reduced by the amount of all losses that are allocated to the Class F or G Certificates as write-offs in reduction of their Certificate Principal Balances. | |
| Debt Service Advances: | The related Master Servicer or, if such Master Servicer fails to do so, the Trustee, will be obligated to advance delinquent debt service payments (other than balloon payments and default interest) and assumed debt service payments on the mortgage loans (including the 301 South College Street mortgage loan but not its relatedpari passucompanion loan), except to the extent any such advance is deemed non-recoverable from collections on the related mortgage loan. In addition, if an Appraisal Reduction Amount exists for a given mortgage loan, the interest portion of any debt service advance for such mortgage loan will be reduced, which will have the effect of reducing the amount of interest available for distribution to the Certificates in reverse alphabetical order of their Class designations (except that interest payments on the Class A-1, A-2, A-3, A-4, A-SB, X-A, X-B and X-C Certificates and the Class A-3FX Regular Interest (and, therefore, the Class A-3FX and A-3FL Certificates) would be affected on apari passubasis). | |
| Servicing Advances: | Each Master Servicer or, if either Master Servicer fails to do so, the Trustee, will be obligated to make servicing advances with respect to each mortgage loan that it services, including the payment of delinquent property taxes, insurance premiums and ground rent, except to the extent that those advances are deemed non-recoverable from collections on the related mortgage loan. After the securitization of the 301 South College Street companion loan, the master servicer under that securitization will have the primary obligation to make any servicing advances with respect to the 301 South College Street loan combination. | |
| Appraisal Reduction Amounts: | An Appraisal Reduction Amount generally will be created in the amount, if any, by which the principal balance of a required appraisal loan (which is a mortgage loan with respect to which | |
THE INFORMATION IN THIS STRUCTURAL AND COLLATERAL TERM SHEET IS NOT COMPLETE AND MAY BE AMENDED PRIOR TO THE TIME OF SALE. THIS TERM SHEET IS NOT AN OFFER TO SELL THESE SECURITIES AND IT IS NOT A SOLICITATION OF AN OFFER TO BUY THESE SECURITIES IN ANY JURISDICTION WHERE THE OFFER OR SALE IS NOT PERMITTED.
17
| WFRBS Commercial Mortgage Trust 2013-C13 | Certain Terms and Conditions |
| certain defaults, modifications or insolvency events have occurred as further described in the Free Writing Prospectus) plus other amounts overdue or advanced in connection with such mortgage loan exceeds 90% of the appraised value of the related mortgaged property plus certain escrows and reserves (including letters of credit) held with respect to the mortgage loan. | ||
| A mortgage loan will cease to be a required appraisal loan when the same has ceased to be a specially serviced mortgage loan (if applicable), has been brought current for at least three consecutive months and no other circumstances exist that would cause such mortgage loan to be a required appraisal loan. | ||
| Appraisal Reduction Amounts will affect the amount of debt service advances on the related mortgage loan. Appraisal Reduction Amounts will also be taken into account in the determination of the identity of the Class whose majority constitutes the “majority subordinate certificateholder” and is entitled to appoint the subordinate class representative. | ||
| Clean-Up Call and Exchange Termination: | On each Distribution Date occurring after the aggregate unpaid principal balance of the mortgage loans is reduced below 1% of the initial aggregate principal balance of the mortgage loans as of the Cut-off Date, certain specified persons will have the option to purchase all of the remaining mortgage loans (and the trust’s interest in all property acquired through exercise of remedies in respect of any mortgage loan) at the price specified in the Free Writing Prospectus. Exercise of the option will terminate the trust and retire the then-outstanding certificates. | |
| If the aggregate Certificate Principal Balances of each of the Class A-1, A-2, A-3, A-4, A-SB, A-S, B, C and D Certificates and the Class A-3FX Regular Interest (and, therefore, the Class A-3FL and Class A-3FX Certificates) have been reduced to zero, the trust may also be terminated in connection with an exchange of all the then-outstanding certificates, for the mortgage loans and REO properties then remaining in the issuing entity, but all of the holders of those Classes of outstanding certificates would have to voluntarily participate in the exchange. | ||
| Liquidated Loan Waterfall: | Following the liquidation of any loan or property, the net liquidation proceeds generally will be applied (after reimbursement of advances and certain trust fund expenses), first, as a recovery of accrued interest, other than delinquent interest that was not advanced as a result of Appraisal Reduction Amounts, and then as a recovery of principal until all principal has been recovered. Any liquidation proceeds remaining thereafter will be applied as a recovery of delinquent interest that was not advanced as a result of Appraisal Reduction Amounts. | |
| Majority Subordinate Certificateholder and Subordinate Class Representative: | A subordinate class representative may be appointed by the “majority subordinate certificate-holder”, which will be the holder(s) of a majority of: (a) during a “subordinate control period”, the most subordinate class among the Class E, F and G Certificates that has a Certificate Principal Balance, as notionally reduced by any Appraisal Reduction Amounts allocable to that class, that is at least equal to 25% of its total initial principal balance and (b) during a “collective consultation period”, the most subordinate class among the Class E, F and G Certificates that has a total principal balance, without regard to Appraisal Reduction Amounts, that is at least equal to 25% of its initial Certificate Principal Balance. The majority subordinate certificateholder will have a continuing right to appoint, remove or replace the subordinate class representative in its sole discretion. This right may be exercised at any time and from time to time. See “The Pooling and Servicing Agreement – The Majority Subordinate Certificateholder and the Subordinate Class Representative” in the Free Writing Prospectus. | |
| Control and Consultation: | The rights of various parties to replace each Special Servicer and approve or consult with respect to major actions of either Special Servicer will vary according to defined periods. A “subordinate control period” will exist as long as the Class E Certificates have a Certificate Principal Balance, net of any Appraisal Reduction Amounts allocable to that class, that is not less than 25% of the initial principal balance of that class (unless a senior consultation period is deemed to occur generally or with respect to a particular mortgage loan, pursuant to clause (ii) of the definition of “senior consultation period”). In general, during a subordinate control period, (i) the subordinate class representative will be entitled to grant or withhold approval of asset status reports prepared, and material servicing actions proposed, by either Special Servicer, and (ii) the majority subordinate certificateholder, or the subordinate class representative on its behalf (or with respect to the 301 South College Street loan combination after the securitization of the related companion loan, the related controlling noteholder (or its representative) under the related intercreditor agreement) will be entitled to terminate and replace each Special Servicer with or without cause, and appoint itself or another person as the applicable successor special servicer. It will be a condition to such appointment that Fitch and Moody’s confirm that the appointment would not result in a qualification, downgrade or withdrawal of any of their then-current ratings of certificates. A “collective consultation period” will exist as long as the Class E Certificates have a Certificate | |
THE INFORMATION IN THIS STRUCTURAL AND COLLATERAL TERM SHEET IS NOT COMPLETE AND MAY BE AMENDED PRIOR TO THE TIME OF SALE. THIS TERM SHEET IS NOT AN OFFER TO SELL THESE SECURITIES AND IT IS NOT A SOLICITATION OF AN OFFER TO BUY THESE SECURITIES IN ANY JURISDICTION WHERE THE OFFER OR SALE IS NOT PERMITTED.
18
| WFRBS Commercial Mortgage Trust 2013-C13 | Certain Terms and Conditions |
| Principal Balance that both (i) as notionally reduced by any Appraisal Reduction Amounts allocable to that class, is less than 25% of its initial principal balance and (ii) without regard to any Appraisal Reduction Amounts allocable to that class, is 25% or more of its initial Certificate Principal Balance (unless a senior consultation period is deemed to occur generally or with respect to a particular mortgage loan, pursuant to clause (ii) of the definition of “senior consultation period”). In general, during a collective consultation period, each Special Servicer will be required to consult with each of the subordinate class representative and the Trust Advisor in connection with asset status reports and material special servicing actions. A “senior consultation period” will exist as long as either (i) the Class E certificates have an aggregate principal balance, without regard to any appraisal reduction amounts allocable to that class, that is less than 25% of its initial principal balance or (ii) during such time as the Class E certificates are the most subordinate class of control-eligible certificates that have a then outstanding principal balance, net of appraisal reduction amounts, at least equal to 25% of its initial principal balance, the then majority subordinate certificateholder has irrevocably waived its right to appoint a subordinate class representative and to exercise any of the rights of the majority subordinate certificateholder or cause the exercise of the rights of the subordinate class representative and such rights have not been reinstated to a successor majority subordinate certificateholder as set forth in the pooling and servicing agreement. In general, during a senior consultation period, each Special Servicer must seek to consult with the Trust Advisor in connection with asset status reports and material special servicing actions, and, in general, no subordinate class representative will be recognized or have any right to terminate either Special Servicer or approve, direct or consult with respect to servicing matters. | ||
| Notwithstanding any contrary description set forth above, with respect to the 301 South College Street mortgage loan, in general (a) for as long as the 301 South College Street loan combination is serviced under the pooling and servicing agreement for this securitization, the initial holder of the relatedpari passucompanion loan will have control rights that include the right to approve or disapprove various material servicing actions involving the loan combination and the subordinate class representative for this securitization will have the right to be consulted on a non-binding basis with respect to such actions, and (b) in connection with the securitization of the 301 South College Streetpari passucompanion loan, after which the 301 South College Street loan combination will be serviced under the pooling and servicing agreement for such other securitization, such pooling and servicing agreement may grant to a subordinate or controlling class representative or other third party control rights that include the right to approve or disapprove various material servicing actions involving the loan combination but the subordinate class representative for this securitization will nonetheless have the right to be consulted on a non-binding basis with respect to such actions. For purposes of the servicing of the 301 South College Street loan combination, the occurrence and continuance of a collective consultation period or senior consultation period with respect to the subordinate class representative under this securitization will not limit the control or other rights of the initial holder of the 301 South College Streetpari passucompanion loan or of a subordinate or controlling class representative or other third party under any securitization thereof, and any collective consultation period or senior consultation period or similar period under that other securitization will not limit the consultation rights of the subordinate class representative under this securitization. The Trust Advisor in this securitization will have no duties with respect to the 301 South College Street loan combination but a trust advisor may be appointed under the securitization of the relatedpari passucompanion loan. | ||
| In general, loan combination control rights also include the right to replace the special servicer for the related loan combination only. | ||
| Replacement of Special Servicer by General Vote of Certificateholders: | During any “collective consultation period” or “senior consultation period”, each Special Servicer may be terminated and replaced upon the affirmative direction of certificate owners holding not less than 75% of the appraisal-reduced voting rights of all certificates, following a proposal from certificate owners holding not less than 25% of the appraisal-reduced voting rights of all certificates. The certificateholders who initiate a vote on a termination and replacement of either Special Servicer without cause must cause Fitch and Moody’s to confirm the then-current ratings of the certificates (or decline to review the matter) and cause the payment of the fees and expenses incurred in the replacement. | |
| Appraisal Remedy: | Solely for purposes of determining whether a “subordinate control period” is in effect, whenever either Special Servicer obtains an appraisal or updated appraisal under the pooling and servicing agreement, the subordinate class representative, with respect to the mortgage loans (other than the 301 South College Street mortgage loan after the securitization of itspari passucompanion loan) will have the right (at its or their expense) to direct such Special Servicer to hire a qualified appraiser to prepare a second appraisal of the mortgaged property. The Special Servicer must thereafter determine whether, based on its assessment of such second appraisal, any recalculation of the Appraisal Reduction Amount is warranted. The Appraisal Reduction Amount, whether based | |
THE INFORMATION IN THIS STRUCTURAL AND COLLATERAL TERM SHEET IS NOT COMPLETE AND MAY BE AMENDED PRIOR TO THE TIME OF SALE. THIS TERM SHEET IS NOT AN OFFER TO SELL THESE SECURITIES AND IT IS NOT A SOLICITATION OF AN OFFER TO BUY THESE SECURITIES IN ANY JURISDICTION WHERE THE OFFER OR SALE IS NOT PERMITTED.
19
| WFRBS Commercial Mortgage Trust 2013-C13 | Certain Terms and Conditions |
| on the first or the second appraisal, will become effective following the second appraisal, except that the Appraisal Reduction Amount based on the first appraisal shall become effective if the subordinate class representative declines to demand a second appraisal within a specified number of business days, or if a second appraisal is not received within 90 days after the direction of the subordinate class representative. In addition, for the same purposes, if there is a material change in the mortgaged property securing any mortgage loan for which an Appraisal Reduction Amount has been calculated, the majority certificateholder of the Class E, F or G Certificates or other designed certificate holders will be entitled (at its expense) to present an additional appraisal to such Special Servicer, which will generally be required to recalculate the Appraisal Reduction Amount based upon such additional appraisal. This latter right may not be exercised more frequently than once in any 12-month period for each mortgage loan for which an Appraisal Reduction Amount was calculated and can only be exercised during a subordinate control period or a collective consultation period as further described in the Free Writing Prospectus. | ||
| Sale of Defaulted Assets: | There will be no “fair value” purchase option. Instead, the pooling and servicing agreement will authorize each Special Servicer to sell defaulted mortgage loans serviced by such Special Servicer (other than the 301 South College Street mortgage loan after the securitization of itspari passucompanion loan) to the highest bidder in a manner generally similar to sales of REO properties. The sale of a defaulted loan (other than the 301 South College Street mortgage loan after the securitization of itspari passucompanion loan) for less than par plus accrued interest and certain other fees and expenses owed on the loan will be subject to consent or consultation rights of the subordinate class representative and/or Trust Advisor, as described in the Free Writing Prospectus. In the case of the 301 South College Street loan combination, the sale will be subject to the consent and/or consultation rights of the holder of the relatedpari passucompanion loan, as described in the Free Writing Prospectus. After the securitization of the 301 South College Streetpari passucompanion loan, pursuant to its intercreditor agreement, the party acting as special servicer of such mortgage loan pursuant to the pooling and servicing agreement of such other securitization, may offer to sell to any person (or may offer to purchase) for cash the 301 South College Street loan combination during such time as such mortgage loan constitutes a defaulted mortgage loan under such other pooling and servicing agreement, and, in connection with any such sale, the applicable special servicer is required to sell both the 301 South College Street mortgage loan and relatedpari passucompanion loan as a whole loan. The subordinate class representative will have consultation rights as the holder of an interest in the 301 South College Street mortgage loan, as described in the Free Writing Prospectus. | |
| “As-Is” Appraisals: | Appraisals must be conducted on an “as-is” basis, and must be no more than 9 months old, for purposes of determining Appraisal Reduction Amounts, market value in connection with REO sales, etc. Required appraisals may consist of updates of prior appraisals. Internal valuations by the applicable Special Servicer are permitted if the principal balance of a mortgage loan is less than $2,000,000. | |
| Trust Advisor: | The Trust Advisor will perform certain review duties that will generally include a limited annual review of and report regarding each Special Servicer to the Certificate Administrator. The review and report generally will be based on: (a) during a collective consultation period or senior consultation period, any asset status reports and additional information delivered to the Trust Advisor by either Special Servicer with respect to any mortgage loan serviced by such Special Servicer (other than the 301 South College Street mortgage loan andpari passucompanion loan), and/or (b) during a senior consultation period, in addition to the applicable information described above, a meeting with each Special Servicer to conduct a limited review of such Special Servicer’s operational practices on a platform basis in light of the servicing standard. In addition, during any collective consultation period or senior consultation period, each Special Servicer must seek to consult with the Trust Advisor (in addition to the subordinate class representative during a collective consultation period) in connection with material special servicing actions with respect to specially serviced mortgage loans serviced by such Special Servicer (other than the 301 South College Street mortgage loan andpari passucompanion loan). Furthermore, under certain circumstances, but only during a senior consultation period, the Trust Advisor may recommend the replacement of either Special Servicer, in which case the Certificate Administrator will deliver notice of such recommendation to the certificateholders, and certificateholders with specified percentages of the voting rights may direct the replacement of such Special Servicer at their expense. | |
| Notwithstanding any contrary provision described above, the Trust Advisor will have no rights or duties in connection with the 301 South College Street mortgage loan. | ||
| The Trust Advisor may be removed and replaced without cause upon the affirmative direction of certificates owners holding not less than 75% of the appraisal-reduced voting rights of all certificates, following a proposal from certificate owners holding not less than 25% of the | ||
THE INFORMATION IN THIS STRUCTURAL AND COLLATERAL TERM SHEET IS NOT COMPLETE AND MAY BE AMENDED PRIOR TO THE TIME OF SALE. THIS TERM SHEET IS NOT AN OFFER TO SELL THESE SECURITIES AND IT IS NOT A SOLICITATION OF AN OFFER TO BUY THESE SECURITIES IN ANY JURISDICTION WHERE THE OFFER OR SALE IS NOT PERMITTED.
20
| WFRBS Commercial Mortgage Trust 2013-C13 | Certain Terms and Conditions |
| appraisal-reduced voting rights of all certificates. The certificateholders who initiate a vote on a termination and replacement of the Trust Advisor without cause must cause Fitch and Moody’s to confirm the then-current ratings of the certificates (or decline to review the matter) and cause the payment of the fees and expenses incurred in the replacement. During any “subordinate control period”, the proposed replacement trust advisor will be subject to the subordinate class representative’s consent (such consent not to be unreasonably withheld). If a proposed termination and replacement of the Trust Advisor is not consummated within 180 days following the initial request of the certificateholders who requested a vote, the proposed termination and replacement shall have no further force or effect. The Trust Advisor generally may be discharged from its duties if and when the Class A-1, A-2, A-3, A-3FL, A-3FX, A-4, A-SB, A-S, B, C and D Certificates are retired. | ||
| Certain Fee Offsets: | If a workout fee is earned by either Special Servicer following a loan default with respect to any mortgage loan that it services, then certain limitations will apply to the collection and retention of a modification fee from the borrower. The modification fee generally must not exceed 1% of the principal balance of the loan as modified. In addition, if the loan re-defaults within a specified period of months and other conditions are satisfied, any subsequent workout or liquidation fee on that loan must be reduced by a portion of the previously-collected modification fee. Furthermore, workout fees, liquidation fees and modification fees collected with respect to any workout, liquidation and/or partial liquidation of a mortgage loan or loan combination that is serviced by a special servicer will be subject to an aggregate cap of $1,000,000 per mortgage loan or loan combination. | |
| Deal Website: | The Certificate Administrator will be required to maintain a deal website which will include, among other items: (a) summaries of asset status reports prepared by each Special Servicer, (b) inspection reports, (c) appraisals, (d) various “special notices” described in the Free Writing Prospectus, (e) the “Investor Q&A Forum” and (f) a voluntary “Investor Registry”. Investors may access the deal website following execution of a certification and confidentiality agreement. | |
| Initial Majority Subordinate Certificateholder: | It is expected that LNR Securities Holdings, LLC or an affiliate will be the initial majority subordinate certificateholder. | |
| Loan Combinations: | The mortgaged property identified on Annex A to the Free Writing Prospectus as 301 South College Street secures both a mortgage note to be included in the trust and one other mortgage note, referred to as a “pari passucompanion loan” that will not be included in the trust, which will bepari passuin right of payment with the mortgage note to be included in the trust. The pair of mortgage notes is referred to herein as a “loan combination.” Prior to the securitization of the 301 South College Streetpari passucompanion loan, the 301 South College Street loan combination will be serviced under the WFRBS 2013-C13 pooling and servicing agreement. After the securitization of the 301 South College Streetpari passucompanion loan, the 301 South College Street loan combination will be serviced under the pooling and servicing agreement related to the securitization of itspari passucompanion loan.
As of the closing date, the 301 South College Streetpari passucompanion loan will be held by its related mortgage loan seller, which will reserve the right to sell suchpari passucompanion loan subject to the related intercreditor agreement. | |
THE INFORMATION IN THIS STRUCTURAL AND COLLATERAL TERM SHEET IS NOT COMPLETE AND MAY BE AMENDED PRIOR TO THE TIME OF SALE. THIS TERM SHEET IS NOT AN OFFER TO SELL THESE SECURITIES AND IT IS NOT A SOLICITATION OF AN OFFER TO BUY THESE SECURITIES IN ANY JURISDICTION WHERE THE OFFER OR SALE IS NOT PERMITTED.
21
| 188 SPEAR STREET AND 208 UTAH STREET |
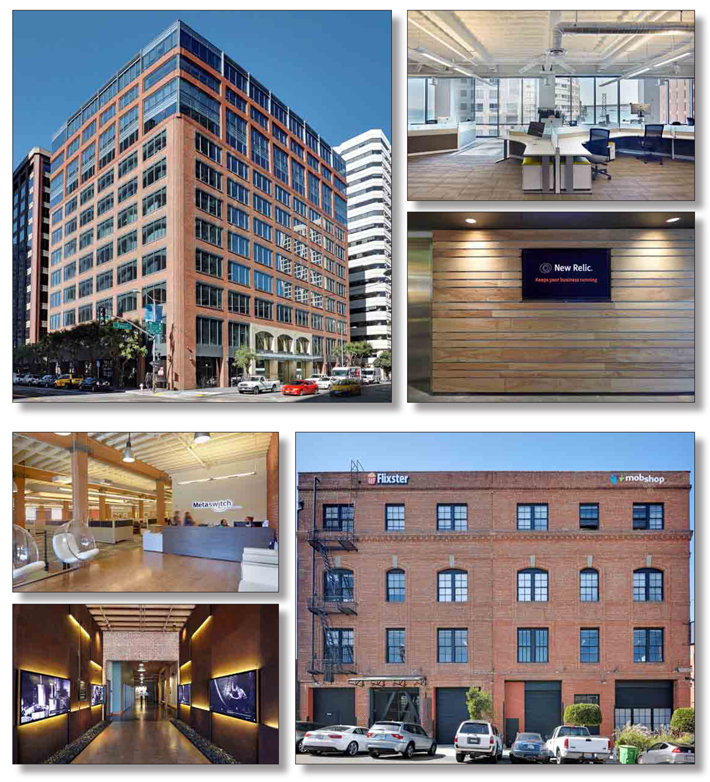
THE INFORMATION IN THIS STRUCTURAL AND COLLATERAL TERM SHEET IS NOT COMPLETE AND MAY BE AMENDED PRIOR TO THE TIME OF SALE. THIS TERM SHEET IS NOT AN OFFER TO SELL THESE SECURITIES AND IT IS NOT A SOLICITATION OF AN OFFER TO BUY THESE SECURITIES IN ANY JURISDICTION WHERE THE OFFER OR SALE IS NOT PERMITTED.
22
| 188 SPEAR STREET AND 208 UTAH STREET |
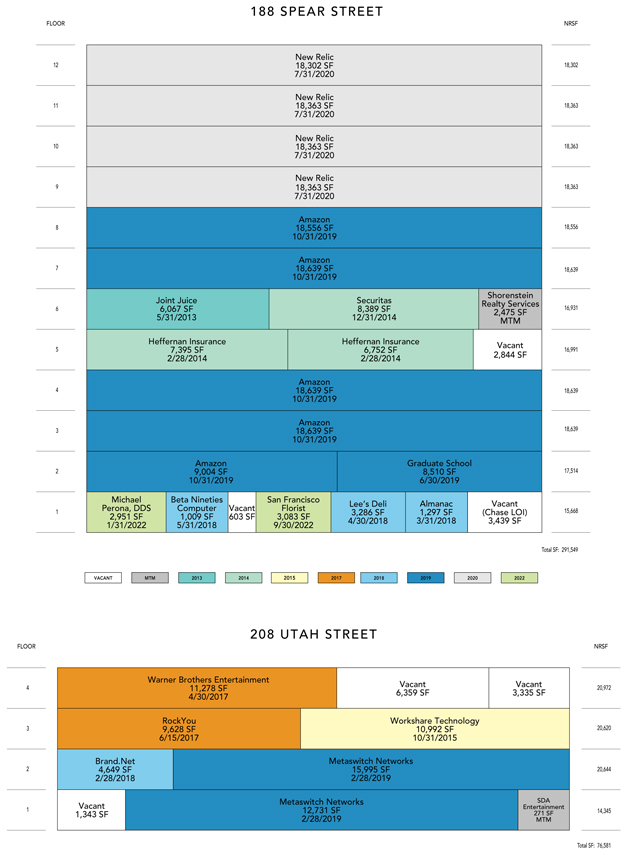
THE INFORMATION IN THIS STRUCTURAL AND COLLATERAL TERM SHEET IS NOT COMPLETE AND MAY BE AMENDED PRIOR TO THE TIME OF SALE. THIS TERM SHEET IS NOT AN OFFER TO SELL THESE SECURITIES AND IT IS NOT A SOLICITATION OF AN OFFER TO BUY THESE SECURITIES IN ANY JURISDICTION WHERE THE OFFER OR SALE IS NOT PERMITTED.
23
| 188 SPEAR STREET AND 208 UTAH STREET |

THE INFORMATION IN THIS STRUCTURAL AND COLLATERAL TERM SHEET IS NOT COMPLETE AND MAY BE AMENDED PRIOR TO THE TIME OF SALE. THIS TERM SHEET IS NOT AN OFFER TO SELL THESE SECURITIES AND IT IS NOT A SOLICITATION OF AN OFFER TO BUY THESE SECURITIES IN ANY JURISDICTION WHERE THE OFFER OR SALE IS NOT PERMITTED.
24
No. 1 – 188 Spear Street and 208 Utah Street
Loan Information
| ||
| Mortgage Loan Seller: | Wells Fargo Bank, National Association | |
| Credit Assessment | ||
| (Fitch/Moody’s): | NR/NR | |
| Original Principal Balance: | $87,000,000 | |
| Cut-off Date Principal Balance: | $87,000,000 | |
| % of Initial Pool Balance: | 9.9% | |
| Loan Purpose: | Refinance | |
| Borrower Names: | 188 Spear Street LLC; SC 208 Utah LLC | |
| Sponsor: | Shorenstein Company LLC | |
| Mortgage Rate: | 3.725% | |
| Note Date: | February 27, 2013 | |
| Anticipated Repayment Date: | NAP | |
| Maturity Date: | March 1, 2023 | |
| IO Period: | 24 months | |
| Loan Term (Original): | 120 months | |
| Seasoning: | 2 months | |
| Amortization Term (Original): | 360 months | |
| Loan Amortization Type: | Interest-only, Amortizing Balloon | |
| Interest Accrual Method: | Actual/360 | |
| Call Protection: | L(26),D(90),O(4) | |
| Lockbox Type: | Hard/Upfront Cash Management | |
| Additional Debt: | Yes | |
| Additional Debt Type: | Future Mezzanine | |
Escrows and Reserves(1):
Type: | Initial | Monthly | Cap (If Any) | |||||||||
Taxes | $ | 104,750 | $ | 52,376 | NAP | |||||||
Insurance | $ | 0 | Springing | NAP | ||||||||
Replacement Reserves | $ | 0 | $ | 5,788 | NAP | |||||||
TI/LC | $ | 0 | $ | 63,298 | $ | 3,568,116 | ||||||
Holdback Reserve | $ | 5,000,000 | $ | 0 | NAP | |||||||
Rent Concession | $ | 1,096,348 | $ | 0 | NAP | |||||||
Outstanding TI/LC | $ | 636,985 | $ | 0 | NAP | |||||||
New Relic Security Deposit(2) | $ | 5,068,057 | $ | 0 | NAP | |||||||
Property Information
| ||
| Single Asset/Portfolio: | Portfolio | |
| Property Type: | Office | |
| Specific Property Type: | CBD | |
| Location: | San Francisco, CA | |
| Size: | 291,549 SF | |
| Cut-off Date Principal | ||
| Balance Per Unit/SF: | $298.41 | |
| Year Built/Renovated: | Various – See Table | |
| Title Vesting: | Fee | |
| Property Manager: | Self-managed | |
| 3rdMost Recent Occupancy(3): | NAV | |
| 2ndMost Recent Occupancy(3): | NAV | |
| Most Recent Occupancy(3): | NAV | |
| Current Occupancy (As of)(4): | 93.9% (1/1/2013) | |
Underwriting and Financial Information:
| ||
| 3rdMost Recent NOI(3): | NAV | |
| 2ndMost Recent NOI(3): | NAV | |
| Most Recent NOI(3): | NAV | |
| U/W Revenues: | $13,292,881 | |
| U/W Expenses: | $4,819,110 | |
| U/W NOI: | $8,473,771 | |
| U/W NCF: | $7,774,741 | |
| U/W NOI DSCR(5): | 1.76x | |
| U/W NCF DSCR(5): | 1.61x | |
| U/W NOI Debt Yield(5): | 9.7% | |
| U/W NCF Debt Yield(5): | 8.9% | |
| As-Is Appraised Value(6): | $152,500,000 | |
| As-Is Appraisal Valuation Date: | November 20, 2012 | |
| Cut-off Date LTV Ratio(5)(6): | 57.0% | |
LTV Ratio at Maturity or ARD(6): | 47.7% | |
| (1) | See “Escrows” section. |
| (2) | The lender will take assignment of a $5,068,057 letter of credit posted by New Relic. |
| (3) | Four floors were added to the 188 Spear Street property in 2012 and the 208 Utah Street property was acquired in August 2012 via a pre-packaged foreclosure; historical occupancy and historical operating statements are not available as the 188 Spear Street and 208 Utah Street Properties were going through various renovations. |
| (4) | New Relic recently exercised their expansion option on the ninth floor (18,363 square feet). They took possession of the space on March 15, 2013 and have a free rent period that is scheduled to expire on October 1, 2013. They also have a free rent period on the tenth floor (18,363 square feet) that is scheduled to expire on February 1, 2014. One year of rent for the tenth floor has been reserved upfront. |
| (5) | All calculations are based on the full loan amount of $87,000,000. Net of the $5,000,000 Holdback Reserve, U/W NOI DSCR is 1.87x, U/W NCF DSCR is 1.71x, U/W NOI Debt Yield is 10.3%, U/W NCF Debt Yield is 9.5% and Cut-off Date LTV Ratio is 53.8%. See “Escrows” section for further detail on the Holdback Reserve. |
| (6) | The As-Is Appraised Value for the 188 Spear Street property is $126,000,000, assuming that unpaid leasing costs for the tenants Amazon, New Relic and Grange Café have been paid. These leasing costs have either been paid, reserved upfront or are a de minimis amount. |
The Mortgage Loan. The mortgage loan (the “188 Spear Street and 208 Utah Street Mortgage Loan”) is evidenced by a single promissory note that is secured by a first mortgage encumbering two office buildings located in the central business district of San Francisco, California (the “188 Spear Street and 208 Utah Street Properties”). The 188 Spear Street and 208 Utah Street Mortgage Loan was originated on February 27, 2013 by Wells Fargo Bank, National Association. The 188 Spear Street and 208 Utah Street Mortgage Loan had an original principal balance of $87,000,000, has an outstanding principal balance as of the Cut-off Date of $87,000,000 and accrues interest at an interest rate of 3.725% per annum. The 188 Spear Street and 208 Utah Street Mortgage Loan had an initial term of 120 months, has a remaining term of 118 months as of the Cut-off Date and requires interest-only payments for the first 24 months following origination and thereafter requires payments of principal and interest based on a 30-year amortization schedule. The 188 Spear Street and 208 Utah Street Mortgage Loan matures on March 1, 2023.
THE INFORMATION IN THIS STRUCTURAL AND COLLATERAL TERM SHEET IS NOT COMPLETE AND MAY BE AMENDED PRIOR TO THE TIME OF SALE. THIS TERM SHEET IS NOT AN OFFER TO SELL THESE SECURITIES AND IT IS NOT A SOLICITATION OF AN OFFER TO BUY THESE SECURITIES IN ANY JURISDICTION WHERE THE OFFER OR SALE IS NOT PERMITTED.
25
| 188 SPEAR STREET AND 208 UTAH STREET |
Following the lockout period, the borrower has the right to defease the 188 Spear Street and 208 Utah Street Mortgage Loan either in whole or in part, on any due date before December 1, 2022. In addition, the 188 Spear Street and 208 Utah Street Mortgage Loan is prepayable without penalty on or after December 1, 2022.
Sources and Uses
Sources | Uses | |||||||||||||||||
Original loan amount | $ | 87,000,000 | 100.0 | % | Loan payoff (188 Spear Street)(1) | $ | 33,054,013 | 38.0 | % | |||||||||
| Purchase price (208 Utah Street)(1) | 25,675,000 | 29.5 | ||||||||||||||||
| Reserves | 6,838,083 | 7.9 | ||||||||||||||||
| Closing costs | 626,182 | 0.7 | ||||||||||||||||
| Return of equity | 20,806,722 | 23.9 | ||||||||||||||||
|
|
|
|
|
|
|
| |||||||||||
Total Sources | $ | 87,000,000 | 100.0 | % | Total Uses | $ | 87,000,000 | 100.0 | % | |||||||||
|
|
|
|
|
|
|
| |||||||||||
| (1) | The borrower acquired the 188 Spear Street property in November 2009 via a pre-packaged foreclosure of a mezzanine note and acquired the 208 Utah Street property in August 2012. The 188 Spear Street and 208 Utah Street Mortgage Loan proceeds refinanced existing debt on the 188 Spear Street property and recapitalized the borrower’s cash purchase of the 208 Utah Street property. |
The Properties.The 188 Spear Street and 208 Utah Street Mortgage Loan is secured by the fee interest in two office buildings totaling 291,549 square feet located in the central business district of San Francisco, California. The 188 Spear Street property is a 12-story, class A office building containing approximately 199,300 square feet of office space and 15,668 rentable square feet of retail space. Built in 1973, the 188 Spear Street property, which is located at the intersection of Spear Street and Howard Street and serves as the headquarters for New Relic, underwent an extensive renovation in 2011 and 2012, which included the addition of four floors, construction of a new entrance and lobby, as well as replacement of the windows, electrical system and HVAC system. The renovation was completed at a cost of approximately $39.4 million (inclusive of soft costs of $8.6 million) and as a result, the 188 Spear Street property meets LEED Gold certification standards. In addition, the borrower has spent approximately $12.6 million on tenant improvements and leasing costs since acquisition. The 208 Utah Street property is a four-story, class B office building containing approximately 76,581 square feet. Built in 1911, the 208 Utah Street property, which is located along 15th Street between Utah Street and Potrero Avenue, underwent renovations in 2011 which included seismic upgrades and additional common area improvements. As of January 1, 2013, the 188 Spear Street and 208 Utah Street Properties were 93.9% occupied by 18 tenants.
The following table presents certain information relating to the 188 Spear Street and 208 Utah Street Properties:
Property Name | Allocated Cut-off Date Principal Balance | % of Portfolio Cut-off Date Principal Balance | Current Occupancy | Year Built/ Renovated | Net Rentable Area (SF) | Appraised Value | ||||||||||||||||||
188 Spear Street | $ | 74,400,000 | 85.5 | % | 96.8 | %(1) | 1973/2012 | 214,968 | $ | 126,000,000 | (2) | |||||||||||||
208 Utah Street | $ | 12,600,000 | 14.5 | % | 85.6 | % | 1911/2011 | 76,581 | $ | 26,500,000 | ||||||||||||||
|
|
|
|
|
|
|
|
|
| |||||||||||||||
Total/Weighted Average | $ | 87,000,000 | 100.0 | % | 93.9 | % | 291,549 | $ | 152,500,000 | |||||||||||||||
|
|
|
|
|
|
|
|
|
| |||||||||||||||
| (1) | New Relic recently exercised their expansion option on the ninth floor (18,363 square feet). They took possession of the space on March 15, 2013 but are not in occupancy and have a free rent period that is scheduled to expire on October 1, 2013. They also have a free rent period on the tenth floor (18,363 square feet) that is scheduled to expire on February 1, 2014. |
| (2) | The appraised value for the 188 Spear Street property is $126,000,000, assuming that unpaid leasing costs for the tenants Amazon, New Relic and Grange Café have been paid. These leasing costs have either been paid or reserved upfront. |
THE INFORMATION IN THIS STRUCTURAL AND COLLATERAL TERM SHEET IS NOT COMPLETE AND MAY BE AMENDED PRIOR TO THE TIME OF SALE. THIS TERM SHEET IS NOT AN OFFER TO SELL THESE SECURITIES AND IT IS NOT A SOLICITATION OF AN OFFER TO BUY THESE SECURITIES IN ANY JURISDICTION WHERE THE OFFER OR SALE IS NOT PERMITTED.
26
| 188 SPEAR STREET AND 208 UTAH STREET |
The following table presents certain information relating to the tenancies at the 188 Spear Street and 208 Utah Street Properties:
Major Tenants
Tenant Name | Credit Rating (Fitch/Moody’s/ S&P)(1) | Tenant NRSF | % of NRSF | Annual U/W Base Rent PSF(2) | Annual U/W Base Rent(2) | % of Total Annual U/W Base Rent | Lease Expiration Date | |||||||||||||||||||
Major Tenants | ||||||||||||||||||||||||||
New Relic(3)(4) | NR/NR/NR | 73,391 | 25.2 | % | $ | 57.00 | $ | 4,183,275 | 33.9 | % | 7/31/2020 | |||||||||||||||
Amazon(3) | NR/Baa1/AA- | 83,477 | 28.6 | % | $ | 46.00 | $ | 3,839,942 | 31.1 | % | 10/31/2019 | (5) | ||||||||||||||
Metaswitch Networks(6) | NR/NR/NR | 28,726 | 9.9 | % | $ | 27.00 | $ | 775,608 | 6.3 | % | 2/28/2019 | |||||||||||||||
Heffernan Insurance(3) | NR/NR/NR | 14,147 | 4.9 | % | $ | 41.50 | $ | 587,101 | 4.8 | % | 2/28/2014 | |||||||||||||||
Warner Bros. Entertainment(6) | BBB/Baa2/BBB | 11,278 | 3.9 | % | $ | 37.00 | $ | 417,286 | 3.4 | % | 4/30/2017 | (7) | ||||||||||||||
Graduate School(3) | NR/NR/NR | 8,510 | 2.9 | % | $ | 47.83 | $ | 407,068 | 3.3 | % | 6/30/2019 | |||||||||||||||
Workshare Technology(6) | NR/NR/NR | 10,992 | 3.8 | % | $ | 37.00 | $ | 406,704 | 3.3 | % | 10/31/2015 | |||||||||||||||
|
|
|
|
|
|
|
| |||||||||||||||||||
Total Major Tenants | 230,521 | 79.1 | % | $ | 46.06 | $ | 10,616,984 | 86.1 | % | |||||||||||||||||
Non-Major Tenants | 43,105 | 14.8 | % | $ | 39.82 | $ | 1,716,470 | 13.9 | % | |||||||||||||||||
|
|
|
|
|
|
|
| |||||||||||||||||||
Occupied Collateral Total | 273,626 | 93.9 | % | $ | 45.07 | $ | 12,333,454 | 100.0 | % | |||||||||||||||||
|
|
|
| |||||||||||||||||||||||
Vacant Space | 17,923 | 6.1 | % | |||||||||||||||||||||||
|
|
|
| |||||||||||||||||||||||
Collateral Total | 291,549 | 100.0 | % | |||||||||||||||||||||||
|
|
|
| |||||||||||||||||||||||
| (1) | Certain ratings are those of the parent company whether or not the parent guarantees the lease. |
| (2) | Annual U/W Base Rent and Annual U/W Base Rent PSF include contractual rent steps through July 2013. |
| (3) | Tenant is located at the 188 Spear Street property. |
| (4) | New Relic recently exercised their expansion option on the ninth floor (18,363 square feet). They took possession of the space on March 15, 2013, but are not in occupancy and have a free rent period that is scheduled to expire on October 1, 2013. They also have a free rent period on the tenth floor (18,363 square feet) that is scheduled to expire on February 1, 2014. One year of rent for the tenth floor has been reserved upfront. Also, New Relic is a defendant in a lawsuit filed by Computer Associates in the Eastern District of New York alleging violation of three patents. The lawsuit is in the preliminary stages, and discovery has not yet commenced. The plaintiff alleges New Relic is violating the three patents and is requesting a trial by jury plus a permanent injunction restraining New Relic from selling software or services based on the patents. The lender has taken assignment of a $5.1 million letter of credit and a cash flow sweep will be triggered if New Relic is subject to any bankruptcy or insolvency proceeding. |
| (5) | On March 31, 2018, Amazon has a one-time right to terminate their lease with 12 months notice, and payment of a fee equal to three months rent and unamortized tenant improvement costs. |
| (6) | Tenant is located at the 208 Utah Street property. |
| (7) | Warner Brothers Entertainment may terminate their lease anytime after May 1, 2015, with nine months notice and payment of a fee equal to unamortized leasing costs and $75,187 (approximately two months of rent). |
THE INFORMATION IN THIS STRUCTURAL AND COLLATERAL TERM SHEET IS NOT COMPLETE AND MAY BE AMENDED PRIOR TO THE TIME OF SALE. THIS TERM SHEET IS NOT AN OFFER TO SELL THESE SECURITIES AND IT IS NOT A SOLICITATION OF AN OFFER TO BUY THESE SECURITIES IN ANY JURISDICTION WHERE THE OFFER OR SALE IS NOT PERMITTED.
27
| 188 SPEAR STREET AND 208 UTAH STREET |
The following table presents certain information relating to the lease rollover schedule at the 188 Spear Street and 208 Utah Street Properties:
Lease Expiration Schedule(1)(2)
Year Ending December 31, | No. of Leases Expiring | Expiring NRSF | % of Total NRSF | Cumulative Expiring NRSF | Cumulative % of Total NRSF | Annual U/W Base Rent | Annual U/W Base Rent PSF(3) | |||||||||||||||||||
MTM | 2 | 2,746 | 0.9 | % | 2,746 | 0.9 | % | $ | 119,475 | $ | 43.51 | |||||||||||||||
2013 | 1 | 6,067 | 2.1 | % | 8,813 | 3.0 | % | $ | 273,015 | $ | 45.00 | |||||||||||||||
2014 | 2 | 22,536 | 7.7 | % | 31,349 | 10.8 | % | $ | 863,938 | $ | 38.34 | |||||||||||||||
2015 | 1 | 10,992 | 3.8 | % | 42,341 | 14.5 | % | $ | 406,704 | $ | 37.00 | |||||||||||||||
2016 | 0 | 0 | 0.0 | % | 42,341 | 14.5 | % | $ | 0 | $ | 0.00 | |||||||||||||||
2017 | 2 | 20,906 | 7.2 | % | 63,247 | 21.7 | % | $ | 802,406 | $ | 38.38 | |||||||||||||||
2018 | 4 | 10,241 | 3.5 | % | 73,488 | 25.2 | % | $ | 439,161 | $ | 42.88 | |||||||||||||||
2019 | 3 | 120,713 | 41.4 | % | 194,201 | 66.6 | % | $ | 5,022,618 | $ | 41.61 | |||||||||||||||
2020 | 1 | 73,391 | 25.2 | % | 267,592 | 91.8 | % | $ | 4,183,275 | $ | 57.00 | |||||||||||||||
2021 | 0 | 0 | 0.0 | % | 267,592 | 91.8 | % | $ | 0 | $ | 0.00 | |||||||||||||||
2022 | 2 | 6,034 | 2.1 | % | 273,626 | 93.9 | % | $ | 222,862 | $ | 36.93 | |||||||||||||||
2023 | 0 | 0 | 0.0 | % | 273,626 | 93.9 | % | $ | 0 | $ | 0.00 | |||||||||||||||
Thereafter | 0 | 0 | 0.0 | % | 273,626 | 93.9 | % | $ | 0 | $ | 0.00 | |||||||||||||||
Vacant | 0 | 17,923 | 6.1 | % | 291,549 | 100.0 | % | $ | 0 | $ | 0.00 | |||||||||||||||
|
|
|
|
|
|
|
|
| ||||||||||||||||||
Total/Weighted Average | 18 | 291,549 | 100.0 | % | $ | 12,333,454 | $ | 45.07 | ||||||||||||||||||
|
|
|
|
|
|
|
|
| ||||||||||||||||||
| (1) | Information obtained from the underwritten rent roll. |
| (2) | Certain tenants may have lease termination options that are exercisable prior to the stated expiration date of the subject lease and that are not considered in the Lease Expiration Schedule. |
| (3) | Weighted Average Annual U/W Base Rent PSF excludes vacant space. |
The following table presents historical occupancy percentages at the 188 Spear Street and 208 Utah Street Properties:
Historical Occupancy(1)
12/31/2010 | 12/31/2011 | 12/31/2012 | 1/1/2013 | |||
NAV | NAV | NAV | 93.9%(2) | |||
| (1) | Four floors were added to the 188 Spear Street property in 2012 and the 208 Utah Street property was acquired in August 2012; historical occupancy is not available as the 188 Spear Street and 208 Utah Street Properties were going through various renovations. |
| (2) | New Relic has exercised its expansion option on the ninth floor (18,293 square feet or 6.3% of NRSF), but is not yet in occupancy. |
Operating History and Underwritten Net Cash Flow. The following table presents certain information relating to the Underwritten Net Cash Flow at the 188 Spear Street and 208 Utah Street Properties:
Cash Flow Analysis(1)
| U/W | U/W $ per SF | |||||||
Base Rent | $ | 12,333,454 | $ | 42.30 | ||||
Grossed Up Vacant Space | 767,495 | 2.63 | ||||||
Total Reimbursables | 1,093,397 | 3.75 | ||||||
Other Income | 376,016 | 1.29 | ||||||
Less Vacancy & Credit Loss | (1,277,482 | )(2) | (4.38 | ) | ||||
|
|
|
| |||||
Effective Gross Income | $ | 13,292,881 | $ | 45.59 | ||||
Total Operating Expenses | $ | 4, 819,110 | $ | 16.53 | ||||
|
|
|
| |||||
Net Operating Income | $ | 8,473,771 | $ | 29.06 | ||||
TI/LC | 629,556 | 2.16 | ||||||
Capital Expenditures | 69,475 | 0.24 | ||||||
|
|
|
| |||||
Net Cash Flow | $ | 7,774,741 | $ | 26.67 | ||||
NOI DSCR | 1.76x | |||||||
NCF DSCR | 1.61x | |||||||
NOI DY | 9.7 | % | ||||||
NCF DY | 8.9 | % | ||||||
| (1) | Historical financials are not available for the 188 Spear Street and 208 Utah Street Properties as four floors were added to the 188 Spear Street property in 2012, the 208 Utah Street property was acquired in August 2012 and both properties were going through various renovations. |
| (2) | The underwritten economic vacancy is 8.0%. The 188 Spear Street and 208 Utah Street Properties are 93.9% leased as of January 1, 2013. |
THE INFORMATION IN THIS STRUCTURAL AND COLLATERAL TERM SHEET IS NOT COMPLETE AND MAY BE AMENDED PRIOR TO THE TIME OF SALE. THIS TERM SHEET IS NOT AN OFFER TO SELL THESE SECURITIES AND IT IS NOT A SOLICITATION OF AN OFFER TO BUY THESE SECURITIES IN ANY JURISDICTION WHERE THE OFFER OR SALE IS NOT PERMITTED.
28
| 188 SPEAR STREET AND 208 UTAH STREET |
Appraisal. As of the appraisal valuation date of November 20, 2012 the 188 Spear Street and 208 Utah Street Properties had an aggregate “as-is” appraised value of $152,500,000. The appraised value for the 188 Spear Street property assumes that unpaid leasing costs for the tenants Amazon, New Relic and Grange Café have been paid. These leasing costs have either been paid or are a de minimis amount.
Environmental Matters. According to the Phase I environmental site assessments dated December 10, 2012 and February 6, 2013, there was no evidence of any recognized environmental conditions at the 188 Spear Street and 208 Utah Street Properties.
Market Overview.The 188 Spear Street and 208 Utah Street Properties are located in the central business district of San Francisco, California.
According to a third party market research report, the 188 Spear Street property is located in the South Financial District office submarket. The Financial District and the neighboring South Financial District are the two core central business district office submarkets in San Francisco, accounting for approximately 49.0% of all office space in the city, and approximately 75.8% of all class A office space. According to a third party market research report, as of year-end 2012, the South Financial District submarket vacancy rate for all classes of office space was 11.3% while the class A vacancy was 8.6%. The South Financial District submarket has seen increases in quoted rents during each of the past nine quarters. As of year-end 2012, the quoted rent for class A office space in the South Financial District submarket was $44.88 per square foot on a full service gross basis.
According to a third party market research report, the 208 Utah Street property is located in the Potrero West (of the 101 Freeway) office submarket. The Potrero West submarket totals approximately 1.7 million square feet; the submarket is comprised of predominantly class B office space (approximately 81.1% of the total rentable area). According to a third party market research report, as of the year-end 2012 the Potrero West submarket vacancy rate for all classes of office space was 4.8% while the class B vacancy was 5.4%. As of year-end 2012, the quoted rent for class B office space in the Potrero West submarket was $40.36 per square foot on a full service gross basis.
The following table presents certain information relating to comparable office properties for the 188 Spear Street property:
188 Spear Street Competitive Set(1)
| 188 Spear Street (Subject) | 33 New Montgomery | 650 California Street | 60 Spear Street | 301 Howard Street | 455 Market Street | One Front Street | ||||||||
Location | San Francisco, CA | San Francisco, CA | San Francisco, CA | San Francisco, CA | San Francisco, CA | San Francisco, CA | San Francisco, CA | |||||||
Distance from Subject | — | 0.7 miles | 0.9 miles | 0.1 miles | 0.2 miles | 0.5 miles | 0.4 miles | |||||||
Property Type | Office | Office | Office | Office | Office | Office | Office | |||||||
Year Built/Renovated | 1973/2012 | 1986/NAV | 1963/2007 | 1967/NAV | 1987/NAV | 1987/NAV | 1981/NAV | |||||||
Total GLA | 214,968 SF | 241,800 SF | 489,400 SF | 133,782 SF | 307,400 SF | 379,200 SF | 638,800 SF | |||||||
Total Occupancy | 97% | 94% | 94% | 22% | 78% | 97% | 96% |
| (1) | Information obtained from the appraisal dated February 11, 2013. |
The following table presents certain information relating to comparable office properties for the 208 Utah Street property:
208 Utah Street Competitive Set(1)
| 208 Utah Street (Subject) | Design Center East | Market Square | 410 Townsend Street | 539 Bryant Street | Warfield Building | 444 De Haro St. | ||||||||
Location | San Francisco, CA | San Francisco, CA | San Francisco, CA | San Francisco, CA | San Francisco, CA | San Francisco, CA | San Francisco, CA | |||||||
Distance from Subject | — | 0.5 miles | 1.0 mile | 0.9 miles | 1.3 miles | 1.5 miles | 0.5 miles | |||||||
Property Type | Office | Office | Office | Office | Office | Office | Office | |||||||
Year Built/Renovated | 1911/2011 | 1903/1985 | 1937/2012 | 1912/1999 | 1912/NAV | 1921/1988 | 1927/1980s | |||||||
Total GLA | 76,581 SF | 82,852 SF | 1,089,600 SF | 73,800 SF | 54,900 SF | 69,500 SF | 152,700 SF | |||||||
Total Occupancy | 86% | 100% | 58% | 100% | 100% | 54% | 31% |
| (1) | Information obtained from the appraisal dated February 11, 2013. |
THE INFORMATION IN THIS STRUCTURAL AND COLLATERAL TERM SHEET IS NOT COMPLETE AND MAY BE AMENDED PRIOR TO THE TIME OF SALE. THIS TERM SHEET IS NOT AN OFFER TO SELL THESE SECURITIES AND IT IS NOT A SOLICITATION OF AN OFFER TO BUY THESE SECURITIES IN ANY JURISDICTION WHERE THE OFFER OR SALE IS NOT PERMITTED.
29
| 188 SPEAR STREET AND 208 UTAH STREET |
The Borrower. The borrowers are 188 Spear Street LLC and SC 208 Utah LLC, each of which is a Delaware limited liability company and a single purpose entity with two independent directors. Legal counsel to the borrower delivered a non-consolidation opinion in connection with the origination of the 188 Spear Street and 208 Utah Street Mortgage Loan. The borrowers are 100% owned and controlled by Shorenstein Company LLC, the guarantor of certain nonrecourse carveouts under the 188 Spear Street and 208 Utah Street Mortgage Loan.
The Sponsor. The 188 Spear Street and 208 Utah Street Mortgage Loan sponsor is Shorenstein Company LLC, a subsidiary of The Shorenstein Company (“Shorenstein”). Shorenstein is one of the country’s oldest real estate organizations, active nationally in the ownership and operation of high-quality office properties. The company is privately owned and is headquartered in San Francisco. As of January 15, 2013, Shorenstein owns and manages approximately 23.6 million square feet of office properties valued at approximately $6.5 billion. The borrower acquired the 188 Spear Street property via a pre-packaged foreclosure of a mezzanine note in November 2009. Further, affiliates of Shorenstein defaulted on two loans as a result of single tenant vacancies, resulting in foreclosures in 2011 and 2012. See “Description of the Mortgage Pool – Default History, Bankruptcy Issues and Other Proceedings” in the Free Writing Prospectus.
Escrows. The loan documents provide for an upfront escrow in the amount of $104,750 for real estate taxes, as well as a Holdback Reserve of $5,000,000. The Holdback Reserve will be disbursed in whole or in part provided the following conditions are satisfied (i) a minimum NOI debt yield of 9.4% is achieved based on a loan amount equal to $82.0 million plus the amount of the Holdback Reserve, and (ii) no event of default has occurred or is continuing. If the Holdback Reserve has not been fully released by February 27, 2018 the lender may apply the unreleased proceeds to pay down the loan, and the borrower is required to pay any applicable yield maintenance premium. There are also upfront escrows in the amount of $1,096,348 for rent concessions for the following tenants: New Relic ($1,046,691), Brand.Net ($34,093) and Almanac ($15,564). There is an upfront escrow in the amount of $636,985 for outstanding tenant improvements and leasing costs (“TI/LC”) for the following tenants: New Relic ($539,962), Brand.Net ($58,113) and Almanac ($38,910).
The lender will take assignment of New Relic’s $5,068,057 security deposit ($69.06 per square foot of New Relic space, or approximately 14 months of rent) in the form of a Letter of Credit. New Relic is currently a defendant in a lawsuit filed by Computer Associates in the Eastern District of New York alleging violation of three patents. The lawsuit is in the preliminary stages, and discovery has not yet commenced. The plaintiff alleges New Relic is violating the three patents and is requesting a trial by jury plus a permanent injunction restraining New Relic from selling software or services based on the patents. According to New Relic’s lease, the security deposit may be reduced by $1,000,000 if, at any time during the lease term (including the renewal term), any of the following conditions apply (i) New Relic has a positive net cash flow for a 12-month period, combined with a minimum of $100.0 million of net revenue during such 12-month period; or (ii) New Relic has an initial public offering that raises no less than $75.0 million in cash, net of offering costs and debt repayment, if any; or (iii) New Relic is acquired by a reputable, creditworthy company with at least $100.0 million in cash on hand that assumes or guarantees in writing New Relic’s obligations under the lease in full.
The loan documents provide for ongoing monthly escrow deposits of $52,376 for real estate taxes, $5,788 for replacement reserves and $63,298 for TI/LC’s, subject to a cap of $3,568,116 ($3,223,500 for the 188 Spear Street property; $344,616 for the 208 Utah Street property). In the event that both Amazon and New Relic renew their lease for a term of at least five years, then the 188 Spear Street TI/LC cap will be reduced to $644,694. The loan documents do not require monthly escrow deposits for insurance provided the following conditions are satisfied (i) no event of default exists and is continuing; (ii) the liability and casualty policies maintained by the borrower are part of a blanket or umbrella policy approved by the lender; and (iii) the borrower provides the lender with evidence of renewal of the policies and paid receipts for the payment of insurance premiums when due.
Lockbox and Cash Management.The 188 Spear Street and 208 Utah Street Mortgage Loan requires a lender-controlled lockbox account, which is already in place, and that the tenants be directed to pay their rents directly to such lockbox account. The loan documents also require that all cash revenues and all other monies received by the borrower or the property manager relating to the 188 Spear Street and 208 Utah Street Properties be deposited into the lockbox account within three business days of receipt. Funds are then swept to a cash management account controlled by the servicer and applied in accordance with the cash management agreement. Prior to the occurrence of a Cash Trap Event Period (as defined below), all excess funds on deposit in the lockbox are swept into the borrower’s operating account on a daily basis.
Upon the occurrence of a Cash Trap Event Period all excess funds on deposit in the lockbox account will be swept to certain restricted accounts, and if an event of default exists, the lender will have the exclusive control of, and the right to withdraw and apply, the funds in the deposit account to payment of any and all debts, liabilities and obligations of the borrower in such order, proportion and priority as the lender may determine in its sole discretion.
A “Cash Trap Event Period” will commence upon the earlier of (i) the occurrence and continuance of an event of default; (ii) the NCF debt service coverage ratio (as defined in the loan documents) falling below 1.20x on an amortizing basis; (iii) the occurrence of an Amazon Cash Trap Event Period (as defined below); or (iv) the occurrence of a New Relic Cash Trap Event Period (as defined below). A Cash Trap Event Period will expire upon (a) in the case of an event of default, the cure of such event of default; (b) in the case of the NCF debt service coverage ratio falling below 1.20x, the NCF debt service coverage ratio being at least 1.20x for two consecutive calendar quarters; (c) in the case of an Amazon Cash Trap Event Period, an Amazon Cure Condition (as defined below); and (d) in the case of an a New Relic Cash Trap Event Period, a New Relic Cure Condition (as defined below).
THE INFORMATION IN THIS STRUCTURAL AND COLLATERAL TERM SHEET IS NOT COMPLETE AND MAY BE AMENDED PRIOR TO THE TIME OF SALE. THIS TERM SHEET IS NOT AN OFFER TO SELL THESE SECURITIES AND IT IS NOT A SOLICITATION OF AN OFFER TO BUY THESE SECURITIES IN ANY JURISDICTION WHERE THE OFFER OR SALE IS NOT PERMITTED.
30
| 188 SPEAR STREET AND 208 UTAH STREET |
An “Amazon Cash Trap Event Period” will commence upon the earlier of (i) Amazon giving notice that it is terminating their lease for all or any portion of their space; (ii) any termination or cancellation of the Amazon lease and/or the Amazon lease failing to be in full force and effect; (iii) Amazon being the subject of any bankruptcy or similar insolvency proceeding; (iv) Amazon failing to extend or renew their lease on or prior to October 31, 2018 for a term of no less than five years. An “Amazon Cure Condition” shall mean (a) that Amazon has revoked or rescinded all termination notices and has re-affirmed the lease as being in full force and effect; (b) in the event of failure to renew their lease in accordance with clause (iv) above, Amazon has renewed their lease for a term of at least five years; (c) in the event of any bankruptcy or similar insolvency proceeding, Amazon no longer being subject to any bankruptcy proceedings and Amazon affirming the lease; and (d) Amazon paying full, unabated rent in accordance with their lease.
A “New Relic Cash Trap Event Period” will commence upon the earlier of (i) New Relic being the subject of a bankruptcy or similar insolvency proceeding, or (ii) New Relic failing to extend or renew their lease on or prior to January 31, 2019 for a term of no less than five years. A “New Relic Cure Condition” shall mean (a) in the event of failure to renew their lease in accordance with clause (ii) above, New Relic has renewed their lease for a term of no less than five years, and (b) in the event of a bankruptcy or similar insolvency proceeding, New Relic no longer being subject to any bankruptcy proceedings and New Relic affirming the lease; (c) New Relic paying full, unabated rent in accordance with their lease.
Property Management. The 188 Spear Street and 208 Utah Street Properties are managed by an affiliate of the borrower.
Assumption. The borrower has a two-time right to transfer the 188 Spear Street and 208 Utah Street Properties, provided that no event of default has occurred and is continuing and certain other conditions are satisfied, including, but not limited to: (i) the lender’s reasonable determination that the proposed transferee and guarantor satisfy the lender’s credit review and underwriting standards, taking into consideration transferee experience, financial strength and general business standing; (ii) execution of a recourse guaranty and an environmental indemnity by an affiliate of the transferee; and (iii) if requested by the lender, rating agency confirmation from Fitch and Moody’s that the transfer will not result in a downgrade, withdrawal or qualification of the respective ratings assigned to the Series 2013-C13 Certificates.
Partial Release.Following the second anniversary of the issuance of the Series 2013-C13 Certificates, the borrower is permitted to release either of the 188 Spear Street and 208 Utah Street Properties in connection with a partial defeasance upon the satisfaction of certain conditions, including but not limited to: (i) defeasance of a portion of the loan in an amount equal to 110% of the allocated loan amount for the individual release property; (ii) the post-release NOI debt yield shall not be less than the greater of (a) the pre-release NOI debt yield and (b) 8.2%; (iii) the post-release loan-to-value ratio shall not be greater than (a) the pre-release loan-to-value ratio and (b) 57.0%; (iv) rating agency confirmation from Fitch and Moody’s that the release will not result in a downgrade, withdrawal or qualification of the respective ratings assigned to the Series 2013-C13 Certificates; and (v) an opinion of counsel that the REMIC trust will not fail to maintain its REMIC status due to the partial defeasance.
Real Estate Substitution.Not permitted.
Subordinate and Mezzanine Indebtedness.Future mezzanine debt is permitted subject to the satisfaction of certain conditions, including (i) that no event of default has occurred and is continuing; (ii) an intercreditor agreement is delivered in form and substance reasonably acceptable to the lender; (iii) the aggregate loan-to-value ratio will not exceed 70.0%; (iv) the aggregate DSCR is not less than 1.25x on an amortizing basis; (v) the holder of the mezzanine debt and any transferees shall be reasonably acceptable to the lender; and (vi) rating agency confirmation from Fitch and Moody’s that the debt will not result in a downgrade, withdrawal or qualification of the respective ratings assigned to the Series 2013-C13 Certificates.
Ground Lease. None.
Terrorism Insurance. The loan documents require that the “all risk” insurance policy required to be maintained by the borrower provide coverage for terrorism in an amount equal to the full replacement cost of the 188 Spear Street and 208 Utah Street Properties. The loan documents also require business interruption insurance covering no less than the 18-month period following the occurrence of a casualty event, together with a six-month extended period of indemnity.
THE INFORMATION IN THIS STRUCTURAL AND COLLATERAL TERM SHEET IS NOT COMPLETE AND MAY BE AMENDED PRIOR TO THE TIME OF SALE. THIS TERM SHEET IS NOT AN OFFER TO SELL THESE SECURITIES AND IT IS NOT A SOLICITATION OF AN OFFER TO BUY THESE SECURITIES IN ANY JURISDICTION WHERE THE OFFER OR SALE IS NOT PERMITTED.
31
| 301 SOUTH COLLEGE STREET |

THE INFORMATION IN THIS STRUCTURAL AND COLLATERAL TERM SHEET IS NOT COMPLETE AND MAY BE AMENDED PRIOR TO THE TIME OF SALE. THIS TERM SHEET IS NOT AN OFFER TO SELL THESE SECURITIES AND IT IS NOT A SOLICITATION OF AN OFFER TO BUY THESE SECURITIES IN ANY JURISDICTION WHERE THE OFFER OR SALE IS NOT PERMITTED.
32
| 301 SOUTH COLLEGE STREET |
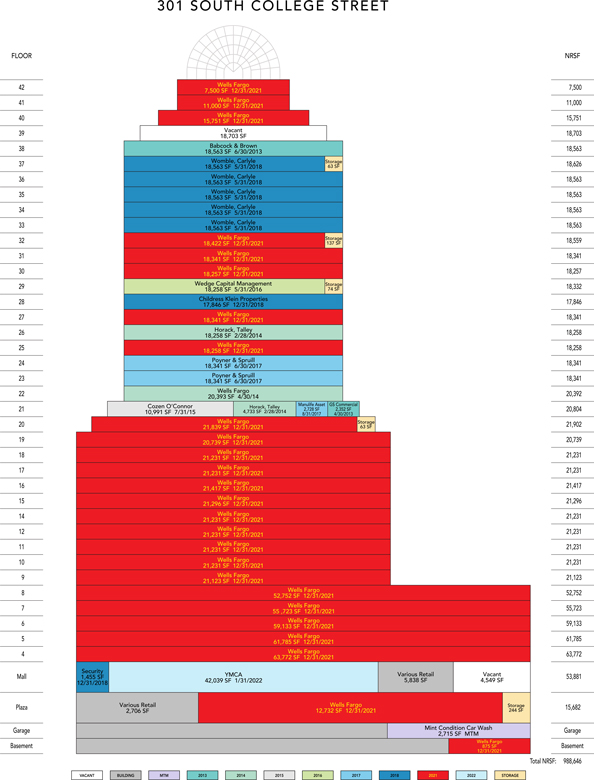
THE INFORMATION IN THIS STRUCTURAL AND COLLATERAL TERM SHEET IS NOT COMPLETE AND MAY BE AMENDED PRIOR TO THE TIME OF SALE. THIS TERM SHEET IS NOT AN OFFER TO SELL THESE SECURITIES AND IT IS NOT A SOLICITATION OF AN OFFER TO BUY THESE SECURITIES IN ANY JURISDICTION WHERE THE OFFER OR SALE IS NOT PERMITTED.
33
| 301 SOUTH COLLEGE STREET |

THE INFORMATION IN THIS STRUCTURAL AND COLLATERAL TERM SHEET IS NOT COMPLETE AND MAY BE AMENDED PRIOR TO THE TIME OF SALE. THIS TERM SHEET IS NOT AN OFFER TO SELL THESE SECURITIES AND IT IS NOT A SOLICITATION OF AN OFFER TO BUY THESE SECURITIES IN ANY JURISDICTION WHERE THE OFFER OR SALE IS NOT PERMITTED.
34
No. 2 – 301 South College Street
Loan Information
| Mortgage Loan Seller: | Wells Fargo Bank, National Association | |
| Credit Assessment | ||
| (Fitch/Moody’s): | NR/NR | |
| Original Principal Balance(1): | $85,000,000 | |
| Cut-off Date Principal Balance(1): | $85,000,000 | |
| % of Initial Pool Balance: | 9.7% | |
| Loan Purpose: | Acquisition | |
| Borrower Name: | WF Property Owner, L.P. | |
| Sponsors(2): | Various | |
| Mortgage Rate: | 3.935% | |
| Note Date: | April 11, 2013 | |
| Anticipated Repayment Date: | NAP | |
| Maturity Date: | May 1, 2023 | |
| IO Period: | 60 months | |
| Loan Term (Original): | 120 months | |
| Seasoning: | 0 months | |
| Amortization Term (Original): | 360 months | |
| Loan Amortization Type: | Interest-only, Amortizing Balloon | |
| Interest Accrual Method: | Actual/360 | |
| Call Protection: | L(24), D or GRTR 1% or YM(89), O(7) | |
| Lockbox Type: | Hard/Upfront Cash Management | |
| Additional Debt(1): | Yes | |
| Additional Debt Type(1): | Pari Passuand Future Mezzanine |
Escrows and Reserves(3):
Type: | Initial | Monthly | Cap (If Any) | |||||||||
Taxes | $ | 1,016,861 | (3) | NAP | ||||||||
Insurance | $ | 0 | Springing | NAP | ||||||||
Replacement Reserves | $ | 0 | $ | 16,477 | NAP | |||||||
Wells Fargo Rollover Reserve | $ | 0 | Springing | NAP | ||||||||
Property Information
| Single Asset/Portfolio: | Single Asset | |
| Property Type: | Office | |
| Specific Property Type: | CBD | |
| Location: | Charlotte, NC | |
| Size: | 988,646 SF | |
| Cut-off Date Principal | ||
| Balance Per Unit/SF(1): | $177.01 | |
| Year Built/Renovated: | 1988/2010 | |
Title Vesting(4): | Fee/Leasehold | |
Property Manager: | CK Brokerage Company #2, | |
| Limited Partnership | ||
| 3rd Most Recent Occupancy (As of): | 98.3% (12/31/2010) | |
| 2nd Most Recent Occupancy (As of): | 97.8% (12/31/2011) | |
| Most Recent Occupancy (As of): | 97.9% (12/31/2012) | |
| Current Occupancy (As of): | 97.6% (2/1/2013) | |
Underwriting and Financial Information:
| ||
| 3rd Most Recent NOI (As of): | $15,467,318 (12/31/2010) | |
| 2nd Most Recent NOI (As of): | $16,011,720 (12/31/2011) | |
| Most Recent NOI (As of)(5): | $16,351,093 (12/31/2012) | |
| U/W Revenues: | $28,389,920 | |
| U/W Expenses: | $9,772,926 | |
| U/W NOI(5): | $18,616,994 | |
| U/W NCF: | $17,861,574 | |
| U/W NOI DSCR(1): | 1.87x | |
| U/W NCF DSCR(1): | 1.80x | |
| U/W NOI Debt Yield(1): | 10.6% | |
| U/W NCF Debt Yield(1): | 10.2% | |
| As-Is Appraised Value: | $250,000,000 | |
| As-Is Appraisal Valuation Date: | February 8, 2013 | |
| Cut-off Date LTV Ratio(1): | 70.0% | |
| LTV Ratio at Maturity or ARD(1): | 63.5% | |
| (1) | The 301 South College Street Loan Combination, totalling $175,000,000, is comprised of twopari passu notes (Notes A-1 and A-2). Note A-2 had an original balance of $85,000,000, has an outstanding principal balance as of the Cut-off Date of $85,000,000 and will be contributed to the WFRBS 2013-C13 Trust. Note A-1 had an original balance of $90,000,000 and is expected to be contributed to a future trust. All presented statistical information related to balances per square foot, loan-to-value ratios, debt service coverage ratios, and debt yields are based on the 301 South College Street Loan Combination. |
| (2) | The sponsors are Starwood Distressed Opportunity Fund IX-1 U.S., L.P. and Starwood Distressed Opportunity Fund IX Global, L.P., each of which are subsidiaries of Starwood Capital Group. |
| (3) | See “Escrows” section. |
| (4) | See “Ground Lease” section. |
| (5) | See “Cash Flow Analysis” section for detail on the increase from Most Recent NOI to U/W NOI. |
The Mortgage Loan. The mortgage loan (the “301 South College Street Loan Combination”) is evidenced by twopari passupromissory notes (Note A-1 and Note A-2) secured by a first mortgage encumbering a 42-story office building located in the central business district of Charlotte, North Carolina (the “301 South College Street Property”). The 301 South College Street Loan Combination was originated on April 11, 2013 by Wells Fargo Bank, National Association. The 301 South College Street Loan Combination had an original balance of $175,000,000, has an outstanding principal balance as of the Cut-off Date of $175,000,000 and accrues interest at an interest rate of 3.935% per annum. The 301 South College Street Loan Combination had an initial term of 120 months, has a remaining term of 120 months as of the Cut-off Date and requires interest-only payments for the first 60 months following origination and thereafter requires payments of principal and interest based on a 30-year amortization schedule. The 301 South College Street Loan Combination matures on May 1, 2023.
THE INFORMATION IN THIS STRUCTURAL AND COLLATERAL TERM SHEET IS NOT COMPLETE AND MAY BE AMENDED PRIOR TO THE TIME OF SALE. THIS TERM SHEET IS NOT AN OFFER TO SELL THESE SECURITIES AND IT IS NOT A SOLICITATION OF AN OFFER TO BUY THESE SECURITIES IN ANY JURISDICTION WHERE THE OFFER OR SALE IS NOT PERMITTED.
35
| 301 SOUTH COLLEGE STREET |
Note A-2 will be contributed to the WFRBS 2013-C13 Trust, had an original principal balance of $85,000,000 and has an outstanding principal balance as of the Cut-off Date of $85,000,000 (the “301 South College Street Mortgage Loan”). Note A-1 had an original principal balance of $90,000,000, is expected to be securitized in a future trust and will represent the controlling interest in the 301 South College Street Loan Combination (the “301 South College Street Companion Loan”). See “Description of the Mortgage Pool – Additional Indebtedness – The 301 South College Street Loan Combination” and “The Pooling and Servicing Agreement – Servicing of the Loan Combinations” in the Free Writing Prospectus.
Following the lockout period, the borrower has the right to either (i) defease the 301 South College Street Loan Combination in whole, but not in part, or (ii) voluntarily prepay the 301 South College Street Loan Combination in whole, but not in part, provided the borrower pays the greater of a yield maintenance premium or a prepayment premium equal to 1.0% of the outstanding principal balance. In addition, the 301 South College Street Loan Combination is prepayable without penalty on or after November 1, 2022.
Sources and Uses
Sources | Uses | |||||||||||||||||||
Original loan combination amount | $ | 175,000,000 | 70.6 | % | Purchase price | $ | 245,000,000 | 98.9 | % | |||||||||||
Sponsor’s new cash contribution | 72,815,121 | 29.4 | Reserves | 1,016,861 | 0.4 | |||||||||||||||
| Closing costs | 1,798,260 | 0.7 | ||||||||||||||||||
|
|
|
|
|
|
|
| |||||||||||||
Total Sources | $ | 247,815,121 | 100.0 | % | Total Uses | $ | 247,815,121 | 100.0 | % | |||||||||||
|
|
|
|
|
|
|
| |||||||||||||
The Property. The 301 South College Street Property is a 42-story, class A office building containing approximately 988,646 square feet located in the central business district of Charlotte, North Carolina. Built in 1988, the 301 South College Street Property is situated on a 2.2-acre parcel and contains approximately 1,081 garage parking spaces. The 301 South College Street Property contains 55,097 square feet of retail space, including the 42,039 square foot state-of-the-art Childress Klein YMCA, which features two half court basketball courts, a five lane indoor heated swimming pool and an on-site fitness bar. Further, the 301 South College Street Property is connected to the four-star, 422-room full service Hilton Center City Hotel. The 301 South College Street Property serves as the East Coast headquarters for Wells Fargo, after having served as the headquarters for both First Union Bank and Wachovia Bank prior to their acquisition by Wells Fargo. The 301 South College Street Property houses Wells Fargo’s Securities and Investment Group, Community and Business Banking Groups and Legal Departments. See “Risks Related To Conflicts Of Interest - Interests and Incentives of the Originators, the Sponsors and Their Affiliates May Not Be Aligned With Your Interests” in the Free Writing Prospectus. Other tenants include the two largest law firms in North Carolina (Womble Carlyle and Poyner Spruill). Over the past seven years, over $25.0 million has been spent on capital improvements, including modernization of the building’s 25 elevators, renovation of the outdoor plaza and replacement of cooling towers. As of February 1, 2013, the 301 South College Street Property was 97.6% leased to 29 tenants.
The following table presents certain information relating to the tenancies at the 301 South College Street Property:
Major Tenants
Tenant Name | Credit Rating (Fitch/Moody’s/ S&P) (1) | Tenant NRSF | % of NRSF | Annual U/W Base Rent PSF (2) | Annual U/W Base Rent (2) | % of Total Annual U/W Base Rent | Lease Expiration Date | |||||||||||||||||||||
Major Tenants | ||||||||||||||||||||||||||||
Wells Fargo | AA-/Aa3/AA- | 686,834 | (3) | 69.5 | % | $ | 22.59 | (4) | $ | 15,515,832 | (4) | 68.0 | % | 12/31/2021 | (5) | |||||||||||||
Womble Carlyle | NR/NR/NR | 92,815 | (6) | 9.4 | % | $ | 31.15 | $ | 2,891,217 | 12.7 | % | 5/31/2018 | ||||||||||||||||
Poyner Spruill | NR/NR/NR | 36,682 | 3.7 | % | $ | 26.92 | $ | 987,635 | 4.3 | % | 6/30/2017 | |||||||||||||||||
YMCA | NR/NR/NR | 42,039 | 4.3 | % | $ | 15.83 | $ | 665,487 | 2.9 | % | 1/31/2022 | |||||||||||||||||
Horack, Talley | NR/NR/NR | 22,991 | 2.3 | % | $ | 24.98 | $ | 574,326 | 2.5 | % | 2/28/2014 | |||||||||||||||||
|
|
|
|
|
|
|
| |||||||||||||||||||||
Total Major Tenants | 881,361 | 89.1 | % | $ | 23.41 | $ | 20,634,497 | 90.4 | % | |||||||||||||||||||
Non-Major Tenants | 84,033 | 8.5 | % | $ | 26.10 | $ | 2,193,082 | 9.6 | % | |||||||||||||||||||
|
|
|
|
|
|
|
| |||||||||||||||||||||
Occupied Collateral Total | 965,394 | 97.6 | % | $ | 23.65 | $ | 22,827,579 | 100.0 | % | |||||||||||||||||||
|
|
|
| |||||||||||||||||||||||||
Vacant Space | 23,252 | 2.4 | % | |||||||||||||||||||||||||
|
|
|
| |||||||||||||||||||||||||
Collateral Total | 988,646 | 100.0 | % | |||||||||||||||||||||||||
|
|
|
| |||||||||||||||||||||||||
| (1) | Certain ratings are those of the parent company whether or not the parent guarantees the lease. |
| (2) | Annual U/W Base Rent PSF and Annual U/W Base Rent include contractual rent steps through August 2013, unless otherwise noted. |
| (3) | Wells Fargo subleases 3,056 square feet to Fujos on the plaza level. Square footage is shown inclusive of the sublease space. |
| (4) | Wells Fargo’s Annual U/W Base Rent PSF and Annual U/W Base Rent was derived by averaging the annual rent over the lease term on 617,789 square feet of space, which includes a contractual rent increase in January 2017. The current in-place rent is $17.75 per square foot, resulting in approximately $10,964,110 of annual base rent. |
| (5) | 20,392 square feet of the Wells Fargo space is scheduled to expire April 30, 2014. |
| (6) | Womble Carlyle subleases 5,613 square feet to Clarus Properties and 7,997 square feet to Bryan Cave. Square footage is shown inclusive of the sublease space. |
THE INFORMATION IN THIS STRUCTURAL AND COLLATERAL TERM SHEET IS NOT COMPLETE AND MAY BE AMENDED PRIOR TO THE TIME OF SALE. THIS TERM SHEET IS NOT AN OFFER TO SELL THESE SECURITIES AND IT IS NOT A SOLICITATION OF AN OFFER TO BUY THESE SECURITIES IN ANY JURISDICTION WHERE THE OFFER OR SALE IS NOT PERMITTED.
36
| 301 SOUTH COLLEGE STREET |
The following table presents certain information relating to the lease rollover schedule at the 301 South College Street Property:
Lease Expiration Schedule(1)(2)
Year Ending December 31, | No. of Leases Expiring | Expiring NRSF | % of Total NRSF | Cumulative Expiring NRSF | Cumulative % of Total NRSF | Annual U/W Base Rent | Annual U/W Base Rent PSF(3) | |||||||||||||||||||||
MTM | 7 | 3,331 | 0.3 | % | 3,331 | 0.3 | % | $ | 4,616 | $ | 1.39 | |||||||||||||||||
2013 | 4 | 22,634 | 2.3 | % | 25,965 | 2.6 | % | $ | 586,474 | $ | 25.91 | |||||||||||||||||
2014 | 3 | 43,757 | 4.4 | % | 69,722 | 7.1 | % | $ | 1,103,402 | $ | 25.22 | |||||||||||||||||
2015 | 3 | 13,297 | 1.3 | % | 83,019 | 8.4 | % | $ | 377,513 | $ | 28.39 | |||||||||||||||||
2016 | 2 | 19,006 | 1.9 | % | 102,025 | 10.3 | % | $ | 509,755 | $ | 26.82 | |||||||||||||||||
2017 | 3 | 39,991 | 4.0 | % | 142,016 | 14.4 | % | $ | 1,086,081 | $ | 27.16 | |||||||||||||||||
2018 | 4 | 113,838 | 11.5 | % | 255,854 | 25.9 | % | $ | 3,468,321 | $ | 30.47 | |||||||||||||||||
2019 | 1 | 1,059 | 0.1 | % | 256,913 | 26.0 | % | $ | 29,652 | $ | 28.00 | |||||||||||||||||
2020 | 0 | 0 | 0.0 | % | 256,913 | 26.0 | % | $ | 0 | $ | 0.00 | |||||||||||||||||
2021 | 1 | 666,442 | 67.4 | % | 923,355 | 93.4 | % | $ | 14,996,278 | $ | 22.50 | |||||||||||||||||
2022 | 1 | 42,039 | 4.3 | % | 965,394 | 97.6 | % | $ | 665,487 | $ | 15.83 | |||||||||||||||||
2023 | 0 | 0 | 0.0 | % | 965,394 | 97.6 | % | $ | 0 | $ | 0.00 | |||||||||||||||||
Thereafter | 0 | 0 | 0.0 | % | 965,394 | 97.6 | % | $ | 0 | $ | 0.00 | |||||||||||||||||
Vacant | 0 | 23,252 | 2.4 | % | 988,646 | 100.0 | % | $ | 0 | $ | 0.00 | |||||||||||||||||
|
|
|
|
|
|
|
|
|
| |||||||||||||||||||
Total/Weighted Average | 29 | 988,646 | 100.0 | % | $ | 22,827,579 | $ | 23.65 | ||||||||||||||||||||
|
|
|
|
|
|
|
|
|
| |||||||||||||||||||
| (1) | Information obtained from the underwritten rent roll. |
| (2) | Certain tenants may have lease termination options that are exercisable prior to the stated expiration date of the subject lease and that are not considered in the Lease Expiration Schedule. |
| (3) | Weighted Average Annual U/W Base Rent PSF excludes vacant space. |
The following table presents historical occupancy percentages at the 301 South College Street Property:
Historical Occupancy(1)
12/31/2010 | 12/31/2011 | 12/31/2012 | 2/1/2013 | |||
98.3% | 97.8% | 97.9% | 97.6% |
| (1) | Information obtained from the borrower. |
Operating History and Underwritten Net Cash Flow.The following table presents certain information relating to the historical operating performance and the Underwritten Net Cash Flow at the 301 South College Street Property:
Cash Flow Analysis
| 2010 | 2011 | 2012 | U/W(1) | U/W $ per SF | ||||||||||||||||
Base Rent | $ | 19,933,195 | $ | 20,000,221 | $ | 19,964,414 | $ | 22,827,579 | $ | 23.09 | ||||||||||
Grossed Up Vacant Space | 0 | 0 | 0 | 651,056 | 0.66 | |||||||||||||||
Total Reimbursables | 2,367,041 | 3,805,598 | 3,407,546 | 3,407,546 | 3.45 | |||||||||||||||
Other Income | 2,547,156 | 2,595,555 | 2,677,671 | 2,677,671 | 2.71 | |||||||||||||||
Less Vacancy & Credit Loss | 0 | (275,115 | ) | 0 | (1,173,932 | )(2) | (1.19 | ) | ||||||||||||
|
|
|
|
|
|
|
|
|
| |||||||||||
Effective Gross Income | $ | 24,847,393 | $ | 26,126,259 | $ | 26,049,630 | $ | 28,389,920 | $ | 28.72 | ||||||||||
Total Operating Expenses | $ | 9,380,075 | $ | 10,114,539 | $ | 9,698,537 | $ | 9,772,926 | $ | 9.89 | ||||||||||
|
|
|
|
|
|
|
|
|
| |||||||||||
Net Operating Income | $ | 15,467,318 | $ | 16,011,720 | $ | 16,351,093 | $ | 18,616,994 | $ | 18.83 | ||||||||||
TI/LC | 0 | 0 | 0 | 557,691 | 0.56 | |||||||||||||||
Capital Expenditures | 0 | 0 | 0 | 197,729 | 0.20 | |||||||||||||||
|
|
|
|
|
|
|
|
|
| |||||||||||
Net Cash Flow | $ | 15,467,318 | $ | 16,011,720 | $ | 16,351,093 | $ | 17,861,574 | $ | 18.07 | ||||||||||
NOI DSCR(3) | 1.55x | 1.61x | 1.64x | 1.87x | ||||||||||||||||
NCF DSCR(3) | 1.55x | 1.61x | 1.64x | 1.80x | ||||||||||||||||
NOI DY(3) | 8.8 | % | 9.1 | % | 9.3 | % | 10.6 | % | ||||||||||||
NCF DY(3) | 8.8 | % | 9.1 | % | 9.3 | % | 10.2 | % | ||||||||||||
| (1) | The increase in U/W Effective Gross Income and U/W Net Operating Income from the Effective Gross Income and Net Operating Income for 2012 is primarily attributable to the Annual U/W Base Rent for Wells Fargo. Wells Fargo’s Annual U/W Base Rent was derived by averaging the annual rent over the lease term for 616,914 square feet of Wells Fargo space, which includes a contractual rent increase in January 2017. The current in-place rent is $17.75 per square foot, resulting in approximately $10,964,110 of annual base rent. Rent for this space was underwritten to $22.27 per square foot, resulting in approximately $13,741,255 of underwritten rent. |
| (2) | The underwritten economic vacancy is 5.0%. The 301 South College Street Property was 97.6% physically occupied as of February 1, 2013. |
| (3) | DSCRs and debt yields are based on the 301 South College Street Loan Combination on an aggregate basis. |
THE INFORMATION IN THIS STRUCTURAL AND COLLATERAL TERM SHEET IS NOT COMPLETE AND MAY BE AMENDED PRIOR TO THE TIME OF SALE. THIS TERM SHEET IS NOT AN OFFER TO SELL THESE SECURITIES AND IT IS NOT A SOLICITATION OF AN OFFER TO BUY THESE SECURITIES IN ANY JURISDICTION WHERE THE OFFER OR SALE IS NOT PERMITTED.
37
| 301 SOUTH COLLEGE STREET |
Appraisal.As of the appraisal valuation date of February 8, 2013, the 301 South College Street Property had an “as-is” appraised value of $250,000,000.
Environmental Matters.According to the Phase I environmental site assessment dated January 25, 2013, there was evidence of a recognized environmental condition related to two underground storage tank (“UST”) sites. One 1,000-gallon diesel fuel UST was abandoned in place at the 301 South College Street Property and given a ‘no further action’ status from the North Carolina Department of Environment and Natural Resources. A second 8,000-gallon diesel fuel UST is located onsite and is planned for closure in the spring of 2013. Documentation was provided which demonstrates that Wells Fargo is the owner of the UST and maintains responsibility for the removal of the UST and any related contamination associated with it. As such, no additional assessment is required.
Market Overview and Competition. According to the appraisal, the 301 South College Street Property is located at the southeast corner of the intersection of South College Street and Martin Luther King Jr. Drive in the central business district of Charlotte, North Carolina. The 301 South College Street Property is located adjacent to Two Wells Fargo Center and Three Wells Fargo Center, creating a corporate campus in an urban setting. The 301 South College Street Property is also located adjacent to a LYNX light rail station, accessible from the 301 South College Street Property lobby, making it one of only three office buildings in Charlotte with direct light rail access. Further, the 301 South College Property is connected to the Overstreet Mall retail corridor, which is a series of second floor walkways and pedestrian bridges traversing the Charlotte central business district. The walkways provide shelter from the weather and access to numerous retailers, office buildings, and hotels. Other nearby attractions within one mile include the Duke Energy Corporate Center and Levine Center for the Arts, the NASCAR Hall of Fame, the Time Warner Cable Arena, Bank of America Stadium and the Charlotte Convention Center. As of November 2012, the unemployment rate for the Charlotte metropolitan statistical area was 9.0%. The 2012 population within the Charlotte metropolitan statistical area was approximately 1.8 million and is expected to grow by 1.9% annually from 2012 to 2016. The estimated 2012 average household income within the Charlotte metropolitan statistical area was $69,255.
According to the appraisal, the 301 South College Street Property is located within the Uptown submarket, which contains approximately 15.4 million square feet of office space, approximately 35.8% of the Charlotte office market inventory. The submarket contains approximately 11.5 million square feet of class A space. As of the third quarter of 2012, the Uptown submarket vacancy was approximately 11.2%. The average vacancy rate for class A+ space (301 South College Street, Duke Energy Center, Bank of America Corporate Center, Hearst Tower, Three Wells Fargo Center, One Bank of America Center and Fifth Third Center) was 4.8%, as of the third quarter of 2012. The rental rate for the Uptown class A submarket is approximately $26.80 per square foot, on a full service gross basis, as of the third quarter of 2012.
The following table presents certain information relating to comparable office properties for the 301 South College Street Property:
Competitive Set(1)
| 301 South College Street (Subject) | 1 Bank of America Center | Bank of America Corporate Center | Fifth Third Center | Bank of America Plaza | Three Wells Fargo Center | Duke Energy Center | ||||||||
Location | Charlotte, NC | Charlotte, NC | Charlotte, NC | Charlotte, NC | Charlotte, NC | Charlotte, NC | Charlotte, NC | |||||||
Distance from Subject | — | 0.3 miles | 0.4 miles | 0.2 miles | 0.2 miles | 0.1 miles | 0.2 miles | |||||||
Property Type | Office | Office | Office | Office | Office | Office | Office | |||||||
Year Built/Renovated | 1988/2012 | 2010/NAV | 1992/NAV | 1997/NAV | 1974/1992 | 1999/NAV | 2010/NAV | |||||||
Number of Stories | 42 | 32 | 60 | 30 | 40 | 32 | 48 | |||||||
Total GLA | 988,646 SF | 750,000 SF | 1,118,979 SF | 682,836 SF | 866,810 SF | 930,733 SF | 1,300,000 SF | |||||||
Total Occupancy | 98% | 100% | 91% | 83% | 91% | 100% | 99% |
| (1) | Information obtained from the appraisal dated March 5, 2013. |
The Borrower.The borrower is WF Property Owner, L.P., a Delaware limited partnership and single purpose entity with two independent directors. Legal counsel to the borrower delivered a non-consolidation opinion in connection with the origination of the 301 South College Street Loan Combination. The two sponsor entities, which are indirect owners of the borrower, are Starwood Distressed Opportunity Fund IX-1 U.S., L.P. and Starwood Distressed Opportunity Fund IX Global, L.P. (the “301 South College Street Mortgage Loan Sponsors”), the guarantors of certain nonrecourse carveouts under the 301 South College Street Loan Combination. Starwood Property Trust, Inc. and Starwood Capital Group have entered into an agreement to acquire LNR Property LLC, which is the ultimate parent company of LNR Partners, LLC, the initial Series 2013-C13 Special Servicer and initial Majority Subordinate Certificate Holder. See “Risks Related to Conflicts of Interest – “Potential Conflicts of Interest of the Master Servicers and Special Servicers” in the Free Writing Prospectus.
The Sponsor.The 301 South College Street Mortgage Loan Sponsors are subsidiaries of Starwood Capital Group. Starwood Capital Group has invested over $12.0 billion of equity since 1991 in real estate investments of all types. As of September 30, 2012, these investments have included over 2,200 hotels, 64,400 multifamily and condominium units, 32.8 million square feet of office, 23 million square feet of retail and 9.3 million square feet of industrial space.
THE INFORMATION IN THIS STRUCTURAL AND COLLATERAL TERM SHEET IS NOT COMPLETE AND MAY BE AMENDED PRIOR TO THE TIME OF SALE. THIS TERM SHEET IS NOT AN OFFER TO SELL THESE SECURITIES AND IT IS NOT A SOLICITATION OF AN OFFER TO BUY THESE SECURITIES IN ANY JURISDICTION WHERE THE OFFER OR SALE IS NOT PERMITTED.
38
| 301 SOUTH COLLEGE STREET |
Escrows.The loan documents provide for an upfront escrow at closing in the amount of $1,016,861 for taxes. The loan documents provide for monthly deposits in an amount equal to one-twelfth of the real estate taxes that will be payable during the following 12 months and $16,477 for replacement reserves. The loan documents do not require monthly escrow deposits for insurance provided the following conditions are satisfied: (i) no event of default exists and is continuing; (ii) the liability and casualty policies maintained by the borrower are part of a blanket or umbrella policy approved by the lender; and (iii) the borrower provides the lender with evidence of renewal of the policies and paid receipts for the payment of insurance premiums when due.
Beginning upon the occurrence of a Cash Trap Event Period (as defined below), and provided no event of default exists, caused by a Wells Fargo Lease Expiration Event (as defined below), all excess cash flow will be swept to the Wells Fargo Rollover Reserve account to be used for tenant improvements and leasing commissions relating to the renewal or releasing of the Wells Fargo space. The excess cash flow shall continue to accumulate until an amount equal to $30.00 per square foot of all terminated space or space being vacated.
A “Wells Fargo Lease Expiration Event” shall mean the expiration of the option to renew the Wells Fargo lease on any portion of its space.
Lockbox and Cash Management.The 301 South College Street Loan Combination requires a lender-controlled lockbox account, which is already in place, and that the tenants be directed to pay their rents directly to such lockbox account. The loan documents also require that all cash revenues and all other monies received by the borrower or the property manager relating to the 301 South College Street Property be deposited into the lockbox account within one business day of receipt. Funds are then swept into a cash management account controlled by the servicer and applied in accordance with cash management agreement. Prior to the occurrence of a Cash Trap Event Period, all excess funds on deposit in the lockbox are swept into the borrower’s operating account on a monthly basis.
Upon the occurrence of a Cash Trap Event Period all excess funds on deposit in the lockbox account will be swept to certain restricted accounts, and if an event of default exists, the lender will have the exclusive control of, and the right to withdraw and apply, the funds in the deposit account to payment of any and all debts, liabilities and obligations of the borrower in such order, proportion and priority as the lender may determine in its sole discretion.
A “Cash Trap Event Period” will commence upon the earlier of (i) the occurrence and continuance of an event of default or (ii) a Wells Fargo Lease Expiration Event. A Cash Trap Event Period will expire upon: (i) in the case of an event of default, the cure of such event of default, or (ii) in the case of a Wells Fargo Lease Expiration Event, the amount of the Wells Fargo Rollover Reserve totals an amount equal to $30.00 per square foot of all terminated space or space being vacated.
Property Management. The 301 South College Street Property is managed by CK Brokerage Company #2, Limited Partnership, an affiliate of Childress Klein Properties.
Assumption.The borrower has a four-time right to transfer the 301 South College Street Property, provided that no event of default has occurred and is continuing and certain other conditions are satisfied, including, but not limited to: (i) the lender’s reasonable determination that the proposed transferee and guarantor satisfy the lender’s credit review and underwriting standards, taking into consideration transferee experience, financial strength and general business standing; (ii) execution of a recourse guaranty and an environmental indemnity by an affiliate of the transferee; and (iii) if requested by the lender, rating agency confirmation from Fitch and Moody’s that the transfer will not result in a downgrade, withdrawal or qualification of the respective ratings assigned to the Series 2013-C13 Certificates, and similar confirmations with respect to the ratings of any securities backed by the 301 South College Street Companion Loan.
Partial Release.Not permitted.
Real Estate Substitution.Not permitted.
Subordinate and Mezzanine Indebtedness.Future mezzanine debt is permitted subject to satisfaction of certain conditions, including: (i) that no event of default has occurred and is continuing; (ii) the holder of the mezzanine debt and any transferees shall satisfy certain financial and/or operational criteria, as outlined in the 301 South College Street Mortgage Loan documents, or otherwise acceptable to the lender or applicable rating agencies; (iii) an intercreditor agreement in form and substance acceptable to Fitch and Moody’s and reasonably acceptable to the lender; (iv) the NOI debt yield is not less than 10.1%; (v) the aggregate loan-to-value ratio will not be greater than 70.0%; and (vi) mezzanine loan documents are acceptable to Fitch and Moody’s and reasonably acceptable to the lender. See “Annex E-2—Exceptions to Representations and Warranties” in the Free Writing Prospectus.
Ground Lease.A portion of the 301 South College Street Property is subject to a ground lease and sub-ground leases. The 301 South College Street borrower owns the fee interest in approximately 93% of the land area and has a sub-sub leasehold interest in the balance of the 301 South College Street Property. The related ground lessor is the North Carolina Railroad Company (a state agency), the lessee/sub-ground lessor is the Norfolk Southern Railway Company, and the sub-ground lessee/sub-sub ground lessor is Southern Region Industry Realty, Inc. The initial ground lease expires on December 31, 2067.
Terrorism Insurance.The loan documents require that the “all risk” insurance policy required to be maintained by the borrower provide coverage for terrorism in an amount equal to the full replacement cost of the 301 South College Street Property. The loan documents also require business interruption insurance covering no less than the 18-month period following the occurrence of a casualty event, together with a six-month extended period of indemnity.
THE INFORMATION IN THIS STRUCTURAL AND COLLATERAL TERM SHEET IS NOT COMPLETE AND MAY BE AMENDED PRIOR TO THE TIME OF SALE. THIS TERM SHEET IS NOT AN OFFER TO SELL THESE SECURITIES AND IT IS NOT A SOLICITATION OF AN OFFER TO BUY THESE SECURITIES IN ANY JURISDICTION WHERE THE OFFER OR SALE IS NOT PERMITTED.
39
| GSA PORTFOLIO |

THE INFORMATION IN THIS STRUCTURAL AND COLLATERAL TERM SHEET IS NOT COMPLETE AND MAY BE AMENDED PRIOR TO THE TIME OF SALE. THIS TERM SHEET IS NOT AN OFFER TO SELL THESE SECURITIES AND IT IS NOT A SOLICITATION OF AN OFFER TO BUY THESE SECURITIES IN ANY JURISDICTION WHERE THE OFFER OR SALE IS NOT PERMITTED.
40
| GSA PORTFOLIO |

THE INFORMATION IN THIS STRUCTURAL AND COLLATERAL TERM SHEET IS NOT COMPLETE AND MAY BE AMENDED PRIOR TO THE TIME OF SALE. THIS TERM SHEET IS NOT AN OFFER TO SELL THESE SECURITIES AND IT IS NOT A SOLICITATION OF AN OFFER TO BUY THESE SECURITIES IN ANY JURISDICTION WHERE THE OFFER OR SALE IS NOT PERMITTED.
41
No. 3 – GSA Portfolio
| Loan Information | ||
| Mortgage Loan Seller: | Wells Fargo Bank, National Association | |
| Credit Assessment | ||
| (Fitch/Moody’s): | NR/NR | |
| Original Principal Balance: | $50,000,000 | |
| Cut-off Date Principal Balance: | $50,000,000 | |
| % of Initial Pool Balance: | 5.7% | |
| Loan Purpose: | Acquisition | |
| Borrower Name(1): | Various | |
| Sponsor: | GSA Realty Holdings, LLC | |
| Mortgage Rate: | 4.150% | |
| Note Date: | March 1, 2013 | |
| Anticipated Repayment Date: | NAP | |
| Maturity Date: | March 1, 2023 | |
| IO Period: | 120 months | |
| Loan Term (Original): | 120 months | |
| Seasoning: | 2 months | |
| Amortization Term (Original): | NAP | |
| Loan Amortization Type: | Interest-only, Balloon | |
| Interest Accrual Method: | Actual/360 | |
| Call Protection: | L(26),D(90),O(4) | |
| Lockbox Type: | Springing (Without Established Account) | |
| Additional Debt: | None | |
| Additional Debt Type: | NAP | |
| Escrows and Reserves(2): | ||||||||||||
Type: | Initial | Monthly | Cap (If Any) | |||||||||
Taxes | $ | 0 | Springing | NAP | ||||||||
Insurance | $ | 0 | Springing | NAP | ||||||||
Replacement Reserves | $ | 0 | Springing | NAP | ||||||||
TI/LC | $ | 0 | Springing | (2) | ||||||||
| Properties Information | ||
Single Asset/Portfolio: | Portfolio | |
Properties Type: | Various – See Table | |
Specific Properties Type: | Various – See Table | |
Location: | Various – See Table | |
Size: | 341,412 SF | |
Cut-off Date Principal | ||
Balance Per Unit/SF: | $146.45 | |
Year Built/Renovated: | Various/Various – See Table | |
Title Vesting: | Fee | |
Property Manager(3): | Various | |
3rd Most Recent Occupancy(4): | NAV | |
2nd Most Recent Occupancy(4): | NAV | |
Most Recent Occupancy(4): | NAV | |
Current Occupancy (As of): | 98.4% (2/1/2013) | |
Underwriting and Financial Information: | ||
3rd Most Recent NOI(4): | NAV | |
2nd Most Recent NOI(4): | NAV | |
Most Recent NOI (As of)(5): | $6,482,970 (Various 2012) | |
U/W Revenues: | $8,688,841 | |
U/W Expenses: | $2,824,475 | |
U/W NOI: | $5,864,366 | |
U/W NCF: | $5,287,398 | |
U/W NOI DSCR: | 2.79x | |
U/W NCF DSCR: | 2.51x | |
U/W NOI Debt Yield: | 11.7% | |
U/W NCF Debt Yield: | 10.6% | |
As-Is Appraised Value: | $94,845,000 | |
As-Is Appraisal Valuation Date(6): | Various | |
Cut-off Date LTV Ratio: | 52.7% | |
LTV Ratio at Maturity or ARD: | 52.7% | |
| (1) | The borrower consists of 14 separate limited liability companies. |
| (2) | See “Escrows” section. |
| (3) | See “Property Management” section. |
| (4) | Historical occupancy and historical financial information prior to Most Recent NOI are not available as six of the 14 GSA Portfolio properties were built in 2011 and 2012. |
| (5) | Most Recent NOI represents annualized NOI for periods ranging in duration from five to 11 months and ending between August 31, 2012 and December 31, 2012 for 12 of the 14 GSA Portfolio properties. The Most Recent NOI for the DEA – Billings property represents the trailing 12-month NOI as of June 30, 2012. The most Recent NOI for the SSA – Muskegon property is not available as the building was constructed in 2012 and the tenant took occupancy in May 2012. |
| (6) | The As-Is Appraisal Valuation Dates range from January 3, 2013 to January 22, 2013. |
The Mortgage Loan. The mortgage loan (the “GSA Portfolio Mortgage Loan”) is evidenced by a single promissory note that is secured by a first mortgage encumbering 13 office buildings and one mixed use building located in 11 states (the “GSA Portfolio Properties”). The GSA Portfolio Mortgage Loan was originated on March 1, 2013 by Wells Fargo Bank, National Association. The GSA Portfolio Mortgage Loan had an original principal balance of $50,000,000, has an outstanding principal balance as of the Cut-off Date of $50,000,000 and accrues interest at an interest rate of 4.150% per annum. The GSA Portfolio Mortgage Loan had an initial term of 120 months, has a remaining term of 118 months as of the Cut-off Date and requires payments of interest-only through the term of the GSA Portfolio Mortgage Loan. The GSA Portfolio Mortgage Loan matures on March 1, 2023.
Following the lockout period, the borrower has the right to defease the GSA Portfolio Mortgage Loan in whole or in part on any due date before December 1, 2022. In addition, the GSA Portfolio Mortgage Loan is prepayable without penalty on or after December 1, 2022.
THE INFORMATION IN THIS STRUCTURAL AND COLLATERAL TERM SHEET IS NOT COMPLETE AND MAY BE AMENDED PRIOR TO THE TIME OF SALE. THIS TERM SHEET IS NOT AN OFFER TO SELL THESE SECURITIES AND IT IS NOT A SOLICITATION OF AN OFFER TO BUY THESE SECURITIES IN ANY JURISDICTION WHERE THE OFFER OR SALE IS NOT PERMITTED.
42
| GSA PORTFOLIO |
Sources and Uses
Sources | Uses | |||||||||||||||||
Original loan amount | $ | 50,000,000 | 51.0 | % | Purchase price | $ | 97,276,222 | 99.2 | % | |||||||||
Sponsor’s new cash contribution | 48,074,884 | 49.0 | % | Closing costs | 798,662 | 0.8 | % | |||||||||||
|
|
|
|
|
|
|
| |||||||||||
Total Sources | $ | 98,074,884 | 100.0 | % | Total Uses | $ | 98,074,884 | 100.0 | % | |||||||||
|
|
|
|
|
|
|
| |||||||||||
The Properties. The GSA Portfolio Mortgage Loan is secured by the fee interests in 13 suburban office buildings and one industrial and office mixed use building located in 11 states (Arizona, Wisconsin, Kentucky, Louisiana, North Carolina, Texas, Washington, Montana, Indiana, Alabama and Michigan). Thirteen of the 14 GSA Portfolio Properties were built between 2005 and 2012, and the IRS – Mesa property was built in 1986 and renovated in 2008. Thirteen of the 14 GSA Portfolio Properties are single tenanted by GSA tenants, and the IRS – Mesa property is currently occupied by one GSA tenant and one non-GSA tenant (underwritten as vacant). As of February 1, 2013, the GSA Portfolio Properties were 98.4% occupied by 14 GSA tenants.
The following table presents certain information relating to the GSA Portfolio Properties:
Property Name - Location | Property Type | Title Vesting | Allocated Cut-off Date Principal Balance | % of Portfolio Cut-off Date Principal Balance | Occupancy | Year Built/ Renovated | Net Rentable Area (SF) | Appraised Value | ||||||||||||||||||||
DEA – Milwaukee, WI | Office | Fee | $ | 6,700,000 | 13.4 | % | 100.0 | % | 2007/NAP | 29,931 | $ | 12,200,000 | ||||||||||||||||
DEA – Tucson, AZ | Mixed Use | Fee | $ | 6,600,000 | 13.2 | % | 100.0 | % | 2008/NAP | 63,501 | $ | 13,365,000 | ||||||||||||||||
SSA/ODAR – Lexington, KY | Office | Fee | $ | 5,665,000 | 11.3 | % | 100.0 | % | 2012/NAP | 44,000 | $ | 10,300,000 | ||||||||||||||||
FBI – Cary, NC | Office | Fee | $ | 4,800,000 | 9.6 | % | 100.0 | % | 2009/NAP | 25,458 | $ | 8,900,000 | ||||||||||||||||
IRS – Mesa, AZ | Office | Fee | $ | 4,035,000 | 8.1 | % | 81.6% | (1) | 1986/2008 | 30,462 | $ | 7,200,000 | ||||||||||||||||
Multi GSA – McAllen, TX | Office | Fee | $ | 3,890,000 | 7.8 | % | 100.0 | % | 2010/NAP | 29,323 | $ | 7,800,000 | ||||||||||||||||
MEPS – Spokane, WA | Office | Fee | $ | 3,250,000 | 6.5 | % | 100.0 | % | 2011/NAP | 20,328 | $ | 6,500,000 | ||||||||||||||||
FBI – Baton Rouge, LA | Office | Fee | $ | 3,150,000 | 6.3 | % | 100.0 | % | 2012/NAP | 14,398 | $ | 5,650,000 | ||||||||||||||||
SSA – Mesa, AZ | Office | Fee | $ | 2,800,000 | 5.6 | % | 100.0 | % | 2005/NAP | 23,084 | $ | 5,400,000 | ||||||||||||||||
DEA – Billings, MT | Office | Fee | $ | 2,500,000 | 5.0 | % | 100.0 | % | 2008/NAP | 13,599 | $ | 5,000,000 | ||||||||||||||||
SSA – Indianapolis, IN | Office | Fee | $ | 2,030,000 | 4.1 | % | 100.0 | % | 2012/NAP | 12,299 | $ | 3,830,000 | ||||||||||||||||
SSA – Lacombe, LA | Office | Fee | $ | 1,880,000 | 3.8 | % | 100.0 | % | 2011/NAP | 11,360 | $ | 3,700,000 | ||||||||||||||||
IRS – Huntsville, AL | Office | Fee | $ | 1,500,000 | 3.0 | % | 100.0 | % | 2010/NAP | 13,670 | $ | 2,700,000 | ||||||||||||||||
SSA – Muskegon, MI | Office | Fee | $ | 1,200,000 | 2.4 | % | 100.0 | % | 2012/NAP | 9,999 | $ | 2,300,000 | ||||||||||||||||
|
|
|
|
|
|
|
|
|
| |||||||||||||||||||
Total/Weighted Average | $ | 50,000,000 | 100.0 | % | 98.4 | % | 341,412 | $ | 94,845,000 | |||||||||||||||||||
|
|
|
|
|
|
|
|
|
| |||||||||||||||||||
| (1) | Crisis Pregnancy Center, which occupies 18.4% of the net rentable area of the IRS – Mesa property on a month-to-month lease, was underwritten as vacant. |
THE INFORMATION IN THIS STRUCTURAL AND COLLATERAL TERM SHEET IS NOT COMPLETE AND MAY BE AMENDED PRIOR TO THE TIME OF SALE. THIS TERM SHEET IS NOT AN OFFER TO SELL THESE SECURITIES AND IT IS NOT A SOLICITATION OF AN OFFER TO BUY THESE SECURITIES IN ANY JURISDICTION WHERE THE OFFER OR SALE IS NOT PERMITTED.
43
| GSA PORTFOLIO |
The following table presents certain information relating to the tenancies at the GSA Portfolio Properties:
Major Tenants
Tenant Name | Credit Rating (Fitch/ Moody’s/S&P) | Tenant NRSF | % of NRSF | Annual U/W Base Rent PSF | Annual U/W Base Rent | % of Total Annual U/W Base Rent | Lease Expiration Date | |||||||||||||||||
Major Tenants | ||||||||||||||||||||||||
GSA – DEA(1) | AAA/Aaa/AA+ | 107,031 | 31.3 | % | $ | 29.04 | $ | 3,108,481 | 34.3 | % | Various(1) | |||||||||||||
GSA – IRS(2) | AAA/Aaa/AA+ | 67,846 | 19.9 | % | $ | 25.21 | $ | 1,710,600 | 18.9 | % | Various(2) | |||||||||||||
GSA – Social Security Administration(3) | AAA/Aaa/AA+ | 56,742 | 16.6 | % | $ | 26.68 | $ | 1,513,688 | 16.7 | % | Various(3) | |||||||||||||
GSA – FBI(4) | AAA/Aaa/AA+ | 39,856 | 11.7 | % | $ | 31.32 | $ | 1,248,285 | 13.8 | % | Various(4) | |||||||||||||
GSA – Office of Disability Adjudication & Review(5) | AAA/Aaa/AA+ | 44,000 | 12.9 | % | $ | 19.69 | $ | 866,523 | 9.6 | % | 4/2/2027 | |||||||||||||
GSA – Military Entrance Processing Station(6) | AAA/Aaa/AA+ | 20,328 | 6.0 | % | $ | 30.43 | $ | 618,581 | 6.8 | % | 1/31/2026 | |||||||||||||
|
|
|
|
|
|
|
| |||||||||||||||||
Total Major Tenants | 335,803 | 98.4% | $ | 27.00 | $ | 9,066,158 | 100.0% | |||||||||||||||||
|
|
|
| |||||||||||||||||||||
|
|
|
| |||||||||||||||||||||
Vacant Space(7) | 5,609 | 1.6% | ||||||||||||||||||||||
Collateral Total | 341,412 | 100.0% | ||||||||||||||||||||||
|
|
|
| |||||||||||||||||||||
| (1) | GSA – DEA leases three spaces (63,501 square feet at the DEA – Tucson property with an Annual U/W Base Rent PSF of $20.32 and Lease Expiration Date of November 30, 2026; 29,931 square feet at the DEA – Milwaukee property with an Annual U/W Base Rent PSF of $46.32 and Lease Expiration Date of May 1, 2023; and 13,599 square feet at the DEA – Billings property with an Annual U/W Base Rent PSF of $31.77 and Lease Expiration Date of December 8, 2023). The tenant has the right to terminate its lease at the DEA – Tucson property at any time on or after November 1, 2021 with 90 days notice. |
| (2) | GSA – IRS leases three spaces (29,323 square feet at the Multi GSA – McAllen property with an Annual U/W Base Rent PSF of $25.40 and Lease Expiration Date of October 31, 2025; 24,853 square feet at the IRS – Mesa property with an Annual U/W Base Rent PSF of $26.29 and Lease Expiration Date of March 31, 2028; and 13,670 square feet at the IRS – Huntsville property with an Annual U/W Base Rent PSF of $22.86 and Lease Expiration Date of February 28, 2021). The tenant has the right to terminate its lease at the IRS – Mesa property at any time on or after April 1, 2018 with 90 days notice. The tenant has the right to terminate its lease at the IRS – Huntsville property at any time on or after March 1, 2016 with 60 days notice. |
| (3) | GSA – Social Security Administration leases four spaces (23,084 square feet at the SSA – Mesa property with an Annual U/W Base Rent PSF of $22.94 and Lease Expiration Date of January 19, 2021; 12,299 square feet at the SSA – Indianapolis property with an Annual U/W Base Rent PSF of $26.22 and Lease Expiration Date of April 11, 2022; 11,360 square feet at the SSA – Lacombe property with an Annual U/W Base Rent PSF of $33.89 and Lease Expiration Date of May 18, 2026; and 9,999 square feet at the SSA – Muskegon property with an Annual U/W Base Rent PSF of $27.66 and Lease Expiration Date of May 30, 2022). The tenant has the right to terminate its lease at the SSA – Lacombe property at any time on or after May 19, 2021 with 60 days notice. |
| (4) | GSA – FBI leases two spaces (25,458 square feet at the FBI – Cary property with an Annual U/W Base Rent PSF of $28.45 and Lease Expiration Date of September 17, 2024 and 14,398 square feet at the FBI – Baton Rouge property with an Annual U/W Base Rent PSF of $36.39 and Lease Expiration Date of February 22, 2027). The tenant has the right to terminate its lease at the FBI – Cary property at any time on or after September 18, 2019 with 60 days notice. The tenant has the right to terminate its lease at the FBI – Baton Rouge property at any time on or after February 23, 2022 with 60 days notice. |
| (5) | GSA – Office of Disability Adjudication & Review’s leased space is located at the SSA/ODAR – Lexington property. |
| (6) | GSA – Military Entrance Processing Station’s leased space is located at the MEPS – Spokane property. |
| (7) | Represents space currently occupied by Crisis Pregnancy Center at the IRS – Mesa property on a month-to-month lease, which was underwritten as vacant. |
The following table presents certain information relating to the lease rollover schedule at the GSA Portfolio Properties:
Lease Expiration Schedule(1)(2)
Year Ending December 31, | No. of Leases Expiring | Expiring NRSF | % of Total NRSF | Cumulative Expiring NRSF | Cumulative % of Total NRSF | Annual U/W Base Rent | Annual U/W Base Rent PSF(3) | |||||||||||||||||||||
MTM | 0 | 0 | 0.0 | % | 0 | 0.0 | % | $ | 0 | $ | 0.00 | |||||||||||||||||
2013 | 0 | 0 | 0.0 | % | 0 | 0.0 | % | $ | 0 | $ | 0.00 | |||||||||||||||||
2014 | 0 | 0 | 0.0 | % | 0 | 0.0 | % | $ | 0 | $ | 0.00 | |||||||||||||||||
2015 | 0 | 0 | 0.0 | % | 0 | 0.0 | % | $ | 0 | $ | 0.00 | |||||||||||||||||
2016 | 0 | 0 | 0.0 | % | 0 | 0.0 | % | $ | 0 | $ | 0.00 | |||||||||||||||||
2017 | 0 | 0 | 0.0 | % | 0 | 0.0 | % | $ | 0 | $ | 0.00 | |||||||||||||||||
2018 | 0 | 0 | 0.0 | % | 0 | 0.0 | % | $ | 0 | $ | 0.00 | |||||||||||||||||
2019 | 0 | 0 | 0.0 | % | 0 | 0.0 | % | $ | 0 | $ | 0.00 | |||||||||||||||||
2020 | 0 | 0 | 0.0 | % | 0 | 0.0 | % | $ | 0 | $ | 0.00 | |||||||||||||||||
2021 | 2 | 36,754 | 10.8 | % | 36,754 | 10.8 | % | $ | 842,077 | $ | 22.91 | |||||||||||||||||
2022 | 2 | 22,298 | 6.5 | % | 59,052 | 17.3 | % | $ | 599,095 | $ | 26.87 | |||||||||||||||||
2023 | 2 | 43,530 | 12.7 | % | 102,582 | 30.0 | % | $ | 1,818,429 | $ | 41.77 | |||||||||||||||||
Thereafter | 8 | 233,221 | 68.3 | % | 335,803 | 98.4 | % | $ | 5,806,557 | $ | 24.90 | |||||||||||||||||
Vacant | 0 | 5,609 | 1.6 | % | 341,412 | 100.0 | % | $ | 0 | $ | 0.00 | |||||||||||||||||
|
|
|
|
|
|
|
|
|
| |||||||||||||||||||
Total/Weighted Average | 14 | 341,412 | 100.0% | $ | 9,066,158 | $ | 27.00 | |||||||||||||||||||||
|
|
|
|
|
|
|
|
|
| |||||||||||||||||||
| (1) | Information obtained from the underwritten rent roll. |
| (2) | The Lease Expiration Schedule does not reflect the termination options referenced in the Major Tenants table above. |
| (3) | Weighted Average Annual U/W Base Rent PSF excludes vacant space. |
THE INFORMATION IN THIS STRUCTURAL AND COLLATERAL TERM SHEET IS NOT COMPLETE AND MAY BE AMENDED PRIOR TO THE TIME OF SALE. THIS TERM SHEET IS NOT AN OFFER TO SELL THESE SECURITIES AND IT IS NOT A SOLICITATION OF AN OFFER TO BUY THESE SECURITIES IN ANY JURISDICTION WHERE THE OFFER OR SALE IS NOT PERMITTED.
44
| GSA PORTFOLIO |
The following table presents historical occupancy percentages at the GSA Portfolio Properties:
Historical Occupancy(1)
12/31/2009 | 12/31/2010 | 12/31/2011 | 2/1/2013 | |||
NAV | NAV | NAV | 98.4% |
| (1) | Historical occupancies are not available as six of the 14 GSA Portfolio Properties were built in 2011 and 2012. |
Operating History and Underwritten Net Cash Flow.The following table presents certain information relating to the historical operating performance and the Underwritten Net Cash Flow at the GSA Portfolio Properties:
Cash Flow Analysis(1)
| Various 2012(2) | U/W | U/W $ per SF | ||||||||||
Base Rent | $ | 8,685,450 | $ | 9,066,158 | $ | 26.55 | ||||||
Grossed Up Vacant Space | 0 | 89,744 | 0.26 | |||||||||
Total Reimbursables | 2,025 | 0 | 0.00 | |||||||||
Other Income | 6,412 | 0 | 0.00 | |||||||||
Less Vacancy & Credit Loss | 0 | (467,061 | )(3) | (1.37 | ) | |||||||
|
|
|
|
|
| |||||||
Effective Gross Income | $ | 8,693,887 | $ | 8,688,841 | $ | 25.45 | ||||||
Total Operating Expenses | $ | 2,210,917 | $ | 2,824,475 | $ | 8.27 | ||||||
|
|
|
|
|
| |||||||
Net Operating Income | $ | 6,482,970 | $ | 5,864,366 | $ | 17.18 | ||||||
TI/LC | 0 | 508,686 | 1.49 | |||||||||
Capital Expenditures | 0 | 68,282 | 0.20 | |||||||||
|
|
|
|
|
| |||||||
Net Cash Flow | $ | 6,482,970 | $ | 5,287,398 | $ | 15.49 | ||||||
NOI DSCR | 3.08x | 2.79x | ||||||||||
NCF DSCR | 3.08x | 2.51x | ||||||||||
NOI DY | 13.0 | % | 11.7 | % | ||||||||
NCF DY | 13.0 | % | 10.6 | % | ||||||||
| (1) | Historical financials prior to Annualized 2012 are not available as six of the 14 GSA Portfolio Properties were built in 2011 and 2012. |
| (2) | Represents annualized NOI for periods ranging in duration from five to 11 months and ending between August 31, 2012 and December 31, 2012 for 12 of the 14 GSA Portfolio Properties. The Most Recent NOI associated with the DEA – Billings property represents the trailing 12-month NOI as of June 30, 2012. Most Recent NOI for the SSA – Muskegon property is not available as the building was constructed in 2012 and the tenant took occupancy in May 2012. |
| (3) | The underwritten economic vacancy is 5.1%. The GSA Portfolio Properties were 98.4% physically occupied as of February 1, 2013. |
Appraisal.As of the appraisal valuation dates ranging from January 3, 2013 to January 22, 2013, the GSA Portfolio Properties had an aggregate “as-is” appraised value of $94,845,000. In addition, the appraisals concluded to an aggregate “go dark” value of $35,090,000.
Environmental Matters.According to the Phase I environmental assessments dated from September 21, 2012 to January 21, 2013, there was no evidence of any recognized environmental conditions at 12 of the 14 the GSA Portfolio Properties.
At the SSA – Muskegon property, the Phase I and Phase II environmental assessments (performed concurrently and both dated November 30, 2012) identified elevated concentrations of contaminants above regulatory action levels. The property is subject to a remedial action plan, which was implemented on June 9, 1995 and approved by the Michigan Department of Environmental Quality, which included “capping” the site with clean fill material and impervious surfaces, relocating utilities to one side of the site and installing a vapor barrier and sub-slab depressurization system to mitigate vapor intrusion risks. In addition, restrictive covenants affecting the property have been recorded that limit uses of the property which would disturb soils or groundwater. The borrower filed a baseline environmental assessment dated December 5, 2012, which results in exemption from liability arising from pre-existing contamination.
At the DEA – Milwaukee property, the Phase I environmental assessment identified a historic recognized environmental condition related to prior manufacturing uses at the property. A Cap Maintenance Plan and Materials Handling Plan dated February 2011 were prepared and approved to maintain the existing cap on contaminated soils and provide a soils handling plan should the site be excavated. As a condition of regulatory closure, various activities are prohibited at the property, including removal or replacement of existing barriers, excavating or grading the land surface, adding fill to capped or paved areas, constructing additional structures or changing any building that has passive or active vapor mitigation systems in place. Based on prior regulatory closure, no further action was recommended other than ongoing compliance.
THE INFORMATION IN THIS STRUCTURAL AND COLLATERAL TERM SHEET IS NOT COMPLETE AND MAY BE AMENDED PRIOR TO THE TIME OF SALE. THIS TERM SHEET IS NOT AN OFFER TO SELL THESE SECURITIES AND IT IS NOT A SOLICITATION OF AN OFFER TO BUY THESE SECURITIES IN ANY JURISDICTION WHERE THE OFFER OR SALE IS NOT PERMITTED.
45
| GSA PORTFOLIO |
The Borrower.The borrower is comprised of 14 separate limited liability companies, each of which is a single purpose entity and has an independent director. Legal counsel to the borrower provided a non-consolidation opinion in connection with the origination of the GSA Portfolio Mortgage Loan. GSA Realty Holdings, LLC, the loan sponsor, is the guarantor of certain nonrecourse carveouts under the GSA Portfolio Mortgage Loan.
The Sponsor.The sponsor, GSA Realty Holdings, LLC, is owned by two pension funds: Carpenters’ Pension Trust Fund (80% owner) and Michigan Regional Council of Carpenters’ Annuity Fund (20% owner). See “ERISA Considerations” in the Free Writing Prospectus. The sponsor is controlled by Titanium Real Estate Advisors, which is a division of Titanium Asset Management (“Titanium”). Titanium was formed in 2009 and manages funds and separate accounts on behalf of its clients and also offers a variety of transactional, advisory and sourcing services. As of December 2012, Titanium had approximately $8.9 billion in assets under management.
Escrows.Ongoing monthly reserves for tenant improvements and leasing costs are required in the amount of $175,000, commencing with the monthly debt service payment in December 2020 and subject to a cap equal to one year of gross rent for all leases that either (i) expire and are not renewed in 2021 or (ii) are terminated in 2021. Ongoing monthly escrows for real estate taxes are not required as long as no event of default has occurred and is continuing and the borrower provides satisfactory evidence of full and timely payment of real estate taxes. Ongoing monthly reserves for insurance are not required as long as no event of default has occurred and is continuing and the borrower provides satisfactory evidence that the GSA Portfolio Properties are insured in accordance with the loan documents. Ongoing monthly replacement reserves are not required as long as no event of default has occurred and is continuing.
Lockbox and Cash Management.Upon the occurrence of a Cash Trap Event Period (as defined below), the borrower is required to establish a lender-controlled lockbox account and direct tenants to pay their rents directly to such lockbox account. During a Cash Trap Event Period, all funds on deposit in the lockbox account are swept to a lender-controlled cash management account on a periodic basis.
A “Cash Trap Event Period” will commence upon the earlier of (i) the occurrence and continuance of an event of default or (ii) the amortizing debt service coverage ratio falling below 1.30x at the end of any calendar quarter. A Cash Trap Event Period will expire, with respect to the circumstances in clause (i), upon the cure of such event of default, or with respect to the circumstances in clause (ii), upon the amortizing debt service coverage ratio being equal to or greater than 1.35x for two consecutive calendar quarters. In addition, with respect to a Cash Trap Event Period that commences due to clause (ii), the borrower has the option to deliver a letter of credit as additional collateral for the GSA Portfolio Mortgage Loan to reduce the outstanding principal balance in order to raise the amortizing debt service coverage ratio to 1.35x.
Property Management.The GSA Portfolio Properties are managed by 11 different regional and national property management companies.
Assumption.The borrower has a two-time right to transfer all of the GSA Portfolio Properties, provided that no event of default has occurred and is continuing and certain other conditions are satisfied, including (i) the lender’s reasonable determination that the proposed transferee and guarantor satisfy the lender’s credit review and underwriting standards, taking into consideration transferee experience, financial strength and general business standing; (ii) execution of a recourse guaranty and an environmental indemnity by an affiliate of the transferee; and (iii) if requested by the lender, rating agency confirmation from Fitch and Moody’s that the transfer will not result in a downgrade, withdrawal or qualification of the respective ratings assigned to the Series 2013- C13 Certificates.
Partial Release.Following the second anniversary of the issuance of the Series 2013-C13 Certificates, the borrower is permitted to release any individual property in connection with a partial defeasance subject to certain conditions, including (i) having the principal balance reduced by 125% of the released property’s allocated loan balance; (ii) the debt service coverage ratio with respect to the remaining properties shall be no less than the greater of 2.51x and the debt service coverage ratio for all properties immediately prior to the release; (iii) the loan-to-value ratio with respect to the remaining properties shall be no greater than the lesser of 52.7% and the loan-to-value ratio for all properties immediately prior to the release; and (iv) rating agency confirmation from Fitch and Moody’s that the release will not result in a downgrade, withdrawal or qualification of the respective ratings assigned to the Series 2013-C13 Certificates.
Real Estate Substitution.The borrower may obtain a release of any individual property from the lien of the GSA Portfolio Mortgage Loan in connection with a substitution of a different property up to three times per year subject to certain conditions, including (i) the aggregate allocated loan amount of the properties released shall not exceed, at the time of substitution, 20% of the aggregate allocated loan amount; (ii) the substitute property cannot be ground leased; (iii) the debt service coverage ratio of the remaining properties for the 12-month period prior to the substitution is no less than the greater of 2.51x and the debt service coverage ratio for all properties immediately prior to the release; (iv) the substitute property has a fair market value no less than the greater of the fair market value of the released property on the closing date and the fair market value of the released property immediately prior to the release (appraisals of the released property and the substitute property are required, dated no more than 60 days prior to the substitution date); (v) the lender receives a legal opinion that the substitution satisfies REMIC requirements; and (vi) confirmation is received from Fitch and Moody’s that the substitution will not result in a downgrade, withdrawal or qualification of the respective ratings then assigned to any of the Series 2013-C13 Certificates.
Subordinate and Mezzanine Indebtedness.Not permitted.
Ground Lease.None.
THE INFORMATION IN THIS STRUCTURAL AND COLLATERAL TERM SHEET IS NOT COMPLETE AND MAY BE AMENDED PRIOR TO THE TIME OF SALE. THIS TERM SHEET IS NOT AN OFFER TO SELL THESE SECURITIES AND IT IS NOT A SOLICITATION OF AN OFFER TO BUY THESE SECURITIES IN ANY JURISDICTION WHERE THE OFFER OR SALE IS NOT PERMITTED.
46
| GSA PORTFOLIO |
Terrorism Insurance.The loan documents require that the borrower maintain insurance against loss for acts of terrorism in an amount equal to the full replacement cost of the GSA Portfolio Properties; provided, however, that if TRIPRA is discontinued or not renewed, the borrower will not be required to spend more than two times the amount of the property insurance and business income coverage required by the loan documents on terrorism insurance at the time terrorism insurance coverage is excluded. The loan documents also require business interruption insurance covering no less than the 18-month period following the occurrence of a casualty event (except for the FBI – Baton Rouge property, which requires business interruption insurance covering no less than the 12-month period following the occurrence of a casualty event), together with a six-month extended period of indemnity (except for the FBI – Baton Rouge property, which does not require an extended period of indemnity).
THE INFORMATION IN THIS STRUCTURAL AND COLLATERAL TERM SHEET IS NOT COMPLETE AND MAY BE AMENDED PRIOR TO THE TIME OF SALE. THIS TERM SHEET IS NOT AN OFFER TO SELL THESE SECURITIES AND IT IS NOT A SOLICITATION OF AN OFFER TO BUY THESE SECURITIES IN ANY JURISDICTION WHERE THE OFFER OR SALE IS NOT PERMITTED.
47
| 825-845 LINCOLN ROAD |
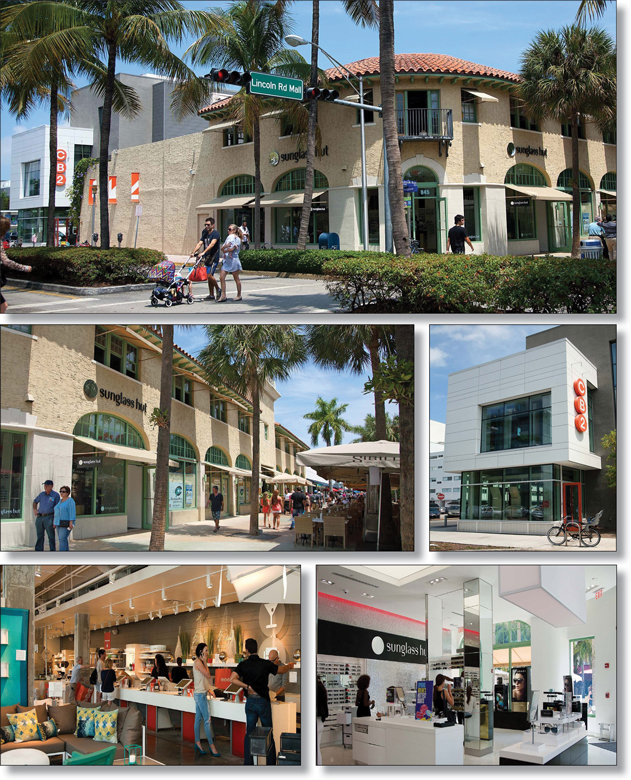
THE INFORMATION IN THIS STRUCTURAL AND COLLATERAL TERM SHEET IS NOT COMPLETE AND MAY BE AMENDED PRIOR TO THE TIME OF SALE. THIS TERM SHEET IS NOT AN OFFER TO SELL THESE SECURITIES AND IT IS NOT A SOLICITATION OF AN OFFER TO BUY THESE SECURITIES IN ANY JURISDICTION WHERE THE OFFER OR SALE IS NOT PERMITTED.
48
825-845 LINCOLN ROAD
825-845 LINCOLN ROAD
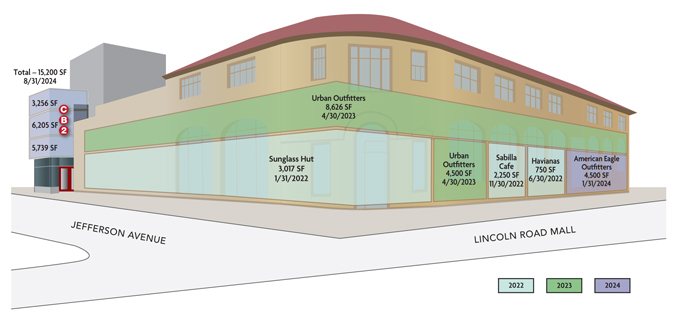
THE INFORMATION IN THIS STRUCTURAL AND COLLATERAL TERM SHEET IS NOT COMPLETE AND MAY BE AMENDED PRIOR TO THE TIME OF SALE. THIS TERM SHEET IS NOT AN OFFER TO SELL THESE SECURITIES AND IT IS NOT A SOLICITATION OF AN OFFER TO BUY THESE SECURITIES IN ANY JURISDICTION WHERE THE OFFER OR SALE IS NOT PERMITTED.
49
825-845 LINCOLN ROAD
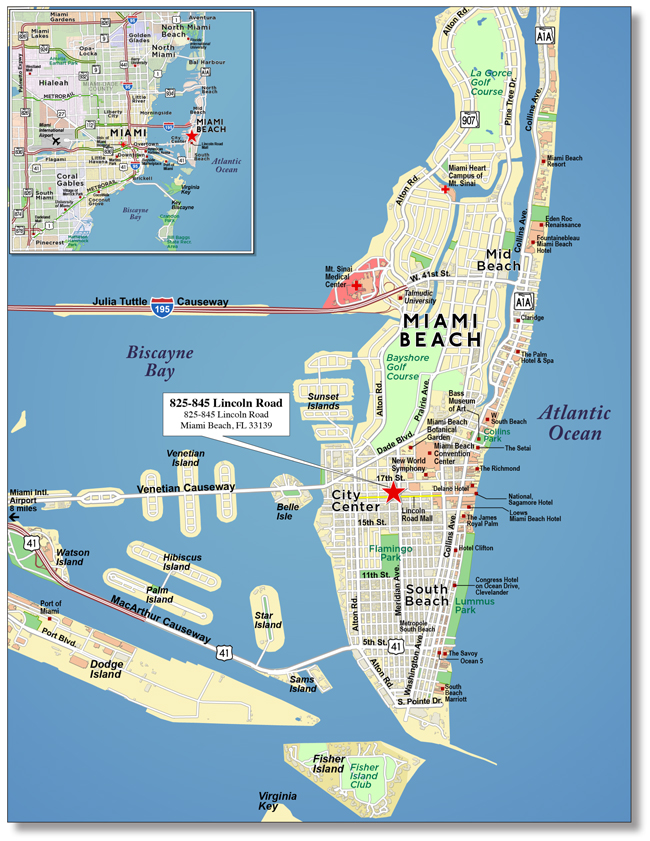
THE INFORMATION IN THIS STRUCTURAL AND COLLATERAL TERM SHEET IS NOT COMPLETE AND MAY BE AMENDED PRIOR TO THE TIME OF SALE. THIS TERM SHEET IS NOT AN OFFER TO SELL THESE SECURITIES AND IT IS NOT A SOLICITATION OF AN OFFER TO BUY THESE SECURITIES IN ANY JURISDICTION WHERE THE OFFER OR SALE IS NOT PERMITTED.
50
No. 4 – 825-845 Lincoln Road
Loan Information
| Mortgage Loan Seller: | Wells Fargo Bank, National Association | |
| Credit Assessment | NR/NR | |
| (Fitch/Moody’s): | ||
| Original Principal Balance: | $30,000,000 | |
| Cut-off Date Principal Balance: | $30,000,000 | |
| % of Initial Pool Balance: | 3.4% | |
| Loan Purpose: | Refinance | |
| Borrower Name: | Lincoln 845 LLC | |
| Sponsor: | David Dushey | |
| Mortgage Rate: | 3.990% | |
| Note Date: | March 12, 2013 | |
| Anticipated Repayment Date: | NAP | |
| Maturity Date: | April 1, 2023 | |
| IO Period: | 120 months | |
| Loan Term (Original): | 120 months | |
| Seasoning: | 1 month | |
| Amortization Term (Original): | NAP | |
| Loan Amortization Type: | Interest-only, Balloon | |
| Interest Accrual Method: | Actual/360 | |
| Call Protection: | L(25),D(91),O(4) | |
| Lockbox Type: | Springing (Without Established Account) | |
| Additional Debt: | None | |
| Additional Debt Type: | NAP | |
Escrows and Reserves(1):
Type: | Initial | Monthly | Cap (If Any) | |||||||||
Taxes | $ | 254,067 | $ | 42,345 | NAP | |||||||
Insurance | $ | 0 | Springing | NAP | ||||||||
Replacement Reserves | $ | 0 | $ | 647 | $ | 40,000 | ||||||
Tenant Specific TI/LC Reserve | $ | 1,513,909 | $ | 0 | NAP | |||||||
Tenants Specific Rent Concession Reserve | $ | 2,650,000 | $ | 0 | NAP | |||||||
Property Information
| Single Asset/Portfolio: | Single Asset | |
| Property Type: | Retail | |
| Specific Property Type: | Unanchored | |
| Location: | Miami Beach, FL | |
| Size: | 38,843 SF | |
| Cut-off Date Principal | $772.34 | |
| Balance Per Unit/SF: | ||
| Year Built/Renovated: | 1925/2013 | |
| Title Vesting: | Fee | |
| Property Manager: | Self-managed | |
| 3rdMost Recent Occupancy (As of): | 100.0% (12/31/2009) | |
| 2ndMost Recent Occupancy (As of) : | 89.3% (12/31/2010) | |
| Most Recent Occupancy (As of) : | 89.3% (12/31/2011) | |
| Current Occupancy (As of)(2): | 100.0% (5/1/2013) | |
Underwriting and Financial Information:
| ||
| 3rdMost Recent NOI (As of): | $2,181,826 (12/31/2010) | |
| 2ndMost Recent NOI (As of): | $1,516,433 (12/31/2011) | |
| Most Recent NOI (As of)(3): | $2,289,802 (12/31/2012) | |
| U/W Revenues: | $4,966,048 | |
| U/W Expenses: | $1,217,978 | |
| U/W NOI(3): | $3,748,070 | |
| U/W NCF: | $3,608,568 | |
| U/W NOI DSCR: | 3.09x | |
| U/W NCF DSCR: | 2.97x | |
| U/W NOI Debt Yield: | 12.5% | |
| U/W NCF Debt Yield: | 12.0% | |
| As-Is Appraised Value: | $66,200,000 | |
| As-Is Appraisal Valuation Date: | February 1, 2013 | |
| Cut-off Date LTV Ratio: | 45.3% | |
| LTV Ratio at Maturity or ARD: | 45.3% | |
| (1) | See “Escrows” section. |
| (2) | The 825-845 Lincoln Road Property is 100.0% leased, but only 52.7% physically occupied as of May 1, 2013. The sponsor is expected to deliver the space to Urban Outfitters by April 30, 2013 and American Eagle and Havaianas before June 30, 2013. The tenants will then be responsible for build out of the space. The sponsor did provide Urban Outfitters with an $80.00 per square foot work letter ($1,050,080 total). The 825-845 Lincoln Road Mortgage Loan is full recourse to the sponsor until the sponsor (i) delivers the tenant space to Urban Outfitters and American Eagle; (ii) has satisfied all landlord lease obligations associated with the space and (iii) Urban Outfitters and American Eagle begin paying full contractual rent and each tenant has delivered an estoppel satisfactory to the lender. |
| (3) | See “Cash Flow Analysis” section for detail on the increase from Most Recent NOI to U/W NOI. |
The Mortgage Loan. The mortgage loan (the “825-845 Lincoln Road Mortgage Loan”) is evidenced by a single promissory note that is secured by a first mortgage encumbering two adjacent unanchored retail buildings totaling 38,843 square feet located on Lincoln Road in Miami Beach, Florida (collectively, the “825-845 Lincoln Road Property”). The 825-845 Lincoln Road Mortgage Loan was originated on March 12, 2013 by Wells Fargo Bank, National Association. The 825-845 Lincoln Road Mortgage Loan had an original principal balance of $30,000,000, has an outstanding principal balance as of the Cut-off Date of $30,000,000 and accrues interest at an interest rate of 3.990% per annum. The 825-845 Lincoln Road Mortgage Loan had an initial term of 120 months, has a remaining term of 119 months as of the Cut-off Date and requires interest-only payments through the term of the 825-845 Lincoln Road Mortgage Loan. The 825-845 Lincoln Road Mortgage Loan matures on April 1, 2023.
Following the lockout period, the borrower has the right to defease the 825-845 Lincoln Road Mortgage Loan in whole, but not in part, on any due date before January 1, 2023. In addition, the 825-845 Lincoln Road Mortgage Loan is prepayable without penalty on or after January 1, 2023.
THE INFORMATION IN THIS STRUCTURAL AND COLLATERAL TERM SHEET IS NOT COMPLETE AND MAY BE AMENDED PRIOR TO THE TIME OF SALE. THIS TERM SHEET IS NOT AN OFFER TO SELL THESE SECURITIES AND IT IS NOT A SOLICITATION OF AN OFFER TO BUY THESE SECURITIES IN ANY JURISDICTION WHERE THE OFFER OR SALE IS NOT PERMITTED.
51
825-845 LINCOLN ROAD
Sources and Uses
Sources | Uses | |||||||||||||||||
Original loan amount | $ | 30,000,000 | 100.0 | % | Loan payoff(1) | $ | 5,980,791 | 19.9 | % | |||||||||
Reserves | 4,417,976 | 14.7 | ||||||||||||||||
Closing costs | 447,967 | 1.5 | ||||||||||||||||
Return of equity | 19,153,267 | 63.8 | ||||||||||||||||
|
|
|
|
|
|
|
| |||||||||||
Total Sources | $ | 30,000,000 | 100.0 | % | Total Uses | $ | 30,000,000 | 100.0 | % | |||||||||
|
|
|
|
|
|
|
| |||||||||||
| (1) | The 825-845 Lincoln Road Property was previously securitized in WBCMT 2003-C5. |
The Property. The 825-845 Lincoln Road Property consists of a two-story building built in 1925 and currently under renovation (the “Lincoln Road Building”) and an adjacent three-story building built in 2008 (the “CB2 Building”). Collectively, the Lincoln Road Building and the CB2 Building contain 38,843 square feet and are located in the Lincoln Road Mall (a pedestrian walkway mall) in Miami Beach, Florida. The Lincoln Road Building is currently being renovated to build-out space for Urban Outfitters, American Eagle Outfitters and Havaianas, while the CB2 Building is 100.0% occupied by CB2. The renovation of the Lincoln Road Building is expected to be completed before June 30, 2013. As of May 1, 2013, the 825-845 Lincoln Road Property was 100.0% leased by six tenants and 52.7% physically occupied.
The following table presents certain information relating to the tenancies at the 825-845 Lincoln Road Property:
Major Tenants
Tenant Name | Credit Rating (Fitch/ Moody’s/ S&P)(1) | Tenant NRSF | % of NRSF | Annual U/W Base Rent PSF | Annual U/W Base Rent | % of Total Annual U/W Base Rent | Sales PSF(2) | Occupancy Cost(2) | Lease Expiration Date | |||||||||||||||||||||||||||
Major Tenants | ||||||||||||||||||||||||||||||||||||
Urban Outfitters | NR/NR/NR | 13,126 | 33.8 | % | $ | 100.94 | $ | 1,325,000 | 30.4 | % | NAV | NAV | 4/30/2023 | (3) | ||||||||||||||||||||||
American Eagle | NR/NR/NR | 4,500 | 11.6 | % | $ | 232.44 | $ | 1,046,000 | 24.0 | % | NAV | NAV | 1/31/2024 | |||||||||||||||||||||||
Sunglass Hut | NR/NR/BBB+ | 3,017 | 7.8 | % | $ | 236.90 | $ | 714,727 | 16.4 | % | NAV | NAV | 1/31/2022 | |||||||||||||||||||||||
CB2 | NR/NR/NR | 15,200 | 39.1 | % | $ | 39.47 | $ | 600,000 | 13.8 | % | $ | 341 | 13.0 | % | 8/31/2024 | |||||||||||||||||||||
|
|
|
|
|
|
|
| |||||||||||||||||||||||||||||
Total Major Tenants | 35,843 | 92.3 | % | $ | 102.83 | $ | 3,685,727 | 84.5 | % | |||||||||||||||||||||||||||
Non-Major Tenants | 3,000 | 7.7 | % | $ | 225.00 | $ | 675,000 | 15.5 | % | |||||||||||||||||||||||||||
|
|
|
|
|
|
|
| |||||||||||||||||||||||||||||
Occupied Collateral Total | 38,843 | 100.0 | % | $ | 112.27 | $ | 4,360,727 | 100.0 | % | |||||||||||||||||||||||||||
|
|
|
| |||||||||||||||||||||||||||||||||
Vacant Space | 0 | 0.0 | % | |||||||||||||||||||||||||||||||||
|
|
|
| |||||||||||||||||||||||||||||||||
Collateral Total | 38,843 | 100.0 | % | |||||||||||||||||||||||||||||||||
|
|
|
| |||||||||||||||||||||||||||||||||
| (1) | Certain ratings are those of the parent company whether or not the parent guarantees the lease. |
| (2) | Sales and Occupancy Costs are for the trailing 12-month period ending December 31, 2012. |
| (3) | The tenant may terminate its lease with 30 days written prior notice if the landlord does not deliver the tenant’s space by January 22, 2014. |
THE INFORMATION IN THIS STRUCTURAL AND COLLATERAL TERM SHEET IS NOT COMPLETE AND MAY BE AMENDED PRIOR TO THE TIME OF SALE. THIS TERM SHEET IS NOT AN OFFER TO SELL THESE SECURITIES AND IT IS NOT A SOLICITATION OF AN OFFER TO BUY THESE SECURITIES IN ANY JURISDICTION WHERE THE OFFER OR SALE IS NOT PERMITTED.
52
825-845 LINCOLN ROAD
The following table presents certain information relating to the historical sales at the 825-845 Lincoln Road Property:
Historical Sales (PSF)(1)
Tenant Name | 2009 | 2010 | 2011 | 2012 | ||||||||||
Urban Outfitters(2) | NAV | NAV | NAV | NAV | ||||||||||
American Eagle(2) | NAV | NAV | NAV | NAV | ||||||||||
Sunglass Hut(3) | NAV | NAV | NAV | NAV | ||||||||||
CB2 | NAV | $ | 387 | $ | 390 | $ | 341 | |||||||
| (1) | Historical Sales (PSF) are based on historical statements provided by the borrower. |
| (2) | Sales are unavailable as the tenants have yet to take occupancy. |
| (3) | Tenant is not required to report sales. |
The following table presents certain information relating to the lease rollover schedule at 825-845 Lincoln Road Property:
Lease Expiration Schedule(1)(2)
Year Ending December 31, | No. of Leases Expiring | Expiring NRSF | % of Total NRSF | Cumulative Expiring NRSF | Cumulative % of Total NRSF | Annual U/W Base Rent | Annual U/W Base Rent PSF | |||||||||||||||||||||
MTM | 0 | 0 | 0.0 | % | 0 | 0.0 | % | $ | 0 | $ | 0.00 | |||||||||||||||||
2013 | 0 | 0 | 0.0 | % | 0 | 0.0 | % | $ | 0 | $ | 0.00 | |||||||||||||||||
2014 | 0 | 0 | 0.0 | % | 0 | 0.0 | % | $ | 0 | $ | 0.00 | |||||||||||||||||
2015 | 0 | 0 | 0.0 | % | 0 | 0.0 | % | $ | 0 | $ | 0.00 | |||||||||||||||||
2016 | 0 | 0 | 0.0 | % | 0 | 0.0 | % | $ | 0 | $ | 0.00 | |||||||||||||||||
2017 | 0 | 0 | 0.0 | % | 0 | 0.0 | % | $ | 0 | $ | 0.00 | |||||||||||||||||
2018 | 0 | 0 | 0.0 | % | 0 | 0.0 | % | $ | 0 | $ | 0.00 | |||||||||||||||||
2019 | 0 | 0 | 0.0 | % | 0 | 0.0 | % | $ | 0 | $ | 0.00 | |||||||||||||||||
2020 | 0 | 0 | 0.0 | % | 0 | 0.0 | % | $ | 0 | $ | 0.00 | |||||||||||||||||
2021 | 0 | 0 | 0.0 | % | 0 | 0.0 | % | $ | 0 | $ | 0.00 | |||||||||||||||||
2022 | 3 | 6,017 | 15.5 | % | 6,017 | 15.5 | % | $ | 1,389,727 | $ | 230.97 | |||||||||||||||||
2023 | 1 | 13,126 | 33.8 | % | 19,143 | 49.3 | % | $ | 1,325,000 | $ | 100.94 | |||||||||||||||||
Thereafter | 2 | 19,700 | 50.7 | % | 38,843 | 100.0 | % | $ | 1,646,000 | $ | 83.55 | |||||||||||||||||
Vacant | 0 | 0 | 0.0 | % | 38,843 | 100.0 | % | $ | 0 | $ | 0.00 | |||||||||||||||||
|
|
|
|
|
|
|
|
|
|
|
|
|
| |||||||||||||||
Total/Weighted Average | 6 | 38,843 | 100.0 | % | $ | 4,360,727 | $ | 112.27 | ||||||||||||||||||||
|
|
|
|
|
|
|
|
|
|
|
|
|
| |||||||||||||||
| (1) | Information obtained from the underwritten rent roll. |
| (2) | Certain tenants may have lease termination options that are exercisable prior to the originally stated expiration date of the subject lease and that are not considered in the Lease Expiration Schedule. |
The following table presents historical occupancy percentages at the 825-845 Lincoln Road Property:
Historical Occupancy(1)
12/31/2009 | 12/31/2010 | 12/31/2011 | 5/1/2013(2) | |||
| 100.0% | 89.3% | 89.3% | 100.0% |
| (1) | Information obtained from the borrower. |
| (2) | The 825-845 Lincoln Road Property is 100.0% leased, but only 52.7% physically occupied as of May 1, 2013. |
THE INFORMATION IN THIS STRUCTURAL AND COLLATERAL TERM SHEET IS NOT COMPLETE AND MAY BE AMENDED PRIOR TO THE TIME OF SALE. THIS TERM SHEET IS NOT AN OFFER TO SELL THESE SECURITIES AND IT IS NOT A SOLICITATION OF AN OFFER TO BUY THESE SECURITIES IN ANY JURISDICTION WHERE THE OFFER OR SALE IS NOT PERMITTED.
53
825-845 LINCOLN ROAD
Operating History and Underwritten Net Cash Flow. The following table presents certain information relating to the historical operating performance and Underwritten Net Cash Flow at the 825-845 Lincoln Road Property:
Cash Flow Analysis
| 2010 | 2011 | 2012 | U/W(1) | U/W $ per SF | ||||||||||||||||
Base Rent | $ | 2,365,386 | $ | 1,940,425 | $ | 2,592,446 | $ | 4,360,727 | $ | 112.27 | ||||||||||
Grossed Up Vacant Space | 0 | 0 | 0 | 0 | 0.00 | |||||||||||||||
Total Reimbursables | 403,529 | 278,254 | 472,235 | 823,357 | 21.20 | |||||||||||||||
Other Income | 24,000 | 24,000 | 24,000 | 0 | 0.00 | |||||||||||||||
Less Vacancy & Credit Loss | 0 | 0 | 0 | (218,036 | )(2) | (5.61 | ) | |||||||||||||
|
|
|
|
|
|
|
|
|
| |||||||||||
Effective Gross Income | $ | 2,792,915 | $ | 2,242,679 | $ | 3,088,681 | $ | 4,966,048 | $ | 127.85 | ||||||||||
Total Operating Expenses | $ | 611,089 | $ | 726,246 | $ | 798,879 | $ | 1,217,978 | $ | 31.36 | ||||||||||
|
|
|
|
|
|
|
|
|
| |||||||||||
Net Operating Income | $ | 2,181,826 | $ | 1,516,433 | $ | 2,289,802 | $ | 3,748,070 | $ | 96.49 | ||||||||||
TI/LC | 0 | 0 | 0 | 131,734 | 3.39 | |||||||||||||||
Capital Expenditures | 0 | 0 | 0 | 7,769 | 0.20 | |||||||||||||||
|
|
|
|
|
|
|
|
|
| |||||||||||
Net Cash Flow | $ | 2,181,826 | $ | 1,516,433 | $ | 2,289,802 | $ | 3,608,568 | $ | 92.90 | ||||||||||
NOI DSCR | 1.80x | 1.25x | 1.89x | 3.09x | ||||||||||||||||
NCF DSCR | 1.80x | 1.25x | 1.89x | 2.97x | ||||||||||||||||
NOI DY | 7.3 | % | 5.1 | % | 7.6 | % | 12.5 | % | ||||||||||||
NCF DY | 7.3 | % | 5.1 | % | 7.6 | % | 12.0 | % | ||||||||||||
| (1) | The increase in U/W Effective Gross Income and U/W Net Operating Income from historical Net Operating Income is attributed to the signing of new leases with Urban Outfitters, American Eagle and Havaianas. All three tenants are expected to take possession of their space by June 30, 2013. |
| (2) | The underwritten economic vacancy is 5.0%. The 825-845 Lincoln Road Property is 100.0% leased as of May 1, 2013. |
Appraisal. As of the appraisal valuation date of February 1, 2013, the 825-845 Lincoln Road Property had an “as-is” appraised value of $66,200,000.
Environmental Matters. According to a Phase I environmental site assessment dated January 18, 2013, there was no evidence of any recognized environmental conditions at the 825-845 Lincoln Road Property.
Market Overview and Competition.The 825-845 Lincoln Road Property has frontage along Lincoln Road and Jefferson Avenue within the larger Lincoln Road Mall located in Miami Beach, Florida. Lincoln Road Mall is an eight-block pedestrian walkway of retail stores located less than one mile away from the Atlantic Ocean and less than one mile from numerous hotels that include: Delano South Beach, Loews Miami Beach, W South Beach and the Setai, Miami Beach. Since a renovation project in 1996, Lincoln Road Mall experienced an increase in restaurants, sidewalk cafes and the inclusion of more national retailers. The renovation attracted national retailers such as Apple, Banana Republic, Gap, Pottery Barn, Williams-Sonoma, Bebe, Victoria’s Secret and Steve Madden. Additionally, in 2012, H&M and Forever 21 opened stores consisting of 24,000 and 39,000 square feet, respectively within the Lincoln Road Mall.
According to the appraisal, average annual growth rates for rent on Lincoln Road ranged from 10.5% to 21.4% over the last 10 years. The appraiser’s rent comparables range from $62.20 per square foot to $278.00 per square foot on a triple net basis. Per a third party market research report, the submarket vacancy rate in the Miami Beach submarket was 3.7% as of the fourth quarter 2012.
The Borrower. The borrower is Lincoln 845 LLC, a Florida limited liability company and a single purpose entity with two independent directors. The borrower consists of 12 individuals and trusts and the managing member is David Dushey, who has an 8.0% ownership in the borrower. David Dushey is the guarantor of certain nonrecourse carveouts under the 825-845 Lincoln Road Mortgage Loan and is the full recourse guarantor for the 825-845 Lincoln Road Mortgage Loan until Urban Outfitters and American Eagle are in place, open for business, paying full rent and have delivered estoppels satisfactory to the lender.
The Sponsor. The sponsor for the 825-845 Mortgage Loan is David Dushey. Mr. Dushey is a vice president at Jenel Management Corp. (“Jenel”), which is a private real estate and management firm based in New York. Jenel owns and manages approximately 70 properties totaling over three million square feet. Jenel’s portfolio includes properties primarily in urban high density areas that have redevelopment, renovation or re-tenanting potential.
Escrows. The loan documents provide for upfront escrows at closing in the amount of $254,067 for real estate taxes and $1,513,909 for tenant improvements and leasing commissions associated with the Urban Outfitters space. In addition, the loan documents provide for an upfront escrow in the amount of $2,650,000, which represents future rent credits and rent abatements associated with the Urban Outfitters ($1,250,000), American Eagle ($1,250,000) and Havaianas ($150,000) leases.
The loan documents provide for ongoing monthly deposits of $42,345 for real estate taxes and $647 for replacement reserves (subject to a cap of $40,000). The loan documents do not require monthly escrow deposits for insurance provided the following conditions are satisfied: (i) no event of default exists and is continuing; (ii) the 825-845 Lincoln Road Property is covered by blanket insurance policies that remain in full force and effect; and (iii) the borrower provides the lender with evidence of renewal of the policies and paid receipts of insurance premiums when due.
THE INFORMATION IN THIS STRUCTURAL AND COLLATERAL TERM SHEET IS NOT COMPLETE AND MAY BE AMENDED PRIOR TO THE TIME OF SALE. THIS TERM SHEET IS NOT AN OFFER TO SELL THESE SECURITIES AND IT IS NOT A SOLICITATION OF AN OFFER TO BUY THESE SECURITIES IN ANY JURISDICTION WHERE THE OFFER OR SALE IS NOT PERMITTED.
54
825-845 LINCOLN ROAD
Lockbox and Cash Management. Upon the occurrence of a Cash Trap Event Period (as defined below), the 825-845 Lincoln Road Mortgage Loan requires that a lender-controlled lockbox account be established and the tenants will be directed to pay their rents directly to such lockbox account. The loan documents also require that upon the occurrence of a Cash Trap Event Period, all cash revenues and other monies received by the borrower or the property manager relating to the 825-845 Lincoln Road Property be deposited into the lockbox account within five business days of receipt.
A “Cash Trap Event Period” will commence upon the earlier of (i) the occurrence and continuance of an event of default; (ii) Urban Outfitters “goes dark”; and (iii) Urban Outfitters fails to exercise its extension option on or before the earlier of (a) the notification date required under the lease or (b) six months prior to its lease expiration date.
A Cash Trap Event Period will expire, with respect to clause (i), upon the cure of such event of default; with respect to clause (ii), Urban Outfitters is no longer dark and is open for 30 days or one or more satisfactory replacement tenants are in full occupancy and open for business and paying full, unabated rent on lease terms acceptable to the lender and Urban Outfitters remains primarily liable for outstanding tenant rental obligations under its lease; and with respect to clause (iii), upon the earlier of Urban Outfitters exercising its renewal option or one or more satisfactory replacement tenants are in full occupancy and open for business and paying full, unabated rent on lease terms acceptable to the lender.
Property Management. The 825-845 Lincoln Road Property is managed by an affiliate of the borrower.
Assumption. On or after March 13, 2014, the borrower has a two-time right to transfer the 825-845 Lincoln Road Property, provided that no event of default has occurred and is continuing and certain other conditions are satisfied, including, but not limited to (i) the lender’s reasonable determination that the proposed transferee and guarantor satisfy the lender’s credit review and underwriting standards, taking into consideration transferee experience, financial strength and general business standing; (ii) execution of a recourse guaranty and an environmental indemnity by an affiliate of the transferee; and (iii) if requested by the lender, rating agency confirmation from Fitch and Moody’s that the transfer will not result in a downgrade, withdrawal or qualification of the respective ratings assigned to the Series 2013-C13 Certificates.
Partial Release. Not permitted.
Real Estate Substitution. Not permitted.
Subordinate and Mezzanine Indebtedness. Not permitted.
Ground Lease. None.
Terrorism Insurance. The loan documents require that the “all risk” insurance policy required to be maintained by the borrower provides coverage for damage from terrorism in an amount equal to the full replacement cost of the 825-845 Lincoln Road Property as well as business interruption insurance covering no less than the 18-month period following the occurrence of a casualty event, together with a six-month extended period of indemnity.
THE INFORMATION IN THIS STRUCTURAL AND COLLATERAL TERM SHEET IS NOT COMPLETE AND MAY BE AMENDED PRIOR TO THE TIME OF SALE. THIS TERM SHEET IS NOT AN OFFER TO SELL THESE SECURITIES AND IT IS NOT A SOLICITATION OF AN OFFER TO BUY THESE SECURITIES IN ANY JURISDICTION WHERE THE OFFER OR SALE IS NOT PERMITTED.
55
HAMPTON INN & SUITES OCEANFRONT
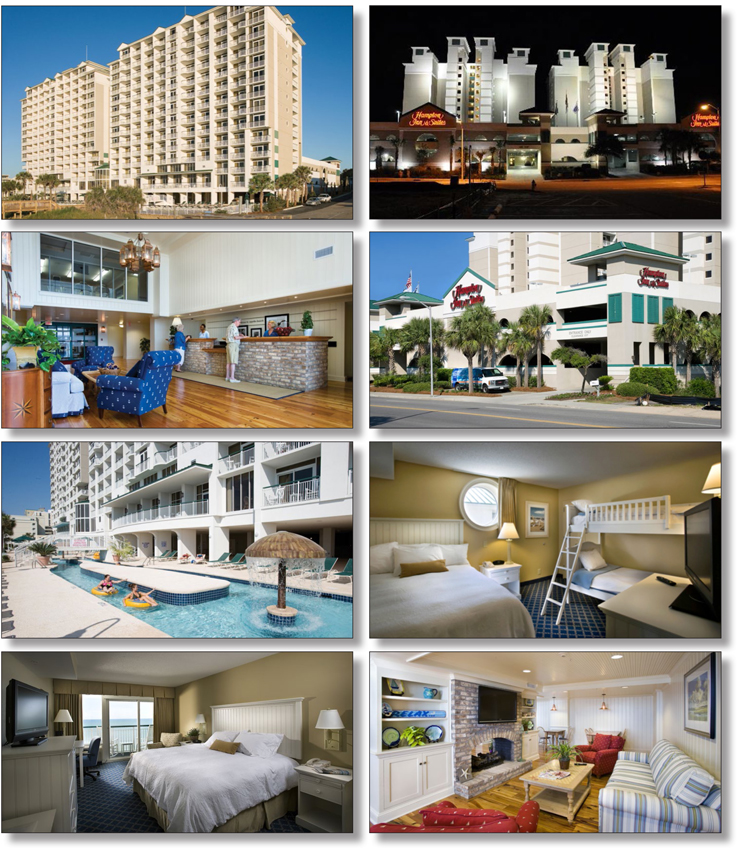
THE INFORMATION IN THIS STRUCTURAL AND COLLATERAL TERM SHEET IS NOT COMPLETE AND MAY BE AMENDED PRIOR TO THE TIME OF SALE. THIS TERM SHEET IS NOT AN OFFER TO SELL THESE SECURITIES AND IT IS NOT A SOLICITATION OF AN OFFER TO BUY THESE SECURITIES IN ANY JURISDICTION WHERE THE OFFER OR SALE IS NOT PERMITTED.
56
HAMPTON INN & SUITES OCEANFRONT
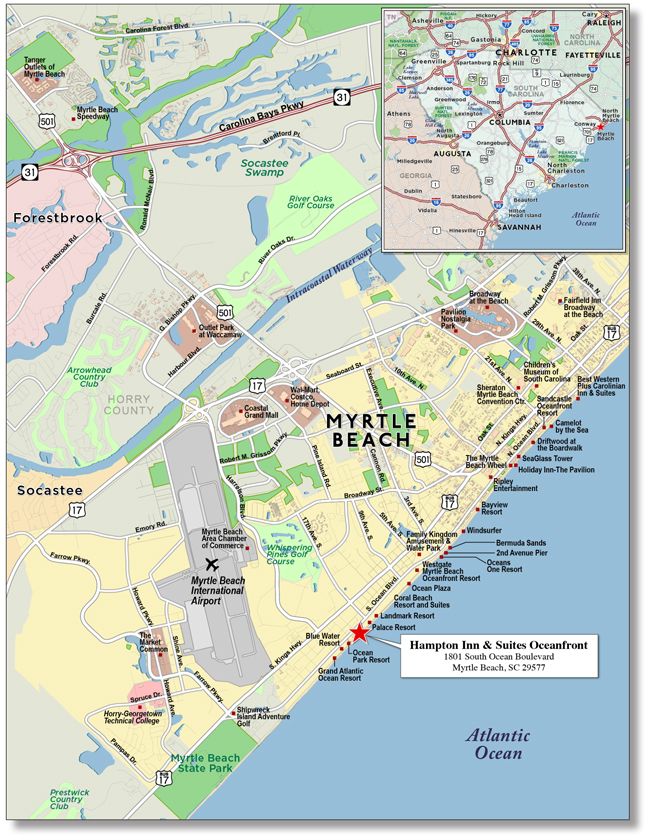
THE INFORMATION IN THIS STRUCTURAL AND COLLATERAL TERM SHEET IS NOT COMPLETE AND MAY BE AMENDED PRIOR TO THE TIME OF SALE. THIS TERM SHEET IS NOT AN OFFER TO SELL THESE SECURITIES AND IT IS NOT A SOLICITATION OF AN OFFER TO BUY THESE SECURITIES IN ANY JURISDICTION WHERE THE OFFER OR SALE IS NOT PERMITTED.
57
No. 5 – Hampton Inn & Suites Oceanfront
Loan Information
| Mortgage Loan Seller: | The Royal Bank of Scotland | |
| Credit Assessment | NR/NR | |
| (Fitch/Moody’s): | ||
| Original Principal Balance: | $30,000,000 | |
| Cut-off Date Principal Balance: | $29,947,006 | |
| % of Initial Pool Balance: | 3.4% | |
| Loan Purpose: | Refinance | |
| Borrower Name: | Myrtle Beach Oceanfront Inn, LLC | |
| Sponsor: | Ross M. Lindsay, III | |
| Mortgage Rate: | 4.659% | |
| Note Date: | March 28, 2013 | |
| Anticipated Repayment Date: | NAP | |
| Maturity Date: | April 1, 2023 | |
| IO Period: | None | |
| Loan Term (Original): | 120 months | |
| Seasoning: | 1 month | |
| Amortization Term (Original): | 300 months | |
| Loan Amortization Type: | Amortizing Balloon | |
| Interest Accrual Method: | Actual/360 | |
| Call Protection: | L(25),D(91),O(4) | |
| Lockbox Type: | Hard/Springing Cash Management | |
| Additional Debt: | None | |
| Additional Debt Type: | NAP |
Escrows and Reserves(1):
Type: | Initial | Monthly | Cap (If Any) | |||||||||
Taxes | $ | 76,299 | $ | 19,075 | NAP | |||||||
Insurance | $ | 80,142 | $ | 39,615 | NAP | |||||||
FF&E Reserve | $ | 0 | $ | 33,447 | NAP | |||||||
PIP Reserve | $ | 55,000 | $ | 0 | NAP | |||||||
Seasonality Reserve | $ | 0 | (1 | ) | $ | 1,200,000 | ||||||
Property Information
| Single Asset/Portfolio: | Single Asset | |
| Property Type: | Hospitality | |
| Specific Property Type: | Limited Service | |
| Location: | Myrtle Beach, SC | |
| Size: | 227 rooms | |
| Cut-off Date Principal | ||
| Balance Per Room: | $131,925 | |
| Year Built/Renovated: | 2000/2009 | |
| Title Vesting: | Fee | |
| Property Manager: | Self-managed | |
| 3rdMost Recent Occupancy (As of): | NAP | |
| 2ndMost Recent Occupancy (As of): | 63.6% (12/31/2010) | |
| Most Recent Occupancy (As of): | 72.9% (12/31/2011) | |
| Current Occupancy (As of): | 74.3% (12/31/2012) |
Underwriting and Financial Information:
| 3rdMost Recent NOI (As of): | $2,242,542 (12/31/2010) | |
| 2ndMost Recent NOI (As of): | $2,914,078 (12/31/2011) | |
| Most Recent NOI (As of): | $3,752,110 (12/31/2012) | |
| U/W Revenues: | $10,033,952 | |
| U/W Expenses: | $6,451,941 | |
| U/W NOI: | $3,582,011 | |
| U/W NCF: | $3,180,652 | |
| U/W NOI DSCR: | 1.76x | |
| U/W NCF DSCR: | 1.56x | |
| U/W NOI Debt Yield: | 12.0% | |
| U/W NCF Debt Yield: | 10.6% | |
| As-Is Appraised Value: | $47,000,000 | |
| As-Is Appraisal Valuation Date: | January 17, 2013 | |
| Cut-off Date LTV Ratio: | 63.7% | |
| LTV Ratio at Maturity or ARD: | 47.1% |
| (1) | See “Escrows” section. |
The Mortgage Loan. The mortgage loan (the “Hampton Inn & Suites Oceanfront Mortgage Loan”) is evidenced by a single promissory note that is secured by a first mortgage encumbering a limited service hotel located in Myrtle Beach, South Carolina (the “Hampton Inn & Suites Oceanfront Property”). The Hampton Inn & Suites Oceanfront Mortgage Loan was originated on March 28, 2013 by The Royal Bank of Scotland. The Hampton Inn & Suites Oceanfront Mortgage Loan had an original principal balance of $30,000,000, has an outstanding principal balance as of the Cut-off Date of $29,947,006 and accrues interest at an interest rate of 4.659% per annum. The Hampton Inn & Suites Oceanfront Mortgage Loan had an initial term of 120 months, has a remaining term of 119 months as of the Cut-off Date and requires payments of principal and interest based on a 25-year amortization schedule. The Hampton Inn & Suites Oceanfront Mortgage Loan matures on April 1, 2023.
Following the lockout period, the borrower has the right to defease the Hampton Inn & Suites Oceanfront Mortgage Loan in whole, but not in part, on any due date before January 1, 2023. In addition, the Hampton Inn & Suites Oceanfront Mortgage Loan is prepayable without penalty on or after January 1, 2023.
THE INFORMATION IN THIS STRUCTURAL AND COLLATERAL TERM SHEET IS NOT COMPLETE AND MAY BE AMENDED PRIOR TO THE TIME OF SALE. THIS TERM SHEET IS NOT AN OFFER TO SELL THESE SECURITIES AND IT IS NOT A SOLICITATION OF AN OFFER TO BUY THESE SECURITIES IN ANY JURISDICTION WHERE THE OFFER OR SALE IS NOT PERMITTED.
58
HAMPTON INN & SUITES OCEANFRONT
Sources and Uses
Sources | Uses | |||||||||||||||||
Original loan amount | $ | 30,000,000 | 96.0 | % | Loan payoff | $ | 30,100,187 | 96.4 | % | |||||||||
Sponsor’s new cash contribution | 1,233,767 | 4.0 | Reserves | 211,441 | 0.7 | |||||||||||||
| Closing costs | 922,139 | 3.0 | ||||||||||||||||
|
|
|
|
|
|
|
| |||||||||||
Total Sources | $ | 31,233,767 | 100.0 | % | Total Uses | $ | 31,233,767 | 100.0 | % | |||||||||
|
|
|
|
|
|
|
| |||||||||||
The Property.The Hampton Inn & Suites Oceanfront Property is a 227-room, 14-story, limited-service hotel located in Myrtle Beach, South Carolina. The Hampton Inn & Suites Oceanfront Property was developed by the sponsor in two phases. The first tower was built in 2000 and consists of 113 rooms while the second tower was built in 2009 and consists of 114 rooms. The first tower was renovated in 2009 shortly after the second tower was built. The Hampton Inn & Suites Oceanfront Property is situated on a 3.3-acre site and has 315 feet of ocean frontage along the Atlantic Ocean. Amenities at the Hampton Inn & Suites Oceanfront Property include a large outdoor pool, two outdoor children’s splash pools, two outdoor lazy rivers, two indoor/outdoor pools, two whirlpools, playground, exercise room, day spa, two breakfast dining areas, 1,655 square feet of meeting & group space, business center, guest laundry facilities, convenience shop and vending areas. The Hampton Inn & Suites Oceanfront Property offers 36 king guestrooms, 121 queen guestrooms, 14 one-bedroom king suites, 20 two-bedroom one-bathroom suites, 32 two-bedroom two-bathroom suites and four two-bedroom two-bathroom penthouses. The standard guestroom features a 27-inch flat-panel television, work desk and chair, dresser, bedside tables, microwave, small refrigerator, iron and ironing board and coffeemaker. Most guestrooms have a balcony with a view of the Atlantic Ocean. Suites offer a larger living space with an additional chair, an ottoman and amenities such as a fully equipped kitchen and separate bedrooms and bathrooms. The Hampton Inn & Suites Oceanfront Property has 295 parking spaces located in an attached four-story parking garage located on the northwest portion of the lot. The Hampton Inn & Suites Oceanfront Property’s franchise agreement expires on March 31, 2028.
Operating History and Underwritten Net Cash Flow.The following table represents certain information relating to the historical operating performance and the Underwritten Net Cash Flow at the Hampton Inn & Suites Oceanfront Property:
Cash Flow Analysis
| 2010 | 2011 | 2012 | U/W | U/W $ per Room | ||||||||||||||||
Occupancy | 63.6% | 72.9% | 74.3% | 74.3% | ||||||||||||||||
ADR | $ | 146.97 | $ | 146.96 | $ | 160.10 | $ | 160.10 | ||||||||||||
RevPAR | $ | 93.47 | $ | 107.13 | $ | 119.00 | $ | 119.00 | ||||||||||||
Total Revenue | $ | 7,881,528 | $ | 9,056,173 | $ | 10,061,479 | $ | 10,033,952 | $ | 44,202 | ||||||||||
Total Department Expenses | 1,913,886 | 2,163,701 | 2,200,555 | 2,194,588 | 9,668 | |||||||||||||||
|
|
|
|
|
|
|
|
|
| |||||||||||
Gross Operating Profit | $ | 5,967,642 | $ | 6,892,472 | $ | 7,860,924 | $ | 7,839,363 | $ | 34,535 | ||||||||||
Total Undistributed Expenses | 3,231,104 | 3,443,804 | 3,569,927 | 3,558,369 | 15,676 | |||||||||||||||
|
|
|
|
|
|
|
|
|
| |||||||||||
Profit Before Fixed Charges | $ | 2,736,538 | $ | 3,448,668 | $ | 4,290,997 | $ | 4,280,995 | $ | 18,859 | ||||||||||
Total Fixed Charges | 493,996 | 534,590 | 538,887 | 698,984 | 3,079 | |||||||||||||||
|
|
|
|
|
|
|
|
|
| |||||||||||
Net Operating Income | $ | 2,242,542 | $ | 2,914,078 | $ | 3,752,110 | $ | 3,582,011 | $ | 15,780 | ||||||||||
FF&E | 0 | 0 | 0 | 401,358 | 1,768 | |||||||||||||||
|
|
|
|
|
|
|
|
|
| |||||||||||
Net Cash Flow | $ | 2,242,542 | $ | 2,914,078 | $ | 3,752,110 | $ | 3,180,652 | $ | 14,012 | ||||||||||
NOI DSCR | 1.10x | 1.43x | 1.85x | 1.76x | ||||||||||||||||
NCF DSCR | 1.10x | 1.43x | 1.85x | 1.56x | ||||||||||||||||
NOI DY | 7.5% | 9.7% | 12.5% | 12.0% | ||||||||||||||||
NCF DY | 7.5% | 9.7% | 12.5% | 10.6% | ||||||||||||||||
Appraisal.As of the appraisal valuation date of January 17, 2013, the Hampton Inn & Suites Oceanfront Property had an “as-is” appraised value of $47,000,000.
Environmental Matters. According to the Phase I environmental site assessment dated January 31, 2013, there was no evidence of any recognized environmental conditions at the Hampton Inn & Suites Oceanfront Property.
Market Overview and Competition.The Hampton Inn & Suites Oceanfront Property is located in Myrtle Beach, South Carolina less than one mile from the Myrtle Beach International Airport. The Myrtle Beach International Airport serves approximately 1.8 million domestic and international passengers a year. The Myrtle Beach area is a popular tourist destination with approximately 14 million visitors per year. The location of the Hampton Inn & Suites Oceanfront Property benefits from numerous demand generators including Broadway at the Beach, the Myrtle Beach Boardwalk, the Myrtle Beach Convention Center, approximately 100 golf courses and 50 miniature golf courses. Broadway at the Beach is a 350-acre complex featuring 11 nightclubs, 20 restaurants, 100 specialty stores and 15 attractions including Ripley’s Aquarium, NASCAR SpeedPark and the Palace Theatre located five miles northeast. The Myrtle Beach Convention Center is located approximately three miles north and is one of the largest convention centers on the east coast. The Myrtle Beach Convention Center originally opened in 1967 and was expanded to more than 249,000 square feet in 1994.
THE INFORMATION IN THIS STRUCTURAL AND COLLATERAL TERM SHEET IS NOT COMPLETE AND MAY BE AMENDED PRIOR TO THE TIME OF SALE. THIS TERM SHEET IS NOT AN OFFER TO SELL THESE SECURITIES AND IT IS NOT A SOLICITATION OF AN OFFER TO BUY THESE SECURITIES IN ANY JURISDICTION WHERE THE OFFER OR SALE IS NOT PERMITTED.
59
HAMPTON INN & SUITES OCEANFRONT
The following table presents certain information relating to the Hampton Inn & Suites Oceanfront Property’s competitive set:
Subject and Market Historical Occupancy, ADR and RevPAR(1)
| Competitive Set | Hampton Inn & Suites Oceanfront | Penetration Factor | ||||||||||||||||||||||||||||||||||
Year | Occupancy | ADR | RevPAR | Occupancy | ADR | RevPAR | Occupancy | ADR | RevPAR | |||||||||||||||||||||||||||
1/31/2013 TTM | 59.5 | % | $ | 122.64 | $ | 72.91 | 75.2 | % | $ | 159.30 | $ | 119.74 | 126.4 | % | 129.9 | % | 164.2 | % | ||||||||||||||||||
1/31/2012 TTM | 57.7 | % | $ | 118.19 | $ | 68.25 | 73.6 | % | $ | 146.56 | $ | 107.80 | 127.4 | % | 124.0 | % | 158.0 | % | ||||||||||||||||||
1/31/2011 TTM | 57.8 | % | $ | 114.31 | $ | 66.09 | 65.5 | % | $ | 144.20 | $ | 94.48 | 113.3 | % | 126.2 | % | 143.0 | % | ||||||||||||||||||
| (1) | Information obtained from a third party hospitality report dated February 20, 2013. |
The Borrower.The borrower is Myrtle Beach Oceanfront Inn, LLC, a South Carolina limited liability company and a single purpose entity with one independent director. Legal counsel to the borrower delivered a non-consolidation opinion in connection with the origination of the Hampton Inn & Suites Oceanfront Mortgage Loan. Ross M. Lindsay, III and Bruce W. Huggins are the guarantors of certain nonrecourse carveouts under the Hampton Inn & Suites Oceanfront Mortgage Loan.
The Sponsor.The loan sponsor is Ross M. Lindsay, III, a tax attorney and CPA who has provided tax and real estate planning services to high net worth individuals and families in South Carolina for 37 years. Mr. Lindsay has been involved in the Myrtle Beach hotel market for over 30 years and currently operates and owns 50% of two other Hampton Inn & Suites hotels in Spartanburg and Clinton, South Carolina.
Escrows.The loan documents provide for upfront escrows at closing in the amount of $76,299 for real estate taxes, $80,142 for insurance premiums and $55,000 for Property Improvement Plan (“PIP”) expenditures. The loan documents also provide for ongoing escrows initially in the amount of $19,075 for real estate taxes, $39,615 for insurance premiums and $33,447 for FF&E (based on one-twelfth of 4.0% of the annual gross revenue). Additionally, the loan documents provide for an ongoing seasonality reserve to be funded with all excess cash flow on a monthly basis to achieve a threshold amount (detailed below), or, if such excess cash flow is not sufficient to fund the account to the required threshold amount by October 1st of each year, the borrower is required to fund any shortfalls up to the threshold amount. The threshold amount for the seasonality reserve is 120% of the projected monthly debt service shortfalls for any year and is initially $1.2 million. Such threshold amount is recalculated at the lender’s discretion at least once per year based on the prior year financials.
Lockbox and Cash Management.The Hampton Inn & Suites Oceanfront Mortgage Loan requires a lender-controlled lockbox account, which is already in place, into which the borrower will cause all credit card receipts to be directly deposited. Prior to the occurrence of a Cash Management Period (as defined below), all funds on deposit in the lockbox account are swept into the borrower’s operating account on a daily basis. During a Cash Management Period, all funds on deposit in the lockbox account are swept to a lender-controlled cash management account each business day.
A “Cash Management Period” will exist upon (i) the occurrence and continuance of an event of default; (ii) the debt service coverage falling below 1.15x at the end of any calendar quarter; or (iii) 12 months prior to the expiration of the franchise agreement if the borrower has not entered into a replacement franchise agreement satisfactory to the lender or the borrower has failed to reserve funds required under a PIP. A Cash Management Period will expire upon with respect to the matters described in clause (i) above, the cure of such event of default; with respect to the matters described in clause (ii) above, the debt service coverage ratio being at least 1.15x for two consecutive calendar quarters; or with respect to the matter described in clause (iii) above, the borrower has entered into a replacement franchise agreement satisfactory to the lender or reserved funds required under a PIP, as applicable.
Property Management.The Hampton Inn & Suites Oceanfront Property is managed by an affiliate of the borrower.
Assumption.The borrower has the right to transfer the Hampton Inn & Suites Oceanfront Property and cause an assumption of the Hampton Inn & Suites Oceanfront Mortgage Loan, provided that certain conditions are satisfied, including, but not limited to: (i) no event of default has occurred and is continuing; (ii) the identity, experience, financial condition and creditworthiness of the transferee and the replacement guarantors and indemnitors are satisfactory to the lender; and (iii) the lender, if required pursuant to the pooling and servicing agreement, has received confirmation from Fitch and Moody’s that such assumption will not result in a downgrade, withdrawal or qualification of the respective ratings assigned to the Series 2013-C13 Certificates.
Partial Release.Not permitted.
Real Estate Substitution.Not permitted.
Subordinate and Mezzanine Indebtedness.Not permitted.
Ground Lease. None.
Terrorism Insurance.The loan documents require that the “all risk” insurance policy required to be maintained by the borrower provide coverage for terrorism in an amount equal to the full replacement cost of the Hampton Inn & Suites Oceanfront Property, as well as business interruption insurance covering no less than the 18-month period following the occurrence of a casualty event, together with a six-month extended period of indemnity.
THE INFORMATION IN THIS STRUCTURAL AND COLLATERAL TERM SHEET IS NOT COMPLETE AND MAY BE AMENDED PRIOR TO THE TIME OF SALE. THIS TERM SHEET IS NOT AN OFFER TO SELL THESE SECURITIES AND IT IS NOT A SOLICITATION OF AN OFFER TO BUY THESE SECURITIES IN ANY JURISDICTION WHERE THE OFFER OR SALE IS NOT PERMITTED.
60
[THIS PAGE INTENTIONALLY LEFT BLANK.]
61
ASHFORD PLACE APARTMENTS
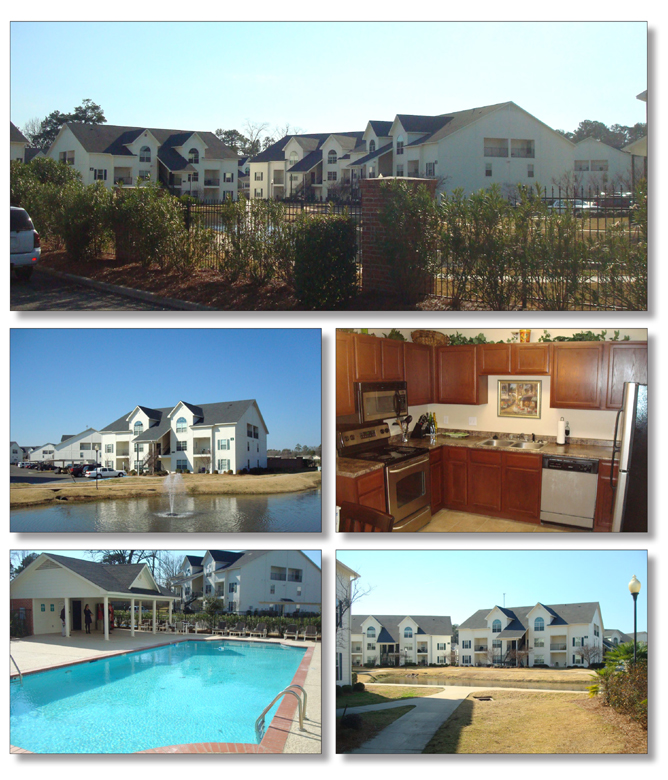
THE INFORMATION IN THIS STRUCTURAL AND COLLATERAL TERM SHEET IS NOT COMPLETE AND MAY BE AMENDED PRIOR TO THE TIME OF SALE. THIS TERM SHEET IS NOT AN OFFER TO SELL THESE SECURITIES AND IT IS NOT A SOLICITATION OF AN OFFER TO BUY THESE SECURITIES IN ANY JURISDICTION WHERE THE OFFER OR SALE IS NOT PERMITTED.
62
ASHFORD PLACE APARTMENTS
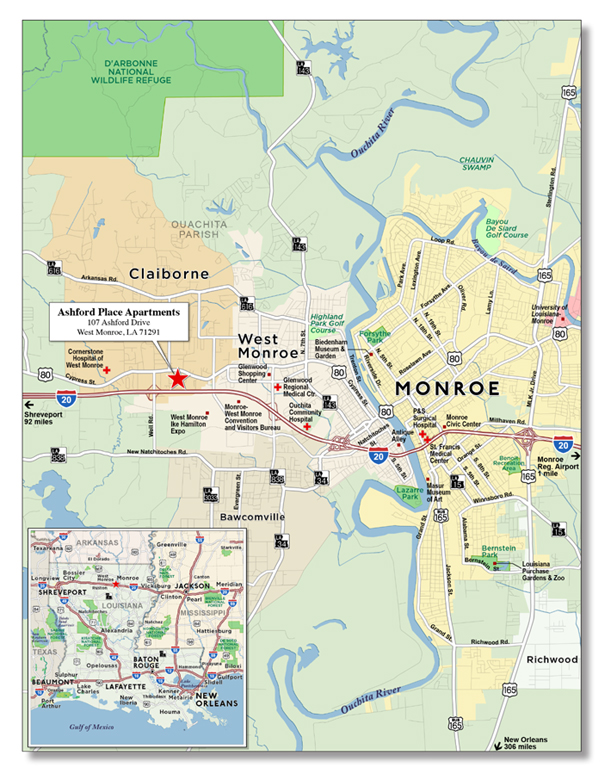
THE INFORMATION IN THIS STRUCTURAL AND COLLATERAL TERM SHEET IS NOT COMPLETE AND MAY BE AMENDED PRIOR TO THE TIME OF SALE. THIS TERM SHEET IS NOT AN OFFER TO SELL THESE SECURITIES AND IT IS NOT A SOLICITATION OF AN OFFER TO BUY THESE SECURITIES IN ANY JURISDICTION WHERE THE OFFER OR SALE IS NOT PERMITTED.
63
No. 6 – Ashford Place Apartments
| Loan Information | ||
| Mortgage Loan Seller: | The Royal Bank of Scotland | |
| Credit Assessment | ||
| (Fitch/Moody’s): | NR/NR | |
| Original Principal Balance: | $24,575,000 | |
| Cut-off Date Principal Balance: | $24,575,000 | |
| % of Initial Pool Balance: | 2.8% | |
| Loan Purpose: | Refinance | |
| Borrower Name: | Ashford Place Apartments, LLC | |
| Sponsors: | Michael Anderson; Kenneth Tramp | |
| Mortgage Rate: | 4.195% | |
| Note Date: | February 8, 2013 | |
| Anticipated Repayment Date: | NAP | |
| Maturity Date: | March 1, 2023 | |
| IO Period: | 18 months | |
| Loan Term (Original): | 120 months | |
| Seasoning: | 2 months | |
| Amortization Term (Original): | 360 months | |
| Loan Amortization Type: | Interest-only, Amortizing Balloon | |
| Interest Accrual Method: | Actual/360 | |
| Call Protection: | L(26),D(90),O(4) | |
| Lockbox Type: | Soft/Springing Cash Management | |
| Additional Debt: | None | |
| Additional Debt Type: | NAP | |
| Escrows and Reserves(1): | ||||||
Type: | Initial | Monthly | Cap (If Any) | |||||||
| Taxes | $ | 96,000 | $ | 23,911 | NAP | |||||
| Insurance | $ | 40,000 | $ | 7,380 | NAP | |||||
| Replacement Reserves | $ | 0 | $ | 7,042 | NAP | |||||
| Property Information | ||
| Single Asset/Portfolio: | Single Asset | |
| Property Type: | Multifamily | |
| Specific Property Type: | Garden | |
| Location: | West Monroe, LA | |
| Size: | 338 units | |
| Cut-off Date Principal | ||
| Balance Per Unit: | $72,707 | |
| Year Built/Renovated(2): | 2006/NAP | |
| Title Vesting: | Fee | |
| Property Manager: | Self-managed | |
| 3rdMost Recent Occupancy (As of): | 91.7% (12/31/2010) | |
| 2ndMost Recent Occupancy (As of)(3): | 82.8% (12/31/2011) | |
| Most Recent Occupancy (As of): | 95.3% (12/31/2012) | |
| Current Occupancy (As of): | 93.2% (1/9/2013) | |
Underwriting and Financial Information: | ||
3rdMost Recent NOI (As of): | $2,010,498 (12/31/2010) | |
| 2ndMost Recent NOI (As of): | $1,665,830 (12/31/2011) | |
| Most Recent NOI (As of): | $2,263,309 (12/31/2012) | |
| U/W Revenues: | $3,866,609 | |
| U/W Expenses: | $1,544,344 | |
| U/W NOI: | $2,322,265 | |
| U/W NCF: | $2,237,765 | |
| U/W NOI DSCR: | 1.61x | |
| U/W NCF DSCR: | 1.55x | |
| U/W NOI Debt Yield: | 9.4% | |
| U/W NCF Debt Yield: | 9.1% | |
| As-Is Appraised Value: | $33,000,000 | |
| As-Is Appraisal Valuation Date: | January 11, 2013 | |
| Cut-off Date LTV Ratio: | 74.5% | |
| LTV Ratio at Maturity or ARD: | 62.2% | |
| (1) | See “Escrows” section. |
| (2) | The Ashford Place Apartments Property was built in phases between 2006 and 2008. |
| (3) | In 2011, the occupancy decreased to 82.8% as the sponsor and manager moved away from signing leases with corporate tenants and implemented a more rigorous qualification process for prospective tenants. After implementing such changes, the occupancy increased to 95.3% in 2012. |
The Mortgage Loan.The mortgage loan (the “Ashford Place Apartments Mortgage Loan”) is evidenced by a single promissory note that is secured by a first mortgage encumbering a 28-building, class A, garden-style multifamily property located in West Monroe, Louisiana (the “Ashford Place Apartments Property”). The Ashford Place Apartments Mortgage Loan was originated on February 8, 2013 by The Royal Bank of Scotland. The Ashford Place Apartments Mortgage Loan had an original principal balance of $24,575,000, has an outstanding balance as of the Cut-off Date of $24,575,000 and accrues interest at an interest rate of 4.195% per annum. The Ashford Place Apartments Mortgage Loan had an initial term of 120 months, has a remaining term of 118 months as of the Cut-off Date and requires interest-only payments for the first 18 months following origination and thereafter requires payments of principal and interest based on a 30-year amortization schedule. The Ashford Place Apartments Mortgage Loan matures on March 1, 2023.
Following the lockout period, the borrower has the right to defease the Ashford Place Apartments Mortgage Loan in whole, but not in part, on any due date before December 1, 2022. In addition, the Ashford Place Apartments Mortgage Loan is prepayable without penalty on or after December 1, 2022.
THE INFORMATION IN THIS STRUCTURAL AND COLLATERAL TERM SHEET IS NOT COMPLETE AND MAY BE AMENDED PRIOR TO THE TIME OF SALE. THIS TERM SHEET IS NOT AN OFFER TO SELL THESE SECURITIES AND IT IS NOT A SOLICITATION OF AN OFFER TO BUY THESE SECURITIES IN ANY JURISDICTION WHERE THE OFFER OR SALE IS NOT PERMITTED.
64
ASHFORD PLACE APARTMENTS
Sources and Uses
Sources | Uses | |||||||||||||||||
Original loan amount | $ | 24,575,000 | 99.0 | % | Loan payoff | $ | 23,989,409 | 96.6 | % | |||||||||
Sponsor’s new cash contribution | 255,925 | 1.0 | Reserves | 136,000 | 0.5 | |||||||||||||
| Closing costs | 705,516 | 2.8 | ||||||||||||||||
|
|
|
|
|
|
|
| |||||||||||
Total Sources | $ | 24,830,925 | 100.0 | % | Total Uses | $ | 24,830,925 | 100.0 | % | |||||||||
|
|
|
|
|
|
|
| |||||||||||
The Property. The Ashford Place Apartments Property is a 28-building, class A, garden-style multifamily property located in West Monroe, Louisiana. The Ashford Place Apartments Property consists of 338 units and was built in phases between 2006 and 2008. Common area amenities include two swimming pools, clubhouse, fitness center, business center, laundry room, tennis court, large landscaped pond and additional carport parking. Unit amenities include stainless steel kitchen appliances with a microwave, granite countertops, security systems, fully sprinklered units, garden tubs in most units, a patio/balcony, extra storage and ceiling fans. As of January 9, 2013, the Ashford Place Apartments Property was 93.2% leased. The property contains 567 open surface parking spaces and 119 carports for a total of 686 parking spaces, reflecting an overall parking ratio of 2.0 spaces per unit.
The following table presents certain information relating to the unit mix of the Ashford Place Apartments Property:
Apartment Unit Summary(1)
Unit Type | No. of Units | % of Total Units | Average Unit Size (SF) | Average Monthly Rent per Unit | ||||||||||||
1 BR/1 BA | 1 | 0.3 | % | 750 | $ | 650 | ||||||||||
1 BR/1 BA | 64 | 18.9 | % | 942 | $ | 805 | ||||||||||
1 BR/1 BA | 48 | 14.2 | % | 1,092 | $ | 825 | ||||||||||
2 BR/2 BA | 1 | 0.3 | % | 1,200 | $ | 935 | ||||||||||
2 BR/2 BA | 64 | 18.9 | % | 1,110 | $ | 935 | ||||||||||
2 BR/2 BA | 64 | 18.9 | % | 1,149 | $ | 945 | ||||||||||
3 BR/2 BA | 48 | 14.2 | % | 1,355 | $ | 1,055 | ||||||||||
3 BR/2 BA | 48 | 14.2 | % | 1,373 | $ | 1,065 | ||||||||||
|
|
|
|
|
|
|
| |||||||||
Total/Weighted Average | 338 | 100.0 | % | 1,154 | $ | 931 | ||||||||||
|
|
|
|
|
|
|
| |||||||||
| (1) | Information obtained from the underwritten rent roll. |
The following table presents historical occupancy percentages at the Ashford Place Apartments Property:
Historical Occupancy(1)(2)
12/31/2010 | 12/31/2011 | 12/31/2012 | 1/9/2013 | |||
91.7% | 82.8% | 95.3% | 93.2% |
| (1) | Information obtained from the borrower. |
| (2) | In 2011, the occupancy decreased to 82.8% as the sponsor and the manager moved away from signing leases with corporate tenants and implemented a more rigorous qualification process for prospective tenants. After implementing such changes, the occupancy increased to 95.3% in 2012. |
THE INFORMATION IN THIS STRUCTURAL AND COLLATERAL TERM SHEET IS NOT COMPLETE AND MAY BE AMENDED PRIOR TO THE TIME OF SALE. THIS TERM SHEET IS NOT AN OFFER TO SELL THESE SECURITIES AND IT IS NOT A SOLICITATION OF AN OFFER TO BUY THESE SECURITIES IN ANY JURISDICTION WHERE THE OFFER OR SALE IS NOT PERMITTED.
65
ASHFORD PLACE APARTMENTS
Operating History and Underwritten Net Cash Flow. The following table presents certain information relating to the historical operating performance and the Underwritten Net Cash Flow at the Ashford Place Apartments Property:
Cash Flow Analysis
| 2010 | 2011 | 2012 | U/W | U/W per Unit | ||||||||||||||||
Base Rent | $ | 3,833,325 | $ | 3,877,805 | $ | 3,857,491 | $ | 3,801,952 | $ | 11,248 | ||||||||||
Grossed Up Vacant Space | 0 | 0 | 0 | 165,900 | 491 | |||||||||||||||
Concessions | (10,665 | ) | (21,863 | ) | (111 | ) | 0 | 0 | ||||||||||||
Other Income | 241,733 | 216,360 | 250,199 | 248,898 | 736 | |||||||||||||||
Less Vacancy & Credit Loss | (421,448 | ) | (831,413 | ) | (316,829 | ) | (350,141 | )(1) | (1,036 | ) | ||||||||||
|
|
|
|
|
|
|
|
|
| |||||||||||
Effective Gross Income | $ | 3,642,945 | $ | 3,240,889 | $ | 3,790,750 | $ | 3,866,609 | $ | 11,440 | ||||||||||
Total Operating Expenses | $ | 1,632,447 | $ | 1,575,059 | $ | 1,527,441 | $ | 1,544,344 | $ | 4,569 | ||||||||||
|
|
|
|
|
|
|
|
|
| |||||||||||
Net Operating Income | $ | 2,010,498 | $ | 1,665,830 | $ | 2,263,309 | $ | 2,322,265 | $ | 6,871 | ||||||||||
Capital Expenditures | 0 | 0 | 0 | 84,500 | 250 | |||||||||||||||
|
|
|
|
|
|
|
|
|
| |||||||||||
Net Cash Flow | $ | 2,010,498 | $ | 1,665,830 | $ | 2,263,309 | $ | 2,237,765 | $ | 6,621 | ||||||||||
NOI DSCR | 1.39x | 1.16x | 1.57x | 1.61x | ||||||||||||||||
NCF DSCR | 1.39x | 1.16x | 1.57x | 1.55x | ||||||||||||||||
NOI DY | 8.2 | % | 6.8 | % | 9.2 | % | 9.4 | % | ||||||||||||
NCF DY | 8.2 | % | 6.8 | % | 9.2 | % | 9.1 | % | ||||||||||||
| (1) | The underwritten economic vacancy is 8.8%. The Ashford Place Apartments Property was 93.2% physically occupied as of January 9, 2013. |
Appraisal.As of the appraisal valuation date of January 11, 2013, the Ashford Place Apartments Property had an “as-is” appraised value of $33,000,000.
Environmental Matters.According to the Phase I environmental site assessment dated January 13, 2013, there was no evidence of any recognized environmental conditions at the Ashford Place Apartments Property.
Market Overview and Competition.The Ashford Place Apartments Property is a garden-style multifamily property located in West Monroe, Louisiana, approximately 10 miles west of the Monroe Regional Airport, approximately 100 miles from Shreveport, Louisiana and approximately 120 miles west of Jackson, Mississippi. Regional access to the local area is provided by Interstate Highway 20, a major east/west freeway system within the southern United States, which links the city with the nearby markets of Shreveport, Louisiana and Jackson, Mississippi. The 2012 population within a one-, three- and five-mile radius of the Ashford Place Apartments Property was 4,194, 31,903 and 59,484, respectively. The average household income within the same one-, three- and five-mile radii was $50,791, $53,256 and $55,208, respectively.
The appraisal identified a competitive set of five multifamily properties, which exhibit a 4.9% average vacancy rate and average asking rents of $706 per month for one-bedroom units, $783 per month for two-bedroom units, and $935 per month for three-bedroom units.
The following table presents certain information relating to some comparable multifamily properties for the Ashford Place Apartments Property:
Competitive Set(1)
| Ashford Place Apartments (Subject) | Pennacle | Town and Country | Shadow Creek | Sheree Place | Van Mark | |||||||
Location | West Monroe, LA | Monroe, LA | Monroe, LA | West Monroe, LA | West Monroe, LA | Monroe, LA | ||||||
Distance to Subject | — | 12.5 miles | 11.7 miles | 1.6 miles | 0.9 miles | 12.9 miles | ||||||
Property Type | Garden | Garden | Garden | Garden | Garden | Garden | ||||||
Number of Units | 338 | 216 | 300 | 164 | 26 | 144 | ||||||
Average Rent (per unit) | ||||||||||||
1BR | $812 | $770 | $619 | $620 | NAP | $685 | ||||||
2BR | $940 | $875 | $669 | $678 | $1,003 | $785 | ||||||
3BR | $1060 | $980 | $819 | $885 | $1,130 | NAP | ||||||
Utilities | Paid by tenant | Sewer included | Water and sewer included | Water and sewer included | Water and sewer included | Water and sewer included | ||||||
Total Occupancy | 93% | 96% | 93% | 91% | 100% | 95% | ||||||
| (1) | Information obtained from the appraisal dated January 30, 2013. |
THE INFORMATION IN THIS STRUCTURAL AND COLLATERAL TERM SHEET IS NOT COMPLETE AND MAY BE AMENDED PRIOR TO THE TIME OF SALE. THIS TERM SHEET IS NOT AN OFFER TO SELL THESE SECURITIES AND IT IS NOT A SOLICITATION OF AN OFFER TO BUY THESE SECURITIES IN ANY JURISDICTION WHERE THE OFFER OR SALE IS NOT PERMITTED.
66
ASHFORD PLACE APARTMENTS
The Borrower. The borrower is Ashford Place Apartments, LLC, a Mississippi limited liability company and single purpose entity with one independent director. Legal counsel to the borrower delivered a non-consolidation opinion in connection with the origination of the Ashford Place Apartments Mortgage Loan. Michael Anderson and Kenneth Tramp, the sponsors, are the guarantors of certain nonrecourse carveouts under the Ashford Place Apartments Mortgage Loan.
The Sponsor. The sponsors are Michael Anderson and Kenneth Tramp. Michael Anderson is the chairman, founder and co-owner of RealSource Property Consulting, LLC (“RealSource”). RealSource was established in 1989 and offers consulting services including real estate brokerage, commercial loan origination, tenant-in-common sponsorship, development, property management and real estate insurance services. The company’s primary real estate investments are multifamily properties. As of November 30, 2012, RealSource’s real estate portfolio included 3,600 units across 12 properties.
Escrows.The loan documents provide for upfront escrows in the amount of $96,000 for real estate taxes and $40,000 for insurance premiums. The loan documents also provide for ongoing monthly escrows in the amount of $23,911 for real estate taxes, $7,380 for insurance premiums and $7,042 for replacement reserves.
Lockbox and Cash Management.The Ashford Place Apartments Mortgage Loan requires a lender-controlled lockbox account, which is already in place, and that the borrower and the property manager deposit all revenues into such lockbox account. The loan documents also require that all cash revenues and all other monies received by the borrower or the property manager be deposited into the lockbox account within one business day of receipt. Prior to the occurrence of a Cash Management Period (as defined below), all funds on deposit in the lockbox account are swept into the borrower’s operating account. During a Cash Management Period, all funds on deposit in the lockbox account are swept to a lender-controlled cash management account.
A “Cash Management Period” will commence upon the earlier of (i) the occurrence and continuance of an event of default and (ii) the amortizing debt service coverage ratio falling below 1.10x at the end of a calendar quarter. A Cash Management Period will end with respect to the matters described in clause (i) above, when such event of default has been cured and with respect to the matters described in clause (ii) above, when an amortizing debt service coverage ratio of at least 1.10x has been achieved for two consecutive calendar quarters.
Property Management.The Ashford Place Apartments Property is currently managed by an affiliate of the borrower.
Assumption.The borrower has the right to transfer the Ashford Place Apartments Property, subject to certain conditions in the loan documents, including but not limited to (i) no event of default has occurred and is continuing; (ii) the lender’s reasonable approval of the identity, experience, financial condition and creditworthiness of the proposed transferee and replacement guarantor; and (iii) the lender has received rating agency confirmation from Fitch and Moody’s that the transfer will not result in a downgrade, withdrawal or qualification of the respective ratings assigned to the Series 2013-C13 Certificates.
Partial Release.Not permitted
Real Estate Substitution.Not permitted.
Subordinate and Mezzanine Indebtedness.Not permitted.
Ground Lease.None.
Terrorism Insurance. The loan documents require that the “all risk” insurance policy required to be maintained by the borrower provides coverage for damage from terrorism in an amount equal to the full replacement cost of the Ashford Place Apartments Property as well as business interruption insurance covering no less than the 12-month period from the date of a casualty event.
THE INFORMATION IN THIS STRUCTURAL AND COLLATERAL TERM SHEET IS NOT COMPLETE AND MAY BE AMENDED PRIOR TO THE TIME OF SALE. THIS TERM SHEET IS NOT AN OFFER TO SELL THESE SECURITIES AND IT IS NOT A SOLICITATION OF AN OFFER TO BUY THESE SECURITIES IN ANY JURISDICTION WHERE THE OFFER OR SALE IS NOT PERMITTED.
67
BLUE DIAMOND RANCH
THE INFORMATION IN THIS STRUCTURAL AND COLLATERAL TERM SHEET IS NOT COMPLETE AND MAY BE AMENDED PRIOR TO THE TIME OF SALE. THIS TERM SHEET IS NOT AN OFFER TO SELL THESE SECURITIES AND IT IS NOT A SOLICITATION OF AN OFFER TO BUY THESE SECURITIES IN ANY JURISDICTION WHERE THE OFFER OR SALE IS NOT PERMITTED.
68
BLUE DIAMOND RANCH
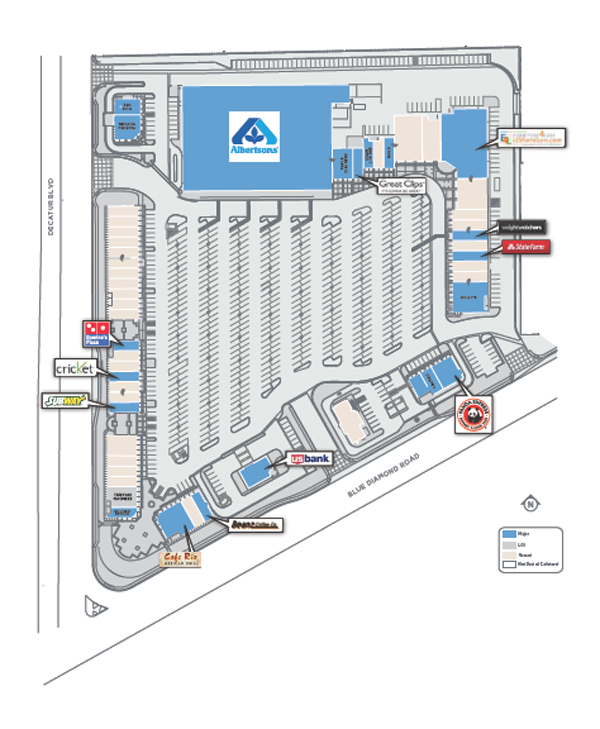
THE INFORMATION IN THIS STRUCTURAL AND COLLATERAL TERM SHEET IS NOT COMPLETE AND MAY BE AMENDED PRIOR TO THE TIME OF SALE. THIS TERM SHEET IS NOT AN OFFER TO SELL THESE SECURITIES AND IT IS NOT A SOLICITATION OF AN OFFER TO BUY THESE SECURITIES IN ANY JURISDICTION WHERE THE OFFER OR SALE IS NOT PERMITTED.
69
BLUE DIAMOND RANCH
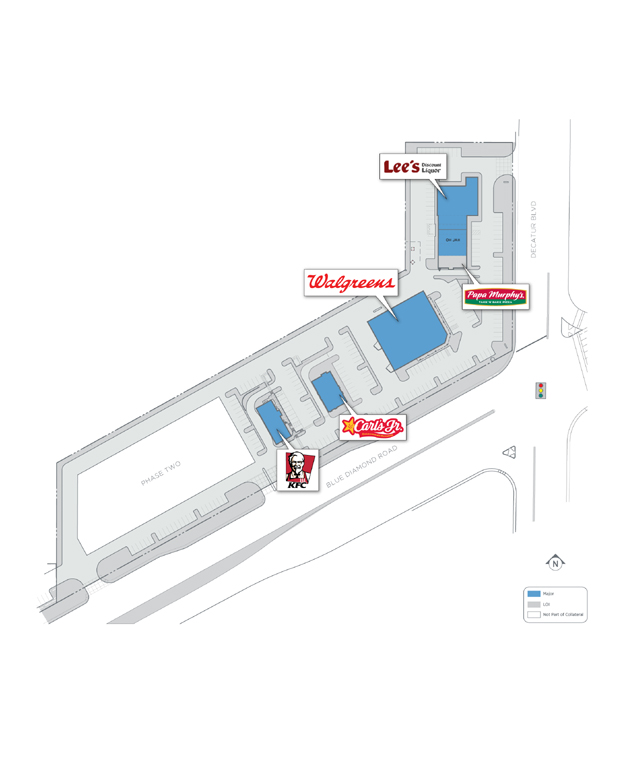
THE INFORMATION IN THIS STRUCTURAL AND COLLATERAL TERM SHEET IS NOT COMPLETE AND MAY BE AMENDED PRIOR TO THE TIME OF SALE. THIS TERM SHEET IS NOT AN OFFER TO SELL THESE SECURITIES AND IT IS NOT A SOLICITATION OF AN OFFER TO BUY THESE SECURITIES IN ANY JURISDICTION WHERE THE OFFER OR SALE IS NOT PERMITTED.
70
BLUE DIAMOND RANCH
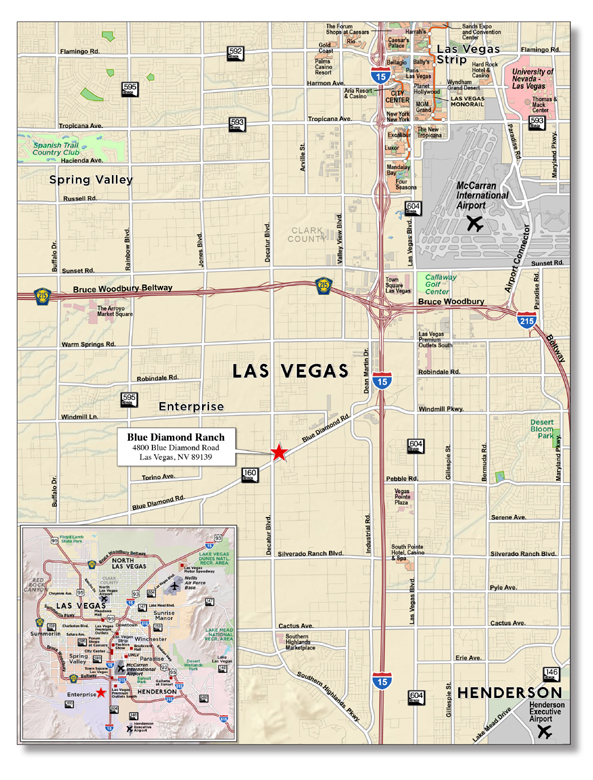
THE INFORMATION IN THIS STRUCTURAL AND COLLATERAL TERM SHEET IS NOT COMPLETE AND MAY BE AMENDED PRIOR TO THE TIME OF SALE. THIS TERM SHEET IS NOT AN OFFER TO SELL THESE SECURITIES AND IT IS NOT A SOLICITATION OF AN OFFER TO BUY THESE SECURITIES IN ANY JURISDICTION WHERE THE OFFER OR SALE IS NOT PERMITTED.
71
No. 7 – Blue Diamond Ranch
| Loan Information | ||
| Mortgage Loan Seller: | Liberty Island Group I LLC | |
| Credit Assessment | ||
| (Fitch/Moody’s): | NR/NR | |
| Original Principal Balance: | $23,000,000 | |
| Cut-off Date Principal Balance: | $22,970,041 | |
| % of Initial Pool Balance: | 2.6% | |
| Loan Purpose: | Refinance | |
| Borrower Name: | Blue Diamond CP30 2013, LLC | |
| Sponsor: | Garry Goett | |
| Mortgage Rate: | 4.560% | |
| Note Date: | March 22, 2013 | |
| Anticipated Repayment Date: | NAP | |
| Maturity Date: | April 1, 2023 | |
| IO Period: | None | |
| Loan Term (Original): | 120 months | |
| Seasoning: | 1 month | |
| Amortization Term (Original): | 360 months | |
| Loan Amortization Type: | Amortizing Balloon | |
| Interest Accrual Method: | Actual/360 | |
| Call Protection: | L(26), GRTR 1% or YM (90), O(4) | |
| Lockbox Type: | Hard/Springing Cash Management | |
| Additional Debt: | None | |
| Additional Debt Type: | NAP | |
Escrows and Reserves(1):
Type: | Initial | Monthly | Cap (If Any) | |||||||||
Taxes | $ | 40,829 | $ | 13,610 | NAP | |||||||
Insurance | $ | 5,127 | $ | 5,127 | NAP | |||||||
Replacement Reserves | $ | 0 | $ | 1,306 | NAP | |||||||
TI/LC Reserve | $ | 0 | $ | 12,000 | $ | 288,000 | ||||||
| Property Information | ||
| Single Asset/Portfolio: | Single Asset | |
| Property Type: | Retail | |
| Specific Property Type: | Anchored | |
| Location: | Las Vegas, NV | |
| Size: | 104,450 SF | |
| Cut-off Date Principal Balance Per Unit/SF: | $219.91 | |
| Year Built/Renovated: | Various – See Table | |
| Title Vesting: | Fee | |
| Property Manager: | Self-managed | |
| 3rdMost Recent Occupancy (As of)(2): | 31.0% (12/31/2010) | |
| 2ndMost Recent Occupancy (As of)(2): | 45.0% (12/31/2011) | |
| Most Recent Occupancy (As of)(2): | 55.0% (12/31/2012) | |
| Current Occupancy (As of): | 66.6% (3/11/2013) | |
| Underwriting and Financial Information: | ||
| 3rdMost Recent NOI (As of)(2): | $1,464,346 (12/31/2010) | |
| 2ndMost Recent NOI (As of)(2): | $2,246,324 (12/31/2011) | |
| Most Recent NOI (As of): | $2,321,832 (12/31/2012) | |
| U/W Revenues: | $3,129,402 | |
| U/W Expenses: | $839,599 | |
| U/W NOI: | $2,289,803 | |
| U/W NCF: | $2,191,229 | |
| U/W NOI DSCR: | 1.63x | |
| U/W NCF DSCR: | 1.56x | |
| U/W NOI Debt Yield: | 10.0% | |
| U/W NCF Debt Yield: | 9.5% | |
| As-Is Appraised Value: | $38,570,000 | |
| As-Is Appraisal Valuation Date: | January 17, 2013 | |
| Cut-off Date LTV Ratio: | 59.6% | |
| LTV Ratio at Maturity or ARD: | 48.3% | |
| (1) | See “Escrows” section. |
| (2) | The low historical occupancy is primarily due to the Blue Diamond Ranch Properties being completed in 2008 and 2010. |
The Mortgage Loan. The mortgage loan (the “Blue Diamond Ranch Mortgage Loan”) is evidenced by a single promissory note that is secured by two first priority mortgages encumbering two retail centers located in Las Vegas, Nevada (the “Blue Diamond Ranch Properties”). The Blue Diamond Ranch Mortgage Loan was originated on March 22, 2013 by Prudential Mortgage Capital Company, LLC. The Blue Diamond Ranch Mortgage Loan had an original principal balance of $23,000,000, has an outstanding principal balance as of the Cut-off Date of $22,970,041 and accrues interest at an interest rate of 4.560% per annum. The Blue Diamond Ranch Mortgage Loan had an initial term of 120 months, has a remaining term of 119 months as of the Cut-off Date and requires payments of principal and interest based on a 30-year amortization schedule. The Blue Diamond Ranch Mortgage Loan matures on April 1, 2023.
Following the lockout period, the borrower has the right to prepay the Blue Diamond Ranch Mortgage Loan in whole, but not in part, provided that the borrower pays the greater of a yield maintenance premium or a prepayment premium equal to 1.0% of the then outstanding principal balance. In addition, the Blue Diamond Ranch Mortgage Loan is prepayable without penalty on or after January 1, 2023.
THE INFORMATION IN THIS STRUCTURAL AND COLLATERAL TERM SHEET IS NOT COMPLETE AND MAY BE AMENDED PRIOR TO THE TIME OF SALE. THIS TERM SHEET IS NOT AN OFFER TO SELL THESE SECURITIES AND IT IS NOT A SOLICITATION OF AN OFFER TO BUY THESE SECURITIES IN ANY JURISDICTION WHERE THE OFFER OR SALE IS NOT PERMITTED.
72
BLUE DIAMOND RANCH
Sources and Uses
Sources | Uses | |||||||||||||
Original loan amount | $23,000,000 | 100.0% | Loan payoff | $ | 21,384,969 | 93.0 | % | |||||||
| Closing costs | 776,134 | 3.4 | ||||||||||||
| Reserves | 45,956 | 0.2 | ||||||||||||
| Return of equity | 792,942 | 3.4 | ||||||||||||
|
|
|
|
|
| |||||||||
Total Sources | $23,000,000 | 100.0% | Total Uses | $ | 23,000,000 | 100.0 | % | |||||||
|
|
|
|
|
| |||||||||
The Properties. The Blue Diamond Ranch Properties consist of two anchored retail buildings totaling approximately 104,450 square feet and are located in Las Vegas, Nevada (the Blue Diamond Ranch Center property and the Blue Diamond Ranch Plaza property). The Blue Diamond Ranch Center property contains approximately 75,047 square feet and is situated on approximately 15.2 acres of land located at the northeast corner of the intersection of Blue Diamond Road and South Decatur Boulevard. Built in 2008, the Blue Diamond Ranch Center property is anchored by an Albertson’s grocery store and as of March 11, 2013, was 55.2% leased by 20 tenants. The Blue Diamond Ranch Plaza property contains approximately 29,403 square feet and is situated on approximately 5.1 acres of land located on the northwest corner of the intersection of Blue Diamond Road and South Decatur Boulevard. As of March 11, 2013, the Blue Diamond Ranch Plaza property was 95.5% leased by five tenants. In aggregate, the Blue Diamond Ranch Properties were 66.6% occupied by 25 tenants as of March 11, 2013.
The following table represents certain information relating to the Blue Diamond Ranch Properties:
Property Name | Allocated Cut-off Date Principal Balance | % of Portfolio Cut-off Date Principal Balance | Total Occupancy | Year Built/ Renovated | Net Rentable Area (SF) | Appraised Value | ||||||||||||
Blue Diamond Ranch Center | NAP | NAP | 55.2 | % | 2008/NAP | 75,047 | $ | 24,070,000 | ||||||||||
Blue Diamond Ranch Plaza | NAP | NAP | 95.5 | % | 2010/NAP | 29,403 | $ | 14,500,000 | ||||||||||
|
|
|
|
|
| |||||||||||||
Total/Weighted Average | NAP | NAP | 66.6 | % | 104,450 | $ | 38,570,000 | |||||||||||
|
|
|
|
|
| |||||||||||||
The following table presents certain information relating to the tenancies at the Blue Diamond Ranch Properties:
Major Tenants
Tenant Name | Credit Rating (Fitch/ Moody’s/S&P)(1) | Tenant NRSF | % of NRSF | Annual U/W Base Rent PSF | Annual U/W Base Rent | % of Total Annual U/W Base Rent | Sales PSF(2) | Occupancy Cost(2) | Lease Expiration Date | |||||||||||||||||||||||||
Major Tenants | ||||||||||||||||||||||||||||||||||
Walgreens | NR/Baa1/BBB | 14,820 | 14.2 | % | $ | 42.00 | $ | 622,440 | 25.1 | % | $ | 320 | 13.1 | % | 7/31/2085 | |||||||||||||||||||
Albertson’s | NR/NR/CCC+ | (3) | (3) | (3) | $ | 287,496 | 11.6 | % | NAV | NAV | 6/24/2033 | |||||||||||||||||||||||
US Bank | AA-/A1/A+ | (3) | (3) | (3) | $ | 210,437 | 8.5 | % | NAV | NAV | 12/31/2023 | |||||||||||||||||||||||
Dotty’s | NR/NR/NR | 4,004 | 3.8 | % | $ | 44.60 | $ | 178,578 | 7.2 | % | NAV | NAV | 9/30/2019 | |||||||||||||||||||||
Carl’s Jr | NR/NR/NR | 3,053 | 2.9 | % | $ | 57.32 | $ | 174,998 | 7.0 | % | NAV | NAV | 5/31/2030 | |||||||||||||||||||||
|
|
|
|
|
|
|
| |||||||||||||||||||||||||||
Total Major Tenants | 21,877 | 20.9 | % | $ | 44.61 | (3) | $ | 1,473,949 | 59.4 | % | ||||||||||||||||||||||||
Non-Major Tenants | 47,659 | 45.6 | % | $ | 19.20 | (3) | $ | 1,007,775 | 40.6 | % | ||||||||||||||||||||||||
|
|
|
|
|
|
|
| |||||||||||||||||||||||||||
Occupied Collateral Total | 69,536 | 66.6 | % | $ | 27.19 | (3) | $ | 2,481,724 | 100.0 | % | ||||||||||||||||||||||||
|
|
|
| |||||||||||||||||||||||||||||||
Vacant Space | 34,914 | 33.4 | % | |||||||||||||||||||||||||||||||
|
|
|
| |||||||||||||||||||||||||||||||
Collateral Total | 104,450 | 100.0 | % | |||||||||||||||||||||||||||||||
|
|
|
| |||||||||||||||||||||||||||||||
| (1) | Certain ratings are those of the parent company whether or not the parent guarantees the lease. |
| (2) | Sales PSF and Occupancy Cost are calculated based on trailing 12-month sales through December 2012. |
| (3) | Albertson’s, US Bank and KFC own their buildings and lease their pad sites, which have no attributed square footage. The Annual U/W Base Rent PSF for Total Major Tenants, Non-Major Tenants and Occupied Collateral Total exclude the Annual U/W Base Rent associated with these pad sites. |
THE INFORMATION IN THIS STRUCTURAL AND COLLATERAL TERM SHEET IS NOT COMPLETE AND MAY BE AMENDED PRIOR TO THE TIME OF SALE. THIS TERM SHEET IS NOT AN OFFER TO SELL THESE SECURITIES AND IT IS NOT A SOLICITATION OF AN OFFER TO BUY THESE SECURITIES IN ANY JURISDICTION WHERE THE OFFER OR SALE IS NOT PERMITTED.
73
BLUE DIAMOND RANCH
The following table presents certain information relating to the lease rollover schedule at the Blue Diamond Ranch Properties:
Lease Expiration Schedule(1)(2)
Year Ending December 31, | No. of Leases Expiring | Expiring NRSF(1) | % of Total NRSF | Cumulative of Total NRSF | Cumulative % of Total NRSF | Annual U/W Base Rent | Annual U/W Base Rent PSF(3) | |||||||||||||||||||||
MTM | 0 | 0 | 0.0 | % | 0 | 0.0 | % | $ | 0 | $ | 0.00 | |||||||||||||||||
2013 | 4 | 7,618 | 7.3 | % | 7,618 | 7.3 | % | $ | 191,817 | $ | 25.18 | |||||||||||||||||
2014 | 4 | 4,739 | 4.5 | % | 12,357 | 11.8 | % | $ | 102,651 | $ | 21.66 | |||||||||||||||||
2015 | 1 | 1,200 | 1.1 | % | 13,557 | 13.0 | % | $ | 32,820 | $ | 27.35 | |||||||||||||||||
2016 | 3 | 4,564 | 4.4 | % | 18,121 | 17.3 | % | $ | 125,181 | $ | 27.43 | |||||||||||||||||
2017 | 0 | 0 | 0.0 | % | 18,121 | 17.3 | % | $ | 0 | $ | 0.00 | |||||||||||||||||
2018 | 4 | 11,510 | 11.0 | % | 29,631 | 28.4 | % | $ | 241,166 | $ | 20.95 | |||||||||||||||||
2019 | 1 | 4,004 | 3.8 | % | 33,635 | 32.2 | % | $ | 178,578 | $ | 44.60 | |||||||||||||||||
2020 | 0 | 0 | 0.0 | % | 33,635 | 32.2 | % | $ | 0 | $ | 0.00 | |||||||||||||||||
2021 | 1 | 3,193 | 3.1 | % | 36,828 | 35.3 | % | $ | 67,053 | $ | 21.00 | |||||||||||||||||
2022 | 2 | 14,835 | 14.2 | % | 51,663 | 49.5 | % | $ | 154,237 | $ | 10.40 | |||||||||||||||||
2023 | 1 | 0 | (4) | 0.0 | % | 51,663 | 49.5 | % | $ | 210,437 | $ | 0.00 | (4) | |||||||||||||||
Thereafter | 4 | 17,873 | (4) | 17.1 | % | 69,536 | 66.6 | % | $ | 1,177,784 | $ | 44.62 | (4) | |||||||||||||||
Vacant | 0 | 34,914 | 33.4 | % | 104,450 | 100.0 | % | $ | 0 | $ | 0.00 | |||||||||||||||||
|
|
|
|
|
|
|
|
|
| |||||||||||||||||||
Total/Weighted Average | 25 | 104,450 | 100.0 | % | $ | 2,481,724 | $ | 27.19 | ||||||||||||||||||||
|
|
|
|
|
|
|
|
|
| |||||||||||||||||||
| (1) | Information was obtained from the underwritten rent roll. |
| (2) | Certain tenants may have lease termination options that are exercisable prior to the originally stated expiration date of the subject lease and that are not considered in the Lease Expiration Schedule. |
| (3) | Weighted Average Annual U/W Base Rent PSF excludes vacant space. |
| (4) | Albertson’s, US Bank and KFC own their own buildings and lease separate pad sites, which have no attributed square footage. The Weighted Average Annual U/W Base Rent PSF excludes the Annual U/W Base Rent associated with each pad site. |
The following table presents historical occupancy percentages at the Blue Diamond Ranch Properties:
Historical Occupancy(1)(2)
12/31/2010 | 12/31/2011 | 12/31/2012 | 3/11/2013 | |||
31.0% | 45.0% | 55.0% | 66.6% |
| (1) | Information obtained from the underwritten rent roll. |
| (2) | The low historical occupancy is primarily due to the Blue Diamond Ranch Properties being completed between 2008 and 2010. |
Operating History and Underwritten Net Cash Flow. The following table presents certain information relating to the historical operating performance and the Underwritten Net Cash Flow at the Blue Diamond Ranch Properties:
Cash Flow Analysis
| 2010 | 2011 | 2012 | U/W | U/W $ per SF | ||||||||||||||||
Base Rent | $ | 2,016,814 | $ | 4,028,818 | $ | 3,632,485 | $ | 2,481,724 | $ | 23.76 | ||||||||||
Grossed Up Vacant Space | 0 | 0 | 0 | 747,702 | 7.16 | |||||||||||||||
Total Reimbursables | 265,160 | 365,393 | 532,053 | 824,462 | 7.89 | |||||||||||||||
Other Income | 4,525 | 4,500 | 20,861 | 14,100 | 0.13 | |||||||||||||||
Less Vacancy & Credit Loss | (117,000 | ) | (1,388,506 | ) | (1,075,892 | ) | (938,586 | )(1) | (8.99 | ) | ||||||||||
|
|
|
|
|
|
|
|
|
| |||||||||||
Effective Gross Income | $ | 2,169,499 | $ | 3,010,205 | $ | 3,109,507 | $ | 3,129,402 | $ | 29.96 | ||||||||||
Total Operating Expenses | $ | 705,153 | $ | 763,881 | $ | 787,675 | $ | 839,599 | $ | 8.04 | ||||||||||
|
|
|
|
|
|
|
|
|
| |||||||||||
Net Operating Income | $ | 1,464,346 | $ | 2,246,324 | $ | 2,321,832 | $ | 2,289,803 | $ | 21.92 | ||||||||||
TI/LC | 0 | 0 | 0 | 82,906 | 0.79 | |||||||||||||||
Reserves for Replacements | 0 | 0 | 0 | 15,668 | 0.15 | |||||||||||||||
|
|
|
|
|
|
|
|
|
| |||||||||||
Net Cash Flow | $ | 1,464,346 | $ | 2,246,324 | $ | 2,321,832 | $ | 2,191,229 | $ | 20.98 | ||||||||||
NOI DSCR | 1.04x | 1.60x | 1.65x | 1.63x | ||||||||||||||||
NCF DSCR | 1.04x | 1.60x | 1.65x | 1.56x | ||||||||||||||||
NOI DY | 6.4 | % | 9.8 | % | 10.1 | % | 10.0 | % | ||||||||||||
NCF DY | 6.4 | % | 9.8 | % | 10.1 | % | 9.5 | % | ||||||||||||
| (1) | The underwritten economic vacancy is 23.1%. The Blue Diamond Ranch Properties were 66.6% physically occupied as of March 11, 2013. |
THE INFORMATION IN THIS STRUCTURAL AND COLLATERAL TERM SHEET IS NOT COMPLETE AND MAY BE AMENDED PRIOR TO THE TIME OF SALE. THIS TERM SHEET IS NOT AN OFFER TO SELL THESE SECURITIES AND IT IS NOT A SOLICITATION OF AN OFFER TO BUY THESE SECURITIES IN ANY JURISDICTION WHERE THE OFFER OR SALE IS NOT PERMITTED.
74
BLUE DIAMOND RANCH
Appraisal. As of the appraisal valuation date of January 17, 2013, the Blue Diamond Ranch Properties had an aggregate “as-is” appraised value of $38,570,000.
Environmental Matters. According to the Phase I environmental site assessments both dated January 29, 2013, there was no evidence of any recognized environmental conditions at either of the Blue Diamond Ranch Properties.
Market Overview and Competition. The Blue Diamond Ranch Properties are situated at the northeast and northwest corners of Blue Diamond Road and South Decatur Boulevard in Las Vegas, Nevada. In the immediate area, major north/south arterials include South Decatur Boulevard, South Rainbow Boulevard and South Durango Drive. Major east/west arterials include Blue Diamond Road (SR 160), West Warm Springs Road and Interstate-215 (Las Vegas Beltway). The Blue Diamond Ranch Properties are located approximately 12 miles southwest of the Las Vegas central business district and approximately seven miles southwest of the McCarran International Airport. According to a third party market research report, between 2010 and 2013 the population within a three-mile radius of the Blue Diamond Ranch Properties increased at an annual compound rate of 9.0%. Within a three- and five-mile radius of the Blue Diamond Ranch Properties, the 2013 estimated population was 75,521 and 251,666, respectively. The estimated 2013 average household income within a three-mile radius of the Blue Diamond Ranch Properties was approximately $58,452. The Blue Diamond Ranch Properties are situated within the Southwest submarket of the Las Vegas retail market. According to a third party market research report, the Southwest submarket, containing 6.1 million square feet inclusive of anchor and non-anchor, collectively, was 15.5% vacant with an average rental asking rate of $20.43 per square foot on a triple net basis as of the fourth quarter 2012.
The following table presents certain information relating to some comparable retail centers provided in the appraisal for the Blue Diamond Ranch Properties:
Competitive Set(1)
| Blue Diamond Ranch (Subject) | Blue Diamond Crossing | Southern Highlands Marketplace | 7320 & 7380 South Rainbow Road | Cimarron Square | ||||||
Location | Las Vegas, NV | Las Vegas, NV | Las Vegas, NV | Las Vegas, NV | Las Vegas, NV | |||||
Distance from Subject | — | 0.5 miles | 2.5 miles | 4.0 miles | 4.0 miles | |||||
Property Type | Retail | Retail | Retail | Retail | Retail | |||||
Year Built/Renovated | 2008-10/NAP | 2007/NAP | 2004/NAP | 2007/NAP | 2008/NAP | |||||
Anchors | Albertson’s, Walgreens | Target, Kohl’s, Office Depot, Big Lots, Petco | Smith’s Grocery, Walgreens | Albertson’s | NAP | |||||
Total GLA | 104,450 SF | 500,000 SF | 58,000 SF | 28,500 SF | 35,500 SF | |||||
Total Occupancy | 67% | 96% | 87% | 86% | 68% |
| (1) | Information obtained from the appraisal dated February 5, 2013. |
The Borrower. The borrower is Blue Diamond CP30 2013, LLC, a Delaware limited liability company and a single purpose entity with an independent director. Legal counsel to the borrower delivered a non-consolidation opinion in connection with the origination of the Blue Diamond Ranch Mortgage Loan. Garry Goett is the guarantor of certain nonrecourse carveouts under the Blue Diamond Ranch Mortgage Loan.
The Sponsor. The sponsor for the Blue Diamond Ranch Mortgage Loan is Garry Goett. Garry Goett is the founder of Olympia Companies (“Olympia”). Olympia’s subsidiaries and related entities actively engage in all phases of real estate development. Olympia’s current portfolio includes real estate projects in the Las Vegas area, such as the Southern Highlands master-planned community, Southern Highlands Golf Club, Southern Highlands Marketplace, the Casino Fandango and attached Galaxy theater, a 100-room Courtyard by Marriott hotel, digital and vinyl billboards and self storage facilities.
Escrows. The loan documents provide for upfront escrows at closing in the amount of $40,829 for real estate taxes and $5,127 for insurance. The loan documents provide for monthly deposits of $13,610 for real estate taxes, $5,127 for insurance, $1,306 for replacement reserves and $12,000 for tenant improvements and leasing commissions (subject to a cap of $288,000).
THE INFORMATION IN THIS STRUCTURAL AND COLLATERAL TERM SHEET IS NOT COMPLETE AND MAY BE AMENDED PRIOR TO THE TIME OF SALE. THIS TERM SHEET IS NOT AN OFFER TO SELL THESE SECURITIES AND IT IS NOT A SOLICITATION OF AN OFFER TO BUY THESE SECURITIES IN ANY JURISDICTION WHERE THE OFFER OR SALE IS NOT PERMITTED.
75
BLUE DIAMOND RANCH
Lockbox and Cash Management. The Blue Diamond Ranch Mortgage Loan requires a lender-controlled lockbox account, which is already in place, into which the borrower directs tenants to pay their rents directly. The loan documents also require that all rents and other monies received by the borrower be deposited into the lockbox account within three business days after receipt thereof. Prior to the occurrence of a Cash Management Period (as defined below), all funds on deposit in the lockbox account are swept into an account designated by the borrower on a daily basis; however the borrower has no right to make withdrawals from the lockbox account except as specified in the loan documents. Upon the occurrence of a Cash Management Period, all funds on deposit in the lockbox account are swept to a lender-controlled cash management account on a daily basis.
A “Cash Management Period” will commence upon the earlier of: (i) the occurrence and continuance of an event of default; (ii) the commencement of a DSCR Trigger Event (as defined below); or (iii) the occurrence of a Major Tenant Trigger Event (as defined below). A Cash Management Period will end either with respect to the matters described in clause (i) above, when such event of default has been cured; or with respect to matters described in clause (ii) above, upon the occurrence of a DSCR Trigger Event Cure (as defined below); or with respect to the matters described in clause (iii) above, upon the occurrence of a Major Tenant Trigger Event Cure (as defined below).
A “DSCR Trigger Event” shall mean that the debt service coverage ratio is less than 1.20x for two consecutive quarters; provided, however, that the borrower shall have the option to prepay a portion of the Blue Diamond Ranch Mortgage Loan during the yield maintenance period, subject to a prepayment premium and satisfaction of the other prepayment conditions set forth in the Blue Diamond Ranch Mortgage Loan agreement, by an amount sufficient to maintain a debt service coverage ratio of at least 1.20x and avoid a DSCR Trigger Event.
A “DSCR Trigger Event Cure” will occur upon the earlier of the following: (i) the debt service coverage ratio is equal to or greater than 1.30x for two consecutive quarters or (ii) the borrower prepays the Blue Diamond Ranch Mortgage Loan, subject to the satisfaction of any applicable prepayment conditions, by an amount sufficient to achieve a debt service coverage ratio of at least 1.30x.
A “Major Tenant Trigger Event” shall mean that any Major Tenant (as defined below) (i) is the subject of any bankruptcy proceedings (as outlined in the loan documents), (ii) has vacated all or substantially all of its space (with or without prior notice to the borrower or guarantor), or (iii) has provided notification of its intention to vacate its space.
A “Major Tenant Trigger Event Cure” will occur upon the earlier of the following (i) any bankruptcy proceeding of which such Major Tenant is the subject has been terminated with prejudice and the applicable lease has been affirmed or (ii) the borrower has entered into a new lease for the associated rentable space (a) with a new tenant acceptable to the lender, (b) the term of such lease is for no less than 10 years, (c) such lease is deemed a Major Lease (as defined in the loan documents), and (d) the new tenant has completed all improvements, is open for business and has commenced regular base rent payments.
A “Major Tenant” is defined as each of Albertson’s and Walgreens.
Property Management. The Blue Diamond Ranch Properties are managed by an affiliate of the borrower.
Assumption. The borrower has the right to transfer the Blue Diamond Ranch Properties subject to certain conditions set forth in the loan documents, including but not limited to (i) no event of default has occurred and is continuing; (ii) the proposed transferee, property manager and management agreement are satisfactory to the lender and applicable rating agencies; and (iii) unless the proposed transferee is a permitted affiliate transferee, the lender receives written confirmation from Fitch and Moody’s that the assumption will not result in a downgrade, qualification or withdrawal of the then current ratings assigned to any class of Series 2013-C13 Certificates.
Right of First Refusal.Walgreens and Carl’s Jr. each have the right of first refusal with 45 days notice that the landlord intends to sell only its respective parcel. If the landlord seeks to sell the entire property or more than the tenant parcel, then the tenant has no such right.
Partial Release. Not permitted.
Real Estate Substitution.Not permitted.
Subordinate and Mezzanine Indebtedness. Not permitted.
Ground Lease. None.
Terrorism Insurance. The loan documents require that the “all risk” insurance policy maintained by the borrower provide coverage for terrorism in an amount equal to the full replacement cost of the Blue Diamond Ranch Properties, as well as business interruption insurance covering no less than the 12-month period from the date of a casualty event.
THE INFORMATION IN THIS STRUCTURAL AND COLLATERAL TERM SHEET IS NOT COMPLETE AND MAY BE AMENDED PRIOR TO THE TIME OF SALE. THIS TERM SHEET IS NOT AN OFFER TO SELL THESE SECURITIES AND IT IS NOT A SOLICITATION OF AN OFFER TO BUY THESE SECURITIES IN ANY JURISDICTION WHERE THE OFFER OR SALE IS NOT PERMITTED.
76
[THIS PAGE INTENTIONALLY LEFT BLANK.]
77
BIMBO BAKERIES DISTRIBUTION CENTER

THE INFORMATION IN THIS STRUCTURAL AND COLLATERAL TERM SHEET IS NOT COMPLETE AND MAY BE AMENDED PRIOR TO THE TIME OF SALE. THIS TERM SHEET IS NOT AN OFFER TO SELL THESE SECURITIES AND IT IS NOT A SOLICITATION OF AN OFFER TO BUY THESE SECURITIES IN ANY JURISDICTION WHERE THE OFFER OR SALE IS NOT PERMITTED.
78
BIMBO BAKERIES DISTRIBUTION CENTER
THE INFORMATION IN THIS STRUCTURAL AND COLLATERAL TERM SHEET IS NOT COMPLETE AND MAY BE AMENDED PRIOR TO THE TIME OF SALE. THIS TERM SHEET IS NOT AN OFFER TO SELL THESE SECURITIES AND IT IS NOT A SOLICITATION OF AN OFFER TO BUY THESE SECURITIES IN ANY JURISDICTION WHERE THE OFFER OR SALE IS NOT PERMITTED.
79
No. 8 – Bimbo Bakeries Distribution Center
| Loan Information | ||
| Mortgage Loan Seller: | Wells Fargo Bank, National Association | |
| Credit Assessment | ||
| (Fitch/Moody’s): | NR/NR | |
| Original Principal Balance: | $22,500,000 | |
| Cut-off Date Principal | ||
| Balance: | $22,500,000 | |
| % of Initial Pool Balance: | 2.6% | |
| Loan Purpose: | Acquisition | |
| Borrower Name: | Morris Maspeth Associates, LLC | |
| Sponsors: | Robert Morris; Joseph Morris | |
| Mortgage Rate: | 3.840% | |
| Note Date: | April 1, 2013 | |
| Anticipated Repayment Date: | NAP | |
| Maturity Date: | April 1, 2023 | |
| IO Period: | 120 months | |
| Loan Term (Original): | 120 months | |
| Seasoning: | 1 month | |
| Amortization Term | ||
| (Original): | NAP | |
| Loan Amortization Type: | Interest-only, Balloon | |
| Interest Accrual Method: | Actual/360 | |
| Call Protection: | L(24),GRTR 1% or YM(92),O(4) | |
| Lockbox Type: | Springing (Without Established Account) | |
| Additional Debt: | None | |
| Additional Debt Type: | NAP | |
Escrows and Reserves(1): | ||
Type: | Initial | Monthly | Cap (If Any) | |||||
Taxes | $ | 0 | Springing | NAP | ||||
Insurance | $ | 0 | Springing | NAP | ||||
Replacement Reserves | $ | 0 | Springing | NAP | ||||
| Property Information | ||
| Single Asset/Portfolio: | Single Asset | |
| Property Type: | Industrial | |
| Specific Property Type: | Warehouse | |
| Location: | Maspeth, NY | |
| Size: | 56,966 SF | |
| Cut-off Date Principal | ||
| Balance Per Unit/SF: | $394.97 | |
| Year Built/Renovated: | 1941/2012 | |
| Title Vesting: | Fee | |
| Property Manager: | Tenant-managed | |
| 3rdMost Recent Occupancy (As of): | 100.0% (12/31/2010) | |
| 2ndMost Recent Occupancy (As of): | (2)(12/31/2011) | |
| Most Recent Occupancy (As of): | (2)(12/31/2012) | |
| Current Occupancy (As of): | 100.0% (5/1/2013) | |
| Underwriting and Financial Information: | ||
| 3rdMost Recent NOI(3): | NAV | |
| 2ndMost Recent NOI(3): | NAV | |
| Most Recent NOI(3): | NAV | |
| U/W Revenues: | $2,826,734 | |
| U/W Expenses: | $435,448 | |
| U/W NOI: | $2,391,286 | |
| U/W NCF: | $2,385,589 | |
| U/W NOI DSCR: | 2.73x | |
| U/W NCF DSCR: | 2.72x | |
| U/W NOI Debt Yield: | 10.6% | |
| U/W NCF Debt Yield: | 10.6% | |
| As-Is Appraised Value: | $39,000,000 | |
| As-Is Appraisal Valuation Date: | February 5, 2013 | |
| Cut-off Date LTV Ratio: | 57.7% | |
| LTV Ratio at Maturity or ARD: | 57.7% | |
| (1) | See “Escrows” section. |
| (2) | Bimbo Bakeries USA paid an $800,000 lease termination fee to YRC, the previous tenant of the Bimbo Bakeries Distribution Center Property, as well as their contract rent from August 2011, when they vacated, until February 2013, when Bimbo Bakeries USA’s current lease commenced. The building was vacant and undergoing extensive renovations from August 2011 through December 2012. |
| (3) | Historical financial information is not available as the borrower acquired the Bimbo Bakeries Distribution Center Property in February 2013. |
The Mortgage Loan. The mortgage loan (the “Bimbo Bakeries Distribution Center Mortgage Loan”) is evidenced by a single promissory note that is secured by a first mortgage encumbering a single tenant industrial warehouse building located in Maspeth, Queens County, New York (the “Bimbo Bakeries Distribution Center Property”). The Bimbo Bakeries Distribution Center Mortgage Loan was originated on April 1, 2013 by Wells Fargo Bank, National Association. The Bimbo Bakeries Distribution Center Mortgage Loan had an original principal balance of $22,500,000, has an outstanding principal balance as of the Cut-off Date of $22,500,000 and accrues interest at an interest rate of 3.840% per annum. The Bimbo Bakeries Distribution Center Mortgage Loan had an initial term of 120 months, has a remaining term of 119 months as of the Cut-off Date and requires payments of interest-only through the term of the loan. The Bimbo Bakeries Distribution Center Mortgage Loan matures on April 1, 2023.
Following the lockout period, the borrower has the right to prepay the Bimbo Bakeries Distribution Center Mortgage Loan in whole, but not in part, provided that the borrower pays the greater of a yield maintenance premium or a prepayment premium equal to 1.0% of the then outstanding principal balance. In addition, the Bimbo Bakeries Distribution Center Mortgage Loan is prepayable without penalty on or after January 1, 2023.
THE INFORMATION IN THIS STRUCTURAL AND COLLATERAL TERM SHEET IS NOT COMPLETE AND MAY BE AMENDED PRIOR TO THE TIME OF SALE. THIS TERM SHEET IS NOT AN OFFER TO SELL THESE SECURITIES AND IT IS NOT A SOLICITATION OF AN OFFER TO BUY THESE SECURITIES IN ANY JURISDICTION WHERE THE OFFER OR SALE IS NOT PERMITTED.
80
BIMBO BAKERIES DISTRIBUTION CENTER
Sources and Uses
| Sources | Uses | |||||||||||||||||
Original loan amount | $ | 22,500,000 | 55.8 | % | Purchase price | $ | 39,500,000 | 97.9 | % | |||||||||
Sponsor’s new cash contribution | 17,827,965 | 44.2 | Closing costs | 827,965 | 2.1 | |||||||||||||
|
|
|
|
|
|
|
| |||||||||||
Total Sources | $ | 40,327,965 | 100.0 | % | Total Uses | $ | 40,327,965 | 100.0 | % | |||||||||
|
|
|
|
|
|
|
| |||||||||||
The Property. The Bimbo Bakeries Distribution Center Property is a single tenant industrial warehouse building located in the Maspeth neighborhood of Queens County, New York and occupied by Bimbo (pronounced “Beem-bo”) Bakeries USA with a lease expiring February 29, 2028 with three 10-year extension options. Bimbo Bakeries USA is the nation’s largest baking company with brands including Bimbo, Entenmann’s, Sara Lee and Brownberry, amongst others. The Bimbo Bakeries Distribution Center Property is situated on a 7.35-acre parcel and contains approximately 56,966 square feet (approximately 38,964 square feet of warehouse space, 11,558 square feet of office space and 6,444 square feet of truck repair garage space). The warehouse space includes 64 delivery truck loading docks and nine tractor trailer truck loading docks. The Bimbo Bakeries Distribution Center Property was built in 1941 and was extensively renovated in 2012 at a reported cost of approximately $10.0 million, of which approximately $2.5 million was paid for by Bimbo Bakeries USA. According to the property condition report, only the foundation and steel frame superstructure were retained from the original building. The Bimbo Bakeries Distribution Center Property offers parking for 106 cars, 82 step vans and 10 tractor trailers. As of May 1, 2013, the Bimbo Bakeries Distribution Center Property was 100.0% occupied by Bimbo Bakeries USA.
The following table presents certain information relating to the tenant at the Bimbo Bakeries Distribution Center Property:
Major Tenant
| Annual U/W | % of Total | Lease | ||||||||||||||||||||||||
| Credit Rating | Tenant | % of | Base Rent | Annual | Annual U/W | Expiration | ||||||||||||||||||||
Tenant Name | (Fitch/Moody’s/S&P) | NRSF | NRSF | PSF | U/W Base Rent | Base Rent | Date | |||||||||||||||||||
Major Tenant | ||||||||||||||||||||||||||
Bimbo Bakeries USA | BBB/Baa2/BBB(1) | 56,966 | 100.0 | % | $ | 46.13 | (2) | $ | 2,627,998 | (2) | 100.0 | % | 2/29/2028 | (3) | ||||||||||||
|
|
|
|
|
|
|
| |||||||||||||||||||
Total Major Tenant | 56,966 | 100.0 | % | $ | 46.13 | $ | 2,627,998 | 100.0 | % | |||||||||||||||||
|
|
|
|
|
|
|
| |||||||||||||||||||
| (1) | Ratings shown represent Bimbo Bakeries USA’s parent company, Grupo Bimbo S.A.B. de C.V., which does not guarantee Bimbo Bakeries USA’s lease. |
| (2) | Annual U/W Base Rent PSF and Annual U/W Base Rent are based on the average contractual rent over the loan term. Bimbo Bakeries USA is currently paying an annual base rent of $2,420,087 ($42.48 per square foot) with 1.88% annual rent escalations. |
| (3) | Bimbo Bakeries USA has three 10-year extension options at fair market value. |
The following table presents certain information relating to the lease rollover schedule at the Bimbo Bakeries Distribution Center Property:
Lease Expiration Schedule(1)
| No. of | Cumulative | Annual | Annual | |||||||||||||||||||||||
| Leases | Expiring | % of Total | Cumulative | % of Total | U/W Base | U/W Base | ||||||||||||||||||||
Year Ending December 31, | Expiring | NRSF | NRSF | Expiring NRSF | NRSF | Rent | Rent PSF | |||||||||||||||||||
MTM | 0 | 0 | 0.0 | % | 0 | 0.0 | % | $ | 0 | $ | 0.00 | |||||||||||||||
2013 | 0 | 0 | 0.0 | % | 0 | 0.0 | % | $ | 0 | $ | 0.00 | |||||||||||||||
2014 | 0 | 0 | 0.0 | % | 0 | 0.0 | % | $ | 0 | $ | 0.00 | |||||||||||||||
2015 | 0 | 0 | 0.0 | % | 0 | 0.0 | % | $ | 0 | $ | 0.00 | |||||||||||||||
2016 | 0 | 0 | 0.0 | % | 0 | 0.0 | % | $ | 0 | $ | 0.00 | |||||||||||||||
2017 | 0 | 0 | 0.0 | % | 0 | 0.0 | % | $ | 0 | $ | 0.00 | |||||||||||||||
2018 | 0 | 0 | 0.0 | % | 0 | 0.0 | % | $ | 0 | $ | 0.00 | |||||||||||||||
2019 | 0 | 0 | 0.0 | % | 0 | 0.0 | % | $ | 0 | $ | 0.00 | |||||||||||||||
2020 | 0 | 0 | 0.0 | % | 0 | 0.0 | % | $ | 0 | $ | 0.00 | |||||||||||||||
2021 | 0 | 0 | 0.0 | % | 0 | 0.0 | % | $ | 0 | $ | 0.00 | |||||||||||||||
2022 | 0 | 0 | 0.0 | % | 0 | 0.0 | % | $ | 0 | $ | 0.00 | |||||||||||||||
2023 | 0 | 0 | 0.0 | % | 0 | 0.0 | % | $ | 0 | $ | 0.00 | |||||||||||||||
Thereafter | 1 | 56,966 | 100.0 | % | 56,966 | 100.0 | % | $ | 2,627,998 | $ | 46.13 | |||||||||||||||
Vacant | 0 | 0 | 0.0 | % | 56,966 | 100.0 | % | $ | 0 | $ | 0.00 | |||||||||||||||
|
|
|
|
|
|
|
|
|
|
|
|
| ||||||||||||||
Total/Weighted Average | 1 | 56,966 | 100.0 | % | $ | 2,627,998 | $ | 46.13 | ||||||||||||||||||
|
|
|
|
|
|
|
|
|
|
|
|
| ||||||||||||||
| (1) | Information obtained from the underwritten rent roll. |
THE INFORMATION IN THIS STRUCTURAL AND COLLATERAL TERM SHEET IS NOT COMPLETE AND MAY BE AMENDED PRIOR TO THE TIME OF SALE. THIS TERM SHEET IS NOT AN OFFER TO SELL THESE SECURITIES AND IT IS NOT A SOLICITATION OF AN OFFER TO BUY THESE SECURITIES IN ANY JURISDICTION WHERE THE OFFER OR SALE IS NOT PERMITTED.
81
BIMBO BAKERIES DISTRIBUTION CENTER
The following table presents historical occupancy percentages at the Bimbo Bakeries Distribution Center Property:
Historical Occupancy Percentages
12/31/2010 | 12/31/2011 | 12/31/2012 | 5/1/2013 | |||
100.0% | (1) | (1) | 100.0% |
| (1) | Bimbo Bakeries USA paid an $800,000 lease termination fee to YRC, the previous tenant of the Bimbo Bakeries Distribution Center Property, as well as their contract rent from August 2011, when they vacated, until February 2013, when Bimbo Bakeries USA’s current lease commenced. The building was vacant and undergoing extensive renovations from August 2011 through December 2012. |
Operating History and Underwritten Net Cash Flow.The following table presents certain information relating to the Underwritten Net Cash Flow at the Bimbo Bakeries Distribution Center Property:
Cash Flow Analysis(1)
| U/W | U/W $ per SF | |||||||
Base Rent | $ | 2,627,998 | $ | 46.13 | ||||
Grossed Up Vacant Space | 0 | 0.00 | ||||||
Total Reimbursables | 332,763 | 5.84 | ||||||
Other Income | 0 | 0.00 | ||||||
Less Vacancy & Credit Loss | (134,028 | )(2) | (2.35 | ) | ||||
|
|
|
| |||||
Effective Gross Income | $ | 2,826,734 | $ | 49.62 | ||||
Total Operating Expenses | $ | 435,448 | $ | 7.64 | ||||
|
|
|
| |||||
Net Operating Income | $ | 2,391,286 | $ | 41.98 | ||||
TI/LC | 0 | 0.00 | ||||||
Capital Expenditures | 5,697 | 0.10 | ||||||
|
|
|
| |||||
Net Cash Flow | $ | 2,385,589 | $ | 41.88 | ||||
NOI DSCR | 2.73x | |||||||
NCF DSCR | 2.72x | |||||||
NOI DY | 10.6 | % | ||||||
NCF DY | 10.6 | % | ||||||
| (1) | Historical financials are not available as the borrower acquired the Bimbo Bakeries Distribution Center Property in February 2013. |
| (2) | The underwritten economic vacancy is 5.1%. The Bimbo Bakeries Distribution Center Property is 100.0% physically occupied as of May 1, 2013. |
Appraisal.As of the appraisal valuation date of February 5, 2013, the Bimbo Bakeries Distribution Center Property had an “as-is” appraised value of $39,000,000. The appraisal also concluded to “go dark” and land values of $24,000,000 and $25,600,000, respectively.
Environmental Matters.According to the Phase I environmental assessment dated January 11, 2013, there was no evidence of any recognized environmental conditions at the Bimbo Bakeries Distribution Center Property.
Market Overview and Competition.The Bimbo Bakeries Distribution Center Property is situated on the southeast corner of the intersection of Maspeth Avenue and Page Place in the Maspeth neighborhood of Queens County, New York, approximately four miles southeast of Manhattan and approximately six miles southwest of LaGuardia Airport. The Maspeth neighborhood of Queens County is an attractive location for distribution facilities due to its centralized access to New York City and efficient distribution routes. National distribution tenants in the immediate area include UPS, FedEx, Coca-Cola, Frito Lay and Restaurant Depot. Primary access to the area is provided by the Brooklyn-Queens Expressway (Interstate 278) and the Long Island Expressway (Interstate 495). The area is also served by Metropolitan Transportation Authority subway lines and buses, and the nearest subway entrance (serving the L and M lines) is located approximately one mile south of the Bimbo Bakeries Distribution Center Property.
According to the appraisal, the Bimbo Bakeries Distribution Center Property is located within the Central Queens submarket, which has an estimated inventory of 612 industrial buildings totaling approximately 19.7 million square feet. As of the fourth quarter of 2012, the submarket vacancy was 5.3% with only 6,000 square feet under construction. The appraiser concluded to a market rent of $35.00 per square foot with 3.0% annual escalations, on a triple net basis, for the Bimbo Bakeries Distribution Center Property. Bimbo Bakeries USA’s lease is structured with below-market annual escalations of 1.88%.
THE INFORMATION IN THIS STRUCTURAL AND COLLATERAL TERM SHEET IS NOT COMPLETE AND MAY BE AMENDED PRIOR TO THE TIME OF SALE. THIS TERM SHEET IS NOT AN OFFER TO SELL THESE SECURITIES AND IT IS NOT A SOLICITATION OF AN OFFER TO BUY THESE SECURITIES IN ANY JURISDICTION WHERE THE OFFER OR SALE IS NOT PERMITTED.
82
BIMBO BAKERIES DISTRIBUTION CENTER
The following table presents certain information relating to comparable industrial properties for the Bimbo Bakeries Distribution Center Property:
Competitive Set(1)
| Bimbo Bakeries | ||||||||||||
| Distribution | 271 | 448-466 | ||||||||||
| Center | 58-60 | 1313 Grand | 46-60 55th | Norman | Kingsland | |||||||
| (Subject) | Page Place | Street | Avenue | Avenue | Avenue | |||||||
Location | Maspeth, NY | Maspeth, NY | Brooklyn, NY | Maspeth, NY | Brooklyn, NY | Brooklyn, NY | ||||||
Distance from Subject | — | 0.2 mile | 0.5 mile | 0.9 mile | 2.2 miles | 2.5 miles | ||||||
Property Type | Industrial | Industrial | Industrial | Industrial | Industrial | Industrial | ||||||
Year Built/Renovated | 1941/2012 | 1962/NAP | 1959/NAP | 1964/NAP | 1931/NAP | 1931/NAP | ||||||
Total GLA | 56,966 SF | 30,215 SF | 46,588 SF | 24,744 SF | 13,000 SF | 31,684 SF | ||||||
Total Occupancy | 100% | 100% | 100% | 100% | 100% | 100% |
| (1) | Information obtained from the appraisal dated February 14, 2013. |
The Borrower.The borrower is Morris Maspeth Associates, LLC, a Delaware limited liability company and a single purpose entity. Robert Morris and Joseph Morris, the loan sponsors, are the guarantors of certain nonrecourse carveouts under the Bimbo Bakeries Distribution Center Mortgage Loan.
The Sponsor.The loan sponsors are Robert Morris (President and CEO of The Morris Companies) and Joseph Morris (Chairman of The Morris Companies). Founded in 1971, The Morris Companies is a full-service real estate organization that handles all aspects of the real estate development process as well as daily property management needs. As of April 2013, The Morris Companies’ industrial portfolio consisted of nine properties in the northeastern region of the United States totaling approximately 3.4 million square feet. Various affiliates of The Morris Companies have been involved in commercial projects that have resulted in loan defaults and lender foreclosure actions. See “Description of the Mortgage Pool – Default History, Bankruptcy Issues and Other Proceedings” in the Free Writing Prospectus.
Escrows.Ongoing monthly reserves for real estate taxes are not required as long as no event of default has occurred and is continuing and the borrower provides satisfactory evidence of full and timely payment of real estate taxes. Ongoing monthly reserves for insurance are not required as long as no event of default has occurred and is continuing and the borrower provides satisfactory evidence that the Bimbo Bakeries Distribution Center Property is insured in accordance with the loan documents. Ongoing monthly replacement reserves are not required as long as no event of default has occurred and is continuing.
Lockbox and Cash Management.Upon the occurrence of a Cash Trap Event Period (as defined below), the borrower is required to establish a lender-controlled lockbox account and direct the tenant to pay its rent directly to such lockbox account. During a Cash Trap Event Period, all funds on deposit in the lockbox account are swept to a lender-controlled cash management account on a periodic basis.
A “Cash Trap Event Period” will commence upon the earlier of (i) the occurrence and continuance of an event of default; (ii) Bimbo Bakeries USA or its parent company filing for bankruptcy, having an involuntary bankruptcy proceeding filed against them or becoming insolvent; and (iii) commencing April 1, 2021, and only if Bimbo Bakeries USA’s parent company’s long-term unsecured debt rating falls below ‘BB+’ by S&P, Bimbo Bakeries USA going dark at the Bimbo Bakeries Distribution Center Property. A Cash Trap Event Period will end, with regard to the circumstances in clause (i), upon the cure of such event of default; with regard to the circumstances in clause (ii), (a) at the time a plan of reorganization has been provided and Bimbo Bakeries USA is fully performing under its lease obligations or (b) the date on which an acceptable replacement tenant has signed a lease, is in occupancy and has commenced paying unabated rent and all tenant improvements required under such replacement lease have been satisfactorily completed; and with regard to the circumstances in clause (iii), (x) Bimbo Bakeries USA resuming operations at the Bimbo Bakeries Distribution Center Property for a period of 60 days or (y) the circumstances outlined in clause (b).
Property Management.The Bimbo Bakeries Distribution Center Property is managed by the tenant.
Assumption.The borrower has a two-time right to transfer the Bimbo Bakeries Distribution Center Property, provided that no event of default has occurred and is continuing and certain other conditions are satisfied, including (i) the lender’s reasonable determination that the proposed transferee and guarantor satisfy the lender’s credit review and underwriting standards, taking into consideration transferee experience, financial strength and general business standing; (ii) execution of a recourse guaranty and an environmental indemnity by an affiliate of the transferee; and (iii) if requested by the lender, rating agency confirmation from Fitch and Moody’s that the transfer will not result in a downgrade, withdrawal or qualification of the respective ratings assigned to the Series 2013-C13 Certificates.
Partial Release.Not permitted.
Real Estate Substitution.Not permitted.
Subordinate and Mezzanine Indebtedness.Not permitted.
Ground Lease. None.
THE INFORMATION IN THIS STRUCTURAL AND COLLATERAL TERM SHEET IS NOT COMPLETE AND MAY BE AMENDED PRIOR TO THE TIME OF SALE. THIS TERM SHEET IS NOT AN OFFER TO SELL THESE SECURITIES AND IT IS NOT A SOLICITATION OF AN OFFER TO BUY THESE SECURITIES IN ANY JURISDICTION WHERE THE OFFER OR SALE IS NOT PERMITTED.
83
BIMBO BAKERIES DISTRIBUTION CENTER
Terrorism Insurance.The loan documents require that the “all risk” insurance policy required to be maintained by the borrower provide coverage for terrorism in an amount equal to the full replacement cost of the Bimbo Bakeries Distribution Center Property. The loan documents also require business interruption insurance covering no less than the 12-month period following the occurrence of a casualty event, together with a six-month extended period of indemnity.
THE INFORMATION IN THIS STRUCTURAL AND COLLATERAL TERM SHEET IS NOT COMPLETE AND MAY BE AMENDED PRIOR TO THE TIME OF SALE. THIS TERM SHEET IS NOT AN OFFER TO SELL THESE SECURITIES AND IT IS NOT A SOLICITATION OF AN OFFER TO BUY THESE SECURITIES IN ANY JURISDICTION WHERE THE OFFER OR SALE IS NOT PERMITTED.
84
[THIS PAGE INTENTIONALLY LEFT BLANK.]
85
HAMPTON INN & SUITES – BEALE STREET

THE INFORMATION IN THIS STRUCTURAL AND COLLATERAL TERM SHEET IS NOT COMPLETE AND MAY BE AMENDED PRIOR TO THE TIME OF SALE. THIS TERM SHEET IS NOT AN OFFER TO SELL THESE SECURITIES AND IT IS NOT A SOLICITATION OF AN OFFER TO BUY THESE SECURITIES IN ANY JURISDICTION WHERE THE OFFER OR SALE IS NOT PERMITTED.
86
HAMPTON INN & SUITES – BEALE STREET

THE INFORMATION IN THIS STRUCTURAL AND COLLATERAL TERM SHEET IS NOT COMPLETE AND MAY BE AMENDED PRIOR TO THE TIME OF SALE. THIS TERM SHEET IS NOT AN OFFER TO SELL THESE SECURITIES AND IT IS NOT A SOLICITATION OF AN OFFER TO BUY THESE SECURITIES IN ANY JURISDICTION WHERE THE OFFER OR SALE IS NOT PERMITTED.
87
No. 9 – Hampton Inn & Suites – Beale Street
| Loan Information | ||
| Mortgage Loan Seller: | Wells Fargo Bank, National Association | |
| Credit Assessment | ||
| (Fitch/Moody’s): | NR/NR | |
| Original Principal Balance: | $22,500,000 | |
| Cut-off Date Principal Balance: | $22,415,761 | |
| % of Initial Pool Balance: | 2.6% | |
| Loan Purpose: | Acquisition | |
| Borrower Name: | CWI Beale Street Hotel, LLC | |
| Sponsor: | Carey Watermark Investors | |
| Incorporated | ||
| Mortgage Rate: | 4.070% | |
| Note Date: | February 14, 2013 | |
| Anticipated Repayment Date: | NAP | |
| Maturity Date: | March 1, 2018 | |
| IO Period: | None | |
| Loan Term (Original): | 60 months | |
| Seasoning: | 2 months | |
| Amortization Term (Original): | 300 months | |
| Loan Amortization Type: | Amortizing Balloon | |
| Interest Accrual Method: | Actual/360 | |
| Call Protection: | L(26),D(30),O(4) | |
| Lockbox Type: | Soft/Springing Cash Management | |
| Additional Debt: | None | |
| Additional Debt Type: | NAP | |
| Escrows and Reserves(1): | ||
Type: | Initial | Monthly | Cap (If Any) | |||||||
Taxes | $ | 26,817 | $ | 4,787 | NAP | |||||
Insurance | $ | 0 | Springing | NAP | ||||||
FF&E | $ | 0 | $ | 23,106 | NAP | |||||
PIP Reserve | $ | 1,074,629 | $ | 0 | NAP | |||||
| Property Information | ||
| Single Asset/Portfolio: | Single Asset | |
| Property Type: | Hospitality | |
| Specific Property Type: | Limited Service | |
| Location: | Memphis, TN | |
| Size: | 144 rooms | |
| Cut-off Date Principal | ||
| Balance Per Room: | $155,665 | |
| Year Built/Renovated: | 2000/2011 | |
| Title Vesting(2): | Various | |
| Property Manager: | Crescent Hotels & Resorts, LLC | |
| 3rdMost Recent Occupancy (As of): | 71.4% (12/31/2009) | |
| 2ndMost Recent Occupancy (As of): | 72.4% (12/31/2010) | |
| Most Recent Occupancy (As of): | 76.2% (12/31/2011) | |
| Current Occupancy (As of): | 80.7% (12/31/2012) | |
| Underwriting and Financial Information: | ||
| 3rdMost Recent NOI (As of): | $2,345,925 (12/31/2010) | |
| 2ndMost Recent NOI (As of): | $2,479,168 (12/31/2011) | |
| Most Recent NOI (As of): | $3,128,035 (12/31/2012) | |
| U/W Revenues: | $6,931,852 | |
| U/W Expenses: | $4,097,859 | |
| U/W NOI: | $2,833,993 | |
| U/W NCF: | $2,556,719 | |
| U/W NOI DSCR: | 1.97x | |
| U/W NCF DSCR: | 1.78x | |
| U/W NOI Debt Yield: | 12.6% | |
| U/W NCF Debt Yield: | 11.4% | |
| As-Is Appraised Value: | $33,025,000 | |
| As-Is Appraisal Valuation Date: | January 23, 2013 | |
| Cut-off Date LTV Ratio: | 67.9% | |
| LTV Ratio at Maturity or ARD: | 59.6% | |
| (1) | See “Escrows” section. |
| (2) | The Hampton Inn & Suites – Beale Street Mortgage Loan is secured by (i) a fee interest in the hotel portion of the Hampton Inn & Suites – Beale Street Property and (ii) a leasehold interest in 60 parking spaces at a neighboring parking garage which is leased by the borrower for the use of hotel guests (see “Ground Lease” section). |
The Mortgage Loan. The mortgage loan (the “Hampton Inn & Suites – Beale Street Mortgage Loan”) is evidenced by a single promissory note that is secured by a first mortgage encumbering a seven-story limited service hotel located in Memphis, Tennessee (the “Hampton Inn & Suites – Beale Street Property”). The Hampton Inn & Suites – Beale Street Mortgage Loan was originated on February 14, 2013 by Wells Fargo Bank, National Association. The Hampton Inn & Suites – Beale Street Mortgage Loan had an original balance of $22,500,000, has an outstanding balance as of the Cut-off Date of $22,415,761 and accrues interest at an interest rate of 4.070% per annum. The Hampton Inn & Suites – Beale Street Mortgage Loan had an initial term of 60 months, has a remaining term of 58 months as of the Cut-off Date and requires payments of principal and interest based on a 25-year amortization schedule. The Hampton Inn & Suites – Beale Street Mortgage Loan matures on March 1, 2018.
Following the lockout period, the borrower has the right to defease the Hampton Inn & Suites – Beale Street Mortgage Loan in whole, but not in part, on any due date before December 1, 2017. In addition, the Hampton Inn & Suites – Beale Street Mortgage Loan is prepayable without penalty on or after December 1, 2017.
THE INFORMATION IN THIS STRUCTURAL AND COLLATERAL TERM SHEET IS NOT COMPLETE AND MAY BE AMENDED PRIOR TO THE TIME OF SALE. THIS TERM SHEET IS NOT AN OFFER TO SELL THESE SECURITIES AND IT IS NOT A SOLICITATION OF AN OFFER TO BUY THESE SECURITIES IN ANY JURISDICTION WHERE THE OFFER OR SALE IS NOT PERMITTED.
88
HAMPTON INN & SUITES – BEALE STREET
Sources and Uses
Sources | Uses | |||||||||||||||||
Original loan amount | $ | 22,500,000 | 70.2 | % | Purchase price(1) | $ | 30,000,000 | 93.6 | % | |||||||||
Sponsor’s new cash contribution | 9,545,703 | 29.8 | Reserves | 1,101,446 | 3.4 | |||||||||||||
| Closing costs | 944,257 | 2.9 | ||||||||||||||||
|
|
|
|
|
|
|
| |||||||||||
Total Sources | $ | 32,045,703 | 100.0 | % | Total Uses | $ | 32,045,703 | 100.0 | % | |||||||||
|
|
|
|
|
|
|
| |||||||||||
| (1) | This purchase price represents an allocated purchase price of a five hotel portfolio. |
The Property.The Hampton Inn & Suites – Beale Street Property is a seven-story limited service hotel which was built in 2000 and renovated in 2011 and is located in Memphis, Tennessee. Amenities at the Hampton Inn & Suites – Beale Street Property include an indoor pool and hot tub, exercise room, business center, guest laundry facilities, convenience shop and complimentary breakfast. The Hampton Inn & Suites – Beale Street Property offers 144 guest rooms, including 70 double guest rooms, 41 king guest rooms, 29 king suites and four handicap accessible guest rooms. There is no on-site parking at the Hampton Inn & Suites – Beale Street Property, but the borrower leases 60 parking spaces at a neighboring parking garage for use by hotel guests. As part of its recent acquisition of the Hampton Inn & Suites – Beale Street Property, the borrower will implement a property improvement plan, expected to be completed by October 2013, which will include updates to the guest rooms (new carpeting, sleeper sofas, mattresses and draperies), renovations to public restrooms, updates to the exterior of the building and new carpet for the meeting rooms. The franchise agreement with Hampton Inn expires on February 29, 2028.
Operating History and Underwritten Net Cash Flow.The following table represents certain information relating to the historical operating performance and the Underwritten Net Cash Flow at the Hampton Inn & Suites – Beale Street Property:
Cash Flow Analysis
| 2010 | 2011 | 2012 | U/W | U/W $ per Room | ||||||||||||||||
Occupancy | 72.4 | % | 76.2 | % | 80.7 | % | 75.0 | % | ||||||||||||
ADR | $ | 151.67 | $ | 153.61 | $ | 158.59 | $ | 165.00 | ||||||||||||
RevPAR | $ | 109.74 | $ | 116.01 | $ | 127.91 | $ | 123.75 | ||||||||||||
Total Revenue | $ | 6,204,401 | $ | 6,531,351 | $ | 7,169,522 | $ | 6,931,852 | $ | 48,138 | ||||||||||
Total Department Expenses | 1,621,984 | 1,753,868 | 1,810,518 | 1,751,392 | 12,162 | |||||||||||||||
|
|
|
|
|
|
|
|
|
| |||||||||||
Gross Operating Profit | $ | 4,582,417 | $ | 4,777,483 | $ | 5,359,004 | $ | 5,180,460 | $ | 35,975 | ||||||||||
Total Undistributed Expenses | 2,129,938 | 2,215,896 | 2,147,861 | 2,261,295 | 15,703 | |||||||||||||||
|
|
|
|
|
|
|
|
|
| |||||||||||
Profit Before Fixed Charges | $ | 2,452,479 | $ | 2,561,587 | $ | 3,211,143 | $ | 2,919,166 | $ | 20,272 | ||||||||||
Total Fixed Charges | 106,554 | 82,419 | 83,108 | 85,173 | (1) | 591 | ||||||||||||||
|
|
|
|
|
|
|
|
|
| |||||||||||
Net Operating Income | $ | 2,345,925 | $ | 2,479,168 | $ | 3,128,035 | $ | 2,833,993 | $ | 19,681 | ||||||||||
FF&E | 243,748 | 261,254 | 0 | 277,274 | 1,926 | |||||||||||||||
|
|
|
|
|
|
|
|
|
| |||||||||||
Net Cash Flow | $ | 2,102,177 | $ | 2,217,914 | $ | 3,128,035 | $ | 2,556,719 | $ | 17,755 | ||||||||||
NOI DSCR | 1.63x | 1.73x | 2.18x | 1.97x | ||||||||||||||||
NCF DSCR | 1.46x | 1.54x | 2.18x | 1.78x | ||||||||||||||||
NOI DY | 10.5 | % | 11.1 | % | 14.0 | % | 12.6 | % | ||||||||||||
NCF DY | 9.4 | % | 9.9 | % | 14.0 | % | 11.4 | % | ||||||||||||
| (1) | Real estate taxes were underwritten based on Payment in Lieu of Taxes (PILOT) provisions under which the borrower pays reduced city and county taxes through 2038. |
Appraisal.As of the appraisal valuation date of January 23, 2013, the Hampton Inn & Suites – Beale Street Property had an “as-is” appraised value of $33,025,000.
Environmental Matters.According to the Phase I environmental assessment dated January 2013, there was no evidence of any recognized environmental conditions at the Hampton Inn & Suites – Beale Street Property.
Market Overview and Competition.The Hampton Inn & Suites – Beale Street Property is situated on the southwest corner of the intersection of Peabody Place and South 3rd Street, approximately one block north of the Beale Street entertainment corridor, in the central business district of Memphis, Tennessee. The Hampton Inn & Suites – Beale Street Property is located approximately 13 miles northwest of the Memphis International Airport and is in close proximity to the Memphis Cook Convention Center, FedExForum (home of the Memphis Grizzlies NBA basketball team) and AutoZone Park (home of the Memphis Redbirds AAA baseball team). Primary access to the neighborhood is provided by Interstate 240 from the north and south and by Interstate 40 and Interstate 55 from the west.
THE INFORMATION IN THIS STRUCTURAL AND COLLATERAL TERM SHEET IS NOT COMPLETE AND MAY BE AMENDED PRIOR TO THE TIME OF SALE. THIS TERM SHEET IS NOT AN OFFER TO SELL THESE SECURITIES AND IT IS NOT A SOLICITATION OF AN OFFER TO BUY THESE SECURITIES IN ANY JURISDICTION WHERE THE OFFER OR SALE IS NOT PERMITTED.
89
HAMPTON INN & SUITES – BEALE STREET
The following table presents certain information relating to the Hampton Inn & Suites – Beale Street Property’s competitive set:
Subject and Market Historical Occupancy, ADR and RevPAR(1)
| Hampton Inn & Suites – Beale | ||||||||||||||||||||||||||||||||||||
| Competitive Set | Street | Penetration Factor | ||||||||||||||||||||||||||||||||||
Year | Occupancy | ADR | RevPAR | Occupancy | ADR | RevPAR | Occupancy | ADR | RevPAR | |||||||||||||||||||||||||||
1/31/2013 TTM | 71.8 | % | $ | 131.45 | $ | 94.33 | 81.1 | % | $ | 158.92 | $ | 128.92 | 113.1 | % | 120.9 | % | 136.7 | % | ||||||||||||||||||
1/31/2012 TTM | 66.9 | % | $ | 126.91 | $ | 84.92 | 76.2 | % | $ | 153.78 | $ | 117.21 | 113.9 | % | 121.2 | % | 138.0 | % | ||||||||||||||||||
1/31/2011 TTM | 64.2 | % | $ | 126.17 | $ | 81.00 | 72.0 | % | $ | 150.47 | $ | 108.32 | 112.1 | % | 119.3 | % | 133.7 | % | ||||||||||||||||||
| (1) | Information obtained from a third party hospitality research report dated February 20, 2013. |
The Borrower.The borrower is CWI Beale Street Hotel, LLC, a Delaware limited liability company and a single purpose entity with an independent director. Legal counsel to the borrower delivered a non-consolidation opinion in connection with the origination of the Hampton Inn & Suites – Beale Street Mortgage Loan. Carey Watermark Investors Incorporated, the loan sponsor, is the guarantor of certain nonrecourse carveouts under the Hampton Inn & Suites – Beale Street Mortgage Loan.
The Sponsor.The sponsor is Carey Watermark Investors Incorporated (“CWI”), a private non-traded hospitality REIT. CWI acts as a capital provider to the lodging industry and targets lodging assets with broken capital structures, undercapitalized property owners and undervalued assets. As of March 2013, CWI’s portfolio consisted of 13 limited service and full service hotels with over 2,500 rooms.
Escrows.The loan documents provide for upfront reserves in the amount of $26,817 for real estate taxes and $1,074,629 for a property improvement plan. The loan documents also provide for ongoing monthly reserves in the amount of $4,787 for real estate taxes and an ongoing monthly FF&E reserve equal to 4.0% of operating income for the most recent calendar month (initially estimated to be $23,106). Ongoing monthly reserves for insurance are not required as long as no event of default exists and is continuing and the borrower provides the lender with satisfactory evidence that the Hampton Inn & Suites – Beale Street Property is insured in accordance with the loan documents.
Lockbox and Cash Management.The Hampton Inn & Suites – Beale Street Mortgage Loan requires a lender-controlled lockbox account, which is already in place, and that the borrower directs the manager to deliver all receipts payable with respect to the Hampton Inn & Suites – Beale Street Property directly into the lockbox account. The loan documents also require that all revenues received by the borrower or the property manager be deposited into the lockbox account within two business days of receipt. Other than during a Cash Trap Event Period (as defined below), all excess funds on deposit are disbursed to the borrower.
A “Cash Trap Event Period” will commence upon the earlier of (i) the occurrence and continuance of an event of default or (ii) the debt service coverage ratio falling below 1.25x at the end of any calendar quarter, commencing December 31, 2013. A Cash Trap Event Period will expire, with regard to the circumstances in clause (i), upon the cure of such event of default, or with regard to the circumstances in clause (ii), upon the date that the debt service coverage ratio is equal to or greater than 1.35x for two consecutive calendar quarters.
Property Management.The Hampton Inn & Suites – Beale Street Property is managed by Crescent Hotels & Resorts, LLC.
Assumption.The borrower has a two-time right to transfer the Hampton Inn & Suites – Beale Street Property, provided that no event of default has occurred and is continuing and certain other conditions are satisfied, including (i) the lender’s reasonable determination that the proposed transferee and guarantor satisfy the lender’s credit review and underwriting standards, taking into consideration transferee experience, financial strength and general business standing; (ii) execution of a recourse guaranty and an environmental indemnity by an affiliate of the transferee; and (iii) if requested by the lender, rating agency confirmation from Fitch and Moody’s that the transfer will not result in a downgrade, withdrawal or qualification of the respective ratings assigned to the Series 2013-C13 Certificates.
Partial Release.Not permitted.
Real Estate Substitution.Not permitted.
Subordinate and Mezzanine Indebtedness.Not permitted.
Ground Lease.The borrower leases 60 parking spaces for the use of hotel guests at a neighboring parking garage subject to a ground lease with an initial expiration date of February 1, 2035 and one 15-year extension option.
Terrorism Insurance.The loan documents require that the “all risk” insurance policy required to be maintained by the borrower provide coverage for terrorism in an amount equal to the full replacement cost of the Hampton Inn & Suites – Beale Street Property, as well as business interruption insurance covering no less than the 12-month period following the occurrence of a casualty event, together with a six-month extended period of indemnity.
THE INFORMATION IN THIS STRUCTURAL AND COLLATERAL TERM SHEET IS NOT COMPLETE AND MAY BE AMENDED PRIOR TO THE TIME OF SALE. THIS TERM SHEET IS NOT AN OFFER TO SELL THESE SECURITIES AND IT IS NOT A SOLICITATION OF AN OFFER TO BUY THESE SECURITIES IN ANY JURISDICTION WHERE THE OFFER OR SALE IS NOT PERMITTED.
90
[THIS PAGE INTENTIONALLY LEFT BLANK.]
91
| SOUTHPORT COMMONS |
THE INFORMATION IN THIS STRUCTURAL AND COLLATERAL TERM SHEET IS NOT COMPLETE AND MAY BE AMENDED PRIOR TO THE TIME OF SALE. THIS TERM SHEET IS NOT AN OFFER TO SELL THESE SECURITIES AND IT IS NOT A SOLICITATION OF AN OFFER TO BUY THESE SECURITIES IN ANY JURISDICTION WHERE THE OFFER OR SALE IS NOT PERMITTED.
92
| SOUTHPORT COMMONS |

THE INFORMATION IN THIS STRUCTURAL AND COLLATERAL TERM SHEET IS NOT COMPLETE AND MAY BE AMENDED PRIOR TO THE TIME OF SALE. THIS TERM SHEET IS NOT AN OFFER TO SELL THESE SECURITIES AND IT IS NOT A SOLICITATION OF AN OFFER TO BUY THESE SECURITIES IN ANY JURISDICTION WHERE THE OFFER OR SALE IS NOT PERMITTED.
93
No. 10 – Southport Commons
Loan Information
Mortgage Loan Seller: | Wells Fargo Bank, National Association | |
Credit Assessment | ||
(Fitch/Moody’s): | NR/NR | |
Original Principal Balance: | $17,150,000 | |
Cut-off Date Principal Balance: | $17,118,390 | |
% of Initial Pool Balance: | 2.0% | |
Loan Purpose: | Refinance | |
Borrower Name: | DAB Investments-Southport | |
| Commons, LLC | ||
Sponsors: | Alan V. Young; William A. Young | |
Mortgage Rate: | 4.370% | |
Note Date: | April 1, 2013 | |
Anticipated Repayment Date: | NAP | |
Maturity Date: | April 1, 2023 | |
IO Period: | None | |
Loan Term (Original): | 120 months | |
Seasoning: | 1 month | |
Amortization Term (Original): | 300 months | |
Loan Amortization Type: | Amortizing Balloon | |
Interest Accrual Method: | Actual/360 | |
Call Protection: | L(25),D(91),O(4) | |
Lockbox Type: | Soft/Springing Cash Management | |
Additional Debt: | None | |
Additional Debt Type: | NAP | |
Escrows and Reserves(1):
Type: | Initial | Monthly | Cap (If Any) | |||||||||
Taxes | $ | 261,512 | $ | 43,586 | NAP | |||||||
Insurance | $ | 8,503 | $ | 4,252 | NAP | |||||||
Replacement Reserves | $ | 0 | $ | 4,501 | NAP | |||||||
TI/LC Reserve | $ | 200,000 | $ | 8,336 | NAP | |||||||
Tenant Reserve | $ | 0 | Springing | $ | 240,000 | |||||||
Property Information
Single Asset/Portfolio: | Single Asset | |
Property Type: | Retail | |
Specific Property Type: | Anchored | |
Location: | Indianapolis, IN | |
Size: | 200,056 SF | |
Cut-off Date Principal | ||
Balance Per Unit/SF: | $85.57 | |
Year Built/Renovated: | 2001/NAP | |
Title Vesting: | Fee | |
Property Manager: | Sitehawk Property | |
| Management Services LLC | ||
3rdMost Recent Occupancy (As of): | 86.6% (12/31/2010) | |
2ndMost Recent Occupancy (As of): | 86.6% (12/31/2011) | |
Most Recent Occupancy (As of): | 88.6% (12/31/2012) | |
Current Occupancy (As of): | 88.6% (2/1/2013) | |
Underwriting and Financial Information: | ||
3rdMost Recent NOI (As of): | $1,908,632 (12/31/2010) | |
2ndMost Recent NOI (As of): | $2,042,121 (12/31/2011) | |
Most Recent NOI (As of): | $2,238,732 (12/31/2012) | |
U/W Revenues: | $2,758,665 | |
U/W Expenses: | $966,585 | |
U/W NOI: | $1,792,080 | |
U/W NCF: | $1,627,718 | |
U/W NOI DSCR : | 1.59x | |
U/W NCF DSCR: | 1.44x | |
U/W NOI Debt Yield: | 10.5% | |
U/W NCF Debt Yield: | 9.5% | |
As-Is Appraised Value: | $23,800,000 | |
As-Is Appraisal Valuation Date: | January 11, 2013 | |
Cut-off Date LTV Ratio: | 71.9% | |
LTV Ratio at Maturity or ARD: | 52.6% | |
| (1) | See “Escrows” section. |
The Mortgage Loan. The mortgage loan (the “Southport Commons Mortgage Loan”) is evidenced by a single promissory note that is secured by a first mortgage encumbering an anchored retail property located in Indianapolis, Indiana (the “Southport Commons Property”). The Southport Commons Mortgage Loan was originated on April 1, 2013 by Wells Fargo Bank, National Association. The Southport Commons Mortgage Loan had an original principal balance of $17,150,000, has an outstanding principal balance as of the Cut-off Date of $17,118,390 and accrues interest at an interest rate of 4.370% per annum. The Southport Commons Mortgage Loan had an initial term of 120 months, has a remaining term of 119 months as of the Cut-off Date and requires payments of principal and interest based on a 25-year amortization schedule. The Southport Commons Mortgage Loan matures on April 1, 2023.
Following the lockout period, the borrower has the right to defease the Southport Commons Mortgage Loan in whole, but not in part, on any due date before January 1, 2023. In addition, the Southport Commons Mortgage Loan is prepayable without penalty on or after January 1, 2023.
THE INFORMATION IN THIS STRUCTURAL AND COLLATERAL TERM SHEET IS NOT COMPLETE AND MAY BE AMENDED PRIOR TO THE TIME OF SALE. THIS TERM SHEET IS NOT AN OFFER TO SELL THESE SECURITIES AND IT IS NOT A SOLICITATION OF AN OFFER TO BUY THESE SECURITIES IN ANY JURISDICTION WHERE THE OFFER OR SALE IS NOT PERMITTED.
94
SOUTHPORT COMMONS
Sources and Uses
Sources | Uses | |||||||||||||||||||
Original loan amount | $ | 17,150,000 | 99.0 | % | Loan payoff(1) | $ | 16,802,280 | 97.0 | % | |||||||||||
Sponsor’s new cash contribution | 177,064 | 1.0 | Closing costs | 54,769 | 0.3 | |||||||||||||||
| Reserves | 470,015 | 2.7 | ||||||||||||||||||
|
|
|
|
|
|
|
| |||||||||||||
Total Sources | $ | 17,327,064 | 100.0 | % | Total Uses | $ | 17,327,064 | 100.0 | % | |||||||||||
|
|
|
|
|
|
|
| |||||||||||||
| (1) | The Southport Commons Property was previously securitized in GCCFC 2003-C1. |
The Property.The Southport Commons Property is an anchored retail center containing approximately 200,056 square feet and located in Indianapolis, Indiana. Built in 2001, the Southport Commons Property is anchored by Kohl’s, and is shadow-anchored by Super Target and Home Depot (both not part of the collateral). Parking is provided by approximately 1,182 surface parking spaces, resulting in a parking ratio of 5.9 spaces per 1,000 square feet of rentable area. Including the Super Target and Home Depot, parking is provided by approximately 2,446 parking spaces, resulting in a parking ratio of 4.8 spaces per 1,000 square feet of rentable area. As of February 1, 2013, the Southport Commons Property was 88.6% leased to 14 tenants.
The following table presents certain information relating to the tenancies at the Southport Commons Property:
Major Tenants
Tenant Name | Credit Rating (Fitch/ Moody’s/ S&P)(1) | Tenant NRSF | % of NRSF | Annual U/W Base Rent PSF | Annual U/W Base Rent | % of Total Annual U/W Base Rent | Sales PSF(2) | Occupancy Cost(2) | Lease Expiration Date | |||||||||||||||||||||||||
Shadow Anchor Tenants – Not Part of Collateral |
| |||||||||||||||||||||||||||||||||
Super Target | A-/A2/A+ | 175,384 | ANCHOR-OWNED – NOT PART OF THE COLLATERAL | |||||||||||||||||||||||||||||||
Home Depot | A-/A3/A- | 132,576 | ANCHOR-OWNED – NOT PART OF THE COLLATERAL | |||||||||||||||||||||||||||||||
Anchor Tenant – Collateral |
| |||||||||||||||||||||||||||||||||
Kohl’s | BBB+/Baa1/BBB+(3) | 86,584 | 43.3 | % | $ | 9.75 | $ | 844,194 | 40.9 | % | NAV | (4) | NAV | (4) | 1/31/2023 | |||||||||||||||||||
|
|
|
|
|
|
|
| |||||||||||||||||||||||||||
Total Anchor Tenant – Collateral | 86,584 | 43.3 | % | $ | 9.75 | $ | 844,194 | 40.9 | % | |||||||||||||||||||||||||
Major Tenants – Collateral |
| |||||||||||||||||||||||||||||||||
Kittles Rooms Express | NR/NR/NR | 23,500 | 11.7 | % | $ | 10.00 | $ | 235,000 | 11.4 | % | NAV | (4) | NAV | (4) | 2/28/2022 | |||||||||||||||||||
Monkey Joe’s | NR/NR/NR | 17,522 | 8.8 | % | $ | 10.00 | $ | 175,220 | 8.5 | % | NAV | (4) | NAV | (4) | 3/31/2022 | (5) | ||||||||||||||||||
Pier 1 Imports | NR/NR/NR | 9,500 | 4.7 | % | $ | 17.50 | $ | 166,250 | 8.1 | % | $ | 170 | (6) | 12.4 | %(6) | 7/31/2014 | ||||||||||||||||||
Dress Barn | NR/NR/NR | 8,000 | 4.0 | % | $ | 14.00 | $ | 112,000 | 5.4 | % | $ | 164 | 11.6 | % | 12/31/2017 | |||||||||||||||||||
Archiver’s | NR/NR/NR | 6,800 | 3.4 | % | $ | 15.00 | $ | 102,000 | 4.9 | % | $ | 136 | 14.6 | % | 12/31/2013 | |||||||||||||||||||
|
|
|
|
|
|
|
| |||||||||||||||||||||||||||
Total Major Tenants – Collateral | 65,322 | 32.7 | % | $ | 12.10 | $ | 790,470 | 38.3 | % | |||||||||||||||||||||||||
Non-Major Tenants – Collateral | 25,290 | 12.6 | % | $ | 16.99 | $ | 429,720 | 20.8 | % | |||||||||||||||||||||||||
|
|
|
|
|
|
|
| |||||||||||||||||||||||||||
Occupied Collateral Total | 177,196 | 88.6 | % | $ | 11.65 | $ | 2,064,384 | 100.0 | % | |||||||||||||||||||||||||
|
|
|
| |||||||||||||||||||||||||||||||
Vacant Space | 22,860 | 11.4 | % | |||||||||||||||||||||||||||||||
|
|
|
| |||||||||||||||||||||||||||||||
Collateral Total | 200,056 | 100.0 | % | |||||||||||||||||||||||||||||||
|
|
|
| |||||||||||||||||||||||||||||||
| (1) | Certain ratings are those of the parent company whether or not the parent guarantees the lease. |
| (2) | Unless otherwise noted, Sales PSF and Occupancy Costs are for the trailing 12-month period ending December 31, 2012. |
| (3) | The ratings shown represent Kohl’s Corporation, which guarantees the Kohl’s lease. |
| (4) | Tenant is not required to report sales. |
| (5) | Monkey Joe’s has a right to terminate their lease after the 66th month if gross sales during the prior trailing 12-month period fall below 85.0% of the gross sales for the previous 3-year average, along with payment of a fee equal to $183,981. |
| (6) | Sales PSF and Occupancy Cost for Pier 1 Imports are for the trailing 12-month period ending February 29, 2012. |
THE INFORMATION IN THIS STRUCTURAL AND COLLATERAL TERM SHEET IS NOT COMPLETE AND MAY BE AMENDED PRIOR TO THE TIME OF SALE. THIS TERM SHEET IS NOT AN OFFER TO SELL THESE SECURITIES AND IT IS NOT A SOLICITATION OF AN OFFER TO BUY THESE SECURITIES IN ANY JURISDICTION WHERE THE OFFER OR SALE IS NOT PERMITTED.
95
SOUTHPORT COMMONS
The following table presents certain information relating to the historical sales at the Southport Commons Property:
Historical Sales (PSF)(1)
Tenant Name | 2009 | 2010 | 2011 | 2012 | ||||||||||||
Kohl’s(2) | NAV | NAV | NAV | NAV | ||||||||||||
Kittles Rooms Express(2) | NAV | NAV | NAV | NAV | ||||||||||||
Monkey Joe’s(2) | NAV | NAV | NAV | NAV | ||||||||||||
Pier 1 Imports | $ | 135 | (3) | $ | 134 | (3) | $ | 152 | (3) | $ | 170 | (3) | ||||
Dress Barn | $ | 153 | $ | 171 | $ | 165 | $ | 164 | ||||||||
Archiver’s | $ | 166 | $ | 142 | $ | 125 | $ | 136 | ||||||||
| (1) | Historical Sales (PSF) are based on historical statements provided by the borrower. |
| (2) | Tenant is not required to report sales. |
| (3) | Sales PSF for Pier 1 Imports represent the trailing 12-month period ending on the last day of February of each applicable year. |
The following table presents certain information relating to the lease rollover schedule at the Southport Commons Property:
Lease Expiration Schedule(1)(2)
Year Ending December 31, | No. of Leases Expiring | Expiring NRSF | % of Total NRSF | Cumulative Expiring NRSF | Cumulative % of Total NRSF | Annual U/W Base Rent | Annual U/W Base Rent PSF(3) | |||||||||||||||||||||
MTM | 0 | 0 | 0.0 | % | 0 | 0.0 | % | $ | 0 | $ | 0.00 | |||||||||||||||||
2013 | 1 | 6,800 | 3.4 | % | 6,800 | 3.4 | % | $ | 102,000 | $ | 15.00 | |||||||||||||||||
2014 | 3 | 15,250 | 7.6 | % | 22,050 | 11.0 | % | $ | 239,250 | $ | 15.69 | |||||||||||||||||
2015 | 1 | 2,500 | 1.2 | % | 24,550 | 12.3 | % | $ | 45,000 | $ | 18.00 | |||||||||||||||||
2016 | 2 | 3,840 | 1.9 | % | 28,390 | 14.2 | % | $ | 69,120 | $ | 18.00 | |||||||||||||||||
2017 | 3 | 18,000 | 9.0 | % | 46,390 | 23.2 | % | $ | 297,000 | $ | 16.50 | |||||||||||||||||
2018 | 1 | 3,200 | 1.6 | % | 49,590 | 24.8 | % | $ | 57,600 | $ | 18.00 | |||||||||||||||||
2019 | 0 | 0 | 0.0 | % | 49,590 | 24.8 | % | $ | 0 | $ | 0.00 | |||||||||||||||||
2020 | 0 | 0 | 0.0 | % | 49,590 | 24.8 | % | $ | 0 | $ | 0.00 | |||||||||||||||||
2021 | 0 | 0 | 0.0 | % | 49,590 | 24.8 | % | $ | 0 | $ | 0.00 | |||||||||||||||||
2022 | 2 | 41,022 | 20.5 | % | 90,612 | 45.3 | % | $ | 410,220 | $ | 10.00 | |||||||||||||||||
2023 | 1 | 86,584 | 43.3 | % | 177,196 | 88.6 | % | $ | 844,194 | $ | 9.75 | |||||||||||||||||
Thereafter | 0 | 0 | 0.0 | % | 177,196 | 88.6 | % | $ | 0 | $ | 0.00 | |||||||||||||||||
Vacant | 0 | 22,860 | 11.4 | % | 200,056 | 100.0 | % | $ | 0 | $ | 0.00 | |||||||||||||||||
|
|
|
|
|
|
|
|
|
| |||||||||||||||||||
Total/Weighted Average | 14 | 200,056 | 100.0 | % | $ | 2,064,384 | $ | 11.65 | ||||||||||||||||||||
|
|
|
|
|
|
|
|
|
| |||||||||||||||||||
| (1) | Information obtained from the underwritten rent roll. |
| (2) | Certain tenants may have lease termination options that are exercisable prior to the originally stated expiration date of the subject lease and that are not considered in the Lease Expiration Schedule. |
| (3) | Weighted Average Annual U/W Base Rent PSF excludes vacant space. |
The following table presents historical occupancy percentages at the Southport Commons Property:
Historical Occupancy(1)
12/31/2010 | 12/31/2011 | 12/31/2012 | 2/1/2013 | |||
| 86.6% | 86.6% | 88.6% | 88.6% |
| (1) | Information obtained from the borrower. |
THE INFORMATION IN THIS STRUCTURAL AND COLLATERAL TERM SHEET IS NOT COMPLETE AND MAY BE AMENDED PRIOR TO THE TIME OF SALE. THIS TERM SHEET IS NOT AN OFFER TO SELL THESE SECURITIES AND IT IS NOT A SOLICITATION OF AN OFFER TO BUY THESE SECURITIES IN ANY JURISDICTION WHERE THE OFFER OR SALE IS NOT PERMITTED.
96
SOUTHPORT COMMONS
Operating History and Underwritten Net Cash Flow. The following table presents certain information relating to the historical operating performance and Underwritten Net Cash Flow at the Southport Commons Property:
Cash Flow Analysis
| 2010 | 2011 | 2012 | U/W | U/W $ per SF | ||||||||||||||||
Base Rent | $ | 2,254,228 | $ | 2,252,879 | $ | 2,320,612 | $ | 2,064,384 | $ | 10.32 | ||||||||||
Grossed Up Vacant Space | 0 | 0 | 0 | 271,480 | 1.36 | |||||||||||||||
Total Reimbursables | 676,005 | 675,125 | 685,493 | 674,481 | 3.37 | |||||||||||||||
Other Income | 19,800 | 19,800 | 19,800 | 19,800 | 0.10 | |||||||||||||||
Less Vacancy & Credit Loss | 0 | 0 | 0 | (271,480 | )(1) | (1.36 | ) | |||||||||||||
|
|
|
|
|
|
|
|
|
| |||||||||||
Effective Gross Income | $ | 2,950,032 | $ | 2,947,805 | $ | 3,025,905 | $ | 2,758,665 | $ | 13.79 | ||||||||||
Total Operating Expenses | $ | 1,041,401 | $ | 905,683 | $ | 787,173 | $ | 966,585 | $ | 4.83 | ||||||||||
|
|
|
|
|
|
|
|
|
| |||||||||||
Net Operating Income | $ | 1,908,632 | $ | 2,042,121 | $ | 2,238,732 | $ | 1,792,080 | $ | 8.96 | ||||||||||
TI/LC | 0 | 0 | 23,015 | 110,347 | 0.55 | |||||||||||||||
Capital Expenditures | 0 | 0 | 0 | 54,015 | 0.27 | |||||||||||||||
|
|
|
|
|
|
|
|
|
| |||||||||||
Net Cash Flow | $ | 1,908,632 | $ | 2,042,121 | $ | 2,215,717 | $ | 1,627,718 | $ | 8.14 | ||||||||||
NOI DSCR | 1.69 | x | 1.81 | x | 1.98 | x | 1.59 | x | ||||||||||||
NCF DSCR | 1.69 | x | 1.81 | x | 1.96 | x | 1.44 | x | ||||||||||||
NOI DY | 11.1 | % | 11.9 | % | 13.1 | % | 10.5 | % | ||||||||||||
NCF DY | 11.1 | % | 11.9 | % | 12.9 | % | 9.5 | % | ||||||||||||
| (1) | The underwritten economic vacancy is 11.6%. The Southport Commons Property was 88.6% physically occupied as of February 1, 2013. |
Appraisal. As of the appraisal valuation date of January 11, 2013, the Southport Commons Property had an “as-is” appraised value of $23,800,000.
Environmental Matters. According to the Phase I environmental assessment dated January 28, 2013, there was no evidence of any recognized environmental conditions at the Southport Commons Property.
Market Overview and Competition.The Southport Commons Property is located in Indianapolis, Indiana, approximately 10 miles south of the Indianapolis central business district. The Southport Commons Property is located just east of Interstate 65 at the northwest corner of the intersection of Southport Road and Emerson Avenue, two primary commercial arterials in the area. According to the appraisal, the daily traffic count passing by the Southport Commons Property on Southport Road is approximately 39,000 vehicles. The local community surrounding the Southport Commons Property has grown at a rate above the Indianapolis metropolitan statistical area as a whole, with the population increasing over 28% between 2000 and 2012. According to the appraisal, as of 2012, the population within a three-mile and five-mile radius of the Southport Commons Property was 60,677 and 149,464, respectively. The estimated average household income within the same three-mile and five-mile radii was $54,676 and $54,067, respectively.
According to a third party market research report, the Southport Commons Property is located within the Beech Grove/SE County submarket, which has an estimated inventory of 316 retail properties totaling approximately 2.3 million square feet. As of the fourth quarter of 2012, the submarket vacancy was 2.2% with an average asking rent of $11.75 per square foot, on a triple net basis.
The following table presents certain information relating to comparable retail properties for the Southport Commons Property:
Competitive Set(1)
| Southport Commons (Subject) | Greenwood Springs | Greenwood Place | Greenwood Shopping Center | South Port Center | Greendale Shopping Center | |||||||
Location | Indianapolis, IN | Greenwood Springs, IN | Indianapolis, IN | Indianapolis, IN | Indianapolis, IN | Greenwood, IN | ||||||
Distance from Subject | — | 2.3 miles | 3.0 miles | 3.0 miles | 3.1 miles | 4.4 miles | ||||||
Property Type | Community Center | Power Center | Community Center | Community Center | Community Center | Neighborhood Center | ||||||
Year Built/Renovated | 2001/NAP | 2000/NAP | 1984/2010 | 1967/1990 | 1990/NAP | 1986/NAP | ||||||
Total GLA | 200,056 SF | 400,090 SF | 364,348 SF | 157,093 SF | 278,800 SF | 123,951 SF | ||||||
Total Occupancy | 89% | 97% | 82% | 100% | 97% | 100% |
| (1) | Information obtained from the appraisal dated February 12, 2013. |
THE INFORMATION IN THIS STRUCTURAL AND COLLATERAL TERM SHEET IS NOT COMPLETE AND MAY BE AMENDED PRIOR TO THE TIME OF SALE. THIS TERM SHEET IS NOT AN OFFER TO SELL THESE SECURITIES AND IT IS NOT A SOLICITATION OF AN OFFER TO BUY THESE SECURITIES IN ANY JURISDICTION WHERE THE OFFER OR SALE IS NOT PERMITTED.
97
SOUTHPORT COMMONS
The Borrower.The borrower is DAB Investments-Southport Commons, LLC, a single purpose entity. Alan V. Young and William A. Young, the loan sponsors, are the guarantors of certain nonrecourse carveouts under the Southport Commons Mortgage Loan.
The Sponsors. The loan sponsors are Alan V. Young and William A. Young, who have a commercial real estate portfolio comprising 14 retail and office properties in Indiana, Florida and North Carolina totaling approximately 689,000 square feet.
Escrows.The loan documents provide for upfront escrows in the amount of $261,512 for taxes, $8,503 for insurance and $200,000 for tenant improvements and leasing costs (“TI/LCs”). The loan documents also provide for ongoing monthly escrows in the amount of $43,586 for taxes, $4,252 for insurance, $4,501 for replacement reserves and $8,336 for TI/LCs. In addition, in the event that the tenant Kittles Rooms Express goes dark, vacates, commences any bankruptcy or similar proceeding, or fails to exercise its extension option 12 months prior to its lease expiration, a monthly escrow in the amount of $20,000 will commence (subject to a cap of $240,000).
Lockbox and Cash Management.The Southport Commons Mortgage Loan requires a lender-controlled lockbox account, which is already in place, and that the borrower and the property manager deliver all receipts payable with respect to the Southport Commons Property directly into such lockbox account. The loan documents also require that all revenues received by the borrower or the property manager be deposited into the lockbox account within one business day of receipt. Other than during a Cash Trap Event Period (as defined below), all excess funds on deposit are disbursed to the borrower.
A “Cash Trap Event Period” will commence upon the earlier of the following: (i) the occurrence and continuance of an event of default; (ii) any Major Tenant (as defined below) going dark; (iii) any Major Tenant commencing a bankruptcy or similar proceeding; or (iv) either Kohl’s or Kittles Rooms Express failing to exercise its extension option 12 months prior to its lease expiration or giving written notice of its intention not to renew its lease. A Cash Trap Event Period will expire, with regard to the circumstances in clause (i), upon the cure of such event of default; with regard to the circumstances in clause (ii), upon either (a) the applicable Major Tenant re-opening for business for 30 days or (b) a Re-Tenanting Event (as defined below); with regard to the circumstances in clause (iii), upon either (x) the date on which the applicable Major Tenant is no longer a debtor in such proceeding and the Major Tenant’s lease has been assumed and is in full force and effect or (y) a Re-Tenanting Event; or with regard to the circumstances in clause (iv), upon either (1) the date on which the tenant has exercised its extension option in accordance with its lease or (2) a Re-Tenanting Event.
A “Re-Tenanting Event” will occur, with respect to any space demised to a Major Tenant, upon the lender’s receipt that one or more satisfactory replacement tenants are in full occupancy of and open for business in the applicable space, and with respect to clause (iv) above only, a tenant estoppel certificate confirms that such replacement tenant is paying full, unabated rent.
A “Major Tenant” shall mean any of the following tenants: Home Depot, Kohl’s, Kittles Rooms Express and Super Target.
Property Management.The property is managed by Sitehawk Property Management Services LLC.
Assumption.The borrower has a two-time right to transfer the Southport Commons Property, provided that no event of default has occurred and is continuing and certain other conditions are satisfied, including (i) the lender’s reasonable determination that the proposed transferee and guarantor satisfy the lender’s credit review and underwriting standards, taking into consideration transferee experience, financial strength and general business standing; (ii) execution of a recourse guaranty and an environmental indemnity by an affiliate of the transferee; and (iii) if requested by the lender, rating agency confirmation from Fitch and Moody’s that the transfer will not result in a downgrade, withdrawal or qualification of the respective ratings assigned to the Series 2013-C13 Certificates.
Partial Release.Not permitted.
Real Estate Substitution.Not permitted.
Subordinate and Mezzanine Indebtedness.Not permitted.
Ground Lease.None.
Terrorism Insurance. The loan documents require that the “all risk” insurance policy required to be maintained by the borrower provide coverage for terrorism in an amount equal to the full replacement cost of the Southport Commons Property, as well as business interruption insurance covering no less than the 12-month period following the occurrence of a casualty event, together with a six-month extended period of indemnity.
THE INFORMATION IN THIS STRUCTURAL AND COLLATERAL TERM SHEET IS NOT COMPLETE AND MAY BE AMENDED PRIOR TO THE TIME OF SALE. THIS TERM SHEET IS NOT AN OFFER TO SELL THESE SECURITIES AND IT IS NOT A SOLICITATION OF AN OFFER TO BUY THESE SECURITIES IN ANY JURISDICTION WHERE THE OFFER OR SALE IS NOT PERMITTED.
98
[THIS PAGE INTENTIONALLY LEFT BLANK.]
99
No. 11 - Merrick Commons
Loan Information
Mortgage Loan Seller: | Wells Fargo Bank, National Association | |
Credit Assessment | ||
(Fitch / Moody’s) | NR/NR | |
Original Principal Balance: | $16,500,000 | |
Cut-off Date Principal Balance: | $16,474,928 | |
% of Initial Pool Balance: | 1.9% | |
Loan Purpose: | Refinance | |
Borrower Name: | KIOP Merrick L.P. | |
Sponsor: | Kimco Income Operating Partnership, L.P. | |
Mortgage Rate: | 3.700% | |
Note Date: | March 14, 2013 | |
Anticipated Repayment Date: | NAP | |
Maturity Date: | April 1, 2023 | |
IO Period: | None | |
Loan Term (Original): | 120 months | |
Seasoning: | 1 month | |
Amortization Term (Original): | 360 months | |
Loan Amortization Type: | Amortizing Balloon | |
Interest Accrual Method: | Actual/360 | |
Call Protection: | L(25),D(91),O(4) | |
Lockbox Type: | Springing (Without Established Account) | |
Additional Debt: | None | |
Additional Debt Type: | NAP |
Escrows and Reserves:
Type: | Initial | Monthly | Cap (If Any) | |||||||||
Taxes(1) | $ | 0 | Springing | NAP | ||||||||
Insurance(2) | $ | 0 | Springing | NAP | ||||||||
Replacement Reserve(3) | $ | 0 | Springing | NAP | ||||||||
Property Information
| Single Asset/Portfolio: | Single Asset | |
| Property Type: | Retail | |
| Specific Property Type: | Anchored | |
| Location: | Merrick, NY | |
| Size: | 108,296 SF | |
| Cut-off Date Principal | ||
| Balance Per Unit/SF: | $152.13 | |
| Year Built/Renovated: | 1963/1995 | |
| Title Vesting: | Fee | |
| Property Manager: | Self-managed | |
| 3rdMost Recent Occupancy (As of): | 100.0% (12/31/2010) | |
| 2ndMost Recent Occupancy (As of): | 100.0% (12/31/2011) | |
| Most Recent Occupancy (As of): | 98.1% (12/31/2012) | |
| Current Occupancy (As of)(4): | 86.1% (2/11/2013) | |
| Underwriting and Financial Information: | ||
| 3rdMost Recent NOI (As of): | $1,904,819 (12/31/2010) | |
| 2ndMost Recent NOI (As of): | $2,197,805 (12/31/2011) | |
| Most Recent NOI (As of): | $2,360,090 (12/31/2012) | |
| U/W Revenues: | $3,114,452 | |
| U/W Expenses: | $1,334,982 | |
| U/W NOI: | $1,779,470 | |
| U/W NCF: | $1,647,166 | |
| U/W NOI DSCR: | 1.95x | |
| U/W NCF DSCR: | 1.81x | |
| U/W NOI Debt Yield: | 10.8% | |
| U/W NCF Debt Yield: | 10.0% | |
| As-Is Appraised Value: | $33,000,000 | |
| As-Is Appraisal Valuation Date: | February 2, 2013 | |
| Cut-off Date LTV Ratio: | 49.9% | |
| LTV Ratio at Maturity or ARD: | 39.3% | |
| (1) | Monthly tax escrows are not required as long as no event of default has occurred and is continuing and the borrower delivers to the lender satisfactory evidence of payment of taxes. |
| (2) | Monthly insurance escrows are not required as long as no event of default has occurred and is continuing and the borrower provides satisfactory evidence that the Merrick Commons Property is insured in accordance with the loan documents. |
| (3) | Monthly replacement reserves are not required as long as no event of default has occurred and is continuing. |
| (4) | The Merrick Commons Property is currently 100.0% leased. The tenant Annie Sez (13.9% of net rentable area) was underwritten as vacant due to its parent company being in bankruptcy. Annie Sez is currently in occupancy and paying full rent and has until August 5, 2013 to assume or reject its lease. In addition, Teachers Federal Credit Union executed a 10-year lease on December 21, 2012 but is not yet in occupancy or paying rent. The tenant is expected to take occupancy and begin paying rent on August 1, 2013. |
The Merrick Commons mortgage loan is evidenced by a single promissory note that is secured by a first mortgage encumbering a grocery anchored shopping center containing 108,296 square feet and located in Merrick, New York (the “Merrick Commons Property”). The Merrick Commons Property was built in 1963 and renovated in 1995 and is located in a dense, infill area in the Southeastern Nassau retail submarket of Long Island. The Merrick Commons Property is anchored by Waldbaum’s grocery store and HomeGoods with a diverse inline tenant mix including apparel retailers, banking, specialty shops and restaurants. As of February 11, 2013, the Merrick Commons Property was 86.1% leased to 16 tenants.
THE INFORMATION IN THIS STRUCTURAL AND COLLATERAL TERM SHEET IS NOT COMPLETE AND MAY BE AMENDED PRIOR TO THE TIME OF SALE. THIS TERM SHEET IS NOT AN OFFER TO SELL THESE SECURITIES AND IT IS NOT A SOLICITATION OF AN OFFER TO BUY THESE SECURITIES IN ANY JURISDICTION WHERE THE OFFER OR SALE IS NOT PERMITTED.
100
MERRICK COMMONS
Sources and Uses
Sources | Uses | |||||||||||||||||||
Original loan amount | $ | 16,500,000 | 100.0 | % | Loan payoff(1) | $ | 12,105,063 | 73.4 | % | |||||||||||
| Closing costs | 157,646 | 1.0 | ||||||||||||||||||
| Return of equity | 4,237,291 | 25.7 | ||||||||||||||||||
|
|
|
|
|
|
|
| |||||||||||||
Total Sources | $ | 16,500,000 | 100.0 | % | Total Uses | $ | 16,500,000 | 100.0 | % | |||||||||||
|
|
|
|
|
|
|
| |||||||||||||
| (1) | The Merrick Commons Property was previously securitized in GECMC 2002-3A. |
The following table presents certain information relating to the tenancies at the Merrick Commons Property:
Major Tenants
| Credit Rating | % of Total | |||||||||||||||||||||||||||||||||
| (Fitch/ | Annual | Annual | Annual | Lease | ||||||||||||||||||||||||||||||
| Moody’s/ | Tenant | % of | U/W Base | U/W Base | U/W Base | Sales | Occupancy | Expiration | ||||||||||||||||||||||||||
Tenant Name | S&P)(1) | NRSF | NRSF | Rent PSF | Rent | Rent | PSF | Cost | Date | |||||||||||||||||||||||||
Anchor Tenants | ||||||||||||||||||||||||||||||||||
Waldbaum’s | NR/NR/NR | 44,478 | 41.1 | % | $ | 16.64 | $ | 740,000 | 36.0 | % | $ | 515 | (2) | 5.4 | %(2) | 11/30/2018 | ||||||||||||||||||
HomeGoods | NR/A3/A | 24,836 | 22.9 | % | $ | 22.28 | (3) | $ | 553,343 | 26.9 | % | $ | 310 | (4) | 10.8 | %(4) | 6/30/2019 | |||||||||||||||||
|
|
|
|
|
|
|
| |||||||||||||||||||||||||||
Total Anchor Tenants | 69,314 | 64.0 | % | $ | 18.66 | $ | 1,293,343 | 62.9 | % | |||||||||||||||||||||||||
Major Tenants | ||||||||||||||||||||||||||||||||||
JPMorgan Chase Bank | A+/A2/A | 3,214 | 3.0 | % | $ | 35.00 | $ | 112,490 | 5.5 | % | NAV | NAV | 9/30/2020 | |||||||||||||||||||||
Bagel Plaza | NR/NR/NR | 2,732 | 2.5 | % | $ | 33.00 | $ | 90,156 | 4.4 | % | NAV | NAV | 2/28/2019 | |||||||||||||||||||||
Massage Envy | NR/NR/NR | 2,627 | 2.4 | % | $ | 34.00 | $ | 89,318 | 4.3 | % | NAV | NAV | 12/31/2018 | |||||||||||||||||||||
Teachers Federal Credit | ||||||||||||||||||||||||||||||||||
Union(5) | NR/NR/NR | 2,063 | 1.9 | % | $ | 32.00 | $ | 66,016 | 3.2 | % | NAV | NAV | 7/31/2023 | |||||||||||||||||||||
From Me to You | NR/NR/NR | 1,631 | 1.5 | % | $ | 34.03 | $ | 55,503 | 2.7 | % | NAV | NAV | 8/31/2016 | |||||||||||||||||||||
|
|
|
|
|
|
|
| |||||||||||||||||||||||||||
Total Major Tenants | 12,267 | 11.3 | % | $ | 33.71 | $ | 413,483 | 20.1 | % | |||||||||||||||||||||||||
Non-Major Tenants | 11,677 | 10.8 | % | $ | 29.86 | $ | 348,631 | 17.0 | % | |||||||||||||||||||||||||
|
|
|
|
|
|
|
| |||||||||||||||||||||||||||
Occupied Collateral Total | 93,258 | 86.1 | % | $ | 22.04 | $ | 2,055,457 | 100.0 | % | |||||||||||||||||||||||||
|
|
|
| |||||||||||||||||||||||||||||||
Vacant Space | 15,038 | 13.9 | % | |||||||||||||||||||||||||||||||
|
|
|
| |||||||||||||||||||||||||||||||
Collateral Total | 108,296 | 100.0 | % | |||||||||||||||||||||||||||||||
|
|
|
| |||||||||||||||||||||||||||||||
| (1) | Certain ratings are those of the parent company whether or not the parent guarantees the lease. |
| (2) | Sales are for the trailing 12-month period ending November 30, 2011. Occupany Cost is based on Annual U/W Base Rent and reimbursements. |
| (3) | HomeGoods’ Annual U/W Base Rent is based on the average over the lease term. The current annual rent is $533,974 ($21.50 PSF). |
| (4) | Sales are for the trailing 12-month period ending January 1, 2012. Occupany Cost is based on Annual U/W Base Rent and reimbursements. |
| (5) | Teachers Federal Credit Union executed a 10-year lease on December 21, 2012 but is not yet in occupancy or paying rent. The tenant is expected to take occupancy and begin paying rent on August 1, 2013. |
THE INFORMATION IN THIS STRUCTURAL AND COLLATERAL TERM SHEET IS NOT COMPLETE AND MAY BE AMENDED PRIOR TO THE TIME OF SALE. THIS TERM SHEET IS NOT AN OFFER TO SELL THESE SECURITIES AND IT IS NOT A SOLICITATION OF AN OFFER TO BUY THESE SECURITIES IN ANY JURISDICTION WHERE THE OFFER OR SALE IS NOT PERMITTED.
101
MERRICK COMMONS
The following table presents certain information relating to the lease rollover schedule at the Merrick Commons Property:
Lease Expiration Schedule(1)(2)
Year Ending December 31, | No. of Leases Expiring | Expiring NRSF | % of Total NRSF | Cumulative Expiring NRSF | Cumulative % of Total NRSF | Annual U/W Base Rent | Annual U/W Base Rent PSF(3) | |||||||||||||||||||||
MTM | 1 | 1,143 | 1.1 | % | 1,143 | 1.1 | % | $ | 36,804 | $ | 32.20 | |||||||||||||||||
2013 | 0 | 0 | 0.0 | % | 1,143 | 1.1 | % | $ | 0 | $ | 0.00 | |||||||||||||||||
2014 | 2 | 2,484 | 2.3 | % | 3,627 | 3.3 | % | $ | 75,258 | $ | 30.30 | |||||||||||||||||
2015 | 0 | 0 | 0.0 | % | 3,627 | 3.3 | % | $ | 0 | $ | 0.00 | |||||||||||||||||
2016 | 1 | 1,631 | 1.5 | % | 5,258 | 4.9 | % | $ | 55,503 | $ | 34.03 | |||||||||||||||||
2017 | 0 | 0 | 0.0 | % | 5,258 | 4.9 | % | $ | 0 | $ | 0.00 | |||||||||||||||||
2018 | 3 | 48,890 | 45.1 | % | 54,148 | 50.0 | % | $ | 879,544 | $ | 17.99 | |||||||||||||||||
2019 | 2 | 27,568 | 25.5 | % | 81,716 | 75.5 | % | $ | 643,499 | $ | 23.34 | |||||||||||||||||
2020 | 3 | 5,890 | 5.4 | % | 87,606 | 80.9 | % | $ | 185,350 | $ | 31.47 | |||||||||||||||||
2021 | 3 | 3,589 | 3.3 | % | 91,195 | 84.2 | % | $ | 113,484 | $ | 31.62 | |||||||||||||||||
2022 | 0 | 0 | 0.0 | % | 91,195 | 84.2 | % | $ | 0 | $ | 0.00 | |||||||||||||||||
2023 | 1 | 2,063 | 1.9 | % | 93,258 | 86.1 | % | $ | 66,016 | $ | 32.00 | |||||||||||||||||
Thereafter | 0 | 0 | 0.0 | % | 93,258 | 86.1 | % | $ | 0 | $ | 0.00 | |||||||||||||||||
Vacant(4) | 0 | 15,038 | 13.9 | % | 108,296 | 100.0 | % | $ | 0 | $ | 0.00 | |||||||||||||||||
|
|
|
|
|
|
|
|
|
| |||||||||||||||||||
Total/Weighted Average | 16 | 108,296 | 100.0 | % | $ | 2,055,457 | $ | 22.04 | ||||||||||||||||||||
|
|
|
|
|
|
|
|
|
| |||||||||||||||||||
| (1) | Information obtained from the underwritten rent roll. |
| (2) | Certain tenants may have lease termination options that are exercisable prior to the stated expiration date of the subject lease and that are not considered in the Lease Expiration Schedule. |
| (3) | Weighted Average Annual U/W Base Rent PSF excludes vacant space. |
| (4) | The Merrick Commons Property is currently 100.0% leased. The tenant Annie Sez (13.9% of net rentable area) was underwritten as vacant due to its parent company being in bankruptcy. Annie Sez is currently in occupancy and paying full rent and has until August 5, 2013 to assume or reject its lease. In addition, Teachers Federal Credit Union executed a 10-year lease on December 21, 2012 but is not yet in occupancy or paying rent. The tenant is expected to take occupancy and begin paying rent on August 1, 2013. |
The following table presents historical occupancy percentages at the Merrick Commons Property:
Historical Occupancy(1)
12/31/2010 | 12/31/2011 | 12/31/2012 | 2/11/2013 | |||
| 100.0% | 100.0% | 98.1% | 86.1%(2)(3) |
| (1) | Information obtained from a third party market research firm. |
| (2) | Information obtained from the borrower rent roll. |
| (3) | The Merrick Commons Property is currently 100.0% leased. The tenant Annie Sez (13.9% of net rentable area) was underwritten as vacant due to its parent company being in bankruptcy. Annie Sez is currently in occupancy and paying full rent and has until August 5, 2013 to assume or reject its lease. In addition, Teachers Federal Credit Union executed a 10-year lease on December 21, 2012 but is not yet in occupancy or paying rent. The tenant is expected to take occupancy and begin paying rent on August 1, 2013. |
Operating History and Underwritten Net Cash Flow. The following table presents certain information relating to the historical operating performance and the Underwritten Net Cash Flow at the Merrick Commons Property:
Cash Flow Analysis
| 2010 | 2011 | 2012 | U/W | U/W $ per SF | ||||||||||||||||
Base Rent | $ | 2,184,887 | $ | 2,315,321 | $ | 2,338,187 | $ | 2,055,457 | $ | 18.98 | ||||||||||
Grossed Up Vacant Space | 0 | 0 | 0 | 300,760 | 2.78 | |||||||||||||||
Percentage Rent | 0 | 0 | 0 | 0 | 0.00 | |||||||||||||||
Total Reimbursables | 960,909 | 1,156,546 | 1,229,547 | 1,058,995 | 9.78 | |||||||||||||||
Other Income | 0 | 0 | 0 | 0 | 0.00 | |||||||||||||||
Less Vacancy & Credit Loss | (3,938 | ) | (60,433 | ) | 0 | (300,760 | )(1) | (2.78 | ) | |||||||||||
|
|
|
|
|
|
|
|
|
| |||||||||||
Effective Gross Income | $ | 3,149,734 | $ | 3,411,434 | $ | 3,567,734 | $ | 3,114,452 | $ | 28.76 | ||||||||||
Total Operating Expenses | $ | 1,244,915 | $ | 1,213,629 | $ | 1,207,644 | $ | 1,334,982 | $ | 12.33 | ||||||||||
|
|
|
|
|
|
|
|
|
| |||||||||||
Net Operating Income | $ | 1,904,819 | $ | 2,197,805 | $ | 2,360,090 | $ | 1,779,470 | $ | 16.43 | ||||||||||
TI/LC | 0 | 0 | 0 | 106,313 | 0.98 | |||||||||||||||
Capital Expenditures | 0 | 0 | 0 | 25,991 | 0.24 | |||||||||||||||
|
|
|
|
|
|
|
|
|
| |||||||||||
Net Cash Flow | $ | 1,904,819 | $ | 2,197,805 | $ | 2,360,090 | $ | 1,647,166 | $ | 15.21 | ||||||||||
NOI DSCR | �� | 2.09 | x | 2.41 | x | 2.59 | x | 1.95 | x | |||||||||||
NCF DSCR | 2.09 | x | 2.41 | x | 2.59 | x | 1.81 | x | ||||||||||||
NOI DY | 11.6 | % | 13.3 | % | 14.3 | % | 10.8 | % | ||||||||||||
NCF DY | 11.6 | % | 13.3 | % | 14.3 | % | 10.0 | % | ||||||||||||
| (1) | The underwritten economic vacancy is 12.8%. The Merrick Commons Property was considered 86.1% physically occupied as of February 11, 2013. |
THE INFORMATION IN THIS STRUCTURAL AND COLLATERAL TERM SHEET IS NOT COMPLETE AND MAY BE AMENDED PRIOR TO THE TIME OF SALE. THIS TERM SHEET IS NOT AN OFFER TO SELL THESE SECURITIES AND IT IS NOT A SOLICITATION OF AN OFFER TO BUY THESE SECURITIES IN ANY JURISDICTION WHERE THE OFFER OR SALE IS NOT PERMITTED.
102
[THIS PAGE INTENTIONALLY LEFT BLANK.]
103
No. 12 – Industry West Commerce Center
Loan Information
Mortgage Loan Seller: | Wells Fargo Bank, National Association | |
Credit Assessment | ||
(Fitch/Moody’s): | NR/NR | |
Original Principal Balance: | $15,400,000 | |
Cut-off Date Principal | ||
Balance: | $15,400,000 | |
% of Initial Pool Balance: | 1.8% | |
Loan Purpose: | Refinance | |
Borrower Name: | Industry West Commerce Center, LLC | |
Sponsors: | Vincent M. Rizzo | |
Mortgage Rate: | 3.790% | |
Note Date: | April 5, 2013 | |
Anticipated Repayment Date: | NAP | |
Maturity Date: | May 1, 2023 | |
IO Period: | None | |
Loan Term (Original): | 120 months | |
Seasoning: | 0 months | |
Amortization Term (Original): | 360 months | |
Loan Amortization Type: | Amortizing Balloon | |
Interest Accrual Method: | Actual/360 | |
Call Protection: | L(24),D(92),O(4) | |
Lockbox Type: | Springing (Without Established Account) | |
Additional Debt: | None | |
Additional Debt Type: | NAP |
Escrows and Reserves:
Type: | Initial | Monthly | Cap (If Any) | |||||||||
Taxes | $ | 31,254 | $ | 15,627 | NAP | |||||||
Insurance | $ | 1,708 | $ | 1,708 | NAP | |||||||
Replacement Reserves | $ | 0 | $ | 2,400 | $ | 58,000 | ||||||
TI/LC | $ | 220,000 | $ | 8,400 | $ | 220,000 | ||||||
Tenant Reserve(1) | $ | 44,000 | $ | 0 | NAP | |||||||
Deposit Account Reserve | $ | 2,000 | $ | 0 | NAP | |||||||
Property Information
Single Asset/Portfolio: | Portfolio | |
Property Type: | Industrial | |
Specific Property Type: | Warehouse | |
Location: | Santa Rosa, CA | |
Size: | 193,337 SF | |
Cut-off Date Principal Balance Per Unit/SF: | $79.65 | |
Year Built/Renovated: | 2008/NAP | |
Title Vesting: | Fee | |
Property Manager: | Self-managed | |
3rdMost Recent Occupancy (As of): | 59.0% (12/31/2010) | |
2ndMost Recent Occupancy (As of)(2)(3): | 71.0% (12/31/2011) | |
Most Recent Occupancy (As of)(2)(4): | 88.0% (12/31/2012) | |
Current Occupancy (As of): | 100.0% (2/26/2013) | |
| Underwriting and Financial Information: | ||
3rdMost Recent NOI (As of): | $1,130,599 (12/31/2010) | |
2ndMost Recent NOI (As of)(2): | $1,114,234 (12/31/2011) | |
Most Recent NOI (As of)(2): | $1,488,753 (12/31/2012) | |
U/W Revenues: | $2,021,915 | |
U/W Expenses: | $404,384 | |
U/W NOI(2): | $1,617,530 | |
U/W NCF: | $1,501,901 | |
U/W NOI DSCR: | 1.88x | |
U/W NCF DSCR: | 1.75x | |
U/W NOI Debt Yield: | 10.5% | |
U/W NCF Debt Yield: | 9.8% | |
As-Is Appraised Value(5): | $22,000,000 | |
As-Is Appraisal Valuation Date: | March 5, 2013 | |
Cut-off Date LTV Ratio: | 70.0% | |
LTV Ratio at Maturity or ARD: | 55.2% | |
| (1) | The Tenant Reserve relates to North Coast Logistics and represents the approximate amount of the tenant’s base rent and reimbursements through its rent commencement date of July 1, 2013. |
| (2) | The increases in historical occupancy and historical NOI are due to the lease up of the Industry West Commerce Center Properties after construction in 2008. The increase in U/W NOI is due to an increase in occupancy. The Industry West Commerce Center Properties averaged 79.7% occupancy in 2012 and were 100.0% physically occupied, as of February 26, 2013. |
| (3) | Occupancy shown represents year-end 2011. The average occupancy in 2011 was 60.6%. |
| (4) | Occupancy shown represents year-end 2012. The average occupancy in 2012 was 79.7%. |
| (5) | The appraised value shown represents the value of the Industry West Commerce Center Properties on one parcel. The appraisal also provided individual property values based on the hypothetical assumption that the Industry West Commerce Center Properties have been split into three separate parcels. The aggregate of the three property level appraised values is $22,350,000. |
The Industry West Commerce Center mortgage loan is evidenced by a single promissory note that is secured by a first mortgage encumbering three multi-tenant industrial warehouse properties located in Santa Rosa, California (the “Industry West Commerce Center Properties”). The Industry West Commerce Center Properties contain 193,337 square feet and were built in 2008. The Industry West Commerce Center Properties are located in Industry West Park, near the intersection of Todd Road and Highway 101. Industry West Park is comprised of more than 30 industrial buildings of various sizes and is served by the Northwest Pacific Railroad. As of February 26, 2013, the Industry West Commerce Center Properties were 100.0% occupied by 12 tenants.
THE INFORMATION IN THIS STRUCTURAL AND COLLATERAL TERM SHEET IS NOT COMPLETE AND MAY BE AMENDED PRIOR TO THE TIME OF SALE. THIS TERM SHEET IS NOT AN OFFER TO SELL THESE SECURITIES AND IT IS NOT A SOLICITATION OF AN OFFER TO BUY THESE SECURITIES IN ANY JURISDICTION WHERE THE OFFER OR SALE IS NOT PERMITTED.
104
INDUSTRY WEST COMMERCE CENTER
Sources and Uses
Sources | Uses | |||||||||||||||||||
Original loan amount | $ | 15,400,000 | 99.3 | % | Loan payoff | $ | 14,979,716 | 96.6 | % | |||||||||||
Sponsor’s new cash contribution | 111,873 | 0.7 | Reserves | 298,962 | 1.9 | |||||||||||||||
| Closing costs | 233,195 | 1.5 | ||||||||||||||||||
|
|
|
|
|
|
|
| |||||||||||||
Total Sources | $ | 15,511,873 | 100.0 | % | Total Uses | $ | 15,511,873 | 100.0 | % | |||||||||||
|
|
|
|
|
|
|
| |||||||||||||
The following table presents certain information relating to the Industry West Commerce Center Properties:
Property Name | Allocated Cut-off Date Principal Balance | % of Portfolio Cut-off Date Principal Balance | Current Occupancy | Year Built/ Renovated | Net Rentable Area (SF) | Appraised Value | ||||||||||||||||||
256 Sutton Place | $ | 9,215,000 | 59.8 | % | 100.0 | % | 2008/NAP | 116,864 | $ | 13,000,000 | ||||||||||||||
258 Sutton Place | $ | 4,005,000 | 26.0 | % | 100.0 | % | 2008/NAP | 49,873 | $ | 6,100,000 | ||||||||||||||
237 Todd Road | $ | 2,180,000 | 14.2 | % | 100.0 | % | 2008/NAP | 26,600 | $ | 3,250,000 | ||||||||||||||
|
|
|
|
|
|
|
|
|
| |||||||||||||||
Total/Weighted Average | $ | 15,400,000 | 100.0 | % | 100.0 | % | 193,337 | $ | 22,000,000 | (1) | ||||||||||||||
|
|
|
|
|
|
|
|
|
| |||||||||||||||
| (1) | The appraised value shown represents the value of the Industry West Commerce Center Properties on one parcel. The appraisal also provided individual property values based on the hypothetical assumption that the Industry West Commerce Center Properties have been split into three separate parcels. The aggregate of the three property level appraised values is $22,350,000. |
The following table presents certain information relating to the tenancies at the Industry West Commerce Center Properties:
Major Tenants
Tenant Name | Credit Rating (Fitch/Moody’s/ S&P)(1) | Tenant NRSF | % of NRSF | Annual U/W Base Rent PSF | Annual U/W Base Rent | % of Total Annual U/W Base Rent | Lease Expiration Date | |||||||||||||||||||
Major Tenants | ||||||||||||||||||||||||||
North Coast Logistics | NR/NR/NR | 24,060 | 12.4 | % | $ | 9.24 | $ | 222,320 | 11.9 | % | 4/30/2020 | |||||||||||||||
WorldPac | NR/NR/NR | 23,111 | 12.0 | % | $ | 9.32 | $ | 215,279 | 11.6 | % | 6/13/2017 | |||||||||||||||
J&B Aviation Services | NR/A1/A+ | 23,111 | 12.0 | % | $ | 9.22 | $ | 213,021 | 11.4 | % | 11/15/2014 | |||||||||||||||
Dal-Tile SSC West | BBB-/Ba1/BBB- | 20,750 | 10.7 | % | $ | 10.20 | $ | 211,650 | 11.4 | % | 9/30/2017 | |||||||||||||||
Superior Pool Products | NR/NR/NR | 20,750 | 10.7 | % | $ | 9.60 | $ | 199,200 | 10.7 | % | 9/30/2014 | |||||||||||||||
Mission Foods | NR/NR/NR | 15,906 | 8.2 | % | $ | 9.60 | $ | 152,698 | 8.2 | % | 8/31/2013 | |||||||||||||||
US Air Conditioning Distribution | NR/NR/NR | 15,906 | 8.2 | % | $ | 9.60 | $ | 152,698 | 8.2 | % | 11/30/2014 | |||||||||||||||
|
|
|
|
|
|
|
| |||||||||||||||||||
Total Major Tenants | 143,594 | 74.3 | % | $ | 9.52 | $ | 1,366,865 | 73.4 | % | |||||||||||||||||
Non-Major Tenants | 49,743 | 25.7 | % | $ | 9.94 | $ | 494,655 | 26.6 | % | |||||||||||||||||
|
|
|
|
|
|
|
| |||||||||||||||||||
Occupied Collateral Total | 193,337 | 100.0 | % | $ | 9.63 | $ | 1,861,520 | 100.0 | % | |||||||||||||||||
|
|
|
| |||||||||||||||||||||||
Vacant Space | 0 | 0.0 | % | |||||||||||||||||||||||
|
|
|
| |||||||||||||||||||||||
Collateral Total | 193,337 | 100.0 | % | |||||||||||||||||||||||
|
|
|
| |||||||||||||||||||||||
| (1) | Certain ratings are those of the parent company whether or not the parent guarantees the lease. |
THE INFORMATION IN THIS STRUCTURAL AND COLLATERAL TERM SHEET IS NOT COMPLETE AND MAY BE AMENDED PRIOR TO THE TIME OF SALE. THIS TERM SHEET IS NOT AN OFFER TO SELL THESE SECURITIES AND IT IS NOT A SOLICITATION OF AN OFFER TO BUY THESE SECURITIES IN ANY JURISDICTION WHERE THE OFFER OR SALE IS NOT PERMITTED.
105
INDUSTRY WEST COMMERCE CENTER
The following table presents certain information relating to the lease rollover schedule at the Industry West Commerce Center Properties:
Lease Expiration Schedule(1)
Year Ending December 31, | No. of | Cumulative | Cumulative | Annual U/W | ||||||||||||||||||||||||
| Leases | Expiring | % of Total | Expiring | % of Total | Annual U/W | Base Rent | ||||||||||||||||||||||
| Expiring | NRSF | NRSF | NRSF | NRSF | Base Rent | PSF | ||||||||||||||||||||||
MTM | 0 | 0 | 0.0 | % | 0 | 0.0 | % | $ | 0 | $ | 0.00 | |||||||||||||||||
2013 | 2 | 20,366 | 10.5 | % | 20,366 | 10.5 | % | $ | 195,514 | $ | 9.60 | |||||||||||||||||
2014 | 5 | 81,360 | 42.1 | % | 101,726 | 52.6 | % | $ | 775,120 | $ | 9.53 | |||||||||||||||||
2015 | 1 | 14,770 | 7.6 | % | 116,496 | 60.3 | % | $ | 150,654 | $ | 10.20 | |||||||||||||||||
2016 | 1 | 8,920 | 4.6 | % | 125,416 | 64.9 | % | $ | 90,984 | $ | 10.20 | |||||||||||||||||
2017 | 2 | 43,861 | 22.7 | % | 169,277 | 87.6 | % | $ | 426,929 | $ | 9.73 | |||||||||||||||||
2018 | 0 | 0 | 0.0 | % | 169,277 | 87.6 | % | $ | 0 | $ | 0.00 | |||||||||||||||||
2019 | 0 | 0 | 0.0 | % | 169,277 | 87.6 | % | $ | 0 | $ | 0.00 | |||||||||||||||||
2020 | 1 | 24,060 | 12.4 | % | 193,337 | 100.0 | % | $ | 222,320 | $ | 9.24 | |||||||||||||||||
2021 | 0 | 0 | 0.0 | % | 193,337 | 100.0 | % | $ | 0 | $ | 0.00 | |||||||||||||||||
2022 | 0 | 0 | 0.0 | % | 193,337 | 100.0 | % | $ | 0 | $ | 0.00 | |||||||||||||||||
2023 | 0 | 0 | 0.0 | % | 193,337 | 100.0 | % | $ | 0 | $ | 0.00 | |||||||||||||||||
Thereafter | 0 | 0 | 0.0 | % | 193,337 | 100.0 | % | $ | 0 | $ | 0.00 | |||||||||||||||||
Vacant | 0 | 0 | 0.0 | % | 193,337 | 100.0 | % | $ | 0 | $ | 0.00 | |||||||||||||||||
|
|
|
|
|
|
|
|
|
| |||||||||||||||||||
Total/Weighted Average | 12 | 193,337 | 100.0 | % | $ | 1,861,520 | $ | 9.63 | ||||||||||||||||||||
|
|
|
|
|
|
|
|
|
| |||||||||||||||||||
| (1) | Information obtained from the underwritten rent roll. |
The following table presents historical occupancy percentages at the Industry West Commerce Center Properties:
Historical Occupancy(1)
12/31/2010 | 12/31/2011 | 12/31/2012 | 2/26/2013 | |||
| 59.0% | 71.0%(2) | 88.0%(3) | 100.0% |
| (1) | Information obtained from the borrower. |
| (2) | Occupancy shown represents year-end 2011. The average occupancy in 2011 was 60.6%. |
| (3) | Occupancy shown represents year-end 2012. The average occupancy in 2012 was 79.7%. |
Operating History and Underwritten Net Cash Flow. The following table presents certain information relating to the historical operating performance and the Underwritten Net Cash Flow at the Industry West Commerce Center Properties:
Cash Flow Analysis
| 2010 | 2011 | 2012 | U/W(1) | U/W $ per SF | ||||||||||||||||
Base Rent | $ | 1,222,081 | $ | 1,229,910 | $ | 1,555,690 | $ | 1,861,520 | $ | 9.63 | ||||||||||
Grossed Up Vacant Space | 0 | 0 | 0 | 0 | 0.00 | |||||||||||||||
Total Reimbursables | 240,358 | 228,361 | 309,883 | 346,547 | 1.79 | |||||||||||||||
Other Income | 4,843 | 2,892 | 524 | 0 | 0.0 | |||||||||||||||
Less Vacancy & Credit Loss | 0 | 0 | 0 | (186,152 | ) | (0.96 | ) | |||||||||||||
|
|
|
|
|
|
|
|
|
| |||||||||||
Effective Gross Income | $ | 1,467,282 | $ | 1,461,163 | $ | 1,866,097 | $ | 2,021,915 | $ | 10.46 | ||||||||||
Total Operating Expenses | $ | 336,683 | $ | 346,929 | $ | 377,344 | $ | 404,384 | $ | 2.09 | ||||||||||
|
|
|
|
|
|
|
|
|
| |||||||||||
Net Operating Income | $ | 1,130,599 | $ | 1,114,234 | $ | 1,488,753 | $ | 1,617,530 | (2) | $ | 8.37 | |||||||||
TI/LC | 0 | 0 | 710,164 | (3) | 86,629 | 0.45 | ||||||||||||||
Capital Expenditures | 0 | 0 | 0 | 29,001 | 0.15 | |||||||||||||||
|
|
|
|
|
|
|
|
|
| |||||||||||
Net Cash Flow | $ | 1,130,599 | $ | 1,114,234 | $ | 778,589 | $ | 1,501,901 | $ | 7.77 | ||||||||||
NOI DSCR | 1.31 | x | 1.30 | x | 1.73 | x | 1.88 | x | ||||||||||||
NCF DSCR | 1.31 | x | 1.30 | x | 0.91 | x | 1.75 | x | ||||||||||||
NOI DY | 7.3 | % | 7.2 | % | 9.7 | % | 10.5 | % | ||||||||||||
NCF DY | 7.3 | % | 7.2 | % | 5.1 | % | 9.8 | % | ||||||||||||
| (1) | The underwritten economic vacancy is 10.0%. The Industry West Commerce Center Properties were 100.0% physically occupied as of February 26, 2013. |
| (2) | The increase in Net Operating Income from 2010 to 2012 is due to the lease up of the Industry West Commerce Properties following construction in 2008. The increase in U/W Net Operating Income is due to an increase in occupancy. The Industry West Commerce Properties averaged 79.7% occupancy in 2012 and were 100.0% physically occupied as of February 26, 2013. |
| (3) | The majority of this figure represents tenant improvement and leasing costs for J&B Aviation Services ($301,166) and WorldPac ($328,269). |
THE INFORMATION IN THIS STRUCTURAL AND COLLATERAL TERM SHEET IS NOT COMPLETE AND MAY BE AMENDED PRIOR TO THE TIME OF SALE. THIS TERM SHEET IS NOT AN OFFER TO SELL THESE SECURITIES AND IT IS NOT A SOLICITATION OF AN OFFER TO BUY THESE SECURITIES IN ANY JURISDICTION WHERE THE OFFER OR SALE IS NOT PERMITTED.
106
[THIS PAGE INTENTIONALLY LEFT BLANK.]
107
No. 13 – The Henry – Autograph Collection by Marriott
Loan Information
Mortgage Loan Seller: | Wells Fargo Bank, National Association | |
Credit Assessment | ||
(Fitch/Moody’s): | NR/NR | |
Original Principal Balance: | $14,500,000 | |
Cut-off Date Principal | ||
Balance: | $14,472,723 | |
% of Initial Pool Balance: | 1.7% | |
Loan Purpose: | Refinance | |
Borrower Name: | 2010 Dearborn Investment LLC | |
Sponsors: | Tae Woo Park; Charles K. Cho | |
Mortgage Rate: | 4.230% | |
Note Date: | March 18, 2013 | |
Anticipated Repayment Date: | NAP | |
Maturity Date: | April 1, 2018 | |
IO Period: | None | |
Loan Term (Original): | 60 months | |
Seasoning: | 1 month | |
Amortization Term (Original): | 300 months | |
Loan Amortization Type: | Amortizing Balloon | |
Interest Accrual Method: | Actual/360 | |
Call Protection: | L(25),D(31),O(4) | |
Lockbox Type: | Hard/Springing Cash Management | |
Additional Debt: | None | |
Additional Debt Type: | NAP |
Escrows and Reserves:
Type: | Initial | Monthly | Cap (If Any) | |||||||||
Taxes | $ | 187,104 | $ | 28,250 | NAP | |||||||
Insurance(1) | $ | 0 | Springing | NAP | ||||||||
FF&E | $ | 0 | $ | 55,282 | NAP | |||||||
Environmental | $ | 25,000 | $ | 0 | NAP | |||||||
Property Information
Single Asset/Portfolio: | Single Asset | |
Property Type: | Hospitality | |
Specific Property Type: | Full Service | |
Location: | Dearborn, MI | |
Size: | 308 rooms | |
Cut-off Date Principal | ||
Balance Per Room: | $46,989 | |
Year Built/Renovated: | 1989/2011 | |
Title Vesting: | Fee | |
Property Manager: | Self-managed | |
3rdMost Recent Occupancy (As of)(3): | 41.5% (12/31/2010) | |
2ndMost Recent Occupancy (As of)(3): | 52.1% (12/31/2011) | |
Most Recent Occupancy (As of): | 67.3% (12/31/2012) | |
Current Occupancy (As of): | 67.3% (1/31/2013) | |
| Underwriting and Financial Information: | ||
3rdMost Recent NOI (As of)(3): | $356,324 (12/31/2011) | |
2ndMost Recent NOI (As of): | $2,546,993 (12/31/2012) | |
Most Recent NOI (As of) | $2,612,930 (TTM 1/31/2013) | |
U/W Revenues: | $16,584,458 | |
U/W Expenses: | $14,040,619 | |
U/W NOI: | $2,543,839 | |
U/W NCF: | $1,880,461 | |
U/W NOI DSCR: | 2.70x | |
U/W NCF DSCR: | 2.00x | |
U/W NOI Debt Yield: | 17.6% | |
U/W NCF Debt Yield: | 13.0% | |
As-Is Appraised Value: | $36,300,000 | |
As-Is Appraisal Valuation Date: | January 30, 2013 | |
Cut-off Date LTV Ratio: | 39.9% | |
LTV Ratio at Maturity or ARD: | 35.1% | |
| (1) | Monthly insurance escrows are not required as long as no event of default has occurred and is continuing and the borrower provides satisfactory evidence that The Henry – Autograph Collection by Marriott Property is insured in accordance with the loan documents. |
| (2) | An upfront Environmental Insurance reserve equivalent to the deductible of the environmental insurance policy was required at closing. The policy from Zurich North America has an eight-year term and a $3,000,000 loss limit. |
| (3) | The Henry – Autograph Collection by Marriott Property underwent significant renovations in 2011 to bring The Henry – Autograph Collection by Marriott Property in-line with franchise requirements; as such, 2010 and 2011 occupancy and 2011 NOI do not reflect stabilized performance. |
The Henry – Autograph Collection by Marriott mortgage loan is evidenced by a single promissory note that is secured by a first mortgage encumbering a 308-room full service hotel located in Dearborn, Michigan (the “The Henry – Autograph Collection by Marriott Property”). The Henry – Autograph Collection by Marriott Property was originally built as a Ritz-Carlton Hotel in 1989 and was acquired and rebranded as The Henry – Autograph Collection by Marriott in June 2010. Since the acquisition of The Henry – Autograph Collection by Marriott Property, the borrower has spent approximately $7.0 million on renovations in order to adhere to franchise requirements of the Autograph Collection by Marriott flag. In addition, the loan agreement requires the borrower to spend $1,500,000 on capital expenditures at The Henry – Autograph Collection by Marriott Property by March 2015. The Henry – Autograph Collection by Marriott Property is located approximately 1.3 miles northwest of the Ford Motor Company’s World Headquarters and approximately three miles from both the AAA Michigan Headquarters and the Fairlane Town Center Shopping Mall. The Henry – Autograph Collection by Marriott Property was recently named “the Best Hotel in Michigan for 2013” by a third party report. The Henry – Autograph Collection by Marriott Property’s franchise agreement expires on June 2, 2030.
THE INFORMATION IN THIS STRUCTURAL AND COLLATERAL TERM SHEET IS NOT COMPLETE AND MAY BE AMENDED PRIOR TO THE TIME OF SALE. THIS TERM SHEET IS NOT AN OFFER TO SELL THESE SECURITIES AND IT IS NOT A SOLICITATION OF AN OFFER TO BUY THESE SECURITIES IN ANY JURISDICTION WHERE THE OFFER OR SALE IS NOT PERMITTED.
108
THE HENRY – AUTOGRAPH COLLECTION BY MARRIOTT
Sources and Uses
Sources | Uses | |||||||||||||||||
Original loan amount | $ | 14,500,000 | 100.0 | % | Loan payoff(1) | $ | 8,524,677 | 58.8 | % | |||||||||
| Reserves | 212,104 | 1.5 | ||||||||||||||||
| Closing costs | 168,836 | 1.2 | ||||||||||||||||
| Return of equity | 5,594,383 | 38.6 | ||||||||||||||||
|
|
|
|
|
|
|
| |||||||||||
Total Sources | $ | 14,500,000 | 100.0 | % | Total Uses | $ | 14,500,000 | 100.0 | % | |||||||||
|
|
|
|
|
|
|
| |||||||||||
| (1) | The mortgage loan proceeds were used to pay off existing debt on The Henry – Autograph Collection by Marriott Property, which was held by a sponsor-related entity. |
The following table presents certain information relating the historical performance of The Henry – Autograph Collection by Marriott Property compared to the performance of a competitive set of properties as provided by a third party hospitality report:
Subject and Market Historical Occupancy, ADR and RevPAR(1)(2)
| The Henry – Autograph Collection | ||||||||||||||||||||||||||||||||||||
| Competitive Set | by Marriott | Penetration Factor | ||||||||||||||||||||||||||||||||||
Year | Occupancy | ADR | RevPAR | Occupancy | ADR | RevPAR | Occupancy | ADR | RevPAR | |||||||||||||||||||||||||||
2/28/2013 TTM | 57.0 | % | $ | 127.10 | $ | 72.40 | 66.8 | % | $ | 124.48 | $ | 83.21 | 117.3 | % | 97.9 | % | 114.9 | % | ||||||||||||||||||
2/29/2012 TTM | 58.5 | % | $ | 120.88 | $ | 70.72 | 54.2 | % | $ | 114.98 | $ | 62.30 | 92.6 | % | 95.1 | % | 88.1 | % | ||||||||||||||||||
2/28/2011 TTM | 55.9 | % | $ | 117.75 | $ | 65.83 | 43.3 | % | $ | 117.85 | $ | 51.04 | 77.5 | % | 100.1 | % | 77.5 | % | ||||||||||||||||||
| (1) | Information obtained from a third party hospitality report dated March 19, 2013. |
| (2) | The Henry – Autograph Collection by Marriott Property underwent significant renovations in 2011 to bring The Henry – Autograph Collection by Marriott Property in-line with franchise requirements. 2011 occupancy, ADR and RevPAR are not reflective of stabilized performance. |
Operating History and Underwritten Net Cash Flow.The following table represents certain information relating to the historical operating performance and the Underwritten Net Cash Flow at The Henry – Autograph Collection by Marriott Property:
Cash Flow Analysis
| 2011(1) | 2012 | TTM 1/31/2013 | U/W | U/W $ per Room | ||||||||||||||||
Occupancy | 52.1 | % | 67.3 | % | 67.3 | % | 67.3 | % | ||||||||||||
ADR | $ | 114.25 | $ | 120.75 | $ | 122.78 | $ | 122.78 | ||||||||||||
RevPAR | $ | 59.48 | $ | 81.27 | $ | 82.61 | $ | 82.61 | ||||||||||||
Total Revenue | $ | 12,919,539 | $ | 16,368,354 | $ | 16,609,902 | $ | 16,584,458 | $ | 53,846 | ||||||||||
Total Department Expenses | 7,415,776 | 8,156,752 | 8,252,810 | 8,246,103 | 26,773 | |||||||||||||||
|
|
|
|
|
|
|
|
|
| |||||||||||
Gross Operating Profit | $ | 5,503,763 | $ | 8,211,602 | $ | 8,357,092 | $ | 8,338,355 | $ | 27,073 | ||||||||||
Total Undistributed Expenses | 4,850,193 | 5,311,850 | 5,383,223 | 5,374,976 | 17,451 | |||||||||||||||
|
|
|
|
|
|
|
|
|
| |||||||||||
Profit Before Fixed Charges | $ | 653,570 | $ | 2,899,751 | $ | 2,973,868 | $ | 2,963,379 | $ | 9,621 | ||||||||||
Total Fixed Charges | 297,246 | 352,759 | 360,938 | 419,540 | 1,362 | |||||||||||||||
|
|
|
|
|
|
|
|
|
| |||||||||||
Net Operating Income | $ | 356,324 | $ | 2,546,993 | $ | 2,612,930 | $ | 2,543,839 | $ | 8,259 | ||||||||||
FF&E | 516,782 | 654,734 | 664,396 | 663,378 | 2,154 | |||||||||||||||
|
|
|
|
|
|
|
|
|
| |||||||||||
Net Cash Flow | ($ | 160,458 | ) | $ | 1,892,259 | $ | 1,948,534 | $ | 1,880,461 | $ | 6,105 | |||||||||
NOI DSCR | 0.38 | x | 2.71 | x | 2.78 | x | 2.70 | x | ||||||||||||
NCF DSCR | (0.17 | x) | 2.01 | x | 2.07 | x | 2.00 | x | ||||||||||||
NOI DY | 2.5 | % | 17.6 | % | 18.1 | % | 17.6 | % | ||||||||||||
NCF DY | (1.1 | %) | 13.1 | % | 13.5 | % | 13.0 | % | ||||||||||||
| (1) | The Henry – Autograph Collection by Marriott Property underwent significant renovations in 2011 to bring The Henry – Autograph Collection by Marriott Property in-line with franchise requirements. 2011 cash flows are not reflective of stabilized performance. |
THE INFORMATION IN THIS STRUCTURAL AND COLLATERAL TERM SHEET IS NOT COMPLETE AND MAY BE AMENDED PRIOR TO THE TIME OF SALE. THIS TERM SHEET IS NOT AN OFFER TO SELL THESE SECURITIES AND IT IS NOT A SOLICITATION OF AN OFFER TO BUY THESE SECURITIES IN ANY JURISDICTION WHERE THE OFFER OR SALE IS NOT PERMITTED.
109
No. 14 – Merchants Exchange
Loan Information
| Mortgage Loan Seller: | Liberty Island Group I LLC | |
| Credit Assessment | ||
| (Fitch/Moody’s): | NR/NR | |
| Original Principal Balance: | $14,250,000 | |
| Cut-off Date Principal Balance: | $14,250,000 | |
| % of Initial Pool Balance: | 1.6% | |
| Loan Purpose: | Refinance | |
| Borrower Name: | Merchants Exchange, LLC | |
| Sponsor: | Samuel Engelman | |
| Mortgage Rate: | 4.060% | |
| Note Date: | April 5, 2013 | |
| Anticipated Repayment Date: | NAP | |
| Maturity Date: | May 1, 2023 | |
| IO Period: | None | |
| Loan Term (Original): | 120 months | |
| Seasoning: | 0 months | |
| Amortization Term (Original): | 360 months | |
| Loan Amortization Type: | Amortizing Balloon | |
| Interest Accrual Method: | Actual/360 | |
| Call Protection: | L(24),D(92),O(4) | |
| Lockbox Type: | None | |
| Additional Debt: | None | |
| Additional Debt Type: | NAP |
Escrows and Reserves:
Type: | Initial | Monthly | Cap (If Any) | |||||||||
Taxes | $ | 164,177 | $ | 18,242 | NAP | |||||||
Insurance | $ | 16,255 | $ | 1,478 | NAP | |||||||
Replacement Reserves | $ | 3,000 | $ | 3,000 | $ | 108,000 | ||||||
TI/LC Reserve(1) | $ | 6,250 | $ | 6,250 | $ | 150,000 | ||||||
Deferred Maintenance | ||||||||||||
Reserve(2) | $ | 135,166 | $ | 0 | NAP | |||||||
Property Information
| Single Asset/Portfolio: | Single Asset | |
| Property Type: | Retail | |
| Specific Property Type: | Anchored | |
| Location: | Marietta, GA | |
| Size: | 130,410 SF | |
| Cut-off Date Principal | ||
| Balance Per Unit/SF: | $109.27 | |
| Year Built/Renovated: | 1987/1997 | |
| Title Vesting: | Fee | |
| Property Manager: | Columbia Retail Management | |
| 3rdMost Recent Occupancy (As of): | 98.9% (12/31/2010) | |
| 2ndMost Recent Occupancy (As of): | 95.3% (12/31/2011) | |
| Most Recent Occupancy (As of): | 98.8% (12/31/2012) | |
| Current Occupancy (As of): | 100.0% (3/20/2013) | |
Underwriting and Financial Information: | ||
| 3rdMost Recent NOI (As of): | $1,601,801 (12/31/2010) | |
| 2ndMost Recent NOI (As of): | $1,603,644 (12/31/2011) | |
| Most Recent NOI (As of): | $1,614,004 (12/31/2012) | |
| U/W Revenues: | $2,045,785 | |
| U/W Expenses: | $466,676 | |
| U/W NOI: | $1,579,109 | |
| U/W NCF: | $1,426,411 | |
| U/W NOI DSCR: | 1.92x | |
| U/W NCF DSCR: | 1.73x | |
| U/W NOI Debt Yield: | 11.1% | |
| U/W NCF Debt Yield: | 10.0% | |
| As-Is Appraised Value: | $20,750,000 | |
| As-Is Appraisal Valuation Date: | February 1, 2013 | |
| Cut-off Date LTV Ratio: | 68.7% | |
| LTV Ratio at Maturity or ARD: | 54.7% | |
| (1) | The borrower was required to establish a leasing reserve at loan closing, into which monthly deposits of $6,250 per month will be made. Funds in the leasing reserve can be applied to future tenant improvement costs and leasing commissions, subject to any limitations and conditions specified in the loan documents. If at any time prior to 12 months from the LA Fitness lease expiration, the balance in the leasing reserve is greater than or equal to $150,000 (“Suspension Period”), then such monthly deposit will be waived. However, if LA Fitness has not renewed its lease 12 months prior to expiration, the Suspension Period will no longer be in effect and the monthly payment will increase to $40,000, while the cap will increase to $750,000. In addition, if LA Fitness gives notice of its intent to vacate on the renewal notice date, which is nine months prior to lease expiration, then monthly deposits will increase to $53,333, and continue until such time the account reaches $750,000. In the event the LA Fitness space is occupied and the new tenant is paying rent, and the DSCR is less than 1.60x, but not less than 1.50x, then such monthly deposits will be $23,000 and the minimum amount will be reduced to $425,000. If the DSCR is not less than 1.60x, then the Suspension Period and the monthly deposit of $6,250 will be reinstated. |
| (2) | The borrower was required to deposit $135,166 into a Deferred Maintenance Reserve at closing. The borrower must complete all immediate repairs identified in the engineering report on or before October 3, 2013, and provide the lender with satisfactory evidence that such work has been completed. |
The Merchants Exchange mortgage loan is evidenced by a single promissory note that is secured by a first mortgage encumbering a 130,410 square feet anchored retail property located in Marietta, Georgia (the “Merchants Exchange Property”). The Merchants Exchange mortgage loan was originated on April 5, 2013 by Prudential Mortgage Capital Company, LLC. The Merchants Exchange Property is anchored by LA Fitness and a free-standing single-story building occupied by Picture Show Movie Theater. The Merchants Exchange Property was built in 1987 and renovated in 1997. Parking at the Merchants Exchange Property is provided by 548 surface spaces, resulting in a parking ratio of 4.2 spaces per 1,000 square feet of rentable area. As of March 20, 2013, the Merchants Exchange Property was 100.0% leased to 19 tenants.
THE INFORMATION IN THIS STRUCTURAL AND COLLATERAL TERM SHEET IS NOT COMPLETE AND MAY BE AMENDED PRIOR TO THE TIME OF SALE. THIS TERM SHEET IS NOT AN OFFER TO SELL THESE SECURITIES AND IT IS NOT A SOLICITATION OF AN OFFER TO BUY THESE SECURITIES IN ANY JURISDICTION WHERE THE OFFER OR SALE IS NOT PERMITTED.
110
MERCHANTS EXCHANGE
Sources and Uses
Sources | Uses | |||||||||||||||||
Original loan amount | $ | 14,250,000 | 99.7 | % | Loan payoff | $ | 13,669,950 | 95.7 | % | |||||||||
Sponsor’s new cash contribution | 38,117 | 0.3 | Reserves | 324,847 | 2.3 | |||||||||||||
| Closing costs | 293,320 | 2.1 | ||||||||||||||||
|
|
|
|
|
|
|
| |||||||||||
Total Sources | $ | 14,288,117 | 100.0 | % | Total Uses | $ | 14,288,117 | 100.0 | % | |||||||||
|
|
|
|
|
|
|
| |||||||||||
The following table presents certain information relating to the tenancies at the Merchants Exchange Property:
Major Tenants
Tenant Name | Credit Rating (Fitch/Moody’s/ S&P) | Tenant NRSF | % of NRSF | Annual U/W Base Rent PSF | Annual U/W Base Rent | % of Total Annual U/W Base Rent | Sales PSF | Occupancy Cost | Lease Expiration Date | |||||||||||||||||||||||||
Major Tenants | ||||||||||||||||||||||||||||||||||
LA Fitness(1) | NR/NR/NR | 48,420 | 37.1 | % | $ | 17.56 | $ | 850,255 | 43.7 | % | NAV | NAV | 6/30/2017 | |||||||||||||||||||||
Picture Show Movie Theater | NR/NR/NR | 19,768 | 15.2 | % | $ | 10.00 | $ | 197,680 | 10.2 | % | (2) | 12.2 | % | 10/31/2020 | ||||||||||||||||||||
Casabella | NR/NR/NR | 13,004 | 10.0 | % | $ | 11.00 | $ | 143,044 | 7.3 | % | NAV | NAV | 9/30/2014 | |||||||||||||||||||||
Dance Stop Studios | NR/NR/NR | 12,785 | 9.8 | % | $ | 9.00 | $ | 115,065 | 5.9 | % | NAV | NAV | 5/31/2014 | |||||||||||||||||||||
Hancock Fabrics | NR/NR/NR | 8,400 | 6.4 | % | $ | 6.43 | $ | 54,012 | 2.8 | % | NAV | NAV | 1/31/2014 | |||||||||||||||||||||
|
|
|
|
|
|
|
| |||||||||||||||||||||||||||
Total Major Tenants | 102,377 | 78.5 | % | $ | 13.28 | $ | 1,360,056 | 69.9 | % | |||||||||||||||||||||||||
Non-Major Tenants | 28,033 | 21.5 | % | $ | 20.95 | $ | 587,351 | 31.1 | % | |||||||||||||||||||||||||
|
|
|
|
|
|
|
| |||||||||||||||||||||||||||
Occupied Collateral Total | 130,410 | 100.0 | % | $ | 14.93 | $ | 1,947,407 | 100.0 | % | |||||||||||||||||||||||||
|
|
|
| |||||||||||||||||||||||||||||||
Vacant Space | 0 | 0.0 | % | |||||||||||||||||||||||||||||||
|
|
|
| |||||||||||||||||||||||||||||||
Collateral Total | 130,410 | 100.0 | % | |||||||||||||||||||||||||||||||
|
|
|
| |||||||||||||||||||||||||||||||
| (1) | LA Fitness is currently subleasing its premises from Kroger through June 30, 2017 at a rental rate of $17.56 per square foot. LA Fitness has four, five-year extensions to renew upon 180 days at $21.30, $23.43, $25.77, $28.34 per square feet respectively. If LA Fitness elects to renew its lease after the original lease expiration on June 30, 2017, the lease becomes a direct lease between the borrower and LA Fitness, and Kroger is released from any liability under their initial lease. |
| (2) | Picture Show Movie Theater operates five screens at the Merchants Exchange Property and had 2012 sales per screen of $324,889. |
THE INFORMATION IN THIS STRUCTURAL AND COLLATERAL TERM SHEET IS NOT COMPLETE AND MAY BE AMENDED PRIOR TO THE TIME OF SALE. THIS TERM SHEET IS NOT AN OFFER TO SELL THESE SECURITIES AND IT IS NOT A SOLICITATION OF AN OFFER TO BUY THESE SECURITIES IN ANY JURISDICTION WHERE THE OFFER OR SALE IS NOT PERMITTED.
111
MERCHANTS EXCHANGE
The following table presents certain information relating to the lease rollover schedule at the Merchants Exchange Property:
Lease Expiration Schedule(1)(2)
Year Ending December 31, | Annual | |||||||||||||||||||||||||||
| U/W | ||||||||||||||||||||||||||||
| No. of | Annual | Base | ||||||||||||||||||||||||||
| Leases | Expiring | % of Total | Cumulative | Cumulative % | U/W Base | Rent | ||||||||||||||||||||||
| Expiring | NRSF | NRSF | Expiring NRSF | of Total NRSF | Rent | PSF | ||||||||||||||||||||||
MTM | 1 | 1,260 | 1.0 | % | 1,260 | 1.0 | % | $ | 26,460 | $ | 21.00 | |||||||||||||||||
2013 | 2 | 3,238 | 2.5 | % | 4,498 | 3.4 | % | $ | 75,554 | $ | 23.33 | |||||||||||||||||
2014 | 5 | 36,211 | 27.8 | % | 40,709 | 31.2 | % | $ | 358,874 | $ | 9.91 | |||||||||||||||||
2015 | 3 | 7,557 | 5.8 | % | 48,266 | 37.0 | % | $ | 127,664 | $ | 16.89 | |||||||||||||||||
2016 | 0 | 0 | 0.0 | % | 48,266 | 37.0 | % | $ | 0 | $ | 0.00 | |||||||||||||||||
2017 | 4 | 56,225 | 43.1 | % | 104,491 | 80.1 | % | $ | 1,001,108 | $ | 17.81 | |||||||||||||||||
2018 | 2 | 3,200 | 2.5 | % | 107,691 | 82.6 | % | $ | 70,800 | $ | 22.13 | |||||||||||||||||
2019 | 0 | 0 | 0.0 | % | 107,691 | 82.6 | % | $ | 0 | $ | 0.00 | |||||||||||||||||
2020 | 1 | 19,768 | 15.2 | % | 127,459 | 97.7 | % | $ | 197,680 | $ | 10.00 | |||||||||||||||||
2021 | 0 | 0 | 0.0 | % | 127,459 | 97.7 | % | $ | 0 | $ | 0.00 | |||||||||||||||||
2022 | 0 | 0 | 0.0 | % | 127,459 | 97.7 | % | $ | 0 | $ | 0.00 | |||||||||||||||||
2023 | 1 | 2,951 | 2.3 | % | 130,410 | 100.0 | % | $ | 89,268 | $ | 30.25 | |||||||||||||||||
Thereafter | 0 | 0 | 0.0 | % | 130,410 | 100.0 | % | $ | 0 | $ | 0.00 | |||||||||||||||||
Vacant | 0 | 0 | 0.0 | % | 130,410 | 100.0 | % | $ | 0 | $ | 0.00 | |||||||||||||||||
|
|
|
|
|
|
|
|
|
| |||||||||||||||||||
Total/Weighted Average | 19 | 130,410 | 100.0 | % | $ | 1,947,407 | $ | 14.93 | ||||||||||||||||||||
|
|
|
|
|
|
|
|
|
| |||||||||||||||||||
| (1) | Information was obtained from the underwritten rent roll. |
| (2) | Certain tenants may have lease termination options that are exercisable prior to the stated expiration date of the subject lease and that are not considered in the Lease Expiration Schedule. |
The following table presents historical occupancy percentages at the Merchants Exchange Property:
Historical Occupancy(1)
12/31/2010 | 12/31/2011 | 12/31/2012 | 3/20/2013 | |||
| 98.9% | 95.3% | 98.8% | 100.0% |
| (1) | Information obtained from borrower rent rolls. |
Operating History and Underwritten Net Cash Flow. The following table presents certain information relating to the Underwritten Net Cash Flow at the Merchants Exchange Property:
Cash Flow Analysis
| 2010 | 2011 | 2012 | U/W(1) | U/W $ per SF | ||||||||||||||||
Base Rent | $ | 1,768,552 | $ | 1,663,010 | $ | 1,745,202 | $ | 1,947,407 | $ | 14.93 | ||||||||||
Grossed Up Vacant Space | 0 | 0 | 0 | 0 | 0 | |||||||||||||||
Total Reimbursables | 247,021 | 304,731 | 301,527 | 325,712 | 2.50 | |||||||||||||||
Other Income | 53,634 | 0 | 0 | 0 | 0 | |||||||||||||||
Less Vacancy & Credit Loss | 0 | 0 | 0 | (227,334 | )(1) | (1.74 | ) | |||||||||||||
|
|
|
|
|
|
|
|
|
| |||||||||||
Effective Gross Income | $ | 2,069,207 | $ | 1,967,741 | $ | 2,046,729 | $ | 2,045,785 | $ | 15.69 | ||||||||||
Total Operating Expenses | $ | 467,406 | $ | 364,097 | $ | 432,725 | $ | 466,676 | $ | 3.58 | ||||||||||
|
|
|
|
|
|
|
|
|
| |||||||||||
Net Operating Income | $ | 1,601,801 | $ | 1,603,644 | $ | 1,614,004 | $ | 1,579,109 | $ | 12.11 | ||||||||||
TI/LC | 0 | 0 | 0 | 116,632 | 0.89 | |||||||||||||||
Capital Expenditures | 0 | 0 | 0 | 36,066 | 0.28 | |||||||||||||||
|
|
|
|
|
|
|
|
|
| |||||||||||
Net Cash Flow | $ | 1,601,801 | $ | 1,603,644 | $ | 1,614,004 | $ | 1,426,411 | $ | 10.94 | ||||||||||
NOI DSCR | 1.95 | x | 1.95 | x | 1.96 | x | 1.92 | x | ||||||||||||
NCF DSCR | 1.95 | x | 1.95 | x | 1.96 | x | 1.73 | x | ||||||||||||
NOI DY | 11.2 | % | 11.3 | % | 11.3 | % | 11.1 | % | ||||||||||||
NCF DY | 11.2 | % | 11.3 | % | 11.3 | % | 10.0 | % | ||||||||||||
| (1) | The underwritten vacancy is 10.0%. The Merchants Exchange Property was 100.0% occupied as of March 20, 2013. |
THE INFORMATION IN THIS STRUCTURAL AND COLLATERAL TERM SHEET IS NOT COMPLETE AND MAY BE AMENDED PRIOR TO THE TIME OF SALE. THIS TERM SHEET IS NOT AN OFFER TO SELL THESE SECURITIES AND IT IS NOT A SOLICITATION OF AN OFFER TO BUY THESE SECURITIES IN ANY JURISDICTION WHERE THE OFFER OR SALE IS NOT PERMITTED.
112
[THIS PAGE INTENTIONALLY LEFT BLANK.]
113
No. 15 – Hampton Inn & Suites – Atlanta
Loan Information
Mortgage Loan Seller: | Wells Fargo Bank, National Association | |
Credit Assessment | ||
(Fitch/Moody’s): | NR/NR | |
Original Principal Balance: | $13,600,000 | |
Cut-off Date Principal | ||
Balance: | $13,600,000 | |
% of Initial Pool Balance: | 1.6% | |
Loan Purpose: | Acquisition | |
Borrower Name: | CWI Atlanta Downtown Hotel, LLC | |
Sponsor: | Carey Watermark Investors | |
| Incorporated | ||
Mortgage Rate: | 4.120% | |
Note Date: | February 14, 2013 | |
Anticipated Repayment Date: | NAP | |
Maturity Date: | March 1, 2018 | |
IO Period: | 12 months | |
Loan Term (Original): | 60 months | |
Seasoning: | 2 months | |
Amortization Term (Original): | 300 months | |
Loan Amortization Type: | Interest-only, Amortizing Balloon | |
Interest Accrual Method: | Actual/360 | |
Call Protection: | L(26),D(30),O(4) | |
Lockbox Type: | Soft/Springing Cash Management | |
Additional Debt: | None | |
Additional Debt Type: | NAP |
Escrows and Reserves:
Type: | Initial | Monthly | Cap (If Any) | |||||||||
Taxes | $ | 86,411 | $ | 14,402 | NAP | |||||||
Insurance(1) | $ | 0 | Springing | NAP | ||||||||
FF&E(2) | $ | 0 | $ | 15,637 | NAP | |||||||
PIP Reserve(3) | $ | 174,673 | $ | 0 | NAP | |||||||
Property Information
| Single Asset/Portfolio: | Single Asset | |
| Property Type: | Hospitality | |
| Specific Property Type: | Limited Service | |
| Location: | Atlanta, GA | |
| Size: | 119 rooms | |
| Cut-off Date Principal | ||
| Balance Per Room: | $114,286 | |
| Year Built/Renovated: | 1928/2011 | |
| Title Vesting: | Fee | |
| Property Manager: | Crescent Hotels & Resorts, LLC | |
| 3rdMost Recent Occupancy (As of): | 60.1% (12/31/2009) | |
| 2ndMost Recent Occupancy (As of): | 68.5% (12/31/2010) | |
| Most Recent Occupancy (As of): | 63.3% (12/31/2011) | |
| Current Occupancy (As of): | 71.7% (12/31/2012) | |
Underwriting and Financial Information: | ||
| 3rdMost Recent NOI (As of): | $1,177,883 (12/31/2010) | |
| 2ndMost Recent NOI (As of): | $1,441,056 (12/31/2011) | |
| Most Recent NOI (As of): | $1,837,125 (12/31/2012) | |
| U/W Revenues: | $4,690,968 | |
| U/W Expenses: | $2,949,732 | |
| U/W NOI: | $1,741,237 | |
| U/W NCF: | $1,553,598 | |
| U/W NOI DSCR: | 2.00x | |
| U/W NCF DSCR: | 1.78x | |
| U/W NOI Debt Yield: | 12.8% | |
| U/W NCF Debt Yield: | 11.4% | |
| As-Is Appraised Value: | $20,300,000 | |
| As-Is Appraisal Valuation Date: | January 21, 2013 | |
| Cut-off Date LTV Ratio: | 67.0% | |
| LTV Ratio at Maturity or ARD: | 60.5% | |
| (1) | Monthly insurance escrows are not required as long as no event of default has occurred and is continuing and the borrower provides satisfactory evidence that the Hampton Inn & Suites – Atlanta Property is insured in accordance with the loan documents. |
| (2) | The FF&E reserve is equal to 4.0% of total revenue for the most recent calendar month ($15,637 estimate is based on U/W Revenues). |
| (3) | The initial PIP Reserve represents the estimated remaining cost of the Hampton Inn & Suites – Atlanta Property property improvement plan work. |
The Hampton Inn & Suites – Atlanta mortgage loan is evidenced by a single promissory note that is secured by a first mortgage encumbering an eight-story limited service hotel located in Atlanta, Georgia (the “Hampton Inn & Suites – Atlanta Property”). Situated in the core of Atlanta’s central business district, the Hampton Inn & Suites – Atlanta Property was constructed in 1928 and underwent a $2,000,000 ($16,807 per room) property improvement plan (“PIP”) in 2011. The Hampton Inn & Suites – Atlanta Property contains 119 guest rooms, which includes 42 king guest rooms, 21 double guest rooms, 49 suites and seven handicap accessible king guest rooms. Amenities at the Hampton Inn & Suites – Atlanta Property include an exercise room, business center, guest laundry, three meeting rooms, convenience shop and complimentary breakfast. The Hampton Inn & Suites – Atlanta Property is within walking distance to the Atlanta Merchandise Mart, Atlanta Apparel Mart, Georgia World Congress Center, Georgia Dome, Phillips Arena, Centennial Olympic Park, Georgia Aquarium and World of Coca-Cola museum. The franchise agreement at the Hampton Inn & Suites – Atlanta Property expires in June 2025.
THE INFORMATION IN THIS STRUCTURAL AND COLLATERAL TERM SHEET IS NOT COMPLETE AND MAY BE AMENDED PRIOR TO THE TIME OF SALE. THIS TERM SHEET IS NOT AN OFFER TO SELL THESE SECURITIES AND IT IS NOT A SOLICITATION OF AN OFFER TO BUY THESE SECURITIES IN ANY JURISDICTION WHERE THE OFFER OR SALE IS NOT PERMITTED.
114
HAMPTON INN & SUITES – ATLANTA
Sources and Uses
Sources | Uses | |||||||||||||||||||
Original loan amount | $ | 13,600,000 | 72.0 | % | Purchase price(1) | $ | 18,000,000 | 95.3 | % | |||||||||||
Sponsor’s new cash contribution | 5,278,753 | 28.0 | Reserves | 261,084 | 1.4 | |||||||||||||||
| Closing costs | 617,669 | 3.3 | ||||||||||||||||||
|
|
|
|
|
|
|
| |||||||||||||
Total Sources | $ | 18,878,753 | 100.0 | % | Total Uses | $ | 18,878,753 | 100.0 | % | |||||||||||
|
|
|
|
|
|
|
| |||||||||||||
| (1) | The purchase price shown represents an allocated purchase price of a five hotel portfolio. |
Operating History and Underwritten Net Cash Flow.The following table represents certain information relating to the historical operating performance and the Underwritten Net Cash Flow at the Hampton Inn & Suites – Atlanta Property:
Cash Flow Analysis
| 2010 | 2011 | 2012 | U/W | U/W $ per Room | ||||||||||||||||
Occupancy | 68.5 | % | 63.3 | %(1) | 71.7 | % | 71.7 | % | ||||||||||||
ADR | $ | 137.41 | $ | 127.46 | $ | 137.11 | $ | 137.11 | ||||||||||||
RevPAR | $ | 94.14 | $ | 80.62 | $ | 98.26 | $ | 98.26 | ||||||||||||
Total Revenue | $ | 2,640,808 | $ | 3,917,210 | $ | 4,690,968 | $ | 4,690,968 | $ | 39,420 | ||||||||||
Total Department Expenses | 493,521 | 854,508 | 984,882 | 984,753 | 8,275 | |||||||||||||||
|
|
|
|
|
|
|
|
|
| |||||||||||
Gross Operating Profit | $ | 2,147,287 | $ | 3,062,702 | $ | 3,706,086 | $ | 3,706,215 | $ | 31,145 | ||||||||||
Total Undistributed Expenses | 862,554 | 1,442,698 | 1,669,696 | 1,755,413 | 14,751 | |||||||||||||||
|
|
|
|
|
|
|
|
|
| |||||||||||
Profit Before Fixed Charges | $ | 1,284,733 | $ | 1,620,005 | $ | 2,036,390 | $ | 1,950,803 | $ | 16,393 | ||||||||||
Total Fixed Charges | 106,851 | 178,949 | 199,265 | 209,566 | 1,761 | |||||||||||||||
|
|
|
|
|
|
|
|
|
| |||||||||||
Net Operating Income | $ | 1,177,883 | $ | 1,441,056 | $ | 1,837,125 | $ | 1,741,237 | $ | 14,632 | ||||||||||
FF&E | 0 | 0 | 0 | 187,639 | 1,577 | |||||||||||||||
|
|
|
|
|
|
|
|
|
| |||||||||||
Net Cash Flow | $ | 1,177,883 | $ | 1,441,056 | $ | 1,837,125 | $ | 1,553,598 | $ | 13,055 | ||||||||||
NOI DSCR | 1.35 | x | 1.65 | x | 2.11 | x | 2.00 | x | ||||||||||||
NCF DSCR | 1.35 | x | 1.65 | x | 2.11 | x | 1.78 | x | ||||||||||||
NOI DY | 8.7 | % | 10.6 | % | 13.5 | % | 12.8 | % | ||||||||||||
NCF DY | 8.7 | % | 10.6 | % | 13.5 | % | 11.4 | % | ||||||||||||
| (1) | The decrease in Occupancy in 2011 was due to a $2,000,000 ($16,807 per room) PIP that was completed in 2011. |
The following table presents certain information relating to the Hampton Inn & Suites – Atlanta Property’s competitive set:
Subject and Market Historical Occupancy, ADR and RevPAR(1)
| Competitive Set | Hampton Inn & Suites - Atlanta | Penetration Factor | ||||||||||||||||||||||||||||||||||
Year | Occupancy | ADR | RevPAR | Occupancy | ADR | RevPAR | Occupancy | ADR | RevPAR | |||||||||||||||||||||||||||
1/31/2013 TTM | 69.3 | % | $ | 132.14 | $ | 91.52 | 72.3 | % | $ | 137.27 | $ | 99.28 | 104.4 | % | 103.9 | % | 108.5 | % | ||||||||||||||||||
1/31/2012 TTM | 67.3 | % | $ | 127.24 | $ | 85.64 | 63.3 | % | $ | 127.48 | $ | 80.65 | 94.0 | % | 100.2 | % | 94.2 | % | ||||||||||||||||||
1/31/2011 TTM | 69.0 | % | $ | 130.84 | $ | 90.33 | 68.6 | % | $ | 136.92 | $ | 93.91 | 99.3 | % | 104.6 | % | 104.0 | % | ||||||||||||||||||
| (1) | Information obtained from a third party hospitality research report dated February 20, 2013. |
THE INFORMATION IN THIS STRUCTURAL AND COLLATERAL TERM SHEET IS NOT COMPLETE AND MAY BE AMENDED PRIOR TO THE TIME OF SALE. THIS TERM SHEET IS NOT AN OFFER TO SELL THESE SECURITIES AND IT IS NOT A SOLICITATION OF AN OFFER TO BUY THESE SECURITIES IN ANY JURISDICTION WHERE THE OFFER OR SALE IS NOT PERMITTED.
115
| WFRBS Commercial Mortgage Trust 2013-C13 | Transaction Contact Information |
| VI. | Transaction Contact Information |
Questions regarding this Structural and Collateral Term Sheet may be directed to any of the following individuals:
RBS Securities Inc. | Wells Fargo Securities, LLC | |||||
Jeff Wilson - Trading | Tel. (203) 897-2900 | Brigid Mattingly | Tel. (312) 269-3062 | |||
| Fax (312) 658-0140 | ||||||
Adam Ansaldi | Tel. (203) 897-0881 | A.J. Sfarra | Tel. (212) 214-5613 | |||
| Fax (203) 873-3542 | Fax (212) 214-8970 | |||||
Jim Barnard | Tel. (203) 897-4417 | Alex Wong | Tel. (212) 214-5615 | |||
| Fax (203) 873-4310 | Fax (212) 214-8970 | |||||
THE INFORMATION IN THIS STRUCTURAL AND COLLATERAL TERM SHEET IS NOT COMPLETE AND MAY BE AMENDED PRIOR TO THE TIME OF SALE. THIS TERM SHEET IS NOT AN OFFER TO SELL THESE SECURITIES AND IT IS NOT A SOLICITATION OF AN OFFER TO BUY THESE SECURITIES IN ANY JURISDICTION WHERE THE OFFER OR SALE IS NOT PERMITTED.
116