June 30, 2018
THE MERGER FUND
WCM ALTERNATIVES:
EVENT-DRIVEN FUND
WCM ALTERNATIVES:
CREDIT EVENT FUND
DEAL COMPOSITION
The Merger Fund (Unaudited)
| Type of Buyer | | Deal Terms* |
| Strategic | 94.8% | | Cash | 40.5% |
| Financial | 5.2% | | Stock and Stub(1) | 27.4% |
| | | | Cash & Stock | 23.3% |
By Deal Type | | Cash & Collar | 5.4% |
| Friendly | 100.0% | | Cash & Stub | 2.0% |
| Hostile | —% | | Stock with Fixed Exchange Ratio | 1.3% |
| | | | Stock with Flexible | |
| | | | Exchange Ratio (Collar) | 0.1% |
| | | | Undetermined(2) | —% |
| * | Data expressed as a percentage of long common stock, corporate bonds and swap contract positions as of June 30, 2018. |
| 1 | “Stub” includes assets other than cash and stock (e.g., escrow notes). |
| 2 | The compensation is undetermined because the compensation to be received (e.g., stock, cash, escrow notes, other) will be determined at a later date, potentially at the option of the Fund’s investment adviser. |
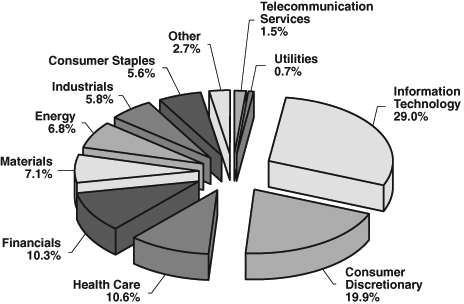
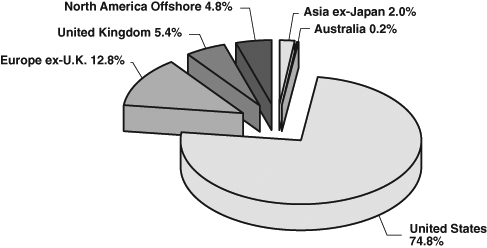
PORTFOLIO COMPOSITION*
The Merger Fund (Unaudited)
By Sector
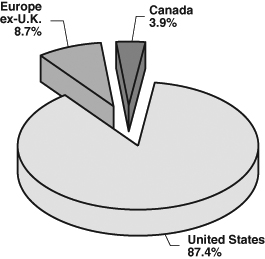
By Region
| * | Data expressed as a percentage of long common stock, corporate bonds and swap contract positions as of June 30, 2018. Data expressed excludes short-term investments, short investments, written options, forward currency exchange contracts and short total return swap contracts. Please refer to the Schedule of Investments, Schedule of Written Options, Schedule of Forward Currency Exchange Contracts and Schedule of Swap Contracts for more details on the Fund’s individual holdings. |
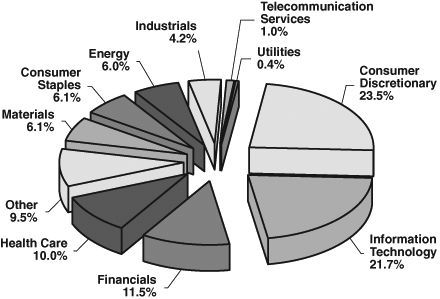
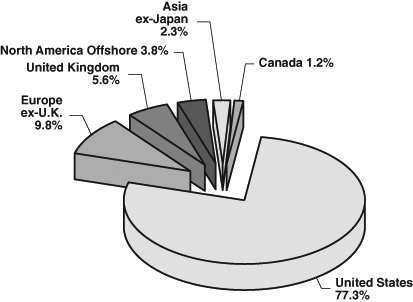
PORTFOLIO COMPOSITION*
WCM Alternatives: Event-Driven Fund (Unaudited)
By Sector
By Region
| * | Data expressed as a percentage of long common stock, corporate bonds and swap contract positions as of June 30, 2018. Data expressed excludes short-term investments, short investments, written options, forward currency exchange contracts and short total return swap contracts. Please refer to the Schedule of Investments, Schedule of Written Options, Schedule of Forward Currency Exchange Contracts and Schedule of Swap Contracts for more details on the Fund’s individual holdings. |
PORTFOLIO COMPOSITION*
WCM Alternatives: Credit Event Fund (Unaudited)
By Sector
By Region
| * | Data expressed as a percentage of long common stock, corporate bonds and swap contract positions as of June 30, 2018. Data expressed excludes short-term investments and short total return swap contracts. Please refer to the Schedule of Investments and Schedule of Swap Contracts for more details on the Fund’s individual holdings. |
The Global Industry Classification Standard (GICS®) was developed by and/or is the exclusive property of MSCI, Inc. and Standard & Poor’s Financial Services LLC (“S&P”). GICS is a service mark of MSCI and S&P and has been licensed for use by U.S. Bancorp Fund Services, LLC.
The Merger Fund and Westchester Capital Funds
EXPENSE EXAMPLE
June 30, 2018 (Unaudited)
As a shareholder of The Merger Fund, WCM Alternatives: Event-Driven Fund and/or WCM Alternatives: Credit Event Fund (the “Funds”), you incur two types of costs: (1) transaction costs and (2) ongoing costs, including management fees, and other Fund specific expenses. The expense example is intended to help a shareholder understand ongoing costs (in dollars) of investing in the Fund(s) and to compare these costs with the ongoing costs of investing in other mutual funds. The example is based on an investment of $1,000 invested at the beginning of the period and held for the most recent six-month period.
The Actual Expenses comparison provides information about actual account values and actual expenses. A shareholder may use the information in this line, together with the amount invested, to estimate the expenses paid over the period. A shareholder may divide his/her account value by $1,000 (e.g., an $8,600 account value divided by $1,000 = 8.6), then multiply the result by the number in the first line under the heading entitled “Expenses Paid During Period” to estimate the expenses paid on his/her account during this period. The example below includes, among other fees, management fees, fund accounting, custody and transfer agent fees. However, the example does not include portfolio trading commissions and related expenses or extraordinary expenses.
The Hypothetical Example for Comparison Purposes provides information about hypothetical account values and hypothetical expenses based on each Fund’s actual expense ratios and assumed rates of return of 5% per year before expenses, which are not the Fund’s actual returns. The hypothetical account values and expenses may not be used to estimate the actual ending account balance or expenses paid for the period. A shareholder may use this information to compare the ongoing costs of investing in the Funds and other funds. To do so, a shareholder would compare this 5% hypothetical example with the 5% hypothetical examples that appear in the shareholder reports of other funds.
The expenses shown in the table are meant to highlight your ongoing costs only and do not reflect any transactional costs, such as sales charges (loads), redemptions fees, or exchange fees. Therefore, the Hypothetical Example for Comparison Purposes is useful in comparing ongoing costs only, and will not help to determine the relevant total costs of owning different funds. In addition, if these transactional costs were included, shareholder costs would have been higher.
The Merger Fund and Westchester Capital Funds
EXPENSE EXAMPLE (continued)
June 30, 2018 (Unaudited)
| | Annualized | Beginning | Ending | Expenses Paid |
| | Net Expense | Account | Account | During Period |
| | Ratio | Value | Value | 1/1/18- |
| | 6/30/18 | 1/1/18 | 6/30/18 | 6/30/18(1) |
| The Merger Fund |
| Investor Class | | | | |
Actual Expenses(2)(3) | 1.97% | $1,000.00 | $1,057.70 | $10.05 |
| Hypothetical Example for | | | | |
| Comparison Purposes | | | | |
| (5% return before | | | | |
expenses)(3) | 1.97% | $1,000.00 | $1,015.03 | $9.84 |
| Institutional Class | | | | |
Actual Expenses(2)(3) | 1.66% | $1,000.00 | $1,058.70 | $8.47 |
| Hypothetical Example for | | | | |
| Comparison Purposes | | | | |
| (5% return before | | | | |
expenses)(3) | 1.66% | $1,000.00 | $1,016.56 | $8.30 |
| | | | | |
| | Annualized | Beginning | Ending | Expenses Paid |
| | Net Expense | Account | Account | During Period |
| | Ratio | Value | Value | 1/1/18- |
| | 6/30/18 | 1/1/18 | 6/30/18 | 6/30/18(1) |
| WCM Alternatives: Event-Driven Fund |
| Investor Class | | | | |
Actual Expenses(2)(4) | 2.54% | $1,000.00 | $1,050.20 | $12.91 |
| Hypothetical Example for | | | | |
| Comparison Purposes | | | | |
| (5% return before | | | | |
expenses)(4) | 2.54% | $1,000.00 | $1,012.20 | $12.67 |
| Institutional Class | | | | |
Actual Expenses(2)(4) | 2.29% | $1,000.00 | $1,052.10 | $11.65 |
| Hypothetical Example for | | | | |
| Comparison Purposes | | | | |
| (5% return before | | | | |
expenses)(4) | 2.29% | $1,000.00 | $1,013.44 | $11.43 |
The Merger Fund and Westchester Capital Funds
EXPENSE EXAMPLE (continued)
June 30, 2018 (Unaudited)
| | Annualized | Beginning | Ending | Expenses Paid |
| | Net Expense | Account | Account | During Period |
| | Ratio | Value | Value | 1/2/18- |
| | 6/30/18 | 1/2/18 | 6/30/18 | 6/30/18(1) |
| WCM Alternatives: Credit Event Fund |
| Investor Class | | | | |
Actual Expenses(2) | 1.89% | $1,000.00 | $1,000.00 | $9.32 |
| Hypothetical Example for | | | | |
| Comparison Purposes | | | | |
| (5% return before | | | | |
| expenses) | 1.89% | $1,000.00 | $1,015.34 | $9.39 |
| Institutional Class | | | | |
Actual Expenses(2) | 1.64% | $1,000.00 | $1,001.00 | $8.09 |
| Hypothetical Example for | | | | |
| Comparison Purposes | | | | |
| (5% return before | | | | |
| expenses) | 1.64% | $1,000.00 | $1,016.57 | $8.15 |
| (1) | Expenses are equal to the Fund’s annualized net expense ratio, multiplied by the average account value over the period, multiplied by 181/365 to reflect the one-half year period, with the exception of the WCM Alternatives: Credit Event Fund which is multiplied by the average account value over the period, multiplied by 180/365 to reflect the period from commencement of operations on January 2, 2018 through June 30, 2018. |
| (2) | Based on the actual returns of 5.77%, 5.87%, 5.02%, 5.21%, 0.00% and 0.10% for the six-month period ended June 30, 2018 for The Merger Fund Investor and Institutional Classes, WCM Alternatives: Event-Driven Fund Investor and Institutional Classes and WCM Alternatives: Credit Event Fund Investor and Institutional Classes, respectively. |
| (3) | Excluding dividends and interest on short positions and borrowing expense on securities sold short, your actual cost of investment and your hypothetical cost of investment would have been $7.60 and $7.45, respectively in the The Merger Fund Investor Class and $6.07 and $5.96, respectively in The Merger Fund Institutional Class. |
| (4) | Excluding dividends and interest on short positions and borrowing expense on securities sold short, your actual cost of investment and your hypothetical cost of investment would have been $10.12 and $9.94, respectively in WCM Alternatives: Event-Driven Fund Investor Class and $8.85 and $8.70, respectively in WCM Alternatives: Event-Driven Fund Institutional Class. |
The Merger Fund
SCHEDULE OF INVESTMENTS
June 30, 2018 (Unaudited)
| | | Shares | | | Value | |
| | | | | | | |
| LONG INVESTMENTS — 98.13% | | | | | | |
| | | | | | | |
| COMMON STOCKS — 58.08% | | | | | | |
| | | | | | | |
| AEROSPACE & DEFENSE — 4.68% | | | | | | |
| Rockwell Collins, Inc. (e) | | | 832,010 | | | $ | 112,055,107 | |
| United Technologies Corporation | | | 22,451 | | | | 2,807,048 | |
| | | | | | | | 114,862,155 | |
| | | | | | | | | |
| ALTERNATIVE CARRIERS — 0.11% | | | | | | | | |
| CenturyLink, Inc. (e) | | | 146,738 | | | | 2,735,196 | |
| | | | | | | | | |
| BEVERAGES — 1.76% | | | | | | | | |
| Dr Pepper Snapple Group, Inc. (e) | | | 352,882 | | | | 43,051,604 | |
| | | | | | | | | |
| BIOTECHNOLOGY — 1.30% | | | | | | | | |
| Shire plc — ADR | | | 189,157 | | | | 31,929,702 | |
| | | | | | | | | |
| BROADCASTING — 1.23% | | | | | | | | |
| Discovery Communications, Inc. Class C (a) | | | 199,782 | | | | 5,094,441 | |
| Tribune Media Company Class A | | | 657,872 | | | | 25,176,761 | |
| | | | | | | | 30,271,202 | |
| | | | | | | | | |
| DATA PROCESSING & | | | | | | | | |
| OUTSOURCED SERVICES — 0.02% | | | | | | | | |
| MoneyGram International, Inc. (a) | | | 55,563 | | | | 371,716 | |
| | | | | | | | | |
| DIVERSIFIED CHEMICALS — 3.74% | | | | | | | | |
| DowDuPont, Inc. (e) | | | 781,588 | | | | 51,522,281 | |
| Huntsman Corporation (e) | | | 1,379,969 | | | | 40,295,095 | |
| | | | | | | | 91,817,376 | |
| | | | | | | | | |
| DRUG RETAIL — 0.01% | | | | | | | | |
| Rite Aid Corporation (a)(e) | | | 125,668 | | | | 217,406 | |
| | | | | | | | | |
| ELECTRONIC EQUIPMENT | | | | | | | | |
| & INSTRUMENTS — 1.69% | | | | | | | | |
| Orbotech Ltd. (a)(b) | | | 670,900 | | | | 41,461,620 | |
| | | | | | | | | |
| HEALTH CARE EQUIPMENT — 0.48% | | | | | | | | |
| NxStage Medical, Inc. (a) | | | 425,694 | | | | 11,876,863 | |
| | | | | | | | | |
| HEALTH CARE SERVICES — 1.53% | | | | | | | | |
| Envision Healthcare Corporation (a) | | | 627,245 | | | | 27,605,052 | |
| Express Scripts Holding Company (a) | | | 127,675 | | | | 9,857,787 | |
| | | | | | | | 37,462,839 | |
| | | | | | | | | |
| HOTELS, RESORTS & CRUISE LINES — 1.81% | | | | | | | | |
| ILG, Inc. | | | 1,343,812 | | | | 44,386,110 | |
The accompanying notes are an integral part of these financial statements.
The Merger Fund
SCHEDULE OF INVESTMENTS (continued)
June 30, 2018 (Unaudited)
| | | Shares | | | Value | |
| | | | | | | |
| INTEGRATED TELECOMMUNICATION | | | | | | |
| SERVICES — 0.77% | | | | | | |
| AT&T, Inc. (e) | | | 588,309 | | | $ | 18,890,602 | |
| | | | | | | | | |
| MANAGED HEALTH CARE — 4.03% | | | | | | | | |
| Aetna, Inc. (e) | | | 538,896 | | | | 98,887,416 | |
| | | | | | | | | |
| MOVIES & ENTERTAINMENT — 7.94% | | | | | | | | |
| Twenty-First Century Fox, Inc. Class B (e) | | | 3,955,956 | | | | 194,909,952 | |
| | | | | | | | | |
| OIL & GAS REFINING | | | | | | | | |
| & MARKETING — 2.67% | | | | | | | | |
| Andeavor | | | 499,623 | | | | 65,540,545 | |
| | | | | | | | | |
| OIL & GAS STORAGE | | | | | | | | |
| & TRANSPORTATION — 2.43% | | | | | | | | |
| Columbia Pipeline Group, Inc. (a)(d)(g)(i) | | | 2,276,354 | | | | 59,526,361 | |
| | | | | | | | | |
| PACKAGED FOODS & MEATS — 1.93% | | | | | | | | |
| Pinnacle Foods, Inc. | | | 727,601 | | | | 47,337,721 | |
| | | | | | | | | |
| PAPER PRODUCTS — 0.31% | | | | | | | | |
| KapStone Paper and | | | | | | | | |
| Packaging Corporation (e) | | | 218,992 | | | | 7,555,224 | |
| | | | | | | | | |
| PROPERTY & CASUALTY INSURANCE — 3.20% | | | | | | | | |
| XL Group Ltd. (b) | | | 1,405,110 | | | | 78,615,905 | |
| | | | | | | | | |
| REINSURANCE — 0.97% | | | | | | | | |
| Validus Holdings Ltd. (b) | | | 352,190 | | | | 23,808,044 | |
| | | | | | | | | |
| REITs — 4.24% | | | | | | | | |
| Gateway Lifestyle Holdings Pty Ltd. (b) | | | 984,664 | | | | 1,697,873 | |
| GGP, Inc. | | | 2,517,067 | | | | 51,423,679 | |
| Gramercy Property Trust | | | 1,813,882 | | | | 49,555,256 | |
| MTGE Investment Corporation | | | 63,652 | | | | 1,247,579 | |
| | | | | | | | 103,924,387 | |
| | | | | | | | | |
| SEMICONDUCTORS — 9.03% | | | | | | | | |
| Cavium, Inc. (a)(e) | | | 285,731 | | | | 24,715,732 | |
| NXP Semiconductors NV (a)(b)(e) | | | 1,800,861 | | | | 196,780,081 | |
| | | | | | | | 221,495,813 | |
| | | | | | | | | |
| SPECIAL PURPOSE | | | | | | | | |
| ACQUISITION COMPANIES — 2.20% | | | | | | | | |
| Avista Healthcare Public Acquisition | | | | | | | | |
| Corporation Class A (a)(b)(f) | | | 662,154 | | | | 6,638,094 | |
| Black Ridge Acquisition Corporation (a)(f) | | | 286,249 | | | | 2,799,515 | |
The accompanying notes are an integral part of these financial statements.
The Merger Fund
SCHEDULE OF INVESTMENTS (continued)
June 30, 2018 (Unaudited)
| | | Shares | | | Value | |
| Federal Street | | | | | | |
| Acquisition Corporation (a)(f) | | | 128,720 | | | $ | 1,262,100 | |
| FinTech Acquisition Corporation II (a) | | | 142,251 | | | | 1,422,510 | |
| Hennessy Capital Acquisition | | | | | | | | |
| Corporation III (a) | | | 162,728 | | | | 1,650,062 | |
| Industrea Acquisition | | | | | | | | |
| Corporation Class A (a) | | | 63,316 | | | | 624,302 | |
| Kayne Anderson Acquisition | | | | | | | | |
| Corporation Class A (a)(f) | | | 514,748 | | | | 5,090,858 | |
| Modern Media Acquisition | | | | | | | | |
| Corporation (a) | | | 477,700 | | | | 4,767,446 | |
| Mudrick Capital Acquisition | | | | | | | | |
| Corporation (a) | | | 428,413 | | | | 4,378,552 | |
| Pensare Acquisition Corporation (a) | | | 708,822 | | | | 7,010,250 | |
| Pure Acquisition Corporation (a) | | | 687,661 | | | | 7,048,525 | |
| Thunder Bridge Acquisition Ltd. (a)(b) | | | 338,801 | | | | 3,399,258 | |
| Tiberius Acquisition Corporation (a) | | | 311,172 | | | | 3,133,502 | |
| Twelve Seas Investment Company (a)(b) | | | 467,667 | | | | 4,704,730 | |
| | | | | | | | 53,929,704 | |
| TOTAL COMMON STOCKS | | | | | | | | |
| (Cost $1,401,271,937) | | | | | | | 1,424,865,463 | |
| | | | | | | | | |
| | | | | | | | | |
| PRIVATE INVESTMENT | | | | | | | | |
| IN PUBLIC EQUITY — 0.13% | | | | | | | | |
| ConvergeOne Holdings, Inc. | | | 328,515 | | | | 3,084,756 | |
| TOTAL PRIVATE INVESTMENT | | | | | | | | |
| IN PUBLIC EQUITY (Cost $2,628,120) | | | | | | | 3,084,756 | |
| | | | | | | | | |
| CLOSED-END FUNDS — 12.03% (a)(e) | | | | | | | | |
| Altaba, Inc. | | | 4,032,090 | | | | 295,189,309 | |
| TOTAL CLOSED-END FUNDS | | | | | | | | |
| (Cost $202,956,047) | | | | | | | 295,189,309 | |
| | | | | | | | | |
| | | | | | | | | |
| PREFERRED STOCKS — 0.15% | | | | | | | | |
| Colony Capital, Inc., 8.750%, Series E | | | 18,334 | | | | 475,584 | |
| NuStar Logistics LP, 9.082% (3 Month | | | | | | | | |
| LIBOR + 6.734%), 1/15/2043 (j) | | | 127,189 | | | | 3,225,513 | |
| TOTAL PREFERRED STOCKS | | | | | | | | |
| (Cost $3,680,186) | | | | | | | 3,701,097 | |
The accompanying notes are an integral part of these financial statements.
The Merger Fund
SCHEDULE OF INVESTMENTS (continued)
June 30, 2018 (Unaudited)
| | | Shares | | | Value | |
| | | | | | | |
| CONTINGENT VALUE | | | | | | |
| RIGHTS — 0.00% (a)(e)(g) | | | | | | |
| Media General, Inc. | | | 891,153 | | | $ | 26,735 | |
| TOTAL CONTINGENT VALUE RIGHTS | | | | | | | | |
| (Cost $0) | | | | | | | 26,735 | |
| | | | | | | | | |
| | | | | | | | | |
| RIGHTS — 0.03% (a)(f) | | | | | | | | |
| Black Ridge Acquisition Corporation | | | 286,249 | | | | 93,031 | |
| Modern Media Acquisition Corporation | | | 477,700 | | | | 248,404 | |
| Pensare Acquisition Corporation | | | 708,822 | | | | 347,323 | |
| TOTAL RIGHTS (Cost $589,350) | | | | | | | 688,758 | |
| | | | | | | | | |
| | | | | | | | | |
| WARRANTS — 0.03% (a)(f) | | | | | | | | |
| Black Ridge Acquisition Corporation | | | 286,249 | | | | 100,187 | |
| ConvergeOne Holdings, Inc. | | | 142,444 | | | | 195,148 | |
| Federal Street Acquisition Corporation | | | 64,360 | | | | 82,059 | |
| Modern Media Acquisition Corporation | | | 238,850 | | | | 155,252 | |
| Pensare Acquisition Corporation | | | 354,411 | | | | 226,823 | |
| TOTAL WARRANTS (Cost $477,579) | | | | | | | 759,469 | |
| | | | | | | | | |
| | | Principal | | | | | |
| | | Amount | | | | | |
| | | | | | | | | |
| CORPORATE BONDS — 7.42% (f) | | | | | | | | |
| BMC Software Finance, Inc. | | | | | | | | |
| 8.125%, 7/15/2021 (h) | | $ | 9,845,000 | | | | 10,078,819 | |
| Dynegy, Inc. | | | | | | | | |
| 5.875%, 6/1/2023 | | | 15,354,000 | | | | 15,872,197 | |
| Envision Healthcare Corporation | | | | | | | | |
| 5.625%, 7/15/2022 | | | 23,689,000 | | | | 24,207,197 | |
| 6.250%, 12/1/2024 (h) | | | 8,746,000 | | | | 9,358,220 | |
| Kindred Healthcare LLC | | | | | | | | |
| 6.375%, 4/15/2022 | | | 6,198,000 | | | | 6,414,930 | |
| Momentive Performance Materials, Inc. | | | | | | | | |
| 3.880%, 10/24/2021 | | | 22,497,000 | | | | 23,678,092 | |
| Nationstar Mortgage LLC / | | | | | | | | |
| Nationstar Capital Corporation | | | | | | | | |
| 6.500%, 7/1/2021 | | | 2,935,000 | | | | 2,934,120 | |
| 6.500%, 6/1/2022 | | | 1,939,000 | | | | 1,928,093 | |
| Rent-A-Center, Inc. | | | | | | | | |
| 6.625%, 11/15/2020 | | | 7,517,000 | | | | 7,563,981 | |
| 4.750%, 5/1/2021 | | | 10,032,000 | | | | 10,082,160 | |
The accompanying notes are an integral part of these financial statements.
The Merger Fund
SCHEDULE OF INVESTMENTS (continued)
June 30, 2018 (Unaudited)
| | | Principal | | | | |
| | | Amount | | | Value | |
| Rite Aid Corporation | | | | | | |
| 6.125%, 4/1/2023 (h) | | $ | 10,019,000 | | | $ | 10,171,790 | |
| Spectrum Brands Holdings, Inc. | | | | | | | | |
| 7.750%, 1/15/2022 | | | 16,785,000 | | | | 17,288,550 | |
| T-Mobile USA, Inc. | | | | | | | | |
| 6.500%, 1/15/2024 | | | 9,842,000 | | | | 10,265,797 | |
| Tribune Media Company | | | | | | | | |
| 5.875%, 7/15/2022 | | | 2,033,000 | | | | 2,061,970 | |
| Unitymedia GmbH | | | | | | | | |
| 6.125%, 1/15/2025 (b)(h) | | | 14,621,000 | | | | 15,132,735 | |
| Unitymedia Hessen GmbH & | | | | | | | | |
| Company KG / Unitymedia NRW GmbH | | | | | | | | |
| 5.000%, 1/15/2025 (b)(h) | | | 7,192,000 | | | | 7,317,860 | |
| Xerium Technologies, Inc. | | | | | | | | |
| 9.500%, 8/15/2021 | | | 7,268,000 | | | | 7,676,825 | |
| TOTAL CORPORATE BONDS | | | | | | | | |
| (Cost $181,866,972) | | | | | | | 182,033,336 | |
| | | Contracts | | | | | | | |
| | | (100 shares per | | | Notional | | | | |
| | | contract) | | | Amount | | | | |
| | | | | | | | | | |
| PURCHASED CALL OPTIONS — 0.00% | | | | | | | | | |
| SPDR S&P 500 ETF Trust | | | | | | | | | |
| Expiration: July 2018, | | | | | | | | | |
| Exercise Price: $280.00 | | | 1,271 | | | $ | 34,479,688 | | | | 31,775 | |
| | | | | | | | | | | | 31,775 | |
| PURCHASED PUT OPTIONS — 0.26% | | | | | | | | | | | | |
| Conagra Brands, Inc. | | | | | | | | | | | | |
| Expiration: September 2018, | | | | | | | | | | | | |
| Exercise Price: $31.00 | | | 2,918 | | | | 10,426,014 | | | | 70,032 | |
| DowDuPont, Inc. | | | | | | | | | | | | |
| Expiration: August 2018, | | | | | | | | | | | | |
| Exercise Price: $62.50 | | | 6,251 | | | | 41,206,592 | | | | 690,735 | |
| Expiration: August 2018, | | | | | | | | | | | | |
| Exercise Price: $65.00 | | | 781 | | | | 5,148,352 | | | | 147,609 | |
| Huntsman Corporation | | | | | | | | | | | | |
| Expiration: August 2018, | | | | | | | | | | | | |
| Exercise Price: $29.00 | | | 13,339 | | | | 438,949,880 | | | | 1,734,070 | |
The accompanying notes are an integral part of these financial statements.
The Merger Fund
SCHEDULE OF INVESTMENTS (continued)
June 30, 2018 (Unaudited)
| | | Contracts | | | | | | | |
| | | (100 shares per | | | Notional | | | | |
| | | contract) | | | Amount | | | Value | |
| SPDR S&P 500 ETF Trust | | | | | | | | | |
| Expiration: July 2018, | | | | | | | | | |
| Exercise Price: $272.00 | | | 849 | | | $ | 23,031,672 | | | $ | 290,358 | |
| Expiration: July 2018, | | | | | | | | | | | | |
| Exercise Price: $274.00 | | | 1,270 | | | | 34,452,560 | | | | 550,545 | |
| Expiration: July 2018, | | | | | | | | | | | | |
| Exercise Price: $277.00 | | | 1,480 | | | | 40,149,440 | | | | 923,520 | |
| Expiration: August 2018, | | | | | | | | | | | | |
| Exercise Price: $270.00 | | | 2,117 | | | | 57,429,976 | | | | 897,608 | |
| United Technologies Corporation | | | | | | | | | | | | |
| Expiration: August 2018, | | | | | | | | | | | | |
| Exercise Price: $105.00 | | | 1,170 | | | | 14,628,510 | | | | 28,080 | |
| Expiration: September 2018, | | | | | | | | | | | | |
| Exercise Price: $105.00 | | | 1,425 | | | | 17,816,775 | | | | 74,100 | |
| VanEck Vectors Semiconductor ETF | | | | | | | | | | | | |
| Expiration: July 2018, | | | | | | | | | | | | |
| Exercise Price: $104.00 | | | 2,109 | | | | 21,653,103 | | | | 645,354 | |
| The Walt Disney Company | | | | | | | | | | | | |
| Expiration: January 2019, | | | | | | | | | | | | |
| Exercise Price: $95.00 | | | 1,709 | | | | 17,912,029 | | | | 434,086 | |
| | | | | | | | | | | | 6,486,097 | |
| TOTAL PURCHASED OPTIONS | | | | | | | | | | | | |
| (Cost $4,996,796) | | | | | | | | | | | 6,517,872 | |
| | | Principal | | | | |
| | | Amount | | | | |
| ESCROW NOTES — 0.07% (a)(d)(g) | | | | | | |
| AMR Corporation | | $ | 1,243,406 | | | | 1,616,428 | |
| T-Mobile USA, Inc. | | | 7,594,000 | | | | — | |
| TOTAL ESCROW NOTES (Cost $679,555) | | | | | | | 1,616,428 | |
| | | | | | | | | |
| | | Shares | | | | | |
| | | | | | | | | |
| SHORT-TERM INVESTMENTS — 19.93% | | | | | | | | |
| | | | | | | | | |
| MONEY MARKET FUNDS — 18.56% (c) | | | | | | | | |
| First American Government Obligations | | | | | | | | |
| Fund, Institutional Share Class, 1.77% | | | 59,120,757 | | | | 59,120,757 | |
| The Government & Agency Portfolio, | | | | | | | | |
| Institutional Share Class, 1.80% | | | 119,806,437 | | | | 119,806,437 | |
The accompanying notes are an integral part of these financial statements.
The Merger Fund
SCHEDULE OF INVESTMENTS (continued)
June 30, 2018 (Unaudited)
| | | Shares | | | Value | |
| JPMorgan Prime Money Market Fund, | | | | | | |
| Institutional Share Class, 2.08% | | | 36,527,694 | | | $ | 36,538,558 | |
| JPMorgan U.S. Government Money | | | | | | | | |
| Market Fund, Institutional | | | | | | | | |
| Share Class, 1.82% | | | 119,975,000 | | | | 119,975,000 | |
| Morgan Stanley Institutional Liquidity | | | | | | | | |
| Fund — Government Portfolio, | | | | | | | | |
| Institutional Share Class, 1.81% | | | 119,975,000 | | | | 119,975,000 | |
| | | | | | | | 455,415,752 | |
| | | | | | | | |
| | | Principal | | | | | |
| | | Amount | | | | | |
| U.S. TREASURY BILLS — 1.37% (e)(f) | | | | | | | | |
| United States Treasury Bills | | | | | | | | |
| 1.84%, 9/20/2018 | | $ | 1,600,000 | | | | 1,593,342 | |
| 1.84%, 9/27/2018 | | | 1,300,000 | | | | 1,294,086 | |
| 1.90%, 10/11/2018 | | | 300,000 | | | | 298,380 | |
| 1.94%, 10/18/2018 | | | 1,600,000 | | | | 1,590,712 | |
| 1.93%, 10/25/2018 | | | 11,700,000 | | | | 11,627,586 | |
| 1.96%, 11/8/2018 | | | 8,400,000 | | | | 8,340,251 | |
| 2.02%, 11/29/2018 | | | 8,600,000 | | | | 8,527,438 | |
| 2.03%, 12/6/2018 | | | 300,000 | | | | 297,352 | |
| | | | | | | | 33,569,147 | |
| TOTAL SHORT-TERM INVESTMENTS | | | | | | | | |
| (Cost $488,986,771) | | | | | | | 488,984,899 | |
| TOTAL LONG INVESTMENTS | | | | | | | | |
| (Cost $2,288,133,313) — 98.13% | | | | | | | 2,407,468,122 | |
| | | | | | | | | |
| | | Shares | | | | | |
| | | | | | | | | |
| SHORT INVESTMENTS — (18.25)% | | | | | | | | |
| | | | | | | | | |
| COMMON STOCKS — (18.25)% | | | | | | | | |
| | | | | | | | | |
| AIRLINES — (0.10)% | | | | | | | | |
| American Airlines Group, Inc. | | | (65,211 | ) | | | (2,475,410 | ) |
| | | | | | | | | |
| BROADCASTING — (0.42)% | | | | | | | | |
| Discovery Communications, Inc. Class A | | | (199,783 | ) | | | (5,494,033 | ) |
| Sinclair Broadcast Group, Inc. Class A | | | (151,388 | ) | | | (4,867,124 | ) |
| | | | | | | | (10,361,157 | ) |
| | | | | | | | | |
| DRUG RETAIL — (1.17)% | | | | | | | | |
| CVS Health Corporation | | | (447,459 | ) | | | (28,793,987 | ) |
The accompanying notes are an integral part of these financial statements.
The Merger Fund
SCHEDULE OF INVESTMENTS (continued)
June 30, 2018 (Unaudited)
| | | Shares | | | Value | |
| | | | | | | |
| HOTELS, RESORTS & | | | | | | |
| CRUISE LINES — (0.80)% | | | | | | |
| Marriott Vacations | | | | | | |
| Worldwide Corporation | | | (172,966 | ) | | $ | (19,538,239 | ) |
| | | | | | | | | |
| INDUSTRIAL GASES — (0.13)% | | | | | | | | |
| Praxair, Inc. (f) | | | (19,619 | ) | | | (3,124,620 | ) |
| | | | | | | | | |
| INTERNET SOFTWARE | | | | | | | | |
| & SERVICES — (10.37)% | | | | | | | | |
| Alibaba Group Holding Ltd. — ADR | | | (1,370,768 | ) | | | (254,318,587 | ) |
| | | | | | | | | |
| MANAGED HEALTH CARE — (0.22)% | | | | | | | | |
| Cigna Corporation | | | (31,076 | ) | | | (5,281,366 | ) |
| | | | | | | | | |
| MOVIES & ENTERTAINMENT — (0.86)% | | | | | | | | |
| The Walt Disney Company | | | (201,173 | ) | | | (21,084,942 | ) |
| | | | | | | | | |
| OIL & GAS REFINING | | | | | | | | |
| & MARKETING — (2.27)% | | | | | | | | |
| Marathon Petroleum Corporation | | | (794,150 | ) | | | (55,717,564 | ) |
| | | | | | | | | |
| PACKAGED FOODS & MEATS — (0.26)% | | | | | | | | |
| Conagra Brands, Inc. | | | (180,750 | ) | | | (6,458,198 | ) |
| | | | | | | | | |
| REITs — (0.41)% | | | | | | | | |
| Annaly Capital Management, Inc. | | | (60,522 | ) | | | (622,771 | ) |
| Brookfield Property Partners LP (b) | | | (497,186 | ) | | | (9,456,478 | ) |
| | | | | | | | (10,079,249 | ) |
| | | | | | | | | |
| SEMICONDUCTORS — (1.24)% | | | | | | | | |
| KLA-Tenor Corporation | | | (167,725 | ) | | | (17,196,844 | ) |
| Marvell Technology Group Ltd. (b) | | | (622,223 | ) | | | (13,340,461 | ) |
| | | | | | | | (30,537,305 | ) |
| | | | | | | | | |
| TOTAL COMMON STOCKS | | | | | | | | |
| (Proceeds $343,657,214) | | | | | | | (447,770,624 | ) |
| TOTAL SHORT INVESTMENTS | | | | | | | | |
| (Proceeds $343,657,214) — (18.25)% | | | | | | | (447,770,624 | ) |
| TOTAL NET INVESTMENTS | | | | | | | | |
| (Cost $1,944,476,099) — 79.88% | | | | | | | 1,959,697,498 | |
| OTHER ASSETS IN EXCESS | | | | | | | | |
| OF LIABILITIES — 20.12% | | | | | | | 493,590,227 | |
| TOTAL NET ASSETS — 100.00% | | | | | | $ | 2,453,287,725 | |
The accompanying notes are an integral part of these financial statements.
The Merger Fund
SCHEDULE OF INVESTMENTS (continued)
June 30, 2018 (Unaudited)
ADR – American Depository Receipt
ETF – Exchange-Traded Fund
LIBOR – London Interbank Offered Rate
plc – Public Limited Company
REITs – Real Estate Investment Trusts
| (a) | Non-income producing security. |
| (b) | Foreign security. |
| (c) | The rate quoted is the annualized seven-day yield as of June 30, 2018. |
| (d) | Security fair valued by the Valuation Group in good faith in accordance with the policies adopted by the Board of Trustees. |
| (e) | All or a portion of the shares have been committed as collateral for open securities sold short, written option contracts, swap contracts, and forward currency exchange contracts. |
| (f) | Level 2 Security. Please see Note 2 in the Notes to the Financial Statements for more information. |
| (g) | Level 3 Security. Please see Note 2 in the Notes to the Financial Statement for more information. |
| (h) | Security exempt from registration under Rule 144A of the Securities Act of 1933. These securities may be resold in transactions exempt from registration normally to qualified institutional buyers. As of June 30, 2018, these securities represent 2.12% of total net assets. |
| (i) | Restricted security. The Fund may own investment securities that have other legal or contractual limitations, and thus are restricted as to resale. These securities are valued by the Valuation Group under the supervision of the Board of Trustees. As of June 30, 2018, this common stock had a cost of $57,736,820 and its market value represented 2.43% of total net assets. The Fund’s adviser perfected its appraisal rights over this security as of 6/20/2016. Please see Note 2 in the Notes to the Financial Statements for more information. |
| (j) | The coupon rate shown on variable rate securities represents the rate as of June 30, 2018. |
The Global Industry Classification Standard (GICS®) was developed by and/or is the exclusive property of MSCI, Inc. and Standard & Poor’s Financial Services LLC (“S&P”). GICS is a service mark of MSCI and S&P and has been licensed for use by U.S. Bancorp Fund Services, LLC.
The accompanying notes are an integral part of these financial statements.
WCM Alternatives: Event-Driven Fund
SCHEDULE OF INVESTMENTS
June 30, 2018 (Unaudited)
| | | Shares | | | Value | |
| | | | | | | |
| LONG INVESTMENTS — 100.07% | | | | | | |
| | | | | | | |
| COMMON STOCKS — 49.81% | | | | | | |
| | | | | | | |
| AEROSPACE & DEFENSE — 1.90% | | | | | | |
| Rockwell Collins, Inc. | | | 10,554 | | | $ | 1,421,413 | |
| United Technologies Corporation | | | 7,500 | | | | 937,725 | |
| | | | | | | | 2,359,138 | |
| | | | | | | | | |
| AUTO PARTS & EQUIPMENT — 2.11% | | | | | | | | |
| Tenneco, Inc. (e) | | | 59,600 | | | | 2,620,016 | |
| | | | | | | | | |
| BEVERAGES — 1.95% | | | | | | | | |
| Dr Pepper Snapple Group, Inc. (e) | | | 19,861 | | | | 2,423,042 | |
| | | | | | | | | |
| BIOTECHNOLOGY — 1.16% | | | | | | | | |
| Shire plc — ADR | | | 8,543 | | | | 1,442,058 | |
| | | | | | | | | |
| BROADCASTING — 0.89% | | | | | | | | |
| Tribune Media Company Class A | | | 29,008 | | | | 1,110,136 | |
| | | | | | | | | |
| CABLE & SATELLITE — 0.71% | | | | | | | | |
| Altice USA, Inc. Class A | | | 51,738 | | | | 882,650 | |
| | | | | | | | | |
| CASINOS & GAMING — 0.21% | | | | | | | | |
| Caesars Entertainment Corporation (a)(e) | | | 24,817 | | | | 265,542 | |
| | | | | | | | | |
| COMMUNICATIONS EQUIPMENT — 0.50% | | | | | | | | |
| Mitel Networks Corporation (a)(b) | | | 56,188 | | | | 616,382 | |
| | | | | | | | | |
| DATA PROCESSING & | | | | | | | | |
| OUTSOURCED SERVICES — 0.09% | | | | | | | | |
| MoneyGram International, Inc. (a)(e) | | | 16,735 | | | | 111,957 | |
| | | | | | | | | |
| DIVERSIFIED CHEMICALS — 4.21% | | | | | | | | |
| DowDuPont, Inc. | | | 48,900 | | | | 3,223,488 | |
| Huntsman Corporation | | | 68,798 | | | | 2,008,902 | |
| | | | | | | | 5,232,390 | |
| | | | | | | | | |
| DRUG RETAIL — 0.05% | | | | | | | | |
| Rite Aid Corporation (a) | | | 36,791 | | | | 63,649 | |
| | | | | | | | | |
| ELECTRONIC EQUIPMENT | | | | | | | | |
| & INSTRUMENTS — 1.63% | | | | | | | | |
| Orbotech Ltd. (a)(b)(e) | | | 32,889 | | | | 2,032,540 | |
| | | | | | | | | |
| HEALTH CARE EQUIPMENT — 0.49% | | | | | | | | |
| NxStage Medical, Inc. (a) | | | 21,679 | | | | 604,844 | |
| | | | | | | | | |
| HEALTH CARE SERVICES — 1.13% | | | | | | | | |
| Envision Healthcare Corporation (a) | | | 31,880 | | | | 1,403,039 | |
The accompanying notes are an integral part of these financial statements.
WCM Alternatives: Event-Driven Fund
SCHEDULE OF INVESTMENTS (continued)
June 30, 2018 (Unaudited)
| | | Shares | | | Value | |
| | | | | | | |
| HOTELS, RESORTS & CRUISE LINES — 0.76% | | | | | | |
| ILG, Inc. (e) | | | 28,769 | | | $ | 950,240 | |
| | | | | | | | | |
| INTEGRATED TELECOMMUNICATION | | | | | | | | |
| SERVICES — 1.06% | | | | | | | | |
| AT&T, Inc. | | | 41,193 | | | | 1,322,707 | |
| | | | | | | | | |
| IT CONSULTING & OTHER SERVICES — 0.36% | | | | | | | | |
| DXC Technology Company | | | 5,000 | | | | 403,050 | |
| Perspecta, Inc. | | | 2,500 | | | | 51,375 | |
| | | | | | | | 454,425 | |
| | | | | | | | | |
| MANAGED HEALTH CARE — 2.70% | | | | | | | | |
| Aetna, Inc. (e) | | | 18,300 | | | | 3,358,050 | |
| | | | | | | | | |
| MOVIES & ENTERTAINMENT — 5.45% | | | | | | | | |
| Twenty-First Century Fox, Inc. Class B (e) | | | 137,595 | | | | 6,779,306 | |
| | | | | | | | | |
| OIL & GAS EXPLORATION | | | | | | | | |
| & PRODUCTION — 0.16% | | | | | | | | |
| Alta Mesa Resources, Inc. (a)(e) | | | 28,539 | | | | 194,350 | |
| | | | | | | | | |
| OIL & GAS REFINING & MARKETING — 2.64% | | | | | | | | |
| Andeavor (e) | | | 25,036 | | | | 3,284,223 | |
| | | | | | | | | |
| OIL & GAS STORAGE | | | | | | | | |
| & TRANSPORTATION — 0.81% | | | | | | | | |
| Columbia Pipeline Group, Inc. (a)(d)(g)(i) | | | 38,718 | | | | 1,012,471 | |
| | | | | | | | | |
| PACKAGED FOODS & MEATS — 2.92% | | | | | | | | |
| Pinnacle Foods, Inc. | | | 55,804 | | | | 3,630,608 | |
| | | | | | | | | |
| PAPER PRODUCTS — 0.09% | | | | | | | | |
| KapStone Paper and Packaging Corporation | | | 3,094 | | | | 106,743 | |
| | | | | | | | | |
| PROPERTY & CASUALTY INSURANCE — 3.86% | | | | | | | | |
| XL Group Ltd. (b) | | | 85,780 | | | | 4,799,391 | |
| | | | | | | | | |
| REITs — 0.50% | | | | | | | | |
| GGP, Inc. | | | 14,638 | | | | 299,054 | |
| Gramercy Property Trust | | | 1,957 | | | | 53,465 | |
| MTGE Investment Corporation | | | 3,242 | | | | 63,543 | |
| New York REIT, Inc. | | | 11,194 | | | | 204,179 | |
| | | | | | | | 620,241 | |
| | | | | | | | | |
| SEMICONDUCTORS — 1.38% | | | | | | | | |
| Cavium, Inc. (a)(e) | | | 18,529 | | | | 1,602,758 | |
| NXP Semiconductors NV (a)(b) | | | 1,051 | | | | 114,843 | |
| | | | | | | | 1,717,601 | |
The accompanying notes are an integral part of these financial statements.
WCM Alternatives: Event-Driven Fund
SCHEDULE OF INVESTMENTS (continued)
June 30, 2018 (Unaudited)
| | | Shares | | | Value | |
| | | | | | | |
| SPECIAL PURPOSE | | | | | | |
| ACQUISITION COMPANIES — 10.09% | | | | | | |
| Avista Healthcare Public Acquisition | | | | | | |
| Corporation Class A (a)(b)(e)(f) | | | 100,214 | | | $ | 1,004,645 | |
| Big Rock Partners Acquisition Corporation (a) | | | 45,950 | | | | 455,369 | |
| Bison Capital Acquisition Corporation (a)(b) | | | 35,538 | | | | 356,091 | |
| Black Ridge Acquisition Corporation (a)(f) | | | 40,778 | | | | 398,809 | |
| CM Seven Star Acquisition | | | | | | | | |
| Corporation (a)(b)(e) | | | 97,424 | | | | 963,523 | |
| Constellation Alpha Capital Corporation (a)(b) | | | 121,632 | | | | 1,211,455 | |
| Draper Oakwood Technology | | | | | | | | |
| Acquisition, Inc. (a) | | | 47,718 | | | | 476,226 | |
| Federal Street Acquisition Corporation (a)(f) | | | 8,476 | | | | 83,107 | |
| GigCapital, Inc. (a) | | | 122,996 | | | | 1,210,293 | |
| Industrea Acquisition Corporation Class A (a) | | | 61,495 | | | | 606,347 | |
| Kayne Anderson Acquisition | | | | | | | | |
| Corporation Class A (a)(f) | | | 23,729 | | | | 234,680 | |
| Legacy Acquisition Corporation (a) | | | 144,392 | | | | 1,389,051 | |
| Matlin & Partners Acquisition | | | | | | | | |
| Corporation Class A (a)(f) | | | 25,036 | | | | 247,356 | |
| Modern Media Acquisition Corporation (a) | | | 71,496 | | | | 713,530 | |
| Mudrick Capital Acquisition Corporation (a) | | | 19,411 | | | | 198,388 | |
| Pensare Acquisition Corporation (a) | | | 56,616 | | | | 559,932 | |
| Pure Acquisition Corporation (a) | | | 44,644 | | | | 457,601 | |
| Regalwood Global Energy Ltd. (a)(b)(f) | | | 97,772 | | | | 992,386 | |
| Trinity Merger Corporation (a) | | | 99,243 | | | | 998,384 | |
| | | | | | | | 12,557,173 | |
| | | | | | | | | |
| TOTAL COMMON STOCKS | | | | | | | | |
| (Cost $61,181,618) | | | | | | | 61,954,912 | |
| | | | | | | | | |
| | | | | | | | | |
| PRIVATE INVESTMENT IN PUBLIC EQUITY — 0.96% | | | | | | | | |
| ConvergeOne Holdings, Inc. | | | 127,015 | | | | 1,192,671 | |
| TOTAL PRIVATE INVESTMENT | | | | | | | | |
| IN PUBLIC EQUITY (Cost $1,016,120) | | | | | | | 1,192,671 | |
| | | | | | | | | |
| | | | | | | | | |
| CLOSED-END FUNDS — 5.86% | | | | | | | | |
| Altaba, Inc. (a)(e) | | | 44,130 | | | | 3,230,757 | |
| Apollo Senior Floating Rate Fund, Inc. | | | 22,543 | | | | 368,127 | |
| Apollo Tactical Income Fund, Inc. | | | 614 | | | | 9,578 | |
| Ares Dynamic Credit Allocation Fund | | | 4,683 | | | | 75,350 | |
| BlackRock Debt Strategies Fund, Inc. (e) | | | 67,032 | | | | 749,418 | |
The accompanying notes are an integral part of these financial statements.
WCM Alternatives: Event-Driven Fund
SCHEDULE OF INVESTMENTS (continued)
June 30, 2018 (Unaudited)
| | | Shares | | | Value | |
| BlackRock Floating Rate Income | | | | | | |
| Strategies Fund, Inc. | | | 19,222 | | | $ | 267,186 | |
| Eaton Vance Floating-Rate Income Trust | | | 22,900 | | | | 332,050 | |
| First Trust Senior Floating Rate | | | | | | | | |
| Income Fund II | | | 22,317 | | | | 286,774 | |
| Invesco Dynamic Credit | | | | | | | | |
| Opportunities Fund | | | 31,842 | | | | 370,004 | |
| Invesco Senior Income Trust | | | 83,915 | | | | 359,156 | |
| Nuveen Credit Strategies Income Fund | | | 1,574 | | | | 12,513 | |
| Voya Prime Rate Trust | | | 72,237 | | | | 363,352 | |
| Western Asset High Income | | | | | | | | |
| Opportunity Fund, Inc. (e) | | | 179,467 | | | | 865,031 | |
| TOTAL CLOSED-END FUNDS | | | | | | | | |
| (Cost $7,349,961) | | | | | | | 7,289,296 | |
| | | | | | | | | |
| PREFERRED STOCKS — 2.70% | | | | | | | | |
| Callon Petroleum Company, 10.000%, Series A | | | 21,517 | | | | 1,104,898 | |
| Colony Capital, Inc., 8.750%, Series E (e) | | | 37,590 | | | | 975,085 | |
| Kimco Realty Corporation, | | | | | | | | |
| 5.250%, Series M (e) | | | 28,577 | | | | 642,125 | |
| LaSalle Hotel Properties, 6.375%, Series I (f) | | | 3,515 | | | | 88,385 | |
| NuStar Logistics LP, 9.082% | | | | | | | | |
| (3 Month LIBOR + 6.734%), 1/15/2043 (e)(j) | | | 21,437 | | | | 543,642 | |
| TOTAL PREFERRED STOCKS | | | | | | | | |
| (Cost $3,311,674) | | | | | | | 3,354,135 | |
| | | | | | | | | |
| CONTINGENT VALUE RIGHTS — 0.00% (a)(e)(g) | | | | | | | | |
| Media General, Inc. | | | 42,852 | | | | 1,286 | |
| TOTAL CONTINGENT VALUE RIGHTS (Cost $0) | | | | | | | 1,286 | |
| | | | | | | | | |
| RIGHTS — 0.18% (a)(f) | | | | | | | | |
| Big Rock Partners Acquisition Corporation | | | 45,950 | | | | 20,677 | |
| Bison Capital Acquisition Corporation (b) | | | 35,538 | | | | 11,727 | |
| Black Ridge Acquisition Corporation | | | 40,778 | | | | 13,253 | |
| CM Seven Star Acquisition Corporation (b) | | | 97,424 | | | | 35,073 | |
| Draper Oakwood Technology | | | | | | | | |
| Acquisition, Inc. | | | 47,718 | | | | 28,154 | |
| GigCapital, Inc. | | | 122,996 | | | | 55,348 | |
| Modern Media Acquisition Corporation | | | 71,496 | | | | 37,178 | |
| Pensare Acquisition Corporation | | | 56,616 | | | | 27,742 | |
| TOTAL RIGHTS (Cost $185,238) | | | | | | | 229,152 | |
The accompanying notes are an integral part of these financial statements.
WCM Alternatives: Event-Driven Fund
SCHEDULE OF INVESTMENTS (continued)
June 30, 2018 (Unaudited)
| | | Shares | | | Value | |
| | | | | | | |
| WARRANTS — 0.23% (a)(f) | | | | | | |
| Big Rock Partners Acquisition Corporation | | | 22,975 | | | $ | 8,616 | |
| Bison Capital Acquisition Corporation (b) | | | 17,769 | | | | 6,681 | |
| Black Ridge Acquisition Corporation | | | 40,778 | | | | 14,272 | |
| CM Seven Star Acquisition Corporation (b) | | | 48,712 | | | | 19,241 | |
| ConvergeOne Holdings, Inc. | | | 52,837 | | | | 72,387 | |
| Draper Oakwood Technology | | | | | | | | |
| Acquisition, Inc. | | | 23,859 | | | | 17,417 | |
| Federal Street Acquisition Corporation | | | 4,238 | | | | 5,404 | |
| GigCapital, Inc. | | | 92,247 | | | | 41,511 | |
| Legacy Acquisition Corporation | | | 144,392 | | | | 62,089 | |
| Modern Media Acquisition Corporation | | | 35,748 | | | | 23,236 | |
| Pensare Acquisition Corporation | | | 28,308 | | | | 18,117 | |
| TOTAL WARRANTS (Cost $194,841) | | | | | | | 288,971 | |
| | | | | | | | | |
| | | Principal | | | | | |
| | | Amount | | | | | |
| | | | | | | | | |
| CONVERTIBLE BONDS — 1.13% (f) | | | | | | | | |
| Caesars Entertainment Corporation | | | | | | | | |
| 5.000%, 10/1/2024 | | $ | 251,397 | | | | 430,589 | |
| NXP Semiconductors NV | | | | | | | | |
| 1.000%, 12/1/2019 (b) | | | 809,000 | | | | 975,314 | |
| TOTAL CONVERTIBLE BONDS | | | | | | | | |
| (Cost $1,250,732) | | | | | | | 1,405,903 | |
| | | | | | | | | |
| CORPORATE BONDS — 13.09% (f) | | | | | | | | |
| Corporate Risk Holdings LLC | | | | | | | | |
| 9.500%, 7/1/2019 (h) | | | 845,000 | | | | 884,081 | |
| Dynegy, Inc. | | | | | | | | |
| 5.875%, 6/1/2023 | | | 601,000 | | | | 621,284 | |
| Enbridge, Inc. | | | | | | | | |
| 6.000% (Fixed at 6.000% until 2027), | | | | | | | | |
| 1/15/2077 (b)(e)(j) | | | 1,279,000 | | | | 1,208,655 | |
| Envision Healthcare Corporation | | | | | | | | |
| 5.625%, 7/15/2022 | | | 3,402,000 | | | | 3,476,419 | |
| Kindred Healthcare LLC | | | | | | | | |
| 6.375%, 4/15/2022 | | | 313,000 | | | | 323,955 | |
| Momentive Performance Materials, Inc. | | | | | | | | |
| 3.880%, 10/24/2021 (e) | | | 1,808,000 | | | | 1,902,920 | |
| QCP SNF West/Central/East/AL REIT LLC | | | | | | | | |
| 8.125%, 11/1/2023 (h) | | | 1,746,000 | | | | 1,897,727 | |
The accompanying notes are an integral part of these financial statements.
WCM Alternatives: Event-Driven Fund
SCHEDULE OF INVESTMENTS (continued)
June 30, 2018 (Unaudited)
| | | Principal | | | | |
| | | Amount | | | Value | |
| Rent-A-Center, Inc. | | | | | | |
| 6.625%, 11/15/2020 | | $ | 382,000 | | | $ | 384,388 | |
| 4.750%, 5/1/2021 | | | 512,000 | | | | 514,560 | |
| Rite Aid Corporation | | | | | | | | |
| 6.125%, 4/1/2023 (h) | | | 460,000 | | | | 467,015 | |
| Sinclair Television Group, Inc. | | | | | | | | |
| 6.125%, 10/1/2022 (e) | | | 1,600,000 | | | | 1,634,000 | |
| Spectrum Brands Holdings, Inc. | | | | | | | | |
| 7.750%, 1/15/2022 (e) | | | 2,591,000 | | | | 2,668,730 | |
| T-Mobile USA, Inc. | | | | | | | | |
| 6.500%, 1/15/2024 | | | 217,000 | | | | 226,344 | |
| Tribune Media Company | | | | | | | | |
| 5.875%, 7/15/2022 | | | 77,000 | | | | 78,097 | |
| TOTAL CORPORATE BONDS (Cost $16,384,950) | | | | | | | 16,288,175 | |
| | | Contracts | | | | | | | |
| | | (100 shares | | | Notional | | | | |
| | | per contract) | | | Amount | | | | |
| | | | | | | | | | |
| PURCHASED CALL OPTIONS — 0.00% | | | | | | | | | |
| SPDR S&P 500 ETF Trust | | | | | | | | | |
| Expiration: July 2018, | | | | | | | | | |
| Exercise Price: $280.00 | | | 63 | | | $ | 1,709,064 | | | | 1,575 | |
| | | | | | | | | | | | 1,575 | |
| | | | | | | | | | | | | |
| PURCHASED PUT OPTIONS — 0.40% | | | | | | | | | | | | |
| Altice USA, Inc. Class A | | | | | | | | | | | | |
| Expiration: August 2018, | | | | | | | | | | | | |
| Exercise Price: $15.00 | | | 306 | | | | 522,036 | | | | 9,180 | |
| Atlas Copco AB Class A | | | | | | | | | | | | |
| Expiration: July 2018, | | | | | | | | | | | | |
| Exercise Price: SEK 235.47 (b)(f) | | | 270 | | | | 1,061,340 | | | | 6,003 | |
| Caesars Entertainment Corporation | | | | | | | | | | | | |
| Expiration: September 2018, | | | | | | | | | | | | |
| Exercise Price: $11.00 | | | 248 | | | | 265,360 | | | | 24,180 | |
| CBS Corporation Class B | | | | | | | | | | | | |
| Expiration: July 2018, | | | | | | | | | | | | |
| Exercise Price: $50.00 | | | 725 | | | | 4,075,950 | | | | 8,700 | |
| Conagra Brands, Inc. | | | | | | | | | | | | |
| Expiration: September 2018, | | | | | | | | | | | | |
| Exercise Price: $31.00 | | | 210 | | | | 750,330 | | | | 5,040 | |
The accompanying notes are an integral part of these financial statements.
WCM Alternatives: Event-Driven Fund
SCHEDULE OF INVESTMENTS (continued)
June 30, 2018 (Unaudited)
| | | Contracts | | | | | | | |
| | | (100 shares | | | Notional | | | | |
| | | per contract) | | | Amount | | | Value | |
| DowDuPont, Inc. | | | | | | | | | |
| Expiration: August 2018, | | | | | | | | | |
| Exercise Price: $62.50 | | | 185 | | | $ | 1,219,520 | | | $ | 20,442 | |
| Expiration: August 2018, | | | | | | | | | | | | |
| Exercise Price: $65.00 | | | 185 | | | | 1,219,520 | | | | 34,965 | |
| DXC Technology Company | | | | | | | | | | | | |
| Expiration: September 2018, | | | | | | | | | | | | |
| Exercise Price: $80.00 (f)(k) | | | 89 | | | | 717,429 | | | | 12,682 | |
| Expiration: September 2018, | | | | | | | | | | | | |
| Exercise Price: $85.00 (f)(k) | | | 6 | | | | 48,366 | | | | 1,410 | |
| EQT Corporation | | | | | | | | | | | | |
| Expiration: September 2018, | | | | | | | | | | | | |
| Exercise Price: $45.00 | | | 593 | | | | 3,272,174 | | | | 26,685 | |
| Huntsman Corporation | | | | | | | | | | | | |
| Expiration: July 2018, | | | | | | | | | | | | |
| Exercise Price: $29.00 | | | 187 | | | | 546,040 | | | | 14,025 | |
| Expiration: August 2018, | | | | | | | | | | | | |
| Exercise Price: $27.00 | | | 21 | | | | 61,320 | | | | 1,417 | |
| Expiration: August 2018, | | | | | | | | | | | | |
| Exercise Price: $29.00 | | | 662 | | | | 1,933,040 | | | | 86,060 | |
| ILG, Inc. | | | | | | | | | | | | |
| Expiration: September 2018, | | | | | | | | | | | | |
| Exercise Price: $28.00 | | | 90 | | | | 297,270 | | | | 2,835 | |
| Shire plc — ADR | | | | | | | | | | | | |
| Expiration: August 2018, | | | | | | | | | | | | |
| Exercise Price: $145.00 | | | 19 | | | | 320,720 | | | | 903 | |
| SPDR S&P 500 ETF Trust | | | | | | | | | | | | |
| Expiration: July 2018, | | | | | | | | | | | | |
| Exercise Price: $272.00 | | | 41 | | | | 1,112,248 | | | | 14,022 | |
| Expiration: July 2018, | | | | | | | | | | | | |
| Exercise Price: $274.00 | | | 63 | | | | 1,709,064 | | | | 27,311 | |
| Expiration: July 2018, | | | | | | | | | | | | |
| Exercise Price: $277.00 | | | 75 | | | | 2,034,600 | | | | 46,800 | |
| Expiration: August 2018, | | | | | | | | | | | | |
| Exercise Price: $270.00 | | | 108 | | | | 2,929,824 | | | | 45,792 | |
The accompanying notes are an integral part of these financial statements.
WCM Alternatives: Event-Driven Fund
SCHEDULE OF INVESTMENTS (continued)
June 30, 2018 (Unaudited)
| | | Contracts | | | | | | | |
| | | (100 shares | | | Notional | | | | |
| | | per contract) | | | Amount | | | Value | |
| Tenneco, Inc. | | | | | | | | | |
| Expiration: July 2018, | | | | | | | | | |
| Exercise Price: $38.00 | | | 79 | | | $ | 347,284 | | | $ | 592 | |
| Expiration: July 2018, | | | | | | | | | | | | |
| Exercise Price: $40.00 | | | 323 | | | | 1,419,908 | | | | 6,460 | |
| Expiration: August 2018, | | | | | | | | | | | | |
| Exercise Price: $40.00 | | | 139 | | | | 611,044 | | | | 12,163 | |
| Expiration: August 2018, | | | | | | | | | | | | |
| Exercise Price: $41.00 | | | 134 | | | | 589,064 | | | | 15,075 | |
| Trinity Industries, Inc. | | | | | | | | | | | | |
| Expiration: July 2018, | | | | | | | | | | | | |
| Exercise Price: $30.00 | | | 926 | | | | 3,172,476 | | | | 4,630 | |
| Expiration: August 2018, | | | | | | | | | | | | |
| Exercise Price: $30.00 | | | 189 | | | | 647,514 | | | | 5,670 | |
| United Technologies Corporation | | | | | | | | | | | | |
| Expiration: August 2018, | | | | | | | | | | | | |
| Exercise Price: $105.00 | | | 110 | | | | 1,375,330 | | | | 2,640 | |
| Expiration: September 2018, | | | | | | | | | | | | |
| Exercise Price: $105.00 | | | 75 | | | | 937,725 | | | | 3,900 | |
| VanEck Vectors Semiconductor ETF | | | | | | | | | | | | |
| Expiration: July 2018, | | | | | | | | | | | | |
| Exercise Price: $104.00 | | | 104 | | | | 1,067,768 | | | | 31,824 | |
| The Walt Disney Company | | | | | | | | | | | | |
| Expiration: January 2019, | | | | | | | | | | | | |
| Exercise Price: $95.00 | | | 95 | | | | 995,695 | | | | 24,130 | |
| | | | | | | | | | | | 495,536 | |
| TOTAL PURCHASED OPTIONS (Cost $543,179) | | | | | | | | | | | 497,111 | |
| | | Principal | | | | |
| | | Amount | | | | |
| | | | | | | |
| ESCROW NOTES — 0.05% (a)(d)(g) | | | | | | |
| AMR Corporation | | $ | 28,850 | | | | 37,505 | |
| Winthrop Realty Trust (e) | | | 26,484 | | | | 21,187 | |
| TOTAL ESCROW NOTES (Cost $105,026) | | | | | | | 58,692 | |
| | | | | | | | | |
| | | Shares | | | | | |
| | | | | | | | | |
| SHORT-TERM INVESTMENTS — 25.66% | | | | | | | | |
| | | | | | | | | |
| MONEY MARKET FUNDS — 12.63% (c) | | | | | | | | |
| The Government & Agency Portfolio, | | | | | | | | |
| Institutional Share Class, 1.80% | | | 6,082,000 | | | | 6,082,000 | |
The accompanying notes are an integral part of these financial statements.
WCM Alternatives: Event-Driven Fund
SCHEDULE OF INVESTMENTS (continued)
June 30, 2018 (Unaudited)
| | | Shares | | | Value | |
| JPMorgan Prime Money Market Fund, | | | | | | |
| Institutional Share Class, 2.08% | | | 1,854,629 | | | $ | 1,854,972 | |
| JPMorgan U.S. Government Money Market | | | | | | | | |
| Fund, Institutional Share Class, 1.82% | | | 6,082,000 | | | | 6,082,000 | |
| Morgan Stanley Institutional Liquidity Fund — | | | | | | | | |
| Government Portfolio, Institutional | | | | | | | | |
| Share Class, 1.81% | | | 1,690,788 | | | | 1,690,788 | |
| | | | | | | | 15,709,760 | |
| | | | | | | | | |
| | | Principal | | | | | |
| | | Amount | | | | | |
| | | | | | | | | |
| U.S. TREASURY BILLS — 13.03% (e)(f) | | | | | | | | |
| United States Treasury Bills | | | | | | | | |
| 1.56%, 7/19/2018 | | $ | 100,000 | | | | 99,919 | |
| 1.55%, 7/26/2018 | | | 500,000 | | | | 499,426 | |
| 1.55%, 8/2/2018 | | | 1,800,000 | | | | 1,797,256 | |
| 1.65%, 8/9/2018 | | | 600,000 | | | | 598,846 | |
| 1.74%, 8/16/2018 | | | 300,000 | | | | 299,319 | |
| 1.78%, 8/23/2018 | | | 300,000 | | | | 299,211 | |
| 1.76%, 8/30/2018 | | | 200,000 | | | | 199,393 | |
| 1.80%, 9/6/2018 | | | 300,000 | | | | 298,969 | |
| 1.85%, 9/13/2018 | | | 400,000 | | | | 398,485 | |
| 1.84%, 9/20/2018 | | | 700,000 | | | | 697,087 | |
| 1.93%, 10/18/2018 | | | 3,600,000 | | | | 3,579,102 | |
| 1.93%, 10/25/2018 | | | 800,000 | | | | 795,049 | |
| 1.94%, 11/1/2018 | | | 1,500,000 | | | | 1,489,992 | |
| 1.96%, 11/8/2018 | | | 100,000 | | | | 99,289 | |
| 2.00%, 11/23/2018 | | | 3,200,000 | | | | 3,174,336 | |
| 2.04%, 12/6/2018 | | | 1,900,000 | | | | 1,883,231 | |
| | | | | | | | 16,208,910 | |
| TOTAL SHORT-TERM INVESTMENTS | | | | | | | | |
| (Cost $31,919,597) | | | | | | | 31,918,670 | |
| | | | | | | | | |
| TOTAL LONG INVESTMENTS | | | | | | | | |
| (Cost $123,442,936) — 100.07% | | | | | | | 124,478,974 | |
| | | | | | | | | |
| | | Shares | | | | | |
| | | | | | | | | |
| SHORT INVESTMENTS — (11.50)% | | | | | | | | |
| | | | | | | | | |
| COMMON STOCKS — (11.50)% | | | | | | | | |
| | | | | | | | | |
| AIRLINES — (0.05)% | | | | | | | | |
| American Airlines Group, Inc. | | | (1,443 | ) | | | (54,776 | ) |
The accompanying notes are an integral part of these financial statements.
WCM Alternatives: Event-Driven Fund
SCHEDULE OF INVESTMENTS (continued)
June 30, 2018 (Unaudited)
| | | Shares | | | Value | |
| | | | | | | |
| BROADCASTING — (0.53)% | | | | | | |
| Discovery Communications, Inc. Class A | | | (16,146 | ) | | $ | (444,015 | ) |
| Sinclair Broadcast Group, Inc. Class A | | | (6,564 | ) | | | (211,033 | ) |
| | | | | | | | (655,048 | ) |
| | | | | | | | | |
| CABLE & SATELLITE — (0.64)% | | | | | | | | |
| Sirius XM Holdings, Inc. | | | (117,749 | ) | | | (797,161 | ) |
| | | | | | | | | |
| DRUG RETAIL — (1.36)% | | | | | | | | |
| CVS Health Corporation | | | (26,360 | ) | | | (1,696,266 | ) |
| | | | | | | | | |
| HOTELS, RESORTS & CRUISE LINES — (1.15)% | | | | | | | | |
| Marriott Vacations Worldwide Corporation | | | (12,676 | ) | | | (1,431,881 | ) |
| | | | | | | | | |
| INDUSTRIAL GASES — (0.60)% | | | | | | | | |
| Praxair, Inc. (f) | | | (4,683 | ) | | | (745,838 | ) |
| | | | | | | | | |
| INTERNET SOFTWARE & SERVICES — (2.46)% | | | | | | | | |
| Alibaba Group Holding Ltd. — ADR | | | (16,507 | ) | | | (3,062,544 | ) |
| | | | | | | | | |
| MOVIES & ENTERTAINMENT — (0.25)% | | | | | | | | |
| The Walt Disney Company | | | (3,005 | ) | | | (314,954 | ) |
| | | | | | | | | |
| OIL & GAS REFINING & MARKETING — (2.25)% | | | | | | | | |
| Marathon Petroleum Corporation | | | (39,794 | ) | | | (2,791,947 | ) |
| | | | | | | | | |
| PACKAGED FOODS & MEATS — (0.44)% | | | | | | | | |
| Conagra Brands, Inc. | | | (15,270 | ) | | | (545,597 | ) |
| | | | | | | | | |
| REITs — (0.40)% | | | | | | | | |
| Annaly Capital Management, Inc. | | | (3,082 | ) | | | (31,714 | ) |
| Brookfield Property Partners LP (b) | | | (24,527 | ) | | | (466,503 | ) |
| | | | | | | | (498,217 | ) |
| | | | | | | | | |
| SEMICONDUCTORS — (1.37)% | | | | | | | | |
| KLA-Tenor Corporation | | | (8,222 | ) | | | (843,002 | ) |
| Marvell Technology Group Ltd. (b) | | | (40,364 | ) | | | (865,404 | ) |
| | | | | | | | (1,708,406 | ) |
| | | | | | | | | |
| TOTAL COMMON STOCKS | | | | | | | | |
| (Proceeds $14,890,932) | | | | | | | (14,302,635 | ) |
| TOTAL SHORT INVESTMENTS | | | | | | | | |
| (Proceeds $14,890,932) — (11.50)% | | | | | | | (14,302,635 | ) |
| TOTAL NET INVESTMENTS | | | | | | | | |
| (Cost $108,552,004) — 88.57% | | | | | | | 110,176,339 | |
| OTHER ASSETS IN EXCESS | | | | | | | | |
| OF LIABILITIES — 11.43% | | | | | | | 14,218,180 | |
| TOTAL NET ASSETS — 100.00% | | | | | | $ | 124,394,519 | |
The accompanying notes are an integral part of these financial statements.
WCM Alternatives: Event-Driven Fund
SCHEDULE OF INVESTMENTS (continued)
June 30, 2018 (Unaudited)
ADR – American Depository Receipt
ETF – Exchange-Traded Fund
LIBOR – London Interbank Offered Rate
plc – Public Limited Company
REITs – Real Estate Investment Trusts
SEK – Swedish Krona
| (a) | Non-income producing security. |
| (b) | Foreign security. |
| (c) | The rate quoted is the annualized seven-day yield as of June 30, 2018. |
| (d) | Security fair valued by the Valuation Group in good faith in accordance with the policies adopted by the Board of Trustees. |
| (e) | All or a portion of the shares have been committed as collateral for open securities sold short, written option contracts, swap contracts, and forward currency exchange contracts. |
| (f) | Level 2 Security. Please see Note 2 in the Notes to the Financial Statements for more information. |
| (g) | Level 3 Security. Please see Note 2 in the Notes to the Financial Statements for more information. |
| (h) | Security exempt from registration under Rule 144A of the Securities Act of 1933. These securities may be resold in transactions exempt from registration normally to qualified institutional buyers. As of June 30, 2018, these securities represent 2.61% of total net assets. |
| (i) | Restricted security. The Fund may own investment securities that have other legal or contractual limitations, and thus are restricted as to resale. These securities are valued by the Valuation Group under the supervision of the Board of Trustees. As of June 30, 2018, this common stock had a cost of $983,662 and its market value represented 0.81% of total net assets. The Fund’s adviser perfected its appraisal rights over this security as of 6/20/2016. Please see Note 2 in the Notes to the Financial Statements for more information. |
| (j) | The coupon rate shown on variable rate securities represents the rate as of June 30, 2018. |
| (k) | As a result of a corporate action on the underlying holding, the option’s underlying security is 100 shares of DXC Technology Company and 50 shares of Perspecta. Inc., respectively. |
The Global Industry Classification Standard (GICS®) was developed by and/or is the exclusive property of MSCI, Inc. and Standard & Poor’s Financial Services LLC (“S&P”). GICS is a service mark of MSCI and S&P and has been licensed for use by U.S. Bancorp Fund Services, LLC.
The accompanying notes are an integral part of these financial statements.
WCM Alternatives: Credit Event Fund
SCHEDULE OF INVESTMENTS
June 30, 2018 (Unaudited)
| | | Shares | | | Value | |
| | | | | | | |
| LONG INVESTMENTS — 98.20% | | | | | | |
| | | | | | | |
| COMMON STOCKS — 14.26% | | | | | | |
| | | | | | | |
| OIL & GAS EXPLORATION | | | | | | |
| & PRODUCTION — 0.23% | | | | | | |
| Alta Mesa Resources, Inc. (a) | | | 1,368 | | | $ | 9,316 | |
| | | | | | | | | |
| SPECIAL PURPOSE | | | | | | | | |
| ACQUISITION COMPANIES — 14.03% | | | | | | | | |
| Avista Healthcare Public Acquisition | | | | | | | | |
| Corporation Class A (a)(b)(e) | | | 5,474 | | | | 54,877 | |
| Constellation Alpha Capital | | | | | | | | |
| Corporation (a)(b) | | | 8,300 | | | | 82,668 | |
| Industrea Acquisition | | | | | | | | |
| Corporation Class A (a) | | | 3,990 | | | | 39,342 | |
| Kayne Anderson Acquisition | | | | | | | | |
| Corporation Class A (a)(e) | | | 3,048 | | | | 30,145 | |
| Mudrick Capital Acquisition | | | | | | | | |
| Corporation (a) | | | 1,950 | | | | 19,930 | |
| Pensare Acquisition Corporation (a) | | | 10,631 | | | | 105,140 | |
| Pure Acquisition Corporation (a) | | | 15,883 | | | | 162,801 | |
| Thunder Bridge Acquisition Ltd. (a)(b) | | | 5,911 | | | | 59,306 | |
| | | | | | | | 554,209 | |
| | | | | | | | | |
| TOTAL COMMON STOCKS | | | | | | | | |
| (Cost $558,187) | | | | | | | 563,525 | |
| | | | | | | | | |
| CLOSED-END FUNDS — 0.12% | | | | | | | | |
| Apollo Tactical Income Fund, Inc. | | | 23 | | | | 359 | |
| Ares Dynamic Credit Allocation Fund | | | 173 | | | | 2,783 | |
| BlackRock Debt Strategies Fund, Inc. | | | 93 | | | | 1,040 | |
| Nuveen Credit Strategies Income Fund | | | 58 | | | | 461 | |
| TOTAL CLOSED-END FUNDS | | | | | | | | |
| (Cost $4,657) | | | | | | | 4,643 | |
| | | | | | | | | |
| PREFERRED STOCKS — 1.44% | | | | | | | | |
| NuStar Logistics LP, 9.082% (3 Month | | | | | | | | |
| LIBOR + 6.734%), 1/15/2043 (g) | | | 2,245 | | | | 56,933 | |
| TOTAL PREFERRED STOCKS | | | | | | | | |
| (Cost $56,704) | | | | | | | 56,933 | |
The accompanying notes are an integral part of these financial statements.
WCM Alternatives: Credit Event Fund
SCHEDULE OF INVESTMENTS (continued)
June 30, 2018 (Unaudited)
| | | Principal | | | | |
| | | Amount | | | Value | |
| | | | | | | |
| CONVERTIBLE BONDS — 6.56% (b)(e) | | | | | | |
| NXP Semiconductors NV | | | | | | |
| 1.000%, 12/1/2019 | | $ | 215,000 | | | $ | 259,200 | |
| TOTAL CONVERTIBLE BONDS | | | | | | | | |
| (Cost $265,021) | | | | | | | 259,200 | |
| | | | | | | | | |
| | | | | | | | | |
| CORPORATE BONDS — 54.79% (e) | | | | | | | | |
| Corporate Risk Holdings LLC | | | | | | | | |
| 9.500%, 7/1/2019 (f) | | | 186,000 | | | | 194,602 | |
| Enbridge, Inc. | | | | | | | | |
| 6.000% (Fixed at 6.000% until 2027), | | | | | | | | |
| 1/15/2077 (b)(g) | | | 152,000 | | | | 143,640 | |
| Envision Healthcare Corporation | | | | | | | | |
| 5.625%, 7/15/2022 | | | 221,000 | | | | 225,834 | |
| 6.250%, 12/1/2024 (f) | | | 74,000 | | | | 79,180 | |
| Kindred Healthcare LLC | | | | | | | | |
| 6.375%, 4/15/2022 | | | 151,000 | | | | 156,285 | |
| Momentive Performance Materials, Inc. | | | | | | | | |
| 3.880%, 10/24/2021 | | | 178,000 | | | | 187,345 | |
| Nationstar Mortgage LLC / | | | | | | | | |
| Nationstar Capital Corporation | | | | | | | | |
| 6.500%, 7/1/2021 | | | 25,000 | | | | 24,993 | |
| 6.500%, 6/1/2022 | | | 16,000 | | | | 15,910 | |
| QCP SNF West/Central/East/AL REIT LLC | | | | | | | | |
| 8.125%, 11/1/2023 (f) | | | 104,000 | | | | 113,038 | |
| Rent-A-Center, Inc. | | | | | | | | |
| 6.625%, 11/15/2020 | | | 12,000 | | | | 12,075 | |
| 4.750%, 5/1/2021 | | | 15,000 | | | | 15,075 | |
| Rite Aid Corporation | | | | | | | | |
| 6.125%, 4/1/2023 (f) | | | 189,000 | | | | 191,882 | |
| Sinclair Television Group, Inc. | | | | | | | | |
| 6.125%, 10/1/2022 | | | 170,000 | | | | 173,613 | |
| Spectrum Brands Holdings, Inc. | | | | | | | | |
| 7.750%, 1/15/2022 | | | 223,000 | | | | 229,690 | |
| Tribune Media Company | | | | | | | | |
| 5.875%, 7/15/2022 | | | 153,000 | | | | 155,180 | |
| Unitymedia GmbH | | | | | | | | |
| 6.125%, 1/15/2025 (b)(f) | | | 148,000 | | | | 153,180 | |
| Xerium Technologies, Inc. | | | | | | | | |
| 9.500%, 8/15/2021 | | | 88,000 | | | | 92,950 | |
| TOTAL CORPORATE BONDS | | | | | | | | |
| (Cost $2,169,745) | | | | | | | 2,164,472 | |
The accompanying notes are an integral part of these financial statements.
WCM Alternatives: Credit Event Fund
SCHEDULE OF INVESTMENTS (continued)
June 30, 2018 (Unaudited)
| | | Shares | | | Value | |
| | | | | | | |
| SHORT-TERM INVESTMENTS — 21.03% | | | | | | |
| | | | | | | |
| MONEY MARKET FUNDS — 21.03% (c) | | | | | | |
| First American Government Obligations | | | | | | |
| Fund, Institutional Share Class, 1.77% | | | 193,000 | | | $ | 193,000 | |
| The Government & Agency Portfolio, | | | | | | | | |
| Institutional Share Class, 1.80% | | | 193,000 | | | | 193,000 | |
| JPMorgan Prime Money Market Fund, | | | | | | | | |
| Institutional Share Class, 2.08% (d) | | | 58,988 | | | | 58,992 | |
| JPMorgan U.S. Government Money Market | | | | | | | | |
| Fund, Institutional Share Class, 1.82% | | | 193,000 | | | | 193,000 | |
| Morgan Stanley Institutional Liquidity | | | | | | | | |
| Fund — Government Portfolio, | | | | | | | | |
| Institutional Share Class, 1.81% | | | 193,000 | | | | 193,000 | |
| TOTAL SHORT-TERM INVESTMENTS | | | | | | | | |
| (Cost $830,992) | | | | | | | 830,992 | |
| TOTAL NET INVESTMENTS | | | | | | | | |
| (Cost $3,885,306) — 98.20% | | | | | | | 3,879,765 | |
| OTHER ASSETS IN EXCESS | | | | | | | | |
| OF LIABILITIES — 1.80% | | | | | | | 71,096 | |
| TOTAL NET ASSETS — 100.00% | | | | | | $ | 3,950,861 | |
LIBOR – London Interbank Offered Rate
REIT – Real Estate Investment Trust
| (a) | Non-income producing security. |
| (b) | Foreign Security. |
| (c) | The rate quoted is the annualized seven-day yield as of June 30, 2018. |
| (d) | All or a portion of the shares have been committed as collateral for swap contracts. |
| (e) | Level 2 Security. Please see Note 2 in the Notes to the Financial Statements for more information. |
| (f) | Security exempt from registration under Rule 144A of the Securities Act of 1933. These securities may be resold in transactions exempt from registration normally to qualified institutional buyers. As of June 30, 2018, these securities represent 18.52% of total net assets. |
| (g) | The coupon rate shown on variable rate securities represents the rate as of June 30, 2018. |
The Global Industry Classification Standard (GICS®) was developed by and/or is the exclusive property of MSCI, Inc. and Standard & Poor’s Financial Services LLC (“S&P”). GICS is a service mark of MSCI and S&P and has been licensed for use by U.S. Bancorp Fund Services, LLC.
The accompanying notes are an integral part of these financial statements.
The Merger Fund
SCHEDULE OF WRITTEN OPTIONS
June 30, 2018 (Unaudited)
| | | Contracts | | | | | | | |
| | | (100 shares | | | Notional | | | | |
| | | per contract) | | | Amount | | | Value | |
| | | | | | | | | | |
| WRITTEN CALL OPTIONS | | | | | | | | | |
| CenturyLink, Inc. | | | | | | | | | |
| Expiration: July 2018, | | | | | | | | | |
| Exercise Price: $19.00 | | | 737 | | | $ | 1,373,768 | | | $ | 21,004 | |
| Conagra Brands, Inc. | | | | | | | | | | | | |
| Expiration: September 2018, | | | | | | | | | | | | |
| Exercise Price: $35.00 | | | 2,918 | | | | 10,426,014 | | | | 522,322 | |
| DowDuPont, Inc. | | | | | | | | | | | | |
| Expiration: August 2018, | | | | | | | | | | | | |
| Exercise Price: $67.50 | | | 6,251 | | | | 41,206,592 | | | | 1,084,548 | |
| Expiration: August 2018, | | | | | | | | | | | | |
| Exercise Price: $70.00 | | | 781 | | | | 5,148,352 | | | | 67,947 | |
| GGP, Inc. | | | | | | | | | | | | |
| Expiration: July 2018, | | | | | | | | | | | | |
| Exercise Price: $20.00 | �� | | 5,098 | | | | 10,415,214 | | | | 295,684 | |
| Huntsman Corporation | | | | | | | | | | | | |
| Expiration: August 2018, | | | | | | | | | | | | |
| Exercise Price: $33.00 | | | 13,799 | | | | 40,293,080 | | | | 482,965 | |
| Shire plc — ADR | | | | | | | | | | | | |
| Expiration: July 2018, | | | | | | | | | | | | |
| Exercise Price: $165.00 | | | 1,577 | | | | 26,619,760 | | | | 851,580 | |
| SPDR S&P 500 ETF Trust | | | | | | | | | | | | |
| Expiration: July 2018, | | | | | | | | | | | | |
| Exercise Price: $270.00 | | | 1,271 | | | | 34,479,688 | | | | 563,053 | |
| Twenty-First Century Fox, Inc. Class A | | | | | | | | | | | | |
| Expiration: July 2018, | | | | | | | | | | | | |
| Exercise Price: $45.00 | | | 775 | | | | 3,850,975 | | | | 379,750 | |
| Twenty-First Century Fox, Inc. Class B | | | | | | | | | | | | |
| Expiration: July 2018, | | | | | | | | | | | | |
| Exercise Price: $34.00 | | | 7,072 | | | | 34,843,744 | | | | 10,961,600 | |
| United Technologies Corporation | | | | | | | | | | | | |
| Expiration: August 2018, | | | | | | | | | | | | |
| Exercise Price: $120.00 | | | 943 | | | | 11,790,329 | | | | 627,095 | |
| Expiration: August 2018, | | | | | | | | | | | | |
| Exercise Price: $125.00 | | | 396 | | | | 4,951,188 | | | | 145,530 | |
| Expiration: September 2018, | | | | | | | | | | | | |
| Exercise Price: $120.00 | | | 1,425 | | | | 17,816,775 | | | | 1,115,063 | |
| The Walt Disney Company | | | | | | | | | | | | |
| Expiration: January 2019, | | | | | | | | | | | | |
| Exercise Price: $115.00 | | | 1,709 | | | | 17,912,029 | | | | 446,903 | |
| | | | | | | | | | | | 17,565,044 | |
The accompanying notes are an integral part of these financial statements.
The Merger Fund
SCHEDULE OF WRITTEN OPTIONS (continued)
June 30, 2018 (Unaudited)
| | | Contracts | | | | | | | |
| | | (100 shares | | | Notional | | | | |
| | | per contract) | | | Amount | | | Value | |
| | | | | | | | | | |
| WRITTEN PUT OPTIONS | | | | | | | | | |
| SPDR S&P 500 ETF Trust | | | | | | | | | |
| Expiration: July 2018, | | | | | | | | | |
| Exercise Price: $267.00 | | | 1,480 | | | $ | 40,149,440 | | | $ | 288,600 | |
| Expiration: August 2018, | | | | | | | | | | | | |
| Exercise Price: $260.00 | | | 4,234 | | | | 114,859,952 | | | | 923,012 | |
| VanEck Vectors Semiconductor ETF | | | | | | | | | | | | |
| Expiration: July 2018, | | | | | | | | | | | | |
| Exercise Price: $95.00 | | | 2,109 | | | | 21,653,103 | | | | 133,922 | |
| | | | | | | | | | | | 1,345,534 | |
| TOTAL WRITTEN OPTIONS | | | | | | | | | | | | |
| (Premiums received $13,957,533) | | | | | | | | | | $ | 18,910,578 | |
ADR – American Depository Receipt
ETF – Exchange-Traded Fund
plc – Public Limited Company
The accompanying notes are an integral part of these financial statements.
WCM Alternatives: Event-Driven Fund
SCHEDULE OF WRITTEN OPTIONS
June 30, 2018 (Unaudited)
| | | Contracts | | | | | | | |
| | | (100 shares | | | Notional | | | | |
| | | per contract) | | | Amount | | | Value | |
| | | | | | | | | | |
| WRITTEN CALL OPTIONS | | | | | | | | | |
| Caesars Entertainment Corporation | | | | | | | | | |
| Expiration: September 2018, | | | | | | | | | |
| Exercise Price: $13.00 | | | 248 | | | $ | 265,360 | | | $ | 6,820 | |
| CBS Corporation Class B | | | | | | | | | | | | |
| Expiration: July 2018, | | | | | | | | | | | | |
| Exercise Price: $55.00 | | | 182 | | | | 1,023,204 | | | | 39,130 | |
| Expiration: September 2018, | | | | | | | | | | | | |
| Exercise Price: $57.50 | | | 364 | | | | 2,046,408 | | | | 87,178 | |
| Conagra Brands, Inc. | | | | | | | | | | | | |
| Expiration: September 2018, | | | | | | | | | | | | |
| Exercise Price: $35.00 | | | 210 | | | | 750,330 | | | | 37,590 | |
| DowDuPont, Inc. | | | | | | | | | | | | |
| Expiration: August 2018, | | | | | | | | | | | | |
| Exercise Price: $67.50 | | | 185 | | | | 1,219,520 | | | | 32,097 | |
| Expiration: August 2018, | | | | | | | | | | | | |
| Exercise Price: $70.00 | | | 186 | | | | 1,226,112 | | | | 16,182 | |
| GGP, Inc. | | | | | | | | | | | | |
| Expiration: July 2018, | | | | | | | | | | | | |
| Exercise Price: $20.00 | | | 301 | | | | 614,943 | | | | 17,458 | |
| Huntsman Corporation | | | | | | | | | | | | |
| Expiration: August 2018, | | | | | | | | | | | | |
| Exercise Price: $30.00 | | | 16 | | | | 46,720 | | | | 1,880 | |
| Expiration: August 2018, | | | | | | | | | | | | |
| Exercise Price: $33.00 | | | 4 | | | | 11,680 | | | | 140 | |
| Expiration: August 2018, | | | | | | | | | | | | |
| Exercise Price: $34.00 | | | 268 | | | | 782,560 | | | | 6,432 | |
| ILG, Inc. | | | | | | | | | | | | |
| Expiration: September 2018, | | | | | | | | | | | | |
| Exercise Price: $32.00 | | | 181 | | | | 597,843 | | | | 33,575 | |
| Shire plc — ADR | | | | | | | | | | | | |
| Expiration: July 2018, | | | | | | | | | | | | |
| Exercise Price: $165.00 | | | 95 | | | | 1,603,600 | | | | 51,300 | |
| Expiration: August 2018, | | | | | | | | | | | | |
| Exercise Price: $160.00 | | | 19 | | | | 320,720 | | | | 21,850 | |
| SPDR S&P 500 ETF Trust | | | | | | | | | | | | |
| Expiration: July 2018, | | | | | | | | | | | | |
| Exercise Price: $270.00 | | | 63 | | | | 1,709,064 | | | | 27,909 | |
The accompanying notes are an integral part of these financial statements.
WCM Alternatives: Event-Driven Fund
SCHEDULE OF WRITTEN OPTIONS (continued)
June 30, 2018 (Unaudited)
| | | Contracts | | | | | | | |
| | | (100 shares | | | Notional | | | | |
| | | per contract) | | | Amount | | | Value | |
| Tenneco, Inc. | | | | | | | | | |
| Expiration: August 2018, | | | | | | | | | |
| Exercise Price: $43.00 | | | 139 | | | $ | 611,044 | | | $ | 38,573 | |
| Expiration: August 2018, | | | | | | | | | | | | |
| Exercise Price: $45.00 | | | 134 | | | | 589,064 | | | | 24,455 | |
| Twenty-First Century Fox, Inc. Class A | | | | | | | | | | | | |
| Expiration: July 2018, | | | | | | | | | | | | |
| Exercise Price: $45.00 | | | 37 | | | | 183,853 | | | | 18,130 | |
| United Technologies Corporation | | | | | | | | | | | | |
| Expiration: August 2018, | | | | | | | | | | | | |
| Exercise Price: $125.00 | | | 124 | | | | 1,550,372 | | | | 45,570 | |
| Expiration: September 2018, | | | | | | | | | | | | |
| Exercise Price: $120.00 | | | 75 | | | | 937,725 | | | | 58,688 | |
| The Walt Disney Company | | | | | | | | | | | | |
| Expiration: January 2019, | | | | | | | | | | | | |
| Exercise Price: $115.00 | | | 95 | | | | 995,695 | | | | 24,842 | |
| | | | | | | | | | | | 589,799 | |
| | | | | | | | | | | | | |
| WRITTEN PUT OPTIONS | | | | | | | | | | | | |
| Altice USA, Inc. Class A | | | | | | | | | | | | |
| Expiration: August 2018, | | | | | | | | | | | | |
| Exercise Price: $17.00 | | | 306 | | | | 522,036 | | | | 30,600 | |
| Atlas Copco AB Class A | | | | | | | | | | | | |
| Expiration: July 2018, | | | | | | | | | | | | |
| Exercise Price: SEK 257.54 (a)(b) | | | 270 | | | | 1,061,340 | | | | 26,452 | |
| DXC Technology Company | | | | | | | | | | | | |
| Expiration: September 2018, | | | | | | | | | | | | |
| Exercise Price: $90.00 (b)(c) | | | 31 | | | | 249,891 | | | | 13,795 | |
| Expiration: September 2018, | | | | | | | | | | | | |
| Exercise Price: $95.00 (b)(c) | | | 6 | | | | 48,366 | | | | 4,050 | |
| Expiration: September 2018, | | | | | | | | | | | | |
| Exercise Price: $100.00 (b)(c) | | | 55 | | | | 443,355 | | | | 57,200 | |
| EQT Corporation | | | | | | | | | | | | |
| Expiration: September 2018, | | | | | | | | | | | | |
| Exercise Price: $50.00 | | | 593 | | | | 3,272,174 | | | | 75,607 | |
| Huntsman Corporation | | | | | | | | | | | | |
| Expiration: July 2018, | | | | | | | | | | | | |
| Exercise Price: $32.00 | | | 187 | | | | 546,040 | | | | 52,827 | |
The accompanying notes are an integral part of these financial statements.
WCM Alternatives: Event-Driven Fund
SCHEDULE OF WRITTEN OPTIONS (continued)
June 30, 2018 (Unaudited)
| | | Contracts | | | | | | | |
| | | (100 shares | | | Notional | | | | |
| | | per contract) | | | Amount | | | Value | |
| SPDR S&P 500 ETF Trust | | | | | | | | | |
| Expiration: July 2018, | | | | | | | | | |
| Exercise Price: $267.00 | | | 75 | | | $ | 2,034,600 | | | $ | 14,625 | |
| Expiration: August 2018, | | | | | | | | | | | | |
| Exercise Price: $260.00 | | | 216 | | | | 5,859,648 | | | | 47,088 | |
| Tenneco, Inc. | | | | | | | | | | | | |
| Expiration: July 2018, | | | | | | | | | | | | |
| Exercise Price: $43.00 | | | 79 | | | | 347,284 | | | | 6,518 | |
| Trinity Industries, Inc. | | | | | | | | | | | | |
| Expiration: July 2018, | | | | | | | | | | | | |
| Exercise Price: $34.00 | | | 926 | | | | 3,172,476 | | | | 71,765 | |
| Expiration: August 2018, | | | | | | | | | | | | |
| Exercise Price: $32.00 | | | 189 | | | | 647,514 | | | | 15,120 | |
| United Technologies Corporation | | | | | | | | | | | | |
| Expiration: August 2018, | | | | | | | | | | | | |
| Exercise Price: $120.00 | | | 29 | | | | 362,587 | | | | 5,293 | |
| VanEck Vectors Semiconductor ETF | | | | | | | | | | | | |
| Expiration: July 2018, | | | | | | | | | | | | |
| Exercise Price: $95.00 | | | 104 | | | | 1,067,768 | | | | 6,604 | |
| | | | | | | | | | | | 427,544 | |
| TOTAL WRITTEN OPTIONS | | | | | | | | | | | | |
| (Premiums received $1,346,658) | | | | | | | | | | $ | 1,017,343 | |
ADR – American Depository Receipt
ETF – Exchange-Traded Fund
SEK – Swedish Krona
| (a) | Foreign security. |
| (b) | Level 2 Security. Please see Note 2 in the Notes to the Financial Statements for more information. |
| (c) | As a result of a corporate action on the underlying holding, the option’s underlying security is 100 shares of DXC Technology Company and 50 shares of Perspecta, Inc., respectively. |
The accompanying notes are an integral part of these financial statements.
The Merger Fund
SCHEDULE OF FORWARD CURRENCY EXCHANGE CONTRACTS
June 30, 2018 (Unaudited)
| | | | | | | | | | | | | | | | | | Unrealized | |
| Settlement | | | Currency to | | USD Value at | | | Currency to | | USD Value at | | | Appreciation | |
Date | Counterparty | | be Delivered | | June 30, 2018 | | | be Received | | June 30, 2018 | | | (Depreciation)* | |
| 11/7/18 | JPM | | | 702,341 | | AUD | | $ | 520,097 | | | | 518,061 | | USD | | $ | 518,061 | | | $ | (2,036 | ) |
| 11/20/18 | JPM | | | 2,313,944 | | AUD | | | 1,713,715 | | | | 1,706,520 | | USD | | | 1,706,520 | | | | (7,195 | ) |
| 7/5/18 | JPM | | | 34,498,756 | | EUR | | | 40,304,438 | | | | 43,156,163 | | USD | | | 43,156,163 | | | | 2,851,725 | |
| 7/5/18 | JPM | | | 40,732,693 | | USD | | | 40,732,693 | | | | 34,498,756 | | EUR | | | 40,304,438 | | | | (428,255 | ) |
| 8/15/18 | JPM | | | 42,932,564 | | EUR | | | 50,317,122 | | | | 52,372,365 | | USD | | | 52,372,365 | | | | 2,055,243 | |
| 8/15/18 | JPM | | | 2,808,584 | | USD | | | 2,808,584 | | | | 2,397,139 | | EUR | | | 2,809,456 | | | | 872 | |
| 7/13/18 | JPM | | | 101,339,523 | | GBP | | | 133,827,598 | | | | 138,303,146 | | USD | | | 138,303,146 | | | | 4,475,548 | |
| 7/13/18 | JPM | | | 36,540,677 | | USD | | | 36,540,677 | | | | 26,931,368 | | GBP | | | 35,565,199 | | | | (975,478 | ) |
| 7/17/18 | JPM | | | 3,694,820 | | GBP | | | 4,880,271 | | | | 5,235,224 | | USD | | | 5,235,224 | | | | 354,953 | |
| 7/17/18 | JPM | | | 3,329,609 | | USD | | | 3,329,609 | | | | 2,498,874 | | GBP | | | 3,300,616 | | | | (28,993 | ) |
| 9/11/18 | JPM | | | 3,965,608 | | GBP | | | 5,251,276 | | | | 5,568,530 | | USD | | | 5,568,530 | | | | 317,254 | |
| 9/11/18 | JPM | | | 5,565,319 | | USD | | | 5,565,319 | | | | 3,965,608 | | GBP | | | 5,251,276 | | | | (314,043 | ) |
| | | | | | | | | $ | 325,791,399 | | | | | | | | $ | 334,090,994 | | | $ | 8,299,595 | |
AUD – Australian Dollar
EUR – Euro
GBP – British Pound
JPM – JPMorgan Chase & Co., Inc.
USD – U.S. Dollar
| * | Net unrealized appreciation (depreciation) is a receivable (payable). |
The accompanying notes are an integral part of these financial statements.
WCM Alternatives: Event-Driven Fund
SCHEDULE OF FORWARD CURRENCY EXCHANGE CONTRACTS
June 30, 2018 (Unaudited)
| | | | | | | | | | | | | | | | | | Unrealized | |
| Settlement | | | Currency to | | USD Value at | | | Currency to | | USD Value at | | | Appreciation | |
Date | Counterparty | | be Delivered | | June 30, 2018 | | | be Received | | June 30, 2018 | | | (Depreciation)* | |
| 7/5/18 | JPM | | | 1,765,755 | | EUR | | $ | 2,062,908 | | | | 2,209,110 | | USD | | $ | 2,209,110 | | | $ | 146,202 | |
| 7/5/18 | JPM | | | 2,084,820 | | USD | | | 2,084,820 | | | | 1,765,755 | | EUR | | | 2,062,908 | | | | (21,912 | ) |
| 8/15/18 | JPM | | | 2,460,497 | | EUR | | | 2,883,712 | | | | 2,999,927 | | USD | | | 2,999,927 | | | | 116,215 | |
| 8/15/18 | JPM | | | 142,571 | | USD | | | 142,571 | | | | 121,685 | | EUR | | | 142,615 | | | | 44 | |
| 7/13/18 | JPM | | | 6,171,176 | | GBP | | | 8,149,571 | | | | 8,423,329 | | USD | | | 8,423,329 | | | | 273,758 | |
| 7/13/18 | JPM | | | 781,354 | | USD | | | 781,354 | | | | 563,883 | | GBP | | | 744,656 | | | | (36,698 | ) |
| 7/17/18 | JPM | | | 207,522 | | GBP | | | 274,104 | | | | 293,280 | | USD | | | 293,280 | | | | 19,176 | |
| 7/17/18 | JPM | | | 184,959 | | USD | | | 184,959 | | | | 139,085 | | GBP | | | 183,709 | | | | (1,250 | ) |
| 9/11/18 | JPM | | | 291,708 | | GBP | | | 386,281 | | | | 408,782 | | USD | | | 408,782 | | | | 22,501 | |
| 9/11/18 | JPM | | | 409,428 | | USD | | | 409,428 | | | | 291,708 | | GBP | | | 386,281 | | | | (23,147 | ) |
| | | | | | | | | $ | 17,359,708 | | | | | | | | $ | 17,854,597 | | | $ | 494,889 | |
EUR – Euro
GBP – British Pound
JPM – JPMorgan Chase & Co., Inc.
USD – U.S. Dollar
| * | Net unrealized appreciation (depreciation) is a receivable (payable). |
The accompanying notes are an integral part of these financial statements.
The Merger Fund
SCHEDULE OF SWAP CONTRACTS
June 30, 2018 (Unaudited)
| | Termi- | Pay/Receive | | | | | | | | | | | | Unrealized | |
| Counter- | | nation | on Financing | | | | Payment | | | | | Notional | | | Appreciation | |
party | Security | Date | Rate | | Financing Rate | | Frequency | | Shares | | | Amount | | | (Depreciation)* | |
| | |
| LONG TOTAL RETURN SWAP CONTRACTS | |
| | | | | | | | | | | | | | | | | | | | |
| BAML | Andeavor | 5/8/19 | Pay | | 0.575% +1 Month LIBOR | | Monthly | | | 117,537 | | | $ | 16,506,707 | | | $ | (1,100,377 | ) |
| JPM | Gateway Lifestyle | | | | | | | | | | | | | | | | | | |
| | Holdings Pty Ltd. | 7/1/19 | Pay | | 0.400% +3 Month LIBOR | | Quarterly | | | 984,657 | | | | 1,736,374 | | | | (38,514 | ) |
| BAML | Gemalto NV | 12/18/18 | Pay | | 0.350% +1 Month LIBOR | | Monthly | | | 794,614 | | | | 46,385,953 | | | | (188,640 | ) |
| JPM | Informa plc | 6/18/19 | Pay | | 0.000%(1) | | Quarterly | | | 143,227 | | | | — | (1) | | | 1,578,347 | |
| BAML | Linde AG | 2/5/19 | Pay | | 0.350% +1 Month LIBOR | | Monthly | | | 118,256 | | | | 26,861,487 | | | | 1,346,383 | |
| JPM | MTGE Investment Corporation | 5/9/19 | Pay | | 0.300% +3 Month LIBOR | | Quarterly | | | 228,812 | | | | 4,471,704 | | | | (3,439 | ) |
| BAML | Shire plc — ADR | 7/2/19 | Pay | | 0.800% +1 Month LIBOR | | Monthly | | | 73,741 | | | | 4,148,747 | | | | 1,326,557 | |
| JPM | Sirtex Medical Ltd. | 6/21/19 | Pay | | 0.400% +3 Month LIBOR | | Quarterly | | | 20,903 | | | | 483,082 | | | | 3,427 | |
| JPM | Sky plc | 12/19/18 | Pay | | 0.530% +3 Month LIBOR | | Quarterly | | | 5,644,497 | | | | 83,869,474 | | | | 24,389,859 | |
| | |
| SHORT TOTAL RETURN SWAP CONTRACTS | |
| | | | | | | | | | | | | | | | | | | | |
| JPM | Annaly Capital | | | | | | | | | | | | | | | | | | |
| | Management, Inc. | 5/9/19 | Receive | | (0.600)% +3 Month LIBOR | | Quarterly | | | (217,803 | ) | | | (2,226,649 | ) | | | (9,134 | ) |
| BAML | Brookfield Property | | | | | | | | | | | | | | | | | | |
| | Partners LP | 3/28/19 | Pay | | (10.313)% +1 Month LIBOR | | Monthly | | | (112,741 | ) | | | (2,140,140 | ) | | | (9,120 | ) |
| BAML | Marathon Petroleum | | | | | | | | | | | | | | | | | | |
| | Corporation | 5/8/19 | Receive | | (0.400)% +1 Month LIBOR | | Monthly | | | (186,824 | ) | | | (14,418,103 | ) | | | 1,317,274 | |
| BAML | Praxair, Inc. | 1/25/19 | Receive | | (0.400)% +1 Month LIBOR | | Monthly | | | (162,843 | ) | | | (25,348,636 | ) | | | (572,329 | ) |
| BAML | Takeda Pharmaceutical | | | | | | | | | | | | | | | | | | |
| | Company Ltd. | 7/3/19 | Receive | | (1.000)% +1 Month LIBOR | | Monthly | | | (61,868 | ) | | | (2,599,795 | ) | | | 2,576,313 | |
| | | | | | | | | | | | | | | | | | $ | 30,616,607 | |
ADR – American Depository Receipt
BAML – Bank of America Merrill Lynch & Co., Inc.
JPM – JPMorgan Chase & Co., Inc.
LIBOR – London Interbank Offered Rate
plc – Public Limited Company
| * | Based on the net swap value held at each counterparty, unrealized appreciation (depreciation) is a receivable (payable). |
(1) | Security held is the direct result of a corporate action. There is no associated financing rate and the security is held with a zero cost basis. |
The accompanying notes are an integral part of these financial statements.
WCM Alternatives: Event-Driven Fund
SCHEDULE OF SWAP CONTRACTS
June 30, 2018 (Unaudited)
| Termi- | Pay/Receive | | | | | | | | | | | | Unrealized | |
| Counter- | | nation | on Financing | | | | Payment | | | | | Notional | | | Appreciation | |
party | Security | Date | Rate | | Financing Rate | | Frequency | | Shares | | | Amount | | | (Depreciation)* | |
| | |
| LONG TOTAL RETURN SWAP CONTRACTS | |
| JPM | Aetna, Inc. | 3/5/19 | Pay | | 0.300% +3 Month LIBOR | | Quarterly | | | 15,000 | | | $ | 2,680,977 | | | $ | 51,962 | |
| JPM | Altaba, Inc. | 7/10/18 | Pay | | 0.632% +3 Month LIBOR | | Quarterly | | | 161,811 | | | | 11,006,090 | | | | 757,213 | |
| BAML | Andeavor | 4/30/19 | Pay | | 0.672% +1 Month LIBOR | | Monthly | | | 15,261 | | | | 2,107,642 | | | | (107,117 | ) |
| JPM | AT&T, Inc. | 6/15/19 | Pay | | 0.300% +3 Month LIBOR | | Quarterly | | | 609 | | | | 16,538 | | | | 2,999 | |
| BAML | CBS Corporation Class B | 10/20/18 | Pay | | 0.400% +1 Month LIBOR | | Monthly | | | 72,506 | | | | 4,183,932 | | | | (110,543 | ) |
| JPM | Discovery Communications, | | | | | | | | | | | | | | | | | | |
| | Inc. Class C | 3/9/19 | Pay | | 0.000%(1) | | Quarterly | | | 16,146 | | | | — | (1) | | | 411,723 | |
| BAML | DowDuPont, Inc. | 10/20/18 | Pay | | 0.400% +1 Month LIBOR | | Monthly | | | 6,841 | | | | 487,462 | | | | (36,841 | ) |
| BAML | Express Scripts | | | | | | | | | | | | | | | | | | |
| | Holding Company | 3/20/19 | Pay | | 0.400% +1 Month LIBOR | | Monthly | | | 9,215 | | | | 687,578 | | | | 23,584 | |
| BAML | Gemalto NV | 12/18/18 | Pay | | 0.350% +1 Month LIBOR | | Monthly | | | 45,849 | | | | 2,676,328 | | | | (10,895 | ) |
| BAML | GGP, Inc. | 1/9/19 | Pay | | 0.750% +1 Month LIBOR | | Monthly | | | 112,310 | | | | 2,472,412 | | | | (178,832 | ) |
| BAML | Gramercy Property Trust | 5/11/19 | Pay | | 0.488% +1 Month LIBOR | | Monthly | | | 63,242 | | | | 1,740,038 | | | | (13,452 | ) |
| JPM | ILG, Inc. | 10/4/18 | Pay | | 0.300% +3 Month LIBOR | | Quarterly | | | 86,632 | | | | 2,794,194 | | | | 56,621 | |
| JPM | Informa plc | 6/18/19 | Pay | | 0.000%(1) | | Quarterly | | | 8,196 | | | | — | (1) | | | 90,319 | |
| JPM | Liberty Media Corporation- | | | | | | | | | | | | | | | | | | |
| | Liberty SiriusXM Class A | 5/10/18 | Pay | | 0.300% +3 Month LIBOR | | Quarterly | | | 12,597 | | | | 496,992 | | | | 66,858 | |
| BAML | Linde AG | 2/20/19 | Pay | | 0.350% +1 Month LIBOR | | Monthly | | | 7,112 | | | | 1,631,312 | | | | 65,206 | |
| JPM | MTGE Investment Corporation | 5/9/19 | Pay | | 0.300% +3 Month LIBOR | | Quarterly | | | 22,824 | | | | 446,053 | | | | (344 | ) |
| BAML | NXP Semiconductors NV | 10/20/18 | Pay | | 0.400% +1 Month LIBOR | | Monthly | | | 87,257 | | | | 10,238,257 | | | | (709,904 | ) |
| BAML | Rite Aid Corporation | 10/20/18 | Pay | | 0.400% +1 Month LIBOR | | Monthly | | | 28,938 | | | | 52,957 | | | | (2,931 | ) |
| BAML | Rockwell Collins, Inc. | 12/11/18 | Pay | | 0.400% +1 Month LIBOR | | Monthly | | | 29,511 | | | | 3,977,303 | | | | (5,523 | ) |
| JPM | Shire plc — ADR | 5/2/19 | Pay | | 0.300% +3 Month LIBOR | | Quarterly | | | 4,966 | | | | 792,355 | | | | 42,753 | |
| BAML | Shire plc — ADR | 7/2/19 | Pay | | 0.800% +1 Month LIBOR | | Monthly | | | 5,615 | | | | 315,906 | | | | 101,011 | |
| JPM | Sky plc | 7/14/18 | Pay | | 0.300% +3 Month LIBOR | | Quarterly | | | 439,168 | | | | 6,995,982 | | | | 1,436,326 | |
| JPM | Twenty-First Century | | | | | | | | | | | | | | | | | | |
| | Fox, Inc. Class B | 12/18/18 | Pay | | 0.300% +3 Month LIBOR | | Quarterly | | | 56,820 | | | | 2,080,181 | | | | 706,965 | |
The accompanying notes are an integral part of these financial statements.
WCM Alternatives: Event-Driven Fund
SCHEDULE OF SWAP CONTRACTS (continued)
June 30, 2018 (Unaudited)
| | Termi- | Pay/Receive | | | | | | | | | | Unrealized | |
| Counter- | | nation | on Financing | | Payment | | | | | Notional | | | Appreciation | |
party | Security | Date | Rate | Financing Rate | Frequency | | Shares | | | Amount | | | (Depreciation)* | |
| | |
| SHORT TOTAL RETURN SWAP CONTRACTS | |
| JPM | Alibaba Group Holding | | | | | | | | | | | | | |
| | Ltd. — ADR | 7/10/18 | Receive | (0.600)% +3 Month LIBOR | Quarterly | | | (53,514 | ) | | $ | (10,157,197 | ) | | $ | 269,052 | |
| JPM | Annaly Capital | | | | | | | | | | | | | | | | |
| | Management, Inc. | 5/9/19 | Receive | (0.600)% +3 Month LIBOR | Quarterly | | | (21,616 | ) | | | (220,985 | ) | | | (906 | ) |
| BAML | Brookfield Property | | | | | | | | | | | | | | | | |
| | Partners LP | 3/28/19 | Pay | (10.313)% +1 Month LIBOR | Monthly | | | (5,278 | ) | | | (100,191 | ) | | | (427 | ) |
| BAML | Cigna Corporation | 3/20/19 | Receive | (0.400)% +1 Month LIBOR | Monthly | | | (2,243 | ) | | | (377,158 | ) | | | (4,249 | ) |
| BAML | Marathon Petroleum | | | | | | | | | | | | | | | | |
| | Corporation | 4/30/19 | Receive | (0.400)% +1 Month LIBOR | Monthly | | | (24,257 | ) | | | (1,833,395 | ) | | | 132,304 | |
| BAML | Praxair, Inc. | 1/25/19 | Receive | (0.400)% +1 Month LIBOR | Monthly | | | (6,301 | ) | | | (995,539 | ) | | | (7,550 | ) |
| BAML | Takeda Pharmaceutical | | | | | | | | | | | | | | | | |
| | Company Ltd. | 7/3/19 | Receive | (1.000)% +1 Month LIBOR | Monthly | | | (4,711 | ) | | | (197,964 | ) | | | 196,176 | |
| JPM | The Walt Disney Company | 1/19/19 | Receive | (0.600)% +3 Month LIBOR | Quarterly | | | (9,475 | ) | | | (1,034,244 | ) | | | 45,954 | |
| | | | | | | | | | | | | | | | $ | 3,267,512 | |
ADR – American Depository Receipt
BAML – Bank of America Merrill Lynch & Co., Inc.
JPM – JPMorgan Chase & Co., Inc.
LIBOR – London Interbank Offered Rate
plc – Public Limited Company
| * | Based on the net swap value held at each counterparty, unrealized appreciation (depreciation) is a receivable (payable). |
(1) | Security held is the direct result of a corporate action. There is no associated financing rate and the security is held with a zero cost basis. |
The accompanying notes are an integral part of these financial statements.
WCM Alternatives: Credit Event Fund
SCHEDULE OF SWAP CONTRACTS
June 30, 2018 (Unaudited)
| | Termi- | Pay/Receive | | | | | | | | | | Unrealized | |
| Counter- | | nation | on Financing | | Payment | | | | | Notional | | | Appreciation | |
party | Security | Date | Rate | Financing Rate | Frequency | | Shares | | | Amount | | | (Depreciation)* | |
| | |
| LONG TOTAL RETURN SWAP CONTRACTS | |
| JPM | BlackRock Debt Strategies | | | | | | | | | | | | | |
| | Fund, Inc. | 5/23/19 | Pay | 0.800% +3 Month LIBOR | Quarterly | | | 4,352 | | | $ | 49,395 | | | $ | (895 | ) |
| JPM | Colony Capital, Inc., | | | | | | | | | | | | | | | | |
| 8.750%, Series E | 4/27/19 | Pay | 0.842% +3 Month LIBOR | Quarterly | | | 6,970 | | | | 177,240 | | | | 2,673 | |
| JPM | Eaton Vance Floating-Rate | | | | | | | | | | | | | | | | |
| Income Trust | 3/16/19 | Pay | 0.800% +3 Month LIBOR | Quarterly | | | 2,101 | | | | 31,367 | | | | (1,173 | ) |
| JPM | First Trust Senior Floating | | | | | | | | | | | | | | | | |
| | Rate Income Fund II | 3/16/19 | Pay | 0.800% +3 Month LIBOR | Quarterly | | | 5,272 | | | | 68,452 | | | | (1,299 | ) |
| JPM | Invesco Dynamic Credit | | | | | | | | | | | | | | | | |
| | Opportunities Fund | 5/23/19 | Pay | 0.800% +3 Month LIBOR | Quarterly | | | 4,196 | | | | 49,384 | | | | (782 | ) |
| JPM | Invesco Senior Income Trust | 3/16/19 | Pay | 1.000% +3 Month LIBOR | Quarterly | | | 13,455 | | | | 59,631 | | | | (2,445 | ) |
| JPM | Nuveen Credit Strategies | | | | | | | | | | | | | | | | |
| | Income Fund | 5/23/19 | Pay | 0.800% +3 Month LIBOR | Quarterly | | | 6,084 | | | | 49,463 | | | | (1,250 | ) |
| JPM | NXP Semiconductors NV | 6/20/19 | Pay | 0.300% +3 Month LIBOR | Quarterly | | | 534 | | | | 60,007 | | | | (2,063 | ) |
| JPM | Voya Prime Rate Trust | 3/16/19 | Pay | 1.000% +3 Month LIBOR | Quarterly | | | 11,559 | | | | 59,893 | | | | (1,773 | ) |
| | | | | | | | | | | | | | | | $ | (9,007 | ) |
JPM – JPMorgan Chase & Co., Inc.
LIBOR – London Interbank Offered Rate
| * | Based on the net swap value held at each counterparty, unrealized appreciation (depreciation) is a receivable (payable). |
The accompanying notes are an integral part of these financial statements.
(This Page Intentionally Left Blank.)
The Merger Fund and Westchester Capital Funds
STATEMENTS OF ASSETS AND LIABILITIES
June 30, 2018 (Unaudited)
| | | | | | WCM Alternatives: | | | WCM Alternatives: | |
| | | The Merger Fund | | | Event-Driven Fund | | | Credit Event Fund | |
| ASSETS: | | | | | | | | | |
| Investments, at value (Cost | | | | | | | | | |
| $2,288,133,313, $123,442,936, | | | | | | | | | |
| and $3,885,306, respectively) | | $ | 2,407,468,122 | | | $ | 124,478,974 | | | $ | 3,879,765 | |
| Cash | | | — | | | | — | | | | 128,232 | |
| Cash held in foreign currency | | | | | | | | | | | | |
| (Cost $—, $24,429, | | | | | | | | | | | | |
| and $—, respectively) | | | — | | | | 24,429 | | | | — | |
| Receivable from brokers | | | | | | | | | | | | |
| for securities sold short | | | 343,657,214 | | | | 14,890,932 | | | | — | |
| Deposits at brokers for | | | | | | | | | | | | |
| other investments | | | 173,852,800 | | | | 3,393,978 | | | | — | |
| Receivable for forward | | | | | | | | | | | | |
| currency exchange contracts | | | 8,299,595 | | | | 494,889 | | | | — | |
| Receivable for swap contracts | | | 30,616,607 | | | | 3,937,495 | | | | — | |
| Receivable for investments sold | | | 22,567,170 | | | | 231,795 | | | | — | |
| Receivable for fund | | | | | | | | | | | | |
| shares issued | | | 9,522,061 | | | | 129,502 | | | | — | |
| Dividends and interest receivable | | | 9,203,417 | | | | 561,112 | | | | 54,892 | |
| Prepaid expenses | | | | | | | | | | | | |
| and other receivables | | | 358,199 | | | | 38,574 | | | | 36,340 | |
| Receivable from | | | | | | | | | | | | |
| investment advisor | | | — | | | | — | | | | 12,249 | |
| Total Assets | | | 3,005,545,185 | | | | 148,181,680 | | | | 4,111,478 | |
| | | | | | | | | | | | | |
| LIABILITIES: | | | | | | | | | | | | |
| Securities sold short, at value | | | | | | | | | | | | |
| (Proceeds of $343,657,214, | | | | | | | | | | | | |
| $14,890,932, and | | | | | | | | | | | | |
| $—, respectively) | | | 447,770,624 | | | | 14,302,635 | | | | — | |
| Written option contracts, | | | | | | | | | | | | |
| at value (Premiums received | | | | | | | | | | | | |
| $13,957,533, $1,346,658, | | | | | | | | | | | | |
| and $—, respectively) | | | 18,910,578 | | | | 1,017,343 | | | | — | |
| Due to custodian | | | — | | | | 11,000 | | | | — | |
| Payable for swap contracts | | | — | | | | 669,983 | | | | 9,007 | |
| Payable for | | | | | | | | | | | | |
| investments purchased | | | 79,930,385 | | | | 7,466,590 | | | | 96,550 | |
| Payable for fund | | | | | | | | | | | | |
| shares redeemed | | | 2,444,876 | | | | 91,068 | | | | — | |
| Payable to the investment adviser | | | 1,958,332 | | | | 126,121 | | | | — | |
| Accrued expenses | | | | | | | | | | | | |
| and other liabilities | | | 827,107 | | | | 93,228 | | | | 55,045 | |
| Distribution fees payable | | | 297,814 | | | | 1,784 | | | | 15 | |
| Dividends and interest payable | | | 117,744 | | | | 7,409 | | | | — | |
| Total Liabilities | | | 552,257,460 | | | | 23,787,161 | | | | 160,617 | |
| NET ASSETS | | $ | 2,453,287,725 | | | $ | 124,394,519 | | | $ | 3,950,861 | |
The accompanying notes are an integral part of these financial statements.
The Merger Fund and Westchester Capital Funds
STATEMENTS OF ASSETS AND LIABILITIES (continued)
June 30, 2018 (Unaudited)
| | | | | | WCM Alternatives: | | | WCM Alternatives: | |
| | | The Merger Fund | | | Event-Driven Fund | | | Credit Event Fund | |
| NET ASSETS CONSISTS OF: | | | | | | | | | |
| Accumulated undistributed | | | | | | | | | |
| net investment income (loss) | | $ | (8,024,499 | ) | | $ | 2,717,529 | | | $ | 19,262 | |
| Accumulated net realized gain | | | | | | | | | | | | |
| (loss) on investments, securities | | | | | | | | | | | | |
| sold short, written option | | | | | | | | | | | | |
| contracts expired or closed, | | | | | | | | | | | | |
| forward currency exchange | | | | | | | | | | | | |
| contracts, swap contracts, and | | | | | | | | | | | | |
| foreign currency transactions | | | 12,607,252 | | | | (2,076,411 | ) | | | (1,995 | ) |
| Net unrealized appreciation | | | | | | | | | | | | |
| (depreciation) on: | | | | | | | | | | | | |
| Investments | | | 119,334,809 | | | | 1,036,038 | | | | (5,541 | ) |
| Securities sold short | | | (104,113,410 | ) | | | 588,297 | | | | — | |
| Written option contracts | | | (4,953,045 | ) | | | 329,315 | | | | — | |
| Forward currency | | | | | | | | | | | | |
| exchange contracts | | | 8,299,595 | | | | 494,889 | | | | — | |
| Swap contracts | | | 30,616,607 | | | | 3,267,512 | | | | (9,007 | ) |
| Foreign currency translation | | | — | | | | — | | | | — | |
| Net unrealized appreciation | | | | | | | | | | | | |
| (depreciation) | | | 49,184,556 | | | | 5,716,051 | | | | (14,548 | ) |
| Paid-in capital | | | 2,399,520,416 | | | | 118,037,350 | | | | 3,948,142 | |
| Total Net Assets | | $ | 2,453,287,725 | | | $ | 124,394,519 | | | $ | 3,950,861 | |
| | | | | | | | | | | | | |
| Investor Class | | | | | | | | | | | | |
| Net assets | | $ | 1,192,544,678 | | | $ | 8,234,347 | | | $ | 29,923 | |
| Shares outstanding | | | 70,639,882 | | | | 770,048 | | | | 2,992 | |
| Net asset value and | | | | | | | | | | | | |
| offering price per share* | | $ | 16.88 | | | $ | 10.69 | | | $ | 10.00 | |
| | | | | | | | | | | | | |
| Institutional Class | | | | | | | | | | | | |
| Net assets | | $ | 1,260,743,047 | | | $ | 116,160,172 | | | $ | 3,920,938 | |
| Shares outstanding | | | 75,087,265 | | | | 10,829,623 | | | | 391,550 | |
| Net asset value and | | | | | | | | | | | | |
| offering price per share* | | $ | 16.79 | | | $ | 10.73 | | | $ | 10.01 | |
| * | The redemption price per share may vary based on the length of time a shareholder holds Fund shares. |
The accompanying notes are an integral part of these financial statements.
The Merger Fund and Westchester Capital Funds
STATEMENTS OF OPERATIONS
For the Period Ended June 30, 2018 (Unaudited)
| | | | | | WCM Alternatives: | | | WCM Alternatives: | |
| | | The Merger Fund | | | Event-Driven Fund | | | Credit Event Fund | |
| INVESTMENT INCOME: | | | | | | | | | |
| Interest | | $ | 15,687,918 | | | $ | 1,552,403 | | | $ | 43,121 | |
| Dividend income on | | | | | | | | | | | | |
| long positions | | | 9,318,675 | | | | 296,073 | | | | 6,668 | |
| Total investment income | | | 25,006,593 | | | | 1,848,476 | | | | 49,789 | |
| | | | | | | | | | | | | |
| EXPENSES: | | | | | | | | | | | | |
| Investment advisory fees | | | 11,723,020 | | | | 693,897 | | | | 18,603 | |
| Distribution fees | | | | | | | | | | | | |
| (Investor Class) | | | 1,426,351 | | | | 9,039 | | | | 17 | |
| Sub transfer agent fees | | | | | | | | | | | | |
| (Investor Class) | | | 693,946 | | | | 4,287 | | | | 1 | |
| Sub transfer agent fees | | | | | | | | | | | | |
| (Institutional Class) | | | 406,949 | | | | 53,600 | | | | 478 | |
| Administration fees | | | 415,433 | | | | 44,062 | | | | 10,558 | |
| Professional fees | | | 386,666 | | | | 64,014 | | | | 52,297 | |
| Transfer agent and shareholder | | | | | | | | | | | | |
| servicing agent fees | | | 241,117 | | | | 27,315 | | | | 12,414 | |
| Reports to shareholders | | | 168,617 | | | | 13,213 | | | | 11,112 | |
| Fund accounting expenses | | | 127,996 | | | | 47,333 | | | | 11,081 | |
| Trustees’ fees and expenses | | | 113,945 | | | | 13,646 | | | | 7,456 | |
| Custody fees | | | 108,773 | | | | 13,029 | | | | 1,950 | |
| Federal and state | | | | | | | | | | | | |
| registration fees | | | 99,014 | | | | 25,095 | | | | 4,355 | |
| Compliance fees | | | 93,414 | | | | 4,332 | | | | 154 | |
| Miscellaneous expenses | | | 70,815 | | | | 4,826 | | | | 1,096 | |
| Borrowing expenses on | | | | | | | | | | | | |
| securities sold short | | | 1,667,307 | | | | 100,337 | | | | — | |
| Dividends and interest on | | | | | | | | | | | | |
| securities sold short | | | 3,924,440 | | | | 207,316 | | | | — | |
| Total expenses | | | | | | | | | | | | |
| before expense | | | | | | | | | | | | |
| waiver/reimbursement | | | | | | | | | | | | |
| by adviser | | | 21,667,803 | | | | 1,325,341 | | | | 131,572 | |
| Expense waived/reimbursed | | | | | | | | | | | | |
| by adviser (Note 3) | | | (441,877 | ) | | | (42,745 | ) | | | (101,045 | ) |
| Net expenses | | | 21,225,926 | | | | 1,282,596 | | | | 30,527 | |
| NET INVESTMENT INCOME | | $ | 3,780,667 | | | $ | 565,880 | | | $ | 19,262 | |
The accompanying notes are an integral part of these financial statements.
The Merger Fund and Westchester Capital Funds
STATEMENTS OF OPERATIONS (continued)
For the Period Ended June 30, 2018 (Unaudited)
| | | | | | WCM Alternatives: | | | WCM Alternatives: | |
| | | The Merger Fund | | | Event-Driven Fund | | | Credit Event Fund | |
| REALIZED AND CHANGE IN | | | | | | | | | |
| UNREALIZED GAIN (LOSS) | | | | | | | | | |
| ON INVESTMENTS: | | | | | | | | | |
| Realized gain (loss) on: | | | | | | | | | |
| Investments | | $ | 47,252,561 | | | $ | (1,010,713 | ) | | $ | (13,312 | ) |
| Securities sold short | | | (18,505,232 | ) | | | (1,399,721 | ) | | | — | |
| Written option contracts | | | | | | | | | | | | |
| expired or closed | | | (1,033,365 | ) | | | 805,569 | | | | — | |
| Forward currency | | | | | | | | | | | | |
| exchange contracts | | | (2,424,274 | ) | | | (233,207 | ) | | | — | |
| Swap contracts | | | 56,492,410 | | | | (1,750,969 | ) | | | 11,317 | |
| Foreign currency transactions | | | (547,364 | ) | | | 1,099 | | | | — | |
| Net realized gain (loss) | | | 81,234,736 | | | | (3,587,942 | ) | | | (1,995 | ) |
| Change in unrealized | | | | | | | | | | | | |
| appreciation (depreciation) on: | | | | | | | | | | | | |
| Investments | | | 5,552,248 | | | | 696,479 | | | | (5,541 | ) |
| Securities sold short | | | 30,453,459 | | | | 2,341,024 | | | | — | |
| Written option contracts | | | 68,648 | | | | 161,707 | | | | — | |
| Forward currency | | | | | | | | | | | | |
| exchange contracts | | | 11,913,203 | | | | 720,654 | | | | — | |
| Swap contracts | | | 3,864,219 | | | | 5,291,012 | | | | (9,007 | ) |
| Foreign currency translation | | | (186 | ) | | | 26 | | | | — | |
| Net change in unrealized | | | | | | | | | | | | |
| appreciation (depreciation) | | | 51,851,591 | | | | 9,210,902 | | | | (14,548 | ) |
| NET REALIZED AND CHANGE IN | | | | | | | | | | | | |
| UNREALIZED GAIN (LOSS) | | | | | | | | | | | | |
| ON INVESTMENTS | | | 133,086,327 | | | | 5,622,960 | | | | (16,543 | ) |
| NET INCREASE IN | | | | | | | | | | | | |
| NET ASSETS RESULTING | | | | | | | | | | | | |
| FROM OPERATIONS | | $ | 136,866,994 | | | $ | 6,188,840 | | | $ | 2,719 | |
The accompanying notes are an integral part of these financial statements.
The Merger Fund
STATEMENTS OF CHANGES IN NET ASSETS
| | | Six Months Ended | | | Year Ended | |
| | | June 30, 2018 | | | December 31, 2017 | |
| | | (Unaudited) | | | | |
| Net investment income | | $ | 3,780,667 | | | $ | 13,712,613 | |
| Net realized gain on investments, securities | | | | | | | | |
| sold short, written option contracts | | | | | | | | |
| expired or closed, forward currency | | | | | | | | |
| exchange contracts, swap contracts, | | | | | | | | |
| and foreign currency transactions | | | 81,234,736 | | | | 100,103,386 | |
| Net change in unrealized appreciation | | | | | | | | |
| (depreciation) on investments, securities sold | | | | | | | | |
| short, written option contracts, forward | | | | | | | | |
| currency exchange contracts, swap contracts, | | | | | | | | |
| and foreign currency translation | | | 51,851,591 | | | | (39,708,339 | ) |
| Net increase in net assets | | | | | | | | |
| resulting from operations | | | 136,866,994 | | | | 74,107,660 | |
| | | | | | | | | |
| Investor Class — | | | | | | | | |
| Distributions to shareholders from: (Note 5) | | | | | | | | |
| Net investment income | | | — | | | | (6,825,795 | ) |
| Total dividends and distributions — | | | | | | | | |
| Investor Class | | | — | | | | (6,825,795 | ) |
| | | | | | | | | |
| Institutional Class — | | | | | | | | |
| Distributions to shareholders from: (Note 5) | | | | | | | | |
| Net investment income | | | — | | | | (11,286,042 | ) |
| Total dividends and distributions — | | | | | | | | |
| Institutional Class | | | — | | | | (11,286,042 | ) |
| Net increase (decrease) in net assets from | | | | | | | | |
| capital share transactions (Note 4) | | | 2,049,131 | | | | (659,130,663 | ) |
| Net increase (decrease) in net assets | | | 138,916,125 | | | | (603,134,840 | ) |
| | | | | | | | | |
| NET ASSETS: | | | | | | | | |
| Beginning of period | | | 2,314,371,600 | | | | 2,917,506,440 | |
| End of period (including accumulated | | | | | | | | |
| undistributed net investment loss of | | | | | | | | |
| $(8,024,499), and $(11,805,166), respectively) | | $ | 2,453,287,725 | | | $ | 2,314,371,600 | |
The accompanying notes are an integral part of these financial statements.
WCM Alternatives: Event-Driven Fund
STATEMENTS OF CHANGES IN NET ASSETS
| | | Six Months Ended | | | Year Ended | |
| | | June 30, 2018 | | | December 31, 2017 | |
| | | (Unaudited) | | | | |
| Net investment income (loss) | | $ | 565,880 | | | $ | (26,139 | ) |
| Net realized gain (loss) on investments, | | | | | | | | |
| securities sold short, written option contracts | | | | | | | | |
| expired or closed, forward currency exchange | | | | | | | | |
| contracts, swap contracts, and foreign | | | | | | | | |
| currency transactions | | | (3,587,942 | ) | | | 10,828,732 | |
| Net change in unrealized appreciation | | | | | | | | |
| (depreciation) on investments, securities sold | | | | | | | | |
| short, written option contracts, forward | | | | | | | | |
| currency exchange contracts, swap contracts, | | | | | | | | |
| and foreign currency translation | | | 9,210,902 | | | | (5,668,571 | ) |
| Net increase in net assets | | | | | | | | |
| resulting from operations | | | 6,188,840 | | | | 5,134,022 | |
| | | | | | | | | |
| Investor Class — | | | | | | | | |
| Distributions to shareholders from: (Note 5) | | | | | | | | |
| Net investment income | | | — | | | | — | |
| Net realized gains | | | — | | | | (55,388 | ) |
| Total dividends and distributions — | | | | | | | | |
| Investor Class | | | — | | | | (55,388 | ) |
| | | | | | | | | |
| Institutional Class — | | | | | | | | |
| Distributions to shareholders from: (Note 5) | | | | | | | | |
| Net investment income | | | — | | | | — | |
| Net realized gains | | | — | | | | (941,430 | ) |
| Total dividends and distributions — | | | | | | | | |
| Institutional Class | | | — | | | | (941,430 | ) |
| Net increase (decrease) in net assets from | | | | | | | | |
| capital share transactions (Note 4) | | | 18,616,689 | | | | (17,494,919 | ) |
| Net increase (decrease) in net assets | | | 24,805,529 | | | | (13,357,715 | ) |
| | | | | | | | | |
| NET ASSETS: | | | | | | | | |
| Beginning of period | | | 99,588,990 | | | | 112,946,705 | |
| End of period (including accumulated | | | | | | | | |
| undistributed net investment income of | | | | | | | | |
| $2,717,529, and $2,151,649, respectively) | | $ | 124,394,519 | | | $ | 99,588,990 | |
The accompanying notes are an integral part of these financial statements.
WCM Alternatives: Credit Event Fund
STATEMENT OF CHANGES IN NET ASSETS
| | | Six Months Ended | |
| | | June 30, 2018 | |
| | | (Unaudited) | |
| Net investment income | | $ | 19,262 | |
| Net realized loss on investments, swap contracts, | | | | |
| and foreign currency transactions | | | (1,995 | ) |
| Net change in unrealized depreciation on investments, | | | | |
| swap contracts, and foreign currency translation | | | (14,548 | ) |
| Net increase in net assets resulting from operations | | | 2,719 | |
| | | | | |
| Net increase in net assets from capital share transactions (Note 4)* | | | 3,948,142 | |
| Net increase in net assets | | | 3,950,861 | |
| | | | | |
| NET ASSETS: | | | | |
| Beginning of period* | | | — | |
| End of period (including accumulated undistributed | | | | |
| net investment income of $19,262) | | $ | 3,950,861 | |
| * | The Fund received a seed investment of $2,710,000 on December 29, 2017 in a non-interest bearing account. The Fund did not conduct investment activity nor incur operating expenses until January 2, 2018. |
The accompanying notes are an integral part of these financial statements.
(This Page Intentionally Left Blank.)
The Merger Fund
FINANCIAL HIGHLIGHTS
Selected per share data is based on a share of beneficial interest outstanding throughout each period/year.
Institutional Class
| | | | | | | | | | | | | | | | | | For the | |
| | | | | | | | | | | | | | | | | | Period from | |
| | | | | | | | | | | | | | | | | | August 1, | |
| | | Six Months | | | | | | | | | | | | | | | 2013^ | |
| | | Ended | | | | | | | | | | | | | | | through | |
| | | June 30, | | | Year Ended December 31, | | | December 31, | |
| | | 2018 | | | 2017 | | | 2016 | | | 2015 | | | 2014 | | | 2013 | |
| | | (Unaudited) | | | | | | | | | | | | | | | | |
| Per Share Data: | | | | | | | | | | | | | | | | | | |
| Net asset value, | | | | | | | | | | | | | | | | | | |
| beginning | | | | | | | | | | | | | | | | | | |
| of period | | $ | 15.83 | | | $ | 15.56 | | | $ | 15.25 | | | $ | 15.58 | | | $ | 15.97 | | | $ | 16.06 | |
| | | | | | | | | | | | | | | | | | | | | | | | | |
| Income from | | | | | | | | | | | | | | | | | | | | | | | | |
| investment | | | | | | | | | | | | | | | | | | | | | | | | |
| operations: | | | | | | | | | | | | | | | | | | | | | | | | |
| Net investment | | | | | | | | | | | | | | | | | | | | | | | | |
| income | | | | | | | | | | | | | | | | | | | | | | | | |
(loss)(1)(2) | | | 0.04 | | | | 0.10 | | | | (0.04 | ) | | | (0.03 | ) | | | 0.37 | | | | 0.03 | |
| Net realized and | | | | | | | | | | | | | | | | | | | | | | | | |
| unrealized gain | | | | | | | | | | | | | | | | | | | | | | | | |
| (loss) on | | | | | | | | | | | | | | | | | | | | | | | | |
| investments | | | 0.92 | | | | 0.33 | | | | 0.49 | | | | (0.05 | ) | | | (0.10 | ) | | | 0.31 | |
| Total from | | | | | | | | | | | | | | | | | | | | | | | | |
| investment | | | | | | | | | | | | | | | | | | | | | | | | |
| operations | | | 0.96 | | | | 0.43 | | | | 0.45 | | | | (0.08 | ) | | | 0.27 | | | | 0.34 | |
| | | | | | | | | | | | | | | | | | | | | | | | | |
| Less distributions: | | | | | | | | | | | | | | | | | | | | | | | | |
| From net | | | | | | | | | | | | | | | | | | | | | | | | |
| investment | | | | | | | | | | | | | | | | | | | | | | | | |
| income | | | — | | | | (0.16 | ) | | | (0.14 | ) | | | (0.18 | ) | | | (0.45 | ) | | | (0.35 | ) |
| From net | | | | | | | | | | | | | | | | | | | | | | | | |
| realized gains | | | — | | | | — | | | | — | | | | (0.07 | ) | | | (0.21 | ) | | | (0.08 | ) |
| Total dividends | | | | | | | | | | | | | | | | | | | | | | | | |
| and | | | | | | | | | | | | | | | | | | | | | | | | |
| distributions | | | — | | | | (0.16 | ) | | | (0.14 | ) | | | (0.25 | ) | | | (0.66 | ) | | | (0.43 | ) |
| Net Asset Value, | | | | | | | | | | | | | | | | | | | | | | | | |
| end of period | | $ | 16.79 | | | $ | 15.83 | | | $ | 15.56 | | | $ | 15.25 | | | $ | 15.58 | | | $ | 15.97 | |
| Total Return | | | 5.87 | %(3) | | | 2.74 | % | | | 2.94 | % | | | (0.52 | )% | | | 1.63 | % | | | 2.20 | %(3) |
The accompanying notes are an integral part of these financial statements.
The Merger Fund
FINANCIAL HIGHLIGHTS (continued)
Institutional Class
| | | | | | | | | | | | | | | | | | For the | |
| | | | | | | | | | | | | | | | | | Period from | |
| | | | | | | | | | | | | | | | | | August 1, | |
| | | Six Months | | | | | | | | | | | | | | | 2013^ | |
| | | Ended | | | | | | | | | | | | | | | through | |
| | | June 30, | | | Year Ended December 31, | | | December 31, | |
| | | 2018 | | | 2017 | | | 2016 | | | 2015 | | | 2014 | | | 2013 | |
| | | (Unaudited) | | | | | | | | | | | | | | | | |
| Supplemental data | | | | | | | | | | | | | | | | | | |
| and ratios: | | | | | | | | | | | | | | | | | | |
| Net assets, | | | | | | | | | | | | | | | | | | |
| end of period | | | | | | | | | | | | | | | | | | |
| (in 000’s) | | $ | 1,260,743 | | | $ | 1,152,718 | | | $ | 1,377,041 | | | $ | 1,247,332 | | | $ | 1,332,078 | | | $ | 172,247 | |
| Ratio of gross | | | | | | | | | | | | | | | | | | | | | | | | |
| expenses to | | | | | | | | | | | | | | | | | | | | | | | | |
| average net assets: | | | | | | | | | | | | | | | | | | | | | | | | |
| Before expense | | | | | | | | | | | | | | | | | | | | | | | | |
| waiver | | | 1.70 | %(4) | | | 1.55 | % | | | 1.70 | % | | | 1.54 | % | | | 1.44 | % | | | 1.32 | %(4) |
| After expense | | | | | | | | | | | | | | | | | | | | | | | | |
| waiver | | | 1.66 | %(4) | | | 1.48 | % | | | 1.59 | % | | | 1.41 | % | | | 1.28 | % | | | 1.19 | %(4) |
| Ratio of dividends | | | | | | | | | | | | | | | | | | | | | | | | |
| and interest on | | | | | | | | | | | | | | | | | | | | | | | | |
| short positions and | | | | | | | | | | | | | | | | | | | | | | | | |
| borrowing expense | | | | | | | | | | | | | | | | | | | | | | | | |
| on securities sold | | | | | | | | | | | | | | | | | | | | | | | | |
| short to average | | | | | | | | | | | | | | | | | | | | | | | | |
| net assets | | | 0.48 | %(4) | | | 0.37 | % | | | 0.52 | % | | | 0.40 | % | | | 0.29 | % | | | 0.19 | %(4) |
| Ratio of operating | | | | | | | | | | | | | | | | | | | | | | | | |
| expense to average | | | | | | | | | | | | | | | | | | | | | | | | |
| net assets | | | | | | | | | | | | | | | | | | | | | | | | |
| excluding dividends | | | | | | | | | | | | | | | | | | | | | | | | |
| and interest on | | | | | | | | | | | | | | | | | | | | | | | | |
| short positions | | | | | | | | | | | | | | | | | | | | | | | | |
| and borrowing | | | | | | | | | | | | | | | | | | | | | | | | |
| expense on | | | | | | | | | | | | | | | | | | | | | | | | |
| securities sold | | | | | | | | | | | | | | | | | | | | | | | | |
| short (after | | | | | | | | | | | | | | | | | | | | | | | | |
| expense waiver) | | | 1.19 | %(4) | | | 1.11 | % | | | 1.07 | % | | | 1.01 | % | | | 0.99 | % | | | 1.00 | %(4) |
| Ratio of net | | | | | | | | | | | | | | | | | | | | | | | | |
| investment income | | | | | | | | | | | | | | | | | | | | | | | | |
| (loss) to average | | | | | | | | | | | | | | | | | | | | | | | | |
| net assets | | | 0.47 | %(4) | | | 0.66 | % | | | (0.27 | )% | | | (0.21 | )% | | | 2.30 | % | | | 0.42 | %(4) |
| Portfolio | | | | | | | | | | | | | | | | | | | | | | | | |
turnover rate(5) | | | 72 | %(3) | | | 166 | % | | | 182 | % | | | 157 | % | | | 137 | % | | | 194 | %(3) |
The accompanying notes are an integral part of these financial statements.
The Merger Fund
FINANCIAL HIGHLIGHTS (continued)
| (1) | Net investments income before dividends and interest on short positions and borrowing expense on securities sold short for the six months ended June 30, 2018 and the years ended December 31, 2017, 2016, 2015, 2014 and the period ended December 31, 2013 was $0.08, $0.16, $0.04, $0.03, $0.42, and $0.04, respectively. |
| (2) | Net investment income (loss) per share has been calculated based on average shares outstanding during the period. |
| (3) | Not annualized. |
| (4) | Annualized. |
| (5) | The numerator for the portfolio turnover rate includes the lesser of purchases or sales (excluding short-term investments, short-term options, forward currency contracts, swap contracts and short positions). The denominator includes the average long positions throughout the period. |
| ^ | Commencement of operations. |
The accompanying notes are an integral part of these financial statements.
(This Page Intentionally Left Blank.)
The Merger Fund
FINANCIAL HIGHLIGHTS
Selected per share data is based on a share of beneficial interest outstanding throughout each period/year.
Investor Class
| | | Six Months | | | | | | | | | | | | | | | | |
| | | Ended | | | | | | | | | | | | | | | | |
| | | June 30, | | | Year Ended December 31, | |
| | | 2018 | | | 2017 | | | 2016 | | | 2015 | | | 2014 | | | 2013 | |
| | | (Unaudited) | | | | | | | | | | | | | | | | |
| Per Share Data: | | | | | | | | | | | | | | | | | | |
| Net asset value, | | | | | | | | | | | | | | | | | | |
| beginning of period | | $ | 15.94 | | | $ | 15.66 | | | $ | 15.31 | | | $ | 15.63 | | | $ | 16.01 | | | $ | 15.83 | |
| | | | | | | | | | | | | | | | | | | | | | | | | |
| Income from | | | | | | | | | | | | | | | | | | | | | | | | |
| investment operations: | | | | | | | | | | | | | | | | | | | | | | | | |
| Net investment | | | | | | | | | | | | | | | | | | | | | | | | |
income (loss)(1)(2) | | | 0.01 | | | | 0.05 | | | | (0.09 | ) | | | (0.08 | ) | | | 0.33 | | | | 0.04 | |
| Net realized and | | | | | | | | | | | | | | | | | | | | | | | | |
| unrealized gain (loss) | | | | | | | | | | | | | | | | | | | | | | | | |
| on investments | | | 0.93 | | | | 0.32 | | | | 0.49 | | | | (0.05 | ) | | | (0.10 | ) | | | 0.53 | |
| Total from | | | | | | | | | | | | | | | | | | | | | | | | |
| investment operations | | | 0.94 | | | | 0.37 | | | | 0.40 | | | | (0.13 | ) | | | 0.23 | | | | 0.57 | |
| | | | | | | | | | | | | | | | | | | | | | | | | |
| Less distributions: | | | | | | | | | | | | | | | | | | | | | | | | |
| From net | | | | | | | | | | | | | | | | | | | | | | | | |
| investment income | | | — | | | | (0.09 | ) | | | (0.05 | ) | | | (0.12 | ) | | | (0.40 | ) | | | (0.31 | ) |
| From net realized gains | | | — | | | | — | | | | — | | | | (0.07 | ) | | | (0.21 | ) | | | (0.08 | ) |
| Total dividends | | | | | | | | | | | | | | | | | | | | | | | | |
| and distributions | | | — | | | | (0.09 | ) | | | (0.05 | ) | | | (0.19 | ) | | | (0.61 | ) | | | (0.39 | ) |
| Net Asset Value, | | | | | | | | | | | | | | | | | | | | | | | | |
| end of period | | $ | 16.88 | | | $ | 15.94 | | | $ | 15.66 | | | $ | 15.31 | | | $ | 15.63 | | | $ | 16.01 | |
| Total Return | | | 5.77 | %(3) | | | 2.39 | % | | | 2.61 | % | | | (0.82 | )% | | | 1.43 | % | | | 3.61 | % |
The accompanying notes are an integral part of these financial statements.
The Merger Fund
FINANCIAL HIGHLIGHTS (continued)
Investor Class
| | | Six Months | | | | | | | | | | | | | | | | |
| | | Ended | | | | | | | | | | | | | | | | |
| | | June 30, | | | Year Ended December 31, | |
| | | 2018 | | | 2017 | | | 2016 | | | 2015 | | | 2014 | | | 2013 | |
| | | (Unaudited) | | | | | | | | | | | | | | | | |
| Supplemental data and ratios: | | | | | | | | | | | | | | | | | | |
| Net assets, end | | | | | | | | | | | | | | | | | | |
| of period (in millions) | | $ | 1,193 | | | $ | 1,162 | | | $ | 1,540 | | | $ | 3,509 | | | $ | 4,069 | | | $ | 4,843 | |
| Ratio of gross expenses | | | | | | | | | | | | | | | | | | | | | | | | |
| to average net assets: | | | | | | | | | | | | | | | | | | | | | | | | |
| Before expense waiver | | | 2.00 | %(4) | | | 1.87 | % | | | 2.03 | % | | | 1.87 | % | | | 1.68 | % | | | 1.61 | % |
| After expense waiver | | | 1.97 | %(4) | | | 1.80 | % | | | 1.92 | % | | | 1.74 | % | | | 1.52 | % | | | 1.48 | % |
| Ratio of dividends and interest | | | | | | | | | | | | | | | | | | | | | | | | |
| on short positions and borrowing | | | | | | | | | | | | | | | | | | | | | | | | |
| expense on securities sold | | | | | | | | | | | | | | | | | | | | | | | | |
| short to average net assets | | | 0.48 | %(4) | | | 0.37 | % | | | 0.52 | % | | | 0.40 | % | | | 0.29 | % | | | 0.22 | % |
| Ratio of operating expense to | | | | | | | | | | | | | | | | | | | | | | | | |
| average net assets excluding | | | | | | | | | | | | | | | | | | | | | | | | |
| dividends and interest on | | | | | | | | | | | | | | | | | | | | | | | | |
| short positions and borrowing | | | | | | | | | | | | | | | | | | | | | | | | |
| expense on securities sold | | | | | | | | | | | | | | | | | | | | | | | | |
| short (after expense waiver) | | | 1.49 | %(4) | | | 1.43 | % | | | 1.40 | % | | | 1.34 | % | | | 1.23 | % | | | 1.26 | % |
| Ratio of net investment income | | | | | | | | | | | | | | | | | | | | | | | | |
| (loss) to average net assets | | | 0.17 | %(4) | | | 0.34 | % | | | (0.60 | )% | | | (0.53 | )% | | | 2.06 | % | | | 0.22 | % |
Portfolio turnover rate(5) | | | 72 | %(3) | | | 166 | % | | | 182 | % | | | 157 | % | | | 137 | % | | | 194 | % |
| (1) | Net investments income before dividends and interest on short positions and borrowing expense on securities on securities sold short for the six months ended June 30, 2018 and the years ended December 31, 2017, 2016, 2015, 2014 and 2013 was $0.05, $0.11, $(0.01), $(0.02), $0.38, and $0.07, respectively. |
| (2) | Net investment income (loss) per share has been calculated based on average shares outstanding during the period. |
| (3) | Not annualized. |
| (4) | Annualized. |
| (5) | The numerator for the portfolio turnover rate includes the lesser of purchases or sales (excluding short-term investments, short-term options, forward currency contracts, swap contracts and short positions). The denominator includes the average long positions throughout the period. |
The accompanying notes are an integral part of these financial statements.
WCM Alternatives: Event-Driven Fund
FINANCIAL HIGHLIGHTS
Selected per share data is based on a share of beneficial interest outstanding throughout each period/year.
Institutional Class
| | | | | | | | | | | | | | | For the | |
| | | | | | | | | | | | | | | Period from | |
| | | | | | | | | | | | | | | January 2, | |
| | | Six Months | | | | | | | | | | | | 2014^ | |
| | | Ended | | | | | | | | | | | | through | |
| | | June 30, | | | Year Ended December 31, | | | December 31, | |
| | | 2018 | | | 2017 | | | 2016 | | | 2015 | | | 2014 | |
| | | (Unaudited) | | | | | | | | | | | | | |
| Per Share Data: | | | | | | | | | | | | | | | |
| Net asset value, | | | | | | | | | | | | | | | |
| beginning of period | | $ | 10.17 | | | $ | 9.81 | | | $ | 9.62 | | | $ | 10.14 | | | $ | 10.00 | |
| | | | | | | | | | | | | | | | | | | | | |
| Income from | | | | | | | | | | | | | | | | | | | | |
| investment operations: | | | | | | | | | | | | | | | | | | | | |
| Net investment | | | | | | | | | | | | | | | | | | | | |
income (loss)(1)(2) | | | 0.06 | | | | 0.00 | (6) | | | (0.04 | ) | | | 0.01 | | | | 0.05 | |
| Net realized and unrealized | | | | | | | | | | | | | | | | | | | | |
| gain (loss) on investments | | | 0.50 | | | | 0.46 | | | | 0.31 | | | | (0.22 | ) | | | 0.34 | |
| Total from | | | | | | | | | | | | | | | | | | | | |
| investment operations | | | 0.56 | | | | 0.46 | | | | 0.27 | | | | (0.21 | ) | | | 0.39 | |
| | | | | | | | | | | | | | | | | | | | | |
| Less distributions: | | | | | | | | | | | | | | | | | | | | |
| From net | | | | | | | | | | | | | | | | | | | | |
| investment income | | | — | | | | — | | | | (0.08 | ) | | | (0.09 | ) | | | — | |
| From net realized gains | | | — | | | | (0.10 | ) | | | — | | | | (0.22 | ) | | | (0.25 | ) |
| Total dividends | | | | | | | | | | | | | | | | | | | | |
| and distributions | | | — | | | | (0.10 | ) | | | (0.08 | ) | | | (0.31 | ) | | | (0.25 | ) |
| Net Asset Value, | | | | | | | | | | | | | | | | | | | | |
| end of period | | $ | 10.73 | | | $ | 10.17 | | | $ | 9.81 | | | $ | 9.62 | | | $ | 10.14 | |
| Total Return | | | 5.21 | %(3) | | | 4.72 | % | | | 2.86 | % | | | (2.08 | )% | | | 3.87 | %(3) |
The accompanying notes are an integral part of these financial statements.
WCM Alternatives: Event-Driven Fund
FINANCIAL HIGHLIGHTS (continued)
Institutional Class
| | | | | | | | | | | | | | | For the | |
| | | | | | | | | | | | | | | Period from | |
| | | | | | | | | | | | | | | January 2, | |
| | | Six Months | | | | | | | | | | | | 2014^ | |
| | | Ended | | | | | | | | | | | | through | |
| | | June 30, | | | Year Ended December 31, | | | December 31, | |
| | | 2018 | | | 2017 | | | 2016 | | | 2015 | | | 2014 | |
| | | (Unaudited) | | | | | | | | | | | | | |
| Supplemental data and ratios: | | | | | | | | | | | | | | | |
| Net assets, end of | | | | | | | | | | | | | | | |
| period (in 000’s) | | $ | 116,160 | | | $ | 94,031 | | | $ | 112,947 | | | $ | 96,489 | | | $ | 12,085 | |
| Ratio of gross expenses | | | | | | | | | | | | | | | | | | | | |
| to average net assets: | | | | | | | | | | | | | | | | | | | | |
| Before expense | | | | | | | | | | | | | | | | | | | | |
| reimbursement/recoupment | | | 2.37 | %(4) | | | 2.20 | % | | | 2.37 | % | | | 2.23 | % | | | 7.95 | %(4) |
| After expense | | | | | | | | | | | | | | | | | | | | |
| reimbursement/recoupment | | | 2.29 | %(4) | | | 2.24 | % | | | 2.36 | % | | | 2.09 | % | | | 2.39 | %(4) |
| Ratio of dividends and interest | | | | | | | | | | | | | | | | | | | | |
| on short positions and borrowing | | | | | | | | | | | | | | | | | | | | |
| expense on securities sold short | | | | | | | | | | | | | | | | | | | | |
| to average net assets | | | 0.55 | %(4) | | | 0.50 | % | | | 0.62 | % | | | 0.35 | % | | | 0.65 | %(4) |
| Ratio of operating expense to | | | | | | | | | | | | | | | | | | | | |
| average net assets excluding | | | | | | | | | | | | | | | | | | | | |
| dividends and interest on | | | | | | | | | | | | | | | | | | | | |
| short positions and borrowing | | | | | | | | | | | | | | | | | | | | |
| expense on securities sold | | | | | | | | | | | | | | | | | | | | |
| short (after expense | | | | | | | | | | | | | | | | | | | | |
| reimbursement/recoupment) | | | 1.74 | %(4) | | | 1.74 | % | | | 1.74 | % | | | 1.74 | % | | | 1.74 | %(4) |
| Ratio of net investment income | | | | | | | | | | | | | | | | | | | | |
| (loss) to average net assets | | | 1.04 | %(4) | | | (0.02 | )% | | | (0.46 | )% | | | 0.05 | % | | | 0.52 | %(4) |
Portfolio turnover rate(5) | | | 106 | %(3) | | | 283 | % | | | 217 | % | | | 199 | % | | | 212 | %(3) |
| (1) | Net investments income before dividends and interest on short positions and borrowing expense on securities sold short for the six months ended June 30, 2018 and the years ended December 31, 2017, 2016, 2015, and the period ended December 31, 2014 was $0.08, $0.05, $0.02, $0.04, and $0.12, respectively. |
| (2) | Net investment income (loss) per share has been calculated based on average shares outstanding during the period. |
| (3) | Not annualized. |
| (4) | Annualized. |
| (5) | The numerator for the portfolio turnover rate includes the lesser of purchases or sales (excluding short-term investments, short-term options, forward currency contracts, swap contracts and short positions). The denominator includes the average long positions throughout the period. |
| (6) | Amount calculated is less than $(0.005). |
| ^ | Commencement of operations. |
The accompanying notes are an integral part of these financial statements.
WCM Alternatives: Event-Driven Fund
FINANCIAL HIGHLIGHTS
Selected per share data is based on a share of beneficial interest outstanding throughout each period.
Investor Class
| | | | | | For the | |
| | | | | | Period from | |
| | | | | | March 22, 2017^ | |
| | | | | | through | |
| | | Six Months Ended | | | December 31, | |
| | | June 30, 2018 | | | 2017 | |
| | | (Unaudited) | | | | |
| Per Share Data: | | | | | | |
| Net asset value, beginning of period | | $ | 10.16 | | | $ | 9.89 | |
| Income from investment operations: | | | | | | | | |
Net investment income (loss)(1)(2) | | | 0.04 | | | | (0.01 | ) |
| Net realized and unrealized gain on investments | | | 0.49 | | | | 0.38 | |
| Total from investment operations | | | 0.53 | | | | 0.37 | |
| | | | | | | | | |
| Less distributions: | | | | | | | | |
| From net investment income | | | — | | | | — | |
| From net realized gains | | | — | | | | (0.10 | ) |
| Total dividends and distributions | | | — | | | | (0.10 | ) |
| Net Asset Value, end of period | | $ | 10.69 | | | $ | 10.16 | |
| Total Return | | | 5.02 | %(3) | | | 3.77 | %(3) |
| | | | | | | | | |
| Supplemental data and ratios: | | | | | | | | |
| Net assets, end of period (in 000’s) | | $ | 8,234 | | | $ | 5,558 | |
| Ratio of gross expenses to average net assets: | | | | | | | | |
| Before expense reimbursement/recoupment | | | 2.63 | %(4) | | | 2.52 | %(4) |
| After expense reimbursement/recoupment | | | 2.54 | %(4) | | | 2.54 | %(4) |
| Ratio of dividends and interest on short positions | | | | | | | | |
| and borrowing expense on securities sold | | | | | | | | |
| short to average net assets | | | 0.55 | %(4) | | | 0.55 | %(4) |
| Ratio of operating expense to average net assets | | | | | | | | |
| excluding dividends and interest on short | | | | | | | | |
| positions and borrowing expense on securities sold | | | | | | | | |
| short (after expense reimbursement/recoupment) | | | 1.99 | %(4) | | | 1.99 | %(4) |
| Ratio of net investment income (loss) | | | | | | | | |
| to average net assets | | | 0.79 | %(4) | | | (0.17 | )%(4) |
Portfolio turnover rate(5) | | | 106 | %(3) | | | 283 | %(3) |
| (1) | Net investments income before dividends and interest on short positions and borrowing expense on securities on securities sold short for the six months ended June 30, 2018 and the period ended December 31, 2017 was $0.03 and $0.03, respectively. |
| (2) | Net investment income (loss) per share has been calculated based on average shares outstanding during the period. |
| (3) | Not annualized. |
| (4) | Annualized. |
| (5) | The numerator for the portfolio turnover rate includes the lesser of purchases or sales (excluding short-term investments, short-term options, forward currency contracts, swap contracts and short positions). The denominator includes the average long positions throughout the period. |
| ^ | Commencement of operations. |
The accompanying notes are an integral part of these financial statements.
WCM Alternatives: Credit Event Fund
FINANCIAL HIGHLIGHTS
Selected per share data is based on a share of beneficial interest outstanding throughout each period.
Institutional Class
| | | Six Months Ended | |
| | | June 30, 2018 | |
| Per Share Data: | | | |
| Net asset value, beginning of period | | $ | 10.00 | |
| Income from investment operations: | | | | |
Net investment income(1) | | | 0.05 | |
| Net realized and unrealized loss on investments | | | (0.04 | ) |
| Total from investment operations | | | 0.01 | |
| Net Asset Value, end of period | | $ | 10.01 | |
| Total Return | | | 0.10 | %(2) |
| | | | | |
| Supplemental data and ratios: | | | | |
| Net assets, end of period (in 000’s) | | $ | 3,921 | |
| Ratio of gross expenses to average net assets: | | | | |
| Before expense reimbursement | | | 7.07 | %(3) |
| After expense reimbursement | | | 1.64 | %(3) |
| Ratio of net investment income to average net assets | | | 1.04 | %(3) |
Portfolio turnover rate(4) | | | 85 | %(2) |
| (1) | Net investment income per share has been calculated based on average shares outstanding during the period. |
| (2) | Not annualized. |
| (3) | Annualized. |
| (4) | The numerator for the portfolio turnover rate includes the lesser of purchases or sales (excluding short-term investments and swap contracts). The denominator includes the average long positions throughout the period. |
The accompanying notes are an integral part of these financial statements.
WCM Alternatives: Credit Event Fund
FINANCIAL HIGHLIGHTS
Selected per share data is based on a share of beneficial interest outstanding throughout each period.
Investor Class
| | | Six Months Ended | |
| | | June 30, 2018 | |
| Per Share Data: | | | |
| Net asset value, beginning of period | | $ | 10.00 | |
| Income from investment operations: | | | | |
Net investment income(1) | | | 0.04 | |
| Net realized and unrealized loss on investments | | | (0.04 | ) |
| Total from investment operations | | | — | |
| Net Asset Value, end of period | | $ | 10.00 | |
| Total Return | | | 0.00 | %(2) |
| | | | | |
| Supplemental data and ratios: | | | | |
| Net assets, end of period | | $ | 29,923 | |
| Ratio of gross expenses to average net assets: | | | | |
| Before expense reimbursement | | | 7.31 | %(3) |
| After expense reimbursement | | | 1.89 | %(3) |
| Ratio of net investment income to average net assets | | | 0.79 | %(3) |
Portfolio turnover rate(4) | | | 85 | %(2) |
| (1) | Net investment income per share has been calculated based on average shares outstanding during the period. |
| (2) | Not annualized. |
| (3) | Annualized. |
| (4) | The numerator for the portfolio turnover rate includes the lesser of purchases or sales (excluding short-term investments and swap contracts). The denominator includes the average long positions throughout the period. |
The accompanying notes are an integral part of these financial statements.
The Merger Fund and Westchester Capital Funds
NOTES TO THE FINANCIAL STATEMENTS
June 30, 2018 (Unaudited)
Note 1 — ORGANIZATION
The Merger Fund (“TMF”) is a no-load, open-end, diversified investment company organized as a trust under the laws of the Commonwealth of Massachusetts on April 12, 1982, and registered under the Investment Company Act of 1940, as amended (the “1940 Act”). TMF was formerly known as the Risk Portfolio of The Ayco Fund. In January of 1989, TMF’s fundamental investment policies were amended to permit TMF to engage in merger arbitrage. At the same time, Westchester Capital Management, Inc. became TMF’s investment adviser, and TMF began to do business as The Merger Fund. In a transaction that closed on December 31, 2010, Westchester Capital Management, Inc. transferred substantially all of its business and assets to Westchester Capital Management, LLC (the “Adviser”), which became TMF’s investment adviser. Therefore, the performance information included for periods prior to 2011 reflects the performance of Westchester Capital Management, Inc. Roy Behren and Michael Shannon, TMF’s current portfolio managers, have served as co-portfolio managers of TMF since January 2007. The Investor Class inception date was January 31, 1989, and the Institutional Class inception date was August 1, 2013. The investment objective of TMF is to seek to achieve capital growth by engaging in merger arbitrage. Merger arbitrage is a highly specialized investment approach generally designed to profit from the successful completion of publicly announced mergers, takeovers, tender offers, leveraged buyouts, spin-offs, liquidations and other corporate reorganizations. At June 30, 2018, 84.8% of the shares outstanding of TMF’s Investor Class were owned by 6 omnibus accounts. At June 30, 2018, 80.9% of the shares outstanding of TMF’s Institutional Class were owned by 6 omnibus accounts.
Westchester Capital Funds (“WCF”) is an open-end management investment company organized under the laws of the Commonwealth of Massachusetts on March 20, 2013, and registered under the 1940 Act. WCM Alternatives: Event-Driven Fund (“EDF”), the first series within WCF, is a no-load, open-end, diversified investment company with two classes of shares, Investor Class shares and Institutional Class shares. The Institutional Class inception date was January 2, 2014. The Investor Class inception date was March 22, 2017. The investment objective of EDF is to seek to provide attractive risk-adjusted returns with low relative volatility in virtually all market environments. WCM Alternatives: Credit Event Fund (“CEF”), the second series within WCF, is a no-load, open-end, non-diversified investment company with two classes of shares, Investor Class shares and Institutional Class shares. The Institutional Class and Investor Class inception date was December 29, 2017. The investment objective of EDF is to seek attractive risk-adjusted returns independent of market
The Merger Fund and Westchester Capital Funds
NOTES TO THE FINANCIAL STATEMENTS (continued)
June 30, 2018 (Unaudited)
Note 1 — ORGANIZATION (continued)
cycles. Risk-adjusted return is a concept that considers not only an investment’s return, but also the amount of potential risk involved in producing that return. At June 30, 2018, 96.0% of the shares outstanding of EDF’s Investor Class were owned by 3 omnibus accounts. At June 30, 2018, 97.7% of the shares outstanding of EDF’s Institutional Class were owned by 3 omnibus accounts. At June 30, 2018, 79.9% of the shares outstanding of CEF’s Investor Class were owned by 3 omnibus accounts. At June 30, 2018, 51.0% and 34.8% of the shares outstanding of CEF’s Institutional Class were owned by 2 omnibus accounts and by affiliates of the Adviser, respectively.
Each class of shares of TMF, EDF and CEF (each a “Fund” and together, the “Funds”) has different eligibility and minimum investment requirements. The underlying assets attributable to a class of a Fund are charged with the expenses attributable to that class of the Fund and with a share of the general expenses of the Fund. Any general expenses of a Fund that are not readily identifiable as belonging to a particular class of the Fund are allocated by or under the direction of the Boards of Trustees of the Funds (the “Board of Trustees” or “Trustees”) in such manner as the Trustees determine. Shares of classes may have different voting rights, such as (i) when required by the 1940 Act, or (ii) when the Trustees determine that such a matter affects only the interests of a particular class. Shares have no preemptive or subscription rights. The Institutional Class shares do not have a distribution fee. Income, expenses (other than expenses attributable to a specific class), and realized and unrealized gains or losses on investments of a Fund are allocated to each class of a Fund based on its relative net assets.
Note 2 — SIGNIFICANT ACCOUNTING POLICIES
The following is a summary of significant accounting policies followed by the Funds in the preparation of their financial statements. These policies are in conformity with U.S. generally accepted accounting principles (“GAAP”). The Funds are investment companies and, accordingly, follow the investment company accounting and reporting guidance of the Financial Accounting Standards Board Accounting Standards Codification Topic 946 – Investment Companies. The presentation of financial statements in conformity with GAAP requires management to make estimates and assumptions that affect the reported amount of assets and liabilities at the date of the financial statements and the reported amounts of revenues and expenses during the reporting period. Actual results could differ from those estimates and assumptions.
The Merger Fund and Westchester Capital Funds
NOTES TO THE FINANCIAL STATEMENTS (continued)
June 30, 2018 (Unaudited)
Note 2 — SIGNIFICANT ACCOUNTING POLICIES (continued)
A. Investment Valuation
Equity securities, including common and preferred stocks, closed-end funds and ETFs, that trade on an exchange will typically be valued based on the last reported sale price. Securities listed on NASDAQ are typically valued using the NASDAQ Official Closing Price. The securities valued using quoted prices in active markets are classified as Level 1 investments. If, on a particular day, an exchange-listed security does not trade, then the mean between the closing bid and asked prices will typically be used to value the security. These securities are classified as Level 2 investments. Fixed income securities having a maturity of greater than 60 days are typically valued based on evaluations provided by an independent pricing vendor. Investments in United States government securities (other than short-term securities) are valued at the mean between the 4:00 p.m. New York time bid and asked prices supplied by a third party vendor. Short-term fixed-income securities having a maturity of less than 60 days are valued at market quotations or based on valuations supplied by a third party pricing service. If a reliable price from a third party pricing service is unavailable, amortized cost may be used if it is determined that the instrument’s amortized cost value represents approximately the fair value of the security. These are classified as Level 2 investments.
Investments in Special Purpose Acquisition Companies, including their related units, shares, rights and warrants (each a “SPAC interest”), will typically be valued by reference to the last reported transaction for the composite exchange. If, on a particular day, no reliable market transaction is readily available and reported for the composite exchange, then the mean between the closing bid and asked prices on the composite exchange will be used to value the SPAC interest, or the SPAC interest will be fair valued in accordance with the Fund’s pricing procedures. These securities are classified as Level 2 investments.
Exchange-traded options are typically valued at the higher of the intrinsic value of the option (i.e., what a Fund would pay or can receive upon the option being exercised) or the last reported composite sale price when such sale falls between the bid and asked prices. When the last sale of an exchange-traded option is outside the bid and asked prices, the Funds will typically value the option at the higher of the intrinsic value of the option or the mean between the highest end of day option bid price and the lowest end of day option ask price. Options for which there is an active market are classified as Level 1 investments, but options not listed on an exchange and/or are fair valued in accordance with the Fund’s pricing procedures are classified as Level 2 investments.
The Merger Fund and Westchester Capital Funds
NOTES TO THE FINANCIAL STATEMENTS (continued)
June 30, 2018 (Unaudited)
Note 2 — SIGNIFICANT ACCOUNTING POLICIES (continued)
Investments in registered open-end investment companies are typically valued at their reported net asset value (“NAV”) per share. These securities are generally classified as Level 1 investments. Forward currency contracts are valued daily at the prevailing forward exchange rate. These securities are generally classified as Level 2. In general, swap prices are determined using the same methods as would be used to price the underlying security. When the underlying security is the subject of a completed corporate reorganization for which the final deal terms are known, the swap is priced at the value of the consideration to be received by the Funds. The credit quality of counterparties and collateral is monitored and the valuation of a swap may be adjusted if it is believed that the credit quality of the counterparty or collateral affects the market value of the swap position. These securities are generally classified as Level 2 investments.
The Funds typically fair value securities and assets for which (a) market quotations are not readily available or (b) market quotations are believed to be unrepresentative of market value. For example, the Funds may fair value a security that primarily trades on an exchange that closes before the New York Stock Exchange (“NYSE”) if a significant event occurs after the close of the exchange on which the security primarily trades but before the NYSE closes. Fair valuations are determined in good faith by the Valuation Group (the “Valuation Group”), a committee comprised of persons who are officers of the Trust or representatives of the Adviser, acting pursuant to procedures adopted by the Board. When fair-value pricing is employed, the prices of securities used by the Funds to calculate their NAV may differ from quoted or published prices for the same securities. In addition, due to the subjective nature of fair-value pricing, it is possible that the value determined for a particular asset may be materially different from the value realized upon such asset’s sale. These securities are generally classified as Level 2 or 3 depending on the inputs as described below.
The Funds have performed analyses of all existing investments to determine the significance and character of all inputs to their fair value determination. Various inputs are used in determining the value of the Funds’ investments. These inputs are summarized in the three broad levels listed below:
| | Level 1 — | Quoted prices in active markets for identical securities. |
| | | |
| | Level 2 — | Other significant observable inputs (including quoted prices for similar securities, interest rates, prepayment speeds, credit risk, etc.). |
The Merger Fund and Westchester Capital Funds
NOTES TO THE FINANCIAL STATEMENTS (continued)
June 30, 2018 (Unaudited)
Note 2 — SIGNIFICANT ACCOUNTING POLICIES (continued)
| | Level 3 — | Significant unobservable inputs are those inputs that reflect the applicable Fund’s own assumptions that market participants would use to price the asset or liability based on the best available information. |
The inputs or methodology used for valuing securities are not an indication of the risk associated with investing in those securities.
The following tables provide the fair value measurements of applicable Fund assets and liabilities by level within the fair value hierarchy for the Funds as of June 30, 2018. These assets and liabilities are measured on a recurring basis.
The Merger Fund
Investments at Fair Value | | Level 1 | | | Level 2 | | | Level 3 | | | Total | |
| Assets | | | | | | | | | | | | |
| Common Stocks* | | $ | 1,349,548,535 | | | $ | 15,790,567 | | | $ | 59,526,361 | | | $ | 1,424,865,463 | |
| Private Investment | | | | | | | | | | | | | | | | |
| In Public Equity | | | 3,084,756 | | | | — | | | | — | | | | 3,084,756 | |
| Closed-End Funds | | | 295,189,309 | | | | — | | | | — | | | | 295,189,309 | |
| Preferred Stock | | | 3,701,097 | | | | — | | | | — | | | | 3,701,097 | |
| Contingent Value Rights | | | — | | | | — | | | | 26,735 | | | | 26,735 | |
| Rights | | | — | | | | 688,758 | | | | — | | | | 688,758 | |
| Warrants | | | — | | | | 759,469 | | | | — | | | | 759,469 | |
| Corporate Bonds | | | — | | | | 182,033,336 | | | | — | | | | 182,033,336 | |
| Purchased Option Contracts | | | 6,517,872 | | | | — | | | | — | | | | 6,517,872 | |
| Escrow Notes | | | — | | | | — | | | | 1,616,428 | | | | 1,616,428 | |
| Short-Term Investments | | | 455,415,752 | | | | 33,569,147 | | | | — | | | | 488,984,899 | |
| Forward Currency | | | | | | | | | | | | | | | | |
| Exchange Contracts** | | | — | | | | 8,299,595 | | | | — | | | | 8,299,595 | |
| Swap Contracts** | | | — | | | | 30,616,607 | | | | — | | | | 30,616,607 | |
| Total | | $ | 2,113,457,321 | | | $ | 271,757,479 | | | $ | 61,169,524 | | | $ | 2,446,384,324 | |
| | | | | | | | | | | | | | | | |
| Liabilities | | | | | | | | | | | | | | | | |
| Short Common Stock* | | $ | 444,646,004 | | | $ | 3,124,620 | | | $ | — | | | $ | 447,770,624 | |
| Written Option Contracts | | | 18,910,578 | | | | — | | | | — | | | | 18,910,578 | |
| Total | | $ | 463,556,582 | | | $ | 3,124,620 | | | $ | — | | | $ | 466,681,202 | |
The Merger Fund and Westchester Capital Funds
NOTES TO THE FINANCIAL STATEMENTS (continued)
June 30, 2018 (Unaudited)
Note 2 — SIGNIFICANT ACCOUNTING POLICIES (continued)
WCM Alternatives: Event-Driven Fund
Investments at Fair Value | | Level 1 | | | Level 2 | | | Level 3 | | | Total | |
| Assets | | | | | | | | | | | | |
| Common Stocks* | | $ | 57,981,458 | | | $ | 2,960,983 | | | $ | 1,012,471 | | | $ | 61,954,912 | |
| Private Investment | | | | | | | | | | | | | | | | |
| In Public Equity | | | 1,192,671 | | | | — | | | | — | | | | 1,192,671 | |
| Closed-End Funds | | | 7,289,296 | | | | — | | | | — | | | | 7,289,296 | |
| Preferred Stock | | | 3,265,750 | | | | 88,385 | | | | — | | | | 3,354,135 | |
| Contingent Value Rights | | | — | | | | — | | | | 1,286 | | | | 1,286 | |
| Rights | | | — | | | | 229,152 | | | | — | | | | 229,152 | |
| Warrants | | | — | | | | 288,971 | | | | — | | | | 288,971 | |
| Convertible Bonds | | | — | | | | 1,405,903 | | | | — | | | | 1,405,903 | |
| Corporate Bonds | | | — | | | | 16,288,175 | | | | — | | | | 16,288,175 | |
| Purchased Option Contracts | | | 477,016 | | | | 20,095 | | | | — | | | | 497,111 | |
| Escrow Notes | | | — | | | | — | | | | 58,692 | | | | 58,692 | |
| Short-Term Investments | | | 15,709,760 | | | | 16,208,910 | | | | — | | | | 31,918,670 | |
| Forward Currency | | | | | | | | | | | | | | | | |
| Exchange Contracts** | | | — | | | | 494,889 | | | | — | | | | 494,889 | |
| Swap Contracts** | | | — | | | | 3,937,495 | | | | — | | | | 3,937,495 | |
| Total | | $ | 85,915,951 | | | $ | 41,922,958 | | | $ | 1,072,449 | | | $ | 128,911,358 | |
| | | | | | | | | | | | | | | | | |
| Liabilities | | | | | | | | | | | | | | | | |
| Short Common Stock* | | $ | 13,556,797 | | | $ | 745,838 | | | $ | — | | | $ | 14,302,635 | |
| Written Option Contracts | | | 915,846 | | | | 101,497 | | | | — | | | | 1,017,343 | |
| Swap Contracts** | | | — | | | | 669,983 | | | | — | | | | 669,983 | |
| Total | | $ | 14,472,643 | | | $ | 1,517,318 | | | $ | — | | | $ | 15,989,961 | |
The Merger Fund and Westchester Capital Funds
NOTES TO THE FINANCIAL STATEMENTS (continued)
June 30, 2018 (Unaudited)
Note 2 — SIGNIFICANT ACCOUNTING POLICIES (continued)
WCM Alternatives: Credit Event Fund
Investments at Fair Value | | Level 1 | | | Level 2 | | | Level 3 | | | Total | |
| Assets | | | | | | | | | | | | |
| Common Stocks* | | $ | 478,503 | | | $ | 85,022 | | | $ | — | | | $ | 563,525 | |
| Closed End Funds | | | 4,643 | | | | — | | | | — | | | | 4,643 | |
| Preferred Stock | | | 56,933 | | | | — | | | | — | | | | 56,933 | |
| Convertible Bonds | | | — | | | | 259,200 | | | | — | | | | 259,200 | |
| Corporate Bonds | | | — | | | | 2,164,472 | | | | — | | | | 2,164,472 | |
| Short-Term Investments | | | 830,992 | | | | — | | | | — | | | | 830,992 | |
| Total | | $ | 1,371,071 | | | $ | 2,508,694 | | | $ | — | | | $ | 3,879,765 | |
| | | | | | | | | | | | | | | | | |
| Liabilities | | | | | | | | | | | | | | | | |
| Swap Contracts** | | $ | — | | | $ | 9,007 | | | $ | — | | | $ | 9,007 | |
| Total | | $ | — | | | $ | 9,007 | | | $ | — | | | $ | 9,007 | |
| * | | Please refer to the Schedules of Investments to view long/short common stocks segregated by industry type. |
| ** | | Forward currency exchange contracts and swap contracts are valued at the net unrealized appreciation (depreciation) on the instrument by counterparty. |
The Level 2 securities are priced using inputs such as current yields, discount rates, credit quality, yields on comparable securities, trading volume, maturity date, market bid and ask prices, prices on comparable securities and other significant inputs. Level 3 securities are valued by using broker quotes or such other pricing sources or data as are permitted by the Funds’ pricing procedures. At June 30, 2018, the value of these securities held by TMF and EDF were $61,169,524 and $1,072,449, respectively. The inputs for these securities are not readily available or cannot be reasonably estimated and are generally those inputs as described in Note 2 A. The appropriateness of fair values for these securities is monitored by the Valuation Group on an ongoing basis.
During the six months ended June 30, 2018, TMF and EDF had transfers into Level 2 from Level 1 of $7,900,194 and $2,327,494 and transfers from Level 2 to Level 1 of $11,777,696 and $2,105,779 due to changes in market activity of the respective securities. There were no transfers into or out of Level 3 for TMF and EDF for the period ended June 30, 2018. CEF did not have any transfers during the period. Transfers are recorded at the end of the reporting period.
The Merger Fund and Westchester Capital Funds
NOTES TO THE FINANCIAL STATEMENTS (continued)
June 30, 2018 (Unaudited)
Note 2 — SIGNIFICANT ACCOUNTING POLICIES (continued)
Level 3 Reconciliation Disclosure
The following is a reconciliation of Level 3 assets for which significant unobservable inputs were used to determine fair value.
The Merger Fund
| | | | | | Contingent | | | | | | | |
| | | Common | | | Value | | | Escrow | | | Total | |
Description | | Stock | | | Rights | | | Notes | | | Investment | |
| Balance as of | | | | | | | | | | | | |
| December 31, 2017 | | $ | 58,982,517 | | | $ | 991,436 | | | $ | 1,989,450 | | | $ | 61,963,403 | |
| Purchases on Investments* | | | — | | | | — | | | | — | ** | | | — | ** |
| (Sales) of Investments | | | — | | | | — | | | | — | | | | — | |
| Realized (Gain) Loss | | | — | | | | (1,604,997 | ) | | | — | | | | (1,604,997 | ) |
| Transfers Into Level 3 | | | — | | | | — | | | | — | | | | — | |
| (Transfer Out) of Level 3 | | | — | | | | — | | | | — | | | | — | |
| Change in Unrealized | | | | | | | | | | | | | | | | |
| Appreciation (Depreciation) | | | 543,844 | | | | 640,296 | | | | (373,022 | ) | | | 811,118 | |
| Balance as of June 30, 2018 | | $ | 59,526,361 | | | $ | 26,735 | | | $ | 1,616,428 | | | $ | 61,169,524 | |
| | | | | | | | | | | | | | | | | |
| WCM Alternatives: Event-Driven Fund | | | | | | | | | | | | | | | | |
| | | Common | | | Contingent | | | Escrow | | | Total | |
Description | | Stock | | | Rights | | | Notes | | | Investment | |
| Balance as of December 31, 2017 | | $ | 1,003,220 | | | $ | 5,293 | | | $ | 218,306 | | | $ | 1,226,819 | |
| Purchases on Investments* | | | — | | | | — | | | | — | | | | — | |
| (Sales) of Investments | | | — | | | | — | | | | — | | | | | |
| Realized (Gain) Loss | | | — | | | | (5,000 | ) | | | (3,132 | ) | | | (8,132 | ) |
| Transfers Into Level 3 | | | — | | | | — | | | | — | | | | — | |
| (Transfer Out) of Level 3 | | | — | | | | — | | | | — | | | | — | |
| Change in Unrealized | | | | | | | | | | | | | | | | |
| Appreciation (Depreciation) | | | 9,251 | | | | 993 | | | | (156,482 | ) | | | (146,238 | ) |
| Balance as of June 30, 2018 | | $ | 1,012,471 | | | $ | 1,286 | | | $ | 58,692 | | | $ | 1,072,449 | |
| * | | Includes receipts from corporate actions. |
| ** | | Amount less than $0.50. |
The realized and unrealized gains and losses from Level 3 transactions are included with the net realized gain (loss) on investments and net change in unrealized appreciation (depreciation) on investments on the Statements of Operations. The net change in unrealized appreciation (depreciation) on investments related to Level 3 securities held by TMF and EDF at June 30, 2018 totals $811,118 and $(146,238), respectively. CEF held no Level 3 securities during the period ended June 30, 2018.
Significant unobservable valuation inputs monitored by the Valuation Group under the supervision of the Board of Trustees for restricted securities or material Level 3 investments as of June 30, 2018 for both TMF and EDF are as follows:
The Merger Fund and Westchester Capital Funds
NOTES TO THE FINANCIAL STATEMENTS (continued)
June 30, 2018 (Unaudited)
Note 2 — SIGNIFICANT ACCOUNTING POLICIES (continued)
The Merger Fund
| | | Fair Value at | | Valuation | Unobservable |
Description | | June 30, 2018 | | Technique | Input |
| Common Stock | | $ | 59,526,361 | | Discounted Cash | Discount Rates/ |
| | | | | | Flow Model | Terminal Value/ |
| | | | | | | Cash Flow Projections |
| | | | | | | |
| Escrow Note | | $ | — | ** | Projected Final | Discount of Projected |
| | | | | | Distribution* | Distribution |
| * | | This Level 3 security was received through a corporate action. The security is being kept open due to the potential of an additional distribution. Based on an evaluation of the likelihood of an additional distribution, the security is being priced at zero. |
| ** | | Amount less than $0.50. |
WCM Alternatives: Event-Driven Fund
| | Fair Value at | Valuation | Unobservable |
Description | June 30, 2018 | Technique | Input |
| Common Stock | $ 1,012,471 | Discounted Cash | Discount Rates |
| | | Flow Model | Terminal Value |
| | | | Cash Flow Projections |
The tables above do not include certain Level 3 investments that are valued by brokers and pricing services. At June 30, 2018, the value of these securities for TMF and EDF were $1,643,163 and $59,978, respectively. The inputs for these investments are not readily available or cannot be reasonably estimated and are generally those inputs described in Note 2.
B. Federal Income Taxes
No provision for federal income taxes has been made since the Funds have complied to date with the provisions of Subchapter M of the Internal Revenue Code applicable to regulated investment companies and intends to continue to comply in future years and to distribute investment company net taxable income and net capital gains to shareholders. Additionally, the Funds intend to make all required distributions to avoid federal excise tax.
The Funds have reviewed all open tax years in major jurisdictions and concluded that there is no impact on the Funds’ net assets and there is no tax liability resulting from unrecognized tax benefits relating to uncertain income tax positions taken or expected to be taken on a tax return. The Funds are also not aware of any tax positions for which it is reasonably possible that the total amounts of unrecognized tax benefits will significantly change in the next twelve months. As of June 30, 2018, TMF’s and EDF’s open Federal and New York tax years include the tax years ended December 31, 2014 through December 31, 2017. CEF is in its first year of operations and therefore it has no open Federal or New York tax years as of June 30, 2018. The Funds have no tax examination in progress.
The Merger Fund and Westchester Capital Funds
NOTES TO THE FINANCIAL STATEMENTS (continued)
June 30, 2018 (Unaudited)
Note 2 — SIGNIFICANT ACCOUNTING POLICIES (continued)
C. Transactions with Brokers
The Funds’ receivables from brokers for securities sold short and deposits at brokers for other investments are with two securities dealers. The Funds are required by the brokers to maintain collateral for securities sold short. The receivable from brokers for securities sold short on the Statements of Assets and Liabilities represents the proceeds from securities sold short that is maintained at the broker. The Funds do not require the brokers to maintain collateral in support of the receivables from the brokers for proceeds on securities sold short. The Funds may maintain cash deposits at brokers beyond the receivables for short sales. On the Statement of Assets and Liabilities, these are classified as deposits at brokers for other investments. A Fund may be required by the brokers with which it executes short sales to maintain an additional amount of collateral in a special tri-party custody arrangement for the benefit of the broker.
The Funds’ equity swap contracts’ and forward currency exchange contracts’ cash deposits are monitored daily by the Adviser and counterparty. These transactions may involve market risk in excess of the amounts receivable or payable reflected on the Statements of Assets and Liabilities.
D. Securities Sold Short
The Funds sell securities or currencies short for economic hedging purposes or any other investment purpose. For financial statement purposes, an amount equal to the settlement amount is initially included in the Statements of Assets and Liabilities as an asset and an equivalent liability. The amount of the liability is subsequently priced to reflect the current value of the short position. Subsequent fluctuations in the market prices of securities or currencies sold, but not yet purchased, may require purchasing the securities or currencies at prices which may differ from the market value reflected on the Statements of Assets and Liabilities. Short sale transactions result in off balance sheet risk because the ultimate obligation may exceed the related amounts shown in the Statements of Assets and Liabilities. The Funds will incur losses if the price of the security increases between the date of the short sale and the date on which the Funds purchase the securities to replace the borrowed securities. The Funds’ losses on short sales are potentially unlimited because there is no upward limit on the price a borrowed security could attain.
The Merger Fund and Westchester Capital Funds
NOTES TO THE FINANCIAL STATEMENTS (continued)
June 30, 2018 (Unaudited)
Note 2 — SIGNIFICANT ACCOUNTING POLICIES (continued)
The Funds are liable for any dividends payable on securities while those securities are sold short. Until the security is replaced, the Funds are required to pay to the lender any income earned, which is recorded as an expense by the Funds. The Funds segregate liquid assets in an amount equal to the market value of securities sold short, which is reflected in the Schedules of Investments. These assets are required to be adjusted daily to reflect changes in the value of the securities or currencies sold short.
E. Written Option Contracts
The Funds are subject to equity price risk in the normal course of pursuing their investment objectives. The Funds write (sell) put or call options for hedging purposes, volatility management purposes, or otherwise to gain, or reduce, long or short exposure to one or more asset classes or issuers. When a Fund writes (sells) an option, an amount equal to the premium received by the Fund is included in the Statement of Assets and Liabilities as an asset and an equivalent liability. The amount of the liability is subsequently priced daily to reflect the current value of the option written. Refer to Note 2 A. for a pricing description. By writing an option, a Fund may become obligated during the term of the option to deliver or purchase the securities underlying the option at the exercise price if the option is exercised. These contracts may involve market risk in excess of the amounts receivable or payable reflected on the Statements of Assets and Liabilities. Refer to Note 2 Q. for further derivative disclosures, and Note 2 O. for further counterparty risk disclosure.
When an option expires on its stipulated expiration date or the Funds enter into a closing purchase transaction, the Funds realize gains or losses if the cost of the closing purchase transaction differs from the premium received when the option was sold without regard to any unrealized appreciation or depreciation on the underlying security, and the liability related to such option is eliminated. When a written call option is exercised, the premium originally received decreases the cost basis of the security and the Funds realize gains or losses from the sale of the underlying security. When a written put option is exercised, the cost of the security acquired is decreased by the premium received for the put.
F. Purchased Option Contracts
The Funds are subject to equity price risk in the normal course of pursuing their investment objectives. The Funds purchase put or call options for hedging purposes, volatility management purposes, or otherwise to gain, or reduce, long or short exposure to one or more asset
The Merger Fund and Westchester Capital Funds
NOTES TO THE FINANCIAL STATEMENTS (continued)
June 30, 2018 (Unaudited)
Note 2 — SIGNIFICANT ACCOUNTING POLICIES (continued)
classes or issuers. When the Funds purchase an option contract, an amount equal to the premiums paid is included in the Statements of Assets and Liabilities as an investment, and is subsequently priced daily to reflect the value of the purchased option. Refer to Note 2 A. for a pricing description. Refer to Note 2 Q. for further derivative disclosures, and Note 2 O. for further counterparty risk disclosure.
When option contracts expire or are closed, realized gains or losses are recognized without regard to any unrealized appreciation or depreciation on the underlying securities that may be held by the Funds. If the Fund exercises a call option, the cost of the security acquired is increased by the premium paid for the call. If the Fund exercises a put option, the premium paid for the put option increases the cost of the underlying security and a gain or loss is realized from the sale of the underlying security.
G. Forward Currency Exchange Contracts
The Funds are subject to foreign currency exchange rate risk in the normal course of pursuing their investment objectives. During the six months ended June 30, 2018, TMF and EDF used forward currency exchange contracts to hedge against changes in the value of foreign currencies. The Funds may enter into forward currency exchange contracts obligating the Funds to deliver and receive a currency at a specified future date. Forward contracts are valued daily, and unrealized appreciation or depreciation is recorded daily as the difference between the contract exchange rate and the closing forward rate applied to the face amount of the contract. Refer to Note 2 A. for a pricing description. A realized gain or loss is recorded at the time the forward contract expires. Credit risk may arise as a result of the failure of the counterparty to comply with the terms of the contract. Refer to Note 2 O. for further counterparty risk disclosure.
The use of forward currency exchange contracts does not eliminate fluctuations in the underlying prices of the Funds’ investment securities. The use of forward currency exchange contracts involves the risk that anticipated currency movements will not be accurately predicted. A forward currency exchange contract would limit the risk of loss due to a decline in the value of a particular currency; however, it would also limit any potential gain that might result should the value of the currency increase instead of decrease. These contracts may involve market risk in excess of the amounts receivable or payable reflected on the Statements of Assets and Liabilities. Refer to Note 2 Q. for further derivative disclosures.
The Merger Fund and Westchester Capital Funds
NOTES TO THE FINANCIAL STATEMENTS (continued)
June 30, 2018 (Unaudited)
Note 2 — SIGNIFICANT ACCOUNTING POLICIES (continued)
H. Equity Swap Contracts
The Funds are subject to equity price risk and interest rate risk in the normal course of pursuing their investment objectives. During the six months ended June 30, 2018, the Funds entered into both long and short equity swap contracts with multiple broker-dealers. A long equity swap contract entitles the Funds to receive from the counterparty any appreciation and dividends paid on an individual security, while obligating the Funds to pay the counterparty any depreciation on the security as well as interest on the notional amount of the contract at a rate equal to LIBOR plus an agreed upon spread (refer to the Schedule of Swap Contracts for further disclosure of the contracts’ financing rates). A short equity swap contract obligates the Funds to pay the counterparty any appreciation and dividends paid on an individual security, while entitling the Funds to receive from the counterparty any depreciation on the security, and to pay to or receive from the counterparty interest on the notional value of the contract at a rate equal to LIBOR less an agreed upon spread (refer to the Schedule of Swap Contracts for further disclosure of the contracts’ financing rates). Refer to Note 2 A. for a pricing description.
The Funds may also enter into equity swap contracts whose value may be determined by the spread between a long equity position and a short equity position. This type of swap contract obligates the Funds to pay the counterparty an amount tied to any increase in the spread between the two securities over the term of the contract. The Funds are also obligated to pay the counterparty any dividends paid on the short equity holding as well as any net financing costs. This type of swap contract entitles the Funds to receive from the counterparty any gains based on a decrease in the spread as well as any dividends paid on the long equity holding and any net interest income.
Fluctuations in the value of an open contract are recorded daily as net unrealized appreciation or depreciation. The Funds will realize gains or losses upon termination or reset of the contract. Either party, under certain conditions, may terminate the contract prior to the contract’s expiration date. Equity swap contracts are typically valued based on market quotations or pricing service evaluations for the underlying reference asset. The Valuation Group monitors the credit quality of the Funds’ counterparties and may adjust the valuation of a swap in the Valuation Group’s discretion due to, among other things, changes in a counterparty’s credit quality.
Credit risk may arise as a result of the failure of the counterparty to comply with the terms of the contract. Refer to Note 2 O. for further counterparty risk disclosure. Additionally, risk may arise from unanticipated
The Merger Fund and Westchester Capital Funds
NOTES TO THE FINANCIAL STATEMENTS (continued)
June 30, 2018 (Unaudited)
Note 2 — SIGNIFICANT ACCOUNTING POLICIES (continued)
movements in interest rates or in the value of the underlying securities. Equity swap contracts may involve market risk in excess of the amounts receivable or payable reflected on the Statements of Assets and Liabilities. Refer to Note 2 Q. for further derivative disclosures.
I. Distributions to Shareholders
Dividends from net investment income and net realized capital gains, if any, are declared and paid at least annually. Income and capital gain distributions are determined in accordance with income tax regulations which may differ from GAAP. These differences are due primarily to wash sale-loss deferrals, constructive sales, straddle-loss deferrals, adjustments on swap contracts, and unrealized gains or losses on Section 1256 contracts, which were realized, for tax purposes, at the end of each Fund’s fiscal year.
J. Foreign Securities
Investing in securities of foreign companies and foreign governments involves special risks and considerations not typically associated with investing in U.S. companies and the U.S. government. These risks include fluctuations in currency exchange rates and adverse political, cultural, regulatory, legal, tax, and economic developments as well as different custody and/or settlement practices or delayed settlements in some foreign markets. Moreover, securities of many foreign companies and their markets may be less liquid and their prices more volatile than those of securities of comparable U.S. companies and the U.S. government.
K. Foreign Currency Transactions
The books and records of the Funds are maintained in U.S. dollars. Foreign currency transactions are translated into U.S. dollars on the following basis: (i) market value of investment securities, assets and liabilities at the daily rates of exchange, and (ii) purchases and sales of investment securities, dividend and interest income and certain expenses at the rates of exchange prevailing on the respective dates of such transactions. For financial reporting purposes, the Funds do not isolate changes in the exchange rate of investment securities from the fluctuations arising from changes in the market prices of securities. However, for federal income tax purposes, the Funds do isolate and treat as ordinary income the effect of changes in foreign exchange rates on realized gain or loss from the sale of investment securities and payables and receivables arising from trade-date and settlement-date differences. Foreign currency held as cash by the Funds’ custodian is reported separately on the Statements of Assets and Liabilities.
The Merger Fund and Westchester Capital Funds
NOTES TO THE FINANCIAL STATEMENTS (continued)
June 30, 2018 (Unaudited)
Note 2 — SIGNIFICANT ACCOUNTING POLICIES (continued)
L. Cash and Cash Equivalents
The Funds consider highly liquid short-term fixed income investments purchased with an original maturity of less than three months to be cash equivalents. Cash equivalents are included in short-term investments on the Schedule of Investments as well as in investments on the Statements of Assets and Liabilities. Temporary cash overdrafts are reported as payable to custodian.
M. Guarantees and Indemnifications
In the normal course of business, the Funds enter into contracts with service providers that contain general indemnification clauses. The Funds’ maximum exposure under these arrangements is unknown, as this would involve future claims that may be made against the Funds that have not yet occurred. The Funds have not historically incurred material expenses in respect of those provisions.
N. Security Transactions, Investment Income and Expenses
Transactions are recorded for financial statement purposes on the trade date. Realized gains and losses from security transactions are recorded on the identified cost basis. Distributions to shareholders are recorded on the ex-dividend date. Dividend income is recorded on the ex-dividend date, except for certain dividends on foreign securities, which are recorded as soon as the Fund is informed after the ex-dividend date. Interest is accounted for on the accrual basis and includes amortization of premiums and discounts on the effective interest method. At June 30, 2018, expenses include $1,667,307 and $100,337 of borrowing expenses on securities sold short for TMF and EDF, respectively. There were no borrowing expenses on securities sold short for CEF for the period through June 30, 2018.
O. Counterparty Risk
The Funds help manage counterparty credit risk by entering into agreements only with counterparties the Adviser believes have the financial resources to honor their obligations. The Adviser considers the creditworthiness of each counterparty to a contract in evaluating potential credit risk. The counterparty risk for forward currency exchange contracts to the Funds includes the amount of any net unrealized appreciation on the contract. The counterparty risk for equity swaps contracts to the Funds includes the risk of loss of the full amount of any net unrealized appreciation on the contract, along with dividends receivable on long equity contracts and interest receivable on short equity contracts. Written and purchased options sold on an exchange expose the Funds to counterparty risk; however, the exchange’s clearinghouse guarantees the options against default.
The Merger Fund and Westchester Capital Funds
NOTES TO THE FINANCIAL STATEMENTS (continued)
June 30, 2018 (Unaudited)
Note 2 — SIGNIFICANT ACCOUNTING POLICIES (continued)
Over-the-counter options counterparty risk includes the risk of loss of the full amount of any net unrealized appreciation. Refer to Note 2 H. for further disclosure to counterparty risk related to equity swap contracts.
P. The Right to Offset
Financial assets and liabilities, as well as cash collateral received by the Funds’ counterparties and posted are offset by the respective counterparty, and the net amount is reported in the Statements of Assets and Liabilities when the Funds believe there exists a legally enforceable right to offset the recognized amounts.
Q. Derivatives
The Funds may utilize derivative instruments such as options, swaps, futures, forward contracts and other instruments with similar characteristics to the extent that they are consistent with the Funds’ respective investment objectives and limitations. The use of these instruments may involve additional investment risks, including the possibility of illiquid markets or imperfect correlation between the value of the instruments and the underlying securities. Derivatives also may create leverage which will amplify the effect of their performance on the Funds and may produce significant losses.
The Funds have adopted authoritative standards regarding disclosure about derivatives and hedging activities and how they affect the Funds’ Statements of Assets and Liabilities and Statements of Operations. For the six months ended June 30, 2018, each Fund’s monthly average quantity and notional value are described below:
| The Merger Fund | | | | | | |
| | | Monthly Average | | | Monthly Average | |
| | | Quantity | | | Notional Value | |
| Purchased Option Contracts | | | 33,061 | | | $ | 309,201,634 | |
| Written Option Contracts | | | 50,095 | | | $ | 360,420,236 | |
| Forward Currency Exchange Contracts | | | 12 | | | $ | 309,541,341 | |
| Long Total Return Swap Contracts | | | 23,174,868 | | | $ | 340,602,549 | |
| Short Total Return Swap Contracts | | | 7,955,623 | | | $ | 61,695,309 | |
| | | | | | | | | |
| WCM Alternatives: Event-Driven Fund | | | | | | | | |
| | | Monthly Average | | | Monthly Average | |
| | | Quantity | | | Notional Value | |
| Purchased Option Contracts | | | 7,976 | | | $ | 47,184,917 | |
| Written Option Contracts | | | 7,858 | | | $ | 38,134,006 | |
| Forward Currency Exchange Contracts | | | 11 | | | $ | 17,948,842 | |
| Long Total Return Swap Contracts | | | 2,490,566 | | | $ | 86,167,323 | |
| Short Total Return Swap Contracts | | | 601,723 | | | $ | 15,570,429 | |
The Merger Fund and Westchester Capital Funds
NOTES TO THE FINANCIAL STATEMENTS (continued)
June 30, 2018 (Unaudited)
Note 2 — SIGNIFICANT ACCOUNTING POLICIES (continued)
| WCM Alternatives: Credit Event Fund | | |
| | Monthly Average | Monthly Average |
| | Quantity | Notional Value |
| Long Total Return Swap Contracts | 26,518 | $277,754 |
Statements of Assets and Liabilities
Fair values of derivative instruments as of June 30, 2018:
| | Asset Derivatives | |
| | Statements of Assets | | | |
Derivatives | and Liabilities Location | | Fair Value | |
| The Merger Fund | | | | |
| Equity Contracts: | | | | |
| Purchased Option Contracts | Investments | | $ | 6,517,872 | |
| Swap Contracts | Receivables | | | 30,616,607 | |
| Foreign Exchange Contracts: | | | | | |
| Forward Currency Exchange Contracts | Receivables | | | 8,299,595 | |
| Total | | | $ | 45,434,074 | |
| | | | | | |
| WCM Alternatives: Event-Driven Fund | | | | | |
| Equity Contracts: | | | | | |
| Purchased Option Contracts | Investments | | $ | 497,111 | |
| Swap Contracts | Receivables | | | 3,937,495 | |
| Foreign Exchange Contracts: | | | | | |
| Forward Currency Exchange Contracts | Receivables | | | 494,889 | |
| Total | | | $ | 4,929,495 | |
| | | |
| | Liability Derivatives | |
| | Statements of Assets | | | | |
Derivatives | and Liabilities Location | | Fair Value | |
| The Merger Fund | | | | | |
| Equity Contracts: | | | | | |
| Written Option Contracts | Written Option Contracts | | $ | 18,910,578 | |
| Total | | | $ | 18,910,578 | |
| | | | | | |
| WCM Alternatives: Event-Driven Fund | | | | | |
| Equity Contracts: | | | | | |
| Written Option Contracts | Written Option Contracts | | $ | 1,017,343 | |
| Swap Contracts | Payables | | | 669,983 | |
| Total | | | $ | 1,687,326 | |
| | | |
| | Liability Derivatives | |
| | Statements of Assets | | | | |
Derivatives | and Liabilities Location | | Fair Value | |
| WCM Alternatives: Credit Event Fund | | | | | |
| Equity Contracts: | | | | | |
| Swap Contracts | Payables | | $ | 9,007 | |
| Total | | | $ | 9,007 | |
The Merger Fund and Westchester Capital Funds
NOTES TO THE FINANCIAL STATEMENTS (continued)
June 30, 2018 (Unaudited)
Note 2 — SIGNIFICANT ACCOUNTING POLICIES (continued)
Statements of Operations
The effect of derivative instruments on the Statements of Operations for the period ended June 30, 2018:
| | | Amount of Realized Gain (Loss) on Derivatives | |
| | | | | | | | | Forward | | | | | | | |
| | | Purchased | | | Written | | | Currency | | | | | | | |
| | | Option | | | Option | | | Exchange | | | Swap | | | | |
Derivatives | | Contracts* | | | Contracts | | | Contracts | | | Contracts | | | Total | |
| The Merger Fund | | | | | | | | | | | | | | | |
| Equity Contracts | | $ | (9,932,570 | ) | | $ | (1,033,365 | ) | | $ | — | | | $ | 56,492,410 | | | $ | 45,526,475 | |
| Foreign Exchange | | | | | | | | | | | | | | | | | | | | |
| Contracts | | | — | | | | — | | | | (2,424,274 | ) | | | — | | | | (2,424,274 | ) |
| Total | | $ | (9,932,570 | ) | | $ | (1,033,365 | ) | | $ | (2,424,274 | ) | | $ | 56,492,410 | | | $ | 43,102,201 | |
| | | | | | | | | | | | | | | | | | | | | |
| WCM Alternatives: | | | | | | | | | | | | | | | | | | | | |
| Event-Driven Fund | | | | | | | | | | | | | | | | | | | | |
| Equity Contracts | | $ | (1,555,580 | ) | | $ | 805,569 | | | $ | — | | | $ | (1,750,969 | ) | | $ | (2,500,980 | ) |
| Foreign Exchange | | | | | | | | | | | | | | | | | | | | |
| Contracts | | | — | | | | — | | | | (233,207 | ) | | | — | | | | (233,207 | ) |
| Total | | $ | (1,555,580 | ) | | $ | 805,569 | | | $ | (233,207 | ) | | $ | (1,750,969 | ) | | $ | (2,734,187 | ) |
| | | | | | | | | | | | | | | | | | | | | |
| WCM Alternatives: | | | | | | | | | | | | | | | | | | | | |
| Credit Event Fund | | | | | | | | | | | | | | | | | | | | |
| Equity Contracts | | | | | | | | | | | | | | $ | 11,317 | | | $ | 11,317 | |
| Total | | | | | | | | | | | | | | $ | 11,317 | | | $ | 11,317 | |
| * | The amounts disclosed are included in the realized gain (loss) on investments. |
The Merger Fund and Westchester Capital Funds
NOTES TO THE FINANCIAL STATEMENTS (continued)
June 30, 2018 (Unaudited)
Note 2 — SIGNIFICANT ACCOUNTING POLICIES (continued)
| | | Change in Unrealized Appreciation (Depreciation) on Derivatives | |
| | | | | | | | | Forward | | | | | | | |
| | | Purchased | | | Written | | | Currency | | | | | | | |
| | | Option | | | Option | | | Exchange | | | Swap | | | | |
Derivatives | | Contracts* | | | Contracts | | | Contracts | | | Contracts | | | Total | |
| The Merger Fund | | | | | | | | | | | | | | | |
| Equity Contracts | | $ | 3,129,563 | | | $ | 68,648 | | | $ | — | | | $ | 3,864,219 | | | $ | 7,062,430 | |
| Foreign Exchange | | | | | | | | | | | | | | | | | | | | |
| Contracts | | | — | | | | — | | | | 11,913,203 | | | | — | | | | 11,913,203 | |
| Total | | $ | 3,129,563 | | | $ | 68,648 | | | $ | 11,913,203 | | | $ | 3,864,219 | | | $ | 18,975,633 | |
| | | | | | | | | | | | | | | | | | | | | |
| WCM Alternatives: | | | | | | | | | | | | | | | | | | | | |
| Event-Driven Fund | | | | | | | | | | | | | | | | | | | | |
| Equity Contracts | | $ | 235,679 | | | $ | 161,707 | | | $ | — | | | $ | 5,291,012 | | | $ | 5,688,398 | |
| Foreign Exchange | | | | | | | | | | | | | | | | | | | | |
| Contracts | | | — | | | | — | | | | 720,654 | | | | — | | | | 720,654 | |
| Total | | $ | 235,679 | | | $ | 161,707 | | | $ | 720,654 | | | $ | 5,291,012 | | | $ | 6,409,052 | |
| | | | | | | | | | | | | | | | | | | | | |
| WCM Alternatives: | | | | | | | | | | | | | | | | | | | | |
| Credit Event Fund | | | | | | | | | | | | | | | | | | | | |
| Equity Contracts | | | | | | | | | | | | | | $ | (9,007 | ) | | $ | (9,007 | ) |
| Total | | | | | | | | | | | | | | $ | (9,007 | ) | | $ | (9,007 | ) |
| * | The amounts disclosed are included in the change in unrealized appreciation (depreciation) on investments. |
Note 3 — AGREEMENTS
The Funds’ investment adviser is Westchester Capital Management, LLC pursuant to an investment advisory agreement between TMF and the Adviser dated as of January 1, 2011 (the “TMF Advisory Agreement”) and pursuant to an investment advisory agreement between WCF, with respect to EDF and CEF, and the Adviser dated as of November 13, 2017 (the “EDF and CEF Advisory Agreement” and together with the TMF Advisory Agreement, the “Advisory Agreements”).
Under the terms of the TMF Advisory Agreement, the Adviser is entitled to receive a fee, calculated daily and payable monthly, at the annual rate of 1.00% of TMF’s average daily net assets. The Adviser has agreed until April 30, 2019 to reduce its advisory fee so that the advisory fee will be: (i) 1.00% of the first $2 billion in average daily net assets of TMF and (ii) 0.93% on average daily net assets above $2.0 billion (the “TMF Fee Waiver Agreement”). Investment advisory fees waived by the Adviser on behalf of TMF for the six months ended June 30, 2018 were $441,877.
Under the terms of the EDF and CEF Advisory Agreement, the Adviser is entitled to receive a fee, calculated daily and payable monthly, at the annual rate of 1.25% of EDF’s average daily net assets and 1.00% of CEF’s
The Merger Fund and Westchester Capital Funds
NOTES TO THE FINANCIAL STATEMENTS (continued)
June 30, 2018 (Unaudited)
Note 3 — AGREEMENTS (continued)
average daily net assets. The Adviser has contractually agreed until April 30, 2019 to waive its investment advisory fee and to reimburse EDF for other ordinary operating expenses to the extent necessary to limit ordinary operating expenses to an amount not to exceed 1.74% for Institutional Class shares and 1.99% for Investor Class shares (the “EDF Expense Limitation Agreement”). The Advisor has contractually agreed until April 30, 2019 to waive its investment advisory fee and to reimburse CEF for other ordinary operating expenses to the extent necessary to limit ordinary operating expenses to an amount not to exceed 1.64% for Institutional Class shares and 1.89% for Investor Class shares (the “CEF Expense Limitation Agreement”). Ordinary operating expenses exclude taxes, commissions, mark-ups, litigation expenses, indemnification expenses, interest expenses, borrowing expenses, including on securities sold short, dividend expenses on securities sold short, trading or investment expenses, acquired fund fees and expenses, and any extraordinary expenses. To the extent that the Adviser waives its investment advisory fee for EDF or CEF and/or reimburses EDF or CEF for other ordinary operating expenses, it may seek reimbursement of a portion or all of such amounts at any time within three fiscal years after the fiscal year in which such amounts were waived or reimbursed, subject to the expense limitation in place at the time such amounts were waived or reimbursed. For the six months ended June 30, 2018, the Adviser reimbursed $42,745 of advisory fees and other expenses to EDF and for the period ended June 30, 2018, the Adviser reimbursed $101,045 of advisory fees and other expenses to CEF.
Investment advisory fees waived and expenses reimbursed on behalf of EDF that are subject to potential recovery by the Adviser are shown in the following table by year of expiration.
| WCM Alternatives: Event-Driven Fund | Year of Expiration | | Potential Recovery | |
| | 12/31/2018 | | $ | 89,167 | |
| | 12/31/2019 | | $ | 5,319 | |
| | 12/31/2020 | | $ | 42,745 | |
| | | | | |
| WCM Alternatives: Credit Event Fund | Year of Expiration | | Potential Recovery | |
| | 12/31/2020 | | $ | 101,045 | |
Each of the TMF Fee Waiver Agreement, the EDF Expense Limitation Agreement and the CEF Expense Limitation Agreement may be terminated at any time by such Fund’s Board of Trustees. Certain officers of the Funds are also officers of the Adviser. Each Advisory Agreement was approved for an initial term of two years and thereafter will remain in effect from year to year provided that such continuance is specifically
The Merger Fund and Westchester Capital Funds
NOTES TO THE FINANCIAL STATEMENTS (continued)
June 30, 2018 (Unaudited)
Note 3 — AGREEMENTS (continued)
approved at least annually by the vote of a majority of the relevant Fund’s Trustees who are not interested persons of the Adviser or such Fund or by a vote of a majority of the outstanding voting securities of such Fund.
U.S. Bancorp Fund Services, LLC, a subsidiary of U.S. Bancorp, a publicly held bank holding company, serves as transfer agent, administrator, accountant, dividend paying agent and shareholder servicing agent for the Funds. U.S. Bank, N.A. serves as custodian for the Funds.
Distribution services are performed pursuant to distribution contracts with broker-dealers and other qualified institutions.
Note 4 — SHARES OF BENEFICIAL INTEREST
The Board of Trustees of each Fund has the authority to issue an unlimited amount of shares of beneficial interest without par value.
Changes in shares of beneficial interest were as follows:
| | | Six Months Ended | | | Year Ended | |
| | | June 30, 2018 | | | December 31, 2017 | |
| Investor Class | | Shares | | | Amount | | | Shares | | | Amount | |
| Issued | | | 13,983,734 | | | $ | 228,990,698 | | | | 18,119,248 | | | $ | 288,451,286 | |
| Issued as reinvestment | | | | | | | | | | | | | | | | |
| of dividends | | | — | | | | — | | | | 369,355 | | | | 5,887,521 | |
| Redeemed | | | (16,198,258 | ) | | | (264,042,949 | ) | | | (44,029,590 | ) | | | (700,623,902 | ) |
| Net Decrease | | | (2,214,524 | ) | | $ | (35,052,251 | ) | | | (25,540,987 | ) | | $ | (406,285,095 | ) |
| | | | | | | |
| | | Six Months Ended | | | Year Ended | |
| | | June 30, 2018 | | | December 31, 2017 | |
| Institutional Class | | Shares | | | Amount | | | Shares | | | Amount | |
| Issued | | | 17,318,064 | | | $ | 281,413,137 | | | | 29,355,964 | | | $ | 464,973,363 | |
| Issued as reinvestment | | | | | | | | | | | | | | | | |
| of dividends | | | — | | | | — | | | | 405,071 | | | | 6,412,277 | |
| Redeemed | | | (15,028,592 | ) | | | (244,311,755 | ) | | | (45,478,115 | ) | | | (724,231,208 | ) |
| Net Increase (Decrease) | | | 2,289,472 | | | $ | 37,101,382 | | | | (15,717,080 | ) | | $ | (252,845,568 | ) |
The Merger Fund and Westchester Capital Funds
NOTES TO THE FINANCIAL STATEMENTS (continued)
June 30, 2018 (Unaudited)
Note 4 — SHARES OF BENEFICIAL INTEREST (continued)
| | | | | | | | | For the Period from | |
| | | | | | | | | March 22,2017^ | |
| | | Six Months Ended | | | through | |
| WCM Alternatives: | | June 30, 2018 | | | December 31, 2017 | |
| Event-Driven Fund | | Shares | | | Amount | | | Shares | | | Amount | |
| Investor Class | | | | | | | | | | | | |
| Issued | | | 253,743 | | | $ | 2,618,629 | | | | 624,205 | | | $ | 6,279,937 | |
| Issued as reinvestment | | | | | | | | | | | | | | | | |
| of dividends | | | — | | | | — | | | | 5,452 | | | | 55,388 | |
| Redeemed | | | (30,981 | ) | | | (321,493 | ) | | | (82,371 | ) | | | (840,457 | ) |
| Net Increase | | | 222,762 | | | $ | 2,297,136 | | | | 547,286 | | | $ | 5,494,868 | |
| | | | | | | | | | | | | | | | | |
| | | Six Months Ended | | | Year Ended | |
| | | June 30, 2018 | | | December 31, 2017 | |
| Institutional Class | | Shares | | | Amount | | | Shares | | | Amount | |
| Issued | | | 2,160,519 | | | $ | 22,266,970 | | | | 3,076,429 | | | $ | 31,012,088 | |
| Issued as reinvestment | | | | | | | | | | | | | | | | |
| of dividends | | | — | | | | — | | | | 92,478 | | | | 941,430 | |
| Redeemed | | | (572,830 | ) | | | (5,947,417 | ) | | | (5,434,615 | ) | | | (54,943,305 | ) |
| Net Increase (Decrease) | | | 1,587,689 | | | $ | 16,319,553 | | | | (2,265,708 | ) | | $ | (22,989,787 | ) |
| | | | | | | | | | | | | | | | | |
| | | Six Months Ended | | | | | | | | | |
| | | June 30, 2018 | | | | | | | | | |
| Credit Event Fund | | Shares | | | Amount | | | | | | | | | |
| Investor Class | | | | | | | | | | | | | | | | |
| Issued | | | 3,222 | | | $ | 32,300 | | | | | | | | | |
| Issued as reinvestment | | | | | | | | | | | | | | | | |
| of dividends | | | — | | | | — | | | | | | | | | |
| Redeemed | | | (230 | ) | | | (2,289 | ) | | | | | | | | |
| Net Increase | | | 2,992 | | | $ | 30,011 | | | | | | | | | |
| | | | | | | | | | | | |
| | | Six Months Ended | | | | | | | | | |
| | | June 30, 2018 | | | | | | | | | |
| Institutional Class | | Shares | | | Amount | | | | | | | | | |
| Issued | | | 394,550 | | | $ | 3,948,131 | | | | | | | | | |
| Issued as reinvestment | | | | | | | | | | | | | | | | |
| of dividends | | | — | | | | — | | | | | | | | | |
| Redeemed | | | (3,000 | ) | | | (30,000 | ) | | | | | | | | |
| Net Increase | | | 391,550 | | | $ | 3,918,131 | | | | | | | | | |
| ^ | Commencement of operations. |
The Merger Fund and Westchester Capital Funds
NOTES TO THE FINANCIAL STATEMENTS (continued)
June 30, 2018 (Unaudited)
Note 5 — INVESTMENT TRANSACTIONS AND INCOME TAX INFORMATION
TMF’s purchases and sales of securities for the six months ended June 30, 2018 (excluding short-term investments, short-term options, forward currency contracts, swap contracts and short positions) in the aggregate were $1,588,594,746 and $1,412,075,795, respectively. EDF’s purchases and sales of securities for the six months ended June 30, 2018 (excluding short-term investments, short-term options, forward currency contracts, swap contracts and short positions) in the aggregate were $110,739,560 and $79,992,682, respectively. CEF’s purchases and sales of securities for the six months ended June 30, 2018 (excluding short-term investments and swap contracts) in the aggregate were $5,627,493 and $2,427,705, respectively. There were no purchases or sales of long-term U.S. Government securities by the Funds.
At December 31, 2017, the components of accumulated earnings gains (losses) on a tax basis were as follows:
| | | | | | WCM Alternatives: | |
| | | The Merger Fund | | | Event-Driven Fund | |
| Cost of investments* | | $ | 1,621,907,511 | | | $ | 86,523,609 | |
| Gross unrealized appreciation | | | 144,599,151 | | | | 5,533,266 | |
| Gross unrealized depreciation | | | (187,361,850 | ) | | | (6,996,593 | ) |
| Net unrealized depreciation | | $ | (42,762,699 | ) | | $ | (1,463,327 | ) |
| Undistributed ordinary income | | | 12,400,625 | | | | 1,785,492 | |
| Undistributed long-term capital gain | | | — | | | | — | |
| Total distributable earnings | | $ | 12,400,625 | | | $ | 1,785,492 | |
| Other accumulated losses | | | (52,737,611 | ) | | | (153,836 | ) |
| Total accumulated gains (losses) | | $ | (83,099,685 | ) | | $ | 168,329 | |
| * | Represents cost (including derivative contracts) for federal income tax purposes and differs from the cost for financial reporting purposes due to wash sales, constructive sales, PFIC mark to market, and unsettled short losses. |
GAAP requires that certain components of net assets relating to permanent differences be reclassified between financial and tax reporting. Permanent differences are primarily related to foreign currency transactions and swap treatment. These reclassifications have no effect on net assets or net asset value per share. For the year ended December 31, 2017, the following table shows the reclassifications made:
The Merger Fund and Westchester Capital Funds
NOTES TO THE FINANCIAL STATEMENTS (continued)
June 30, 2018 (Unaudited)
Note 5 — INVESTMENT TRANSACTIONS AND INCOME TAX INFORMATION (continued)
| | | | | | Accumulated Net | | | | |
| | | | | | Realized Gain (Loss) on | | | | |
| | | | | | Investment, Securities | | | | |
| | | | | | Sold Short, Written Option | | | | |
| | | | | | Contracts Expired or | | | | |
| | | Accumulated | | | Closed, Forward Currency | | | | |
| | | Undistributed | | | Exchange Contracts, | | | | |
| | | Net Investment | | | Swap Contracts and | | | | |
| | | Income (Loss) | | | Foreign Currency Transactions | | | Paid-in Capital | |
| The Merger Fund | | $ | (12,367,809 | ) | | $ | 9,892,235 | | | $ | 2,475,574 | |
| | | | | | | | | | | | | |
| WCM Alternatives: | | | | | | | | | | | | |
| Event-Driven Fund | | $ | 2,056,192 | | | $ | (2,898,242 | ) | | $ | 842,050 | |
The tax components of dividends paid during the six months ended June 30, 2018 and the year ended December 31, 2017 were as follows:
| | | | | | | | | WCM Alternatives: | | | WCM Alternatives: | |
| | | The Merger Fund | | | Event-Driven Fund | | | Credit Event Fund | |
| Investor Class | | 2018 | | | 2017 | | | 2018 | | | 2017 | | | 2018 | | | 2017 | |
| Ordinary Income | | $ | — | | | $ | 6,825,795 | | | $ | — | | | $ | 55,388 | | | $ | — | | | | N/A | |
| Long-Term Capital Gains | | | — | | | | — | | | | — | | | | — | | | | — | | | | N/A | |
| Total Distributions Paid | | $ | — | | | $ | 6,825,795 | | | $ | — | | | $ | 55,388 | | | $ | — | | | | N/A | |
| | | | | | | | | | | | | | | | | | | | | | | | | |
| Institutional Class | | | 2018 | | | | 2017 | | | | 2018 | | | | 2017 | | | | 2018 | | | | 2017 | |
| Ordinary Income | | $ | — | | | $ | 11,286,042 | | | $ | — | | | $ | 941,430 | | | $ | — | | | | N/A | |
| Long-Term Capital Gains | | | — | | | | — | | | | — | | | | — | | | | — | | | | N/A | |
| Total Distributions Paid | | $ | — | | | $ | 11,286,042 | | | $ | — | | | $ | 941,430 | | | $ | — | | | | N/A | |
The Funds designated as long-term capital gain dividend, pursuant to Internal Revenue Case Section 852(b)(3), the amount necessary to reduce the earnings and profits of the Fund related to net capital gain to zero for the tax year ended December 31, 2017.
As of December 31, 2017, TMF and EDF did not have any post-October ordinary losses deferred, on a tax basis. As of December 31, 2017, TMF and EDF had no post-October ordinary losses. As of December 31, 2017, TMF had no short-term and $42,349,028 of long-term capital loss carryover. As of December 31, 2017, EDF had no short-term or long-term capital loss carryover.
Note 6 — DISTRIBUTION PLAN
TMF has adopted an Amended and Restated Plan of Distribution (the “TMF Plan”) dated July 30, 2013, pursuant to Rule 12b-1 under the 1940 Act that applies to TMF’s Investor Class shares. EDF has adopted a Plan of Distribution (the “EDF Plan”) dated July 30, 2013, pursuant to Rule 12b-1 under the 1940 Act that applies to EDF’s Investor Class shares. CEF has
The Merger Fund and Westchester Capital Funds
NOTES TO THE FINANCIAL STATEMENTS (continued)
June 30, 2018 (Unaudited)
Note 6 — DISTRIBUTION PLAN (continued)
adopted a Plan of Distribution (the “CEF Plan” and together with the TMF and EDF Plans, the “Plans”) dated October 31, 2017, pursuant to Rule 12b-1 under the 1940 Act that applies to CEF’s Investor Class shares. Under each Plan, a Fund may pay the Fund's distributor for certain of the distribution and shareholder service expenses associated with the Fund's Investor Class shares, as well as to reimburse the distributor for payments made to any broker-dealer or other financial intermediary with whom the Fund has entered into a contract to distribute the Fund's Investor Class shares, or any other qualified financial services firm, to compensate those broker-dealers, intermediaries or firms for distribution and/or shareholder-related services with respect to the Fund's Investor Class shares held or purchased by their respective customers or in connection with the purchase of the Fund's Investor Class shares attributable to their efforts. Under each Plan, the amount of such compensation paid in any one year shall not exceed 0.25% annually of the average daily net assets attributable to the respective Fund’s Investor Class shares, which may be payable as a distribution fee or a service fee for providing permitted recordkeeping, subaccounting, subtransfer agency and/or shareholder liaison services. For the six months ended June 30, 2018, TMF incurred $1,426,351 pursuant to the TMF Plan in respect of TMF’s Investor Class shares. For the six months ended June 30, 2018, EDF incurred $9,039 pursuant to the EDF Plan in respect of EDF’s Investor Class shares. For the six months ended June 30, 2018, CEF incurred $17 pursuant to the CEF Plan in respect of CEF’s Investor Class shares. Each Plan will remain in effect from year to year provided such continuance is approved at least annually by a vote either of a majority of the relevant Fund’s Trustees, including a majority of the non-interested Trustees, or a majority of the relevant Fund’s outstanding Investor Class shares.
Note 7 — OFFSETTING ASSETS AND LIABILITIES
Each Fund is subject to various Master Netting Arrangements, which govern the terms of certain transactions with select counterparties. The Master Netting Arrangements allow each Fund to close out and net its total exposure to a counterparty in the event of a default with respect to all the transactions governed under a single agreement with a counterparty. The Master Netting Arrangements also specify collateral posting arrangements at pre-arranged exposure levels. Under the Master Netting Arrangements, collateral is routinely transferred if the total net exposure to certain transactions (net of existing collateral already in place) governed under the relevant Master Netting Arrangement with a counterparty in a given account exceeds a specified threshold depending on the counterparty and the type of Master Netting Arrangement.
The Merger Fund and Westchester Capital Funds
NOTES TO THE FINANCIAL STATEMENTS (continued)
June 30, 2018 (Unaudited)
Note 7 — OFFSETTING ASSETS AND LIABILITIES (continued)
The Merger Fund
| | | | | | Gross | | | Net | | | | | | | | | | |
| | | | | | Amounts | | | Amounts | | | | | | | | | | |
| | | | | | Offset | | | Presented | | | Gross Amounts not | | | | |
| | | Gross | | | in the | | | in the | | | offset in the Statement | | | | |
| | | Amounts of | | | Statement | | | Statement | | | of Assets and Liabilities | | | | |
| | | Recognized | | | of Assets | | | of Assets | | | | | | Collateral | | | | |
| | | Assets/ | | | and | | | and | | | Financial | | | Received/ | | | Net | |
| | | Liabilities | | | Liabilities | | | Liabilities | | | Instruments | | | Pledged* | | | Amount | |
| Assets: | | | | | | | | | | | | | | | | | | |
| Description | | | | | | | | | | | | | | | | | | |
| Forward | | | | | | | | | | | | | | | | | | |
| Currency | | | | | | | | | | | | | | | | | | |
| Exchange | | | | | | | | | | | | | | | | | | |
| Contracts** | | $ | 10,055,595 | | | $ | 1,756,000 | | | $ | 8,299,595 | | | $ | — | | | $ | — | | | $ | 8,299,595 | |
| Swap | | | | | | | | | | | | | | | | | | | | | | | | |
| Contracts — | | | | | | | | | | | | | | | | | | | | | | | | |
| Bank of America | | | | | | | | | | | | | | | | | | | | | | | | |
| Merrill Lynch | | | | | | | | | | | | | | | | | | | | | | | | |
| & Co., Inc. | | | 6,566,527 | | | | 1,870,466 | | | | 4,696,061 | | | | — | | | | — | | | | 4,696,061 | |
| Swap | | | | | | | | | | | | | | | | | | | | | | | | |
| Contracts — | | | | | | | | | | | | | | | | | | | | | | | | |
| JPMorgan | | | | | | | | | | | | | | | | | | | | | | | | |
| Chase & | | | | | | | | | | | | | | | | | | | | | | | | |
| Co., Inc. | | | 25,971,633 | | | | 51,087 | | | | 25,920,546 | | | | — | | | | — | | | | 25,920,546 | |
| | | $ | 42,593,755 | | | $ | 3,677,553 | | | $ | 38,916,202 | | | $ | — | | | $ | — | | | $ | 38,916,202 | |
| | | | | | | | | | | | | | | | | | | | | | | | | |
| Liabilities: | | | | | | | | | | | | | | | | | | | | | | | | |
| Description | | | | | | | | | | | | | | | | | | | | | | | | |
| Written Option | | | | | | | | | | | | | | | | | | | | | | | | |
| Contracts** | | $ | 18,910,578 | | | $ | — | | | $ | 18,910,578 | | | $ | — | | | $ | 18,910,578 | | | $ | — | |
| Forward | | | | | | | | | | | | | | | | | | | | | | | | |
| Currency | | | | | | | | | | | | | | | | | | | | | | | | |
| Exchange | | | | | | | | | | | | | | | | | | | | | | | | |
| Contracts** | | | 1,756,000 | | | | 1,756,000 | | | | — | | | | — | | | | — | | | | — | |
| Swap | | | | | | | | | | | | | | | | | | | | | | | | |
| Contracts — | | | | | | | | | | | | | | | | | | | | | | | | |
| Bank of America | | | | | | | | | | | | | | | | | | | | | | | | |
| Merrill Lynch | | | | | | | | | | | | | | | | | | | | | | | | |
| & Co., Inc. | | | 1,870,466 | | | | 1,870,466 | | | | — | | | | — | | | | — | | | | — | |
| Swap | | | | | | | | | | | | | | | | | | | | | | | | |
| Contracts — | | | | | | | | | | | | | | | | | | | | | | | | |
| JPMorgan | | | | | | | | | | | | | | | | | | | | | | | | |
| Chase & | | | | | | | | | | | | | | | | | | | | | | | | |
| Co., Inc. | | | 51,087 | | | | 51,087 | | | | — | | | | — | | | | — | | | | — | |
| | | $ | 22,588,131 | | | $ | 3,677,553 | | | $ | 18,910,578 | | | $ | — | | | $ | 18,910,578 | | | $ | — | |
The Merger Fund and Westchester Capital Funds
NOTES TO THE FINANCIAL STATEMENTS (continued)
June 30, 2018 (Unaudited)
Note 7 — OFFSETTING ASSETS AND LIABILITIES (continued)
WCM Alternatives: Event-Driven Fund
| | | | | | Gross | | | Net | | | | | | | | | | |
| | | | | | Amounts | | | Amounts | | | | | | | | | | |
| | | | | | Offset | | | Presented | | | Gross Amounts not | | | | |
| | | Gross | | | in the | | | in the | | | offset in the Statement | | | | |
| | | Amounts of | | | Statement | | | Statement | | | of Assets and Liabilities | | | | |
| | | Recognized | | | of Assets | | | of Assets | | | | | | Collateral | | | | |
| | | Assets/ | | | and | | | and | | | Financial | | | Received/ | | | Net | |
| | | Liabilities | | | Liabilities | | | Liabilities | | | Instruments | | | Pledged* | | | Amount | |
| Assets: | | | | | | | | | | | | | | | | | | |
| Description | | | | | | | | | | | | | | | | | | |
| Forward | | | | | | | | | | | | | | | | | | |
| Currency | | | | | | | | | | | | | | | | | | |
| Exchange | | | | | | | | | | | | | | | | | | |
| Contracts** | | $ | 577,896 | | | $ | 83,007 | | | $ | 494,889 | | | $ | — | | | $ | — | | | $ | 494,889 | |
| Swap | | | | | | | | | | | | | | | | | | | | | | | | |
| Contracts — | | | | | | | | | | | | | | | | | | | | | | | | |
| Bank of America | | | | | | | | | | | | | | | | | | | | | | | | |
| Merrill Lynch | | | | | | | | | | | | | | | | | | | | | | | | |
| & Co., Inc. | | | 518,281 | | | | 518,281 | | | | — | | | | — | | | | — | | | | — | |
| Swap | | | | | | | | | | | | | | | | | | | | | | | | |
| Contracts — | | | | | | | | | | | | | | | | | | | | | | | | |
| JPMorgan | | | | | | | | | | | | | | | | | | | | | | | | |
| Chase & | | | | | | | | | | | | | | | | | | | | | | | | |
| Co., Inc. | | | 3,938,745 | | | | 1,250 | | | | 3,937,495 | | | | — | | | | — | | | | 3,937,495 | |
| | | $ | 5,034,922 | | | $ | 602,538 | | | $ | 4,432,384 | | | $ | — | | | $ | — | | | $ | 4,432,384 | |
| | | | | | | | | | | | | | | | | | | | | | | | | |
| Liabilities: | | | | | | | | | | | | | | | | | | | | | | | | |
| Description | | | | | | | | | | | | | | | | | | | | | | | | |
| Written | | | | | | | | | | | | | | | | | | | | | | | | |
| Option | | | | | | | | | | | | | | | | | | | | | | | | |
| Contracts** | | $ | 1,017,343 | | | $ | — | | | $ | 1,017,343 | | | $ | — | | | $ | 1,017,343 | | | $ | — | |
| Forward | | | | | | | | | | | | | | | | | | | | | | | | |
| Currency | | | | | | | | | | | | | | | | | | | | | | | | |
| Exchange | | | | | | | | | | | | | | | | | | | | | | | | |
| Contracts** | | | 83,007 | | | | 83,007 | | | | — | | | | — | | | | — | | | | — | |
| Swap | | | | | | | | | | | | | | | | | | | | | | | | |
| Contracts — | | | | | | | | | | | | | | | | | | | | | | | | |
| Bank of America | | | | | | | | | | | | | | | | | | | | | | | | |
| Merrill Lynch | | | | | | | | | | | | | | | | | | | | | | | | |
| & Co., Inc. | | | 1,188,264 | | | | 518,281 | | | | 669,983 | | | | — | | | | 669,983 | | | | — | |
| Swap | | | | | | | | | | | | | | | | | | | | | | | | |
| Contracts — | | | | | | | | | | | | | | | | | | | | | | | | |
| JPMorgan | | | | | | | | | | | | | | | | | | | | | | | | |
| Chase & | | | | | | | | | | | | | | | | | | | | | | | | |
| Co., Inc. | | | 1,250 | | | | 1,250 | | | | — | | | | — | | | | — | | | | — | |
| | | $ | 2,289,864 | | | $ | 602,538 | | | $ | 1,687,326 | | | $ | — | | | $ | 1,687,326 | | | $ | — | |
The Merger Fund and Westchester Capital Funds
NOTES TO THE FINANCIAL STATEMENTS (continued)
June 30, 2018 (Unaudited)
Note 7 — OFFSETTING ASSETS AND LIABILITIES (continued)
WCM Alternatives: Credit Event Fund
| | | | | | Gross | | | Net | | | | | | | | | | |
| | | | | | Amounts | | | Amounts | | | | | | | | | | |
| | | | | | Offset | | | Presented | | | Gross Amounts not | | | | |
| | | Gross | | | in the | | | in the | | | offset in the Statement | | | | |
| | | Amounts of | | | Statement | | | Statement | | | of Assets and Liabilities | | | | |
| | | Recognized | | | of Assets | | | of Assets | | | | | | Collateral | | | | |
| | | Assets/ | | | and | | | and | | | Financial | | | Received/ | | | Net | |
| | | Liabilities | | | Liabilities | | | Liabilities | | | Instruments | | | Pledged* | | | Amount | |
| Assets: | | | | | | | | | | | | | | | | | | |
| Description | | | | | | | | | | | | | | | | | | |
| Swap | | | | | | | | | | | | | | | | | | |
| Contracts — | | | | | | | | | | | | | | | | | | |
| JPMorgan | | | | | | | | | | | | | | | | | | |
| Chase & | | | | | | | | | | | | | | | | | | |
| Co., Inc. | | $ | 2,673 | | | $ | 2,673 | | | $ | — | | | $ | — | | | $ | — | | | $ | — | |
| | | $ | 2,673 | | | $ | 2,673 | | | $ | — | | | $ | — | | | $ | — | | | $ | — | |
| Liabilities: | | | | | | | | | | | | | | | | | | | | | | | | |
| Description | | | | | | | | | | | | | | | | | | | | | | | | |
| Swap | | | | | | | | | | | | | | | | | | | | | | | | |
| Contracts — | | | | | | | | | | | | | | | | | | | | | | | | |
| JPMorgan | | | | | | | | | | | | | | | | | | | | | | | | |
| Chase & | | | | | | | | | | | | | | | | | | | | | | | | |
| Co., Inc. | | $ | 11,680 | | | $ | 2,673 | | | $ | 9,007 | | | $ | — | | | $ | 9,007 | | | $ | — | |
| | | $ | 11,680 | | | $ | 2,673 | | | $ | 9,007 | | | $ | — | | | $ | 9,007 | | | $ | — | |
| * | | In some instances, the actual collateral received/pledged may be more than amount shown. |
| ** | | JPMorgan Chase & Co., Inc. is the counterparty for all open forward currency exchange contracts and prime broker for all written option contracts held by the Funds as of June 30, 2018. |
Note 8 — ACCOUNTING PRONOUNCEMENTS
In March 2017, the Financial Accounting Standards Board (“FASB”) issued Accounting Standards Update (“ASU”) No. 2017-08, Receivables—Nonrefundable Fees and Other Costs (Subtopic 310-20): Premium Amortization on Purchased Callable Debt Securities. The amendments in the ASU shorten the amortization period for certain callable debt securities, held at a premium, to be amortized to the earliest call date. The ASU does not require an accounting change for securities held at a discount; which continues to be amortized to maturity. The ASU is effective for fiscal years and interim periods within those fiscal years beginning after December 15, 2018. Management is currently evaluating the impact, if any, of applying this provision.
Note 9 — SUBSEQUENT EVENTS
Management has evaluated events and transactions occurring after June 30, 2018 through the date that the financial statements were issued, and has determined that no additional disclosure in the financial statements is required.
BOARD APPROVAL OF INVESTMENT ADVISORY AGREEMENT
(Unaudited)
Prior to the inception of CEF’s investment operations, the Board of Trustees of the Fund (the “Board”), including a majority of the Trustees who are not interested persons of the Fund (the “Independent Trustees”), approved the Fund’s advisory arrangement (the “Agreement”) with the Adviser for an initial two-year period. A summary of the material factors and conclusions that formed the basis for the approval by the Board and the Independent Trustees are discussed below.
Review Process
The 1940 Act, as amended, requires that the Board request and evaluate, and that the Adviser furnish, such information as may reasonably be necessary to evaluate the proposed terms of the Fund’s Agreement. The Independent Trustees began their formal review process by requesting from the Adviser information they believed necessary to evaluate the proposed terms of the Fund’s Agreement. The Independent Trustees and Board, in approving the Agreement, did not identify any particular information that was all-important or controlling, and each Trustee attributed different weights to the various factors. Throughout the review process, the Independent Trustees were advised by their independent counsel. The Independent Trustees also discussed the proposed approval of the Agreement in private sessions with their independent counsel, at which no representatives of the Adviser were present.
The following summary describes the most important, but not all, of the factors considered by the Board and the Independent Trustees.
Materials Reviewed
During the course of its review, the Board received a wide variety of materials relating to the services to be provided by the Adviser and the Fund’s other service providers, including reports on the Adviser’s experience in managing a sleeve of another account using substantially similar investment strategies to those proposed to be employed on behalf of the Fund, the proposed advisory fee structure, and other information relating to the nature, extent and quality of services proposed to be provided by the Adviser to the Fund. In addition, in connection with its consideration of the Agreement, the Board requested and reviewed supplementary information regarding the estimated total expenses of the Fund, the Adviser’s estimated profitability in respect of the Agreement, and information about the personnel expected to provide investment management services to the Fund. The Board also requested and evaluated advisory fee and expense information for other investment companies with substantially similar investment strategies that was
BOARD APPROVAL OF INVESTMENT ADVISORY AGREEMENT
(continued) (Unaudited)
compiled by Morningstar, Inc. The Board and the Independent Trustees also considered information regarding anticipated so-called “fall-out” benefits to the Adviser and its affiliates due to the Adviser’s proposed relationship with the Fund. In addition to the information presented as part of this process, the members of the Board also considered information they received regarding the Adviser in their roles as members of the board of trustees of the other registered investment companies sponsored and advised by the Adviser.
Nature, Extent and Quality of Services
Nature and Extent of Services – In approving the Agreement for an initial two-year term, the Board and the Independent Trustees evaluated the nature and extent of the services to be provided by the Adviser. The Board and the Independent Trustees also considered information concerning the Adviser’s investment philosophy and investment outlook with respect to the Fund. In this context, the Board and the Independent Trustees considered the in-house research capabilities of the Adviser as well as other resources available to the Adviser, including research services available to the Adviser as a result of securities transactions to be effected for the Fund and other investment advisory clients of the Adviser. The Board and the Independent Trustees also considered the managerial and financial resources available to the Adviser.
Quality of Services – The Board and the Independent Trustees considered the quality of the services to be provided by the Adviser and the quality of the resources of the Adviser available to the Fund. The Board and the Independent Trustees considered the specialized experience, expertise and professional qualifications of the personnel of the Adviser, including that the Adviser had a track record managing a sleeve of another account using substantially similar investment strategies to those proposed to be employed on behalf of the Fund. The Board and the Independent Trustees considered the complexity of managing the Fund’s strategy relative to other types of funds. The Board and the Independent Trustees also received and reviewed information regarding the quality of non-investment advisory services expected to be provided to the Fund by the Adviser, including certain compliance services. The Board and the Independent Trustees considered that the scope of the advisory services to be provided to the Fund by the Adviser were consistent with the Fund’s investment-related operational requirements.
In their evaluation of the quality of the services to be provided by the Adviser, the Board and the Independent Trustees also considered the performance of the Adviser in managing The Merger Fund (“TMF”), The
BOARD APPROVAL OF INVESTMENT ADVISORY AGREEMENT
(continued) (Unaudited)
Merger Fund VL (“VL”) and WCM Alternatives: Event-Driven Fund (“EDF”), as the principal investment strategies the Adviser proposes to provide to the Fund are similar in nature to those it deploys from time to time for TMF, VL and EDF. The Board and the Independent Trustees concluded, within the context of their overall conclusions regarding the Agreement, that the Adviser’s performance record in managing other funds with event-related investment strategies supported the approval of the Agreement.
The Board and the Independent Trustees concluded, within the context of their conclusions regarding the Agreement, that, overall, they were satisfied with the proposed nature, extent and quality of the services to be provided by the Adviser.
Management Fees and Expenses
The Board and the Independent Trustees reviewed information, including comparative information, regarding the proposed advisory fees to be paid to the Adviser and the estimated total expenses to be borne by the Fund. They considered the Fund’s advisory fees relative to its peer group. In this regard, the Independent Trustees noted that while the Fund’s net advisory fee and net operating expenses (Investor Class), after taking into account the proposed expense limitation arrangement, were above the median of its peer group, the Fund’s peer group is quite limited, not all of the funds in the limited peer group appear to use event driven investment strategies, and the Fund’s proposed advisory fees were equal to or below that of five out of the seven peers shown (at the Fund’s projected asset levels). The Board and the Independent Trustees also considered the fees that the Adviser and its affiliates charge its other clients, though the Board and Independent Trustees noted that the Fund’s proposed investment strategies have never served as the primary means by which another client of the Adviser sought to achieve its investment objective. The Board and the Independent Trustees concluded, within the context of their overall conclusions regarding the Agreement, that the proposed fees to be charged under the Agreement represent reasonable compensation to the Adviser in light of the services to be provided.
Anticipated Profitability and Possible Economies of Scale
Anticipated Profitability – The Board and the Independent Trustees reviewed information regarding the anticipated cost of services provided by the Adviser and the anticipated profitability (before distribution expenses and prior to taxes) of the Adviser’s relationship with the Fund. The Board reviewed a pro forma profit and loss analysis for the Adviser based on the estimated cost of services to be provided and estimated
BOARD APPROVAL OF INVESTMENT ADVISORY AGREEMENT
(continued) (Unaudited)
Fund assets. In evaluating the Adviser’s expected profitability, the Independent Trustees considered that the information provided by the Adviser was necessarily estimated and that preparing the related profitability information involved certain assumptions and allocations that were imprecise. The Board and the Independent Trustees recognized that the probative value of estimated profitability information may be limited because a wide range of comparative information often is not generally available and it can be affected by numerous factors, including the structure of the particular adviser, the types of funds it manages, its business mix, the efficiency of an adviser’s operations, numerous assumptions about allocations and the adviser’s cost of capital. In addition, the Board and the Independent Trustees considered information regarding the direct and indirect benefits the Adviser may receive as a result of its relationship with the Fund, including research expected to be purchased with soft dollar credits earned from portfolio transactions effected on behalf of the Fund (soft dollar arrangements), and reputational benefits.
Possible Economies of Scale – The Board and the Independent Trustees reviewed the extent to which the Adviser may realize economies of scale in managing the Fund. The Board and the Independent Trustees concluded, within the context of their overall conclusions regarding the Agreement, that the Adviser’s estimated level of profitability from its relationship with the Fund was reasonable and not excessive in light of, among other things, significant start-up and ongoing costs expected to be borne by the Adviser and its expertise and experience in managing event-driven strategies. The Board and the Independent Trustees noted the Adviser’s representation that it believes it is highly unlikely it will experience meaningful economies of scale with respect to the Fund over the course of the first two years of the Agreement. The Board and the Independent Trustees concluded that the Adviser is unlikely to experience significant economies of scale in connection with the services to be provided to the Fund during the initial two-year term due to the low level of anticipated assets expected to be invested in the Fund during the initial two-year period and the start-up and ongoing costs that are expected to be borne by the Adviser as a result of the proposed expense limitation agreement with respect to the Fund. The Board and the Independent Trustees believed that it was not necessary to consider sharing economies of scale, including breakpoints, at this time. The Trustees also considered that the Adviser proposed an expense limitation that would limit, with certain exceptions, the maximum total annual expenses of the Fund for at least the first year of the Fund’s operations. The Independent Trustees
BOARD APPROVAL OF INVESTMENT ADVISORY AGREEMENT
(continued) (Unaudited)
concluded that those measures were reasonably designed to result in the sharing of economies of scale realized by the Adviser during the initial term of the Agreement, if any, with the Fund and its shareholders.
Conclusions
Based on the Board’s review, including the Board’s consideration of each of the factors referred to above, the Board and the Independent Trustees concluded that the proposed terms of the Agreement, including the fees payable to the Adviser, are fair and reasonable to the Fund and its shareholders given the scope and quality of the services expected to be provided to the Fund and such other considerations as the Independent Trustees considered relevant in the exercise of their reasonable business judgment and that approval of the Agreement was in the best interests of the Fund and its shareholders. Accordingly, the Board and Independent Trustees unanimously approved the Agreement for an initial two-year term.
ADDITIONAL INFORMATION (Unaudited)
For the fiscal year ended December 31, 2017, certain dividends paid by TMF may be subject to a maximum tax rate of 15% as provided for by the Jobs and Growth Tax Relief Reconciliation Act of 2003. The percentage of dividends declared from ordinary income designated as qualified dividend income for the fiscal year ended December 31, 2017 was 100.00% for TMF and 25.94% for EDF.
For corporate shareholders, the percent of ordinary income distributions qualifying for the corporate dividends-received deduction for the fiscal year ended December 31, 2017 was 100.00% for TMF and 23.70% for EDF.
The percentage of taxable ordinary income distributions that are designated as short-term capital gain distributions under Internal Revenue Code Section 871(k)(2)(c) for the fiscal year ended December 31, 2017 was 0.00% for TMF and 100.00% for EDF.
AVAILABILITY OF PROXY VOTING INFORMATION
Information regarding how the Funds generally vote proxies relating to portfolio securities may be obtained without charge by calling the Funds’ Transfer Agent at 1-800-343-8959 or by visiting the SEC’s website at www.sec.gov. Information regarding how the Funds voted proxies during the most recent 12-month period ended June 30 is available on the SEC’s website or by calling the toll-free number listed above.
AVAILABILITY OF QUARTERLY PORTFOLIO SCHEDULE
The Funds file their complete schedule of portfolio holdings with the SEC for the first and third quarters of each fiscal year on Form N-Q. The Funds’ Forms N-Q are available on the SEC’s website at www.sec.gov and may be reviewed and copied at the SEC’s Public Reference Room in Washington, DC. Information on the operation of the Public Reference Room may be obtained by calling 1-800-SEC-0330.
The Merger Fund and Westchester Capital Funds
PRIVACY POLICY
We collect the following non-public personal information about you:
| • | Information we receive from you on or in applications or other forms, correspondence, or conversations, including, but not limited to, your name, address, phone number, social security number, assets, income and date of birth; and |
| | |
| • | Information about your transactions with us, our affiliates, or others, including, but not limited to, your account number and balance, payments history, parties to transactions, cost basis information, and other financial information. |
We do not disclose any non-public personal information about our current or former shareholders to non-affiliated third parties, except as permitted by law. For example, we are permitted by law to disclose all of the information we collect, as described above, to our transfer agent to process your transactions. Furthermore, we restrict access to your non- public personal information to those persons who require such information to provide products or services to you. We maintain physical, electronic, and procedural safeguards that comply with federal standards to guard your non-public personal information.
In the event that you hold shares of the Fund through a financial intermediary, including, but not limited to, a broker-dealer, bank, or trust company, the privacy policy of your financial intermediary would govern how your non-public personal information would be shared with non- affiliated third parties.
THIS PRIVACY POLICY IS NOT A PART OF THE SEMI-ANNUAL REPORT.
(This Page Intentionally Left Blank.)
| Investment Adviser |
| | Westchester Capital Management, LLC | |
| | 100 Summit Lake Drive | |
| | Valhalla, NY 10595 | |
| | (914) 741-5600 | |
| | www.westchestercapitalfunds.com | |
| | | |
| Administrator, Transfer Agent, Accountant, |
| Dividend Paying Agent and Shareholder Servicing Agent |
| | U.S. Bancorp Fund Services, LLC | |
| | 615 East Michigan Street | |
| | P.O. Box 701 | |
| | Milwaukee, WI 53201-0701 | |
| | (800) 343-8959 | |
| | | |
| Custodian |
| | U.S. Bank, N.A. | |
| | 1555 North Rivercenter Drive, Suite 302 | |
| | Milwaukee, WI 53212 | |
| | (800) 343-8959 | |
| | | |
| Distributor |
| | Quasar Distributors, LLC | |
| | 777 East Wisconsin Avenue | |
| | Milwaukee, WI 53202 | |
| | | |
| Trustees |
| | Roy Behren | |
| | Michael T. Shannon | |
| | Barry Hamerling | |
| | Richard V. Silver | |
| | Christianna Wood | |
| | | |
| Executive Officers |
| | Roy Behren, Co-President and Treasurer | |
| | Michael T. Shannon, Co-President | |
| | Bruce Rubin, Vice President and | |
| | Chief Compliance Officer | |
| | Abraham R. Cary, Secretary | |
| | | |
| Counsel |
| | Ropes & Gray LLP | |
| | 1211 Avenue of the Americas | |
| | New York, NY 10036 | |
| | | |
| Independent Registered |
| Public Accounting Firm |
| | PricewaterhouseCoopers LLP | |
| | 300 Madison Avenue | |
| | New York, NY 10017 | |
Item 2. Code of Ethics.
Not applicable for semi-annual reports.
Item 3. Audit Committee Financial Expert.
Not applicable for semi-annual reports.
Item 4. Principal Accountant Fees and Services.
Not applicable for semi-annual reports.
Item 5. Audit Committee of Listed Registrants.
Not applicable.
Item 6. Investments.
The registrant’s Schedule of Investments is included as part of the report to shareholders filed under Item 1 of this Form.
Item 7. Disclosure of Proxy Voting Policies and Procedures for Closed-End Management Investment Companies.
Not applicable to open-end investment companies.
Item 8. Portfolio Managers of Closed-End Management Investment Companies.
Not applicable to open-end investment companies.
Item 9. Purchases of Equity Securities by Closed‑End Management Investment Company and Affiliated Purchasers.
Not applicable to open-end investment companies.
Item 10. Submission of Matters to a Vote of Security Holders.
There have been no material changes to the procedures by which shareholders may recommend nominees to the registrant’s board of trustees.
Item 11. Controls and Procedures.
| (a) | The registrant’s Co-Presidents/Chief Executive Officers and Treasurer/Chief Financial Officer have reviewed the registrant's disclosure controls and procedures (as defined in Rule 30a-3(c) under the Investment Company Act of 1940 (the “Act”)) as of a date within 90 days of the filing of this report, as required by Rule 30a-3(b) under the Act and Rules 13a-15(b) or 15d‑15(b) under the Securities Exchange Act of 1934. Based on their review, such officers have concluded that the disclosure controls and procedures are effective in ensuring that information required to be disclosed in this report is appropriately recorded, processed, summarized and reported and made known to them by others within the registrant and by the registrant’s service provider. |
| (b) | There were no changes in the registrant's internal control over financial reporting (as defined in Rule 30a-3(d) under the Act) that occurred during the second fiscal quarter of the period covered by this report that has materially affected, or is reasonably likely to materially affect, the registrant's internal control over financial reporting. |
Item 12. Disclosure of Securities Lending Activities for Closed-End Management Investment Companies.
Not applicable to open-end investment companies.
Item 13. Exhibits.
| (a) | (1) Any code of ethics or amendment thereto, that is the subject of the disclosure required by Item 2, to the extent that the registrant intends to satisfy Item 2 requirements through filing an exhibit. Not Applicable. |
(2) A separate certification for each principal executive officer and principal financial officer pursuant to Section 302 of the Sarbanes-Oxley Act of 2002. Filed herewith.
(3) Any written solicitation to purchase securities under Rule 23c‑1 under the Act sent or given during the period covered by the report by or on behalf of the registrant to 10 or more persons. Not applicable to open-end investment companies.
(4) Change in the registrant’s independent public accountant. Provide the information called for by Item 4 of Form 8-K under the Exchange Act (17 CFR 249.308). Unless otherwise specified by Item 4, or related to and necessary for a complete understanding of information not previously disclosed, the information should relate to events occurring during the reporting period. Not Applicable.
| (b) | Certifications pursuant to Section 906 of the Sarbanes‑Oxley Act of 2002. Furnished herewith. |
SIGNATURES
Pursuant to the requirements of the Securities Exchange Act of 1934 and the Investment Company Act of 1940, the registrant has duly caused this report to be signed on its behalf by the undersigned, thereunto duly authorized.
(Registrant) Westchester Capital Funds
By (Signature and Title)* /s/ Michael T. Shannon
Michael T. Shannon, Co-President
Date September 4, 2018
By (Signature and Title)* /s/ Roy Behren
Roy Behren, Co-President and Treasurer
Date September 4, 2018
Pursuant to the requirements of the Securities Exchange Act of 1934 and the Investment Company Act of 1940, this report has been signed below by the following persons on behalf of the registrant and in the capacities and on the dates indicated.
By (Signature and Title)* /s/ Michael T. Shannon
Michael T. Shannon, Co-President
Date September 4, 2018
By (Signature and Title)* /s/ Roy Behren
Roy Behren, Co-President and Treasurer
Date September 4, 2018
* Print the name and title of each signing officer under his or her signature.