Table of Contents
As confidentially submitted to the Securities and Exchange Commission on March 25, 2013. This draft registration statement has not been publicly filed with the Securities and Exchange Commission and all information herein remains strictly confidential.
Registration No. 333-
SECURITIES AND EXCHANGE COMMISSION
Washington, D.C. 20549
FORM F-1
REGISTRATION STATEMENT
UNDER
THE SECURITIES ACT OF 1933
GRAÑA Y MONTERO S.A.A.
(Exact name of Registrant as specified in its charter)
| Republic of Peru | 1600 | Not Applicable | ||
| (State or other jurisdiction of incorporation or organization) | (Primary Standard Industrial Classification Code Number) | (I.R.S. Employer Identification No.) |
Graña y Montero S.A.A.
Av. Paseo de la República 4667
Surquillo
Lima 34, Peru
(51) (1) 213 – 6565
(Address, including zip code, and telephone number, including area code, of registrant’s principal executive offices)
CT Corporation System
111 Eighth Avenue
New York, New York 10011
1-800-223-7567
(Name, address, including zip code, and telephone number, including area code, of agent for service)
With copies to:
Juan Francisco Méndez Simpson Thacher & Bartlett LLP 425 Lexington Avenue New York, New York 10017 (212) 455-2579 | Claudia Drago Morante Chief Legal Officer Graña y Montero S.A.A. Av. Paseo de la República Surquillo Lima 34, Peru (51) (1) 213–6565 | Nicholas Kronfeld Davis Polk & Wardwell LLP 450 Lexington Avenue New York, New York 10017 (212) 450-4950 |
Approximate date of commencement of proposed sale to the public: As soon as practicable after this Registration Statement becomes effective.
If any of the securities being registered on this Form are to be offered on a delayed or continuous basis pursuant to Rule 415 under the Securities Act, please check the following box. ¨
If this Form is filed to register additional securities for an offering pursuant to Rule 462(b) under the Securities Act, check the following box and list the Securities Act registration statement number of the earlier effective registration statement for the same offering. ¨
If this Form is a post-effective amendment filed pursuant to Rule 462(c) under the Securities Act, check the following box and list the Securities Act registration statement number of the earlier effective registration statement for the same offering. ¨
If this form is a post-effective amendment filed pursuant to Rule 462(d) under the Securities Act, check the following box and list the Securities Act registration statement number of the earlier effective registration statement for the same offering. ¨
If delivery of the prospectus is expected to be made pursuant to Rule 434, check the following box. ¨
CALCULATION OF REGISTRATION FEE
| ||||
| Title of each class of securities to be registered | Proposed maximum aggregate offering price(3) | Amount of registration fee | ||
Common shares (1)(2) | $[—] | $[—] | ||
| ||||
| ||||
| (1) | Includes common shares that the underwriters may purchase solely to cover over-allotments, if any, and common shares that are to be offered outside the United States but that may be resold from time to time in the United States in transactions requiring registration under the Securities Act. Offers and sales of common shares outside the United States are being made pursuant to Regulation S and are not covered by the Registration Statement. All or part of these common shares may be represented by American depositary shares, each of which represents [—] of our common shares. |
| (2) | A separate Registration Statement on Form F-6 will be filed for the registration of ADSs issuable upon deposit of the common shares registered hereby. |
| (3) | Estimated solely for purposes of calculating the amount of the registration fee pursuant to Rule 457(o) under the Securities Act. |
The Registrant hereby amends this Registration Statement on such date or dates as may be necessary to delay its effective date until the Registrant shall file a further amendment which specifically states that this Registration Statement shall thereafter become effective in accordance with Section 8(a) of the Securities Act, or until this Registration Statement shall become effective on such date as the Commission, acting pursuant to said Section 8(a), may determine.
Table of Contents
The information in this prospectus is not complete and may be changed. We may not sell these securities until the registration statement filed with the U.S. Securities and Exchange Commission is effective. This prospectus is not an offer to sell these securities and is not soliciting an offer to buy these securities in any jurisdiction where the offer or sale is not permitted.
SUBJECT TO COMPLETION, DATED , 2013

American Depositary Shares
Graña y Montero S.A.A.
Representing Common Shares
This is an initial public offering of American depositary shares, or ADSs, of Graña y Montero S.A.A. Each ADS represents [—] common shares.
We anticipate that the initial public offering price will be between US$ and US$ per ADS. We have applied to have the ADSs listed on the New York Stock Exchange under the symbol “[GRAM]”. Our common shares are listed on the Lima Stock Exchange (Bolsa de Valores de Lima) under the symbol “GRAMONC1”. On [—], 2013, the last reported sales price of our common shares on the Lima Stock Exchange was S/.[—] per common share (equivalent to approximately US$[—] per ADS based on the exchange rate on such date).
We have granted the underwriters an option for a period of 30 days to purchase from us a maximum of additional ADSs, representing common shares, to cover over-allotments of ADSs.
Investing in the ADSs involves risks. See “Risk Factors” beginning on page 18.
| Price to Public | Underwriting Discounts and Commissions | Proceeds to Us | ||||||||||
Per ADS | US$ | US$ | US$ | |||||||||
Total | US$ | US$ | US$ | |||||||||
The underwriters will receive compensation in addition to the underwriting discount. See “Underwriting.”
Neither the U.S. Securities and Exchange Commission nor any state securities commission has approved or disapproved of these securities or determined if this prospectus is truthful or complete. Any representation to the contrary is a criminal offense.
Neither the ADSs nor the offering has been or will be registered in the Republic of Peru and therefore are not and will not be subject to Peruvian laws applicable to public offerings in Peru. The information contained in this prospectus has not been approved or disapproved by the Peruvian Securities Commission (Superintendencia del Mercado de Valores). The ADSs may not be offered or sold in Peru except in compliance with the securities laws of Peru.
Delivery of the ADSs will be made on or about , 2013.
Global Coordinators
| Credit Suisse | J.P. Morgan | Morgan Stanley |
The date of this prospectus is , 2013
Table of Contents
We are responsible for the information contained in this prospectus. We have not authorized anyone to give you any other information and we take no responsibility for any other information that others may give you. The information contained in this prospectus is accurate only as of the date of this prospectus, regardless of the time of delivery of this prospectus or of any sale of ADSs.
| Page | ||||
| 1 | ||||
| 18 | ||||
| 38 | ||||
| 39 | ||||
| 40 | ||||
| 41 | ||||
| 42 | ||||
Management’s Discussion and Analysis of Financial Condition and Results of Operations | 50 | |||
| 81 | ||||
| 92 | ||||
| 139 | ||||
| 150 | ||||
| 159 | ||||
| Page | ||||
| 161 | ||||
| 163 | ||||
| 167 | ||||
| 168 | ||||
| 172 | ||||
| 182 | ||||
| 187 | ||||
| 195 | ||||
| 196 | ||||
| 196 | ||||
| 197 | ||||
| 198 | ||||
| F-1 | ||||
Through and including , 2013 (the 25th day after the date of this prospectus), U.S. federal securities law requires all dealers that effect transactions in our ADSs, whether or not participating in this offering, to deliver a prospectus. This requirement is in addition to the dealers’ obligation to deliver a prospectus when acting as underwriters and with respect to their unsold allotments or subscription.
i
Table of Contents
This prospectus has been prepared on the basis that all offers of ADSs in any Member State of the European Economic Area which has implemented the Prospectus Directive (each, a “Relevant Member State”) will be made pursuant to an exemption under the Prospectus Directive from the requirement to produce a prospectus for offers of the ADSs. Accordingly, any person making or intending to make any offer of ADSs within the European Economic Area that are the subject of the offering contemplated in this prospectus should only do so in circumstances in which no obligation arises for us or the underwriters to produce a prospectus for such offer. Neither we nor the underwriters have authorized, or hereby authorize, the making of any offer of ADSs in circumstances in which an obligation arises for us or the underwriters to publish a prospectus for such offer. “Prospectus Directive” means Directive 2003/71/EC (and amendments thereto, including the 2010 PD Amending Directive, to the extent implemented in the Relevant Member State), and includes any relevant implementing measure in the Relevant Member State; and the expression “2010 PD Amending Directive” means Directive 2010/73/EU.
The distribution of this prospectus and the offering and sale of the ADSs in certain jurisdictions may be restricted by law. Persons who receive this prospectus must inform themselves about and observe any such restrictions. This prospectus does not constitute an offer of, or an invitation to purchase, any of the ADSs in any jurisdiction in which such offer or invitation would be unlawful.
ii
Table of Contents
PRESENTATION OF FINANCIAL AND OTHER INFORMATION
Certain Definitions
All references to “we,” “us,” “our,” “our company,” “the group” and “Graña y Montero” in this prospectus are to Graña y Montero S.A.A., a publicly-held corporation (sociedad anónima abierta) organized under the laws of Peru. In this prospectus, we refer to our principal subsidiaries as follows: (i) in our Engineering and Construction (E&C) segment: GyM S.A. as “GyM”; Stracon GyM S.A. as “Stracon GyM”; Vial y Vives S.A. as “Vial y Vives”; and GMI S.A. as “GMI”; (ii) in our Infrastructure segment: Norvial S.A. as “Norvial”; Survial S.A. as “Survial”; Concesión Canchaque S.A. as “Canchaque”; GyM Ferrovías S.A. as “GyM Ferrovías”; La Chira S.A. as “La Chira”; and GMP S.A. as “GMP”; (iii) in our Real Estate segment: Viva GyM S.A. as “Viva GyM”; Inmobiliaria Almonte S.A.C. as “Almonte”; and (iv) in our Technical Services segment, GMD S.A. as “GMD”; Concar S.A. as “Concar”; and CAM S.A. as “CAM.”
The term “U.S. dollar” and the symbol “US$” refer to the legal currency of the United States; the term “nuevo sol” and the symbol “S/.” refer to the legal currency of Peru; the term “Chilean peso” and the symbol “CLP” refer to the legal currency of Chile; and the term “Colombian peso” and the symbol “COP” refer to the legal currency of Colombia.
Financial Information
Our consolidated financial statements for the years ended December 31, 2010, 2011 and 2012 included in this prospectus have been prepared in nuevos soles and in accordance with International Financial Reporting Standards (“IFRS”) issued by the International Accounting Standards Board (“IASB”) and audited by Dongo, Soria, Gaveglio y Asociados S.C. de R.L., a member firm of PricewaterhouseCoopers in accordance with the auditing standards of the U.S. Public Company Accounting Oversight Board (“PCAOB”). We have also included in this prospectus certain financial information for years prior to 2010 which have been prepared in accordance with generally accepted accounting principles in Peru (“Peruvian GAAP”). In accordance with Peruvian law, we were required to present our financial statements under IFRS beginning with our financial statements for the year ended December 31, 2010. Peruvian GAAP differs in certain respects from IFRS. Accordingly our financial information presented in accordance with Peruvian GAAP is not directly comparable to our financial information prepared in accordance with IFRS.
We manage our business in four segments: Engineering and Construction (E&C); Infrastructure; Real Estate; and Technical Services. For information on our results of operations per our business segments, see note 5 to our consolidated financial statements included in this prospectus.
In this prospectus, we present EBITDA, a non-GAAP financial measure. A non-GAAP financial measure is generally defined as one that purports to measure financial performance, financial position or cash flows but excludes or includes amounts that would not be so adjusted in the most comparable IFRS measure. We present EBITDA because we believe it provides investors with a supplemental measure of the financial performance of our core operations that facilitates period-to-period comparisons on a consistent basis. Our management uses EBITDA, among other measures, for internal planning and performance measurement purposes. EBITDA should not be construed as an alternative to net profit or operating profit, as an indicator of operating performance, as an alternative to cash flow provided by operating activities or as a measure of liquidity (in each case, as determined in accordance with IFRS). EBITDA, as calculated by us, may not be comparable to similarly titled measures reported by other companies. For our definition EBITDA and a reconciliation of EBITDA to the most directly comparable IFRS financial measure, see “Selected Financial Data.”
We have translated some of the nuevos soles amounts contained in this prospectus into U.S. dollars for convenience purposes only. Unless otherwise indicated or the context otherwise requires, the rate used to translate nuevos soles amounts to U.S. dollars was S/.2.551 to US$1.00, which was the exchange rate reported for December 31, 2012 by the Peruvian Superintendency of Banks, Insurance and Private Pension Fund Administrators (Superintendencia de Banca, Seguros y AFPs, or “SBS”). We present our backlog in U.S. dollars. For contracts denominated in nuevo soles or other local currencies, amounts have been converted into U.S. dollars based on the exchange rate published by the SBS on December 31 of the corresponding year. When we present our ratios of backlog and revenues in this prospectus, we similarly convert our revenues, which are reported in nuevo soles, into U.S. dollars based on the exchange rate reported for December 31 of the corresponding year. For conversions of
iii
Table of Contents
macroeconomic indicators (particularly in “Industry” in this prospectus), average annual exchange rates for the currencies of each of the countries addressed are used. The Federal Reserve Bank of New York does not report a noon buying rate for nuevos soles. The U.S. dollar equivalent information presented in this prospectus is provided solely for convenience of investors and should not be construed as implying that the nuevos soles or other currency amounts represent, or could have been or could be converted into, U.S. dollars at such rates or at any other rate. See “Exchange Rates” for information regarding historical exchange rates of nuevos soles to U.S. dollars.
Certain figures included in this prospectus have been subject to rounding adjustments. Accordingly, figures shown as totals in certain tables may not be arithmetic aggregations of the figures that precede them.
Backlog
This prospectus includes our backlog for our Engineering and Construction, Infrastructure and Technical Services segments. We do not include in this prospectus backlog for our Real Estate segment or, in our Infrastructure segment, for our Norvial toll road concession or our Energy line of business. When we present backlog on a segment basis, we do not include eliminations that are included in our consolidated backlog. Backlog is not a measure defined by IFRS, and our methodology for determining backlog may not be comparable to the methodology used by other companies in determining their backlog. For our definition of backlog, see “Business—Backlog. See also “Risk Factors—Risk Related to Our Company— Our backlog and our ratio of historical backlog to revenues may not be reliable indicators of future revenues or profit.”
Market Information
We make estimates in this prospectus regarding our competitive position and market share, as well as the market size and expected growth of the engineering and construction, infrastructure, real estate and technical services industries in Peru and elsewhere in Latin America. We have made these estimates on the basis of our management’s knowledge and statistics and other information from government agencies, industry professional organizations, industry publications and other sources. We believe these estimates to be accurate as of the date of this prospectus. Our director, Hugo Santa María Guzmán, is a partner in APOYO Consultoría, and our director, Roberto Abusada Salah is a director of the Peruvian Economy Institute.
In this prospectus we present gross domestic product (“GDP”) both on a nominal and real basis. Real GDP is nominal GDP adjusted to exclude the effect of inflation. Unless otherwise indicated, references to GDP are to real GDP.
Offering Information
All amounts contained in this prospectus that have been adjusted to reflect the estimated net proceeds of the offering are based upon the sale of ADSs at an assumed public offering price of US$ per ADS (the mid-point of the price range set forth on the cover page of this prospectus). Unless otherwise indicated, all information contained in this prospectus assumes no exercise of the underwriters’ option to purchase up to additional ADSs, representing common shares, to cover over-allotments, if any.
Measurements and Other Data
In this prospectus, we use the following measurements:
| • | m means one meter, which equals approximately 3.28084 feet; |
| • | m2 means one square meter, which equals approximately 10.7630 square feet; |
| • | km means one kilometer, which equals approximately 0.621371 miles; |
| • | hectare means one hectare, which equals approximately 2.47105 acres; |
| • | tonne means one metric ton, which equals approximately 2,204.6 pounds; |
iv
Table of Contents
| • | bbl or barrel of oil means one stock tank barrel, which is equivalent to approximately 0.15898 cubic meters; |
| • | boe means one barrel of oil equivalent, which equals approximately 160.2167 cubic meters, determined using the ratio of 5,658 cubic feet of natural gas to one barrel of oil; |
| • | cf means one cubic foot; |
| • | M, when used before bbl, boe or cf, means one thousand bbl, boe and cf, respectively; |
| • | MM, when used before bbl, boe or cf, means one million bbl, boe and cf, respectively; |
| • | MW means one megawatt, which equals one million watts; and |
| • | Gwh means one gigawatt hour, which equals one billion watt hours. |
In this prospectus, we use the term accident incident rate with respect to our E&C segment, which is calculated as the number of injuries divided by the total number of hours worked by all full-time employees of our E&C segment during the relevant year divided by 200,000 (which reflects 40 hours worked per week in a 50-week year by 100 equivalent full-time workers).
v
Table of Contents
FORWARD-LOOKING STATEMENTS
This prospectus contains forward-looking statements. Forward-looking statements convey our current expectations or forecasts of future events. These statements involve known and unknown risks, uncertainties and other factors, including those listed under “Risk Factors,” which may cause our actual results, performance or achievements to differ materially from the forward-looking statements that we make.
Forward-looking statements typically are identified by words or phrases such as “may,” “will,” “expect,” “anticipate,” “aim,” “estimate,” “intend,” “project,” “plan,” “believe,” “potential,” “continue,” “is/are likely to,” or other similar expressions. Any or all of our forward-looking statements in this prospectus may turn out to be inaccurate. Our actual results could differ materially from those contained in forward-looking statements due to a number of factors, including, among others:
| • | global macroeconomic conditions, including commodity prices, and economic, political and social conditions in the markets in which we operate, particularly in Peru; |
| • | major changes in Peruvian government policies at the national, regional or municipal levels, including in connection with infrastructure concessions, investments in infrastructure and affordable housing subsidies; |
| • | social conflicts in Peru that disrupt infrastructure projects, particularly in the mining sector; |
| • | interest rate fluctuations, inflation and devaluation or appreciation of the nuevo sol in relation to the U.S. dollar (or other currencies in which we receive revenue); |
| • | our ability to continue to grow our operations, both in Peru and internationally; |
| • | the level of capital investments and financings available for infrastructure projects of the types that we perform, both in the private and public sectors; |
| • | competition in our markets, both from local and international companies; |
| • | our ability to complete acquisitions on favorable terms or at all and to integrate acquired businesses and manage them effectively post-acquisition; |
| • | performance under contracts, where a failure to meet schedules, cost estimates or performance targets on a timely basis could result in reduced profit margins or losses and impact our reputation; |
| • | developments, some of which may be beyond our control, that affect our reputation in our markets, including a deterioration in our safety record; |
| • | industry-specific operational risks, such as operator errors, mechanical failures and other accidents; |
| • | availability and costs of energy, raw materials, equipment and labor; |
| • | our ability to obtain financing on favorable terms; |
| • | our ability to attract and retain qualified personnel; |
| • | our ability to enter into joint operations, and rules involved in operating under joint operation or similar arrangements; |
| • | our exposure to potential liability claims and contract disputes, including as a result of environmental damage alleged to have been caused by our operations; |
| • | our and our clients’ compliance with environmental, health and safety laws and regulations, and changes in government policies and regulations in the countries in which we operate; |
vi
Table of Contents
| • | negotiations of claims with our clients of cost and schedule variances and change orders on major projects; |
| • | volatility in global prices of oil and gas; |
| • | the cyclical nature of some of our business segments; |
| • | limitations on our ability to operate our concessions profitably, including changes in traffic patterns, and limitations on our ability to obtain new concessions; |
| • | our ability to accurately estimate the costs of our projects; |
| • | changes in real estate market prices, customer demand, preference and purchasing power, and financing availability and terms; |
| • | our ability to obtain zoning and other license requirements for our real estate development; |
| • | changes in tax laws; |
| • | natural disasters, severe weather or other events that may adversely impact our business; and |
| • | other factors identified or discussed under “Risk Factors.” |
The forward-looking statements in this prospectus represent our expectations and forecasts as of the date of this prospectus. Except as required by law, we undertake no obligation to update or revise publicly any forward-looking statements, whether as a result of new information, future events or otherwise, after the date of this prospectus.
vii
Table of Contents
This summary highlights selected information contained in this prospectus and may not include all of the information that is important to you. For a more complete understanding of our company and this offering, you should read this entire prospectus, including “Risk Factors,” “Management’s Discussion and Analysis of Financial Condition and Results of Operations” and our consolidated financial statements included in this prospectus.
Overview
We are the largest engineering and construction company in Peru, and the largest publicly-traded engineering and construction company in Latin America as measured by market capitalization as of December 31, 2012, with strong complementary businesses in infrastructure, real estate and technical services.
With 80 years of operations, we have a long track record of successfully completing the engineering and construction of many of Peru’s landmark private- and public-sector infrastructure projects, such as the Lima International Airport and the Peru LNG gas liquefaction plant, and we believe we have earned a reputation for operational excellence in our markets. We have developed a highly-experienced management team, a talented pool of more than 3,500 engineers and a skilled work force that share our core corporate values.
Beginning in the mid-1980s, we leveraged our engineering and construction expertise into complementary lines of business, such as the development, ownership, operation and maintenance of infrastructure assets (including the Lima Metro, Peru’s only urban railway system), real estate development, and the provision of technical services primarily to infrastructure-related assets. We believe our business mix creates significant opportunities across our lines of business, generates more stable revenues and earnings on a consolidated basis, and provides additional financial stability to our company.
As a result of our performance in Peru, we have been requested by clients to undertake the engineering and construction of large and complex projects outside our home market, such as the Pueblo Viejo gold mine in the Dominican Republic. Through the successful execution of those projects, we have developed operational experience in other Latin American countries. We have further expanded our activities in other key markets of the region through the acquisition of businesses with solid positions in those markets, more recently through the acquisition of the Chilean construction company Vial y Vives, which specializes in the mining sector.
The table below shows our revenue growth from 2003 to 2009 under Peruvian GAAP and from 2010 to 2012 (upon our conversion to IFRS) under IFRS.
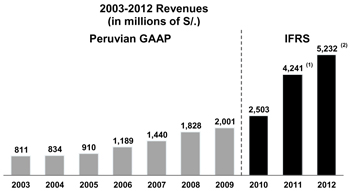
| (1) | Includes S/.558 million of revenues from a business we acquired in 2011. |
| (2) | Includes S/.658 million of revenues from businesses we acquired in 2011 and 2012. |
During 2012, we generated revenues of S/.5,231.9 million (US$2,050.9 million), EBITDA of S/.775.7 million (US$304.1 million), and net profit of S/.366.3 million (US$143.6 million) including net profit attributable to
1
Table of Contents
controlling interest of S/.290.0 million (US$113.7 million). From 2010 through 2012, our consolidated revenues grew at a compounded annual growth rate (CAGR) of 44.6% (35.2% excluding acquisitions). In addition, as of December 31, 2012, our backlog amounted to S/.10,450.3 million (US$4,096.5 million), which represented 2.2x our related revenues for the year. Moreover, 76.3% of our backlog as of such date is comprised of contracts in the private sector, strategically targeted to our key end-markets, such as mining, infrastructure, power, energy and real estate. See “Business—Backlog.”
Our Engineering and Construction (E&C) segment was founded in 1933 and is currently the largest player in Peru in terms of 2011 revenues, based on Peru: The Top 10,000 Companies 2012, a publication which ranks the top 10,000 companies in Peru by revenue. Throughout our history, we (on our own or as a majority or minority partner in joint operations) have completed projects in almost every major sector of the Peruvian economy. Some of these landmark projects include the construction of the Peru LNG gas liquefaction plant for Hunt Oil and Repsol, one of the largest foreign direct investments in Peru’s history; the engineering and construction of the 605 km Mantaro-Socabaya transmission line for Hydro Quebec, which connected the country’s electrical grids; and the expansion of the Cuajone copper mine operated by Southern Copper, the largest copper mine and smelter complex in the world at that time. We also completed the Lima Metro, and have built many of the iconic buildings in the country, including the Westin Lima Hotel and the Gran Teatro Nacional, as well as approximately 8,000 affordable housing and housing units. In addition to our activities in Peru, clients often request us to execute the engineering and construction of complex projects abroad, including the construction of the Pueblo Viejo gold mine for Barrick Gold in the Dominican Republic, the engineering and construction of the Four Seasons Hotel in Mexico City, and, as part of a joint operation with SNC-Lavalin and Techint, the project management (EPCM) of the Mina de Cobre Panamá project developed by Inmet Mining, the second largest foreign investment project in Panama’s history, after the Panama Canal.
Our Infrastructure, Real Estate and Technical Services segments operate complementary lines of business, many of which are typically carried out under long-term arrangements that provide a more stable cash flow stream. In our Infrastructure segment, we currently have long-term concessions or similar contractual arrangements in Peru for three toll roads, the Lima Metro, a waste water treatment plant in Lima, multiple fuel storage facilities, two producing oil fields, and a gas processing plant. In our Real Estate segment, we primarily develop and sell homes targeted to low- and middle-income population sectors which are experiencing a significant increase in disposable income, as well as, to a lesser extent, office and commercial space. In our Technical Services segment, we provide operation and maintenance services for infrastructure assets, information technology (IT) services, including IT outsourcing, systems integration, application outsourcing and business process outsourcing services, and electricity networks services, including installation, operation and maintenance of electrical metering systems and related infrastructure.
In addition to our activities in Peru, we have recently completed two international acquisitions. In February 2011, we acquired a controlling interest in Compañía Americana de Multiservicios (CAM) from Enersis S.A. of Grupo Endesa (“Enersis”). Headquartered in Chile, CAM provides technical services to power utility companies in Chile, Peru, Colombia and Brazil. In November 2012, we acquired a controlling interest in Vial y Vives, an engineering and construction company specializing in the Chilean mining sector, consolidating our strong position in the Latin American mining E&C sector. We expect to continue to selectively undertake projects and pursue acquisitions and strategic alliances in Latin America to further expand our company outside Peru, with a particular focus on Chile and Colombia.
We have developed an extensive and talented team, including more than 3,500 engineers, that gives us the capability and scale to undertake large and complex projects. We put significant emphasis on promoting our core corporate values of quality, professionalism, reliability and efficiency. As a company listed on the Lima Stock Exchange since 1997, we also abide by the highest corporate governance standards in Peru.
2
Table of Contents
The table below sets forth selected financial information relating to our business.
| As of and for the year ended December 31, | ||||||||||||||||
| 2010 | 2011 | 2012 | 2012 | |||||||||||||
| (in millions of S/.) | (in millions of US$) | |||||||||||||||
Revenues | 2,502.7 | 4,241.3 | 5,231.9 | 2,050.9 | ||||||||||||
EBITDA | 553.9 | 662.0 | 775.7 | 304.1 | ||||||||||||
Net profit | 276.7 | 336.2 | 366.3 | 143.6 | ||||||||||||
Net profit attributable to controlling interest | 252.8 | 289.1 | 290.0 | 113.7 | ||||||||||||
Dividends per common share (in S/. or US$) | 0.05 | 0.10 | 0.16 | 0.06 | ||||||||||||
Net debt | (340.0 | ) | (128.3 | ) | 65.4 | 25.6 | ||||||||||
Net debt/EBITDA ratio | (0.6 | )x | (0.2 | )x | 0.1x | |||||||||||
Backlog(1) | 3,790.4 | 6,583.2 | 10,450.3 | 4,096.5 | ||||||||||||
Backlog/revenues ratio(1)(2) | 1.8x | 1.8x | 2.2x | |||||||||||||
| (1) | Does not include our Real Estate segment and in our Infrastructure segment our Norvial toll road concession or our Energy line of business. See “Business—Backlog.” |
| (2) | Backlog is calculated as of the last day of the applicable year. Revenues are calculated for such year and converted into U.S. dollars based on the exchange rate published by the SBS on December 31 of the corresponding year. Includes revenues only for businesses included in backlog. |
Our Markets
We believe that Peru offers us attractive opportunities to continue to grow our businesses because of its strong macroeconomic outlook, stable political environment, solid public finances, increased private and public investments and growing middle class. Peru has experienced uninterrupted economic growth over the last 13 years (including in 2009 despite the global economic crisis). It has been South America’s fastest growing economy as measured by real GDP growth and one of only six investment grade countries worldwide with average annual real GDP growth over 7.0% from 2007 to 2011. According to the Economist Intelligence Unit (EIU), the Peruvian economy is projected to grow at rates of 6.2% and 6.0% in 2013 and 2014, respectively.
The main drivers of Peru’s recent economic performance have been strong domestic demand and increased private and public investment, with private and public investment having grown at CAGRs of 10.8% and 15.9%, respectively, from 2007 to 2012. Despite this increase in investment, Peru still has a sizable infrastructure deficit of approximately US$90 billion, according to the Peruvian Association for the Promotion of National Infrastructure (AFIN). APOYO Consultoría, a business consultancy services company in Peru, has identified public and private investment in the key sectors of mining, power and energy, and infrastructure in Peru of US$10 billion and US$61 billion, respectively, between 2012 and 2016. Of these public and private investments, mining activity accounts for approximately 54.9%, power and energy accounts for approximately 24.5%, and infrastructure accounts for approximately 20.6%.
We believe that the main countries in Latin America outside our home market that we intend to focus on—Chile and Colombia—benefit from similar macroeconomic trends as Peru, and offer attractive growth opportunities for many of our business segments.
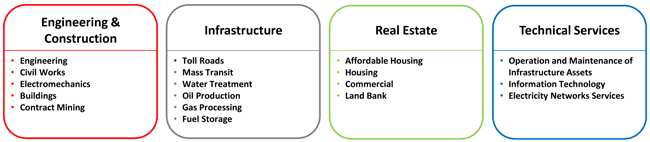
Our Business Segments
The following charts set forth the principal activities of each of our four business segments and their contribution to our consolidated revenues, EBITDA and net profit in U.S. dollars for 2012.
3
Table of Contents
| Revenues | EBITDA | Net profit | ||
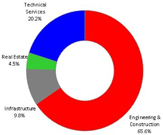 | 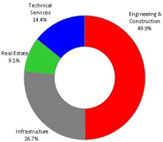 | 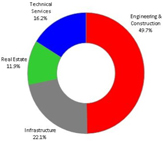 | ||
| US$2,050.9 million | US$304.1 million | US$143.6 million | ||
Engineering and Construction
Our E&C segment has an 80-year operating history and is the largest player in Peru by 2011 revenues, undertaking a broad range of activities in: (i) engineering, from traditional engineering services such as structural, civil and design engineering, and architectural planning to advanced specialties including process design, simulation, and environmental services; (ii) civil works, such as the construction of hydroelectric power stations and other large infrastructure facilities; (iii) electromechanic construction, such as concentrator plants, oil and natural gas pipelines, and transmission lines; (iv) building construction, such as office buildings, residential buildings, hotels, affordable housing projects, shopping centers and industrial facilities; (v) contract mining, such as earthworks, blasting, loading and hauling ore.
We provide E&C services mainly for private-sector projects and, to a lesser extent, for public infrastructure projects. Our principal end-markets consist of the mining, power, oil and gas, transportation, real estate and other infrastructure sectors. The type of contracts we have vary depending on the nature of the project, the client and the sector, and typically are based on cost-plus or unit price arrangements and, to a lesser degree, on lump-sum and EPC arrangements. As of December 31, 2012, approximately 79% of our engineering and construction backlog was contracted under cost-plus fee or unit price contractual arrangements. Although contracting for engineering and construction usually consists of open bidding processes, we are often able to enter into direct bilateral contract negotiation with select clients, thanks to our reputation for quality of service, which helps mitigate competitive pricing pressures.
We believe that the expertise we have developed over the years serving the large mining sector in Peru, combined with our recent Vial y Vives acquisition in Chile, positions us as one of the leading E&C mining contractors in Latin America. Some of our landmark mining projects include the expansion of the Cuajone copper mine operated by Southern Copper; the expansion of the Cerro Verde copper mine for Freeport-McMoran; the expansion of the Cajamarquilla zinc refinery for Votorantim Metais-Cajamarquilla; and the engineering and construction of the Cerro Corona gold concentrator plant for GoldFields, one of the largest gold producing mines in Peru. Our mining projects also include the Pueblo Viejo gold mine operated by Barrick and Goldcorp in the Dominican Republic, one of the largest gold producing mines in the Americas and the single largest foreign investment project in the Dominican Republic’s history; the engineering and construction for Apex Silver of the San Cristobal mine in Bolivia, one of the largest open-pit silver reserve mines in the world; and our current role as part of the joint operation that is carrying out the project management (EPCM) of the US$6.2 billion Mina de Cobre Panamá copper project developed by Inmet Mining.
4
Table of Contents
The table below sets forth selected financial information for our Engineering and Construction business segment.
| As of and for the year ended December 31, | ||||||||||||||||
| 2010 | 2011 | 2012 | 2012 | |||||||||||||
| (in millions of S/.) | (in millions of US$) | |||||||||||||||
Revenues | 1,700.5 | 2,784.2 | 3,524.6 | 1,381.6 | ||||||||||||
EBITDA | 218.3 | 315.0 | 387.9 | 152.1 | ||||||||||||
Net profit | 111.2 | 166.4 | 188.5 | 73.9 | ||||||||||||
Net profit attributable to controlling interest | 104.1 | 153.1 | 165.1 | 64.7 | ||||||||||||
Backlog | 2,989.2 | 4,961.5 | 7,462.7 | 2,925.4 | ||||||||||||
Backlog/revenues ratio(1) | 1.8x | 1.8x | 2.1x | |||||||||||||
| (1) | Backlog is calculated as of the last day of the applicable year. Revenues are calculated for such year and converted into U.S. dollars based on the exchange rate published by the SBS on December 31 of the corresponding year. |
Infrastructure
We are an important toll road concessionaire in Peru, operating three toll roads. Moreover, we are the concessionaire for the Lima Metro, the largest mass-transit rail system in Peru, and a waste water treatment plant. Additionally, we operate multiple fuel storage facilities, two producing oil fields and a gas processing plant under long-term government contracts.
Our principal toll road concession is Norvial, a 25-year concession ending in 2028 for a 183 kilometer stretch of the Panamericana Norte highway that provides the only northern highway exit from the city of Lima. Through a partnership with rail operator Ferrovías S.A.C., we were awarded the 30-year concession for the new Lima Metro, which began operations at the beginning of 2012. Under 30-year government service contracts that began in 1991, we also extract crude oil in two fields located in northwestern Peru. Our aggregate average daily production during 2012 was approximately 1,405 bbl per day. These fields had estimated proved reserves of 8,460 Mboe as of December 31, 2012. We own and operate a gas processing plant, with an aggregate capacity of 44 MMcf per day. In addition, through a joint operation with Oiltanking GmbH we operate nine fuel storage terminals along the Peruvian coastline, which we believe handled approximately one-third of the country’s refined fuel in 2012.
We continuously evaluate infrastructure projects and selectively participate in the bidding processes for a variety of concessions. A joint operation in which we participate has been awarded, and is currently negotiating the contract for, the expansion of two major highways in Lima. The first is a 37-year concession of the Via Expresa Javier Prado, a 20 km toll road that crosses the city from east to west, traversing through eight districts. This project has an estimated total completion cost of US$790 million. We were also awarded, and are currently negotiating the terms for, a 40-year concession for the Via Expresa Sur, a 4.6 km extension of one of the main roads in Lima, which crosses the city from north to south. This project has an estimated total completion cost of US$200 million.
The table below sets forth selected financial information for our Infrastructure business segment.
| As of and for the year ended December 31, | ||||||||||||||||
| 2010 | 2011 | 2012 | 2012 | |||||||||||||
| (in millions of S/.) | (in millions of US$) | |||||||||||||||
Revenues | 354.7 | 404.2 | 524.5 | 205.6 | ||||||||||||
EBITDA | 191.1 | 176.1 | 207.5 | 81.4 | ||||||||||||
Net profit | 88.1 | 81.8 | 84.0 | 32.9 | ||||||||||||
Net profit attributable to controlling interest | 73.6 | 68.2 | 66.7 | 26.1 | ||||||||||||
Backlog(1) | 132.7 | 528.3 | 1,089.4 | 427.0 | ||||||||||||
Backlog/revenues ratio(1)(2) | 3.0x | 14.5x | 7.2x | |||||||||||||
5
Table of Contents
| (1) | Does not include our Norvial toll road concession or our Energy line of business. See “Business—Backlog.” |
| (2) | Backlog is calculated as of the last day of the applicable year. Revenues are calculated for such year and converted into U.S. dollars based on the exchange rate published by the SBS on December 31 of the corresponding year. Includes revenues only for businesses included in backlog. Our ratio of backlog to revenues for our Infrastructure segment is not representative of what we would expect the ratio to be in future periods because in 2010 and 2011 we did not have revenues for La Chira waste water treatment plant and the Lima Metro and in 2012 we only had pre-operation revenues for La Chira waste water treatment plant and revenues for the Lima Metro based on a limited number of trains during the first year of operation. |
Real Estate
Our Real Estate segment is the largest apartment building developer in Peru, in terms of number of units sold and value of sales in 2012, according to Tinsa, a market intelligence firm focused on the real estate market, and is focused on the development and sale of affordable housing and housing as well as other real estate projects. Since commencing our operations in 1987, we have developed approximately 450,000 m2 of affordable housing (approximately 6,614 units); approximately 290,000 m2 of housing (approximately 1,400 units); approximately 115,000 m2 of office space (approximately 780 offices); and approximately 43,000 m2 of shopping centers (three shopping centers). As of the date of this prospectus, we are in the process of developing 11 affordable housing projects (with an expected 160,000 m2in aggregate), five housing projects (with an expected 22,000 m2 in aggregate); and five office buildings (with an expected 24,000 m2in aggregate). We typically acquire land for development with co-investors. This allows us to optimize our return on capital and increase the number of projects we can develop with the same capital base.
Our Real Estate segment also owns and sells significant land parcels in Lima, with land bank of approximately 888 hectares, as of December 31, 2012. One of our principal land bank properties is a 50.0% interest in Cuartel San Martín, a 68,000 m2 former military base located in Lima’s upscale Miraflores district, where we are planning a premiere multi-use development that will include higher-income housing, office towers, a shopping mall, a luxury hotel and a conference center. We plan to begin construction of this project in the fourth quarter of 2013. We also own a 50.4% interest in Almonte, an approximately 800-hectare development project located in the southern part of the city of Lima, and one of the largest privately owned pieces of land in the Lima metropolitan area.
The table below sets forth selected financial information for our Real Estate business segment.
| Year ended December 31, | ||||||||||||||||
| 2010 | 2011 | 2012 | 2012 | |||||||||||||
| (in millions of S/.) | (in millions of US$) | |||||||||||||||
Revenues | 218.6 | 152.3 | 240.1 | 94.1 | ||||||||||||
EBITDA | 27.4 | 37.5 | 70.5 | 27.6 | ||||||||||||
Net profit | 17.9 | 24.1 | 45.3 | 17.8 | ||||||||||||
Net profit attributable to controlling interest | 8.5 | 6.1 | 12.4 | 4.9 | ||||||||||||
Technical Services
Our Technical Services segment undertakes a broad range of activities, including (i) the operation and maintenance of infrastructure assets; (ii) information technology (IT) services for private clients and the government; and (iii) electricity networks services. This segment’s mid-to long-term contracts add a more stable cash flow stream to our consolidated activities.
Operating in the road operation and maintenance sector since 1994, we believe we are an industry leader in Peru in the sector. As of the date of this prospectus, we have 11 maintenance contracts for more than 5,000 km of road. In addition to road maintenance, we also have a long-term contract for the operation and maintenance of the Lima Metro.
6
Table of Contents
Operating in the IT sector since 1984, we are the second largest IT company in Peru, as measured by 2011 revenues, according to International Data Corporation, a market intelligence firm focused on the IT market. We offer systems integration, technology outsourcing and solutions, application outsourcing and business process outsourcing to a broad range of clients in the banking, mining, energy, education and government sectors, among others.
Through CAM, acquired on February 24, 2011 from Enersis, we provide field and specialized services in the engineering, installation, operation and management of electrical metering systems and related infrastructure, primarily for power utility companies in Chile, Peru, Colombia and Brazil.
The table below sets forth selected financial information for our Technical Services business segment.
| As of and for the year ended December 31, | ||||||||||||||||
| 2010 | 2011 | 2012 | 2012 | |||||||||||||
| (in millions of S/.) | (in millions of US$) | |||||||||||||||
Revenues | 285.0 | 977.0 | 1,083.3 | 424.7 | ||||||||||||
EBITDA | 53.8 | 121.6 | 111.6 | 43.7 | ||||||||||||
Net profit | 24.7 | 61.1 | 61.5 | 24.1 | ||||||||||||
Net profit attributable to controlling interest | 23.9 | 53.9 | 50.6 | 19.8 | ||||||||||||
Backlog | 750.3 | 1,391.9 | 2,228.9 | 873.7 | ||||||||||||
Backlog/revenues ratio(1) | 2.6x | 1.4x | 2.1x | |||||||||||||
| (1) | Backlog is calculated as of the last day of the applicable year. Revenues are calculated for such year and converted into U.S. dollars based on the exchange rate published by the SBS on December 31 of the corresponding year. |
Our Strengths
We believe our company’s strengths provide us with significant competitive advantages. Our principal strengths include the following:
Leader in fast-growing markets
We are the largest engineering and construction company in Peru and the largest publicly-traded engineering and construction company in Latin America as measured by market capitalization as of December 31, 2012. Peru is undergoing a period of unparalleled development, with over 6.5% average annual real GDP growth between 2008 and 2012 and significant private and public investments in the mining, power, oil and gas, transportation, real estate and other infrastructure sectors. We have completed some of the most complex and large-scale infrastructure projects in the country, and we believe we are an integral part of Peru’s ongoing transformation with projects that contribute to the overall economic development of the country. We believe our expertise, reputation, scale and operational capabilities in Peru position us to take advantage of the country’s favorable economic conditions and growth opportunities. We believe we are also a significant infrastructure concessionaire in Peru, the largest apartment building developer in Peru and the second largest IT company in Peru.
We believe we are well-positioned to leverage our platform in the Peruvian market to continue to grow our business in other countries in Latin America, primarily Chile and Colombia. Throughout our history, we have undertaken complex E&C projects in the region and have recently completed acquisitions in Chile. Moreover, we believe we are one of the leading mining E&C companies in Latin America.
Long-standing track record and reputation for operational excellence
During our 80-year history, we have focused on the successful and on-time execution of complex projects, through our “deliver before deadline” and “lean construction” initiatives. Our extensive experience has allowed us to gain deep market knowledge and expertise, which help us better serve our clients and manage risks in our contractual arrangements. We believe we have a reputation for operational excellence, and were named among the
7
Table of Contents
top ten most admired companies in Peru by PwC in 2012. In addition, KPMG ranked us seventh out of 100 companies with the best reputations in Peru in 2012. We believe that our track record and the reputation we have earned in our markets are key factors in winning new and repeat business, as well as in partnering with strategic industry players and attracting top talent to our company.
Complementary lines of business which generate more stable cash flows and create additional business opportunities across our segments
We have expanded our company by developing complementary lines of business, many of which have become leaders in their respective markets. These lines of business create significant business opportunities across our segments, enabling us to capture a greater share of infrastructure spending, and also generate cost synergies. One example is Norvial, a toll-road concession operated within our Infrastructure segment. In addition to managing the concession, we used our E&C segment to design and construct the expansion of the highway and, once constructed, we are now using our Technical Services segment to operate and maintain the highway. In addition to increasing our levels of consolidated activity, many of these lines of business enable us to achieve more stable cash flows through medium and long-term client service contracts and concessions, which counter in part the cyclicality of the engineering and construction business.
High growth and profitability with strong financial position
Our operations have grown significantly over the last several years, with our consolidated revenues growing at CAGR of 44.6% (35.2% excluding acquisitions) from 2010 to 2012. We have achieved this growth with low levels of indebtedness, relying mainly on cash flow from operations to fund our growth. As of December 31, 2012, our net debt was S/.65.4 million (US$25.6 million) and our EBITDA to net debt ratio was 0.1x. In 2012, we achieved an EBITDA of S/.775.7 million (US$304.1 million), with an EBITDA margin (i.e., EBITDA as a percentage of revenues) of 14.8%.
Robust backlog and significant additional potential projects
We have a robust and growing backlog which amounted to S/.10,450.3 million (US$4,096.5 million) as of December 31, 2012, 67.8% higher than as of December 31, 2011. We believe that our backlog, which represents approximately 2.2x our 2012 revenues, provides visibility as to our potential for growth in the coming years, although backlog may not always be an accurate indicator of future revenues. See “Risk Factors—Risk Related to Our Company— Our backlog and our ratio of historical backlog to revenues may not be reliable indicators of future revenues or profit.” We believe our backlog is strategically targeted to our key end-markets. In addition to our backlog, we also have significant potential projects in our pipeline. We have already been awarded concessions for the Via Expresa Javier Prado and Via Expresa Sur expansion projects, for which we are currently in the contract negotiation stage. We are also in the process of obtaining the necessary licenses to begin construction of our large multi-use real estate development project at Cuartel San Martín. Furthermore, we continuously evaluate bidding on contracts arising from the significant ongoing private and public investments in Latin America.
Proven ability to create and grow businesses organically and through acquisitions
We have proven our ability to extend our engineering and construction capabilities into complementary lines of business in a diverse range of industries, some of which began as innovative start-ups in response to client needs. For example, in 1984, we created a new IT business division, which grew and evolved through the years to become the second largest IT company in Peru. Additionally, we also have successfully acquired and integrated new businesses. In February 2011, we acquired CAM, our electricity services business headquartered in Santiago, Chile, and have integrated its operations and personnel into our company, while improving its operational performance. More recently, in November 2012, we acquired Vial y Vives, an engineering and construction company specializing in the Chilean mining sector which complements our leading E&C practice in the mining sector. We believe that our proven ability to create new businesses, develop businesses organically and acquire and successfully integrate new businesses into our platform is a key competitive advantage as we continue to expand our operations in Latin America.
8
Table of Contents
Highly experienced management, talented engineers and skilled workforce, with shared core corporate values
Our senior management team has an average tenure within our company of approximately 19 years. In 2012, Euromoney recognized us as the second best managed company in the construction and cement sectors in Latin America, and among the five best managed companies in Peru. We motivate our management through performance-based compensation, which align their interests with those of our shareholders. In addition, through our efforts to attract, train and retain our workforce, we have built a talented team of employees, including more than 3,500 engineers. We also have access to a network of approximately 40,000 manual laborers throughout Peru that can supplement our workforce when required by our construction pipeline. Thanks to our extensive and talented team, we have the capability and scale to undertake large and complex projects in Peru and elsewhere.
We have been listed on the Lima Stock Exchange since 1997. We abide by the highest corporate governance standards in Peru, and we are one of only 17 companies in Latin America, and one of only three in Peru, that form part of the Company’s Circle, which recognizes companies for their high corporate governance standards and is sponsored by the International Finance Corporation (IFC), the Organization for Economic Co-operation and Development (OECD) and the Global Corporate Governance Forum. In addition, we have developed a strong corporate culture based on principles of high-quality, professionalism, reliability and efficiency. We employ rigorous safety standards and procedures and emphasize environmental sustainability and social responsibility. In 2012, our engineering and construction subsidiary GyM had an accident incidence rate of 0.29, calculated over 64,202,006 hours worked. In 2011, GyM had an accident incidence rate of 0.52, calculated over 52,979,699 hours worked, which was significantly lower than that of private construction companies in the United States for the year, which had an average of 3.80, as reported by the Bureau of Labor Statistics of the U.S Department of Labor.
Our Strategies
Our mission is to be the most reliable engineering services company in Latin America. Our key strategies to achieve this mission include the following:
Be the contractor of choice for large-scale and complex projects in Peru and other key markets
We intend to enhance our position as a contractor of choice for large-scale and complex infrastructure projects in Peru and other key markets, by (i) utilizing the scale, expertise and market knowledge we have accumulated during our 80-year operating history to strengthen and expand our E&C segment; (ii) maintaining and further developing our long-standing client relationships based on our ongoing pursuit of operational excellence; (iii) continuing to strategically partner with global industry leaders, such as Bechtel and Fluor, with complementary capabilities for specific projects that we undertake; and (iv) leveraging our expertise in the mining sector with a view to becoming the premier mining services provider throughout Latin America.
Further expand our infrastructure-related businesses to increase activity across our business segments and generate more stable cash flows
We plan to continue to expand our infrastructure-related businesses to capitalize on private and public investments in Peru, including in toll roads, airports, ports, railroads, hospitals, water utility companies, and other power and oil and gas infrastructure assets. In addition to providing more recurring and predictable cash flows, our Infrastructure segment generates additional business opportunities for our E&C and Technical Services segments.
Maintain highly capitalized balance sheet
We seek to maintain a prudent and sustainable capital structure and a strong financial position to allow us to capitalize on additional business opportunities as they arise. We intend to remain financially disciplined by limiting substantially all our debt incurrence to identified projects with repayment sources.
9
Table of Contents
Selectively pursue international opportunities, focusing on Chile and Colombia
We intend to leverage the capabilities and experience we have in Peru, particularly providing engineering and construction services to the mining, oil and gas and infrastructure end-markets, to continue to evaluate and selectively pursue opportunities in other markets. We expect to focus our efforts primarily on Chile and Colombia, which we believe offer attractive opportunities in these end-markets. We intend to evaluate other international opportunities on a case-by-case basis.
Continue fostering our core corporate values throughout the organization
We will continue to instill our core corporate values throughout our organization, while also transmitting these values to surrounding communities. We will continue to attract and develop our human capital through various training, mentorship and reward programs in order to maintain our position as the best company in Peru to learn and work in the engineering and construction field. We also seek to promote social welfare by fostering relationships with the communities that surround our areas of operation. In 2012, the Inter-American Federation of the Construction Industry recognized us for our corporate strategy and promotion of citizenship with the Latin American Social Responsibility award. We strive to promote our corporate values to strengthen our organization and improve our performance as well as to have a positive impact on the markets where we operate.
Our Corporate Structure
The following organizational chart sets forth our principal operating subsidiaries along our four business segments.
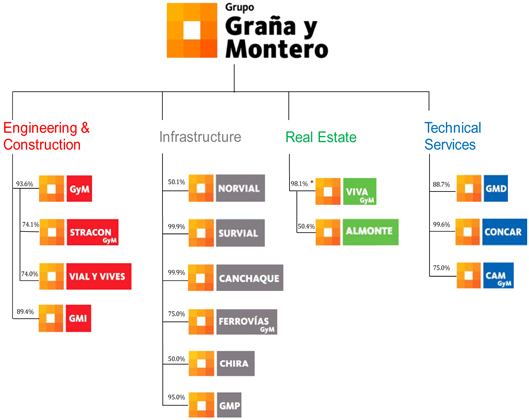
| * | 38.9% of the share capital in Viva GyM is held by our subsidiary GyM. |
10
Table of Contents
Corporate Information
Our principal executive office is located at Avenida Paseo de la República 4667, Lima 34, Peru, and our main telephone number is +511-213-6565. Our website address is www.granaymontero.com.pe. Information contained on, or accessible through, our website is not incorporated in this prospectus, and you should not consider any such information part of this prospectus.
11
Table of Contents
The Offering
The following is a brief summary of the terms of this offering and should be read together with the more detailed information and financial data and statements contained elsewhere in this prospectus. For a more complete description of our ADSs and common shares, see “Description of our Share Capital” and “Description of American Depositary Shares” in this prospectus.
| Issuer | Graña y Montero S.A.A. | |
| Securities Offered | ADSs, representing of our common shares. | |
| Offering Price | We expect the offering price will be between US$ and US$ per ADS. | |
| Option to Purchase Additional ADSs | We are granting the underwriters an option, exercisable within 30 days, to purchase up to an aggregate of additional ADSs, representing common shares, to cover over-allotments of ADSs. | |
| ADSs | Each ADS represents [—] common shares held by [—], as custodian of [—], the depositary. The ADSs will be evidenced by American depositary receipts, or ADRs, issued under a deposit agreement among us, [—] and the holders of the ADSs. | |
| Use of Proceeds | We estimate that the net proceeds from this offering will be approximately US$ million, or approximately US$ million if the underwriters exercise their option to purchase additional ADSs in full. These amounts assume an initial public offering price of US$ per ADS (the midpoint of the price range set forth on the cover page of this prospectus), after deducting the estimated underwriting discounts and commissions and offering expenses. We intend to use the net proceeds from this offering for capital expenditures, including potential acquisitions, investments under potential new infrastructure concessions and other investment opportunities, as well as general corporate purposes. See “Use of Proceeds.” | |
| Lock-up | We, our directors and officers and certain of our other shareholders have agreed not to sell any of our common shares or ADSs for a period of 180 days after the date of this prospectus without the prior approval of Credit Suisse Securities (USA) LLC, J.P. Morgan Securities LLC and Morgan Stanley & Co. LLC.See “Underwriting.” | |
12
Table of Contents
| No Preemptive Rights Offer | Because shareholders representing at least 40% of the subscribed voting shares have agreed to waive their preemptive rights under Peruvian law in connection with this offering and such capital increase does not favor, directly or indirectly, certain shareholders to the detriment of others, there will not be a preemptive rights offer for our common shares. See “Description of our Share Capital—Preemptive and Accretion Rights.” | |
| Shares Outstanding Immediately Prior to and Following the Offering | Immediately prior to the offering, we had 558,284,190 common shares issued and outstanding. After giving effect to the offering, we will have common shares outstanding (assuming no exercise of the option to purchase additional ADSs). | |
| Voting | Subject to Peruvian law and the terms of the deposit agreement, a holder of ADSs will generally have the right to instruct the depositary how to vote the common shares represented by its ADSs. See “Description of our Share Capital” and “Description of American Depositary Shares.” | |
| Dividends | Our dividend policy is to distribute 30% of our net profit obtained from the preceding year. Under Peruvian law, the distribution of dividends requires the approval of our shareholders at our annual shareholders’ meeting. Holders of ADSs will be entitled to receive dividends, if any, paid on the common shares represented by the ADSs. Cash dividends on our common shares will be paid in nuevos soles and will be converted by the depositary into U.S. dollars and paid to the holders of ADSs, net of fees, expenses and any taxes. Under Peruvian law, dividends are subject to a withholding tax of 4.1% if paid to non-Peruvian holders. See “Dividends” and “Description of American Depositary Shares.” | |
| Listing | We have applied to list our ADSs on the New York Stock Exchange under the symbol [GRAM]”. | |
| Risk Factors | See “Risk Factors” and the other information included in this prospectus for a discussion of factors you should consider before deciding to invest in our ADSs. | |
13
Table of Contents
Summary Financial and Operating Data
The following information is only a summary and should be read together with “Presentation of Financial and Other Information,” “Selected Financial Data,” “Management’s Discussion and Analysis of Financial Conditions and Results of Operations” and the consolidated financial statements included in this prospectus.
The following summary financial data as of and for the years ended December 31, 2010, 2011 and 2012 have been derived from our annual audited consolidated financial statements included in this prospectus, which have been prepared in accordance with IFRS issued by the IASB.
| Year ended December 31, | ||||||||||||||||
| 2010 | 2011(1) | 2012 | 2012 | |||||||||||||
| (in millions of S/.) | (in millions of US$)(2) | |||||||||||||||
Income Statement Data: | ||||||||||||||||
Revenues | 2,502.7 | 4,241.3 | 5,231.9 | 2,050.9 | ||||||||||||
Cost of sales | (2,057.8 | ) | (3,609.5 | ) | (4,519.8 | ) | (1,771.8 | ) | ||||||||
|
|
|
|
|
|
|
| |||||||||
Gross profit | 444.8 | 631.7 | 712.1 | 279.1 | ||||||||||||
Administrative expenses | (123.2 | ) | (199.6 | ) | (257.2 | ) | (100.8 | ) | ||||||||
Other income and expenses(3) | 2.7 | 4.3 | 75.9 | 29.8 | ||||||||||||
Profit from sale of investments | 75.0 | 4.8 | — | — | ||||||||||||
Other (losses) gains, net | 0.2 | (2.8 | ) | (0.3 | ) | (0.1 | ) | |||||||||
Gain from business combination(3) | — | 45.2 | — | — | ||||||||||||
|
|
|
|
|
|
|
| |||||||||
Operating profit | 399.5 | 483.6 | 530.6 | 208.0 | ||||||||||||
Financial (expense) income, net | (10.0 | ) | (6.2 | ) | (10.3 | ) | (4.1 | ) | ||||||||
Share of the profit and loss obtained by associates | 11.5 | 0.2 | 0.6 | 0.2 | ||||||||||||
|
|
|
|
|
|
|
| |||||||||
Profit before income tax | 401.0 | 477.6 | 520.8 | 204.2 | ||||||||||||
Income tax | (124.3 | ) | (141.4 | ) | (154.6 | ) | (60.6 | ) | ||||||||
|
|
|
|
|
|
|
| |||||||||
Net profit | 276.7 | 336.2 | 366.3 | 143.6 | ||||||||||||
Net profit attributable to controlling interest(4) | 252.8 | 289.1 | 290.0 | 113.7 | ||||||||||||
Net profit attributable to non-controlling interest(4) | 23.9 | 47.1 | 76.3 | 29.9 | ||||||||||||
| (1) | Includes the results of operations of CAM since February 24, 2011. See “Management’s Discussion and Analysis of Financial Condition and Results of Operations—Factors Affecting Our Results of Operations—Acquisitions” and note 28 to our consolidated financial statements included in this prospectus. |
| (2) | Calculated based on an exchange rate of S/.2.551 to US$1.00 as of December 31, 2012. |
| (3) | In 2011, relates to gains recorded in connection with the CAM business acquisition as a result of the excess of fair value of the assets and liabilities we acquired in the CAM acquisition over the consideration paid and, in 2012, the reversal of provisions of CAM. See “Management’s Discussion and Analysis of Financial Condition and Results of Operations—Factors Affecting Our Results of Operations—Acquisitions” and notes 25 and 28 to our consolidated financial statements included in this prospectus. |
| (4) | We consolidate the results of our subsidiaries in our financial statements and we reflect the profit corresponding to the minority interests in our subsidiaries under “net profit attributable to non-controlling interests” in our income statement. We proportionally consolidate (on a line-by-line basis) the results of our joint operations in our financial statements. We reflect the results of our associated companies under the equity method of accounting in our financial statements under the line item “share of the profit and loss in associates” in our income statement. See “Management’s Discussion and Analysis of Financial Condition and Results of Operations—Results of Operations—General—Accounting for Subsidiaries, Joint Operations and Associated Companies” and note 2.2 to our consolidated financial statements included in this prospectus. |
| As of December 31, | ||||||||||||
| 2011 | 2012 | 2012 | ||||||||||
| (in millions of S/.) | (in millions of US$)(1) | |||||||||||
Balance Sheet Data: | ||||||||||||
Total current assets | 2,502.3 | 3,011.4 | 1,180.5 | |||||||||
Cash and cash equivalents | 658.2 | 780.1 | 305.8 | |||||||||
Accounts receivables | 855.2 | 930.8 | 364.9 | |||||||||
Outstanding work in progress | 393.8 | 525.3 | 205.9 | |||||||||
Inventories(2) | 546.3 | 747.4 | 293.0 | |||||||||
Total non-current assets | 1,191.5 | 1,981.2 | 776.6 | |||||||||
Long-term accounts receivables(3) | 75.2 | 393.4 | 154.2 | |||||||||
Property, plant and equipment | 686.9 | 938.1 | 367.7 | |||||||||
Intangible assets(4) | 317.8 | 505.1 | 198.0 | |||||||||
14
Table of Contents
| As of December 31, | ||||||||||||
| 2011 | 2012 | 2012 | ||||||||||
| (in millions of S/.) | (in millions of US$)(1) | |||||||||||
Total current liabilities | 1,741.4 | 2,618.1 | 1,026.3 | |||||||||
Short-term borrowings | 231.0 | 452.8 | 177.5 | |||||||||
Accounts payables(5) | 1,313.6 | 1,995.2 | 782.1 | |||||||||
Total non-current liabilities | 499.3 | 597.6 | 234.3 | |||||||||
Long-term borrowings | 298.9 | 392.7 | 153.9 | |||||||||
Shareholders’ equity | 1,189.0 | 1,392.2 | 545.8 | |||||||||
Non-controlling interest | 264.1 | 384.7 | 150.8 | |||||||||
| (1) | Calculated based on an exchange rate of S/.2.551 to US$1.00 as of December 31, 2012. |
| (2) | Includes investments for the purchase of land by our Real Estate segment. These investments in land are recorded at book value and are not marked-to-market for changes in fair value. See note 12 to our consolidated financial statements included in this prospectus. |
| (3) | Includes payments required to be made by the Peruvian government for the amounts we invest to purchase trains and other infrastructure for the Lima Metro. See “Management’s Discussion and Analysis of Financial Condition and Results of Operations—Results of Operations—General—Infrastructure” and note 8 to our consolidated financial statements included in this prospectus. |
| (4) | We recognize our investments in the construction of the highway of our Norvial concession as intangible assets. See note 2.15(c) to our consolidated financial statements included in this prospectus. |
| (5) | Includes S/.421.0 million and S/.848.1 million in advance payments made by our clients as of December 31, 2011 and 2012, respectively, in connection with our E&C and Operation and Maintenance of Infrastructure Assets contracts. See “Management’s Discussion and Analysis of Financial Condition and Results of Operations—Results of Operations—General—Engineering and Construction” and “—Technical Services” and note 18 to our consolidated financial statements included in this prospectus. |
| As of and for the year ended December 31, | ||||||||||||||||
| 2010 | 2011(1) | 2012 | 2012 | |||||||||||||
| (in millions of S/., except percentages, ratios and share data) | (in millions of US$, except percentages, ratios and share data)(2) | |||||||||||||||
Other Data: | ||||||||||||||||
EBITDA(3) | 553.9 | 662.0 | 775.7 | 304.1 | ||||||||||||
Gross margin | 17.8 | % | 14.9 | % | 13.6 | % | ||||||||||
EBITDA margin(4) | 22.1 | % | 15.6 | % | 14.8 | % | ||||||||||
Outstanding shares | 558,284 | 558,284 | 558,284 | |||||||||||||
Profit per share (in S/. or US$) | 0.5 | 0.5 | 0.5 | 0.2 | ||||||||||||
Profit attributable to controlling interest per share (in S/. or US$) | 0.45 | 0.52 | 0.52 | 0.20 | ||||||||||||
Dividend per share (in S/. or US$) | 0.05 | 0.10 | 0.16 | 0.06 | ||||||||||||
Net debt/EBITDA ratio | (0.6 | )x | (0.2 | )x | 0.1x | |||||||||||
Backlog(5) | 3,790.4 | 6,583.2 | 10,450.3 | 4,096.5 | ||||||||||||
Backlog/revenues ratio(6) | 1.8x | 1.8x | 2.2x | |||||||||||||
| (1) | Includes the results of operations of CAM since February 24, 2011. See “Management’s Discussion and Analysis of Financial Condition and Results of Operations—Factors Affecting Our Results of Operations—Acquisitions” and note 28 to our consolidated financial statements included in this prospectus. |
| (2) | Calculated based on an exchange rate of S/.2.551 to US$1.00 as of December 31, 2012. |
| (3) | See “Selected Financial Data—Non-GAAP Financial Measure and Reconciliation” for a reconciliation of EBITDA to net profit. |
| (4) | Reflects EBITDA as a percentage of revenues. |
| (5) | Does not include our Real Estate segment and in our Infrastructure segment our Norvial toll road concession or our Energy line of business. See “Business—Backlog.” |
| (6) | Backlog is calculated as of the last day of the applicable year. Revenues are calculated for such year and converted into U.S. dollars based on the exchange rate published by the SBS on December 31 of the corresponding year, which was S/.2.81 to US$1.00 as of December 31, 2010, S/.2.70 as of December 31, 2011 and S/.2.55 as of December 31, 2012. Includes revenues only for businesses included in our backlog. |
15
Table of Contents
The following tables set forth summary financial data for each of our business segments. For more information on the results of operations of our segments, see “Management’s Discussion and Analysis of Financial Condition and Results of Operations— Results of Operations” and note 5 to our consolidated financial statements included in this prospectus.
Engineering and Construction
| As of and for the year ended December 31, | ||||||||||||||||
| 2010 | 2011 | 2012 | 2012 | |||||||||||||
| (in millions of S/.) | (in millions of US$)(1) | |||||||||||||||
Revenues | 1,700.5 | 2,784.2 | 3,524.6 | 1,381.6 | ||||||||||||
EBITDA(2) | 218.3 | 315.0 | 387.9 | 152.1 | ||||||||||||
Net profit | 111.2 | 166.4 | 188.5 | 73.9 | ||||||||||||
Net profit attributable to controlling interest | 104.1 | 153.1 | 165.1 | 64.7 | ||||||||||||
Backlog | 2,989.2 | 4,961.5 | 7,462.7 | 2,925.4 | ||||||||||||
Backlog/revenues ratio(3) | 1.8x | 1.8x | 2.1x | |||||||||||||
Infrastructure
| As of and for the year ended December 31, | ||||||||||||||||
| 2010 | 2011 | 2012 | 2012 | |||||||||||||
| (in millions of S/.) | (in millions of US$)(1) | |||||||||||||||
Revenues | 354.7 | 404.2 | 524.5 | 205.6 | ||||||||||||
EBITDA(2) | 191.1 | 176.1 | 207.5 | 81.4 | ||||||||||||
Net profit | 88.1 | 81.8 | 84.0 | 32.9 | ||||||||||||
Net profit attributable to controlling interest | 73.6 | 68.2 | 66.7 | 26.1 | ||||||||||||
Backlog(4) | 132.7 | 528.3 | 1,089.4 | 427.0 | ||||||||||||
Backlog/revenues ratio(3) | 3.0x | 14.5x | 7.2x | |||||||||||||
Real Estate
| Year ended December 31, | ||||||||||||||||
| 2010 | 2011 | 2012 | 2012 | |||||||||||||
| (in millions of S/.) | (in millions of US$)(1) | |||||||||||||||
Revenues | 218.6 | 152.3 | 240.1 | 94.1 | ||||||||||||
EBITDA(2) | 27.4 | 37.5 | 70.5 | 27.6 | ||||||||||||
Net profit | 17.4 | 24.1 | 45.3 | 17.8 | ||||||||||||
Net profit attributable to controlling interest | 8.5 | 6.1 | 12.4 | 4.9 | ||||||||||||
Technical Services
| As of and for the year ended December 31, | ||||||||||||||||
| 2010 | 2011(5) | 2012 | 2012 | |||||||||||||
| (in millions of S/.) | (in millions of US$)(1) | |||||||||||||||
Revenues | 285.0 | 977.0 | 1,083.3 | 424.7 | ||||||||||||
EBITDA(2) | 53.8 | 121.6 | 111.6 | 43.7 | ||||||||||||
Net profit | 24.7 | 61.1 | 61.5 | 24.1 | ||||||||||||
Net profit attributable to controlling interest | 23.9 | 53.9 | 50.6 | 19.8 | ||||||||||||
Backlog | 750.3 | 1,391.9 | 2,228.9 | 873.7 | ||||||||||||
Backlog/revenues ratio(3) | 2.6x | 1.4x | 2.1x | |||||||||||||
| (1) | Calculated based on an exchange rate of S/.2.551 to US$1.00 as of December 31, 2012. |
| (2) | See “Selected Financial Data—Non-GAAP Financial Measure and Reconciliation” for a reconciliation of EBITDA to profit. |
| (3) | Backlog is calculated as of the last day of the applicable year. Revenues are calculated for such year and converted into U.S. dollars based on the exchange rate published by the SBS on December 31 of the corresponding year, which was S/.2.81 to US$1.00 as of December 31, 2010, S/.2.70 as of December 31, 2011 and S/.2.55 as of December 31, 2012. Includes revenues only for businesses included in our backlog. Our ratio of backlog to revenues for our Infrastructure segment is not representative of |
16
Table of Contents
| what we would expect the ratio to be in future periods because in 2010 and 2011 we did not have revenues for La Chira waste water treatment plant and the Lima Metro and in 2012 we only had pre-operation revenues for La Chira waste water treatment plant and revenues for the Lima Metro based on a limited number of trains during the first year of operation. |
| (4) | Does not include our Norvial toll road concession or our Energy line of business. See “Business—Backlog.” |
| (5) | Includes the results of operations of CAM since February 24, 2011. See “Management’s Discussion and Analysis of Financial Condition and Results of Operations—Factors Affecting Our Results of Operations—Acquisitions” and note 28 to our consolidated financial statements included in this prospectus. |
17
Table of Contents
Risks Related to Our Company
Global economic conditions could adversely affect our financial performance
The global financial crisis and ensuing global recession in 2008 and 2009 had a significant adverse effect on the development of large-scale infrastructure and real estate projects worldwide. The current sovereign crisis in Europe, coupled with the slow economic recovery in the United States, has generated economic uncertainty which could adversely affect private- and public-sector investments. Future global economic conditions, in particular fluctuations in commodity prices and financings costs, may impact our clients’ investment decisions. Should our clients choose to postpone or suspend new investments, or delay or cancel the execution of existing projects, as a result of global economic conditions, demand for our products and services, including our backlog, would decline, which may result in a decline in revenues and in under-utilization of our capacity. In addition, our business may be impacted by adverse economic developments even after economic conditions have improved because of the lag time between when investments decisions are made and the projects are executed. Furthermore, financial difficulties suffered by our clients, joint operation partners, subcontractors or suppliers due to global economic conditions could result in payment delays or defaults, or increase our costs or adversely impact our project execution. Accordingly, a global economic downturn could have a material adverse effect on our financial performance.
We may not be able to continue the historic growth of our business
We have experienced rapid growth in our operations in recent years and our strategy is to continue to grow our operations, including through international expansion. We cannot assure you, however, that we will be able to continue to grow our business at the same pace as in recent years or at all. Our ability to grow our business could be adversely affected by numerous factors, some of which are beyond our control, including, among others, a slowdown in Peru’s recent rapid economic growth and its substantial investment in infrastructure, increased competition, and our capacity to manage growth in our company.
Growth can place significant demands on our management and operating structure, and too rapid growth may overwhelm our operating capacity. In addition, sustained growth will require us to recruit a large number of talented professionals and we cannot assure you that we will be able to hire sufficient engineers or other personnel with the expertise and experience we require. Nor can we assure you that as our company continues to grow we will be able to maintain our performance standards and corporate values across our entire organization. Failure to manage our growth effectively could adversely affect the quality of our products and services, which would have a material adverse effect on our business.
We face significant competition in each of our markets
Each of the markets in which we operate is competitive. We compete on the basis of, among other factors, price, performance, product and service quality, skill and execution capability, client relations, reputation and brand, and health, safety and environmental record. We face significant competition from both local and international players. Some of these competitors may have greater resources than us or specialized expertise in certain sectors. In addition, a portion of our business is derived from open bidding processes which can be highly competitive. Certain of our markets are highly fragmented with a large number of companies competing for market share. Our competitors may be more inclined to take greater or unusual risks or accept terms and conditions in a contract that we might not deem acceptable. Moreover, we cannot assure you that we will not face new competition from industry players entering or expanding their operations in our markets. If we are unable to compete effectively, our ability to continue to grow our business or maintain our market share would be affected. In addition, because one of the factors on which we generally compete is price, increased competition could impact our operating margins. Accordingly, our business and financial performance could be adversely affected by competition in our markets.
A major change in Peruvian government policies could affect our business
Our business is significantly affected by national, regional and municipal government policies and regulation, including with respect to infrastructure concessions or similar contracts to the private sector, public spending in infrastructure investment, and government housing subsidies, among others. Any adverse change in government policies with respect to these matters could result in a material adverse effect on our business and financial performance.
18
Table of Contents
Social conflicts may disrupt infrastructure projects
Despite Peru’s ongoing economic growth and stabilization, high levels of poverty and unemployment and social and political tensions continue to be pervasive problems in the country. Peru has, from time to time, experienced social and political turmoil, including riots, nationwide protests, strikes and street demonstrations. In 2011 and 2012, certain regions experienced strikes and protests related mainly to the environmental impact of mining activities, which resulted in commercial disruptions. These protests led to the suspension of certain mining projects, including the suspension of a large mining project in the northern region of Cajamarca for which we had been contracted to provide construction services. Social conflicts may disrupt, delay or suspend infrastructure projects in the future, which could have a material adverse effect on our business and financial performance.
New projects may require the prior approval of local indigenous communities
In September 2011, Peru enacted Law No. 29,785, regarding the Prior Consultation Right of Local Indigenous Communities, in accordance with the International Labor Organization Convention No. 169 (Ley del Derecho a la Consulta Previa a los Pueblos Indígenas y Originarios, Reconocido en el Convenio 169 de la Organización Internacional del Trabajo). This law establishes a prior consultation procedure (procedimiento de consulta previa) that the Peruvian government must carry out with local indigenous communities whose rights may be directly affected by new legislative or administrative measures, including the granting of certain permits or new concessions or similar contracts such as for mining, energy and oil and gas projects. Local indigenous communities do not have a veto right; upon completion of this prior consultation procedure, the Peruvian government retains the discretion to approve or reject the applicable legislative or administrative measure. We cannot assure you that these consultation procedures will not adversely affect new projects and concessions. Accordingly, our business and financial performance may be materially and adversely affected.
We may not be able to successfully expand outside of Peru
One of our key strategies is to continue to expand our operations outside of Peru, particularly in Chile and Colombia, and we expect that our international operations will become a more significant part of our consolidated business in future. We cannot assure you that we will be able to replicate our success in Peru in other countries. Our international expansion is subject to additional challenges, including: our ability to assimilate cultural differences and practices; our limited familiarity with local laws, regulators and contractors; our ability to attract and manage foreign personnel; the absence of a local workforce formed in our corporate values and familiar with our operations; competition in foreign markets, including from industry players with significantly greater local experience and reputation; and other risks specific to these countries. Many countries in Latin America have suffered significant economic, political and social crises in the past, and these events may occur again in the future. If we are unable to overcome these challenges, we may not be able to successfully expand internationally.
We may not be able to make successful acquisitions
Part of our strategy is to evaluate strategic acquisition opportunities to expand our operations and geographic footprint. We may not be able to identify appropriate acquisition opportunities, or, if we do, we may overpay for these acquisitions or may not otherwise be able to negotiate terms and conditions that are acceptable to us. We may also face difficulties obtaining financing to pay for acquisitions. In addition, we may not be able to obtain regulatory approvals, including antitrust approvals, required to consummate acquisitions. Furthermore, even if we are able to successfully consummate an acquisition, we may encounter challenges in integrating the acquired business effectively and profitably into our operations. The integration of an acquisition involves a number of factors that may affect our operations, including diversion of management’s attention, difficulties in retaining personnel and entry into unfamiliar markets. Acquired businesses may not achieve the levels of productivity anticipated or otherwise perform as expected. Acquisitions may bring us into businesses we have not previously conducted and expose us to additional business risks that are different from those we have traditionally experienced, including new geographic, market, operating and financial risks. Moreover, acquisitions involve special risks, including the potential assumption of unanticipated liabilities and contingencies. Even if such liabilities are assumed by the sellers, we may have difficulties enforcing our rights, contractual or otherwise. We cannot assure you that future acquisitions will meet our strategic objectives.
19
Table of Contents
Our backlog and our ratio of historical backlog to revenues may not be reliable indicators of future revenues or profit
Our backlog amount is subject to revision over time and our ability to realize revenues from our backlog is subject to a number of uncertainties. Cancellations, scope adjustments or deferrals may occur, from time to time, with respect to contracts reflected in our backlog and could reduce the amount of our backlog and the revenue and profits that we actually earn. Contracts may also remain in our backlog for an extended period of time and poor performance could also impact our profit from the contracts in our backlog. In addition, our backlog is expressed in U.S. dollars based on period-end exchange rates while a significant portion of our contracts are payable in nuevo soles or other local currencies. As a result, any depreciation of local currency would diminish the amount of revenues eventually earned relative to backlog. Three contracts in particular comprise 30.3% of our backlog as of December 31, 2012, and the termination of any of these three contracts would significantly reduce our backlog and future revenues and profits. Accordingly, the amount of our backlog is not necessarily indicative of future revenues or profits related to the performance of the related contracts.
The ratio of our historical backlog to revenues earned in subsequent years is volatile and substantially affected by a number of factors, some of which are outside our control, including levels of contract scope adjustments and our ability to enter into new contracts (which are substantially influenced by general economic conditions), delays and cancellations, foreign exchange rate movements, and our capacity to expand the amount of work we carry out beyond that previously contracted. Accordingly, historical correlations between backlog and revenues may not recur in future periods. In particular, we do not believe that the ratio of our E&C segment revenues for 2013 and 2014 to backlog expected to be realized in each of those years will be comparable to our historic ratios shown in “Business—Backlog—E&C Backlog.”
Our success depends on key personnel
Our success depends, to a significant degree, upon the services of our senior management, board of directors and other key personnel (including, among others, our Chairman and our Chief Executive Officer). Members of our management team are not subject to long-term employment agreements or non-competition agreements with us. We cannot assure you that we will be successful in retaining our current senior management or members of our board of directors, nor can we assure you that, in such event, we would be able to find suitable replacements. The loss of the services of some of our senior management or members of our board of directors could have a material adverse effect on our business and financial performance. In addition, the success of our business depends on our ongoing ability to attract, train and retain qualified engineers and other personnel. In recent years, the availability in Peru of qualified personnel who have the necessary expertise and experience has been lower than demand and, therefore, competition for human resources has become intense. We cannot assure that we will be able to hire and retain the number of qualified personnel required to meet the needs of, or to grow, our business. If we are unable to attract, train and retain the qualified personnel that we require at reasonable cost, our business and financial performance could be adversely affected.
Our success depends, to a large extent, on our reputation for the quality, reliability, timely delivery and safety of our products and services
We believe our track record and reputation are key factors in our clients’ evaluation of whether to engage our services and purchase our products, encouraging key industry players to partner with us, and recruiting and retaining talented personnel to our company. Our reputation is based, to a large extent, on the quality, reliability, timeliness and safety of our products and services. If our products do not meet expected standards or we fail to meet our deadlines, our relationship with our clients and partners could suffer, the reputation of our company could be adversely affected, we may not be invited to new bidding processes and our ability to capture new business could be severely diminished.
The nature of our business exposes us to potential liability claims and contract disputes
We may be subject to a variety of legal or administrative proceedings, liability claims or contract disputes. The government, clients and other third parties may present claims against us for injury or damage caused, directly or indirectly, by our operations, for example for alleged failures in our engineering and construction, the operation of our infrastructure concessions (such as our toll roads or the Lima Metro), and real estate developments we sell. Although we have adopted a range of insurance, risk management and risk avoidance programs designed to reduce
20
Table of Contents
potential liabilities, a catastrophic event resulting from the services we have performed or products we have provided could result in significant professional or product liability, warranty or other claims against us as well as reputational harm, especially if public safety is impacted. We may in the future be named as a defendant in legal proceedings where our clients or third parties may make a claim for damages or other remedies with respect to our projects or other matters. Any liability not covered by our insurance, or in excess of our insurance limits, could result in a significant loss for us, which may affect our financial performance.
We are susceptible to operational risks that could affect our business and financial performance
Our business is subject to numerous industry-specific operational risks, including natural disasters, adverse weather conditions, operator error or other accidents, mechanical and technical failures, explosions and other events, many of which are beyond our control. Such occurrences could result in injury or loss of life, severe damage to and destruction of property and equipment, business interruption, pollution and other environmental damage, clean-up responsibilities, regulatory requirements, investigations and penalties, and potential liability claims and contractual disputes. In addition, such occurrences could materially impact our reputation. Although we maintain comprehensive insurance covering our assets and operations at levels that our management believes to be adequate, our insurance coverage will not be sufficient in all circumstances or to protect against all hazards. The occurrence of such an operational risk could have a material adverse effect on our business and financial performance.
Deterioration in our safety record could adversely affect our business and financial performance
Our ability to retain existing clients and attract new business is dependent on our ability to safely operate our business. Existing and potential clients consider the safety record of their services providers to be of high importance in their decision to award service contracts. Some of our activities, in particular in our E&C segment, as well as our electricity networks services line of business, can be high risk by their nature. If one or more accidents were to occur at a site, the affected client may terminate or cancel our contract and may be less likely to continue to use our services. We cannot assure you that we will not experience accidents in the future, causing our safety record to deteriorate. Accidents may be more likely as we continue to grow, particularly if we are required to hire less experienced employees due to shortages of skilled labor. Moreover, often times we do not perform these activities by ourselves and accidents can happen due to errors committed by partners and subcontractors over whom we have no control. Because many of our clients require us to report our safety metrics to them as part of the bidding process and because a substantial part of our client base is comprised of major companies with high safety standards, a general deterioration in our safety record could have a material adverse impact on our business including our ability to bid for new contracts.
Any safety incidents or a deterioration in our safety record could adversely impact our ability to attract and retain qualified employees. In addition, we could also be subject to liability for damages as a result of accidents and could incur penalties or fines for violations of applicable safety laws and regulations.
Increases in the prices of energy, raw materials, equipment or wages could increase our operating costs
Our business requires significant purchases of energy, raw materials and components, , including, among others, large quantities of fuel, cement and steel, as well as purchases or leases of equipment. Certain of these inputs used in our operations are susceptible to significant fluctuations in prices, over which we may have little control. The prices of some of these inputs are affected to a significant extent by the prices of commodities, such as oil, iron and copper. Substantial increases in the prices of such commodities generally result in increases in our suppliers’ operating costs and, consequently, lead to increases in the prices they charge for their products. Moreover, we do not have long-term contracts for the supply of our key inputs, and, as result, if prices increase significantly or if we are required to find alternative suppliers, our costs to procure these inputs may increase significantly. In addition, growing demand for labor, especially when coupled with shortages of qualified employees in the countries where we operate, may result in significant wage inflation. To the extent that we are unable to pass along to our clients increases in the prices of our key inputs or increases in the wages that we must pay, our operating margins could be materially adversely impacted.
We may not be able to obtain financing on favorable terms
Our ability to undertake large investments (particularly in our Infrastructure and Real Estate segments) or consummate significant acquisitions will depend on the availability of equity and debt financing. We cannot assure you that we will be able to obtain new financings in the future on favorable terms or at all. Our ability to obtain
21
Table of Contents
financings will depend in part upon prevailing conditions in credit and capital markets, which are beyond our control. In 2008 and 2009, global markets suffered turmoil, which significantly constrained the availability of new financings. In addition, our ability to obtain new financing, or refinance existing debt, may at certain times be adversely affected by the cyclicality of our business, particularly our E&C segment, as has occurred in the past. Furthermore, in response to the ensuing global economic recession in 2009, many countries, in particular the United States as well as the countries where we operate, have maintained target interest rates at very low levels, and we cannot assure you that these interest rates will not rise significantly in the future, which would impact our costs of funding. If adequate funds are not available, or are not available on favorable terms, we may not be able to make future investments or take advantage of acquisitions or other opportunities.
We may not be able to recover on claims against clients for payment
If a client fails to pay our invoices on time or defaults in making its payments to us, we could incur significant losses. We occasionally bring claims against clients, principally the government, for delayed payments, additional costs that exceed the contract price or for amounts not included in the original contract price, including change orders. These types of claims can occur due to matters such as owner-caused delays or changes from the initial project scope, and, occasionally, they can be the subject of lengthy proceedings. When these types of events occur and unresolved claims are pending, we may invest significant working capital in projects to cover cost overruns pending the resolution of the relevant claims. A failure to promptly recover on these types of claims and change orders could have a material adverse effect on our financial performance.
If we are unable to enter into joint operations, our ability to compete for new business may be adversely affected
We may join with other companies to form joint operations or other strategic alliances to compete for a specific concession or contract, including with partners that contribute expertise in a specific field. Because a joint operation or alliance can often offer stronger combined qualifications than a company on a stand-alone basis, these arrangements can be important to the success of a particular bid. If we are unable to enter into joint operations or other strategic alliances, our ability to compete for new business may be adversely affected.
Our joint operations may be affected by disputes with, or the unsatisfactory performance by, our partners
Joint operations and similar arrangements that we enter into as part of our business, including arrangements where operating control may be shared with unaffiliated third parties, may involve risks not otherwise present when we operate independently, including: sharing approval rights over major decisions; responsibility for our partners’ unpaid obligations or liabilities; and inconsistencies in our and our partners’ economic or business interests or goals. Any disputes between us and our partners may result in delays, litigation or operational impasses. We may also incur liabilities as a result of action taken by our partners. In addition, if we participate in joint operation arrangements where we are not the controlling party, we may have limited control over the joint operation decisions and actions and the success of the joint operation will depend largely on the performance of our partners. These risks could adversely affect our ability to transact the business that is the subject of such joint operation, and could result in the termination of the applicable concession or contract. Under these circumstances, we may be required to make additional investments and provide additional services to ensure adequate performance and delivery. These additional obligations could result in reduced profits or, in some cases, increased liabilities or significant losses for us. In addition, failure by a joint operation partner to comply with applicable laws or regulations could negatively impact our business and, in the case of government contracts, could result in fines, suspension or even debarment from participating in bidding processes. As a result, our business and financial performance could be adversely affected by disputes involving our joint operation arrangements.
We are dependent upon third parties to complete many of our contractual obligations
We rely on third-party suppliers to provide much of the materials and equipment used in our businesses. A portion of the work performed under our infrastructure concessions and, to a lesser extent, other contracts is performed by third-party subcontractors. As a result, the timely completion and quality of our projects may depend on factors beyond our control, including the quality and timeliness of the delivery of materials supplied for use in the project and the technical skills of subcontractors hired for the project. If we are unable to find qualified suppliers or hire qualified subcontractors, our ability to meet our contractual obligations could be impaired. In addition, if the amount we are required to pay for supplies, equipment or subcontractors exceeds what we have estimated, we may suffer losses under our contract. If a supplier or a subcontractor fails to provide supplies, equipment or services as
22
Table of Contents
required under a negotiated arrangement for any reason, or provides supplies, equipment or services that are not of an acceptable quality, we may be required to source those supplies, equipment or services on a delayed basis or at a higher price than anticipated, which could impact our financial performance. In addition, faulty materials or equipment could result in claims against us for failure to meet contractual specifications, and failure by suppliers or subcontractors to comply with applicable laws and regulations could negatively impact our reputation and our business and, in the case of government contracts, could result in fines, suspension or even debarment from participating in bidding processes. These risks may be intensified during economic downturns if these suppliers or subcontractors experience financial difficulties. As a result, our business and financial performance may be adversely affected by our dependence on third party providers.
Debarment from participating in government bidding processes would have a material adverse effect on our business and financial performance
We may face debarment from participating in government bidding processes for one to three years as a result of certain violations to the Peruvian State Contracting Law (Ley de Contrataciones del Estado). We are required to comply with a large number of contractual obligations with the government in our business, and we cannot assure you that we will be in full compliance at all times. Moreover, such a debarment could affect the ability of our entire company (including any of our subsidiaries), and not just the line of business where the alleged violation took place, to participate in government bids under the Peruvian State Contracting Law. In December 2012, Sedapal S.A. (the public utility company responsible for the supervision of the water service in Lima) provided us with notice that they had terminated one of our E&C contracts, alleging that we had breached the terms of the contract by failing to meet agreed-upon deadlines. We believe this termination is invalid because we had previously initiated arbitrations, which are currently ongoing, relating to Sedapal’s denials of our requests for term extensions and because we had previously terminated the contract on the grounds that Sedapal breached its payment obligations to us. Although we believe the likelihood of Sedapal winning this new arbitration is remote, a negative outcome could affect our company’s, including any of our subsidiaries’, participation in government bidding processes. A significant part of our revenues on a consolidated basis is derived from public sector contracts in Peru. As a result, if our company is debarred from participating in government bidding processes, our business and financial performance would be materially and adversely affected.
Failure to comply with, or changes in, laws or regulations could have a material adverse effect on our business and financial performance
We operate in highly regulated industries. Our business and financial performance depends on our and our clients’ ability to comply on a timely and efficient basis with extensive national, regional and municipal laws and regulations relating to, among other matters, environmental, health and safety, building and zoning, labor, tax and other matters. The cost of complying with these laws and regulations can be substantial. In addition, compliance with these laws and regulations can cause scheduling delays. Although we believe we are in compliance with all applicable concessions, other similar contracts, laws and regulations in all material respects, we cannot assure you we have been or will be at all times in full compliance. Failure by us or our clients to comply with our concessions, similar contracts or these laws and regulations could result in a range of adverse consequences for our business, including subjecting us to significant fines, civil liabilities and criminal sanctions, requiring us to comply with costly restorative orders, the shutdown of operations, and revocation of permits and termination of concessions or similar contracts. In addition, we cannot assure you that future changes to existing laws and regulations, or stricter interpretation or enforcement of existing laws and regulations, will not impair our ability to comply with such laws and regulations or increase our compliance costs. Accordingly, existing or future regulation in our markets could have a material adverse effect on our business and financial performance.
We may be held liable for environmental damage caused by our operations
The nature of certain of our operations requires us to assume risks of causing environmental and other damages. We may be held liable for the environmental damage we cause, including the incidental consequences of human exposure to hazardous substances or other environmental damage. We may be subject to clean up costs or penalties in the event of certain discharges into the environment and/or environmental contamination and damage. Our environmental liability insurance may not be sufficient or may not apply to certain types of environmental damage. Any substantial liability for environmental damage could have a material adverse effect on our financial performance.
23
Table of Contents
New environmental regulation as a result of climate change could impact our business and financial performance
Growing concerns about climate change could result in the imposition of additional or more stringent environmental requirements or regulations. For example, there are ongoing international efforts to address greenhouse emissions, such as the Kyoto Protocol, which are in various stages of negotiation and implementation. If more stringent environmental regulation is adopted in the countries where we operate, we may be obliged to incur higher expenditures than anticipated, adversely affecting our financial performance. In addition, future remediation requirements in the event that we are found responsible for environmental damage may be substantial, which could impact our financial condition. Moreover, more stringent environmental regulation could increase the costs of projects for our clients or, in some cases, prevent a project from going forward, thereby potentially reducing the demand for our services. Accordingly, new environmental regulation could have a material adverse effect on our business and financial performance.
We may not be able to effectively protect against financial market risks
Our operations are exposed to financial market risks, such as risks related to exchange rates, commodity prices and, to a lesser extent, interest rates. Fluctuations in currency, commodity prices or interest rates could adversely affect our financial performance. We cannot assure you that derivative financial instruments will protect us from the adverse effects of financial market risks. While hedging transactions are intended to reduce market risks, such transactions may expose us to other risks, such as counterparty risk. We may not be able to adequately protect ourselves against financial market risks and may not ultimately realize an economic benefit from our hedging strategy.
The loss of a key client in some of our lines of business may affect our business and financial performance
In some of our lines of business, such as our Infrastructure and Technical Services segments, a substantial amount of the revenue we receive is concentrated among a limited number of clients, including the Peruvian government. If one or more of these major clients fail or delay in paying our fees, or if there is a significant reduction or cancellation of business by one or more of these major clients, our business and financial performance may be adversely affected. In particular we cannot assure you that Enersis, from whom we acquired our electricity networks services line of business in 2011, will not reduce its use of our services. If we are not able to capture new clients to replace the loss of business from existing key clients, our financial performance may be adversely affected.
Our use of the percentage-of-completion method of accounting for our Engineering and Construction segment could result in a reduction of previously recorded profits
In accordance with IFRS, we measure and recognize a large portion of our revenues under the percentage-of-completion accounting methodology. This methodology allows us to recognize revenues ratably over the life of a contract, without regard to the timing of receipt of cash payments, by comparing the amount of the costs incurred to date against the total amount of costs expected to be incurred. The effect of revisions to estimated costs, and thus revenues, is recorded when the amounts are known and can be reasonably estimated. These revisions can occur at any time and could be material. On a historical basis, we believe that we have made reasonably reliable estimates of the progress towards completion on our long-term contracts. However, given the uncertainties associated with these types of contracts and inherent in the nature of some of the industries in which we operate, it is possible for actual costs to vary from estimates previously made, which may result in reductions or reversals of previously recorded profits.
Labor unrest could adversely affect our financial performance
All of our manual laborers and a portion of our employees are members of labor unions. Our practice is generally to extend benefits we offer our unionized employees to non-unionized employees. In our E&C segment, collective bargaining agreements are negotiated at two levels, on an annual basis between the Peruvian National Federation of Civil Construction and the Peruvian Chamber of Construction, without our direct involvement, and on a per project basis directly between the unions and us in accordance with such annual agreement. We also have collective agreements with our employees in certain of our business segments, which are also negotiated periodically. Although we consider that our relationship with unions are currently positive, we cannot assure you that we will not experience work slowdowns, work stoppages, strikes or other labor disputes in the future, which could result in the interruption or delay of our operations. Such interruptions or delays could have an adverse impact on our business, including on the cost of our projects and our ability to make timely delivery. Moreover, our operations may also be affected by labor unrest in our clients’ or our partners’ workforce.
24
Table of Contents
The proceeds from our insurance policies may not be sufficient and we may not be insured against all risks
We maintain insurance coverage both as a corporate risk management strategy and in order to satisfy the requirements under certain regulations and contracts. We cannot assure you that proceeds from our insurance policies, however, will be sufficient to cover the damages resulting from any event covered by such policies. Certain risks are not covered under the terms of our insurance policies, such as interruption of operations. In such event, we may incur significant expenses to rebuild our facilities, repair or replace our equipment, or cover other damages. In addition, if any of our third party insurers fail, abruptly cancel our coverage or otherwise cannot satisfy their insurance requirements to us, then our overall risk exposure and operational expenses could be increased. Moreover, we may not be able to renew our insurance policies on favorable terms, or at all. Although we have in the past been generally able to cover our insurance needs, we cannot assure you that we will be able to secure all necessary insurance in the future.
An increase in import duties and controls may have a material adverse effect on our financial performance
Our future success depends in part on our ability to select and purchase quality mechanical instruments and equipment at attractive prices. While we have historically been able to do so, such instruments and equipment may become subject to higher import taxes than currently apply. In addition, the Peruvian antitrust authority (Instituto Nacional de Defensa de la Competencia y de la Protección de la Propriedad Intelectual, or “INDECOPI”) is currently conducting an investigation regarding potential dumping of Chinese imports, which may result in new anti-dumping laws. We cannot assure you that there will not be further increases in import taxes, changes in laws related to imports or the imposition of quotas by countries from which we import mechanical instruments and equipment, which could have a material adverse effect on our business.
Additional Risks Related to our Engineering and Construction Business
We are vulnerable to the cyclical nature of the end-markets we serve
Demand for our engineering and construction services is dependent on conditions in the end-markets we serve, which include, among others, the mining, power, oil and gas, transportation, real estate and other infrastructure sectors in Peru, as well as the mining sector in Chile. Consequently, our engineering and construction business is closely linked to the performance and growth of these sectors, and it is exposed to many of the risks faced by our clients operating in these sectors, over which we have no control. These industries tend to be cyclical in nature and, as a result, although downturns can impact our entire company, our engineering and construction business has historically been subject to periods of very high and low demand. For example, between 2000 and 2003, there was a significant decline in activity in the Peruvian real estate and construction sectors, which consequently affected our and our competitors’ business and financial performance during that time. Factors that can affect these sectors include, among others, macroeconomic conditions, climate conditions, the level of private and public investment, the availability of credit, changes in laws and regulations, and political and social stability. The mining and oil and gas sectors, in particular, are also driven by worldwide demand for the underlying commodities, including, among others, silver, gold, copper, oil and gas, which can be affected by such other factors as global economic conditions and geopolitical affairs. A decline in prices for minerals or oil and gas can have a significant impact on our clients’ exploration and production activities and, as a result, on their demand for our engineering and construction services. Accordingly, adverse developments in the end-markets served by our engineering and construction business could have a material adverse effect on our financial performance.
Decreases in capital investments by our clients may adversely affect the demand for our services
Our engineering and construction business is directly affected by changes in private-sector and, to a lesser extent, public-sector investments for large-scale infrastructure projects. In addition, our engineering and construction business is directly affected by the availability and cost of financings for these projects. In the markets where we operate, investments and financings for large-scale projects have historically been influenced by macroeconomic and other factors which are beyond our control, including in the case of public-sector investment, government spending levels. As a result, we cannot assure you that clients will not choose to limit or not undertake new projects or delay, suspend or cancel existing projects. Reductions in anticipated capital investments or available financing for large-scale projects could have a material adverse effect on our financial performance.
25
Table of Contents
Our revenues may fluctuate based on project cycles, which we may not control
The substantial majority of the revenues from our engineering and construction business is generated from project awards, the timing of which may be unpredictable and outside of our control, especially considering the highly competitive bidding processes and complex and lengthy negotiations they involve. These processes can be impacted by a wide variety of outside factors including governmental approvals, financing contingencies and overall market and economic conditions. Moreover, because a significant portion of our revenues is generated from large-scale projects, our results of operations can fluctuate quarterly or yearly depending on whether and when project awards occur and the commencement and progress of work under awarded contracts. As a result, we are subject to the risk that revenues may not be derived from awarded projects as quickly as anticipated.
Our business may be adversely affected if we incorrectly estimate the costs of our projects
We conduct our engineering and construction business under various types of contractual arrangements where costs are estimated in advance. In some of our contracts (i.e., lump-sum, unit price and EPC) we bear the risk of some or all unanticipated cost overruns, including due to inflation or certain unforeseen events. Risks under contracts which could result in cost overruns include: difficulties in performance of our subcontractors, suppliers, or other third parties; changes in laws and regulations or difficulties in obtaining permits or other approvals; unanticipated technical problems; unforeseen increases in the cost of inputs, components, equipment, labor, or the inability to obtain these on a timely basis; delays caused by weather conditions; incorrect assumptions related to productivity or scheduling estimates; and project modifications that create unanticipated costs or delays. These risks tend to be exacerbated for longer term contracts since there is increased risk that the circumstances under which we based our original bid could change. In many of our contracts, we may not be able to obtain compensation for additional work performed or expenses incurred. Our failure to estimate accurately the resources and time required to complete a project could adversely affect our profitability. Even under our cost-plus contracts, our inability to complete projects within the estimated budget could affect our relationship with our clients and negatively impact awards of future contracts. As a result, if we incorrectly estimate the costs of our projects, our business and financial performance could be adversely affected.
We may be unable to deliver our services in a timely manner
The success of our engineering and construction business depends on our ability to meet the standards and schedules required by our clients. Significant delays that prevent us from providing our services on agreed time frames could adversely affect our client relations and reputation. Delays may occur for a number of reasons, including as a result of our inability to adequately foresee the needs of our clients; delays caused by our joint operation partners, subcontractors or suppliers; insufficient production capacity; equipment failure; shortage of qualified workers; changes to customs regulations; and natural disasters. Failure to finish construction by the contractual completion date set forth in the contract could result in costs that reduce our projected profit margins, including a requirement to pay daily penalties and damages. If we are unable to meet deadlines, either due to internal problems or as a result of events over which we have no control, we may lose the trust of our clients and, therefore, experience a decrease in the demand for our services. In such event, our business and financial performance could be adversely affected.
We may not be able to obtain compensation for additional work or expenses incurred as a result of client-requested change orders
Clients often determine, after commencement of the project, to change various elements of the project. Some of our contracts may also require that clients provide us with design or engineering information or with equipment or materials to be used on the project, and, in some cases, the client may provide us with deficient design or engineering information or equipment or materials or may provide the information or equipment or materials to us later than required by the project schedule. Our project contracts generally require the client to compensate us for additional work or expenses incurred due to client requested change orders or failure of the client to provide us with specified design or engineering information or equipment or materials. Under these circumstances, we generally negotiate with the client with respect to the amount of additional time required to make these changes and the compensation to be paid to us. We are subject to the risk that we are unable to obtain, through negotiation, arbitration, litigation or
26
Table of Contents
otherwise, adequate amounts to compensate us for the additional work or expenses incurred by us due to client-requested change orders or failure by the client to timely provide required items. A failure to obtain adequate compensation for these matters could require us to record an adjustment to amounts of revenue and gross profit that were recognized in prior periods. Any such adjustments, if substantial, could have a material adverse effect on our financial performance.
We may have difficulty obtaining performance bonds that we require in the normal course of our operations
In our engineering and construction business, it is industry practice for customers to require performance bonds or other forms of credit enhancement to secure, among other things, bids, advance payments and performance. We cannot assure you that in the future we will not encounter difficulties in obtaining such performance bonds or credit enhancements. The Peruvian market for these types of credit instruments is small; moreover, under Peruvian banking regulations, lenders are required to impose limits on the amount of credit they extend to a group of affiliated companies. Failure to provide performance bonds or credit enhancements on terms required by clients may result in our inability to compete for or win new projects.
Additional Risks Related to our Infrastructure Business
A substantial or extended decline in oil prices may adversely affect our financial performance
A substantial part of the revenues of our infrastructure business depends upon prevailing prices for oil. Historically, oil prices and markets have been volatile and are likely to continue to be volatile in the future. Oil is a commodity and its price is subject to wide fluctuations in response to relatively minor changes in supply and demand for oil market uncertainty, and a variety of additional factors beyond our control. Those factors include, among others: global demand and supply; political developments in producing regions; weather conditions; governmental regulations; international conflicts and acts of terrorism; the price and availability of alternative sources of energy; and overall local and global economic conditions. Moreover, lower oil prices may not only decrease our revenues on a per unit basis, but may also reduce the amount of oil we can produce economically, if any, and, as such, may have a negative impact on our reserves. As result, our financial performance could be materially and adversely affected by declines in oil prices.
Our reserve estimates depend on many assumptions that may turn out to be inaccurate
The process of estimating oil and gas reserves is complex. In order to prepare our reserve estimates, our engineers must project production rates and timing of development expenditures as well as analyze available geological, geophysical, production and engineering data, and the extent, quality and reliability of this data can vary. The process also requires economic assumptions about matters such as oil prices, drilling and operating expenses, capital expenditures, taxes, and availability of funds. Therefore, estimates of oil are inherently imprecise. Actual future production, oil prices, revenues, taxes, development expenditures, operating expenses and quantities of recoverable oil reserves will most likely vary from our estimates, and those variances may be material. Any significant variance could materially affect our estimated reserves.
Our return on our investment in our concessions may not meet estimated returns
Our return on any investment in a concession is based on the terms and conditions of the concession, its duration and the amount of capital invested as well as the amount of revenues collected, debt service costs, payment of penalties and other factors. For example, traffic volume at toll roads may be affected by a number of factors beyond our control, including security conditions; general economic conditions; demographic changes; fuel prices; reduction in commercial or industrial activities in the regions served by the roads; and natural disasters. Decreased traffic at Norvial could adversely affect our financial performance. Although some of our concessions allow for adjustments based on economic conditions, certain concessions provide that adjustment requests be approved only if certain limited events specified in our concession contracts have occurred. If a request of adjustment is not granted, our financial performance could be affected. Given these factors and the possibility that governmental authorities could implement policies that affect our contractual return on investment in a way that we did not anticipate, we cannot assure you that our return on any investment under any concession will meet our estimates.
27
Table of Contents
Governmental entities may terminate prematurely our concessions and similar contracts under various circumstances, some of which are beyond our control
Our ability to continue operating our concessions and similar public-sector contracts depends on governmental authorities, which may revoke the agreement for certain reasons set forth in the relevant documentation contract and in applicable legislation, including the failure to comply with any contractual terms (including the concessionaire’s default on debt) or applicable law. Moreover, the relevant governmental authority may terminate and/or repossess a concession at any time, if, in accordance with applicable law, it determines that it is in the public interest to do so. The relevant governmental authority may also assume the operation of a concession in certain emergency situations, such as war, public disturbance or threat to national security. In addition, in the case of force majeure, the relevant governmental authority may require us to implement certain changes to our operations. If the government terminates any of our concessions, under Peruvian law it is generally required to compensate us for the amount of our unrecovered investment, unless the concession is revoked pursuant to applicable law or the terms of the concession which would imply a serious breach of the concession’s terms by us. Such compensation process is likely to be time consuming and the amount paid to us may not fully compensate us. We cannot assure you that we would receive such compensation on a timely basis or in an amount equivalent to the value of our investment in a concession plus lost profits.
We are exposed to risks related to the operation and maintenance of our concessions and similar contracts
The operation and maintenance requirements under our concessions could encounter delays or cause us to exceed our budgeted costs for such projects, which could limit our ability to realize the expected return on these projects, increase our operating or capital expenses and adversely affect our business and financial performance. In addition, our operations may be adversely affected by interruptions or failures in the technology and infrastructure systems that we use to support our operations, including toll road collection and traffic measurement systems. The Lima Metro in particular may be susceptible to outages due to power loss, telecommunications failures and similar events. The failure of any of our technology systems may cause disruptions in our operations, adversely affecting our profitability. While we have business continuity plans in place to reduce the adverse impact of information technology system failures on our operations, we cannot assure you that these plans will be effective. Furthermore, accidents and natural disasters may also disrupt the construction, operation or maintenance of our projects and concessions, which could adversely affect our business and financial performance.
We may not be successful in obtaining new concessions
The market for infrastructure concessions in Peru is competitive. We compete with Peruvian and foreign companies for infrastructure concessions in Peru, some of whom may have greater financial and other resources or particular expertise pertinent to a specific concession. Moreover, our public-sector clients may face budget deficits that may prohibit the development of infrastructure concessions, which could affect our business. We may also not be able to obtain additional concessions if the government decides not to award new concessions, due to budget constraints or policy changes or because alternative financing mechanisms are used. Our inability to bid for or obtain new concessions may adversely affect our business and financial performance.
We cannot assure you whether or when we will undertake any of the projects that have been awarded to joint operations in which our company participates but for which contract negotiations are ongoing, namely the concessions for the Via Expresa Javier Prado or Via Expresa Sur. We may not be able to negotiate contracts terms that are favorable to us or at all. In addition, these projects may suffer long delays or suspension as a result of political considerations or other factors.
Additional Risks Related to our Real Estate Business
We are exposed to risks associated with the development of real estate
Our real estate business is subject to the risks that generally affect the real estate industry, such as availability and prices of suitable land, environmental and zoning regulations, interruptions in supply and volatility of the prices of construction materials and equipment, and changes in the demand for real estate. Our real estate business is specifically affected by the following risks: macroeconomic conditions in Peru that may impact the growth of the real estate sector as a whole, particularly in the residential market, including an increase in unemployment or a decrease in wage levels; an increase in prevailing interest rates or lack of available credit; changes in government subsidies for
28
Table of Contents
affordable housing; unfavorable real estate market conditions, such as an oversupply of residential units or scarcity of suitable land in particular areas; the level of customer interest in our new projects or the sales price per unit necessary to sell the unit may be lower than expected; customer perception of the security, convenience and attractiveness of our projects and the areas in which they are located; cost overruns, many of which may be beyond our control, that exceed our estimates and affect our profit margins, including the price of labor, land, insurance, taxes and public charges; the construction and sale of units may not be completed on schedule; bankruptcy or significant financial difficulties of large industry players, which cause a loss of confidence in the industry; and restrictions on real estate development imposed by local, regional and national laws and regulations. The occurrence of any of the above events may have a material adverse effect on our business and financial performance.
Real estate prices may not continue to rise and may decline
Real estate prices in Peru have risen significantly over the last decade. We cannot assure you that this increase in real estate prices does not represent a bubble. Real estate prices in Peru may not continue to rise or may decline significantly, particularly if financing costs rise or consumer confidence in the real estate market erodes. If real estate prices decline significantly, our business and financial performance could be materially and adversely affected.
Our business may be adversely affected if we are not able to obtain the necessary licenses and/or authorizations for our developments in due time
Real estate development requires obtaining certain licenses, authorizations and registrations. In Peru, local authorities are responsible for issuing most of the licenses that are required during the development stage, including zoning, demolition and construction licenses, among others. Currently, we have approximately 21 real estate projects in various stages of development. We have not yet initiated the administrative processes before the appropriate authorities, or such procedures are pending approval, for 9 of these developments, including our Cuartel San Martín multi-use development project, as they are still in the early stages of development. A denial or an extended delay by applicable administrative authorities may render land unsuitable for development or delay the completion of planned projects, increase our costs and adversely affect our business and financial performance.
Scarcity of financing and/or an increase in interest rates could decrease the demand for real estate properties
The scarcity of financing and/or an increase in interest rates may adversely affect the ability or willingness of prospective buyers to purchase our real estate properties. In most cases, the purchasers of our residential or commercial properties finance at least part of the purchase price with mortgage loans. In 2012, 53% of our residential units was sold to purchasers who received government subsidies to finance the purchase homes. An increase in interest rates, whether as a result of market conditions or government action or otherwise, may cause a decrease in the demand for our residential and commercial properties and for land development, as well as an increase of our own financing costs, which may adversely affect our business and financial performance.
We may experience difficulties in finding desirable land and increases in the price of land may increase our cost of sales and decrease our earnings
The continued growth of our real estate business depends in large part on our ability to continue to acquire land and to do so at a reasonable cost. As more developers enter or expand their operations in the Peruvian real estate sector, land prices could rise significantly and suitable land could become scarce due to increased demand or decreased supply. A resulting rise in land prices may increase our cost of sales and decrease our earnings. We may not be able to acquire suitable land at reasonable prices in the future, which may have a negative impact on our financial performance.
Changing market conditions may adversely affect our ability to sell home inventories in our land and at expected prices
There is a lag between the time we acquire land and the time that we can bring the developed properties to market. Lag time varies on a project-by-project basis. As a result, we face the risk that demand for real estate may decline or that other developments may occur during this period that affect market conditions, and that we will not be able to dispose of developed properties or undeveloped land at expected prices or profit margins or within anticipated time frames or at all. Significant expenditures associated with investments in real estate, such as maintenance costs, construction costs and debt payments, cannot generally be reduced if changes in market conditions cause a decrease
29
Table of Contents
in expected revenues from our properties. Moreover, the market value of home inventories and undeveloped land can fluctuate significantly because of changing market conditions. As a result of these and other factors beyond our control, we may be forced to sell properties or land at a loss or for prices that generate lower profit margins than we anticipate.
Additional Risks Related to our Technical Services Business
Our engagements with clients may not be profitable or may be terminated or not renewed
The pricing and other terms of many of our client contracts in our technical services business necessarily require us to make estimates and assumptions at the time we enter into these contracts that could differ from actual results. These estimates reflect our best judgments regarding the nature of the engagement and our expected costs to provide the contracted services. Because of the competitive nature of the markets in which we operate, particularly in IT services, the risks related to errors in these estimates are heightened. Any increased or unexpected costs of unanticipated delays or complications in connection with the performance of these engagements, including delays caused by factors outside our control, could make these contracts less profitable or not profitable, which would have an adverse effect on our profit margin. Our exposure to this risk increases generally in proportion to the scope of services provided under a contract.
In addition, the success of our technical services business is dependent on our ability to retain our clients. In our electricity networks services line of business in particular, Enersis, from whom we acquired control of the business in 2011 remains a key client; however, we cannot assure you that they will continue to use our services in the future. Also, in our IT services business in particular, we may lose clients due to their conversion to in-house service providers. We are also vulnerable to reduced volumes from our clients due to business downturns or for other reasons, which can reduce the scope and price of services we provide. A contract termination by a major client could cause us to experience a higher than expected number of unassigned employees, which would affect our profitability until we are able to reduce or reallocate our personnel. We may not be able to replace any client that elects to terminate or not renew its contract with us, and the termination or non-renewal of a significant number of our agreements, or of our most important contracts, may adversely affect our business and financial performance. In addition, non-compliance on a contract with a public-sector client may lead to debarment from participating in government bidding processes and, consequently, inability to contract with other public-sector clients, not just for the line of business where the alleged violation took place, but also for all of our other businesses.
We may not be successful in obtaining new government contracts
We compete to provide services to the Peruvian government, and some of our competitors may have greater financial and other resources or particular expertise pertinent to a specific contract. In addition, we may not be able to obtain additional government service contracts if the government decides not to award additional public-sector road contracts or, to a lesser extent, contracts for the provision of IT and electrical networks services, due to budget constraints, policy changes or otherwise. Our inability to obtain new government contracts may adversely affect our business and financial performance.
We face risks related to the delivery of products and services by our suppliers
In the course of our IT services and electricity networks services, we depend on technology providers that may commit errors or omissions related to the delivery or the quality of equipment, services or products that are essential to our business. A significant error or failure to deliver such equipment, products or services made by one of our suppliers, particularly in our IT services business where we may have an exclusive arrangement with a specific supplier for a client, may adversely affect our business and financial performance.
Our IT security measures may be breached or compromised and we may sustain system outages
We rely on encryption, authentication technology and firewalls to provide security for confidential information, including personal data, transmitted to and by us over the internet. A breach of our network security measures could result in the misappropriation of proprietary or personal information or cause interruptions in our IT services or operations, could damage our reputation and harm our ability to deliver services to our clients. This may result in client dissatisfaction and a loss of business. Our security measures may be inadequate to prevent security breaches, and we may be required to expand significant capital and other resources to protect against the threat of security breaches and to alleviate problems caused by breaches as well as by any unplanned unavailability of our IT systems caused by other reasons, which may adversely affect our business and financial performance.
30
Table of Contents
Our services may infringe upon the intellectual property rights of others
Our IT services, or third-party products we offer our clients, may infringe the intellectual property rights of third parties, and we may have infringement claims asserted against us. These claims may harm our reputation, increase our costs and prevent us from offering certain services or products. Any claims or litigation relating to intellectual property, even if ultimately decided in our favor, could be time-consuming and costly, injure our reputation or require us to enter into royalty or licensing arrangements. Any limitation on our ability to provide a service or product could result in our loss of revenue-generating opportunities and require us to incur additional expenses to develop new or modified solutions for future projects, which may adversely affect our business and financial performance.
Risks Relating to Peru
Economic, social and political developments in Peru could adversely affect our business and financial performance
The substantial majority of our operations are conducted in Peru and depend on economic and political developments in the country. As a result, our business may be materially and adversely affected by economic downturns, currency depreciation, inflation, interest rate fluctuation, government policies, regulation, taxation, social instability, political unrest, terrorism and other developments in or affecting the country, over which we have no control. In the past, Peru has experienced periods of severe economic recession, large currency devaluation and high inflation. We cannot assure you that Peru will not experience similar adverse economic developments in the future. In addition, Peru has experienced periods of political instability that has included a succession of regimes with differing economic policies and programs. Previous governments have imposed controls on prices, exchange rates, local and foreign investments and international trade, restricted the ability of companies to dismiss employees, expropriated private-sector assets and prohibited the remittance of profits to foreign investors. We cannot assure you that the Peruvian government will continue to pursue business-friendly and open-market policies that stimulate economic growth and social stability.
Fluctuations in the value of the nuevo sol could adversely affect financial performance
Fluctuations in the value of the nuevo sol relative to the U.S. dollar could adversely affect Peru’s economy. In addition, appreciation of the nuevo sol or depreciation of the U.S. dollar could increase, in terms of nuevos soles, our production costs. In 2012, 36.1% and 51.7% of our revenues were denominated in nuevos soles and U.S. dollars, respectively, whereas 55.3% and 31.2% of our costs of sales were denominated in nuevos soles and U.S. dollars, respectively. In the past the exchange rate between the nuevo sol and the U.S. dollar has fluctuated significantly. We cannot assure you that the value of nuevo sol against other currencies will not fluctuate significantly in the future, which could adversely affect the Peruvian economy and our business, financial condition and results of operations.
In addition, although Peruvian law currently imposes no restrictions on the ability to convert nuevos soles to foreign currency and transfer foreign currency outside of the country, in the 1980s and early 1990s, Peru imposed exchange controls, including controls affecting the remittance of dividends to foreign investors. We cannot assure you that exchange controls in Peru will not be implemented in the future. The imposition of exchange controls could have an adverse effect on the economy and on your ability to receive dividends from us as a holder of ADSs.
Inflation could adversely affect our financial performance
In the past, Peru has suffered through periods of hyperinflation, which have materially undermined the Peruvian economy and the government’s ability to create conditions that support economic growth. A return to a high inflation environment would also undermine Peru’s foreign competitiveness, with negative effects on the level of economic activity and employment.
As a result of reforms initiated in the 1990s, Peruvian inflation decreased significantly from four-digit inflation during the 1980s. The Peruvian economy experienced annual inflation of 2.1% in 2010, 4.7% in 2011 and 2.6% in 2012, as measured by the Peruvian Consumer Price Index (Índice de Precios al Consumidor del Perú).
31
Table of Contents
If Peru experiences substantial inflation in the future, our costs of sales and administrative expenses could increase which could affect our operating margins. Inflationary pressures may lead to governmental intervention in the economy, including the introduction of government policies that may adversely affect the overall performance of the Peruvian economy. For example, in response to increased inflation, the Peruvian Central Bank, which sets the Peruvian basic interest rate, may increase or decrease the basic interest rate in an attempt to control inflation or foster economic growth.
Changes in tax laws may increase our tax burden and, as a result, negatively affect our financial performance
The Peruvian congress and government regularly implement changes to tax laws that may increase our tax burden. These changes may include modifications in our tax rates and, on occasions, the enactment of temporary taxes that in some cases have become permanent taxes. Tax reforms related to the Peruvian income tax, value added tax and tax code have recently been approved, but we are unable to estimate the impacts that these reforms may have on business. The effects of any tax reforms that could be proposed in the future and any other changes that result from the enactment of additional reforms have not been, and cannot be, quantified. However, any changes to our tax regime may result in increases in our overall costs and/or our overall compliance costs, which could negatively affect our financial performance.
Earthquakes, severe weather and other natural disasters could adversely affect our business and financial performance
Peru is located in an area that experiences seismic activity and occasionally is affected by earthquakes. For example, in 2007, an earthquake with a magnitude of 7.9 on the Richter scale struck the central coast of Peru, severally damaging the region south of Lima. Such conditions may result in physical damage to our properties and equipment, closure of one or more of our project sites and infrastructure concessions, inadequate work forces in our markets and temporary disruptions in the supply of construction materials. In addition, Peru has also experienced adverse climate conditions (due to climate change or otherwise) and adverse weather patterns, such as El Niño, an oceanic and atmospheric phenomenon that causes a warming of temperatures in the Pacific Ocean, resulting in heavy rains off the coast of Peru and potentially flooding. Poor weather conditions can have significant adverse effects on our engineering and construction activities as well as on our operation and maintenance of infrastructure assets business. Any of these factors may materially adversely affect the Peruvian economy and our business and financial performance.
A resurgence of terrorism in Peru could adversely affect the Peruvian economy and, as a result, our business and results of operations
In the past, Peru experienced severe terrorist activity that reached its peak of violence against the government and private sector in the late 1980s and early 1990s. In the mid-1990s, terrorist groups suffered significant defeats, including the arrest of leaders, resulting in considerable limitations in their activities. Despite the suppression of terrorist activity, we cannot assure you that a resurgence of terrorism in Peru will not occur, or that if there is such a resurgence, it will not disrupt the economy of Peru and our business.
The Peruvian economy could be affected by adverse economic developments in regional or global markets
Financial and securities markets in Peru are influenced, to varying degrees, by economic and market conditions in regional or global markets. Although economic conditions vary from country to country, investors’ perceptions of events occurring in one country may adversely affect cash flows and securities from issuers in other countries, including Peru. For example, the Peruvian economy was adversely affected by the political and economic events that occurred in several emerging economies in the 1990s, including in Mexico in 1994, the Asian crisis in 1997, the economic crisis in Russia in 1998, the Brazilian currency devaluation in 1999 and the Argentine crisis in 2001, which affected the market value of securities issued by companies from markets throughout Latin America. In addition, Peru’s economy continues to be affected by events in the economies of its major regional partners and in developed economies that are trading partners or that affect the global economy. The 2008-2009 global economic recession, principally driven by the subprime mortgage market in the United States, substantially affected the international financial system, including Peru’s securities market and economy. Additionally, the current sovereign crisis in Europe, coupled with the slow economic recovery in the United States, may reduce the confidence of foreign investors, which may cause volatility in the securities markets and affect the ability of companies to obtain financing globally. Any interruption to the recovery of the developed economies, the continued effects of the recent global crisis, a worsening of the current crisis in Europe or a new economic or financial crisis could affect Peru’s economy, and, consequently, materially adversely affect our business and financial performance.
32
Table of Contents
Risks relating to Chile, Colombia and other Latin American Countries
We face risks relating to our operations outside of Peru
Latin American economic, political and social conditions may adversely affect our business. Our financial performance may be significantly affected not only by general economic, political and social conditions in Peru but also in other markets where we operate or intend to operate, including Chile and Colombia.
These countries have suffered significant economic, political and social crises in the past, and these events may occur again in the future. We cannot predict whether changes in current administrations will result in changes in governmental policy and whether such changes will affect our business. Instability in the region has been caused by many different factors, including: significant governmental influence over local economies; substantial fluctuations in economic growth; high levels of inflation; changes in currency values; exchange controls or restrictions on expatriation of earnings; high domestic interest rates; wage and price controls; changes in governmental economic or tax policies, including retroactive changes; imposition of trade barriers, including import duties on information technology equipment; electricity rationing; liquidity of domestic capital and lending markets; unexpected changes in regulation; expropriations; and high levels of organized crime, terrorism and social conflicts, as well as overall political, social and economic instability.
Risks Relating to the Offering and our ADSs
The market price of our ADSs may fluctuate significantly, and you could lose all or part of your investment
Volatility in the market price of our ADSs may prevent you from being able to sell your ADSs at or above the price you paid for them. The market price and liquidity of the market for our ADSs may be significantly affected by numerous factors, some of which are beyond our control and may not be directly related to our operating performance. These factors include, among others: actual or anticipated changes in our results of operations, or failure to meet expectations of financial market analysts and investors; investor perceptions of our prospects or our industries; operating performance of companies comparable to us and increased competition in our industries; new laws or regulations or new interpretations of laws and regulations applicable to our business; general economic trends in Peru; catastrophic events, such as earthquakes and other natural disasters; and developments and perceptions of risks in Peru and in other countries.
You may not be able to sell ADSs you own or the common shares underlying the ADSs at the time or the price you desire because an active or liquid market for these securities may not develop
Prior to this offering, there has not been a public market for our ADSs. We have applied to list our ADSs on the New York Stock Exchange. We cannot predict whether an active liquid public trading market for our ADSs will develop or be sustained. Active, liquid trading markets generally result in lower price volatility and respond more efficiently to orders from investors to purchase or sell securities. Liquidity of a securities’ market is often a function of the volume of the underlying shares that are publicly-held by unrelated parties. Our common shares are listed on the Lima Stock Exchange. Although ADS holders are entitled to withdraw common shares underlying our ADSs from the depositary at any time, the Lima Stock Exchange in Peru is generally a less liquid trading market than the New York Stock Exchange.
Substantial sales of ADSs or common shares after this offering could cause the price of our ADSs or common shares to decrease
Significant shareholders will continue to hold a large number of our common shares after this offering. We, our directors and officers and certain of our other shareholders, will agree with the representatives of the underwriters not to offer, sell, contract to sell or otherwise dispose of or hedge any common shares or ADSs, without the prior written consent of the representatives of the underwriters, during the 180 calendar day period following the date of the prospectus, subject to certain exceptions. After this 180 day period expires, these securities will be eligible for sale. The market price of our ADSs could decline significantly if we or our significant shareholders sell securities in our company or the market perceives that we or our significant shareholders intend to do so.
33
Table of Contents
We may raise additional capital in the future through the issuance of equity securities, which may result in dilution of the interests of our shareholders
We may need to raise additional capital and may opt for obtaining such capital through the public or private placement of debt securities or securities convertible into our common shares. In the event of a public or private debt financing, or the financing through the issuance of securities convertible into our common shares, such additional funds may be obtained with the exclusion of the preemptive rights of our shareholders, including the investors in our common shares, which may dilute the percentage interests of investors in our common shares.
No shareholder or group of shareholders holds a majority of our common shares
Our directors and senior management, directly and indirectly, own approximately 37.2% of our common shares as of February 28, 2013, including 21.1% of which is owned, directly and indirectly, by our Chairman. After giving effect to this offering, assuming full exercise of the underwriters’ over-allotment option, our directors and senior management will, directly and indirectly, own approximately % of our common shares, including % of which will be owned, directly and indirectly, by our Chairman. No shareholder or group of shareholders currently owns a majority of our common shares. Accordingly, no shareholder or group of shareholders may on its own determine the outcome of substantially all matters submitted for a vote to our shareholders. In addition, a new investor or group of investors may in the future seek to acquire a significant stake in, or control of, our company, subject to compliance with Peruvian tender offer requirements which require that a tender offer be made to all shareholders upon, among other matters, acquisition of 25%, 50% and 60% of our voting rights. If a new investor or group of investors acquires a significant stake in, or control of, our company, we cannot assure you that such investor or group of investors will not seek to change how our business is managed.
Holders of ADSs may be unable to exercise voting rights with respect to our common shares underlying the ADSs at our shareholders’ meetings
As a holder of ADSs representing common shares being held by the depositary in your name, you may exercise voting rights with respect to the common shares represented by the ADSs only in accordance with the deposit agreement relating to the ADSs. Holders of our common shares will receive notice of shareholders’ meetings through publication of a notice in the official gazette in Peru, a Peruvian newspaper of general circulation and the website of the Peruvian Securities Commission, and will be able to exercise their voting rights by either attending the meeting in person or voting by proxy. ADS holders will not receive notice directly from us. Instead, pursuant to the deposit agreement, we will notify the depositary, who will mail to holders of ADSs the notice of the meeting and a statement as to the manner in which voting instructions may be given. To exercise their voting rights, ADS holders must instruct the depositary how to exercise the voting rights for the common shares which underlie their ADSs. Due to these additional procedural steps involving the depositary, the process for exercising voting rights may take longer for ADS holders than for holders of our common shares.
Holders of ADSs also may not receive voting materials in time to instruct the depositary to vote the common shares underlying their ADSs. In addition, the depositary and its agents are not responsible for failing to carry out voting instructions of the holders of ADS or for the manner of carrying out such instructions, unless such failure can be attribute to gross negligence, bad faith or willful misconduct on the part of the depositary or its agents. Accordingly, holders of ADSs may not be able to exercise voting rights, and they will have little, if any, recourse if the underlying common shares are not voted as requested.
Our shareholders’ ability to receive cash dividends may be limited
Our shareholders’ ability to receive cash dividends may be limited by the ability of the depositary to convert cash dividends paid in nuevos soles into U.S. dollars. Under the terms of our deposit agreement with the depositary for the ADSs, the depositary will convert any cash dividend or other cash distribution we pay on the common shares underlying the ADSs into U.S. dollars, if it can do so on a reasonable basis and can transfer the U.S. dollars to the United States. If this conversion is not possible or if any government approval is needed and cannot be obtained, the deposit agreement allows the depositary to distribute the foreign currency only to those ADR holders to whom it is possible to do so. If the exchange rate fluctuates significantly during a time when the depositary cannot convert the foreign currency, you may lose some or all of the value of the dividend distribution.
34
Table of Contents
Holders of ADSs may be unable to exercise preemptive or accretion rights with respect to the common shares underlying their ADSs
Under Peruvian corporate law, if we issue new common shares as part of a capital increase, unless otherwise agreed to by holders of 40% of our subscribed voting common shares and, provided that such capital increase does not favor, directly or indirectly, certain shareholders to the detriment of others, our shareholders will generally have the right to subscribe to a proportional number of common shares of the class held by them to maintain their existing ownership percentage, which is known as preemptive rights. In addition, shareholders are entitled to the right to subscribe for the unsubscribed common shares at the end of a preemptive rights offering, on a pro rata basis, which is known as accretion rights. You may not be able to exercise the preemptive or accretion rights relating to common shares underlying your ADSs unless a registration statement under the Securities Act is effective with respect to those rights or an exemption from the registration requirements of the Securities Act is available. We are not obligated to file a registration statement with respect to the common shares relating to these preemptive and accretion rights, and we cannot assure you that we will file any such registration statement. Unless we file a registration statement or an exemption from registration is available, you may receive only the net proceeds from the sale of your preemptive and accretion rights by the depositary or, if the preemptive and accretion rights cannot be sold, they will be allowed to lapse. As a result, U.S. holders of our ADSs may suffer dilution of their interest in our company upon future capital increases.
We are entitled to amend the deposit agreement and to change the rights of ADS holders under the terms of such agreement, without the prior consent of the ADS holders
We are entitled to amend the deposit agreement and to change the rights of the ADS holders under the terms of such agreement, without the prior consent of the ADS holders. Any change related to an increase in deposits or charges for book-entry securities services or any modification that might hinder the rights of the ADS holders will be effective within 30 days after the ADS holders have received notice of such change or modification and such holders will have no right to any compensation whatsoever.
Any delay or difficulty in satisfying the requirements of Section 404 of the U.S. Sarbanes-Oxley Act of 2002 could adversely affect our future results of operations and the price of our ADSs
We will be required under the U.S. Securities Exchange Act of 1934 to maintain disclosure controls and procedures and internal control over financial reporting. Section 404 of the U.S. Sarbanes-Oxley Act of 2002 will require us to document and test the effectiveness of our internal control over financial reporting in accordance with an established internal control framework and to report on our conclusion as to the effectiveness of our internal controls. It will also require an independent registered public accounting firm to test our internal control over financial reporting and report on the effectiveness of such controls for our fiscal year ending December 31, 2014 and subsequent years. An independent registered public accounting firm will also be required to test, evaluate and report on the completeness of our assessment. Any delays or difficulty in satisfying our requirements could adversely affect our future results of operations and the price of our ADSs. Moreover, it may cost us more than we expect to comply with these control- and procedure-related requirements. Failure to comply with Section 404 could potentially subject us to sanctions or investigations by the SEC, the New York Stock Exchange or other regulatory authorities.
We may in the future discover areas of our internal controls that need improvement, particularly with respect to businesses that we have acquired or may acquire. We cannot be certain that any remedial measures we take will ensure that we implement and maintain adequate internal controls over our financial processes and reporting in the future. Any failure to implement required new or improved controls, or difficulties encountered in their implementation, could harm our operating results or cause us to fail to meet our reporting obligations. If we are unable to conclude that we have effective internal control over financial reporting, or if our independent registered public accounting firm is unable to provide us with an unqualified opinion regarding the effectiveness of our internal control over financial reporting as of December 31, 2014 and in future periods as required by Section 404, investors could lose confidence in the reliability of our consolidated financial statements, which could result in a decrease in the value of our ADSs.
35
Table of Contents
Peru has different corporate disclosure and accounting standards than those you may be familiar with in the United States
Financial reporting and securities disclosure requirements in Peru differ in certain significant respects from those required in the United States. There are also material differences among IFRS, Peruvian GAAP and U.S. GAAP. Accordingly, the information about us available to you will not be the same as the information available to holders of shares issued by a U.S. company. In addition, the Peruvian Securities Market Law, which governs open or publicly listed companies, such as us, imposes disclosure requirements that are more limited than those in the U.S. in certain important respects. Although Peruvian law imposes restrictions on insider trading and price manipulation, applicable Peruvian laws are different from those in the United States, and the Peruvian securities markets are not as highly regulated and supervised as the U.S. securities markets.
Our status as a foreign private issuer allows us to follow alternate standards to the corporate governance standards of the NYSE, which may limit the protections afforded to investors
We are a foreign private issuer within the meaning of the New York Stock Exchange corporate governance standards. Under New York Stock Exchange rules, a foreign private issuer may elect to comply with the practices of its home country and not to comply with certain corporate governance requirements applicable to U.S. companies with securities listed on the exchange. We currently follow certain Peruvian practices concerning corporate governance and intend to continue to do so. Accordingly, holders of our ADSs will not have the same protections afforded to shareholders of companies that are subject to all New York Stock Exchange corporate governance requirements.
For example, the New York Stock Exchange listing standards provide that the board of directors of a U.S. listed company must have a majority of independent directors at the time the company ceases to be a “controlled company.” Under Peruvian corporate governance practices, a Peruvian company is not required to have a majority of independent members on its board of directors. The listing standards for the New York Stock Exchange also require that U.S. listed companies, at the time they cease to be “controlled companies,” have a nominating/corporate governance committee and a compensation committee (in addition to an audit committee). Each of these committees must consist solely of independent directors and must have a written charter that addresses certain matters specified in the listing standards. Under Peruvian law, a Peruvian company may, but is not required to, form special governance committees, which may be composed partially or entirely of non-independent directors. In addition, New York Stock Exchange rules require the independent non-executive directors of U.S. listed companies to meet on a regular basis without management being present. There is no similar requirement under Peruvian law.
The New York Stock Exchange’s listing standards also require U.S. listed companies to adopt and disclose corporate governance guidelines. In July 2002, the Peruvian Securities Commission and a committee comprised of regulatory agencies and associations prepared and published a list of suggested non-mandatory corporate governance guidelines called the “Principles of Good Governance for Peruvian Companies.” Although we have implemented these measures, we are not legally required to comply with the corporate governance guidelines, only disclose whether or not we are in compliance.
Minority shareholders in Peru are not afforded equivalent protections as minority shareholders in other jurisdictions and investors may face difficulties in commencing judicial and arbitration proceedings against our company or the controlling shareholder
Our company is organized and existing under the laws of Peru. Accordingly, investors may face difficulties in serving process on our company, our officers and directors or our significant shareholders in the United States of certain other jurisdictions, and in enforcing decisions granted by courts located in other jurisdictions against our company, our officers and directors or our significant shareholders that are based on securities laws of jurisdictions other than Peru.
In Peru, there are no proceedings to file class action suits or shareholder derivative actions with respect to issues arising between minority shareholders and an issuer, its controlling shareholders or directors and officers. Furthermore, the procedural requirements to file actions by shareholders differ from those of other jurisdictions, such as in the United States. As a result, it may be more difficult for our minority shareholders to enforce their rights against us, our directors, officers or significant shareholders as compared to the shareholders of a U.S. company. The deposit agreement provides that the depositary has no obligation to commence or become involved in any judicial proceedings and any other legal actions relating to the ADSs or the deposit agreement, either on behalf of the ADS holders or on behalf of any other person.
36
Table of Contents
Judgments of Peruvian courts with respect to our common shares will be payable only in nuevos soles
If proceedings are brought in the courts of Peru seeking to enforce our obligations in respect of the common shares, we will not be required to discharge our obligations in a currency other than nuevos soles. Under Peruvian exchange control limitations, an obligation in Peru to pay amounts denominated in a currency other than nuevos soles may be satisfied in Peruvian currency only at the exchange rate, as determined by the Peruvian Central Bank, in effect on the date the judgment is obtained, and such amounts are then adjusted to reflect exchange rate variations through the effective payment date. The then prevailing exchange rate may not afford non-Peruvian investors with full compensation for any claim arising out of or related to our obligations under the ADSs.
Our newly issued common shares from this offering will initially be represented by “certificados provisionales” for which there may not be a liquid market
In accordance with Peruvian law, our common shares will be represented by preliminary stock certificates (certificados provisionales) until the capital increase is recorded with the Peruvian public registry and new common shares are listed on the Lima Stock Exchange and registered in the CAVALI S.A. ICLV book-entry settlement system. We cannot assure you that the Peruvian public registry will not delay the recording of our capital increase. In addition, the corporate resolution authorizing the capital increase may be subject to judicial challenges or other factors that prevent or delay the recording of the capital increase with the Peruvian public registry. Once the capital increase has been recorded, we will issue common shares in exchange for the preliminary stock certificates. Only after the capital increase has been recorded with the Peruvian public registry and we have issued common shares in exchange for the preliminary stock certificates, will you be able to cancel your ADSs and withdraw the deposited common shares.
If securities or industry analysts do not actively follow our business, or if they publish unfavorable research about our business, the price and trading volume of the ADSs could decline
The trading market for the ADSs will depend, in part, on the research and reports that securities or industry analysts publish about us or our business. If analysts do not cover our company, the trading price for the ADSs may be negatively impacted. If one or more of the analysts who covers us downgrades the ADSs or publishes unfavorable research about our business, the price of the ADSs would likely decline. If one or more of these analysts ceases coverage of our company or fails to publish reports on us regularly, demand for the ADSs could decrease, which could cause the price and trading volume of the ADSs to decline.
37
Table of Contents
The Peruvian nuevo sol is freely traded in the exchange market. Current Peruvian regulations on foreign investment allow foreign equity holders of Peruvian companies to receive and repatriate 100% of the cash dividends distributed by these companies. Non-Peruvian equity holders are allowed to purchase foreign currency at free market currency rates through any member of the Peruvian banking system and transfer such foreign currency outside Peru without restriction. Peruvian law in the past, however, has imposed restrictions on the conversion of Peruvian currency and the transfer of funds abroad, and we cannot assure you that Peruvian law will continue to permit such payments, transfers, conversions or remittances without restrictions.
The following table sets forth, for the periods indicated, certain information regarding the exchange rates for nuevos soles per U.S. dollar, as published by the SBS. The Federal Reserve Bank of New York does not report a noon buying rate for nuevos soles.
| High | Low | Average(1) | Period end | |||||||||||||
2008 | 3.160 | 2.693 | 2.925 | 3.142 | ||||||||||||
2009 | 3.259 | 2.853 | 3.012 | 2.891 | ||||||||||||
2010 | 2.885 | 2.787 | 2.826 | 2.809 | ||||||||||||
2011 | 2.834 | 2.694 | 2.755 | 2.697 | ||||||||||||
2012 | ||||||||||||||||
2012: | ||||||||||||||||
August | 2.630 | 2.610 | 2.617 | 2.610 | ||||||||||||
September | 2.611 | 2.594 | 2.603 | 2.598 | ||||||||||||
October | 2.602 | 2.578 | 2.588 | 2.592 | ||||||||||||
November | 2.616 | 2.579 | 2.599 | 2.579 | ||||||||||||
December | 2.581 | 2.551 | 2.568 | 2.551 | ||||||||||||
2013: | ||||||||||||||||
January | 2.578 | 2.541 | 2.552 | 2.578 | ||||||||||||
February | 2.587 | 2.567 | 2.579 | 2.587 | ||||||||||||
March (through March 22) | 2.609 | 2.591 | 2.596 | 2.591 | ||||||||||||
| (1) | Based on the exchange rate on the last day of each month during the year. |
38
Table of Contents
We estimate that the net proceeds to us from this offering will be approximately US$ million, or US$ million if the underwriters exercise the over-allotment option in full. These amounts assume an initial public offering price of US$ per ADS (the midpoint of the price range set forth on the cover page of this prospectus), after deducting the estimated underwriting discounts and commissions and offering expenses payable by us, and assumes no exercise of the underwriters’ over-allotment option.
We intend to use the net proceeds from this offering for capital expenditures, including potential acquisitions in each of our business segments both in or outside Peru, investments under potential new infrastructure concessions and other investment opportunities, as well as general corporate purposes. We routinely evaluate acquisitions, new infrastructure concessions and other investment opportunities that are aligned with our strategic goals. We cannot assure you that we will find opportunities on terms that we consider to be favorable or whether we will be able to take advantage of these opportunities. Our management will have significant flexibility in applying the net proceeds from this offering.
39
Table of Contents
The following table sets forth our capitalization as of December 31, 2012:
| • | on an actual basis; and |
| • | as adjusted to give effect to the sale of our ADSs in the offering at an assumed initial public offering price of US$ per ADS (the midpoint of the price range set forth on the cover page of this prospectus), after deducting estimated underwriting discounts and commissions and offering expenses payable by us. |
The as adjusted information in the table below assumes no exercise of the underwriters’ over-allotment option.
The table below should be read in conjunction with our consolidated financial statements included in this prospectus.
| As of December 31, 2012 | ||||||||||||
| Actual | As adjusted | |||||||||||
(in millions of S/.) | (in millions of US$)(1) | (in millions of S/.) | (in millions of US$)(1) | |||||||||
Indebtedness: | ||||||||||||
Short-term indebtedness | 452.8 | 177.5 | ||||||||||
Long-term indebtedness | 392.7 | 153.9 | ||||||||||
|
|
|
| |||||||||
Total indebtedness | 845.5 | 331.4 | ||||||||||
Shareholders’ equity: | ||||||||||||
Capital | 558.3 | 218.8 | ||||||||||
Reserves | 107.0 | 41.9 | ||||||||||
Retained earnings | 724.0 | 283.8 | ||||||||||
Premium for share issuance | 6.7 | 2.6 | ||||||||||
Other comprehensive income | (3.7 | ) | (1.5 | ) | ||||||||
Equity attributable to controlling interest | 1,392.2 | 545.8 | ||||||||||
Non-controlling interest | 384.7 | 150.8 | ||||||||||
|
|
|
| |||||||||
Total equity | 1,776.9 | 696.5 | ||||||||||
Total capitalization | 2,622.4 | 1,028.0 | ||||||||||
| (1) | Calculated based on an exchange rate of S/.2.551 to US$1.00 as of December 31, 2012. |
On February 27, 2013, we entered into a syndicated loan for an aggregate amount of up to US$150 million. As of the date of this prospectus, we had US$90 million outstanding under this loan. On March 5, 2013, we used part of the proceeds from this loan to repay in full our US$60 million bridge loan reflected in our short-term indebtedness in the table above. See “Management’s Discussion and Analysis of Financial Condition and Results of Operations—Liquidity and Capital Resources—Indebtedness.”
40
Table of Contents
Purchasers of our ADSs in this offering will experience immediate and substantial dilution to the extent of any difference between the initial public offering price per ADS and the net book value per ADS upon the completion of the offering.
Net book value represents the amount of our total assets, less our total liabilities and excluding goodwill. Net book value per share is determined by dividing our net book value by the number of our outstanding common shares.
As of December 31, 2012, our net book value would have been approximately S/.[—] million, or S/.[—] per share (equivalent to US$[—] per ADS). Based upon an assumed initial public offering price of US$ per ADS (the midpoint of the price range set forth on the cover page of this prospectus), the immediate dilution to purchasers of our ADSs in the offering will be S/. per common share or US$ per ADS or %. The following table illustrates this dilution per common share and per ADS:
| Per ADS | Per common share | |||||||
Assumed initial public offering price | US$ | S/. | ||||||
Net book value as of December 31, 2012 | ||||||||
Dilution to new investors | ||||||||
If the underwriters exercise the over-allotment option in full, net tangible book value would increase to S/. per common share or US$ per ADS and the immediate dilution to our purchasers of ADSs in the offering would be S/. per common share or US$ per ADS.
41
Table of Contents
The following selected consolidated financial data should be read together with “Presentation of Financial and Other Information,” “Management’s Discussion and Analysis of Financial Condition and Results of Operations” and our consolidated financial statements included in this prospectus.
The following selected financial data as of and for the years ended December 31, 2010, 2011 and 2012 have been derived from our annual audited consolidated financial statements included in this prospectus, which have been prepared in accordance with IFRS issued by the IASB. We applied the accommodation provided by the U.S. Securities and Exchange Commission (“SEC”) in respect of first-time application of IFRS and the following information is limited to our selected consolidated financial information for 2010, 2011 and 2012.
| Year ended December 31, | ||||||||||||||||
| 2010 | 2011(1) | 2012 | 2012 | |||||||||||||
| (in millions of S/.) | (in millions of US$)(2) | |||||||||||||||
Income Statement Data: | ||||||||||||||||
Revenues | 2,502.7 | 4,241.3 | 5,231.9 | 2,050.9 | ||||||||||||
Cost of sales | (2,057.8 | ) | (3,609.5 | ) | (4,519.8 | ) | (1,771.8 | ) | ||||||||
|
|
|
|
|
|
|
| |||||||||
Gross profit | 444.8 | 631.7 | 712.1 | 279.1 | ||||||||||||
Administrative expenses | (123.2 | ) | (199.6 | ) | (257.2 | ) | (100.8 | ) | ||||||||
Other income and expenses(3) | 2.7 | 4.3 | 75.9 | 29.8 | ||||||||||||
Profit from sale of investments | 75.0 | 4.8 | — | — | ||||||||||||
Other (losses) gains, net | 0.2 | (2.8 | ) | (0.3 | ) | (0.1 | ) | |||||||||
Gain from business combination(3) | — | 45. 2 | — | — | ||||||||||||
|
|
|
|
|
|
|
| |||||||||
Operating profit | 399.5 | 483.6 | 530.6 | 208.0 | ||||||||||||
Financial (expense) income, net | (10.0 | ) | (6.2 | ) | (10.3 | ) | (4.1 | ) | ||||||||
Share of the profit and loss obtained by associates under the equity method of accounting | 11.5 | 0.2 | 0.6 | 0.2 | ||||||||||||
|
|
|
|
|
|
|
| |||||||||
Profit before income tax | 401.0 | 477.6 | 520.8 | 204.2 | ||||||||||||
Income tax | (124.3 | ) | (141.4 | ) | (154.6 | ) | (60.6 | ) | ||||||||
|
|
|
|
|
|
|
| |||||||||
Net profit | 276.7 | 336.2 | 366.3 | 143.6 | ||||||||||||
Net profit attributable to controlling interest(4) | 252.8 | 289.1 | 290.0 | 113.7 | ||||||||||||
Net profit attributable to non-controlling interest(4) | 23.9 | 47.1 | 76.3 | 29.9 | ||||||||||||
| (1) | Includes the results of operations of CAM since February 24, 2011. See “Management’s Discussion and Analysis of Financial Condition and Results of Operations—Factors Affecting Our Results of Operations—Acquisitions” and note 28 to our consolidated financial statements included in this prospectus. |
| (2) | Calculated based on an exchange rate of S/.2.551 to US$1.00 as of December 31, 2012. |
| (3) | In 2011, relates to gains recorded in connection with the CAM business acquisition as a result of the excess of the fair value of the assets and liabilities we acquired in the CAM acquisition over the consideration paid and, in 2012, the reversal of provisions of CAM. See “Management’s Discussion and Analysis of Financial Condition and Results of Operations—Factors Affecting Our Results of Operations—Acquisitions” and notes 25 and 28 to our consolidated financial statements included in this prospectus. |
| (4) | We consolidate the results of our subsidiaries in our financial statements and we reflect the profit corresponding to the minority interests in our subsidiaries under “net profit attributable to non-controlling interests” in our income statement. We proportionally consolidate (on a line-by-line basis) the results of our joint operations in our financial statements. We reflect the results of our associated companies under the equity method of accounting in our financial statements under the line item “share of the profit and loss in associates” in our income statement. See “Management’s Discussion and Analysis of Financial Condition and Results of Operations—Results of Operations—General—Accounting for Subsidiaries, Joint Operations and Associated Companies” and note 2.2 to our consolidated financial statements included in this prospectus. |
| As of December 31, | ||||||||||||
| 2011 | 2012 | 2012 | ||||||||||
| (in millions of S/.) | (in millions of US$)(1) | |||||||||||
Balance Sheet Data: | ||||||||||||
Total current assets | 2,502.3 | 3,011.4 | 1,180.5 | |||||||||
Cash and cash equivalents | 658.2 | 780.1 | 305.8 | |||||||||
Accounts receivables | 855.2 | 930.8 | 364.9 | |||||||||
Outstanding work in progress | 393.8 | 525.3 | 205.9 | |||||||||
Inventories(2) | 546.3 | 747.4 | 293.0 | |||||||||
Total non-current assets | 1,191.5 | 1,981.2 | 776.6 | |||||||||
Long-term accounts receivables(3) | 75.2 | 393.4 | 154.2 | |||||||||
Property, plant and equipment | 686.9 | 938.1 | 367.7 | |||||||||
42
Table of Contents
| As of December 31, | ||||||||||||
| 2011 | 2012 | 2012 | ||||||||||
| (in millions of S/.) | (in millions of US$)(1) | |||||||||||
Intangible assets(4) | 317.8 | 505.1 | 198.0 | |||||||||
Total current liabilities | 1,741.4 | 2,618.1 | 1,026.3 | |||||||||
Short-term borrowings | 231.0 | 452.8 | 177.5 | |||||||||
Accounts payables(5) | 1,313.6 | 1,995.2 | 782.1 | |||||||||
Total non-current liabilities | 499.3 | 597.6 | 234.3 | |||||||||
Long-term borrowings | 298.9 | 392.7 | 153.9 | |||||||||
Shareholders’ equity | 1,189.0 | 1,392.2 | 545.8 | |||||||||
Non-controlling interest | 264.1 | 384.7 | 150.8 | |||||||||
| (1) | Calculated based on an exchange rate of S/.2.551 to US$1.00 as of December 31, 2012. |
| (2) | Includes investments for the purchase of land by our Real Estate segment. These investments in land are recorded at book value and are not marked-to-market for changes in fair value. See note 12 to our consolidated financial statements included in this prospectus. |
| (3) | Includes payments required to be made by the Peruvian government for the amounts we invest to purchase trains and other infrastructure for the Lima Metro. See “Management’s Discussion and Analysis of Financial Condition and Results of Operations—Results of Operations—General—Infrastructure” and note 8 to our consolidated financial statements included in this prospectus. |
| (4) | We recognize our investments in the construction of the highway of our Norvial concession as intangible assets. See note 2.15(c) to our consolidated financial statements included in this prospectus. |
| (5) | Includes S/.421.0 million and S/.848.1 million in advance payments made by our clients as of December 31, 2011 and 2012, respectively, in connection with our E&C and Operation and Maintenance of Infrastructure Assets contracts. See “Management’s Discussion and Analysis of Financial Condition and Results of Operations—Results of Operations—General—Engineering and Construction” and “—Technical Services” and note 18 to our consolidated financial statements included in this prospectus. |
The following tables set forth summary financial data for each of our business segments. For more information on the results of operations of our segments, see “Management’s Discussion and Analysis of Financial Condition and Results of Operations— Results of Operations” and note 5 to our consolidated financial statements included in this prospectus.
| 1. | Engineering & Construction |
| Year ended December 31, | ||||||||||||||||
| 2010 | 2011 | 2012 | 2012 | |||||||||||||
| (in millions of S/.) | (in millions of US$)(1) | |||||||||||||||
Income Statement Data: | ||||||||||||||||
Revenues | 1,700.5 | 2,784.2 | 3,524.6 | 1,381.6 | ||||||||||||
Cost of sales | (1,469.6 | ) | (2,454.9 | ) | (3,116.6 | ) | (1,221.7 | ) | ||||||||
|
|
|
|
|
|
|
| |||||||||
Gross profit | 230.9 | 329.3 | 408.0 | 159.9 | ||||||||||||
Administrative expenses | (82.5 | ) | (104.4 | ) | (159.8 | ) | (62.7 | ) | ||||||||
Other income and expenses | (1.5 | ) | 4.8 | (1.9 | ) | (0.8 | ) | |||||||||
Other (losses) gains, net | 3.0 | (2.2 | ) | 1.3 | 0.5 | |||||||||||
|
|
|
|
|
|
|
| |||||||||
Operating profit | 149.8 | 227.5 | 247.6 | 97.1 | ||||||||||||
Financial (expense) income, net | 2.7 | 5.3 | 19.7 | 7.7 | ||||||||||||
Other non-operating income and expenses | 7.7 | 5.1 | 9.2 | 3.6 | ||||||||||||
|
|
|
|
|
|
|
| |||||||||
Profit before income tax | 160.2 | 237.9 | 276.4 | 108.4 | ||||||||||||
Income tax | (49.0 | ) | (71.5 | ) | (87.9 | ) | (34.5 | ) | ||||||||
|
|
|
|
|
|
|
| |||||||||
Net profit | 111.2 | 166.4 | 188.5 | 73.9 | ||||||||||||
Net profit attributable to controlling interest | 104.1 | 153.1 | 165.1 | 64.7 | ||||||||||||
Net profit attributable to non-controlling interest | 7.1 | 13.3 | 23.4 | 9.2 | ||||||||||||
| As of December 31, | ||||||||||||
| 2011 | 2012 | 2012 | ||||||||||
| (in millions of S/.) | (in millions of US$)(1) | |||||||||||
Balance Sheet Data: | ||||||||||||
Total current assets | 1,252.9 | 1,547.4 | 606.6 | |||||||||
Cash and cash equivalents | 400.5 | 423.3 | 165.9 | |||||||||
Accounts receivables | 539.2 | 555.8 | 217.9 | |||||||||
Outstanding work in progress | 218.7 | 417.1 | 163.5 | |||||||||
Other current assets | 94.6 | 151.2 | 59.3 | |||||||||
Total non-current assets | 452.7 | 875.8 | 343.3 | |||||||||
Long-term accounts receivables | 2.3 | 11.3 | 4.4 | |||||||||
43
Table of Contents
| As of December 31, | ||||||||||||
| 2011 | 2012 | 2012 | ||||||||||
| (in millions of S/.) | (in millions of US$)(1) | |||||||||||
Property, plant and equipment | 329.6 | 539.0 | 211.3 | |||||||||
Other non-current assets | 120.7 | 325.6 | 127.6 | |||||||||
Total current liabilities | 1,114.6 | 1,587.0 | 622.1 | |||||||||
Short-term borrowings | 70.4 | 120.0 | 47.0 | |||||||||
Accounts payables(2) | 931.9 | 1,356.5 | 531.8 | |||||||||
Total non-current liabilities | 155.0 | 260.8 | 102.3 | |||||||||
Long-term borrowings | 136.6 | 180.9 | 70.9 | |||||||||
Other long-term liabilities | 18.4 | 80.0 | 31.4 | |||||||||
Shareholders’ equity | 406.3 | 472.11 | 185.0 | |||||||||
Non-controlling interest | 29.8 | 103.3 | 40.5 | |||||||||
| 2. | Infrastructure |
| Year ended December 31, | ||||||||||||||||
| 2010 | 2011 | 2012 | 2012 | |||||||||||||
| (in millions of S/.) | (in millions of US$)(1) | |||||||||||||||
Income Statement Data: | ||||||||||||||||
Revenues | 354.7 | 404.2 | 524.5 | 205.6 | ||||||||||||
Cost of sales | (222.4 | ) | (258.0 | ) | (351.8 | ) | (137.9 | ) | ||||||||
|
|
|
|
|
|
|
| |||||||||
Gross profit | 132.3 | 146.2 | 172.6 | 67.7 | ||||||||||||
Administrative expenses | (19.8 | ) | (25.6 | ) | (30.5 | ) | (12.0 | ) | ||||||||
Other income and expenses | 2.2 | (0.2 | ) | (0.8 | ) | (0.3 | ) | |||||||||
Profit from the sale of investments | 17.0 | — | — | — | ||||||||||||
|
|
|
|
|
|
|
| |||||||||
Other (losses) gains, net | (2.8 | ) | (2.1 | ) | (1.6 | ) | 0.6 | |||||||||
|
|
|
|
|
|
|
| |||||||||
Operating profit | 128.9 | 118.3 | 139.7 | 54.8 | ||||||||||||
Financial (expense) income, net | (10.7 | ) | (6.0 | ) | (17.3 | ) | (6.8 | ) | ||||||||
Other non-operating income and expenses | 0.4 | 0.2 | — | — | ||||||||||||
|
|
|
|
|
|
|
| |||||||||
Profit before income tax | 118.6 | 112.5 | 122.3 | 48.0 | ||||||||||||
Income tax | (30.5 | ) | (30.8 | ) | (38.4 | ) | (15.0 | ) | ||||||||
|
|
|
|
|
|
|
| |||||||||
Net profit | 88.1 | 81.8 | 84.0 | 32.9 | ||||||||||||
Net profit attributable to controlling interest | 73.6 | 68.2 | 66.7 | 26.1 | ||||||||||||
Net profit attributable to non-controlling interest | 14.5 | 13.6 | 17.3 | 6.8 | ||||||||||||
| As of December 31, | ||||||||||||
| 2011 | 2012 | 2012 | ||||||||||
| (in millions of S/.) | (in millions of US$)(1) | |||||||||||
Balance Sheet Data: | ||||||||||||
Total current assets | 302.4 | 319.1 | 125.1 | |||||||||
Cash and cash equivalents | 64.9 | 149.7 | 58.7 | |||||||||
Accounts receivables | 117.4 | 118.9 | 46.6 | |||||||||
Outstanding work in progress | 105.4 | 26.8 | 10.5 | |||||||||
Other current assets | 14.7 | 23.8 | 9.3 | |||||||||
Total non-current assets | 466.0 | 826.8 | 324.1 | |||||||||
Long-term accounts receivables(3) | 41.0 | 349.3 | 136.9 | |||||||||
Property, plant and equipment | 192.5 | 211.3 | 82.8 | |||||||||
Other non-current assets | 232.4 | 266.2 | 104.3 | |||||||||
Total current liabilities | 129.5 | 486.0 | 190.5 | |||||||||
Short-term borrowings | 33.4 | 38.7 | 15.2 | |||||||||
Accounts payables | 75.7 | 439.3 | 172.2 | |||||||||
Total non-current liabilities | 134.2 | 190.5 | 74.7 | |||||||||
Long-term borrowings | 127.1 | 146.3 | 57.3 | |||||||||
Other long-term liabilities | 7.0 | 44.2 | 17.3 | |||||||||
Shareholders’ equity | 402.6 | 355.5 | 139.4 | |||||||||
Non-controlling interest | 102.1 | 113.9 | 44.7 | |||||||||
44
Table of Contents
| 3. | Real Estate |
| Year ended December 31, | ||||||||||||||||
| 2010 | 2011 | 2012 | 2012 | |||||||||||||
| (in millions of S/.) | (in millions of US$)(1) | |||||||||||||||
Income Statement Data: | ||||||||||||||||
Revenues | 218.6 | 152.3 | 240.1 | 94.1 | ||||||||||||
Cost of sales | (185.3 | ) | (106.9 | ) | (153.4 | ) | (60.1 | ) | ||||||||
|
|
|
|
|
|
|
| |||||||||
Gross profit | 33.3 | 45.3 | 86.7 | 34.0 | ||||||||||||
Administrative expenses | (6.8 | ) | (10.1 | ) | (17.4 | ) | (6.8 | ) | ||||||||
Other income and expenses | 0.2 | (0.4 | ) | (1.7 | ) | (0.7 | ) | |||||||||
|
|
|
|
|
|
|
| |||||||||
Operating profit | 26.7 | 34.9 | 67.6 | 26.5 | ||||||||||||
Financial (expense) income, net | (0.1 | ) | (0.5 | ) | (2.3 | ) | (0.9 | ) | ||||||||
|
|
|
|
|
|
|
| |||||||||
Profit before income tax | 26.6 | 34.4 | 65.3 | 25.6 | ||||||||||||
Income tax | (8.7 | ) | (10.2 | ) | (20.0 | ) | (7.8 | ) | ||||||||
|
|
|
|
|
|
|
| |||||||||
Net profit | 17.9 | 24.1 | 45.3 | 17.8 | ||||||||||||
Net profit attributable to controlling interest(4) | 8.5 | 6.1 | 12.4 | 4.9 | ||||||||||||
Net profit attributable to non-controlling interest(4) | 9.4 | 18.1 | 32.9 | 12.9 | ||||||||||||
| As of December 31, | ||||||||||||
| 2011 | 2012 | 2012 | ||||||||||
| (in millions of S/.) | (in millions of US$)(1) | |||||||||||
Balance Sheet Data: | ||||||||||||
Total current assets | 450.7 | 636.0 | 249.3 | |||||||||
Cash and cash equivalents | 49.3 | 73.0 | 28.6 | |||||||||
Accounts receivables | 19.5 | 37.7 | 14.8 | |||||||||
Outstanding work in progress | 0.0 | 0.0 | 0.0 | |||||||||
Other current assets(5) | 381.9 | 525.3 | 205.9 | |||||||||
Total non-current assets | 46.1 | 71.4 | 28.0 | |||||||||
Long-term accounts receivables | 0.0 | 6.8 | 2.7 | |||||||||
Property, plant and equipment | 5.0 | 4.5 | 1.8 | |||||||||
Investment property | 36.5 | 36.0 | 14.1 | |||||||||
Other non-current assets | 4.5 | 24.2 | 9.5 | |||||||||
Total current liabilities | 197.5 | 263.6 | 103.3 | |||||||||
Short-term borrowings | 41.6 | 43.2 | 16.9 | |||||||||
Accounts payables | 146.7 | 211.8 | 83.0 | |||||||||
Total non-current liabilities | 96.4 | 62.6 | 24.5 | |||||||||
Long-term borrowings | 16.5 | 49.7 | 19.5 | |||||||||
Other long-term liabilities | 79.8 | 12.9 | 5.1 | |||||||||
Shareholders’ equity | 50.1 | 147.1 | 57.6 | |||||||||
Non-controlling interest(4) | 152.8 | 234.2 | 91.8 | |||||||||
| 4. | Technical Services |
| Year ended December 31, | ||||||||||||||||
| 2010 | 2011(6) | 2012 | 2012 | |||||||||||||
| (in millions of S/.) | (in millions of US$)(1) | |||||||||||||||
Income Statement Data: | ||||||||||||||||
Revenues | 285.0 | 977.0 | 1,083.3 | 424.7 | ||||||||||||
Cost of sales | (223.9 | ) | (867.3 | ) | (979.4 | ) | (383.9 | ) | ||||||||
|
|
|
|
|
|
|
| |||||||||
Gross profit | 61.0 | 109.7 | 103.9 | 40.7 | ||||||||||||
Administrative expenses | (23.0 | ) | (72.1 | ) | (105.4 | ) | (41.3 | ) | ||||||||
Other income and expenses | (0.1 | ) | 6.2 | 73.6 | 28.8 | |||||||||||
Gain from business combination | — | 45.2 | — | — | ||||||||||||
Other (losses) gains, net | — | 0.4 | — | — | ||||||||||||
|
|
|
|
|
|
|
| |||||||||
Operating profit | 37.9 | 89.4 | 72.2 | 28.3 | ||||||||||||
Financial (expense) income, net | (1.8 | ) | (8.5 | ) | (5.1 | ) | (2.0 | ) | ||||||||
|
|
|
|
|
|
|
| |||||||||
Profit before income tax | 36.1 | 80.9 | 67.1 | 26.3 | ||||||||||||
Income tax | (11.3 | ) | (19.8 | ) | (5.6 | ) | (2.2 | ) | ||||||||
|
|
|
|
|
|
|
| |||||||||
Net profit | 24.7 | 61.1 | 61.5 | 24.1 | ||||||||||||
Net profit attributable to controlling interest | 23.9 | 53.9 | 50.6 | 19.8 | ||||||||||||
Net profit attributable to non-controlling interest | 0.8 | 7.2 | 10.8 | 4.2 | ||||||||||||
| As of December 31, | ||||||||||||
| 2011 | 2012 | 2012 | ||||||||||
| (in millions of S/.) | (in millions of US$)(1) | |||||||||||
Balance Sheet Data: | ||||||||||||
Total current assets | 513.0 | 495.5 | 194.2 | |||||||||
Cash and cash equivalents | 73.4 | 85.3 | 33.4 | |||||||||
Accounts receivables | 276.7 | 259.6 | 101.8 | |||||||||
Outstanding work in progress | 69.8 | 81.4 | 31.9 | |||||||||
Other current assets | 93.2 | 69.2 | 27.1 | |||||||||
Total non-current assets | 183.7 | 192.2 | 75.3 | |||||||||
45
Table of Contents
| As of December 31, | ||||||||||||
| 2011 | 2012 | 2012 | ||||||||||
| (in millions of S/.) | (in millions of US$)(1) | |||||||||||
Long-term accounts receivables | 30.1 | 24.3 | 9.5 | |||||||||
Property, plant and equipment | 96.8 | 109.3 | 42.8 | |||||||||
Other non-current assets | 56.8 | 58.7 | 23.0 | |||||||||
Total current liabilities | 412.4 | 489.4 | 191.8 | |||||||||
Short-term borrowings | 85.0 | 96.0 | 37.6 | |||||||||
Accounts payables | 275.5 | 354.2 | 138.8 | |||||||||
Total non-current liabilities | 168.5 | 74.4 | 29.2 | |||||||||
Long-term borrowings | 14.6 | 12.4 | 4.9 | |||||||||
Other long-term liabilities | 153.9 | 61.9 | 24.3 | |||||||||
Shareholders’ equity | 91.7 | 103.0 | 40.4 | |||||||||
Non-controlling interest | 24.1 | 20.9 | 8.2 | |||||||||
| (1) | Calculated based on an exchange rate of S/.2.551 to US$1.00 as of December 31, 2012. |
| (2) | Includes advance payments, which reflects advance payments made by our clients in connection with our E&C and Operation and Maintenance of Infrastructure Assets contracts. See “Management’s Discussion and Analysis of Financial Condition and Results of Operations—Results of Operations—General—Engineering and Construction” and “—Technical Services” and note 18 to our consolidated financial statements included in this prospectus. |
| (3) | Includes long-term accounts receivables, which includes payments required to be made by the Peruvian government for the amounts we invest to purchase trains and other infrastructure for the Lima Metro. See “Management’s Discussion and Analysis of Financial Condition and Results of Operations—Results of Operations—General—Infrastructure” and note 8 to our consolidated financial statements included in this prospectus. and other long-term accounts receivables. |
| (4) | The net profit attributable to controlling interests of our Real Estate segment is significantly affected by the financing and commercial arrangements we use to purchase land and to develop real estate projects. Depending on the level of non-controlling interests used to finance our real estate projects, our Real Estate segment tends to have significant net profit attributable to non-controlling interests. See “Management’s Discussion and Analysis of Financial Condition and Results of Operations—Results of Operations—General—Real Estate.” |
| (5) | Includes inventories, which includes investments for the purchase of land by our Real Estate segment. These investments in land are recorded at book value and are not marked-to-market for changes in fair value. See note 12 to our consolidated financial statements included in this prospectus. |
| (6) | Includes the results of operations of CAM since February 24, 2011. See “Management’s Discussion and Analysis of Financial Condition and Results of Operations—Factors Affecting Our Results of Operations—Acquisitions” and note 28 to our consolidated financial statements included in this prospectus. |
Non-GAAP Financial Measure and Reconciliation
In this prospectus, we present EBITDA, a non-GAAP financial measure. A non-GAAP financial measure is generally defined as one that purports to measure financial performance, financial position or cash flows but excludes or includes amounts that would not be so adjusted in the most comparable IFRS measure. We define EBITDA as net profit plus: financial (expense) income, net; income tax; and depreciation and amortization. We present EBITDA because we believe it provides investors with a supplemental measure of the financial performance of our core operations that facilitates period-to-period comparisons on a consistent basis. Our management uses EBITDA, among other measures, for internal planning and performance measurement purposes. EBITDA should not be construed as an alternative to net profit or operating profit, as an indicator of operating performance, as an alternative to cash flow provided by operating activities or as a measure of liquidity (in each case, as determined in accordance with IFRS). EBITDA, as calculated by us, may not be comparable to similarly titled measures reported by other companies. The following table sets forth the reconciliation of our net profit to EBITDA on a consolidated basis.
| Year ended December 31, | ||||||||||||||||
| 2010 | 2011(1) | 2012 | 2012 | |||||||||||||
| (in millions of S/.) | (in millions of US$)(1) | |||||||||||||||
Net profit | 276.7 | 336.2 | 366.3 | 143.6 | ||||||||||||
Financial expense (income), net | 10.0 | 6.2 | 10.3 | 4.1 | ||||||||||||
Income tax | 124.3 | 141.4 | 154.6 | 60.6 | ||||||||||||
Depreciation and amortization | 142.9 | 178.2 | 244.5 | 95.8 | ||||||||||||
|
|
|
|
|
|
|
| |||||||||
EBITDA | 553.9 | 662.0 | 775.7 | 304.1 | ||||||||||||
46
Table of Contents
The following tables set forth the reconciliation of our net profit to EBITDA for each of our business segments and certain of our lines of business or subsidiaries within these segments.
| 1. | Engineering & Construction |
| Year ended December 31, | ||||||||||||||||
| 2010 | 2011 | 2012 | 2012 | |||||||||||||
| (in millions of S/.) | (in millions of US$)(1) | |||||||||||||||
Net profit | 111.2 | 166.4 | 188.5 | 73.9 | ||||||||||||
Financial expense (income), net | (2.7 | ) | (5.3 | ) | (19.7 | ) | (7.7 | ) | ||||||||
Income tax | 49.0 | 71.5 | 87.9 | 34.5 | ||||||||||||
Depreciation and amortization | 60.8 | 82.4 | 131.1 | 51.4 | ||||||||||||
|
|
|
|
|
|
|
| |||||||||
EBITDA | 218.3 | 315.0 | 387.9 | 152.1 | ||||||||||||
| 2. | Infrastructure |
| 2.1 | Full Segment |
| Year ended December 31, | ||||||||||||||||
| 2010 | 2011 | 2012 | 2012 | |||||||||||||
| (in millions of S/.) | (in millions of US$)(1) | |||||||||||||||
Net profit | 88.1 | 81.8 | 84.0 | 32.9 | ||||||||||||
Financial expense (income), net | 10.7 | 6.0 | 17.3 | 6.8 | ||||||||||||
Income tax | 30.5 | 30.8 | 38.4 | 15.0 | ||||||||||||
Depreciation and amortization | 61.8 | 57.6 | 67.9 | 26.6 | ||||||||||||
|
|
|
|
|
|
|
| |||||||||
EBITDA | 191.1 | 176.1 | 207.5 | 81.4 | ||||||||||||
| 2.2 | All Toll Roads |
| Year ended December 31, | ||||||||||||||||
| 2010 | 2011 | 2012 | 2012 | |||||||||||||
| (in millions of S/.) | (in millions of US$)(1) | |||||||||||||||
Net profit | 25.5 | 21.4 | 29.4 | 11.5 | ||||||||||||
Financial expense (income), net | 9.8 | 5.9 | 5.2 | 2.0 | ||||||||||||
Income tax | 8.7 | 5.8 | 12.5 | 4.9 | ||||||||||||
Depreciation and amortization | 27.9 | 21.3 | 24.5 | 9.6 | ||||||||||||
|
|
|
|
|
|
|
| |||||||||
EBITDA | 72.0 | 54.5 | 71.5 | 28.0 | ||||||||||||
2.2(a) Norvial
| Year ended December 31, | ||||||||||||||||
| 2010 | 2011 | 2012 | 2012 | |||||||||||||
| (in millions of S/.) | (in millions of US$)(1) | |||||||||||||||
Net profit | 19.4 | 26.4 | 27.2 | 10.6 | ||||||||||||
Financial expenses (income), net | 6.2 | 4.8 | 3.8 | 1.5 | ||||||||||||
Income tax | 6.1 | 7.8 | 11.6 | 4.5 | ||||||||||||
Depreciation and amortization | 27.7 | 21.1 | 24.2 | 9.5 | ||||||||||||
|
|
|
|
|
|
|
| |||||||||
EBITDA | 59.4 | 60.1 | 66.7 | 26.2 | ||||||||||||
| 2.3 | Mass Transit |
| Year ended December 31, | ||||||||||||||
| 2011 | 2012 | 2012 | ||||||||||||
| (in millions of S/.) | (in millions of US$)(1) | |||||||||||||
Net profit | (8.5 | ) | (11.0 | ) | (4.3 | ) | ||||||||
Financial expense (income), net | (1.9 | ) | 4.0 | 1.6 | ||||||||||
Income tax | (4.7 | ) | (3.6 | ) | (1.4 | ) | ||||||||
Depreciation and amortization | 0.1 | 0.5 | 0.2 | |||||||||||
|
|
|
|
|
| |||||||||
EBITDA | (15.0 | ) | (10.2 | ) | (4.0 | ) | ||||||||
47
Table of Contents
| 2.4 | Energy |
| Year ended December 31, | ||||||||||||||||
| 2010 | 2011 | 2012 | 2012 | |||||||||||||
| (in millions of S/.) | (in millions of US$)(1) | |||||||||||||||
Net profit | 62.6 | 69.1 | 63.4 | 24.8 | ||||||||||||
Financial expense (income), net | 0.9 | 1.9 | 1.8 | 0.7 | ||||||||||||
Income tax | 21.8 | 29.7 | 28.5 | 11.2 | ||||||||||||
Depreciation and amortization | 33.9 | 36.1 | 42.8 | 16.8 | ||||||||||||
|
|
|
|
|
|
|
| |||||||||
EBITDA | 119.1 | 136.8 | 136.4 | 53.5 | ||||||||||||
| 3. | Real Estate |
| Year ended December 31, | ||||||||||||||||
| 2010 | 2011 | 2012 | 2012 | |||||||||||||
| (in millions of S/.) | (in millions of US$)(1) | |||||||||||||||
Net profit | 17.9 | 24.1 | 45.3 | 17.8 | ||||||||||||
Financial expense (income), net | 0.1 | 0.5 | 2.3 | 0.9 | ||||||||||||
Income tax | 8.7 | 10.2 | 20.0 | 7.8 | ||||||||||||
Depreciation and amortization | 0.7 | 2.6 | 2.9 | 1.1 | ||||||||||||
|
|
|
|
|
|
|
| |||||||||
EBITDA | 27.4 | 37.5 | 70.5 | 27.6 | ||||||||||||
| 4. | Technical Services |
| 4.1 | Full Segment |
| Year ended December 31, | ||||||||||||||||
| 2010 | 2011(2) | 2012 | 2012 | |||||||||||||
| (in millions of S/.) | (in millions of US$)(1) | |||||||||||||||
Net profit | 24.7 | 61.1 | 61.5 | 24.1 | ||||||||||||
Financial expense (income), net | 1.8 | 8.5 | 5.1 | 2.0 | ||||||||||||
Income tax | 11.3 | 19.8 | 5.6 | 2.2 | ||||||||||||
Depreciation and amortization | 15.9 | 32.2 | 39.4 | 15.5 | ||||||||||||
|
|
|
|
|
|
|
| |||||||||
EBITDA | 53.8 | 121.6 | 111.6 | 43.7 | ||||||||||||
| 4.2 | Concar |
| Year ended December 31, | ||||||||||||||||
| 2010 | 2011 | 2012 | 2012 | |||||||||||||
| (in millions of S/.) | (in millions of US$)(1) | |||||||||||||||
Net profit | 17.5 | 34.9 | 12.6 | 4.9 | ||||||||||||
Financial expense (income), net | (0.2 | ) | (0.5 | ) | (0.6 | ) | (0.3 | ) | ||||||||
Income tax | 8.0 | 15.2 | 6.2 | 2.4 | ||||||||||||
Depreciation and amortization | 5.1 | 4.0 | 5.1 | 2.0 | ||||||||||||
|
|
|
|
|
|
|
| |||||||||
EBITDA | 30.4 | 53.6 | 23.2 | 9.1 | ||||||||||||
| 4.3 | GMD |
| Year ended December 31, | ||||||||||||||||
| 2010 | 2011 | 2012 | 2012 | |||||||||||||
| (in millions of S/.) | (in millions of US$)(1) | |||||||||||||||
Net profit | 7.2 | 9.1 | 11.3 | 4.4 | ||||||||||||
Financial expense (income), net | 2.1 | 0.5 | 1.9 | 0.8 | ||||||||||||
Income tax | 3.3 | 4.8 | 5.3 | 2.1 | ||||||||||||
Depreciation and amortization | 10.8 | 17.2 | 15.9 | 6.2 | ||||||||||||
|
|
|
|
|
|
|
| |||||||||
EBITDA | 23.4 | 31.6 | 34.5 | 13.5 | ||||||||||||
48
Table of Contents
| 4.4 | CAM |
| Year ended December 31, | ||||||||||||
| 2011(2) | 2012 | 2012 | ||||||||||
| (in millions of S/.) | (in millions of US$)(1) | |||||||||||
Net profit | 17.1 | 37.5 | 14.7 | |||||||||
Financial expense (income), net | 8.5 | 3.8 | 1.5 | |||||||||
Income tax | (0.2 | ) | (5.9 | ) | (2.3 | ) | ||||||
Depreciation and amortization | 10.9 | 18.5 | 7.2 | |||||||||
|
|
|
|
|
| |||||||
EBITDA | 36.4 | 53.9 | 21.1 | |||||||||
| (1) | Includes the results of operations of CAM since February 24, 2011. See “Management’s Discussion and Analysis of Financial Condition and Results of Operations—Factors Affecting Our Results of Operations—Acquisitions” and note 28 to our consolidated financial statements included in this prospectus. |
| (2) | Calculated based on an exchange rate of S/.2.551 to US$1.00 as of December 31, 2012. |
49
Table of Contents
MANAGEMENT’S DISCUSSION AND ANALYSIS OF FINANCIAL
CONDITION AND RESULTS OF OPERATIONS
The following discussion should be read in conjunction with our consolidated financial statements for 2010, 2011 and 2012 included in this prospectus. Our consolidated financial statements included in this prospectus have been prepared in accordance with IFRS issued by the IASB. The following discussion contains forward-looking statements that involve risks and uncertainties. Our actual results may differ materially from those discussed in the forward-looking statements as a result of various factors, including, without limitation, those set forth under “Forward-Looking Statements” and “Risk Factors.”
Overview
We are the largest engineering and construction company in Peru, and the largest publicly traded engineering and construction company in Latin America as measured by market capitalization as of December 31, 2012, with strong complementary businesses in infrastructure, real estate and technical services. With 80 years of operations, we have a long track record of successfully completing the engineering and construction of many of the country’s landmark private and public sector infrastructure projects. Beginning in the mid-1980s, we decided to leverage our engineering and construction expertise into complementary lines of business. We have also undertaken the engineering and construction of large and complex projects outside our home market throughout our history. More recently, we decided to expand our activities into other key markets of the Latin American region through the acquisition of businesses with solid positions in those markets.
Factors Affecting Our Results of Operations
General
Peruvian and Chilean Economic Conditions
Approximately 95.4%, 85.6% and 82.8% of our revenues in 2010, 2011 and 2012 were derived from activities in Peru. Accordingly, our results of operations are substantially affected by economic conditions in the country and our growth is driven in significant part by growth in the Peruvian economy. In addition, approximately 7.5% and 12.5% of our revenues in 2011 and 2012 were derived from activities in Chile, primarily as a result of the acquisition of CAM in February 2011, and we expect our percentage of Chilean revenues to continue to grow as a result of our acquisition of Vial y Vives in November 2012.
The Peruvian economy has been one of the fastest growing economies globally, with the Peruvian real GDP growing at an average rate of 7.3% during the three years from 2010 to 2012 as a result of, among other factors, robust domestic demand and increased private and public investment. With increasing disposable income and an expanding middle class, private consumption grew at an average annual rate of 6.0% in real terms from 2010 to 2012. Also, during this period, private investment increased at an average annual rate of 16.2% in real terms, driven by an increase in projects primarily in the mining, oil and gas, energy, transportation, telecommunications and manufacturing sectors. Inflation in Peru, as measured by the change in the consumer price index, was 2.1% in 2010, 4.7% in 2011 and 2.6% in 2012. The nuevo sol appreciated versus the U.S. dollar by 2.8%, 4.0% and 5.4% in 2010, 2011 and 2012. Given its recent performance with regard to fiscal balance, debt/GDP ratio, net reserves and high liquidity, Peru’s sovereign debt is rated investment grade and was upgraded to BBB by S&P and Fitch in August 2011 and October 2011, respectively, and to Baa2 by Moody’s in August 2012. According to the Economist Intelligence Unit (EIU), the Peruvian economy is projected to grow at rates of 6.2% and 6.0% in 2013 and 2014, respectively.
The Chilean economy grew at an average annual rate of 5.8% during the three years from 2010 to 2012 in real terms, mainly driven by strong domestic demand. Private consumption grew at an average annual rate at 8.2% in real terms during the three years from 2010 to 2012, and total fixed investment grew at an annual average rate of 13.6% in real terms during this period. Inflation in Chile, as measured by the change in the consumer price index, was 3.0% in 2010, 4.4% in 2011 and 1.5% in 2012. The Chilean peso fluctuated versus the U.S. dollar, increasing by 7.5% in 2010, decreasing by 11.3% in 2011, and increasing by 8.2% in 2012. Chilean sovereign debt was rated A+ by Fitch in February 2012, AA- by S&P in December 2012 and Aa3 by Moody’s in December 2012, the highest sovereign debt ratings in Latin America. According to the Economist Intelligence Unit (EIU), the Chilean economy is projected to grow at rates of 4.7% and 4.9% in 2013 and 2014, respectively.
50
Table of Contents
Fluctuations in Exchanges Rates
In 2012, approximately 36.1%, 51.7% and 12.2% of our revenues were denominated in nuevo soles, U.S. dollars and other currencies (principally Chilean pesos), respectively, while 55.3%, 31.2% and 13.5% of our cost of sales during the year were denominated in nuevo soles, U.S. dollars and other currencies. In addition, as of December 31, 2012, 6.9%, 86.3% and 6.8% of our total debt was denominated in nuevo soles, U.S. dollars and other currencies, respectively. Accordingly, fluctuations in the value of these currencies can materially affect our results of operations. When the nuevo sol appreciates against the U.S. dollar, our operating margins tend to decrease; when the nuevo sol depreciates against the U.S. dollar, our operating margins tend to increase. Conversely, the appreciation of the nuevo sol against the U.S. dollar decreases our indebtedness and financial expenses as expressed in nuevos soles; and the depreciation of the nuevo sol against the U.S. dollar increases our indebtedness and financial expenses as expressed in nuevos soles. We enter into derivatives, from time to time, to hedge part of our financial exposure to currency fluctuations.
Cost of Labor, Third Party Services and Inputs
The largest components of our costs are: labor, which in 2012 represented 32.3% of our cost of sales and 48.8% of our administrative expenses; services provided by third parties, which in 2012 represented 30.7% of our cost of sales and 20.0% of our administrative expenses; and inputs (including raw materials), which in 2012 represented 25.2% of our cost of sales. For a breakdown of our cost of sales and administrative expenses, see note 23 to our consolidated financial statements included in this prospectus.
Our cost of labor is influenced by, among other factors, the number of our employees, as well as inflation, competition we face for personnel in each of our business segments and the availability of qualified candidates. From 2010 to 2011 our personnel charges increased by 77.1%, and from 2011 to 2012 our personnel charges increased 38.1%. Services provided by third parties include: subcontracting in our E&C segment, such as carpentry work; advisory and consultancy work, including external audit and legal services; and renting of equipment. From 2010 to 2011 our costs related to services provided by third parties increased by 53.4%, and from 2011 to 2012 our costs related to services provided by third parties increased by 0.7%. The principal inputs we use are fuel, cement and steel, which in the aggregate represented a majority of our total input costs in 2012. Our costs for these inputs are affected by, among other factors, the growth of our operations, market prices, including global prices in the case of fuel, and transportation costs. We do not have long-term contracts for the supply of our key inputs. From 2010 to 2011, our input costs increased by 258.1%, and from 2011 to 2012 our input costs increased by 46.5%. These increases in our costs during the years from 2010 to 2012 were primarily due to our acquisition of CAM in February 2011 and high organic growth in our business. Excluding the acquisition of CAM, our personnel charges, costs related to services provided by third parties and input costs in the aggregate increased by 57.5% in 2011 and by 28.4% in 2012.
Acquisitions
We acquired a 75.0% interest in CAM in February 2011 for US$10.8 million, after post-closing adjustments. Accordingly, CAM’s results are not reflected in our results of operations for 2010, only 10 months performance is reflected in 2011 and a full year performance is reflected in 2012. In 2012, CAM represented 12.1% of our consolidated revenues, 3.3% of our consolidated gross profit and 6.7% of our consolidated operating profit. The inclusion of CAM has increased our revenues and diversified our company in geographic terms; however, it has also impacted our consolidated gross margins as CAM’s gross margins tend to be significantly lower than those of our other business lines, reducing our consolidated gross margin by 160 basis points in 2011 and 110 basis points in 2012. In 2011, as a result of the excess of the fair value of the assets and liabilities we acquired in the CAM acquisition over the consideration paid, we recognized a gain of S/.45.2 million, which is reflected in “gain from business combination.” In 2012, we reversed provisions amounting to S/.75.9 million relating to labor and tax contingencies and trade liabilities that we had reflected on our balance sheet in connection with the CAM acquisition because we determined that the underlying contingencies and liabilities had become remote, expired or been resolved; these reversals are reflected under “other income (expenses).” For further information, see notes 25 and 28(c) to our consolidated financial statements included in this prospectus.
51
Table of Contents
In addition, we acquired a 74.0% interest in Vial y Vives in October 2012 for US$55.6 million. Accordingly, Vial y Vives’ results have not been fully reflected in our historical results of operations for 2012. We expect the acquisition of Vial y Vives to further increase and diversify our revenues, in addition to complementing our expertise in the E&C mining sector; however, the historic operating margins of Vial y Vives have tended to be lower than those of our E&C segment because of its relatively higher administrative expenses.
Engineering and Construction
The principal driver of our E&C results is economic growth in Peru, particularly private and public investment in the country’s mining, power, oil and gas, transportation, real estate and other infrastructure sectors. See “—Peruvian and Chilean Economic Conditions.”
Appropriate pricing and budgeting of our engineering and construction projects is also key to our results of operations in our E&C segment and can be affected by such factors as competition, direct negotiations with clients as opposed to competitive bidding processes, the accuracy of our estimation of project costs and unexpected cost overruns. The types of contracts in this segment consist of cost-plus fee, unit price, lump-sum and EPC contracts. For a description of our E&C contracts, see “Business—Engineering and Construction—Contracts.” The nature of our contractual arrangements can affect our margins, both because, depending on the type of contract, the burden of cost overruns may be placed on the client or on us, and because certain contractual arrangements tend to have lower gross margins. For the years from 2010 to 2012, our E&C segment has trended towards contractual arrangements that pose less risk for us (i.e., cost-plus fee and, to a lesser extent, unit price), which provide more stability to our results but lower gross margins. For 2010, approximately 9.8%, 66.8%, 23.4% and 0% of our E&C revenues were derived from cost-plus fee, unit price, lump-sum and EPC contracts, respectively, 23.9%, 61.7%, 14.2% and 0.2% in 2011 and 37.9%, 48.5%, 5.0% and 8.6% in 2012. The types of contractual arrangements we enter into in our E&C segment vary significantly from year to year.
Infrastructure
Traffic and Fees for Toll Roads
The majority of our toll roads revenues derive from the Norvial concession. Unlike our other toll road concessions, our revenues from the Norvial concession depend on traffic volume. Traffic volume on the Norvial road increased 10.6% from 2010 to 2011 and 7.4% from 2011 to 2012 (based on vehicle equivalents, as defined in “Business—Infrastructure—Principal Infrastructure Activities—Toll Roads—Norvial”) and such increases are largely driven by economic activity levels in Peru. For the Norvial toll road, the toll rate is set out in the Norvial concession agreement and adjusted in accordance with a contractual formula that takes into account the nuevo sol/U.S. dollar exchange rate and Peruvian and United States inflation. Under our Survial and Canchaque road concessions, our revenues consist of annual fees paid by the Peruvian Ministry of Transport and Communications in consideration for the operation and maintenance of the roads, which can vary depending on the amount of road maintenance required due to road wear and tear.
Under the Norvial concession, we are required to expand certain stretches of the highway, by, among other things, adding two additional lanes. The first stage of construction was completed in 2008 and the second stage is expected to begin between 2014 and 2015. We estimate that Norvial’s capital investment for the second stage will be approximately US$100 million.
Mass Transit
We generate revenue from our Lima Metro concession based on kilometers travelled per train, with the fee per kilometer, the number of trains required to be in operation and the number of kilometers that we are required to travel established by the terms of the concession. Our revenues do not depend on passenger traffic volume. Our results in this concession are directly influenced by the timely acquisition, set up, reliability and proper operation of our trains as well as by the timing of the government’s completion of the 12.4 kilometer second stretch of Line One (which is being constructed by a joint operation in which our E&C segment participates). In the second half of 2011, we incurred expenses during the pre-operation phase of the Lima Metro, a period during which we did not generate revenues. In 2012, we generated losses as a result of the limited number of trains (five) we initially operated.
52
Table of Contents
However, we expected losses during the first year of operation of the Lima Metro and, as required by the concession, we have ordered 19 new trains and expect to generate profits once additional trains are in operation. We are scheduled to receive the new trains on a periodic basis and expect to have all trains (24) in operation by the third quarter of 2014. In addition, according to the government, the second stretch of Line One of the Lima Metro is expected to be completed by the third quarter of 2014.
We estimate that GyM Ferrovías will make a total of S/.830 million (US$325 million) in capital expenditures in connection with the Lima Metro. As of December 31, 2012, GyM Ferrovías had spent S/.315 million (US$124 million) of this amount. We expect to finance the additional capital expenditures required for the Lima Metro with a combination of cash from operations and the incurrence of indebtedness.
Energy
A significant part of the revenues in our Infrastructure segment depends on global prices for oil. Under our hydrocarbon extraction service contracts, we are entitled to a variable fee, which is based on the level of production of each field and a basket of international crude oil prices. Historically, oil prices have been volatile and are likely to be volatile again in the future. During 2010, 2011 and 2012, average Brent crude prices were approximately US$80, US$111 and US$112 per barrel and the average fee we received in these years was US$58.59, US$83.90 and US$86.13 per barrel of extracted oil, respectively. Because our activities are conducted in mature oil fields, which have been producing oil for over 100 years in the case of Block I and over 50 years in the case of Block V, our oil production depends primarily on the level of our capital expenditures undertaken for drilling and production purposes.
Our gas processing plant has a long-term delivery and gas processing and fractionation contract with Empresa Eléctrica de Piura S.A. (“EEPSA”), a thermal power generation subsidiary of the Endesa group. Under the contract, EEPSA delivers wet natural gas that it purchases from onshore and offshore gas operators in the area. We are responsible for all operating costs of the gas processing plant but are entitled to keep revenues from the sale of all resulting natural gas liquids to third parties after delivery of all dry gas and payment of a variable royalty to EEPSA. Volumes processed by our gas processing plant depend upon gas volumes demanded by EEPSA for its gas-fired turbines, which can vary significantly. Prices for natural gas liquids can also fluctuate significantly and are affected by market prices for crude oil.
In connection with our fuel storage terminal business, under a contract with Petroperú S.A. (“Petroperú”), we receive revenues related to monthly reserved volume in storage tanks for refined crude products (storage fee) and for volumes loaded and delivered into railroad cars or cistern trucks to each terminal (throughput fee). These fees are adjusted annually to account for U.S. inflation. Our fuel storage activities are carried out under a 15-year contract, which expires in August 2014.
Awarding and Timing of Infrastructure Concessions and Government Contracts
The results of operations of our Infrastructure segment are affected by our ability to win new concessions and government contracts, which depend in part on government policies and our ability to compete effectively. We currently have five concessions as well as long-term government contracts in this segment. Joint operations in which we participate have been awarded concessions, and are currently negotiating contracts for, the expansion of two major highways within the city of Lima. If we are able to enter into satisfactory contracts, we believe these concessions will significantly increase the results of operations of our Infrastructure segment. However, we cannot assure you that we will be able to negotiate these contracts on favorable terms or at all. In addition, our government contract to operate nine fuel storage terminals is scheduled to expire in August 2014, and we cannot assure you that it will be extended on favorable terms or at all.
Our results in our Infrastructure segment are also affected by the timing of the commencement of operations under our concessions, as well as when we are required to undertake significant capital investments or major construction works under the terms of our concessions. Under our Norvial and Lima Metro concessions, we are required to undertake capital investments during the initial years of the concessions for which we are compensated throughout the term of the concessions by our toll rate in the case of the Norvial concession and tariffs in the case of the Lima Metro concession. Under our Survial, Canchaque and La Chira concessions, we generate revenues in our
53
Table of Contents
Infrastructure segment from our construction activities during the pre-operational phase, and once operations commence we generate revenues from fees related to operation and maintenance. Survial, Canchaque and La Chira have financed their construction costs through the sale of government certificates of construction to financial institutions at a discount from face value. Certificates of construction are negotiable instruments that the Peruvian government typically delivers upon completion of each stage of a project and which entitle the holder to receive payment from the government equal to the capital investment made in the corresponding stage upon completion of the entire project. Accordingly, the results of our Infrastructure segment may be affected by the discount rates obtained on the sale of government certificates of construction. For more information on our obligations and compensation under our concessions, see “Business—Infrastructure.”
Real Estate
The results of operations of our Real Estate segment are driven by the number of units we develop and deliver in a reporting period, our mix of unit sales (affordable housing versus housing), unit prices, land purchase prices and our costs of construction. These results are also affected by a number of factors that may impact the Peruvian real estate sector as a whole, including: the availability of government subsidies for affordable housing; prices of suitable land in particular areas; regulation of real estate development imposed by national, regional and local laws and regulators, and the time required to obtain applicable construction permits and licenses; the unemployment rate and wage levels; prevailing interest rates and availability of financing; the supply in the market; the level of customer interest in our new projects; and our costs, such as the price of labor, materials, insurance, taxes and other public charges. We delivered 2,142, 1,244 and 1,368 units in 2010, 2011 and 2012, respectively.
The results of operations of our Real Estate segment are also significantly affected by our sales of land parcels. Due to the appreciation of land prices in Peru, and because we record our land holdings at book value (i.e., without marking to market), our recent land sales have resulted in high margins.
In addition, the net profit attributable to controlling interests of our Real Estate segment is significantly affected by the financing and commercial arrangements we use to purchase land and to develop real estate projects. Depending on the level of non-controlling interests used to finance our real estate projects, our Real Estate segment tends to have significant net profit attributable to non-controlling interests. See “—Results of Operations—General—Real Estate.”
Technical Services
The results of operations of our Technical Services segment, especially our activities relating to IT and electricity networks services, are affected by the economic growth of the countries in which we operate. As companies expand in response to economic growth, they tend to outsource certain activities in order to focus on their core businesses.
Our results in the operation and maintenance of infrastructure assets depend on our ability to obtain contracts from the government or infrastructure concessionaires, such as those in our Infrastructure segment, which depend on government policies and our ability to compete effectively. We obtained three public-sector road contracts at the end of 2010 as well as three new public-sector road contracts at the end of 2012, which we expect to result in an increase of our revenues in our Technical Services segment during 2013. We typically obtain higher revenues from these contracts during the commencement of services as we bring the road to proper operating condition.
Critical Accounting Estimates and Judgments
Estimates and judgments used in connection with the preparation of our financial statements are continuously evaluated and are based on historical experience and other factors, including expectations of future events that are believed to be reasonable under the circumstances.
Critical Accounting Estimates and Assumptions
We make estimates and assumptions concerning our future. The resulting accounting estimates will, by definition, seldom equal the related actual results. However, our management considers that the estimates and assumptions used in connection with the preparation of our consolidated financial statements included in this prospectus do not have a significant risk of causing a material adjustment to the balances of assets and liabilities in subsequent years.
54
Table of Contents
Percentage-of-Completion Revenue Recognition
Revenue from construction contracts is recognized under the percentage-of-completion method which requires the final margin from construction contracts to be estimated. Projections of these margins are performed by our management based on work execution budgets and adjusted periodically based on updated information reflecting the actual performance of work. In this regard, our management considers that the estimates made as of December 31, 2012 are reasonable.
As of December 31, 2010, 2011 and 2012, a sensitivity analysis was performed considering a 10% increase or decrease in our gross margin (i.e., gross profit as a percentage of revenues). As of December 31, 2012, a 10% positive or negative change in our gross margin would result in a S/.37.2 million increase or decrease, respectively, in our profit before taxes.
Goodwill Impairment Reviews
Impairment reviews are undertaken annually, or more frequently if there is a triggering event, to determine if goodwill arising from business acquisitions has suffered any impairment. For this purpose, goodwill is attributed to the different cash-generating units to which it relates. The recoverable amount of the cash-generating units has been determined based on its value-in-use calculations. This evaluation requires the exercise of our management’s professional judgment to analyze any potential indicators of impairment as well as the use of estimates in determining the value-in-use, including the preparation of future cash flows, macro-economic forecasts as well as defining the interest rate at which said cash flows will be discounted.
As of December 31, 2012, based on the impairment testing performed by our management, no goodwill impairment losses were required to be recognized because the recoverable amount of the cash-generating units subject to testing was substantially higher than their related carrying amounts.
Taxes
Determination of the tax obligations and expenses requires interpretations of the applicable tax laws and regulations. We seek legal tax counsel’s advice before making decisions on tax matters. Although our management considers its estimates to be prudent and appropriate, differences of interpretation may arise with the Peruvian tax authorities which may require future tax adjustments.
Provision for Well Closure Costs
We estimate the present value of our future obligation for well closure costs and increase the carrying amount of the asset that will be withdrawn in the future and that is reflected under “intangibles” in our balance sheet. Subsequently, this liability is attributed to profit or loss during the useful life of the assets that gave rise to it. The well closure liability is adjusted to reflect the changes that resulted from the passage of time and from revisions of either the date of occurrence or the amount of the present value of the obligations originally estimated.
During 2012, we recorded an additional S/.4.9 million, charged to the intangible asset account, credited to the well closure liability. This is to reflect estimated obligations to close 70 productive wells included in the service agreements for Blocks I and V. This provision is increased monthly, charged to results, on an incremental value basis.
Critical Judgments in Applying Accounting Policies
CAM Acquisition
Under IFRS 3, an entity recognizes a profit on an acquisition when the fair value of the assets acquired, net of the liabilities assumed exceeds the consideration paid. This accounting standard presumes that recognition of a profit on
55
Table of Contents
a business acquisition is unusual; therefore, it requires the buyer to review the determination of the fair values of the acquired assets, liabilities and price paid before recognizing any gains. Furthermore, IFRS 3 authorizes a review period of 12 months from the acquisition date for an entity to adjust the determination of the fair values of the acquired assets and liabilities and, accordingly, adjust the goodwill or gain generated from the acquisition, as applicable.
On February 24, 2011, we acquired CAM and, as a result of the process of allocating the purchase price paid, the fair value of the assets acquired, net of the liabilities assumed, was determined to have exceeded the consideration paid by S/.45.2 million. At the date of issue of the financial statements, the 12-month period requirement for fair value review had been met and our management considers that it has reasonably reviewed the values attributable to the assets and liabilities of the business acquired; accordingly, it has completed the process of allocating the consideration paid, and has therefore, recognized the above-mentioned profit on acquisition in the year-end profit or loss.
Estimated Useful Life of Machinery and Equipment
We review on an annual basis the useful lives of our machinery and equipment. The evaluation of the useful lives is made based on the hours of use and is performed by our applicable technical internal area. This estimation of work hours is performed based on historical data considering the estimated productive capacity of the asset and is expressed in a rate per unit of production or hour. Our management determined not to change the useful life during 2012 because, based on its own assessments, the useful lives already reflected the current economic conditions of our operating environment.
New Accounting Pronouncements
The following standards, which have been issued but were not yet effective during 2012, are relevant to our activities:
| • | IFRS 7, “Financial Instruments: Disclosures” as amended in October 2010 modifies the disclosures required so that the users of the financial statements may assess the risk exposure related to financial asset transfers and the effect of this risk on the entity’s financial position. For us, this amendment came into effect on January 1, 2013. |
| • | IFRS 9, “Financial Instruments,” addresses the classification, measurement and recognition of financial assets and financial liabilities. It replaces the parts of International Accounting Standard (“IAS”) 39 that relate to the classification and measurement of financial instruments. IFRS 9 requires financial assets to be classified into two measurement categories: those measured at fair value and those measured at amortized cost. The classification depends on the entity’s business model for managing its financial instruments and the contractual cash flow characteristics of the instrument. For financial liabilities, the standard retains most of the IAS 39 requirements. Application of IFRS 9 will be mandatory from January 1, 2015. |
| • | IFRS 10, “Consolidated Financial Statements,” replaces IAS 27 and Standing Interpretations Committee (“SIC) 12 and builds on existing principles by identifying the concept of control as the determining factor in whether an entity should be included within the consolidated financial statements of the parent company. The standard provides additional guidance to assist in the determination of control where this is difficult to assess. IFRS 10 came into effect on January 1, 2013. |
| • | IFRS 11, “Joint Arrangements,” which replaces IAS 31, amends the classification of joint arrangements in only two categories (joint operations and joint ventures), depending on whether the investors have contractual rights and obligations on the assets and liabilities of the arrangement (joint operation) or whether investors have a residual right on the equity of the arrangement (joint venture). This standard discontinues the application of proportional consolidation method. IFRS 11 came into effect on January 1, 2013. |
56
Table of Contents
| • | IFRS 12, “Disclosures of Interests in Other Entities” includes the disclosure requirements for all forms of interests in other entities, including joint arrangements, associates, special purpose vehicles and other off-balance sheet vehicles. IFRS 12 came into effect on January 1, 2013. |
| • | IFRS 13, “Fair Value Measurement,” aims to improve consistency and reduce complexity by providing a precise definition of fair value and a single source of fair value measurement and disclosure requirements for use across IFRS. The requirements do not extend the use of fair value accounting but provide guidance on how it should be applied where its use is already required or permitted by other standards within IFRS. IFRS 13 came into effect on January 1, 2013. |
| • | Amendment to IAS 1, “Presentation of Financial Statements” relating to other comprehensive income requires for entities to group the items of “other comprehensive income” depending on whether they are reclassificable or not to the statement of comprehensive income. These amendments do not specify which items should be included in “other comprehensive income.” For us, this standard came into effect on January 1, 2013. |
| • | IAS 19, “Employee Benefits” was amended in June 2011 by the IASB. The amendments eliminate the corridor approach and recognize financial expenses on a net basis. This amendment came into effect on January 1, 2013. |
| • | IAS 27, “Separate Financial Statements” was amended in May 2011 by the IASB. The new standard includes the alignment of the separate financial statements which remain effective once the provisions of control were included in Normas Internacionales de Información Financiera (NIIF) 10. For us, this standard came into effect on January 1, 2013. |
| • | IAS 28, “Investments in Associates and Joint Ventures” was amended in May 2011 by the IASB. The new standard includes guidelines to recognize joint ventures and associates under the equity method of accounting. This standard became effective for us on January 1, 2013. |
We have carried out an initial assessment of the impact of these new standards on our financial position and results. The adoption of IFRS 11 required a more detailed analysis of the effect, given our participation in several joint operations. However, after such initial assessment, management considers that the standard will not have a material impact on our financial position or performance because we have joint controlled operations and do not apply the proportional consolidation method, as defined under IFRS 11. The other standards described above will only affect certain disclosures in the financial statements. There are no other IFRS or the International Financial Reporting Interpretations Committee (IFRIC) interpretations that are not yet effective that would be expected to have a significant impact on our financial statements.
Results of Operations
General
Accounting for Subsidiaries, Joint Operations and Associated Companies
Results of our subsidiaries, joint operations and associated companies are reflected in our financial results. We refer to our subsidiaries as those entities over which we exercise control. We consolidate the results of our subsidiaries in our financial statements and we reflect the profit corresponding to the minority interests in our subsidiaries under “profit attributable to non-controlling interests” in our income statement. We refer to our joint operations as enterprises in which we share control with unrelated entities. We proportionally consolidate (on a line-by-line basis) the results of our joint operations in our financial statements. We refer to our associated companies as those entities over which we have significant influence but do not control. We reflect the results of our associated companies under the equity method of accounting in our financial statements under the line item “share of the profit and loss in associates” in our income statement. For further information, see note 2.2 to our consolidated financial statements included in this prospectus.
57
Table of Contents
On March 1, 2012, as a result of our acquisition of control of Stracon GyM, we began to consolidate Stracon GyM’s results and reflect net profit attributable to the non-controlling interests with respect to the other owner of the company in our income statement. Prior to that date, the business operated by Stracon GyM was a joint operation, and, accordingly, we proportionately consolidated its results in our financial statements and did not reflect any non-controlling interests. For further information, see notes 25 and 28(b) to our consolidated financial statements included in this prospectus.
Intersegment Transactions
Some of our segments from time to time provide services to our other segments. In 2012, we obtained 2.2% of the revenues in our E&C segment from the engineering design of La Chira waste water treatment plant for our Infrastructure segment and the construction of real estate for our Real Estate segment; 35.4% of the revenues in our operation and maintenance of infrastructure assets line of business derived from services provided to Norvial, Survial, Canchaque and the Lima Metro; and 2.7% of the revenues in our IT services line of business derived from IT and outsourcing services provided to several of our other lines of businesses. Accordingly, in such circumstances, the segment providing services recognizes revenues and the segment receiving such services recognizes costs of sales relating to the services provided. For example, in the case of La Chira, in which our E&C segment provides services to our Infrastructure segment, our E&C segment recognizes revenues and our Infrastructure segment recognizes costs of sales with respect to the fees charged by our E&C segment for those services. In consolidation, these intersegment revenues and cost of sales are eliminated in our financial results. Nonetheless, our Infrastructure segment, in particular, may recognize gross profits or losses based on the difference between the fees the segment charges in accordance with concession terms and costs it incurs relating to services provided by our other segments. For more information on our segments, see note 5 to our consolidated financial statements included in this prospectus.
Engineering and Construction
We obtain revenues in our E&C segment from the engineering and construction services we provide to our clients, which we recognize under the percentage-of-completion method of accounting. For further information, see note 2.25 to our consolidated financial statements included in this prospectus. We receive unrestricted client advances in a substantial majority of our E&C projects, on average equal to approximately 30% of the contract price, which we record as an account payable. We typically invoice our clients on a periodic basis as each project progresses, deducting from the related advances on a proportional basis. For further information, see note 18 to our consolidated financial statements included in this prospectus. Our cost of sales in our E&C segment includes labor, subcontractor expenses, materials, equipment, and project-specific general expenses.
Infrastructure
In our Infrastructure segment, we recognize revenues and cost of sales as follows:
(1) Toll Roads:
| • | For Norvial, we obtain revenues for toll fees collected, minus deductions required to be transferred to the government as described in “Business—Infrastructure—Principal Infrastructure Activities—Toll Roads—Norvial,” which we recognize upon receipt. Cost of sales for Norvial include fees paid to third parties (primarily our subsidiary Concar) for operation and maintenance services as well as the amortization of the road concession; and |
| • | For Survial and Canchaque, we obtain revenues for routine and periodic maintenance services, which we recognize in the period in which the services are performed. Cost of sales for Survial and Canchaque include fees paid to third parties (primarily our subsidiary Concar) for operation and maintenance services. We do not recognize the Survial and Canchaque concessions as intangible assets and therefore do not amortize the concessions. |
For further information, see notes 2.15(c) and 15 to our consolidated financial statements included in this prospectus.
58
Table of Contents
(2) Mass Transit: We obtain revenues from our Lima Metro concession based on a tariff per kilometer traveled by our trains in operation in accordance with a schedule established in our concession agreement, which we recognize in the period in which the services are performed. Under the concession, the tariff is comprised of three components: (i) fees related to our operation and maintenance services; (ii) fees related to the Peruvian government’s repayment of the amounts we invest to purchase trains and other infrastructure for the Peruvian government; and (iii) fees related to interest we charge the Peruvian government in connection with the amounts we invest to purchase such trains and other infrastructure. We only recognize in our income statement the portion of the tariff that relates to items (i) and (iii). We record the amounts paid by us that relate to item (ii) as long-term accounts receivables from the Peruvian government. Accordingly, tariff payments received relating to item (ii) reduce our accounts receivables but do not impact our income statement, and we do not amortize our investments in our income statement as our investment in the concession is recorded as an account receivable with the government rather than a depreciable investment. For further information, see note 8 to our consolidated financial statements included in this prospectus. Cost of sales for the Lima Metro include fees paid to third parties (primarily our E&C segment, our subsidiary Concar and other subcontractors) for construction and operation and maintenance services, energy, and our financing costs related to the purchase of trains.
(3) Water Treatment: Beginning in March 2012, we obtained revenues from the engineering design of La Chira waste water treatment plant, which we recognize based on the percentage-of-completion method of accounting. Once the plant begins operations, which is expected to occur at the beginning of 2015, we will obtain revenues only for operation and maintenance services, which we will recognize in the period in which the services are performed. During the construction phase, cost of sales for La Chira includes fees paid to third parties, primarily our E&C segment, for engineering and construction services. During the operation phase, cost of sales for La Chira will include personnel charges and maintenance of infrastructure.
(4) Energy: We obtain revenues from extraction services related to oil and gas production, fuel storage services, and the sale of natural gas liquids derived from our gas processing and fractionation services, which we recognize in the period in which the services are performed and, in the case of sale of natural gas liquids, when the sale is made. Cost of sales for our energy line of business includes labor, materials, amortization of oil wells, depreciation of the gas plant, maintenance and general expenses.
Real Estate
We obtain revenues in our Real Estate segment from sales of affordable housing and housing units, commercial buildings and land parcels, which we recognize at the time of delivery of the unit or building and, in the case of land parcels, at the time of the sale. We typically pre-sell our affordable housing and housing units prior to and during construction, and use the related proceeds we receive to finance the construction of the units. These pre-sale funds are restricted and released from escrow to us periodically as construction progresses. Our Real Estate cost of sales includes the cost to purchase land, costs of architectural design and construction (which usually includes payments to third parties, primarily our E&C segment), licensing and permit costs, personnel costs, and fees to third parties related to sanitation or electrical engineering. We recognize land purchases as inventory, and, accordingly, do not mark-to-market the value of our land for changes in fair value. For further information, see note 12 to our consolidated financial statements included in this prospectus.
In our Real Estate segment, we have significant net profit attributable to non-controlling interests. We hold a significant portion of our land bank through Almonte in which we have a 50.4% interest, and we consolidate Almonte’s results in our financial statements. In addition, we undertake a significant number of our real estate projects through entities in which we may have a majority interest, co-equal interest or minority interest; when we have control over these entities, we consolidate their results in our financial statements regardless of whether we own a majority of the capital. Furthermore, in connection with our affordable housing projects, we generally partner with real estate investment funds and insurance companies that provide between 60% and 70% of the total capital required to purchase the land and cover certain pre-construction costs in exchange for equity in the project. Although we typically own a minority interest in these projects, we consolidate their results in our financial statements because we exercise control over the project. Accordingly, we reflect the profit corresponding to our real estate partners under net profit attributable to non-controlling interests in our income statement. See “Accounting for Subsidiaries, Joint Operations and Associated Companies.”
59
Table of Contents
Technical Services
In our Technical Services segment, we recognize revenues and cost of sales as follows:
(1) Operation and Maintenance of Infrastructure Assets: We obtain revenues from our operation and maintenance of infrastructure assets line of business for the operation and maintenance services we provide to the government and concessionaires (currently concessions within our Infrastructure segment), which we recognize in the period in which the services are performed. We receive unrestricted advances with respect to our service contracts with the government, that vary from approximately 10% to 30% of the contract price, which we record as an account payable. We typically invoice our clients on a periodic basis as the project progresses, deducting from the related advances on a proportional basis. For further information, see note 18 to our consolidated financial statements included in this prospectus. Our cost of sales in this line of business includes personnel costs, services provided by third parties, machinery and other materials (primarily trucks), and depreciation of equipment utilized to provide services.
(2) IT Services: We obtain revenues from our IT services line of business for IT and outsourcing services we perform for government and private sector clients, which we recognize in the period in which the services are performed. Our IT services cost of sales includes personnel costs, services provided by third parties, equipment and other materials, depreciation of equipment utilized to provide services, and amortization of software.
(3) Electricity Networks Services: We obtain revenues from the electrical services we provide to our clients, which we recognize in the period in which the services are performed. Our cost of sales in this line of business includes personnel costs, services provided by third parties, machinery and other materials (primarily trucks and meters), and depreciation of equipment utilized to provide services.
Comparison of Results of Operations for 2011 and 2012
The following table sets forth the components of our consolidated income statement for 2011 and 2012.
| Year ended December 31, | ||||||||||||
| 2011 | 2012 | Variation | ||||||||||
| (in millions of S/.) | % | |||||||||||
Revenues | 4,241.3 | 5,231.9 | 23.4 | |||||||||
Cost of sales | (3,609.5 | ) | (4,519.8 | ) | 25.2 | |||||||
|
|
|
|
|
| |||||||
Gross profit | 631.7 | 712.1 | 12.7 | |||||||||
Administrative expenses | (199.6 | ) | (257.2 | ) | 28.9 | |||||||
Other income (expenses) | 4.3 | 75.9 | 1,665.1 | |||||||||
Profit from the sale of investments | 4.8 | — | N/M | |||||||||
Other (losses) gains, net | (2.8 | ) | (0.3 | ) | (89.3 | ) | ||||||
Gain from business combination | 45.2 | — | N/M | |||||||||
|
|
|
|
|
| |||||||
Operating profit | 483.6 | 530.6 | 9.7 | |||||||||
Financial (expense) income, net | (6.2 | ) | (10.3 | ) | 66.1 | |||||||
Share of profit and loss in associates | 0.2 | 0.6 | 200.0 | |||||||||
|
|
|
|
|
| |||||||
Profit before income tax | 477.6 | 520.8 | 9.0 | |||||||||
Income tax | (141.4 | ) | (154.6 | ) | 9.3 | |||||||
|
|
|
|
|
| |||||||
Net profit | 336.2 | 366.3 | 9.0 | |||||||||
Net profit attributable to controlling interest | 289.1 | 290.0 | 0.3 | |||||||||
Net profit attributable to non-controlling interest | 47.1 | 76.3 | 62.0 | |||||||||
Revenues
Our total revenues increased by 23.4%, or S/.990.6 million, from S/.4,241.3 million for 2011 to S/.5,231.9 million for 2012. This increase was due to growth in each of our business segments, particularly our E&C segment.
60
Table of Contents
The following table sets forth a breakdown of our revenues by segment for 2011 and 2012.
| Year ended December 31, | ||||||||||||||||||||
| 2011 | 2012 | Variation | ||||||||||||||||||
| (in millions of S/.) | % of Total | (in millions of S/.) | % of Total | % | ||||||||||||||||
Engineering and Construction | 2,784.2 | 65.6 | 3,524.6 | 67.4 | 26.6 | |||||||||||||||
Infrastructure | 404.2 | 9.5 | 524.5 | 10.0 | 29.7 | |||||||||||||||
Real Estate | 152.3 | 3.6 | 240.1 | 4.6 | 57.6 | |||||||||||||||
Technical Services | 977.0 | 23.0 | 1,083.3 | 20.7 | 10.9 | |||||||||||||||
Corporate | 39.8 | 0.9 | 44.7 | 0.9 | 12.2 | |||||||||||||||
Eliminations | (116.2 | ) | (2.7 | ) | (185.2 | ) | (3.5 | ) | 59.4 | |||||||||||
|
|
|
|
|
|
|
|
|
| |||||||||||
Total | 4,241.3 | 100.0 | 5,231.9 | 100.0 | 23.4 | |||||||||||||||
Cost of Sales
Our total cost of sales increased by 25.2%, or S/.910.3 million, from S/.3,609.5 million for 2011 to S/.4,519.8 million for 2012. This increase was primarily related to the growth in our revenues and, to a lesser extent, an increase in costs in our Technical Services segment.
Gross Profit
Our gross profit increased by 12.7%, or S/.80.3 million, from S/.631.7 million for 2011 to S/.712.1 million for 2012. Our gross margin for 2012 was 13.6% compared to 14.9% for 2011. This decrease was primarily due to the full year impact of CAM in our Technical Services segment, which reduced our margins in that segment, changes in the mix of contracting arrangements in our E&C segment with the proportion of less risky contracts increasing, depressing our margins in that segment, and lower production and prices at our gas processing plant in our Infrastructure segment, partially offset by higher margins in our Real Estate segment. Our gross margin was adversely affected primarily due to expenses relating to the pre-operation phase of the Lima Metro during the second half of 2011, a period during which we did not generate revenues, and, in 2012, as a result of the limited number of trains we operated during the first year of operation.
The following table sets forth a breakdown of our gross profit by segment for 2011 and 2012.
| Year ended December 31, | ||||||||||||||||||||
| 2011 | 2012 | Variation | ||||||||||||||||||
| (in millions of S/.) | % of Total | (in millions of S/.) | % of Total | % | ||||||||||||||||
Engineering and Construction | 329.3 | 52.1 | 408.0 | 57.3 | 23.9 | |||||||||||||||
Infrastructure | 146.2 | 23.1 | 172.6 | 24.2 | 18.1 | |||||||||||||||
Real Estate | 45.3 | 7.2 | 86.7 | 12.2 | 91.3 | |||||||||||||||
Technical Services | 109.7 | 17.4 | 103.9 | 14.6 | (5.2 | ) | ||||||||||||||
Corporate | 2.0 | 0.3 | (0.03 | ) | 0.0 | (101.3 | ) | |||||||||||||
Eliminations | (0.7 | ) | (0.1 | ) | (59.2 | ) | (8.3 | ) | 8,357.1 | |||||||||||
|
|
|
|
|
|
|
|
|
| |||||||||||
Total | 631.7 | 100.0 | 712.1 | 100.0 | 12.7 | |||||||||||||||
Administrative Expenses
Our administrative expenses increased by 28.9%, or S/.57.6 million, from S/.199.6 million for 2011 to S/.257.2 million for 2012, primarily due to the expansion of our administrative structure to support the growth of our business in each of our segments, particularly in our E&C segment. As a percentage of revenues, our administrative expenses grew to 4.9% in 2012 from 4.7% in 2011.
61
Table of Contents
Other Income (Expenses)
Our other income (expenses) increased S/.71.6 million, from S/.4.3 million for 2011 to S/.75.9 million for 2012. This increase was primarily due to the reversal in 2012 of S/.72.8 million in provisions recognized in connection with our acquisition of CAM. In addition, in 2011, we recognized a S/.45.2 million gain from sale of business combination in connection with the excess of the fair value of the assets and liabilities acquired in the CAM acquisition over the consideration paid, which is reflected under “gain from business combination.” For further information, see “—Factors Affecting Our Results of Operations—Acquisitions” and notes 25 and 28(c) to our consolidated financial statements included in this prospectus.
Operating Profit
Our operating profit increased 9.7%, or S/.47.0 million, from S/.483.6 million for 2011 to S/.530.6 million for 2012. Our operating margin (i.e., operating profit as a percentage of revenues) was 10.1% for 2012 compared to 11.4% for 2011, reflecting the decrease in gross margin, as well as higher administrative expenses in 2012 in our E&C segment relating to our acquisition of Vial y Vives and extraordinary income in 2011 for Concar in our Technical Services segment arising from an arbitration award related to the Arequipa-Matarani road. Excluding the effects of the CAM acquisition, our operating profit increased by 8.1% and our operating margin for 2012 was 10.8% compared to 12.4% for 2011.
The following table sets forth a breakdown of our operating profit by segment for 2011 and 2012.
| Year ended December 31, | ||||||||||||||||||||
| 2011 | 2012 | Variation | ||||||||||||||||||
| (in millions of S/.) | % of Total | (in millions of S/.) | % of Total | % | ||||||||||||||||
Engineering and Construction | 227.5 | 47.0 | 247.6 | 46.7 | 8.8 | |||||||||||||||
Infrastructure | 118.3 | 24.5 | 139.7 | 26.3 | 18.1 | |||||||||||||||
Real Estate | 34.9 | 7.2 | 67.6 | 12.7 | 93.7 | |||||||||||||||
Technical Services | 89.4 | 18.5 | 72.2 | 13.6 | (19.2 | ) | ||||||||||||||
Corporate | (8.9 | ) | (1.8 | ) | 4.4 | 0.8 | 149.4 | |||||||||||||
Eliminations | 22.4 | 4.6 | (0.9 | ) | (0.2 | ) | (103.9 | ) | ||||||||||||
|
|
|
|
|
|
|
|
|
| |||||||||||
Total | 483.6 | 100.0 | 530.6 | 100.0 | 9.7 | |||||||||||||||
Business Segments
The following discussion analyzes our key results of operations on a segment basis. For further information on our business segments, see note 5 to our consolidated financial statements included in this prospectus.
Engineering and Construction
The table below sets forth selected financial information related to our E&C segment.
| Year ended December 31, | ||||||||||||
| 2011 | 2012 | Variation | ||||||||||
| (in millions of S/.) | % | |||||||||||
Revenues | 2,784.2 | 3,524.6 | 26.6 | |||||||||
Gross profit | 329.3 | 408.0 | 23.9 | |||||||||
Operating profit | 227.5 | 247.6 | 8.8 | |||||||||
Revenues.Our E&C revenues increased 26.6%, or S/.740.4 million, from S/.2,784.2 million for 2011 to S/.3,524.6 million for 2012, primarily due to a greater number of projects undertaken and an increase in average project size, driven by economic growth and increased investment in Peru. This growth in E&C revenues was driven principally by the mining, energy and oil and gas end-markets.
Gross Profit.Our E&C gross profit increased 23.9%, or S/.78.7 million, from S/.329.3 million for 2011 to S/.408.0 million for 2012. The increase in our E&C cost of sales was largely in line with our revenue growth in this
62
Table of Contents
segment. Our E&C gross margin for 2012 was 11.6% compared to 11.8% for 2011. Our E&C gross margin was affected by the trend in our contractual arrangements toward less risky contracts which provide more stable results at lower profit margins. See “—Factors Affecting Our Results of Operations—Engineering and Construction.”
Operating Profit.Our E&C operating profit increased 8.8%, or S/.20.1 million, from S/.227.5 million for 2011 to S/.247.6 million for 2012. Our E&C administrative expenses increased 53.2%, or S/.55.5 million, which resulted in administrative expenses as a percentage revenues of 4.5% for 2012 compared to 3.7% for 2011, due in part to extraordinary costs, including restructuring costs, incurred related to our acquisition of Vial y Vives. Our E&C operating profit was also impacted by S/.2.6 million in other income in 2011 and S/.0.6 million in other expenses in 2012, in each case from the sale of equipment and machinery. Our E&C operating margin for 2012 was 7.0% (7.1% excluding Vial y Vives) compared to 8.2% for 2011.
Infrastructure
The table below sets forth selected financial information related to our Infrastructure segment.
| Year ended December 31, | ||||||||||||
| 2011 | 2012 | Variation | ||||||||||
| (in millions of S/.) | % | |||||||||||
Revenues | 404.2 | 524.5 | 29.7 | |||||||||
Gross profit | 146.2 | 172.6 | 18.1 | |||||||||
Operating profit | 118.3 | 139.7 | 18.1 | |||||||||
Revenues.The table below sets forth the breakdown of our Infrastructure revenues by principal lines of business.
| Year ended December 31, | ||||||||||||
| 2011 | 2012 | Variation | ||||||||||
| (in millions of S/.) | % | |||||||||||
Toll Roads | 115.2 | 123.3 | 7.1 | |||||||||
Mass Transit | — | 73.1 | N/M | |||||||||
Water Treatment | — | 41.0 | N/M | |||||||||
Energy | 289.0 | 287.0 | (0.7 | ) | ||||||||
|
|
|
|
|
| |||||||
Total | 404.2 | 524.5 | 29.7 | |||||||||
Our Infrastructure revenues increased 29.7%, or S/.120.2 million, from S/.404.2 million for 2011 to S/.524.5 million for 2012. The variation in our Infrastructure revenues principally reflected the following:
| • | Toll Roads: a 7.1%, or S/.8.2 million, increase in revenues, from S/.115.2 million for 2011 to S/.123.3 million for 2012, primarily due to increased vehicular traffic in Norvial, which increased 7.4% from 2011 to 2012, and, to a lesser extent, the initiation of periodic maintenance services in Survial; |
| • | Mass Transit: S/.73.1 million in revenues for 2012, resulting from the initiation of operations of the Lima Metro in January 2012; |
| • | Water Treatment: S/.41.0 million in revenues for 2012, resulting from the commencement of the engineering design of La Chira waste water treatment plant in March 2012; and |
| • | Energy: a 0.7%, or S/.2.0 million, decrease in revenues, from S/.289.0 million for 2011 to S/.287.0 million for 2012 primarily due to lower production and sales prices in 2012 in our gas processing plant, partially offset by higher prices and, to a lesser extent, higher production in our oil extraction services. Our gas processing plant had high production levels and sales prices in 2011 as a result of the high energy requirements of EEPSA due to lower rainfall during the year. |
63
Table of Contents
Gross Profit.The table below sets forth the breakdown of our Infrastructure gross profit by principal lines of business.
| Year ended December 31, | ||||||||||||
| 2011 | 2012 | Variation | ||||||||||
| (in millions of S/.) | % | |||||||||||
Toll Roads | 40.1 | 53.3 | 32.9 | |||||||||
Mass Transit | (9.9 | ) | (2.7 | ) | 72.6 | |||||||
Water Treatment | — | 11.2 | N/M | |||||||||
Energy | 116.0 | 110.8 | (4.4 | ) | ||||||||
|
|
|
|
|
| |||||||
Total | 146.2 | 172.6 | 18.1 | |||||||||
Our Infrastructure gross profit increased 18.1%, or S/.26.4 million, from S/.146.2 million for 2011 to S/.172.6 million for 2012. Our Infrastructure gross margin was 32.9% for 2012 compared to 36.2% for 2011. The variation in our Infrastructure gross profit principally reflected the following:
| • | Toll Roads: a 32.9%, or S/.13.2 million, increase in gross profit, from S/.40.1 million for 2011 to S/.53.3 million for 2012. This increase was primarily due to costs incurred by Survial in 2011, without corresponding revenues, with respect to the performance of certain periodic maintenance services prior to the government’s approval, with the government approving periodic maintenance work to begin in October 2012. Our Toll Roads gross margin was 43.2% for 2012 compared to 34.8% for 2011; |
| • | Mass Transit: a S/.7.2 million decrease in gross loss, from a S/.9.9 million gross loss for 2011 to a S/.2.7 million gross loss for 2012, primarily due to losses in 2011 as a result of cost of sales incurred in the pre-operation phase of the Lima Metro during the second half of the year, a period during which we did not generate revenues, and, in 2012, as a result of the limited number of trains we operated during the first year of operation. However, we have recently ordered 19 additional trains and, when these trains begin to operate, we expect to generate gross profit from the Lima Metro; |
| • | Water Treatment: S/.11.2 million in gross profit for 2012, due to the commencement of the engineering design of La Chira waste water treatment plant. Our Water Treatment gross margin for 2012 was 27.2%; and |
| • | Energy: a 4.4%, or S/.5.1 million, decrease in gross profit, from S/.116.0 million for 2011 to S/.110.8 million for 2012, primarily due to decreased activity at our gas processing plant in 2012 compared to 2011. Our Energy gross margin was 38.6% for 2012 compared to 40.1% for 2011. |
Operating Profit. The table below sets forth the breakdown of our Infrastructure operating profit by principal lines of business.
| Year ended December 31, | ||||||||||||
| 2011 | 2012 | Variation | ||||||||||
| (in millions of S/.) | % | |||||||||||
Toll Roads | 33.1 | 47.0 | 42.0 | |||||||||
Mass Transit | (15.1 | ) | (10.6 | ) | 29.8 | |||||||
Water Treatment | (0.3 | ) | 9.7 | N/M | ||||||||
Energy | 100.5 | 93.6 | (6.9 | ) | ||||||||
|
|
|
|
|
| |||||||
Total | 118.3 | 139.7 | 18.1 | |||||||||
Our Infrastructure operating profit increased 18.1%, or S/.21.4 million, from S/.118.3 million for 2011 to S/.139.7 million for 2012. Our Infrastructure operating margin was 26.6% for 2012 compared to 29.3% for 2011. The variation in our Infrastructure operating profit principally reflected the following:
| • | Toll Roads: a 42.0%, or S/.13.9 million, increase in operating profit, from S/.33.1 million for 2011 to S/.47.0 million for 2012, primarily due to the increase in our Toll Roads gross profit and, to a lesser |
64
Table of Contents
extent, a reduction in administrative expenses at Survial as we are able to achieve efficiencies across our toll road concessions. Our Toll Roads operating margin was 38.1% for 2012 compared to 28.8% for 2011; |
| • | Mass Transit: a S/.4.5 million lower operating loss, from an operating loss of S/.15.1 million for 2011 to an operating loss of S/.10.6 million for 2012. The operating losses in 2011 relate to expenses incurred in the pre-operation phase of the Lima Metro in the second half of 2011, a period during which we did not generate revenues, and, in 2012, as a result of the limited number of trains we operated during the first year of operation; |
| • | Water Treatment: a S/.9.9 million increase in operating profit, from an operating loss of S/.(0.3) million for 2011 to an operating profit of S/.9.7 million for 2012, due to the commencement of the engineering design of La Chira waste water treatment plant. Our Water Treatment operating margin for 2012 was 23.6%; and |
| • | Energy: a 6.9%, or S/.6.9 million, decrease in operating profit, from S/.100.5 million for 2011 to S/.93.6 million for 2012, primarily due to the decrease in gross margin. Our Energy operating margin was 32.6% for 2012 compared to 34.8% for 2011. |
Real Estate
The table below sets forth selected financial information related to our Real Estate segment.
| Year ended December 31, | ||||||||||||
| 2011 | 2012 | Variation | ||||||||||
| (in millions of S/.) | % | |||||||||||
Revenues | 152.3 | 240.1 | 57.7 | |||||||||
Gross profit | 45.3 | 86.7 | 91.3 | |||||||||
Operating profit | 34.9 | 67.6 | 93.6 | |||||||||
Revenues.Our Real Estate revenues increased 57.7%, or S/.87.8 million, from S/.152.3 million for 2011 to S/.240.1 million for 2012. This increase was primarily due to an increase in the number of housing units delivered, with 1,368 units delivered in 2012 compared to 1,244 units delivered in 2011, and a shift in the mix of units delivered towards housing (as opposed to affordable housing) units, which have higher prices per unit, as well as an increase in land parcels sold by Almonte. We generated S/.10.1 million in 2011 and S/.45.6 million in 2012 from the sale of land parcels by Almonte.
Gross Profit.Our Real Estate gross profit increased 91.3%, or S/.41.4 million, from S/.45.3 million for 2011 to S/.86.7 million for 2012, primarily as a result of the land parcel sales by Almonte at a significant increase in land prices compared to the book value at which we had these assets recorded in our financial statements of S/.2.1 million. Our Real Estate gross margin was 36.1% for 2012 compared to 29.8% for 2011. Excluding the sale of land parcels by Almonte, our Real Estate gross profit increased 25.3% and our Real Estate gross margin was 24.0% for 2012 compared to 25.9% for 2011. This decrease in gross margin, after excluding the sales of land parcels by Almonte, was primarily due to costs in certain commercial real estate projects that initiated operations in 2012.
Operating Profit.Our Real Estate operating profit increased 93.6%, or S/.32.7 million, from S/.34.9 million for 2011 to S/.67.6 million for 2012, primarily as a result of the increase in our Real Estate gross profit described above. Our Real Estate operating margin was 28.1% for 2012 compared to 22.9% for 2011. Excluding the sale of land parcels by Almonte, our Real Estate operating margin was 14.0% for 2012 compared to 18.6% for 2011, primarily due to the lower gross margin and marketing costs in 2012 relating to a greater number of housing projects initiated in 2012.
65
Table of Contents
Technical Services
The table below sets forth selected financial information related to our Technical Services segment.
| Year ended December 31, | ||||||||||||
| 2011 | 2012 | Variation | ||||||||||
| (in millions of S/.) | % | |||||||||||
Revenues | 977.0 | 1,083.3 | 10.9 | |||||||||
Gross profit | 109.7 | 103.9 | (5.2 | ) | ||||||||
Operating profit | 89.4 | 72.2 | (19.3 | ) | ||||||||
Revenues. The table below sets forth the breakdown of our Technical Services revenues by principal lines of business.
| Year ended December 31, | ||||||||||||
| 2011 | 2012 | Variation | ||||||||||
| (in millions of S/.) | % | |||||||||||
Operation and Maintenance of Infrastructure Assets | 232.9 | 242.8 | 4.2 | |||||||||
IT Services | 185.9 | 208.0 | 11.9 | |||||||||
Electricity Networks Services | 558.2 | 632.5 | 13.3 | |||||||||
|
|
|
|
|
| |||||||
Total | 977.0 | 1,083.3 | 10.9 | |||||||||
Our Technical Services revenues increased 10.9%, or S/.106.4 million, from S/.977.0 million for 2011 to S/.1,083.3 million for 2012. The variation in our Technical Services revenues principally reflected the following:
| • | Operation and Maintenance of Infrastructure Assets: a 4.2%, or S/.9.9 million, increase in revenues, from S/.232.9 million for 2011 to S/.242.8 million for 2012, primarily due to the addition of three new road maintenance contracts related to 1,165 km of roads awarded at the end of 2012, which we expect to have a greater impact on our revenues in 2013; |
| • | IT Services: a 11.9%, or S/.22.1 million, increase in revenues, from S/.185.9 million for 2011 to S/.208.0 million for 2012, primarily as a result of economic growth of Peru, with government entities and businesses increasingly outsourcing IT services to focus on their core functions which led to both additional clients as well as additional activity for existing clients; and |
| • | Electricity Networks Services: a 13.3%, or S/.74.3 million, increase in revenues, from S/.558.2 million for 2011 to S/.632.5 million for 2012, primarily due to the consolidation of revenues for CAM for a full year in 2012 compared to ten months in 2011. |
Gross Profit.The table below sets forth the breakdown of our Technical Services gross profit by principal lines of business.
| Year ended December 31, | ||||||||||||
| 2011 | 2012 | Variation | ||||||||||
| (in millions of S/.) | % | |||||||||||
Operation and Maintenance of Infrastructure Assets | 55.6 | 41.2 | (26.0 | ) | ||||||||
IT Services | 29.6 | 39.0 | 32.1 | |||||||||
Electricity Networks Services | 24.5 | 23.7 | (3.2 | ) | ||||||||
|
|
|
|
|
| |||||||
Total | 109.7 | 103.9 | (5.2 | ) | ||||||||
66
Table of Contents
Our Technical Services gross profit decreased 5.2%, or S/.5.7 million, from S/.109.7 million for 2011 to S/.103.9 million for 2012. Our Technical Services gross margin was 9.6% for 2012 compared to 11.2% for 2011. The variation in our Technical Services gross profit principally reflected the following:
| • | Operation and Maintenance of Infrastructure Assets: a 26.0%, or S/.14.4 million, decrease in gross profit, from S/.55.6 million for 2011 to S/.41.2 million for 2012, primarily due to the higher margins we obtained in 2011 as a result of the initiation of services of contracts awarded at the end of 2010. In general, the initiation of a road maintenance contract (i.e., bringing the road to proper operating condition) generates higher margins than subsequent routine maintenance; accordingly, we expect higher gross profit in 2013 with the addition of three new road maintenance contracts at the end of 2012. Our Operation and Maintenance of Infrastructure Assets gross margin was 16.9% for 2012 compared to 23.9% for 2011; |
| • | IT Services: a 32.1%, or S/.9.5 million, increase in gross profit, from S/.29.6 million for 2011 to S/.39.0 million for 2012, primarily related to growth in revenues and, in particular, higher margin services. Our IT Services gross margin was 18.8% for 2012 compared to 15.9% for 2011; and |
| • | Electricity Networks Services: a 3.2%, or S/.0.8 million, decrease in gross profit, from S/.24.5 million for 2011 to S/.23.7 million for 2012, primarily due to costs incurred in connection with certain contracts entered into by CAM prior to our acquisition of it. We will seek to improve the Electricity Networks Services gross margin as we continue to integrate the business and implement further restructuring initiatives by improving operating processes to enhance efficiencies. Our Electricity Networks Services gross margin was 3.8% for 2012 compared to 4.4% for 2011. |
Operating Profit. The table below sets forth the breakdown of our Technical Services operating profit by principal lines of business.
| Year ended December 31, | ||||||||||||
| 2011 | 2012 | Variation | ||||||||||
| (in millions of S/.) | % | |||||||||||
Operation and Maintenance of Infrastructure Assets | 49.6 | 18.1 | (63.4 | ) | ||||||||
IT Services | 14.4 | 18.6 | 29.3 | |||||||||
Electricity Networks Services | 25.5 | 35.5 | 39.1 | |||||||||
|
|
|
|
|
| |||||||
Total | 89.4 | 72.2 | (19.3 | ) | ||||||||
Our Technical Services operating profit decreased 19.3%, or S/.17.3 million, from S/.89.4 million for 2011 to S/.72.2 million for 2012. Our Technical Services operating margin for 2012 was 6.7% compared to 9.2% for 2011. The variation in our Technical Services operating profit principally reflected the following:
| • | Operation and Maintenance of Infrastructure Assets: a 63.4%, or S/.31.4 million, decrease in operating profit, from S/.49.6 million for 2011 to S/.18.1 million for 2012, primarily due to the decrease in our gross profit and an increase in costs relating to the preparation of concession bids, as well as a S/.7.2 million gain in 2011 resulting from an arbitration award related to the Arequipa-Matarani road. Our Operation and Maintenance of Infrastructure Assets operating margin was 7.5% for 2012 compared to 21.3% for 2011; |
| • | IT Services: a 29.3%, or S/.4.2 million, increase in operating profit, from S/.14.4 million for 2011 to S/.18.6 million for 2012, primarily due to the increase in gross profit. Our IT Services operating margin was 8.9% for 2012 compared to 7.7% for 2011; and |
| • | Electricity Networks Services: a 39.1%, or S/.10.0 million, increase in operating profit, from S/.25.5 million for 2011 to S/.35.5 million for 2012, primarily due to the effects of the reversal of provisions in connection with the CAM acquisition, as described in “—Factors Affecting Our Results with Operations—Acquisitions,” which offset the decrease in gross profit. Our Electricity Networks Services operating margin was 5.6% for 2012 compared to 4.6% for 2011. |
67
Table of Contents
Financial (Expense) Income, Net
Our net financial expense increased 68.0%, or S/.4.2 million, from net financial expenses of S/.6.2 million in 2011 to net financial expenses of S/.10.3 million in 2012. Excluding exchange difference, our net financial expense increased 290.9%, or S/.23.4 million, from net expenses of S/.8.0 million for 2011 to net expenses of S/.31.5 million for 2012. This increase was primarily due to an increase in indebtedness incurred to finance our investments from S/.529.8 million as of December 31, 2011 to S/.845.5 million as of December 31, 2012. Our exchange difference, net increased S/.19.2 million, from a gain of S/.1.9 million for 2011 to a gain of S/.21.1 million for 2012. This increase in gain from exchange difference, net was primarily due to the appreciation of the nuevo sol versus the U.S. dollar in 2012, which decreased the value of our U.S. dollar liabilities in nuevo soles. For a breakdown of our financial expenses and income, see note 24 to our consolidated financial statements included in this prospectus.
Income Tax
Our income tax increased 9.3%, or S/.13.1 million, from S/.141.4 million for 2011 to S/.154.6 million for 2012. This increase in income tax was primarily due to an increase in profit before income tax. Our effective tax rates for 2012 and 2011 were 29.7% and 29.6%, respectively.
Net Profit
Our net profit increased 8.9%, or S/.30.1 million, from S/.336.2 million for 2011 to S/.366.3 million for 2012. Net profit attributable to controlling interests increased 0.3%, while net profit attributable to non-controlling interests increased 61.9%. Net profit attributable to non-controlling interests increased primarily as a result of the consolidation in 2012 of the results of Stracon GyM, as compared to the proportionate consolidation of the results of Stracon GyM in 2011, as well as the 49.6% non-controlling interest in Almonte, which provided significant profit from the sale of land parcels in 2012. See “—General—Accounting for Subsidiaries, Joint Operations and Associated Companies.”
Comparison of Results of Operations for 2010 and 2011
The following table sets forth the components of our consolidated income statements for 2010 and 2011.
| Year ended December 31, | ||||||||||||
| 2010 | 2011 | Variation | ||||||||||
| (in millions of S/.) | % | |||||||||||
Revenues | 2,502.7 | 4,241.3 | 69.5 | |||||||||
Cost of sales | (2,057.8 | ) | (3,609.5 | ) | 75.4 | |||||||
|
|
|
|
|
| |||||||
Gross profit | 444.8 | 631.7 | 42.0 | |||||||||
Administrative expenses | (123.2 | ) | (199.6 | ) | 62.1 | |||||||
Other income (expenses) | 2.7 | 4.3 | 61.3 | |||||||||
Profit from the sale of investments | 75.0 | 4.8 | (93.6 | ) | ||||||||
Other (losses) gains, net | 0.2 | (2.8 | ) | N/M | ||||||||
Gain from business combination | — | 45.2 | N/M | |||||||||
|
|
|
|
|
| |||||||
Operating profit | 399.5 | 483.6 | 21.0 | |||||||||
Financial (expense) income, net | (10.0 | ) | (6.2 | ) | (38.4 | ) | ||||||
Share of the profit and loss in associates | 11.5 | 0.2 | (98.1 | ) | ||||||||
|
|
|
|
|
| |||||||
Profit before income tax | 401.0 | 477.6 | 19.1 | |||||||||
Income tax | (124.3 | ) | (141.4 | ) | 13.8 | |||||||
|
|
|
|
|
| |||||||
Net profit | 276.7 | 336.2 | 21.5 | |||||||||
Net profit attributable to controlling interest | 252.8 | 289.1 | 14.3 | |||||||||
Net profit attributable to non-controlling interest | 23.9 | 47.1 | 97.3 | |||||||||
68
Table of Contents
Revenues
Our total revenues increased by 69.5%, or S/.1,738.6 million, from S/.2,502.7 million for 2010 to S/.4,241.3 million for 2011. This increase was primarily due to growth in each of our segments other than Real Estate, in particular our E&C segment, as well as our acquisition of CAM in February 2011. Excluding the revenues generated from our acquisition of CAM, our total revenues would have increased 47.2%.
The following table sets forth a breakdown of our revenues by segment for 2010 and 2011.
| Year ended December 31, | ||||||||||||||||||||
| 2010 | 2011 | Variation | ||||||||||||||||||
| (in millions of S/.) | % of Total | (in millions of S/.) | % of Total | % | ||||||||||||||||
Engineering and Construction | 1,700.5 | 67.9 | 2,784.2 | 65.6 | 63.7 | |||||||||||||||
Infrastructure | 354.7 | 14.2 | 404.2 | 9.5 | 14.0 | |||||||||||||||
Real Estate | 218.6 | 8.7 | 152.3 | 3.6 | (30.3 | ) | ||||||||||||||
Technical Services | 285.0 | 11.4 | 977.0 | 23.0 | 242.8 | |||||||||||||||
Corporate | 362.2 | 14.5 | 39.8 | 0.9 | (89.0 | ) | ||||||||||||||
Eliminations | (418.2 | ) | (16.7 | ) | (116.2 | ) | (2.7 | ) | (72.2 | ) | ||||||||||
|
|
|
|
|
|
|
|
|
| |||||||||||
Total | 2,502.7 | 100.0 | 4,241.3 | 100.0 | 69.5 | |||||||||||||||
Cost of Sales
Our total cost of sales increased by 75.4%, or S/.1,551.7 million, from S/.2,057.8 million for 2010 to S/.3,609.5 million for 2011. The increase was primarily related to the growth in our revenues, as well as the effect of the acquisition of CAM.
Gross Profit
Our gross profit increased by 42.0%, or S/.186.9 million, from S/.444.8 million for 2010 to S/.631.7 million for 2011. Our gross margin was 14.9% for 2011 compared to 17.8% for 2010. Our gross margin in 2011 was impacted by the inclusion of the results of CAM in our Technical Services segment, changes in contractual arrangements in our E&C segment and, to a lesser extent, expenses incurred in the pre-operation phase of the Lima Metro in our Infrastructure segment in the second half of 2011. Excluding the effects of the acquisition of CAM, our gross profit increased by 36.5% and our gross margin was 16.5% for 2011.
The following table sets forth a breakdown of our gross profit by segment for 2010 and 2011.
| Year ended December 31, | ||||||||||||||||||||
| 2010 | 2011 | Variation | ||||||||||||||||||
| (in millions of S/.) | % of Total | (in millions of S/.) | % of Total | % | ||||||||||||||||
Engineering and Construction | 230.9 | 51.9 | 329.3 | 52.1 | 42.6 | |||||||||||||||
Infrastructure | 132.3 | 29.7 | 146.2 | 23.1 | 10.5 | |||||||||||||||
Real Estate | 33.3 | 7.5 | 45.3 | 7.2 | 36.3 | |||||||||||||||
Technical Services | 61.0 | 13.7 | 109.7 | 17.4 | 79.7 | |||||||||||||||
Corporate | 18.6 | 4.2 | 2.0 | 0.3 | (89.3 | ) | ||||||||||||||
Eliminations | (31.3 | ) | (7.0 | ) | (0.7 | ) | (0.1 | ) | (97.7 | ) | ||||||||||
|
|
|
|
|
|
|
|
|
| |||||||||||
Total | 444.8 | 100.0 | 631.7 | 100.0 | 42.0 | |||||||||||||||
Administrative Expenses
Our administrative expenses increased by 62.1%, or S/.76.4 million, from S/.123.2 million for 2010 to S/.199.6 million for 2011, primarily due to the acquisition of CAM. As a percentage of revenues, our administrative expenses decreased to 4.7% in 2011 from 4.9% in 2010.
69
Table of Contents
Other Income (Expenses)
Our other income increased S/.1.6 million, from income of S/.2.7 million for 2010 to income of S/.4.3 million for 2011. This increase was primarily related to the sale of machinery and equipment in 2011.
Operating Profit
Our operating profit increased 21.0%, or S/.84.0 million, from S/.399.5 million for 2010 to S/.483.6 million for 2011. Our operating margin was 11.4% for 2011 compared to 16.0% for 2010. This decrease in operating margin was primarily due to a gain in 2010 of S/.58.0 million from the sale of the Larcomar shopping center and compensation received from the expropriation of oil and gas assets in Bolivia of S/.17.0 million, partially offset by a gain of S/45.2 million as a result of the excess of the fair value of the assets and liabilities we acquired in the CAM acquisition over the consideration paid, as described in “—Factors Affecting Our Results of Operations—Acquisitions.” Excluding these effects, our operating profit increased 35.1% and our operating margin for 2011 was 10.3% compared to 13.0% for 2010.
The following table sets forth a breakdown of our operating profit by segment for 2010 and 2011.
| Year ended December 31, | ||||||||||||||||||||
| 2010 | 2011 | Variation | ||||||||||||||||||
| (in millions of S/.) | % of Total | (in millions of S/.) | % of Total | % | ||||||||||||||||
Engineering and Construction | 149.8 | 37.5 | 227.5 | 47.0 | 51.9 | |||||||||||||||
Infrastructure | 128.9 | 32.3 | 118.3 | 24.5 | (8.2 | ) | ||||||||||||||
Real Estate | 26.7 | 6.7 | 34.9 | 7.2 | 30.5 | |||||||||||||||
Technical Services | 37.9 | 9.5 | 89.4 | 18.5 | 135.8 | |||||||||||||||
Corporate | 67.6 | 16.9 | (8.9 | ) | (1.8 | ) | (113.2 | ) | ||||||||||||
Eliminations | (11.4 | ) | (2.9 | ) | 22.4 | 4.6 | 296.5 | |||||||||||||
|
|
|
|
|
|
|
|
|
| |||||||||||
Total | 399.5 | 100.0 | 483.6 | 100.0 | 21.0 | |||||||||||||||
Business Segments
The following discussion analyzes our key results of operations on a segment basis. For further information on our business segments, see note 5 to our consolidated financial statements included in this prospectus.
Engineering and Construction
The table below sets forth selected financial information related to our E&C segment.
| Year ended December 31, | ||||||||||||
| 2010 | 2011 | Variation | ||||||||||
| (in millions of S/.) | % | |||||||||||
Revenues | 1,700.5 | 2,784.2 | 63.7 | |||||||||
Gross profit | 230.9 | 329.3 | 42.6 | |||||||||
Operating profit | 149.8 | 227.5 | 51.9 | |||||||||
Revenues.Our E&C revenues increased 63.7%, or S/.1.083.7 million, from S/.1,700.5 million for 2010 to S/.2,784.2 million for 2011, primarily due to a greater number of projects undertaken and an increase in average project size related to economic growth and increased investment in Peru. This growth in E&C revenues was driven principally by the mining, real estate and, to a lesser extent, oil and gas and water end-markets, partially offset by a decrease in the transportation end-market.
Gross Profit.Our E&C gross profit increased 42.6%, or S/.98.4 million, from S/.230.9 million for 2010 to S/.329.3 million for 2011. Our E&C gross margin was 11.8% for 2011 compared to 13.6% for 2010. Our E&C gross margin was affected by the trend in our contractual arrangements towards less risky contracts which provide more stable results at lower profit margins. See “—Factors Affecting Our Results of Operating—Engineering and Construction.”
70
Table of Contents
Operating Profit.Our E&C operating profit increased 51.9% or S/.77.7 million, from S/.149.8 million for 2010 to S/.227.5 million for 2011. Our E&C operating margin was 8.2% for 2011 compared to 8.8% for 2010. E&C operating margin was primarily affected by the effect of our E&C gross margin, partially offset by S/.2.6 million in other income in 2011 from the sale of equipment and machinery compared to S/.1.5 million in 2010.
Infrastructure
The table below sets forth selected financial information related to our Infrastructure segment.
| Year ended December 31, | ||||||||||||
| 2010 | 2011 | Variation | ||||||||||
| (in millions of S/.) | % | |||||||||||
Revenues | 354.7 | 404.2 | 14.0 | |||||||||
Gross profit | 132.3 | 146.2 | 10.5 | |||||||||
Operating profit | 128.9 | 118.3 | (8.2 | ) | ||||||||
Revenues.The table below sets forth the breakdown of our Infrastructure revenues by principal lines of business.
| Year ended December 31, | ||||||||||||
| 2010 | 2011 | Variation | ||||||||||
| (in millions of S/.) | % | |||||||||||
Toll Roads | 114.9 | 115.2 | 0.3 | |||||||||
Mass Transit | — | — | — | |||||||||
Water Treatment | — | — | — | |||||||||
Energy | 239.8 | 289.0 | 20.5 | |||||||||
|
|
|
|
|
| |||||||
Total | 354.7 | 404.2 | 14.0 | |||||||||
Our Infrastructure revenues increased 14.0%, or S/.49.5 million, from S/.354.7 million for 2010 to S/.404.2 million for 2011. We did not have revenues from our Mass Transit or Water Treatment businesses in 2010 and 2011. The variation in our Infrastructure revenues principally reflected the following:
| • | Toll Roads: a 0.3%, or S/.0.3 million, increase, from S/.114.9 million for 2010 to S/.115.2 million for 2011, primarily due to an increase in vehicular traffic in Norvial, which increased 10.6% from 2010 to 2011, partially offset by a S/.18.4 million gain in Survial in 2010 related to the financing of the construction of the road. See “—Factors Affecting Our Results of Operations—Infrastructure—Traffic and Fees for Toll Roads”; and |
| • | Energy: a 20.5%, or S/.49.2 million, increase, from S/.239.8 million for 2010 to S/.289.0 million for 2011, primarily due to an increase in oil prices and, to a lesser extent, oil production. |
Gross Profit.The table below sets forth the breakdown of our Infrastructure gross profit by principal lines of business.
| Year ended December 31, | ||||||||||||
| 2010 | 2011 | Variation | ||||||||||
| (in millions of S/.) | % | |||||||||||
Toll Roads | 53.3 | 40.1 | (24.7 | ) | ||||||||
Mass Transit | — | (9.9 | ) | N/M | ||||||||
Water Treatment | — | — | — | |||||||||
Energy | 79.1 | 116.0 | 46.7 | |||||||||
|
|
|
|
|
| |||||||
Total | 132.3 | 146.2 | 10.5 | |||||||||
71
Table of Contents
Our Infrastructure gross profit increased 10.5%, or S/.13.9 million, from S/.132.3 million for 2010 to S/.146.2 million for 2011. Our Infrastructure gross margin was 36.2% for 2011 compared to 37.3% for 2010. The variation in our Infrastructure gross profit principally reflected the following:
| • | Toll Roads: a 24.7%, or S/.13.1 million, decrease, from S/.53.3 million for 2010 to S/.40.1 million for 2011. Our Toll Roads gross margin was 34.8% for 2011 compared to 46.4% for 2010. In 2010, Survial had a gain of S/.18.4 million related to the financing of the construction of the road and, in 2011, Survial incurred costs, without corresponding revenues, with respect to the performance of certain periodic maintenance services prior to the government’s approval; |
| • | Mass Transit: cost of sales of S/.9.9 million for 2011 relating to the pre-operation phase of the Lima Metro, a period during which we did not generate revenues; and |
| • | Energy: a 46.7%, or S/.36.9 million, increase, from S/.79.1 million for 2010 to S/.116.0 million for 2011. Our Energy gross profit increased primarily due to increase in global oil prices. Our Energy gross margin was 40.1% for 2011 compared to 33.0% for 2010. |
Operating Profit.The table below sets forth the breakdown of our Infrastructure operating profit by principal lines of business.
| Year ended December 31, | ||||||||||||
| 2010 | 2011 | Variation | ||||||||||
| (in millions of S/.) | % | |||||||||||
Toll Roads | 44.1 | 33.1 | (24.8 | ) | ||||||||
Mass Transit | — | (15.1 | ) | N/M | ||||||||
Water Treatment | — | (0.3 | ) | N/M | ||||||||
Energy | 84.8 | 100.5 | 18.5 | |||||||||
|
|
|
|
|
| |||||||
Total | 128.9 | 118.3 | (8.2 | ) | ||||||||
Our Infrastructure operating profit decreased 8.2%, or S/.10.6 million, from S/.128.9 million for 2010 to S/.118.3 million for 2011. Our Infrastructure operating margin was 29.3% for 2011 compared to 36.3% for 2010. The variation in our Infrastructure operating profit principally reflected the following:
| • | Toll Roads: a 24.8 %, or S/.11.0 million, decrease, from S/.44.1 million for 2010 to S/.33.1 million for 2011, primarily due to the effects of the Toll Roads gross profit. Our Toll Roads operating margin was 28.8% for 2011 compared to 38.4% for 2010; |
| • | Mass Transit: a S/.15.1 million operating loss for 2011, relating to costs incurred during the pre-operation phase of the Lima Metro, a period during which we did not generate revenues; and |
| • | Energy: a 18.5%, or S/.15.7 million, increase, from S/.84.8 million for 2010 to S/.100.5 million for 2011. Our Energy operating margin was 34.8% for 2011 compared to 35.3% for 2010. Our Energy operating margin for 2010 was positively affected by a gain of S/.17.0 million in compensation for the expropriation of oil and gas assets in Bolivia. |
Real Estate
The table below sets forth selected financial information related to our Real Estate segment.
| Year ended December 31, | ||||||||||||
| 2010 | 2011 | Variation | ||||||||||
| (in millions of S/.) | % | |||||||||||
Revenues | 218.6 | 152.3 | (30.3 | ) | ||||||||
Gross profit | 33.3 | 45.3 | 36.3 | |||||||||
Operating profit | 26.7 | 34.9 | 30.5 | |||||||||
72
Table of Contents
Revenues.Our Real Estate revenues decreased 30.3%, or S/.66.3 million, from S/.218.6 million for 2010 to S/.152.3 million for 2011. This decrease was primarily due to a decrease in the number of housing units delivered, with 1,244 units delivered in 2011 compared to 2,142 units delivered in 2010 as a result of the timing of the completion and delivery of our real estate projects, partially offset by the sale of land parcels by Almonte in 2011 which generated S/.10.1 million.
Gross Profit.Our Real Estate gross profit increased 36.3%, or S/.12.1 million, from S/.33.3 million for 2010 to S/.45.3 million for 2011, due to higher margins obtained in two affordable housing projects, as well as the sale of land parcels by Almonte in 2011, which reflected a significant appreciation in price compared to the book value recorded in our financial statements of S/.0.7 million. Our Real Estate gross margin was 29.8% for 2011 compared to 15.2% for 2010. Excluding the sale of land parcels by Almonte, our Real Estate gross profit increased 10.4% and our Real Estate gross margin was 25.9% for 2011.
Operating Profit. Our Real Estate operating profit increased 30.5%, or S/.8.2 million, from S/.26.7 million for 2010 to S/.34.9 million for 2011. Our Real Estate operating margin was 22.9% for 2011 compared to 12.2% for 2010. Our Real Estate operating margin was primarily affected by the effect of our Real Estate gross margin. Excluding the sale of land parcels by Almonte, our Real Estate operating margin was 18.6% for 2011.
Technical Services
The table below sets forth selected financial information related to our Technical Services segment.
| Year ended December 31, | ||||||||||||
| 2010 | 2011 | Variation | ||||||||||
| (in millions of S/.) | % | |||||||||||
Revenues | 285.0 | 977.0 | 242.8 | |||||||||
Gross profit | 61.0 | 109.7 | 79.7 | |||||||||
Operating profit | 37.9 | 89.4 | 135.8 | |||||||||
Revenues. The table below sets forth the breakdown of our Technical Services revenues by principal lines of business.
| Year ended December 31, | ||||||||||||
| 2010 | 2011 | Variation | ||||||||||
| (in millions of S/.) | % | |||||||||||
Operation and Maintenance of Infrastructure Assets | 143.8 | 232.9 | 62.0 | |||||||||
IT Services | 141.2 | 185.9 | 31.6 | |||||||||
Electricity Networks Services | — | 558.2 | N/M | |||||||||
|
|
|
|
|
| |||||||
Total | 285.0 | 977.0 | 242.8 | |||||||||
Our Technical Services revenues increased 242.8%, or S/.692.0 million, from S/.285.0 million for 2010 to S/.977.0 million for 2011, in large part as a result of the acquisition of CAM. Excluding the revenues generated by CAM, our Technical Services revenues increased 47.2%. The variation in our Technical Services revenues principally reflected the following:
| • | Operation and Maintenance of Infrastructure Assets: a 62.0%, or S/.89.1 million, increase, from S/.143.8 million for 2010 to S/.232.9 million for 2011, primarily due to three additional public-sector road contracts related to 2,872 km awarded at the end of 2010, which we began to execute in 2011; |
| • | IT Services: a 31.6% or S/.44.7 million, increase, from S/.141.2 million for 2010 to S/.185.9 million for 2011, primarily as a result of economic growth of Peru, with government entities and businesses increasingly outsourcing IT services to focus on their core functions, which led to both additional clients as well as increased activity for existing clients; and |
| • | Electricity Networks Services: S/.558.2 million in revenues in 2011 resulting from the acquisition of CAM in February 2011. |
73
Table of Contents
Gross Profit.The table below sets forth the breakdown of our Technical Services gross profit by principal lines of business.
| Year ended December 31, | ||||||||||||
| 2010 | 2011 | Variation | ||||||||||
| (in millions of S/.) | % | |||||||||||
Operation and Maintenance of Infrastructure Assets | 35.0 | 55.6 | 58.9 | |||||||||
IT Services | 26.1 | 29.6 | 13.5 | |||||||||
Electricity Networks Services | — | 24.5 | N/M | |||||||||
|
|
|
|
|
| |||||||
Total | 61.0 | 109.7 | 79.7 | |||||||||
Our Technical Services gross profit increased 79.7%, or S/.48.6 million, from S/.61.0 million for 2010 to S/.109.7 million for 2011. Our Technical Services gross margin was 11.2% for 2011 compared to 21.4% for 2010, primarily as a result of our acquisition of CAM, which generates significantly lower margins than our other lines of business. The variation in our Technical Services gross profit principally reflected the following:
| • | Operation and Maintenance of Infrastructure Assets: a 58.9%, or S/.20.6 million, increase, from S/.35.0 million for 2010 to S/.55.6 million for 2011. Our Operation and Maintenance of Infrastructure Assets gross margin was 23.9% for 2011 compared to 24.3% for 2010; |
| • | IT Services: a 13.5%, or S/.3.5 million, increase in gross profit from S/.26.1 million for 2010 to S/.29.6 million for 2011. Our IT Services gross margin was 15.9% for 2011 compared to 18.4% for 2010. This decrease in gross margin was primarily due to an extraordinary penalty payment in 2011 resulting from a fire at the facilities of one of our clients; and |
| • | Electricity Networks Services: S/.24.5 million in gross profit in 2011 resulting from our acquisition of CAM. Our Electricity Networks Services gross margin was 4.4% for 2011. |
Operating Profit. The table below sets forth the breakdown of our Technical Services operating profit by principal lines of business.
| Year ended December 31, | ||||||||||||
| 2010 | 2011 | Variation | ||||||||||
| (in millions of S/.) | % | |||||||||||
Operation and Maintenance of Infrastructure Assets | 25.3 | 49.6 | 95.8 | |||||||||
IT Services | 12.6 | 14.4 | 13.9 | |||||||||
Electricity Networks Services | — | 25.5 | N/M | |||||||||
|
|
|
|
|
| |||||||
Total | 37.9 | 89.4 | 135.8 | |||||||||
Our Technical Services operating profit increased 135.8%, or S/.51.5 million, from S/.37.9 million for 2010 to S/.89.4 million for 2011. Our Technical Services operating margin was 9.2% for 2011 compared to 13.3 % for 2010. The variation in our Technical Services operating profit principally reflected the following:
| • | Operation and Maintenance of Infrastructure Assets: a 95.8%, or S/.24.3 million, increase, from S/.25.3 million for 2010 to S/.49.6 million for 2011, primarily due to an increase in our Operation and Maintenance of Infrastructure Assets gross profit, as well as a S/.7.2 million gain in 2011 resulting from an arbitration award related to the Arequipa-Matarani road. Our Operation and Maintenance of Infrastructure Assets operating margin was 21.3% for 2011 compared to 17.6% for 2010; |
| • | IT Services: a 13.9%, or S/.1.7 million, increase, from S/.12.6 million for 2010 to S/.14.4 million for 2011, primarily related to an increase in our IT Services gross profit. Our IT Services operating margin was 7.7% for 2011 compared to 8.9% for 2010; and |
| • | Electricity Networks Services: S/.25.5 million in operating profit in 2011 resulting from our acquisition of CAM in 2011. Our Electricity Networks Services operating margin was 4.6% for 2011. Our operating profit was affected by a S/.45.2 million gain from the excess of the fair value of assets and liabilities acquired in the CAM acquisition over the price paid, as described in “—Factors Affecting Our Results of Operation— Acquisitions.” |
74
Table of Contents
Financial (Expense) Income, Net
Our net financial expense decreased 38.4%, or S/.3.8 million, from net financial expenses of S/.10.0 million in 2010 to net financial expenses of S/.6.2 million in 2011. Excluding exchange difference, our net financial expense decreased 55.8%, or S/.10.2 million, from net financial expenses of S/.18.2 million for 2010 to net financial expenses of S/.8.1 million for 2011. This decrease was primarily due to an increase in interest on short-term bank deposits as a result of higher deposit amounts. Our exchange difference, net decreased 76.9%, or S/.6.3 million, from a gain of S/.8.2 million for 2010 to a gain of S/.1.9 million for 2011. This decrease was primarily due to the depreciation of the Chilean peso versus the nuevo sol in 2011, which decreased the value of the Chilean peso assets in CAM in nuevo soles, partially offset by the appreciation of the nuevo sol versus the U.S. dollar during the year. For a breakdown of our financial expenses, see note 24 to our consolidated financial statements included in this prospectus.
Income Tax
Our income tax increased 13.8%, or S/.17.1 million, from S/.124.3 million for 2010 to S/.141.4 million for 2011. The increase was primarily due to an increase in profit before income tax. Our effective tax rates for 2011 and 2010 were 29.6% and 31.0%, respectively.
Net Profit
Our net profit increased 21.5%, or S/.59.5 million, from S/.276.7 million for 2010 to S/.336.2 million for 2011. Net profit attributable to controlling interests increased 14.3%, while net profit attributable to non-controlling interests increased 97.3%. Net profit attributable to non-controlling interests increased primarily as a result of the consolidation of our 75.0% interest in CAM and a greater percentage of minority interests in Viva GyM as a result of increased non-controlling interests used to finance our real estate projects.
Liquidity and Capital Resources
Our principal sources of liquidity have historically been cash flows from operating activities and, to a lesser extent, indebtedness. Our principal uses of cash (other than in connection with our operating activities) have historically been: capital expenditures in all our business segments, including acquisitions and investments in our infrastructure concessions; servicing of our debt; and payment of dividends. We believe that these sources of cash will be sufficient to cover our working capital needs in the ordinary course of business. We believe that our cash from operations, the net proceeds from this offering and our current financing sources are sufficient to satisfy our current capital expenditures and debt service obligations in 2013 and 2014. We anticipate financing future acquisitions or additional capital expenditures with cash from operations and additional indebtedness.
Capital Expenditures
The table below provides our total capital expenditures incurred in 2010, 2011 and 2012.
| Year ended December 31, | ||||||||||||||||
| 2010 | 2011 | 2012 | 2012 | |||||||||||||
| (in millions of S/.) | (in millions of US$) | |||||||||||||||
Engineering and Construction(1) | 127.1 | 183.7 | 417.1 | 163.5 | ||||||||||||
Infrastructure(2)(3) | 52.6 | 172.0 | 301.9 | 118.3 | ||||||||||||
Real Estate(4) | 124.1 | 73.6 | 128.3 | 50.3 | ||||||||||||
Technical Services(5) | 30.9 | 57.5 | 39.8 | 15.6 | ||||||||||||
Corporate(3) | 16.2 | 6.9 | 11.6 | 4.6 | ||||||||||||
|
|
|
|
|
|
|
| |||||||||
Total(6) | 350.9 | 493.7 | 898.7 | 352.3 | ||||||||||||
75
Table of Contents
| (1) | In our consolidated financial statements, in accordance with IFRS, we record in “cash flow used in investing activities” with respect to equipment leases only the amounts paid during the period as opposed to the total amount of lease payments, which is included in the table above. In 2010, 2011 and 2012, the differences between the amounts reflected in the table above and the amounts reflected in our consolidated cash flow statements for our E&C segment amounted to S/.(86) million, S/.(165) million and S/.(204) million, respectively. |
| (2) | Includes our disbursements of S/.24 million in 2011 and S/.215.7 million in 2012 for the purchase of 19 additional trains for the Lima Metro, which in accordance with IFRS accounting for public service concessions are recorded in our consolidated financial statements as a “long-term accounts receivable.” See”—Results of Operations—General—Infrastructure.” |
| (3) | Our investments in 2011 of S/.75.1 million related to the Lima Metro (other than for trains) and S/.5.8 million related to La Chira waste water treatment plant are presented in the table above under “Infrastructure” as opposed to “Corporate” as recorded in our consolidated financial statements. |
| (4) | Includes S/.117.5 million, S/.70.7 million and S/.126.8 million in investments in 2010, 2011 and 2012, respectively, for the purchase of land by our Real Estate segment, which in accordance with IFRS are recorded in our consolidated financial statements as “inventory.” |
| (5) | In our consolidated financial statements, in accordance with IFRS, we record as “cash flow used in investing activities” with respect to equipment leases only the amounts paid during the period as opposed to the total amount of lease payments which is included in the table above. In 2010, 2011 and 2012, the differences between the amounts reflected in the table above and the amounts reflected in our consolidated cash flow statements for our Technical Services segment amounted to S/.(4) million, S/.(3) million and S/.(2) million, respectively. |
| (6) | Includes S/.0 million, S/.29.1 million and S/.181.0 million of capital expenditures related to acquisitions in 2010, 2011 and 2012, respectively. |
Our current plans for our E&C segment contemplate capital expenditures in 2013 of approximately S/.160 million (US$63 million) for the purchase of equipment and machinery. Our current plans for our Infrastructure segment contemplate capital expenditures in 2013 of approximately S/.380 million (US$149 million) for the purchase of additional trains and the construction of the maintenance and repair yard in connection with the Lima Metro as well as for investments in oil development drilling activities. Our current plans for our Real Estate segment contemplate capital expenditures in 2013 of approximately S/.195 million (US$76 million) for the purchase of land for real estate development projects. Our current plans for our Technical Services segment contemplate capital expenditures in 2013 of approximately S/.45 million (US$18 million) for the purchase of equipment used in our operations. Our current plans for our Corporate segment contemplate capital expenditures in 2013 of approximately S/.420 million (US$165 million), including S/.320 million (US$125 million) for potential acquisitions in each of our business segments, S/.70 million (US$27 million) for new infrastructure concessions and S/.31 million (US$12 million) for the construction of a new office building for corporate use. As we determine the capital expenditures currently reflected in our Corporate segment, we will assign these expenditures to the corresponding segment.
These estimates are subject to change. We routinely evaluate acquisitions, new infrastructure concessions and other investment opportunities that are aligned with our strategic goals. We cannot assure you that we will find opportunities on terms that we consider to be favorable or at all or whether we will be able to take advantage of these opportunities should they arise. See “Forward-Looking Statements.”
76
Table of Contents
Cash Flows
The table below sets forth certain components of our cash flows for 2010, 2011 and 2012.
| Year ended December 31, | ||||||||||||
| 2010 | 2011 | 2012 | ||||||||||
| (in millions of S/.) | ||||||||||||
Net cash provided by operating activities | 402.1 | 133.3 | 439.3 | |||||||||
Net cash provided by (used in) investing activities | 19.9 | (85.6 | ) | (202.3 | ) | |||||||
Net cash provided by (used in) financing activities | (127.0 | ) | (72.5 | ) | (115.1 | ) | ||||||
|
|
|
|
|
| |||||||
Total | 682.9 | 658.2 | 780.1 | |||||||||
Cash Flow from Operating Activities
Net cash flow provided by operating activities in 2012 was significantly higher than in 2011. This primarily reflects an increase in other accounts payable partially offset by an increase in accounts receivable in 2012, due to an increase in our results of operations for the year. Net cash flow provided by operating activities in 2011 was significantly lower than in 2010. This primarily reflects an increase in the volume of inventory, other accounts receivable, other accounts payable to related parties in 2011 due to growth of the company, partially offset by a decrease in trade accounts payable and other accounts payable that year, mainly due to a decline in advance payments from clients due to the high levels of such advances during 2010.
Cash Flow from Investing Activities
Net cash flow used in investing activities in 2012 was significantly higher than in 2011. This primarily reflects an increase in payments for investment purchases in 2012, principally related to the acquisition of Vial y Vives, higher investment in oil drilling activities and a greater amount of purchases of machinery and equipment. Net cash flow used in investing activities in 2011 was significantly higher than in 2010, primarily due to the cash inflow in 2010 from the sale of the Larcomar shopping center and compensation received from the expropriation of our oil and gas assets in Bolivia, while in 2011 we acquired CAM, purchased a greater amount of machinery and equipment and made higher investments in oil drilling activities.
Cash Flow from Financing Activities
Net cash flow used in financing activities in 2012 was higher than in 2011. This primarily reflects higher debt service payments, as a result of increased indebtedness outstanding, and higher dividends paid in 2012, partially offset by higher indebtedness incurred during the year. Net cash flow used in financing activities in 2011 was lower than in 2010. This primarily reflects higher indebtedness incurred in 2011, partially offset higher debt service payments and higher dividends paid during the year.
Indebtedness
As of December 31, 2012, we had a total outstanding indebtedness of S/.845.5 million (US$331.4 million) as set forth in the table below.
| Currency | Range of Maturity Dates | |||||||||||||||||||||||||||||||||
Segment | Type | (in millions of US$) | (in millions of S/.) | (in millions of CLP)(1) | Total in millions of S/. | Total in millions of US$ | Weighted average interest rate | Earliest | Latest | |||||||||||||||||||||||||
Engineering and Construction: | Leasing Promissory note |
| 108.5 7.0 |
|
| 6.3 — |
|
| — — |
|
| 283.1 17.7 |
|
| 111.0 7.0 |
|
| 4.2 4.6 | % % |
| 1/1/2013 5/15/2015 |
|
| 1/2/2023 4/15/2017 |
| |||||||||
Infrastructure: | Leasing | 5.8 | — | — | 14.9 | 5.8 | 5.4 | % | 3/1/2013 | 2/1/2016 | ||||||||||||||||||||||||
| Long-term loan | 55.1 | — | — | 140.5 | 55.1 | 5.5 | % | 1/1/2013 | 8/31/2020 | |||||||||||||||||||||||||
| Promissory note | 8.4 | 8.3 | — | 29.6 | 11.6 | 6.4 | % | 1/11/2013 | 10/5/2013 | |||||||||||||||||||||||||
Real Estate: | Leasing | 8.0 | — | — | 20.4 | 8.0 | 6.7 | % | 7/1/2022 | 7/1/2022 | ||||||||||||||||||||||||
| Promissory note | 14.2 | 36.3 | — | 72.4 | 28.4 | 6.8 | % | 3/3/2013 | 5/15/2015 | |||||||||||||||||||||||||
Technical Services: | Leasing | 7.7 | — | 319.8 | 21.4 | 8.4 | 4.3 | % | 1/8/2013 | 1/31/2016 | ||||||||||||||||||||||||
| Promissory note | 12.1 | 7.3 | 9,202.0 | 87.1 | 34.1 | 6.8 | % | 1/3/2013 | 6/12/2014 | |||||||||||||||||||||||||
Corporate: | Leasing | 1.6 | — | — | 4.0 | 1.6 | 4.8 | % | 12/4/2018 | 12/4/2018 | ||||||||||||||||||||||||
| Promissory note | 60.5 | — | — | 154.4 | 60.5 | 4.2 | % | 3/4/2013 | 3/4/2013 | |||||||||||||||||||||||||
|
|
|
|
|
|
|
|
|
| |||||||||||||||||||||||||
Total | 288.8 | 58.1 | 9,522.0 | 845.5 | 331.4 | |||||||||||||||||||||||||||||
77
Table of Contents
| (1) | Includes debt held by CAM and its subsidiaries that is denominated in Chilean pesos, Colombian pesos and Brazilian reais, all of which is presented in Chilean pesos in the table above. |
Below is a description of our material outstanding indebtedness as of December 31, 2012. As of December 31, 2012, we were in compliance in all material respects with the financial covenants corresponding to our outstanding indebtedness.
Leasing. As of December 31, 2012, we were party to numerous leasing agreements with several financial institutions which in the aggregate amounted to approximately S/.343.8 million (US$134.8 million). We entered into such agreements primarily for the purpose of leasing the equipment and other assets necessary to run our operations. Upon maturity of each leasing agreement, we have the option to purchase or return the equipment or assets to the lessor. The amounts owed under these leasing agreements are generally repaid in monthly installments, subject to a minimum guaranteed payment corresponding to the minimum amount for which the equipment or assets could be sold to a third-party.
BBVA Banco Continental Bridge Loan. As of December 31, 2012, Graña y Montero had a short-term unsecured loan with BBVA Banco Continental entered into on October 5, 2012 in an outstanding principal amount of approximately US$60.7 million. This loan accrued interest at an annual rate of three month LIBOR plus 3.80% and matured in March 2013. The proceeds of the loan were used by our subsidiary GyM Ferrovías to purchase trains and other infrastructure assets. This loan was repaid on March 5, 2013 with proceeds from the syndicated loan described below.
Syndicated Loan. On February 27, 2013, Graña y Montero entered into a syndicated loan with certain lenders and BBVA Bancomer S.A., Institución de Banca Múltiple, Grupo Financiero BBVA Bancomer, as administrative agent, for an aggregate amount of up to US$150 million, to be used to repay the US$60 million bridge loan entered into with BBVA Banco Continental, for investments in and funding the operations of GyM Ferrovías and other general corporate purposes. As of the date of this prospectus, we had US$90 million outstanding under this loan. This loan accrues interest at an annual rate of three month LIBOR plus 4.25% and matures on February 27, 2018. Certain of our subsidiaries (GyM, GMP, Concar and Viva GyM) are guarantors under the loan. The agreement contains certain customary covenants, including restrictions on our and our guarantor subsidiaries’ ability to pay dividends if in default and the obligation to maintain the following financial covenants during the term of the agreement: (1) Borrower Consolidated Adjusted Debt Coverage Ratio (as defined therein) for the preceding four quarter period shall be less than 3.00:1.00 as of the end of each fiscal quarter; (2) Guarantor Consolidated Adjusted Debt Coverage Ratio (as defined therein) for the preceding four quarter period shall be less than 2.50:1.00 as of the end of each fiscal quarter; and (3) Consolidated Net Worth (as defined therein) as of the end of each fiscal quarter shall be at least equal to US$497.6 million.
Citibank, N.A. Unsecured Loan. Our subsidiary GMP has an unsecured loan with Citibank, N.A. under a loan agreement dated September 19, 2008 and amended on August 27, 2012 in an outstanding principal amount of S/.69.2 million (US$27.1 million) as of December 31, 2012. This loan accrues interest at an annual rate of three month LIBOR plus: (i) 1.75% if, at the installment payment date, the exchange rate between the nuevo sol and U.S. dollar remains between S/.2.60 to S/.2.75 per US$1.00 or (ii) 1.95%, if otherwise. The loan matures in August 2020. The proceeds of the loan were used by our subsidiary GMP to finance the construction, equipment and operation of the Gas Pariñas plant in Talara. The agreement is secured by certain land, equipment and accounts receivable of GMP. The agreement contains certain customary covenants, including restrictions on the ability of GMP to pay dividends if
78
Table of Contents
it is in default under the loan and the obligation by GMP to maintain the following financial covenants during the term of the agreement: (1) Leverage Ratio (as defined therein) shall not be greater than 1.50; (2) Debt Service Coverage Ratio (as defined therein) shall not be less than 1.20; (3) Liquidity Ratio (as defined therein) shall not be less than 1.10; and (4) Debt Coverage Ratio (as defined therein) shall not be greater than 2.20.
Inter-American Development Bank and International Finance Corporation Unsecured Loans. Norvial has two unsecured loans with the Inter-American Development Bank and with the International Finance Corporation under loan agreements entered into in April 2005, each in an outstanding principal amount of US$9.4 million as of December 31, 2012. These loans accrue interest at an annual rate of 6.9% and mature in November 2016. The proceeds of these loans were used for the construction, rehabilitation and maintenance of the Norvial road. The loan agreements contain certain customary covenants, including restrictions on Norvial’s ability to pay dividends and incur additional debt.
Derivative Financial Instruments
In February 2012, our subsidiary GyM Ferrovías entered into a forward rate agreement with BBVA S.A. to hedge the foreign exchange risk pertaining to expenditures incurred in euros to a foreign supplier for the development, maintenance and operation of the Lima Metro. GyM Ferrovías will receive an aggregate of EUR44.5 million at a fixed exchange rate of S/.3.5952 per euro beginning in March 2013 and up to S/.3.6412 per euro in January 2014.
In August 2012, our subsidiary GMP entered into two interest rate swaps with Citibank, N.A. to hedge its exposure to fluctuations in LIBOR under its unsecured loan with Citibank, N.A. described above. These interest rate swaps establish a fixed annual rate of 5.05%, payable at each interest payment date under the loan.
In September 2012, our subsidiary Viva GyM entered into a forward foreign exchange agreement with Banco de Crédito del Perú to hedge the foreign exchange risk on the amount to be received in U.S. dollars as proceeds from a loan agreement with Banco de Crédito del Perú in connection with the construction of the Torre Real 8 project. Under the agreement, Viva GyM receives in nuevos soles the equivalent of US$3.6 million in 12 equal installments payments of US$300,000 determined at a fixed exchange rate of S/.2.5921 per U.S. dollar on the first installment in October 2012 and up to S/.2.6242 per U.S. dollar on the final installment in September 2013.
For additional information about our derivative financial instruments and borrowings, see notes 6.1 and 16 to our consolidated financial statements included in this prospectus.
Off-Balance Sheet Arrangements
There are no off-balance sheet arrangements that have, or are reasonably likely to have, a current or future material effect on our results of operations, financial condition or liquidity. As of December 31, 2012, we maintain guarantee commitments with different financial institutions securing transactions for US$170.8 million and S/.6.3 million, relating to our purchase of additional trains for the Lima Metro. For additional information on these commitments, see note 27(c) to our consolidated financial statements included in this prospectus.
Contractual Obligations
The following table sets forth our contractual obligations with payment terms as of December 31, 2012.
| Payments Due By Period | ||||||||||||||||||||
| (in millions of S/.) | ||||||||||||||||||||
| Less than 1 year | 1-3 years | 3-5 years | More than 5 Years | Total | ||||||||||||||||
Indebtedness(1) | 331.4 | 5.2 | 102.5 | 89.9 | 529.1 | |||||||||||||||
Capitalized Lease Obligations(2) | 74.5 | 101.8 | 125.9 | 14.2 | 316.4 | |||||||||||||||
Purchase Obligations(3) | 214.8 | 8.9 | 5.6 | 4.6 | 233.8 | |||||||||||||||
|
|
|
|
|
|
|
|
|
| |||||||||||
Total | 620.6 | 115.9 | 234.0 | 108.7 | 1,079.3 | |||||||||||||||
79
Table of Contents
| (1) | Only includes principal amount of indebtedness. |
| (2) | Excludes building leases, which are not material. |
| (3) | Includes the purchase of land for two real estate development projects, the purchase of trains for the Lima Metro and payments due with respect to the increase in our interest in Almonte in 2009. Excludes S/.703.5 million (US$275.8 million) accounts payable within 90 days, except for certain material accounts payable, such as the purchase of land and purchase of trains. |
Quantitative and Qualitative Disclosures about Market Risk
We are exposed to a number of market risks arising from our normal business activities, including the possibility that changes in currency exchange rates or interest rates will adversely affect future cash flows and profit or the value of our financial assets and liabilities. From time to time, we enter into derivative transactions to hedge against foreign currencies and interest rate fluctuations. For further information regarding our market risk, see note 3 to our consolidated financial statements included in this prospectus.
Exchange Rate Risk
We are exposed to market risk associated with changes in foreign currency exchange rates. Our revenues and costs, and our assets and liabilities, are denominated in nuevo soles, U.S. dollars, Chilean pesos and, to a lesser extent, other currencies. In 2012, 36%, 52% and 12% of our revenues were denominated in nuevo soles, U.S. dollars and other currencies (principally Chilean pesos), respectively, while 56%, 31% and 13% of our cost of sales during the year were denominated in nuevo soles, U.S. dollars and other currencies. In addition, as of December 31, 2012, 6.9%, 86.3% and 6.8% of our total debt was denominated in nuevo soles, U.S. dollars and other currencies, respectively. If, at December 31, 2012, the nuevo sol had strengthened/weakened by 10% against the U.S. dollar, with all other variables remaining constant, our net profit for the year would have increased/decreased by S/.2.0 million.
Interest Rate Risk
We may from time to time incur variable interest rate indebtedness, and accordingly our financial expenses are affected by changes in interest rates. Based upon our indebtedness at December 31, 2012, and taking into account our interest rate derivative instruments, a change in interest rates of one percent (or 100 basis points) would impact our net profit by S/.8.5 million annually. This sensitivity analysis does not take into account indebtedness that we incur subsequent to December 31, 2012.
80
Table of Contents
Our Main Market: Peru
Overview of the Peruvian Economy
Our results are substantially affected by economic conditions prevailing in Peru. The Peruvian economy has been one of the fastest growing economies globally during the period from 2008 to 2012. According to the Peruvian Central Bank, Peruvian real GDP grew at an average rate of 6.5% during that period, the highest rate in South America. The economic expansion during this period was a result of robust domestic demand, increase in investment, price stability, increase in foreign direct investment, improvement in public finances, and lower external debt, among other factors.
In addition, the country’s strong economic growth has led to a 73.7% increase in GDP per capita from US$3,800 in 2007 to US$6,601 in 2012. According to the National Statistical Institute of Peru (INEI), the country’s poverty rate (defined as the percentage of population with per capita consumption below S/.272 per month, as of May 2012) fell from 42.4% in 2007 to 27.8% in 2011 and is expected, as noted by the Peruvian Ministry of Economy and Finance, to continue declining at a steady rate. Inequality as measured by the Gini coefficient improved from 0.52 in 2007 to 0.48 in 2010, according to the World Bank. Also, the proportion of middle class families, those in socioeconomic categories B and C as measured by Ipsos APOYO, a Peruvian company dedicated to research and surveys, has expanded from 19.0% of the population in 2003 to 27.0% of the population in 2011.
The following table sets forth the main economic indicators of the Peruvian economy from 2007 to 2012.
In US$ billion, unless stated otherwise | 2007 | 2008 | 2009 | 2010 | 2011 | 2012 | ||||||||||||||||||
Nominal GDP | 107.2 | 126.9 | 126.9 | 153.9 | 176.6 | 201.2 | ||||||||||||||||||
Nominal GDP / capita (US$) | 3,799.5 | 4,426.6 | 4,361.2 | 5,206.3 | 5,885.1 | 6,601.1 | ||||||||||||||||||
Real growth rates (% based on local currency GDP(1) | 8.9 | % | 9.8 | % | 0.9 | % | 8.8 | % | 6.9 | % | 6.3 | % | ||||||||||||
Private consumption(1) | 8.3 | % | 8.7 | % | 2.4 | % | 6.0 | % | 6.4 | % | 5.8 | % | ||||||||||||
Private investment(1) | 23.3 | % | 25.9 | % | (15.1 | %) | 22.1 | % | 11.7 | % | 14.7 | % | ||||||||||||
Foreign direct investment(1) | 58.4 | % | 26.1 | % | (7.1 | %) | 31.5 | % | (2.6 | %) | 34.6 | % | ||||||||||||
Public expenditure (consumption and investment)(1) | 8.4 | % | 11.4 | % | 18.1 | % | 16.3 | % | (4.2 | %) | 13.0 | % | ||||||||||||
Total private and public fixed investment(1) | 22.6 | % | 27.1 | % | (9.2 | %) | 23.2 | % | 5.1 | % | 16.2 | % | ||||||||||||
Exports(1) | 6.9 | % | 8.2 | % | (3.2 | %) | 1.3 | % | 8.8 | % | 5.5 | % | ||||||||||||
Imports(1) | 21.4 | % | 20.1 | % | (18.6 | %) | 24.0 | % | 9.8 | % | 11.2 | % | ||||||||||||
Inflation (measured by change in CPI) | 3.9 | % | 6.7 | % | 0.2 | % | 2.1 | % | 4.7 | % | 2.6 | % | ||||||||||||
Average exchange rate (S/./US$) | 3.13 | 2.93 | 3.01 | 2.83 | 2.75 | 2.64 | ||||||||||||||||||
End of period exchange rate (S/./US$) | 3.00 | 3.14 | 2.89 | 2.81 | 2.70 | 2.55 | ||||||||||||||||||
Central Bank interest rate (end of period) | 5.00 | % | 6.50 | % | 1.25 | % | 3.00 | % | 4.25 | % | 4.25 | % | ||||||||||||
Population (million)(2) | 28.2 | 28.7 | 29.1 | 29.6 | 30.0 | 30.5 | ||||||||||||||||||
Unemployment rate(2) | 8.4 | % | 8.4 | % | 8.4 | % | 7.9 | % | 7.7 | % | 7.5 | % | ||||||||||||
Total public debt(1) | 31.9 | 30.6 | 34.5 | 36.0 | 38.3 | 40.1 | ||||||||||||||||||
Public debt/nominal GDP (%) | 28.5 | % | 25.9 | % | 26.1 | % | 23.3 | % | 21.2 | % | 19.9 | % | ||||||||||||
Net reserves | 27.7 | 31.2 | 33.1 | 44.1 | 48.8 | 64.0 | ||||||||||||||||||
Net reserves/nominal GDP (%) | 25.8 | % | 24.6 | % | 26.1 | % | 28.7 | % | 27.6 | % | 31.8 | % | ||||||||||||
Fiscal surplus (deficit)/nominal GDP (%)(1) | 2.9 | % | 2.4 | % | (1.3 | %) | (0.3 | %) | 1.9 | % | 2.0 | % | ||||||||||||
Source: Peruvian Central Bank, SBS, Ministry of Economy and Finance, National Statistical Institute of Peru (INEI), IMF.
| (1) | 2012 projected by the Peruvian Central Bank. |
| (2) | 2012 projected by IMF. |
Average annual inflation, measured by the change in the CPI index, was 3.4% in the period from 2007 to 2012. Peru’s price stability has also been reflected in its currency, the nuevo sol, which appreciated from an average of S/.3.13 per US$1.00 in 2007 to an average of S/.2.64 per US$1.00 in 2012, an appreciation of 15.6%. Given its sustained performance with regards to fiscal balance, debt/GDP ratio, net reserves and high liquidity (international reserves are higher than the equivalent of 16 months of imports of goods and services and 5.6 times the debt service (which includes the portion of long term debt due that year and the short term debt, according to 2011 figures), Peru’s sovereign debt has been granted investment grade rating by S&P, Fitch and Moody’s. At the end of 2012, Peruvian sovereign debt had one of the highest credit ratings in the South American region, rated BBB by S&P (August 2011) and Fitch (October 2011) and Baa2 by Moody’s (August 2012).
81
Table of Contents
The following table sets forth real gross domestic product by expenditure for the years indicated.
| Year ended December 31 | ||||||||||||||||||||||||
GDP by Expenditure (% of GDP unless otherwise stated) | 2007 | 2008 | 2009 | 2010 | 2011 | 2012(1) | ||||||||||||||||||
Government consumption | 9.0 | 9.0 | 10.3 | 10.1 | 9.8 | 9.4 | ||||||||||||||||||
Private consumption | 61.5 | 64.0 | 65.4 | 61.9 | 60.8 | 65.9 | ||||||||||||||||||
Total fixed investment | 21.5 | 25.9 | 22.9 | 25.1 | 24.1 | 29.7 | ||||||||||||||||||
Public sector | 3.4 | 4.3 | 5.2 | 5.9 | 4.5 | 5.6 | ||||||||||||||||||
Private sector | 18.2 | 21.5 | 17.7 | 19.2 | 19.6 | 24.2 | ||||||||||||||||||
Change in inventories(2) | 1.3 | 1.0 | (2.1 | ) | 0.2 | 1.4 | 0.3 | |||||||||||||||||
Exports of goods and services | 29.1 | 27.3 | 24.0 | 25.5 | 28.7 | 17.8 | ||||||||||||||||||
Imports of goods and services | 22.4 | 27.1 | 20.4 | 22.8 | 24.8 | 23.2 | ||||||||||||||||||
Net exports | 6.7 | 0.2 | 3.6 | 2.7 | 3.9 | (5.3 | ) | |||||||||||||||||
GDP (in billions of US$) | 107.2 | 126.9 | 126.9 | 153.9 | 176.6 | 201.2 | ||||||||||||||||||
Source: Peruvian Central Bank.
| (1) | 2012 Projected by Peruvian Central Bank. |
| (2) | Defined as the difference between the volume at the end of the period and the volume at the beginning of the period; valued at the average price over the period. |
As a result of the improvement in national income and the expanding middle-income population, private consumption grew at an average annual rate of 6.3% in real terms, from 2007 to 2012. Also, during this period, private investment increased at an average rate of 13.8% in real terms, driven by an increase in projects, primarily in the mining, oil and gas, electricity, transportation, telecommunications and manufacturing sectors. Additionally, total fixed investment as a percentage of GDP increased from 21.5% in 2007 to 29.7% in 2012, reflecting an overall increase in private and public investment over that period. Domestic investments flowed mainly into mining projects, the Camisea gas project, the construction of new power plants and ongoing expansions in the cement, food, power and hotel industries.
The following chart sets forth major investment projects executed by sector in the period from 2008 to 2011.
Investment Projects by Sector, Executed during 2008 – 2011
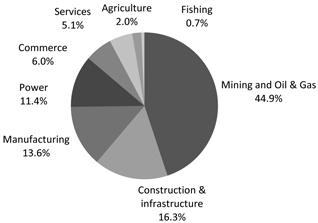
Total: US$43 billion
Source: Peruvian Central Bank—Annual reports
Key Industry Sectors Relating to Our Business in Peru
Construction and Infrastructure
The Peruvian construction industry GDP is estimated at US$14 billion and accounted for 7.1% of the country’s nominal GDP in 2012 according to the Peruvian Central Bank. Construction GDP grew at an average of 15.9%
82
Table of Contents
annually in nominal terms during the six years from 2007 to 2012. This growth has been associated with private investments in the housing, mining and manufacturing sectors as well as public projects such as toll roads, infrastructure renovation and government-sponsored housing programs such as MiVivienda and TechoPropio, run by Fondo Mivivienda (the country’s government-owned mortgage financing institution that runs the TechoPropio program and other programs, collectively referred to as MiVivienda in this prospectus). The following table illustrates that from 2007 to 2012, the average real growth rate in both private investment and construction in Peru was approximately two times the average real GDP growth rate, historically moving in the same direction as the change in the growth rate of overall real GDP.
Growth of Real Private Investment GDP and Real Construction Sector GDP vs. Real GDP
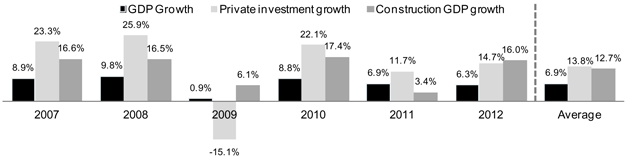
Source: Peruvian Central Bank.
Peru still lags behind other Latin American countries in infrastructure development. As shown in the table below, Peru ranks 111 out of 144 countries in terms of infrastructure quality.
Ranking of Infrastructure Quality 2012-2013
Country | Country | |
USA | 25 | |
Chile | 31 | |
Mexico | 65 | |
China | 69 | |
Brazil | 107 | |
Colombia | 108 | |
Peru | 111 |
Source: 2012 Global Competitiveness Report, World Economic Forum, based on a total of 144 countries.
Additionally, Peru still faces a significant infrastructure investment gap. According to the Peruvian Association for the Promotion of National Infrastructure (AFIN), the country’s infrastructure investment gap is estimated at US$88 billion for the period from 2012 to 2021, with the breakdown shown in the chart below. The greatest deficits are in power, telecommunications and roads.
83
Table of Contents
Peru Infrastructure Investment Gap: 2012–2021
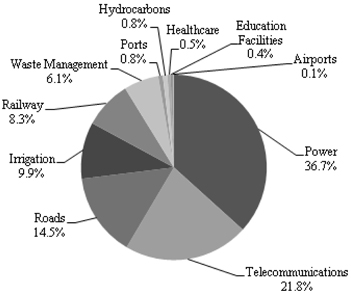
Total: US$88 billion
| Source: | Peruvian Association for the Promotion of National Infrastructure (AFIN). Infrastructure investment gap in Peru is calculated as the amount of investment needed to increase each sector’s coverage to all the unattended users (based on a cost-per-user component to define how much investment is needed). |
The Peruvian government is encouraging public-private partnerships for infrastructure concessions as a way to promote the improvement of the country’s infrastructure. Proinversión, a Peruvian state agency engaged in the promotion of private investments in Peru which is the Peruvian State agency engaged in the promotion of business opportunities, estimated public and private investments in infrastructure in Peru of US$20 billion from 2011 through 2016. We believe we are well-positioned to win contracts related to these concessions. There remains a significant transportation infrastructure investment gap estimated at US$21 billion, according to the Peruvian School of Business Administration for Graduates (ESAN), which is measured as the cost needed to increase or improve the transportation network in order to meet currently unmet demand. As of January 2013, the total transportation project pipeline that will help close this gap was US$22 billion, of which US$5 billion corresponds to projects under construction or that are expected to commence construction by 2016, according to APOYO Consultoría. To facilitate infrastructure development, the government established the framework for private-public partnerships by Legislative Decree No. 1012 and its regulation by Supreme Decree No. 146-2008-EF, which envisaged public co-financing of private infrastructure initiatives. For example, the Municipality of Lima granted joint operations in which we participate two highway concessions for which we are currently negotiating definitive documentation, Vía Expresa Javier Prado and Vía Expresa Sur. We believe that our experience in operating concessions in Peru provides us with the expertise to win additional concessions and similar contracts as the government grants such concessions to foster improvements in the country’s infrastructure.
As of 2012, the national highway network in Peru consisted of 24,092 km, of which only 5,792 km have been granted in concessions through a total of 15 concessions. We are the concessionaries for three of these 15 concessions, representing approximately 1,012 km in total. The following map sets forth the road concessions granted to private companies as of 2012. For air and maritime transportation, the ports and airports’ system is comprised of nine concessions, two of which are group concessions of various airports.
84
Table of Contents
Concessions of Roads, Airports and Ports in Peru
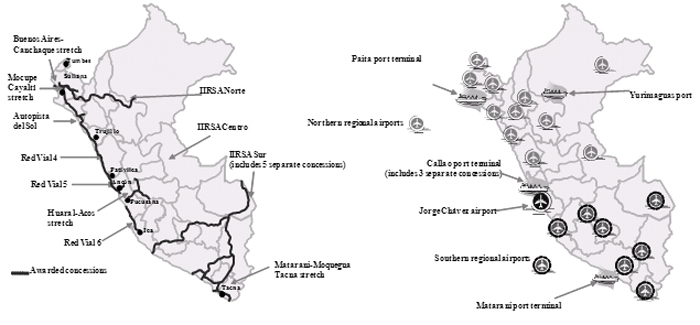
| Source: | Peruvian Supervisory Agency for Investment in Public Transportation Infrastructure (Organismo Supervisor de la Inversión en Infraestructura de Transporte Público), Proinversión, APOYO Consultoría. Roads map as of August 2012; airports/ports map as of November 2012. |
The real estate industry presents several construction opportunities for us as well, since Peru still has a housing deficit of approximately two million homes, according to estimates by National Statistical Institute of Peru (INEI), and limited mortgage penetration, with mortgages representing only 4.4% of GDP in 2012, based on data from SBS and the Peruvian Central Bank. The National Statistical Institute of Peru (INEI) calculates the national deficit based on the latest census data from 2007 and accounts for a lack of supply for current housing demand based on quantitative (number of families without homes) and qualitative (number of homes that do not meet basic standards of living set by the United Nations) deficits. As of December 31, 2012, we are developing 11 affordable housing projects, which are in various stages of development. We believe local banks are seeking to increase their mortgage lending, including for affordable housing.
The oil and gas infrastructure industry has seen significant growth due to the Camisea project. Additionally, state-owned Petroperú S.A. (“Petroperú) has also recently engaged in expanding its oil transportation network and refinery facilities, with construction between 2011 and 2025 expected to require US$11 billion of investments, as estimated by Petroperú. We have significant experience performing the engineering and construction of oil and gas infrastructure, and plan to continue seeking future contracts in this sector.
We are the leading E&C company in Peru, based on 2011 revenues as measured by Peru: The Top 10,000 Companies 2012. Other companies such as Cosapi (Peru), San Martin Contratistas Generales (subsidiary of Empresas Ica in Mexico), Ingenieros Civiles y Contratistas Generales SA (Peru) and Odebrecht (Brazil), have a significant presence in Peru. We believe we are well-positioned to maintain our leadership position.
Mining
Peru is a poly-metallic resources producer and exports several metals including silver, copper, zinc, gold and lead, among others. Peru is also a major contributor to global metal reserves. According to the U.S. Geological Survey of 2012, Peru holds 22.2% of global silver reserves, 11.2% of global copper reserves, 7.2% of global zinc reserves and 4.2% of global gold reserves as of January 2013. According to the Peruvian Central Bank, mining exports reached approximately US$27 billion and represented 58.4% of total Peruvian exports in 2012.
Companies operating in Peru’s mining sector includes major global players such as Xstrata (Las Bambas, Antamina), Barrick Gold (Alto Chicama, Pierina and Laguna Norte), Freeport (Cerro Verde), Grupo Mexico (Southern Peru), Rio Tinto (La Granja), Newmont (Yanacocha, Conga), and Glencore (Quenuales, Perubar) among others, as well as local players such as Buenaventura, Volcan, and Hochschild Mining, among others.
85
Table of Contents
Upcoming mining projects comprise estimated capital expenditures of approximately US$35 billion from 2013 to 2016, according to APOYO Consultoría. According to the Peruvian Ministry of Energy and Mines, there are 13 mining projects currently under construction and we participate in 11 of these projects as the E&C contractor. This demonstrates the strong growth potential of the local mining industry as well as private-sector commitment to exploration initiatives. As of October 2012, the Peruvian Ministry of Energy and Mines estimates 51 mining projects at various stages of development involving an estimated investment of US$53 billion. We are a leading E&C company for mining projects and we believe our recent acquisition of control of Vial y Vives, which specializes in E&C for the mining sector, will strengthen our ability to compete for contracts in this sector.
Mining Investment Projects by Level of Development
| Number of Projects | US$ billion | |||||||
Expansion | 10 | 7.4 | ||||||
With approved Environmental Impact Assessment (“EIA”) | 13 | 20.0 | ||||||
With EIA under evaluation | 3 | 0.4 | ||||||
Exploration | 25 | 24.9 | ||||||
|
|
|
| |||||
Total | 51 | 52.6 | ||||||
|
|
|
| |||||
Source: Peruvian Ministry of Energy and Mines.
Power and Utilities
The power and utilities market in Peru has shown sustained growth with maximum electricity demand reaching 5,291 MW and growing at an average annual rate of 6.8% during the six years from 2007 to 2012, according to the Economic Operations Committee of Peru’s National Interconnected System. The growth of the power and utilities market has led to the construction of power generation facilities, as well as the expansion of the power transmission and distribution network.
According to the Peruvian Ministry of Energy and Mines, Peru had an installed generation capacity of 6,968 MW as of 2012. The Peruvian market is served by 108 generation facilities which are operated by 23 companies. As of March 2012, the nation’s power transmission network spanned approximately 21,573 kilometers, according to OSINERGMIN. As of January 2012, there were 20 electric distribution companies across Peru.
Over the past six years, Peru has actively increased its efforts to extend electricity coverage throughout the country, particularly in rural areas. According to ESAN, the Peruvian power sector requires investments of approximately US$32 billion for the period from 2012 to 2021 to meet the country’s increased demand for power services. According to Proinversión and APOYO Consultoría, as of January 2013, there were 36 projects of construction/expansion of generation facilities representing a total investment of US$20 billion, of which 11 projects are already under construction and seven are expected to begin construction between 2013 and 2017. Furthermore, there are 10 projects in the pipeline for the power transmission sector amounting to total investments of approximately US$2 billion, of which four projects are already under construction and three are expected to begin construction between 2013 and 2017. These projects involve the construction of approximately 2,525 kilometers of transmission lines. Additionally, in the distribution sector, the Peruvian Ministry of Energy and Mines has developed a 10-year plan to expand the electricity coverage throughout Peru. This plan involves an investment of approximately US$1 billion in the expansion of rural electric systems.
We are currently building four hydroelectric plants in Peru. Our experience in designing and building power plants, including hydro plants, as well as the services we provide to the utilities sector provide us with a foundation to seek additional contracts in Peru’s power sector as it expands in the future.
Oil and Gas
The oil and gas industry has been one of the most dynamic sectors in Peru with a sector nominal GDP average annual growth rate of 17.1% during the six years from 2007 to 2012. Oil and gas activity includes the exploration and production, and transportation and commercialization of hydrocarbon products and derivatives.
According to the Peruvian Ministry of Energy and Mines, during 2012, local production of hydrocarbons was approximately 24 MMbbl, 32 MMboe of liquefied natural gas (LNG) and 74 MMboe of natural gas. These levels
86
Table of Contents
have grown an average of 8.8% annually from 2007 to 2012. Peruvian gas production increased considerably since 2004, when the Camisea project, the largest gas project in Peruvian history, began operations. The Peruvian Ministry of Energy and Mines reports that as of 2011 proven reserves of oil and gas amount to 3,323 MMboe. These reserves have increased since 2007, due to increased exploration activities, as evidenced in the chart below. The Peruvian government’s reserves methodology may differ materially from the one mandated by the SEC.
Hydrocarbons Proven Reserves and Production Evolution in Peru (in MMboe)
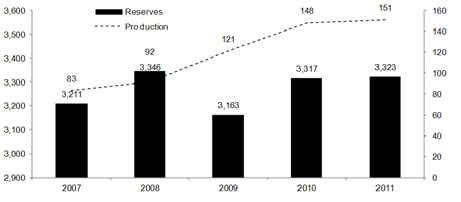
Source: Peruvian Ministry of Energy and Mines.
The exploration and production sector is mainly served by global and regional companies including Pluspetrol, Repsol, Petrobras, BPZ Energy and Savia. Certain local companies also undertake production activities. We are involved in oil production, gas processing and fractionation, and operations of fuel storage and distribution. According to the Peruvian Ministry of Energy and Mines, state-owned Petroperú, is the largest local player in refining and transporting oil and gas (as measured by volume of oil and gas processed in 2012), operating the Talara and Conchan refineries, the North-Peruvian oil pipeline and service stations. It is currently expanding the Talara refinery, which, as of December 2012, is expected to require an investment of more than US$3 billion. There are other major projects under evaluation, such as the Gasoducto Sur Peruano (Peruvian Southern Gas Pipeline), which will cover a transmission network over five Peruvian regions. According to APOYO Consultoría, as of January 2013 this project requires an estimated investment of approximately US$6 billion. The bidding process is expected to take place in 2014.
According to Proinversión and APOYO Consultoría, 34 projects comprise the oil and gas pipeline, totaling approximately US$35 billion. Eleven of these projects, totaling approximately US$9 billion, are under construction or are expected to begin construction by 2017. In this context, the Peruvian Ministry of Economy and Finance expects an average real growth of the sector GDP of 10.5% during the three years from 2013 to 2015.
Real Estate
The real estate market in Peru has grown during the past 10 years as the residential market faces increased demand from a large and growing middle-income population. Activity in the real estate sector has been driven mainly by a surge in home building in Lima, which comprised 74.0% of real estate construction activity by area in Lima in 2010, according to the Peruvian Chamber of Construction (CAPECO). Unit sales in Lima increased by 12.0% in 2012, according to data from Tinsa. Nevertheless, according to the latest available data (based on 2007 census) from National Statistical Institute of Peru (INEI) there is a housing deficit of two million houses in Peru (or 29.1% of unmet demand). Government-sponsored housing programs, including MiVivienda and Techo Propio, aim to reduce this deficit, by helping low-income families purchase houses under fully or partially financed mechanisms. The following graph sets forth the evolution of awarded loans by each program during the period from 2007 to 2012.
87
Table of Contents
Value of MiVivienda and TechoPropio Loans Disbursed in 2007-2012, in US$ million
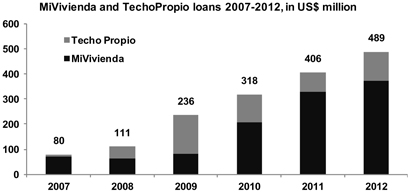
Source: MiVivienda Fund statistics.
The MiVivienda and TechoPropio programs are funded by the Peruvian government and the development and sale of the housing projects is undertaken by private investors. The government defines a number of projects and units to be built and runs bidding contests among real estate developers to design and build such projects, and sell the corresponding units. We are involved in these initiatives and we compete with other real estate companies such as Los Portales, Centenario, Besco, Urbi, Imagina and Edifica. The penetration in the housing market remains low compared to other countries. The stock of mortgage loans as of 2012 represents only 4.4% of Peruvian GDP, in contrast to Chile, for instance, which shows a mortgage to GDP ratio of 17.4% for 2011. However, the stock of mortgages in Peru has been growing during recent years at an average annual rate of 21.7% during the six years from 2007 to 2012. During 2012, US$3 billion in mortgages were granted, of which 14.7% were MiVivienda and Techo Propio mortgages.
Peru’s real estate sector is expected to grow mainly due to Peru’s growing upper and middle class, which has increased from 19.0% of households in 2003 to approximately 27.0% in 2011, representing a 56.2% increase covering approximately three million additional people, according to Ipsos APOYO and the National Statistical Institute of Peru (INEI).
Information Technology
The local IT industry has been growing as technology is becoming a larger component of business processes. The International Data Corporation (IDC), a market intelligence firm focused on the information technology market, estimates the IT spending in Peru was US$395 million in 2011, excluding subcontracting, and is expected to grow at an average annual rate of 12.0% from 2012 to 2015. The Peruvian IT market comprises three types of products/services: (1) IT services (including technical support, consulting and IT outsourcing services for firms); (2) software applications (including the development and commercialization of software programs, including both off-the–shelf and custom-made applications) many of which are custom-designed for specific industries; and (3) platforms (consisting of computer hardware and infrastructure, including equipment, basic software and communication devices).
The main industry players include GMD (our IT company), IBM, HP, Oracle, Cosapi Data, Optical IP, Synapsis, and major telecommunications operators such as Telefónica del Perú and Claro. The Peruvian market is expected to follow global growth based on higher demand for access to technology solutions.
88
Table of Contents
Our Other Markets: Chile and Colombia
Chile
Overview of the Chilean Economy
Our activities in Chile span across the E&C and power services sectors. The following table sets forth the main economic indicators of the Chilean economy for the period from 2007 to 2012.
Values in nominal US$ billion unless otherwise stated | 2007 | 2008 | 2009 | 2010 | 2011 | 2012 | ||||||||||||||||||
Nominal GDP | 173.0 | 179.9 | 173.0 | 216.3 | 248.7 | 264.5 | ||||||||||||||||||
Nominal GDP / capita (US$) | 10,423.3 | 10,729.5 | 10,216.7 | 12,650.9 | 14,421.5 | 15,196.8 | ||||||||||||||||||
Real GDP growth rate (%)(1) | 5.2 | % | 3.1 | % | (0.9 | %) | 6.1 | % | 5.9 | % | 5.5 | % | ||||||||||||
Inflation (%, measured by change in CPI) | 7.8 | % | 7.1 | % | (1.4 | %) | 3.0 | % | 4.4 | % | 1.5 | % | ||||||||||||
Total private and public fixed investment(2) | 34.7 | 44.4 | 37.6 | 46.4 | 57.6 | 63.3 | ||||||||||||||||||
Average exchange rate (CLP/US$) | 522.7 | 521.8 | 559.7 | 510.4 | 483.4 | 486.8 | ||||||||||||||||||
End of period exchange rate (CLP/US$) | 495.8 | 629.1 | 506.4 | 468.4 | 521.5 | 478.6 | ||||||||||||||||||
Population (million)(3) | 16.6 | 16.8 | 16.9 | 17.1 | 17.2 | 17.4 | ||||||||||||||||||
Unemployment rate(3) | 7.0 | 7.8 | 10.8 | 8.2 | 7.1 | 6.6 | ||||||||||||||||||
Public Debt / nominal GDP (%)(2, 4) | 13.8 | % | 18.1 | % | 20.8 | % | 19.4 | % | 27.4 | % | 24.4 | % | ||||||||||||
Net reserves / nominal GDP (%) | 9.8 | % | 12.9 | % | 14.7 | % | 12.9 | % | 16.9 | % | 15.7 | % | ||||||||||||
Fiscal surplus (deficit) / nominal GDP (%)(5) | 7.8 | % | 3.9 | % | (4.3 | %) | (0.5 | %) | 1.3 | % | 0.6 | % | ||||||||||||
Source: Chilean Central Bank, Chilean Government Budget Office, IMF, Global Insight.
| (1) | 2012 Projected by Chilean Central Bank. |
| (2) | 2012 Projected by Global Insight. |
| (3) | 2012 Projected by the IMF. |
| (4) | 2012 data as of September 2012. |
| (5) | 2012 Projected by Chilean Government Budget Office. |
The Chilean economy grew at an average annual rate of 4.2% during the six years from 2007 to 2012 in real terms. Considering only the post-crisis period (the three years from 2010 to 2012), the annual growth rate rises to 5.8%, one of the highest in South America. This expansion was mainly driven by a strong domestic demand: fixed investment grew on average at 9.5% per year in real terms and total consumption grew on average at 5.9% per year during the six years from 2007 to 2012 in real terms. Inflation has remained stable since 2010, averaging 3.7% between 2007 and 2012, in line with the Chilean Central Bank’s inflation target of 3% +/– 1%. Chile’s sovereign debt has the highest rating in the region, rated AA– by S&P (December 2012), Aa3 by Moody’s (December 2012) and A+ by Fitch (January 2012).
Key Industry Sectors Relating to Our Business in Chile
Mining
Chile has one of the most significant mining sectors in Latin America, exporting several metals, including copper, silver, gold and nickel and it is the largest producer of copper worldwide. In 2012, Chile’s copper production represented 31.6% of the world’s global production and 27.9% of the world’s copper reserves, according to the Chilean Copper Commission (COCHILCO), a specialized agency that advises the Chilean government on matters concerning the production of copper and copper byproducts and metals and industrial minerals mining, except coal and fuels.
The largest copper producer in Chile (measured by 2011 production volume) is Corporación Nacional del Cobre (CODELCO), a state-owned company and the largest copper producer worldwide. There are also several privately owned companies not owned by the Chilean government that operate mines, both local and foreign. For example, Escondida (BHP Billiton) operates the highest-producing copper mine in the world.
The pipeline of mining projects in Chile comprises approximately US$61 billion planned for the period 2013 to 2016, according to the Chilean Copper Commission (COCHILCO). Some of these projects have already granted E&C contracts, several of which were granted to us, including a primary crusher for Mina Caserones, developed by Minera Lumina Copiapo. However, most have yet to contract the associated E&C work, and we believe this is an opportunity for us.
89
Table of Contents
Construction and Infrastructure
In 2012, Chile’s construction industry nominal GDP was approximately US$22 billion. Chile ranked as the top Latin American country in terms of infrastructure quality, according to the 2012 Global Competitiveness Report. Despite this ranking, Chile still faces a large infrastructure investment gap, as noted by the Chilean Chamber of Construction, of approximately US$48 billion for the period from 2012 to 2016.
In Chile, E&C companies include large local players such as Salfacorp, Socovesa, Sidgo Kopers, Echeverria Izquierdo, Ingevec, Besalco, Paz and Claro Vicuña Valenzuela. Regional players in the Chilean market include Odebrecht and Techint.
Power
The Chilean power system is comprised of four grids: Sistema Interconectado del Norte Grande (SING), Sistema Interconectado Central (SIC), Sistema de Aysén and Sistema de Magallanes. The SIC and the SING grids account for approximately 99.2% of Chile’s installed power generation capacity. The Chilean energy market is controlled by the private sector in all of its three subsectors (generation, transmission and distribution). The SIC grid’s energy production reached 46,095 Gwh in 2011. As of 2011, Chile has one of the highest energy costs in the region, according to the Economic Commission for Latin America & the Caribbean (ECLAC). According to Environment Evaluation Service (SEA), a public organism engaged in the administration and assessment of the environmental impact of projects, and Central Energía, current projects include more than US$6 billion of committed investments representing an expansion of 2,764 MW in Chile’s total generation capacity. Additionally, according to the Chilean Construction Commission (Cámara Chilena de la Construcción, or CChC), there is approximately US$12 billion in potential power generation pipeline projects from 2012 to 2016, which we believe is an opportunity for our E&C and Technical Services segments. As an example, we have recently completed the construction of the transmission line of the Maitencillo Caserones mines.
Colombia
Overview of the Colombian Economy
Our current activities in Colombia involve technical services provided primarily to the power services sector. The following table sets forth the main economic indicators of the Colombian economy for the period from 2007 to 2012.
Values in nominal US$ billion unless otherwise stated | 2007 | 2008 | 2009 | 2010 | 2011 | 2012 | ||||||||||||||||||
Nominal GDP | 207.5 | 244.3 | 233.9 | 286.3 | 333.2 | 365.7 | ||||||||||||||||||
Nominal GDP / capita (US$) | 4,723.0 | 5,496.1 | 5,200.2 | 6,291.4 | 7,234.9 | 7,847.8 | ||||||||||||||||||
Real GDP growth rate (%)(1) | 6.9 | % | 3.5 | % | 1.7 | % | 4.0 | % | 5.9 | % | 4.3 | % | ||||||||||||
Inflation (%, measured by change in CPI)(2) | 5.7 | % | 7.7 | % | 2.0 | % | 3.2 | % | 3.7 | % | 2.4 | % | ||||||||||||
Total private and public fixed investment(3) | 43.5 | 50.5 | 45.4 | 54.0 | 64.7 | 72.5 | ||||||||||||||||||
Average exchange rate (COP/US$) | 2,077.8 | 1,965.1 | 2,157.6 | 1,899 | 1,848 | 1,798.1 | ||||||||||||||||||
End of period exchange rate (COP/US$) | 2,014.8 | 2,243.6 | 2,044.2 | 1,913.9 | 1,942.7 | 1,768.2 | ||||||||||||||||||
Population (million)(1) | 43.9 | 44.5 | 45.0 | 45.5 | 46.1 | 46.6 | ||||||||||||||||||
Unemployment rate(1) | 11.2 | % | 11.3 | % | 12.0 | % | 11.8 | % | 10.8 | % | 11.0 | % | ||||||||||||
Public Debt / nominal GDP (%) | 32.9 | % | 33.3 | % | 35.0 | % | 35.0 | % | 33.8 | % | 32.9 | % | ||||||||||||
Net reserves / nominal GDP (%) | 10.1 | % | 9.8 | % | 10.8 | % | 9.9 | % | 9.7 | % | 10.2 | % | ||||||||||||
Fiscal surplus (deficit) / nominal GDP (%) | (2.8 | )% | (1.7 | )% | (3.8 | )% | (3.5 | )% | (2.1 | )% | (2.4 | %) | ||||||||||||
| Source: | Colombian National Department of Administration of Statistics (DANE), Colombian Central Bank, Colombian Treasury Department, IMF, Global Insight. |
| (1) | 2012 Projected by the IMF. |
| (2) | 2012 Projected by the Colombian Central Bank. |
| (3) | 2012 Projected by the Global Insight. |
Colombian real GDP grew at an average annual rate of 4.4% during the six years from 2007 to 2012. The country’s strong economic growth is evidenced by an increase in GDP per capita from US$4,723 in 2007 to US$7,848 in 2012. Inflation has remained stable over recent years, averaging 4.1% per year from 2007 to 2012, in line with the Colombian Central Bank’s inflation target of 3% +/– 1%. Additionally, Colombia’s price stability has also been reflected in its currency, the Colombian peso, which appreciated from an average of COP 2,077.8 per US$1.00 in 2007 to an average of COP 1,798.1 per US$1.00 in 2012. Colombia’s credit ratings were upgraded in 2011 to investment grade by the three major rating agencies. Its sovereign debt currently holds BBB– rating from
90
Table of Contents
Fitch and S&P, and Baa3 from Moody’s. Colombia is also recognized for its investor-friendly legal regime. A study published in 2012 by the World Bank and the International Finance Corporation ranked Colombia the first in Latin America and the Caribbean, and fifth in the world in terms of investor protections.
Key Industry Sectors Relating to Our Business in Colombia
Oil and Gas
The Colombian oil and gas sector GDP has grown at an average annual real growth rate of 13.4% during the five years from 2007 to 2011. According to the Colombian National Department of Administration of Statistics (DANE), as of September 2012, this sector accounted for 5.5% of the Colombian GDP during the first nine months of 2012. According to the Colombian Petroleum Association (“ACP”), a trade union for private oil companies in Colombia, as of 2011, the country had overall proven reserves of 3,225 MMboe, including oil as well as natural gas, which have increased 63.5% since 2007. The ACP reserves methodology may differ from the one mandated by the SEC. Production in Colombia reached 420 MMboe during 2012, having increased 74.4% since 2007. These production levels are mainly attributed to large regional players such as Ecopetrol and Pacific Rubiales, which together accounted for 86.1% of oil production during 2012, according to Colombian Ministry of Mines and Energy. There have been significant investments in the oil and gas sector in Colombia. As an example, Ecopetrol and Pacific Rubiales have made capital expenditures of US$31 billion and US$4 billion, respectively, during the five years from 2008 to 2012, consequently increasing exploration and drilling activities that have created a vast range of opportunities for engineering and construction contractors, who serve the exploration and production companies in Colombia. Several investment projects are currently focused on further developing the oil and gas infrastructure in Colombia. For instance, the expansion of the Bicentenario pipeline and the Oleoducto del Pacífico pipeline projects have total estimated investment amounts of approximately US$4 billion and US$8 billion, respectively, and are expected to be completed by 2020. Furthermore, Ecopetrol plans to invest US$80 billion from 2012 to 2020 in capital expenditures. Given our experience, we believe that we can capitalize on the expansion of the oil and gas sector in Colombia.
Infrastructure
Colombia ranked 108 of 144 countries in infrastructure quality according to the 2012 Global Competitiveness Report. According to Colombian national agencies including the Ministry of Transport, the National Infrastructure Agency and the National Planning Department, the infrastructure development plan for 2012 through 2021 envisions public and private investments of approximately US$55 billion, of which US$19 billion have been committed to projects in 2012—2014. According to the Colombian National Planning Department, this initiative includes US$42 billion to be spent on roads and railroads construction between 2012 and 2021, which we believe presents a future opportunity for our E&C and Infrastructure segments.
In Colombia, E&C companies include large local players such as Conalvias, Conconcreto, CSS Constructora, Construcciones Civiles, Montajes Morelco, Mincivil, Marval, Odinsa, and Constructora el Condor. Regional players in the Colombian market include Odebrecht and Empresas Ica.
Power
The Colombian power sector is comprised of a mix of government and privately owned companies. The country’s net installed capacity reached 14,478 MW, according to the Colombian Ministry of Mines and Energy, as of December 2012. As of September 2012, there were 43 electricity generation companies including several players such as EPM, Emgesa, Isagen and EEPSA. The transmission grid consists of approximately 8,738 miles of transmission lines and is comprised of nine companies. The distribution subsector is comprised of 32 distributors, mostly municipally-controlled companies.
According to a Business Monitor International (BMI) report, a publication on global emerging markets, of June 2012, current and upcoming projects in the sector include more than US$12 billion of committed investments through 2018, representing an expansion of 5,500 MW in Colombia’s total generation capacity, which is a future opportunity for our E&C and Technical Services segments.
91
Table of Contents
Overview
We are the largest engineering and construction company in Peru, and the largest publicly-traded engineering and construction company in Latin America as measured by market capitalization as of December 31, 2012, with strong complementary businesses in infrastructure, real estate and technical services.
With 80 years of operations, we have a long track record of successfully completing the engineering and construction of many of Peru’s landmark private- and public-sector infrastructure projects, such as the Lima International Airport and the Peru LNG gas liquefaction plant, and we believe we have earned a reputation for operational excellence in our markets. We have developed a highly-experienced management team, a talented pool of more than 3,500 engineers and a skilled work force that share our core corporate values.
Beginning in the mid-1980s, we leveraged our engineering and construction expertise into complementary lines of business, such as the development, ownership, operation and maintenance of infrastructure assets (including the Lima Metro, Peru’s only urban railway system), real estate development, and the provision of technical services primarily to infrastructure-related assets. We believe our business mix creates significant opportunities across our lines of business, generates more stable revenues and earnings on a consolidated basis, and provides additional financial stability to our company.
As a result of our performance in Peru, we have been requested by clients to undertake the engineering and construction of large and complex projects outside our home market, such as the Pueblo Viejo gold mine in the Dominican Republic. Through the successful execution of those projects, we have developed operational experience in other Latin American countries. We have further expanded our activities in other key markets of the region through the acquisition of businesses with solid positions in those markets, more recently through the acquisition of the Chilean construction company Vial y Vives, which specializes in the mining sector.
The table below shows our revenue growth from 2003 to 2009 under Peruvian GAAP and from 2010 to 2012 (upon our conversion to IFRS) under IFRS.
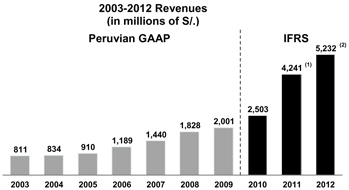
| (1) | Includes S/.558 million of revenues from a business we acquired in 2011. |
| (2) | Includes S/.658 million of revenues from businesses we acquired in 2011 and 2012. |
During 2012, we generated revenues of S/.5,231.9 million (US$2,050.9 million), EBITDA of S/.775.7 million (US$304.1 million), and net profit of S/.366.3 million (US$143.6 million) including net profit attributable to controlling interest of S/.290.0 million (US$113.7 million). From 2010 through 2012, our consolidated revenues grew at a CAGR of 44.6% (35.2% excluding acquisitions). In addition, as of December 31, 2012, our backlog amounted to S/.10,450.3 million (US$4,096.5 million), which represented 2.2x our related revenues for the year. Moreover, 76.3% of our backlog as of such date is comprised of contracts in the private sector, strategically targeted to our key end-markets, such as mining, infrastructure, power, energy and real estate. See “—Backlog.”
Our E&C segment was founded in 1933 and is currently the largest player in Peru in terms of 2011 revenues, based on Peru: The Top 10,000 Companies 2012, a publication which ranks the top 10,000 companies in Peru by revenue. Throughout our history, we (on our own or as a majority or minority partner in joint operations) have
92
Table of Contents
completed projects in almost every major sector of the Peruvian economy. Some of these landmark projects include the construction of the Peru LNG gas liquefaction plant for Hunt Oil and Repsol, one of the largest foreign direct investments in Peru’s history; the engineering and construction of the 605 km Mantaro-Socabaya transmission line for Hydro Quebec, which connected the country’s electrical grids; and the expansion of the Cuajone copper mine operated by Southern Copper, the largest copper mine and smelter complex in the world at that time. We also completed the Lima Metro, and have built many of the iconic buildings in the country, including the Westin Lima Hotel and the Gran Teatro Nacional, as well as approximately 8,000 affordable housing and housing units. In addition to our activities in Peru, clients often request us to execute the engineering and construction of complex projects abroad, including the construction of the Pueblo Viejo gold mine for Barrick Gold in the Dominican Republic, the engineering and construction of the Four Seasons Hotel in Mexico City, and, as part of a joint operation with SNC-Lavalin and Techint, the project management (EPCM) of the Mina de Cobre Panamá project developed by Inmet Mining, the second largest foreign investment project in Panama’s history, after the Panama Canal.
Our Infrastructure, Real Estate and Technical Services segments operate complementary lines of business, many of which are typically carried out under long-term arrangements that provide a more stable cash flow stream. In our Infrastructure segment, we currently have long-term concessions or similar contractual arrangements in Peru for three toll roads, the Lima Metro, a waste water treatment plant in Lima, multiple fuel storage facilities, two producing oil fields, and a gas processing plant. In our Real Estate segment, we primarily develop and sell homes targeted to low- and middle-income population sectors which are experiencing a significant increase in disposable income, as well as, to a lesser extent, office and commercial space. In our Technical Services segment, we provide operation and maintenance services for infrastructure assets, information technology (IT) services, including IT outsourcing, systems integration, application outsourcing and business process outsourcing services, and electricity networks services, including installation, operation and maintenance of electrical metering systems and related infrastructure.
In addition to our activities in Peru, we have recently completed two international acquisitions. In February 2011, we acquired a controlling interest in CAM. Headquartered in Chile, CAM provides technical services to power utility companies in Chile, Peru, Colombia and Brazil. In November 2012, we acquired a controlling interest in Vial y Vives, an engineering and construction company specializing in the Chilean mining sector, consolidating our strong position in the Latin American mining E&C sector. We expect to continue to selectively undertake projects and pursue acquisitions and strategic alliances in Latin America to further expand our company outside Peru, with a particular focus on Chile and Colombia.
We have developed an extensive and talented team, including more than 3,500 engineers, that gives us the capability and scale to undertake large and complex projects. We put significant emphasis on promoting our core corporate values of quality, professionalism, reliability and efficiency. As a company listed on the Lima Stock Exchange since 1997, we also abide by the highest corporate governance standards in Peru.
The table below sets forth selected financial information relating to our business.
| As of and for the year ended December 31, | ||||||||||||||||
| 2010 | 2011 | 2012 | 2012 | |||||||||||||
| (in millions of S/.) | (in millions of US$) | |||||||||||||||
Revenues | 2,502.7 | 4,241.3 | 5,231.9 | 2,050.9 | ||||||||||||
EBITDA | 553.9 | 662.0 | 775.7 | 304.1 | ||||||||||||
Net profit | 276.7 | 336.2 | 366.3 | 143.6 | ||||||||||||
Net profit attributable to controlling interest | 252.8 | 289.1 | 290.0 | 113.7 | ||||||||||||
Dividends per common share (in S/. or US$) | 0.05 | 0.10 | 0.16 | 0.06 | ||||||||||||
Net debt | (340.0 | ) | (128.3 | ) | 65.4 | 25.6 | ||||||||||
Net debt/EBITDA ratio | (0.6 | )x | (0.2 | )x | 0.1x | |||||||||||
Backlog(1) | 3,790.4 | 6,583.2 | 10,450.3 | 4,096.5 | ||||||||||||
Backlog/revenues ratio(1)(2) | 1.8x | 1.8x | 2.2x | |||||||||||||
| (1) | Does not include our Real Estate segment and in our Infrastructure segment our Norvial toll road concession or our Energy line of business. See “—Backlog.” |
| (2) | Backlog is calculated as of the last day of the applicable year. Revenues are calculated for such year and converted into U.S. dollars based on the exchange rate published by the SBS on December 31 of the corresponding year. Includes revenues only for businesses included in backlog. |
93
Table of Contents
Our History
Graña y Montero has been operating in Peru since 1933 and is listed on the Lima Stock Exchange since 1997. Set forth below are key highlights in our company’s history:
| • | Graña y Montero traces its origins to its predecessor company GRAMONVEL, founded 80 years ago by, and named after, engineers Alejandro Graña Garland, Carlos Montero Bernales and Carlos Graña Elizalde. We began primarily as a construction company. |
| • | We expanded our operations internationally in 1943 with our contract to build a Nestle factory in Venezuela. |
| • | In 1948, we began one of our largest projects since our founding – the construction of the city of Talara for the International Petroleum Company, which was completed in 1957. |
| • | In 1949, GRAMONVEL merged with Morris y Montero to form Graña y Montero Contratistas Generales S.A. (now GyM S.A., our construction subsidiary), expanding its service offerings and increasing its capacity to undertake large-scale infrastructure projects. |
| • | In 1968, José Graña Miró Quesada joined GyM S.A., and eventually became its chief executive officer in 1982, instilling our core corporate values of quality, professionalism, reliability and efficiency. |
| • | In 1983, we began a diversification strategy by developing complementary lines of business. In 1984, we founded GMP, our oil and gas subsidiary. In 1985, we partnered with Sonda S.A. (a Chilean IT services company) to form GMD, our IT services subsidiary. Beginning in 1987, we founded our real estate development business, currently Viva GyM. |
| • | In 1996, we reorganized our subsidiaries and founded Graña y Montero, which became the principal shareholder of all our subsidiaries. In 1997, we listed our company on the Lima Stock Exchange. |
| • | In 1998, the company built Larcomar, a landmark shopping center in Lima that has become a popular tourist destination, which we sold in 2010. |
| • | In 2003, 2006 and 2007, we were awarded the concessions for the construction, operation and maintenance of the Norvial, Canchaque and Survial toll roads, respectively. |
| • | In 2007, we also developed the first large-scale affordable housing project in Lima, consisting of 3,400 apartment units and located in the district of El Agustino. |
| • | In 2011, Graña y Montero acquired 75.0% of CAM, a leading company in the electricity sector based in Chile, and formerly part of the Latin American power generation and distribution company Enersis. In 2012, Graña y Montero acquired 74% of Vial y Vives, an engineering and construction company specializing in the Chilean mining sector. |
| • | In 2012, we began operating the Lima Metro. |
94
Table of Contents
Our Corporate Structure
The following organizational chart sets forth our principal operating subsidiaries within our four business segments.
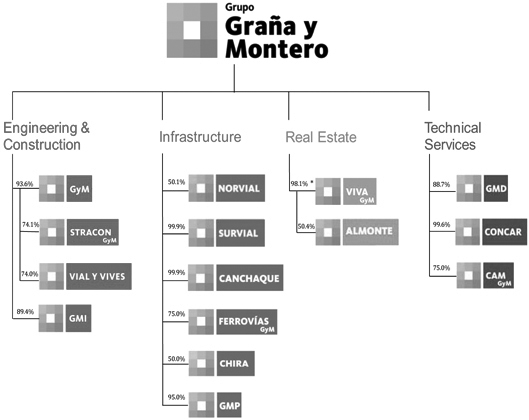
| * | 38.9% of the share capital in Viva GyM is held by our subsidiary GyM. |
The following charts set forth the principal activities of each of our four business segments:
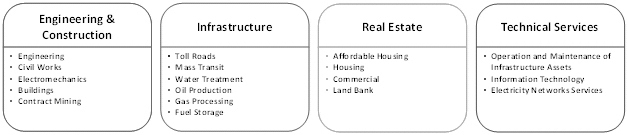
The following is a brief description of our principal operating subsidiaries:
| • | Engineering and Construction: |
| • | GyM S.A. (“GyM”) is one of the oldest and largest construction companies in Peru. Graña y Montero owns 93.6% of GyM; the remaining 6.3% is held by former and current company executives. |
| • | Stracon GyM S.A. (“Stracon GyM”) provides services to the mining and construction industries. GyM owns 74.1% of Stracon GyM; the remaining 25.9% is held by Stracon S.A.C., an affiliate of a New Zealand contractor. |
| • | Vial y Vives S.A. (“Vial y Vives”) is a Chile-based engineering and construction company specializing in the mining sector. GyM owns 74.0% of Vial y Vives; Inversiones VyV S.A., a company controlled by the founders of Vial y Vives, owns 14.9%; and the remaining 11.0% is held by company executives. |
| • | GMI S.A. (“GMI”) is primarily engaged in engineering consultancy for projects in the mining, hydrocarbons, electrical, agricultural, industrial, tourism and transportation sectors. Graña y Montero owns 89.4% of GMI; 4.0% is held by current and former company executives; and the remaining 6.6% is held by third parties. |
95
Table of Contents
| • | Infrastructure: |
| • | Toll Roads: |
| • | Norvial S.A. (“Norvial”) is the concessionaire of the 183 km stretch between Ancón and Pativilca of the Panamericana Norte road. Graña y Montero owns 50.1% of Norvial; JJC Contratistas Generales S.A., a Peruvian construction company, owns 33.0%; and Besco S.A., a Peruvian affiliate of the Chilean construction company Besalco S.A., owns the remaining 16.9%. |
| • | Survial S.A. (“Survial”) is the concessionaire of the 750 km highway between Marcona and Urcos in Peru. Graña y Montero owns 99.9% of Survial. |
| • | Concesión Canchaque S.A. (“Canchaque”) is the concessionaire of the 78 km highway between the towns of Buenos Aires and Canchaque in Peru. Graña y Montero owns 99.9% of Canchaque. |
| • | Mass Transit: |
| • | GyM Ferrovías S.A. (“GyM Ferrovías”) is the concessionaire of the Lima Metro. Graña y Montero owns 75.0% of GyM Ferrovías; the other 25.0% is held by Ferrovías S.A.C., a railway infrastructure company. |
| • | Water Treatment: |
| • | La Chira S.A. (“La Chira”) is the concessionaire of La Chira waste water treatment plant in southern Lima, Peru. Graña y Montero owns 50.0% of La Chira; the other 50.0% is held by Acciona Agua S.A, an affiliate of a waste water treatment and distribution company. |
| • | Energy: |
| • | GMP S.A. (“GMP”) is engaged in the oil and gas business and currently provides hydrocarbon extraction services to Perupetro, a Peruvian state oil company; owns a gas processing plant; and, through a joint operation with a Peruvian affiliate of Oiltanking GmbH, operates nine fuel terminals in Peru. Graña y Montero owns 95.0% of GMP; the remaining 5.0% is held by a company executive. |
| • | Real Estate: |
| • | Viva GyM S.A. (“Viva GyM”) is focused on the development and sale of affordable housing and housing, as well as other real estate projects such as office buildings and shopping centers. Graña y Montero directly owns 59.1% of Viva GyM, with GyM owning an additional 38.9%; and the other 1.9% is owned by company executives. |
| • | Inmobiliaria Almonte S.A.C. (“Almonte”) is a real estate company which owns 800 hectares of land in southern Lima. Viva GyM owns 50.4% of Almonte; Inversiones Sur S.A., which is part of a Chilean economic group, owns 22.0%; and the other 27.6% is owned by third parties. |
| • | Technical Services: |
| • | GMD S.A. (“GMD”) is a provider of IT services and business solutions. Graña y Montero owns 88.7% of GMD; 5.9% is held by company executives; and the remaining 5.5% is held by one of our directors. |
| • | Concar S.A. (“Concar”) is engaged in the operation and maintenance of infrastructure assets. Graña y Montero owns 99.6% of Concar. |
| • | CAM S.A. (“CAM”) provides field and specialized electrical services in Chile as well as in Brazil, Colombia, and Peru. Graña y Montero owns 75.0% of CAM; and the other 25% is held by El Condor Combustibles S.A., which is part of a Chilean economic group. |
For a description of the shareholdings of our executives and directors in our operating subsidiaries, see “Management— Share Ownership.”
96
Table of Contents
Our Strengths
We believe our company’s strengths provide us with significant competitive advantages. Our principal strengths include the following:
Leader in fast-growing markets
We are the largest engineering and construction company in Peru and the largest publicly-traded engineering and construction company in Latin America as measured by market capitalization as of December 31, 2012. Peru is undergoing a period of unparalleled development, with over 6.5% average annual real GDP growth between 2008 and 2012 and significant private and public investments in the mining, power, oil and gas, transportation, real estate and other infrastructure sectors. We have completed some of the most complex and large-scale infrastructure projects in the country, and we believe we are an integral part of Peru’s ongoing transformation with projects that contribute to the overall economic development of the country. We believe our expertise, reputation, scale and operational capabilities in Peru position us to take advantage of the country’s favorable economic conditions and growth opportunities. We believe we are also a significant infrastructure concessionaire in Peru, the largest apartment building developer in Peru and the second largest IT company in Peru.
We believe we are well-positioned to leverage our platform in the Peruvian market to continue to grow our business in other countries in Latin America, primarily Chile and Colombia. Throughout our history, we have undertaken complex E&C projects in the region and have recently completed acquisitions in Chile. Moreover, we believe we are one of the leading mining E&C companies in Latin America.
Long-standing track record and reputation for operational excellence
During our 80-year history, we have focused on the successful and on-time execution of complex projects, through our “deliver before deadline” and “lean construction” initiatives. Our extensive experience has allowed us to gain deep market knowledge and expertise, which help us better serve our clients and manage risks in our contractual arrangements. We believe we have a reputation for operational excellence, and were named among the top ten most admired companies in Peru by PwC in 2012. In addition, KPMG ranked us seventh out of 100 companies with the best reputations in Peru in 2012. We believe that our track record and the reputation we have earned in our markets are key factors in winning new and repeat business, as well as in partnering with strategic industry players and attracting top talent to our company.
Complementary lines of business which generate more stable cash flows and create additional business opportunities across our segments
We have expanded our company by developing complementary lines of business, many of which have become leaders in their respective markets. These lines of business create significant business opportunities across our segments, enabling us to capture a greater share of infrastructure spending, and also generate cost synergies. One example is Norvial, a toll-road concession operated within our Infrastructure segment. In addition to managing the concession, we used our E&C segment to design and construct the expansion of the highway and, once constructed, we are now using our Technical Services segment to operate and maintain the highway. In addition to increasing our levels of consolidated activity, many of these lines of business enable us to achieve more stable cash flows through medium and long-term client service contracts and concessions, which counter in part the cyclicality of the engineering and construction business.
High growth and profitability with strong financial position
Our operations have grown significantly over the last several years, with our consolidated revenues growing at CAGR of 44.6% (35.2% excluding acquisitions) from 2010 to 2012. We have achieved this growth with low levels of indebtedness, relying mainly on cash flow from operations to fund our growth. As of December 31, 2012, our net debt was S/.65.4 million (US$25.6 million) and our EBITDA to net debt ratio was 0.1x. In 2012, we achieved an EBITDA of S/.775.7 million (US$304.1 million), with an EBITDA margin of 14.8%.
97
Table of Contents
Robust backlog and significant additional potential projects
We have a robust and growing backlog which amounted to S/.10,450.3 million (US$4,096.5 million) as of December 31, 2012, 67.8% higher than as of December 31, 2011. We believe that our backlog, which represents approximately 2.2x our 2012 revenues, provides visibility as to our potential for growth in the coming years, although backlog may not always be an accurate indicator of future revenues. See “Risk Factors—Risk Related to Our Company—Our backlog and our ratio of historical backlog to revenues may not be reliable indicators of future revenues or profit.” We believe our backlog is strategically targeted to our key end-markets. In addition to our backlog, we also have significant potential projects in our pipeline. We have already been awarded concessions for the Via Expresa Javier Prado and Via Expresa Sur expansion projects, for which we are currently in the contract negotiation stage. We are also in the process of obtaining the necessary licenses to begin construction of our large multi-use real estate development project at Cuartel San Martín. Furthermore, we continuously evaluate bidding on contracts arising from the significant ongoing private and public investments in Latin America.
Proven ability to create and grow businesses organically and through acquisitions
We have proven our ability to extend our engineering and construction capabilities into complementary lines of business in a diverse range of industries, some of which began as innovative start-ups in response to client needs. For example, in 1984, we created a new IT business division, which grew and evolved through the years to become the second largest IT company in Peru. Additionally, we also have successfully acquired and integrated new businesses. In February 2011, we acquired CAM, our electricity services business headquartered in Santiago, Chile, and have integrated its operations and personnel into our company, while improving its operational performance. More recently, in November 2012, we acquired Vial y Vives, an engineering and construction company specializing in the Chilean mining sector which complements our leading E&C practice in the mining sector. We believe that our proven ability to create new businesses, develop businesses organically and acquire and successfully integrate new businesses into our platform is a key competitive advantage as we continue to expand our operations in Latin America.
Highly experienced management, talented engineers and skilled workforce, with shared core corporate values
Our senior management team has an average tenure within our company of approximately 19 years. In 2012, Euromoney recognized us as the second best managed company in the construction and cement sectors in Latin America, and among the five best managed companies in Peru. We motivate our management through performance-based compensation, which align their interests with those of our shareholders. In addition, through our efforts to attract, train and retain our workforce, we have built a talented team of employees, including more than 3,500 engineers. We also have access to a network of approximately 40,000 manual laborers throughout Peru that can supplement our workforce when required by our construction pipeline. Thanks to our extensive and talented team, we have the capability and scale to undertake large and complex projects in Peru and elsewhere.
We have been listed on the Lima Stock Exchange since 1997. We abide by the highest corporate governance standards in Peru, and we are one of only 17 companies in Latin America, and one of only three in Peru, that form part of the Company’s Circle, which recognizes companies for their high corporate governance standards and is sponsored by the International Finance Corporation (IFC), the Organization for Economic Co-operation and Development (OECD) and the Global Corporate Governance Forum. In addition, we have developed a strong corporate culture based on principles of high-quality, professionalism, reliability and efficiency. We employ rigorous safety standards and procedures and emphasize environmental sustainability and social responsibility. In 2012, our engineering and construction subsidiary GyM had an accident incidence rate of 0.29, calculated over 64,202,006 hours worked. In 2011, GyM had an accident incidence rate of 0.52, calculated over 52,979,699 hours worked, which was significantly lower than that of private construction companies in the United States for the year, which had an average of 3.80, as reported by the Bureau of Labor Statistics of the U.S Department of Labor.
98
Table of Contents
Our Strategies
Our mission is to be the most reliable engineering services company in Latin America. Our key strategies to achieve this mission include the following:
Be the contractor of choice for large-scale and complex projects in Peru and other key markets
We intend to enhance our position as a contractor of choice for large-scale and complex infrastructure projects in Peru and other key markets, by (i) utilizing the scale, expertise and market knowledge we have accumulated during our 80-year operating history to strengthen and expand our E&C segment; (ii) maintaining and further developing our long-standing client relationships based on our ongoing pursuit of operational excellence; (iii) continuing to strategically partner with global industry leaders, such as Bechtel and Fluor, with complementary capabilities for specific projects that we undertake; and (iv) leveraging our expertise in the mining sector with a view to becoming the premier mining services provider throughout Latin America.
Further expand our infrastructure-related businesses to increase activity across our business segments and generate more stable cash flows
We plan to continue to expand our infrastructure-related businesses to capitalize on private and public investments in Peru, including in toll roads, airports, ports, railroads, hospitals, water utility companies, and other power and oil and gas infrastructure assets. In addition to providing more recurring and predictable cash flows, our Infrastructure segment generates additional business opportunities for our E&C and Technical Services segments.
Maintain highly capitalized balance sheet
We seek to maintain a prudent and sustainable capital structure and a strong financial position to allow us to capitalize on additional business opportunities as they arise. We intend to remain financially disciplined by limiting substantially all our debt incurrence to identified projects with repayment sources.
Selectively pursue international opportunities, focusing on Chile and Colombia
We intend to leverage the capabilities and experience we have in Peru, particularly providing engineering and construction services to the mining, oil and gas and infrastructure end-markets, to continue to evaluate and selectively pursue opportunities in other markets. We expect to focus our efforts primarily on Chile and Colombia, which we believe offer attractive opportunities in these end-markets. We intend to evaluate other international opportunities on a case-by-case basis.
Continue fostering our core corporate values throughout the organization
We will continue to instill our core corporate values throughout our organization, while also transmitting these values to surrounding communities. We will continue to attract and develop our human capital through various training, mentorship and reward programs in order to maintain our position as the best company in Peru to learn and work in the engineering and construction field. We also seek to promote social welfare by fostering relationships with the communities that surround our areas of operation. In 2012, the Inter-American Federation of the Construction Industry recognized us for our corporate strategy and promotion of citizenship with the Latin American Social Responsibility award. We strive to promote our corporate values to strengthen our organization and improve our performance as well as to have a positive impact on the markets where we operate.
Engineering and Construction
Our E&C segment has an 80-year track record and is the largest player in Peru by 2011 revenues, based on Peru: The Top 10,000 Companies 2012, undertaking a broad range of activities relating to: engineering; civil construction; electromechanic construction; building construction; and contract mining. We provide E&C services for a diverse range of end-markets, focusing on the mining, power, oil and gas, transportation, real estate and other infrastructure sectors. The following chart sets forth our 2012 revenues by end-market.
99
Table of Contents
2012 E&C Revenues by End-Market
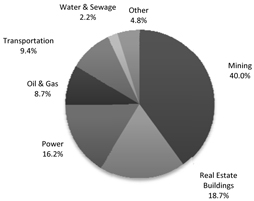
Total: US$1,381.6 million
We mainly undertake private-sector projects, particularly projects with a high degree of complexity, which enable us to develop innovative and tailor-made solutions to our clients. We provide our clients with an integral service offering by leveraging our various areas of expertise and engaging in virtually all aspects of project execution, thereby capturing a larger share of investment projects.
In 1999, we began adopting the “lean construction” philosophy as a pillar in our design and construction projects. “Lean construction” aims to create value for customers by better understanding and considering clients’ needs to improve project design, functionality and cost optimization. “Lean construction” also provides techniques and tools that significantly reduce construction waste by improving planning reliability, process design, coordination and collaboration.
Although we primarily undertake engineering and construction projects in Peru, our clients often ask us to undertake the engineering and construction of large and complex projects in other countries such as Mexico, the Dominican Republic, Bolivia, Panama and Chile. As a result, we have developed extensive experience executing projects throughout Latin America. To further capitalize on our capabilities and expertise, we have decided to expand our activities into other key markets, such as Chile and Colombia, that are benefitting from high levels of investment and are aligned with our areas of strategic focus.
The acquisition of Vial y Vives has solidified our presence in Chile. While we have been undertaking projects in Chile since 1995, such as the construction of the transmission line and crusher of the Caserones mine for SCM Minera Lumina Copiapo, we believe we will benefit from Vial y Vives’ established and long-lasting presence in the country.
Given the prevalence of mining operations in our principal markets—Peru and Chile together are estimated to have projected investment flows of approximately US$96 billion between 2013 and 2016, according to the Peruvian Ministry of Energy and Mines, Cochilco, and APOYO Consultoria—we have significant expertise with respect to specialized engineering and construction services for the mining sector. As a result, we believe we are one of the leading mining construction companies in Latin America and we leverage this expertise both within our principal markets as well as to selectively undertake complex projects across the region.
The table below sets forth selected financial information for our E&C business segment.
| As of and for the year ended December 31, | ||||||||||||||||
| 2010 | 2011 | 2012 | 2012 | |||||||||||||
| (in millions of S/.) | (in millions of US$) | |||||||||||||||
Revenues | 1,700.5 | 2,784.2 | 3,524.6 | 1,381.6 | ||||||||||||
EBITDA | 218.3 | 315.0 | 387.9 | 152.1 | ||||||||||||
EBITDA margin | 12.8 | % | 11.3 | % | 11.0 | % | ||||||||||
Net profit | 111.2 | 166.4 | 188.5 | 73.9 | ||||||||||||
Net profit attributable to controlling interest | 104.1 | 153.1 | 165.1 | 64.7 | ||||||||||||
Backlog | 2,989.2 | 4,961.5 | 7,462.7 | 2,925.4 | ||||||||||||
Backlog/revenues ratio(1) | 1.8x | 1.8x | 2.1x | |||||||||||||
| (1) | Backlog is calculated as of the last day of the applicable year. Revenues are calculated for such year and converted into U.S. dollars based on the exchange rate published by the SBS on December 31 of the corresponding year. |
100
Table of Contents
Principal Engineering and Construction Activities
The following chart sets forth our 2012 revenues by E&C activity.
2012 E&C Revenues by Activities
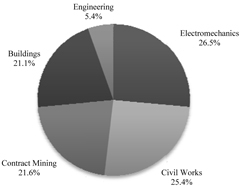
Total: US$1,381.6 million
Engineering Services
Our engineering activities consist of a broad range of services relating to engineering, supervision, geometrics and environmental consultancy, including pre-investment studies, pre-feasibility studies, process design, project development, supervision of executive designs and construction management, including construction site reviews.
Civil Construction
Our civil construction activities focus on infrastructure projects, including earthworks, the construction of roads, highways, transportation facilities (e.g., mass transit systems such as the Lima Metro), dams, hydroelectric plants, water supply and sewage projects, excavation, structural concrete construction and tunneling. Our civil construction projects are generally large and complex, requiring the use of large construction equipment and sophisticated managerial and engineering techniques.
Electromechanic Construction
Our electromechanic construction activities include the construction and assembly of concentrator plants, pipelines, transmission lines, gas and oil networks, and substations, predominantly for energy projects and industrial plants.
Building Construction
Through our building construction activities, we respond to the demands of the Peruvian real estate market with a focus on the construction of hotels, affordable housing projects, residential buildings, office buildings, shopping centers, and industrial plants.
101
Table of Contents
Contract Mining
Our contract mining activities consist of mine planning, development, construction works, operation (including earthworks, blasting, loading and hauling ore) and mine closure.
Major Projects
We have played an active role in the development of the infrastructure sector in Peru, as well as other countries in Latin America, including the construction of roads, hotels, hospitals, shopping centers, housing developments, concentrator plants, hydroelectric power plants, thermal power plants and transmission lines as well as water supply and sewage projects, irrigation projects and dam building, among others. Throughout our history, we have participated, on our own or through minority or majority interests in joint operations, in a diverse range of landmark projects, including the following:
| • | in 1948, Talara city in northern Peru for the International Petroleum Company, consisting of 2,000 homes, schools, churches, a movie theater and airport; |
| • | in 1950, a 430 km stretch of the Panamericana Sur highway; |
| • | in 1952, the Rebagliati hospital, the largest public hospital in Peru; |
| • | in 1960, the Cañón del Pato hydroelectric power plant, the second largest hydroelectric plant in Peru in terms of installed capacity; |
| • | in 1961, the Jorge Chavez International Airport, Peru’s first international airport, located in Lima; |
| • | in 1969, the Cuajone mining project, the largest copper mine and smelter complex in the world at that time and, in 1997, the Ilo smelter and refinery for Southern Copper Corporation; |
| • | in 1974, the Sheraton Hotel in Lima, and, in 1995, the Sheraton Hotel in Santiago, Chile; |
| • | in 1988, the Chavimochic irrigation project, the most significant irrigation project in Peru; |
| • | in 1992, the Four Seasons Hotel in Mexico City, Mexico; |
| • | in 1995, the U.S. Embassy in Peru; |
| • | in 1998, the Mantaro-Socobaya 605 km transmission line, which connected the country’s electrical grids; |
| • | in 2000, the Marriot Hotel in Lima; |
| • | in 2002, began providing open pit mining services, which are ongoing, to Brocal; |
| • | in 2004, the Ralco hydroelectric power plant in Chile; |
| • | in 2004, the gas fractionation plant and, in 2008, its expansion for Consorcio Camisea, Camisea project, the largest energy project in Peru’s history; |
| • | in 2005, the San Cristobal concentrator plant in Bolivia; |
| • | in 2005, the Cerro Verde mine concentrator plant for Phelps Dodge; |
| • | in 2008, the Cerro Corona concentrator plant for GoldFields; |
| • | in 2008, the Parque Agustino real estate development project, the first major affordable housing project in Peru, which consists of 3,400 units; |
| • | in 2009, the Westin Lima Hotel, currently the tallest building in Peru; |
| • | in 2010, the Melchorita liquefaction plant for Peru LNG, Camisea project; |
| • | in 2010, the Bayóvar plant for Vale; |
| • | in 2010, the Gran Teatro Nacional, the most modern theater in Peru; |
| • | in 2011, Pueblo Viejo Mine concentrator plant for Barrick Gold Corp. in the Dominican Republic; |
| • | in 2011, the first stretch of Line One of the Lima Metro for the Peruvian Ministry of Transport and Communications; and |
| • | in 2012, for project manager Bechtel, the Antapaccay copper concentrator developed by Xstrata Copper, the world’s fourth largest copper producer. |
We currently have a diversified portfolio of ongoing projects, on our own or through majority or minority interests in joint operations, in a wide range of sectors in Peru and the other countries where we operate, including the following:
| • | construction of a copper concentrator plant for the Las Bambas mining project, managed by Bechtel and developed by Xstrata Copper. Upon its scheduled completion in 2014, the project is expected to have a daily processing capacity of 140,000 tonnes; |
102
Table of Contents
| • | construction of the Nueva Fuerabamba city, an integral real estate development project for the population surrounding the Las Bambas mining project. The city, which is scheduled to be substantially completed in the fourth quarter of 2013, is expected to be located 3,800 meters above sea level, and is expected to include over 400 housing units, public buildings and basic services; |
| • | construction of a natural gas distribution network for Contugas, providing access to natural gas for five districts south of Lima. Scheduled to be completed in the third quarter of 2013, this network is expected to be the first gas distribution development outside Peru’s capital; |
| • | engineering, procurement and construction of the 510 MW Cerro del Águila S.A hydroelectric plant for IC Power, which is expected to represent approximately 10% of Peru’s installed generation capacity. The project, which is scheduled to be completed in 2015, is expected to include the construction of a 75 meter high dam and a 6 km tunnel; |
| • | construction of a 99.9 MW expansion of the Macchu Picchu hydroelectric plant for Egemsa, which is expected to be completed in 2014; |
| • | engineering, procurement and construction of La Chira, a waste water treatment plant for the city of Lima for which we also have the concession through a joint operation with Acciona Agua. This project, which is scheduled to be completed in 2014, is expected to include a 3.5 km submarine pipeline; |
| • | engineering, procurement and construction of a concentrator plant for the La Inmaculada silver and gold project, developed by Hochschild Mining. This project, which is scheduled to be completed in 2014, is expected to have a daily processing capacity of 3,500 tonnes; |
| • | construction of a concentrator plant for the Toromocho copper mine, developed by Chinalco Mining. The project, which is scheduled to be completed in 2014, is expected to have a daily processing capacity of 117,000 tonnes; |
| • | construction of a primary crusher for Mina Caserones, developed by Minera Lumina Copiapo, which is expected to have a daily production capacity of 144,230 tonnes. This project is being executed in Chile and is scheduled to be completed in 2014; |
| • | construction of access facilities and a tailings dam for the Mina Constancia project, which is scheduled to be completed in 2017 and is being developed by Hudbay Minerals Inc.; |
| • | construction of a tailings dam for the Mina de Cobre Panamá project, developed by Inmet Mining. This project, which is scheduled to be completed in 2015, is the second largest foreign investment project in Panama’s history, after the Panama Canal; |
| • | expansion of a plant for Cementos Lima, the largest cement producer in Peru. This project is scheduled to be completed in the second quarter of 2013; |
| • | design, procurement and construction of the infrastructure for the second stretch of Line One of the Lima Metro for which we also have the concession through a joint operation with GyM Ferrovías. This project, which is scheduled to be completed in 2014, is expected to include the construction of 12.4 kilometer of elevated railway, 10 stations and corresponding electrical facilities; and |
| • | construction of the Parque Central affordable housing project, an urban development that is expected to consist of approximately 2,100 units with recreational areas and facilities. |
Clients
We believe we have developed long-term relationships with many clients as a result of our performance over the years and are focused on the successful and on-time execution of complex projects, through our “deliver before deadline” and “lean construction” initiatives. Our extensive experience has earned us a reputation for operational excellence and allowed us to gain deep market knowledge and expertise, which help us better serve our clients. The
103
Table of Contents
principal clients of our E&C segment include renowned domestic and multinational mining, power, oil and gas, transportation and infrastructure development companies, such as Xstrata, Hochschild, Buenaventura, Luz del Sur, Kallpa, Transelec, Cementos Lima, Rio Alto, Chinalco Mining, Minera Lumina Copiapo, Hudbay Minerals, among others. We have a well-diversified client base as none of our engineering and construction clients accounted for 10% or more of our consolidated revenues in 2012.
Project Selection and Bidding
We win new engineering and construction contracts through public bidding processes or direct negotiation, from a variety of sources, including potential client requests, proposals from existing or former clients, opportunities sought by our commercial team and from requests by the Peruvian government. More than 80% of our 2012 revenues came from private-sector projects. The Peruvian government and its agencies typically award construction contracts through a public bidding process conducted in accordance with the Peruvian State Contracting Law (Ley de Contrataciones del Estado). In the private sector, in addition to obtaining new projects, another important source of revenue involves increases in the scope of work to be performed in connection with already existing projects. These arrangements are typically negotiated directly with the client, often during the course of the work we are already performing for that client.
We have a designated team that oversees the management of project proposals and a commercial team that reviews and evaluates potential projects in order to estimate costs. In considering whether to bid for a potential project, we principally consider the following factors: competition and the probability of being awarded the project; project size; the client; our experience undertaking similar projects; and the availability of resources, including human resources. As part of the project selection process, our commercial team performs a detailed cost analysis utilizing sophisticated software we developed to assist in determining whether the project is viable and cost-effective. If we choose to pursue a project, a budget leader is assigned to prepare the offer that is eventually presented to our potential client.
Despite the budgeting risks generally associated with engineering and construction contracts, our management believes that our experience generally allows us to estimate our project costs accurately. Our project management teams also periodically review project budgets for inconsistencies between budgeted and actual costs in order to recover for cost variations through contract renegotiation. Budgeting risks are also mitigated through advance payments. Considering that we receive advance payments for most of our E&C contracts, our E&C projects typically do not require significant working capital investment. Our E&C segment secures financing primarily to purchase machinery and equipment for our construction and contract mining services.
We are required, in the majority of our construction contracts, to provide a performance bond to guarantee project performance and completion, which remain in effect for the contract’s duration. We are also required to provide performance bonds to secure any advance payments provided to us by our clients. These bonds are periodically reduced during the project’s execution in accordance with project advancement. After the expiration of the contract term, we are typically required to provide an additional performance bond that remains valid for one year.
Contracts
We principally enter into four types of engineering and construction contracts:
| • | Cost-plus fee contracts. The contract price is based upon actual costs incurred for time and materials plus a fee, which may be a percentage of the costs incurred or a pre-determined fee. Sometimes, cost-plus fee contracts include a target price, and a contractual arrangement that determines our responsibility in the event the total cost of the project exceeds the target price or the benefit we receive if the total contract price results in cost savings. Cost-plus fee contracts tend to involve the least budgeting risk for us. |
| • | Unit price contracts. The contract price is based upon a price per unit (i.e., variable quantities of work priced at defined unit rates). Each line item of the project budget, such as cubic meter of earth excavated or cubic meter of concrete poured, has a defined price, but the quantities of the units may vary. Our bid price reflects our estimate of the costs that we expect to incur for each work unit. These contracts typically include an “escalation” clause which is essentially an adjustment mechanism to account for Peruvian inflation. |
104
Table of Contents
| • | Lump-sum contracts. The contract price is fixed. Our bid is meant to cover all costs and include a profit. The principal risk in these types of contracts are errors in calculating our costs, including those of raw materials; miscalculation of the number of units or workers needed to complete the project; unanticipated technical complexities; or other unexpected events or circumstances that may increase our costs. |
| • | Engineering, procurement and construction (EPC) contracts. EPC contracts, known as “single source” or “turn-key” contracts, are also lump-sum contracts. Pursuant to EPC contracts, we provide a broad range of basic and detailed engineering services, including preparation of the technical project specifications, detailed drawings and construction specifications; technical studies; and identification of lists of materials and equipment necessary for the project. These contracts, which we utilize predominantly for our mining contracts, require a high-level of expertise and generally involve the most budgetary risks for us. |
As of December 31, 2012, approximately 21.3% of our E&C backlog was contracted under lump-sum and EPC arrangements.
Raw Materials
The principal inputs we use in our E&C segment are, among others, fuel, cement and steel. These and the other products we require in our E&C segment may be subject to the availability of raw materials, such as oil, iron and copper, and commodity pricing fluctuations, which we monitor on a regular basis. We typically aim to enter into master supply agreements for a period of six months to one year. Although we obtain the majority of our inputs needs in Peru, we believe we have access to numerous global supply sources. The availability of these inputs, however, may vary significantly from year to year due to various factors including client demand, producer capacity, market conditions, transport costs and specific material shortages, and we may incur additional costs in obtaining them.
We purchase and lease the equipment we require for our E&C segment business from several local and international suppliers, currently with no significant concentration with any particular suppliers. While we do not have difficulty obtaining the equipment we need, we may face difficulties finding skilled personnel who are able to operate certain equipment and machinery.
Competition
We generally compete with some of the largest contractors in Peru and the other countries where we operate. Because the E&C sector is highly competitive, the markets served by our business generally require substantial resources and highly-skilled and experienced technical personnel. The principal competitors of our E&C segment include Besalco S.A., Odebrecht S.A., Andrade Gutierrez S.A., Obrascón Huarte Lain S.A., JJC Contratistas Generales S.A., Cosapi S.A., Techint SAC, SSK Montajes e Instalaciones S.A.C., Skanska del Perú S.A., Mota-Engil Peru S.A., Grupo San Jose, Salfacorp S.A., Constructores Interamericanos S.A.C. (COINSA), and San Martin Contratistas Generales. For certain projects, due to the size of the project, expertise required and other factors, we may choose to partner with our competitors, including the aforementioned companies.
Competition for our E&C segment is driven by performance, skill and project execution capabilities for completing complex projects in a safe, timely and cost-efficient manner, as well as price.
Infrastructure
We are an important toll road concessionaire in Peru, operating three toll roads. Moreover, we are the concessionaire for the Lima Metro, the largest mass-transit rail system in Peru, and a waste water treatment plant. Additionally, we operate multiple fuel storage facilities, two producing oil fields and a gas processing plant under long-term government contracts.
105
Table of Contents
The table below sets forth selected financial information for our Infrastructure business segment.
| As of and for the year ended December 31, | ||||||||||||||||
| 2010 | 2011 | 2012 | 2012 | |||||||||||||
| (in millions of S/.) | (in millions of US$) | |||||||||||||||
Revenues | 354.7 | 404.2 | 524.5 | 205.6 | ||||||||||||
EBITDA | 191.1 | 176.1 | 207.5 | 81.4 | ||||||||||||
EBITDA margin | 53.9 | % | 43.6 | % | 39.6 | % | ||||||||||
Net profit | 88.1 | 81.8 | 84.0 | 32.9 | ||||||||||||
Net profit attributable to controlling interest | 73.6 | 68.2 | 66.7 | 26.1 | ||||||||||||
Backlog(1) | 132.7 | 528.3 | 1,089.4 | 427.0 | ||||||||||||
Backlog/revenues ratio(1)(2) | 3.0x | 14.5x | 7.2x | |||||||||||||
| (1) | Does not include our Norvial toll road concession or our Energy line of business. See “Business—Backlog.” |
| (2) | Backlog is calculated as of the last day of the applicable year. Revenues are calculated for such year and converted into U.S. dollars based on the exchange rate published by the SBS on December 31 of the corresponding year. Includes revenues only for businesses included in backlog. Our ratio of backlog to revenues for our Infrastructure segment is not representative of what we would expect the ratio to be in future periods because in 2010 and 2011 we did not have revenues for La Chira waste water treatment plant and the Lima Metro and in 2012 we only had pre-operation revenues for La Chira waste water treatment plant and revenues for the Lima Metro based on a limited number of trains during the first year of operation. |
Our strategy is to pursue concessions with the potential to generate business opportunities across our organization. Once we obtain a concession, our goal is to be involved virtually in all aspects of project execution through the participation of our different business segments, from the design and construction to the operation and maintenance of the infrastructure asset.
Through our Infrastructure segment we participate in a number of joint operations with the objective of bidding for government concessions or other long-term contracts. When bidding, we occasionally look for partners to reduce our risks and achieve the level of expertise needed to meet the demands of each particular project.
The following table shows selected information about our current concessions and long-term contracts.
Project | Year Granted | Initiated | Expiration | Characteristics | % Owned by Us | Status | ||||||||
Toll Roads: | ||||||||||||||
Norvial | 2003 | 2003 | 2028 | 183 km | 50.1 | % | Operating | |||||||
Survial | 2007 | 2008 | 2032 | 750 km | 99.9 | % | Operating | |||||||
Canchaque | 2006 | 2010 | 2021 | 78 km | 99.9 | % | Operating | |||||||
Mass Transit: | ||||||||||||||
Lima Metro | 2011 | 2012 | 2041 | 31.5 km(1) | 75.0 | % | Operating | |||||||
Water Treatment: | ||||||||||||||
La Chira | 2012 | 2014 (expected) | 2037 | Avg. treatment capacity of 6.3 m3/sec (expected) | 50.0 | % | Obtaining permits | |||||||
Energy(2): | ||||||||||||||
Oil Production | ||||||||||||||
Block I | 1995 | 1995 | 2021 | Avg. daily production of 1,253 bbl (2012) | 100 | % | Operating | |||||||
Block V | 1993 | 1993 | 2023 | Avg. daily production of 150 bbl (2012) | 100 | % | Operating | |||||||
Gas Processing(3) | 2006 | 2006 | N/A | Avg. daily processing capacity of 84 MMcf | 100 | % | Operating | |||||||
Fuel Terminals | 1998 | 1998 | 2014 | Aggregate storage capacity of 2.6 MMbbl | 50.0 | % | Operating | |||||||
| (1) | Currently only five trains are operating on a first stretch of 21 km (13 mile); full operation with 24 trains is expected by the third quarter of 2014 on the full 33 km (20 mile) Line One. |
| (2) | Percentages owned in Energy reflect GMP’s ownership. We own 95% of GMP. |
| (3) | We own a gas processing plant and have a long-term delivery and gas processing contract with EEPSA. |
106
Table of Contents
Principal Infrastructure Lines of Business
Toll Roads
Peru’s economic development is underpinned by a strong government commitment to infrastructure investment, with a particular focus on improving the country’s road system through the award of new concessions to the private sector. As of January 2013, the total transportation project pipeline in Peru was US$22 billion, according to APOYO Consultoría. We believe this investment offers significant opportunities to our Infrastructure segment.
Our Infrastructure segment currently has three toll road concessions through our subsidiaries Norvial, Survial and Canchaque. All three toll roads are currently in operation and we have the authorizations, permits and licenses necessary to fulfill our obligations under each concession, including releases of rights of way. All of our toll road concessions have utilized the construction services of our E&C segment and the roads are currently operated and maintained by our Technical Services segment. The table below sets forth selected financial information relating to our toll roads.
| Year ended December 31, | ||||||||||||||||
| 2010 | 2011 | 2012 | 2012 | |||||||||||||
| (in millions of S/.) | (in millions of US$) | |||||||||||||||
Revenues | 114.9 | 115.2 | 123.3 | 48.4 | ||||||||||||
EBITDA | 72.0 | 54.5 | 71.5 | 28.0 | ||||||||||||
EBITDA margin | 62.7 | % | 47.3 | % | 58.0 | % | ||||||||||
Net profit | 25.5 | 21.4 | 29.4 | 11.5 | ||||||||||||
The pie charts below set forth the breakdown of our revenues and EBITDA from our toll road concessions for 2012.
| Revenues | EBITDA | |
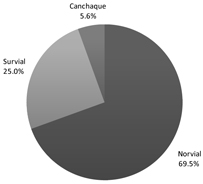 | 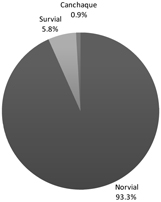 | |
| Total: US$48.4 million | Total: US$28.0 million | |
Norvial
Under our Norvial concession, we operate and maintain part of the only major highway that connects Lima to the northwest of Peru. This 183-km road, known as Red Vial 5, runs from the cities of Ancón to Pativilca and has three toll stations. The concession was awarded to Norvial in 2003 for a 25-year term. We own 50.1% of Norvial; and our partners in this concession are JJC Contratistas Generales and Besco. The following map shows the location of the Red Vial 5 road in Peru.
107
Table of Contents
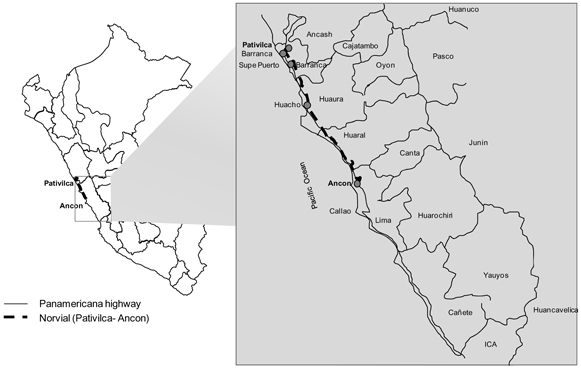
Norvial’s revenue derives from the collection of tolls. For the Norvial toll road, the toll rate is set out in the Norvial concession agreement and adjusted in accordance with a contractual formula that takes into account the nuevo sol/U.S. dollar exchange rate and Peruvian and U.S. inflation. We are required to transfer 5.5% of our monthly toll revenue to the Peruvian Ministry of Transport and Communications and pay a 1% regulatory fee to the Peruvian Supervisory Agency for Investment in Public Transportation Infrastructure.
Our obligations under the concession include expanding the already existing road by, among other things, adding two additional lanes. The first stage of construction was completed in 2008 and the second stage is expected to begin between 2014 and 2015. We estimate that our capital investment for the second stage will be approximately US$100 million. When the construction of the second stage begins, we will also be required to pay a one-time estimated fee of approximately US$1.8 million to the Peruvian Supervisory Agency for Investment in Public Transportation Infrastructure.
Unlike other toll roads in Peru, Norvial charges toll fees in both directions. Our road is highly transited both by heavy vehicles, primarily for the purpose of transporting goods, and also by passenger vehicles, which typically use the road to access tourist destinations. The following table sets forth average daily traffic volume and average toll fees charged for vehicle equivalents in respect to the Norvial toll road concession for 2010, 2011 and 2012.
| Year ended December 31, | ||||||||||||
| 2010 | 2011 | 2012 | ||||||||||
Average daily traffic by vehicle equivalents(1) | 14,641 | 16,290 | 17,799 | |||||||||
Average toll fee charged for vehicle equivalents (in S/.) | 13.28 | 13.23 | 13.15 | |||||||||
| (1) | Each automobile is counted as one equivalent vehicle and commercial vehicles (such as trucks or buses) represent the number of equivalent vehicles equal to the ratio between the toll rate applicable to commercial vehicles and that which is applicable to one automobile. |
The table below sets forth selected financial information relating to Norvial.
| Year ended December 31, | ||||||||||||||||
| 2010 | 2011 | 2012 | 2012 | |||||||||||||
| (in millions of S/.) | (in millions of US$) | |||||||||||||||
Revenues | 71.0 | 78.7 | 85.7 | 33.6 | ||||||||||||
EBITDA | 59.4 | 60.1 | 66.7 | 26.2 | ||||||||||||
EBITDA margin | 83.7 | % | 76.4 | % | 77.9 | % | ||||||||||
Net profit | 19.4 | 26.4 | 27.2 | 10.6 | ||||||||||||
108
Table of Contents
Survial
Under our Survial concession, we operate and maintain a 750 km road from the San Juan de Marcona port to Urcos, Peru, which is connected to an interoceanic road that runs up to the Peruvian-Brazilian border. The road has five toll stations and three weigh stations. The concession was awarded to Survial in 2007 for a 25-year term. We own 99.9% of Survial. The following map shows the location of the road in Peru.
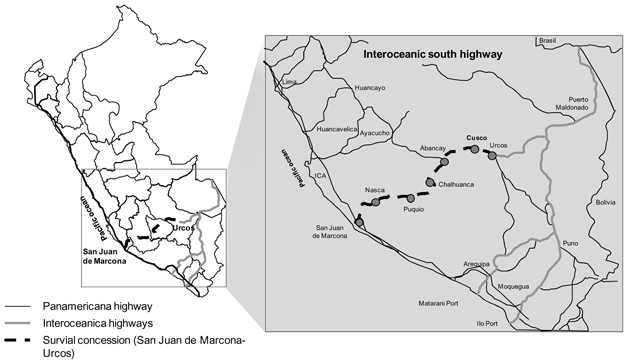
Our obligations under the concession include the construction of the road, which was completed in 2010.
Our revenue from this concession consists of an annual fee paid to Survial by the Peruvian Ministry of Transport and Communications in consideration for the operation and maintenance of the road, which fee can vary depending on the amount of maintenance required due to road damages. In 2010, 2011 and 2012 the fee amounted to approximately US$7.4 million, US$9.1 million and US$37.5 million, respectively. Our revenue in this concession does not depend on traffic volume.
Canchaque
Under our Canchaque concession, we operate and maintain a 78 km road from the towns of Buenos Aires to Canchaque, in Peru. The road has one toll station. The concession was awarded to Canchaque in 2006 for a 15-year term. We own 99.9% of Canchaque. Our obligations under the concession include the construction of the road, which was completed in 2009. Our revenue from this concession consists of an annual fee paid by the Peruvian Ministry of Transport and Communications in consideration for the operation and maintenance of the road, which fee can vary depending on the amount of road maintenance required due to road wear and tear. In 2010, 2011 and 2012 the fee amounted to approximately US$828,510, US$1.3 million and US$1.4 million, respectively. Our revenue in this concession does not depend on traffic volume.
Additional Toll Road Projects
We continuously evaluate infrastructure projects and strategically present public-private partnership proposals and participate in bidding processes for road concessions. In 2012, a joint operation in which we participate was awarded, and is currently negotiating the terms for, a 40-year concession for a 4.6 km extension of Via Expresa Sur, one of the main roads in Lima, which crosses the city from north to south. The road will connect downtown Lima to Panamericana Sur, a highway that runs from Ecuador to Chile. Our estimate of the total investment under the concession, as submitted in our bid, is of approximately US$200 million. Such investment will be made during the construction phase, which is expected to take up to five years. Our revenue will derive from the collection of a toll
109
Table of Contents
fee upon completion of the construction. The concession is expected to guarantee a minimum annual revenue of US$18 million during the first two years of the concession term and US$19.6 million for the third year and for an additional period, the term of which is being negotiated. If in a particular year, our annual revenue is lower than the minimum guaranteed, we expect the government to compensate us for the difference, up to an amount not to exceed US$10 million. Completion of the project is subject to expropriation of the land necessary for the construction of the road. Releases of right of way are still pending.
A joint operation in which we participate has been awarded, and is in the process of negotiating the terms for, a 37-year concession for Via Expresa Javier Prado, a 20 km toll road that crosses Lima from east to west, traversing through eight districts. According to estimates from the Municipality of Lima, the total investment in the concession is expected to amount to approximately US$790 million. Such investment will be made during the construction phase which is expected to take between five to seven years. Our revenue will derive from the collection of a toll fee upon completion of the construction. This concession was awarded to the joint operation at the end of the 1990s and negotiations were discontinued but were recently resumed in 2012.
We cannot assure you if or when the concession contracts will be agreed or whether the contractual terms will be favorable to us. See “Risk Factors—Risks Related to our Infrastructure Business.”
Mass Transit
In 2011, we were awarded a 30-year concession for the operation of Line One of the Lima Metro, Peru’s only urban railway system. The concession was awarded to our subsidiary GyM Ferrovías, in which we hold a 75% ownership interest, with the other 25% being held by Ferrovías S.A.C. Our obligations under the contract include: (i) the operation and maintenance of the five existing trains provided by the government; (ii) the acquisition of 19 new trains on behalf of the Peruvian government, which will be the legal owner of such trains; (iii) the operation and maintenance of the 19 new trains (24 trains in the aggregate); and (iv) the design and construction of the railway maintenance and repair yard, which is being built by our E&C segment. The operation and maintenance of the trains is carried out by our Technical Services segment, which is currently operating the first stretch of Line One and will start operating the full Line One once the construction of the second stretch, currently planned for the third quarter of 2014, is complete. A joint operation in which our E&C segment participates was awarded the construction of the second stretch of Line One. The map below shows the route of Line One.
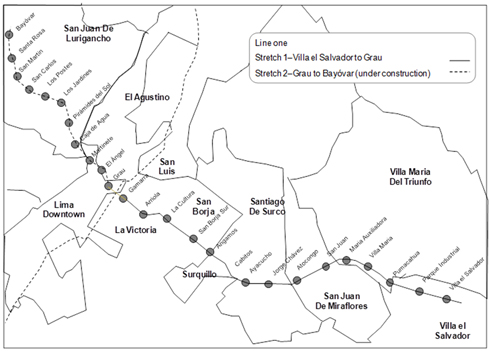
110
Table of Contents
We expect to make a total of S/.830 million (US$325 million) in capital expenditures in connection with the acquisition of the new trains on behalf of the government and the construction of the maintenance and repair yard. As of December 31, 2012, we had spent S/.315 million (US$124 million) of this amount. We have ordered the 19 new trains and have received two of them as of December 31, 2012. We are awaiting the corresponding approval to begin operating the two new trains. We expect to receive the remaining trains on a periodic basis and expect to have the 19 trains in operation by the third quarter of 2014.
Our revenue from this concession consists of a quarterly fee that we receive from the Ministry of Transport and Communications based on the kilometers travelled per train, with the fee per kilometer, the number of trains required to be in operation and the number of kilometers that we are required to travel established by the terms of the concession. Our revenues do not depend on passenger traffic volume. According to the government, completion of the second stretch should take place by the third quarter of 2014. This, together with the operation of the new trains, will increase our revenue since we will operate more trains which will travel more kilometers, as established in the concession contract.
We currently operate five trains on the first stretch which enable us to travel 812,539 km per year based on required schedule and frequency. By the third quarter of 2014 we expect to be in full operation, with 24 trains that are expected to travel 2,603,453 km per year in the full Line One, based on required schedule and frequency. The following tables show (i) the length of Line One, the average frequency of the trains and the fee per kilometer travelled; and (ii) the increase in scheduled kilometers in relation to the number of trains in operation.
| Lima Metro - Line One | ||||||||
| Stretch One | Full Line One (expected) | |||||||
Kilometers | 21.5 | 33.5 | ||||||
Required average frequency | 15 minutes | 7 minutes | ||||||
Fee per kilometer travelled (S./) | 73.97 | 71.97 | ||||||
Operating Trains | Contracted Km per Year(1) | |||
5 | 812,539 | |||
6 | 1,000,879 | |||
7 | 1,275,326 | |||
8 | 1,386,691 | |||
9 | 1,508,494 | |||
10 | 1,567,673 | |||
11 | 1,598,633 | |||
12 | 1,626,905 | |||
13 | 1,655,178 | |||
14 | 1,670,873 | |||
24(2) | 2,603,453 | |||
| (1) | Based on required schedule and frequency |
| (2) | Full Line One (i.e., stretches one and two) in operation |
Pursuant to the concession, we must comply with certain requirements in the operation of the trains. According to the concession, at least 95% of our trains must be running and available for use and not less than 85% of our trains that are available for use must arrive to destination on scheduled time. The table below shows our monthly average results during 2012.
111
Table of Contents
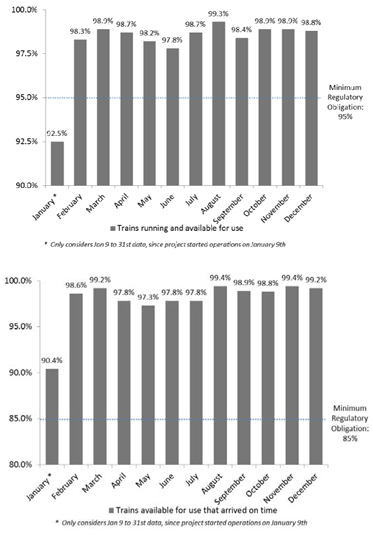
Water Treatment
In 2012, we were awarded a 25-year concession for the construction, operation and maintenance of La Chira waste water treatment plant in the south of Lima. The project is aimed at addressing Lima’s environmental problems caused by sewage discharged directly into the sea. We hold a 50% share in this project and our partner Acciona Agua holds the remaining 50%.
We estimate that La Chira’s total investment in the concession will amount to approximately US$83.1 million. La Chira’s annual revenues under the concession, once in operation, are expected to amount to approximately US$2.7 million, in the form of a fee paid by Sedapal S.A., the public utility company responsible for the supervision of the water service in Lima. A joint operation in which our E&C segment participates is undertaking the construction of the waste water treatment plant.
Energy
We currently operate three energy businesses within our Infrastructure segment. We have two long-term hydrocarbon extraction service contracts with Perupetro, the Peruvian entity responsible for the administration and supervision of all exploration and production contracts in Peru, under which we operate two onshore oil producing fields in northern Peru. Aggregate average production of these fields in 2012 was of approximately 1,400 bbl per day. We also own and operate a gas processing plant which processes and fractions natural gas from its liquids in northern Peru and delivers dry gas to a gas-fired power generation company under a long-term processing and fractionation agreement. In addition, we are a 50% partner in Consorcio Terminales which has a contract with Petroperú, the other state owned oil and gas company, to operate nine fuel storage terminals, which we believe handled approximately one-third of the country’s refined fuel in 2012.
112
Table of Contents
The table below sets forth selected financial information relating to our Energy line of business.
| Year ended December 31, | ||||||||||||||||
| 2010 | 2011 | 2012 | 2012 | |||||||||||||
| (in millions of S/.) | (in millions of US$) | |||||||||||||||
Revenues | 239.8 | 289.0 | 287.0 | 112.5 | ||||||||||||
EBITDA | 119.1 | 136.8 | 136.4 | 53.5 | ||||||||||||
EBITDA margin | 49.7 | % | 47.3 | % | 47.5 | % | ||||||||||
Net profit | 62.6 | 69.1 | 63.4 | 24.8 | ||||||||||||
The pie charts below set forth the breakdown of our revenues and EBITDA from our Energy line of business for 2012.
| Revenues | EBITDA | |
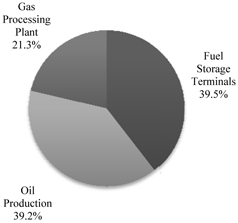 | 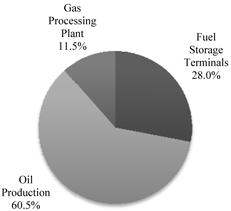 | |
| Total: US$112.5 million | Total: US$53.5 million | |
Oil Production
We operate and extract oil from two fields (Block I and Block V) located in the province of Talara in northern Peru. Both fields are operated under long-term service contracts in which we provide hydrocarbon extraction services to Perupetro. Hydrocarbons extracted from each field belong to Perupetro, which in turn pays us a variable fee per barrel of lifted hydrocarbons, which fee is based on a basket of international crude prices and the level of production. The fee is paid on a monthly basis. Our activities are focused on proved reserves development and production and are conducted in mature oil fields, which have been producing oil for over 100 years in the case of Block I and over 50 years in the case of Block V. We believe our activities in these fields bear limited exploration risk.
The following table shows selected information about our fields.
Property | Basin | GMP’s Ownership | Expiration | Developed Acres | Undeveloped Acres | |||||||||||
Block I | Talara | 100 | % | 2021 | 25,154 | 4,808 | ||||||||||
Block V | Talara | 100 | % | 2023 | 6,320 | 2,496 | ||||||||||
Block I:
We operate and extract oil and natural gas from Block I under a 20-year hydrocarbon extraction service contract with Perupetro, which was extended for an additional 10-year term and expires in December 2021. Average daily production during 2012 was 1,253 barrels of crude oil. We operate 158 wells using various oil extraction systems and operate a network of production batteries and pipelines to collect, measure and deliver oil in fiscalization point close to the Talara refinery. The field is located in the province of Talara, department of Piura, in northern Peru, approximately five miles from the Talara refinery, the second largest refinery in the country. Block I is the oldest oil producing field in Peru and has been producing oil since around 1890.
113
Table of Contents
Block V:
We operate and extract oil and natural gas from Block V under a 20-year hydrocarbon extraction service contract with Perupetro, which was extended for an additional 10-year term and expires in October 2023. Average daily production during 2012 in this field was 150 barrels of crude oil. We operate 41 wells in this field using various oil extraction systems. The Block V field is located in the province of Los Organos, department of Piura, Peru, close to the border with Ecuador. Block V has been producing oil since the 1950s.
The map below shows the geographic location of our oil producing blocks in northern Peru.
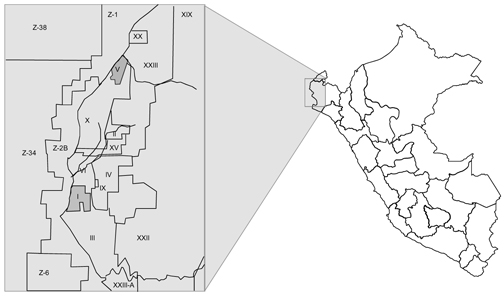
Under our hydrocarbon extraction service contracts, we are entitled to a variable fee, which is based on the level of production of each field and a basket of international crude prices, which include Fortis Blend, Suez Blend and Oman crudes. During 2010, 2011 and 2012, we received an average fee of US$58.59, US$83.90 and US$86.13 per barrel of extracted oil, which was equivalent to approximately 73.6%, 75.4% and 77.2%, respectively, of average Brent crude prices in the same years. Our average lifting cost per barrel during these years, calculated as total cash costs divided by total crude oil produced, were US$15.18, US$21.82 and US$20.18, respectively. According to our hydrocarbons development contracts, we are required to deliver all the oil and gas we produce, regardless of its quantity, to Perupetro. Therefore, we are not committed to provide a fixed and determinable quantity of oil or gas in the near future under existing contracts.
We produce natural gas as a byproduct of the production of crude oil. We provide natural gas to Perupetro, which in turn sells it to EEPSA, and pays us a fee which varies depending on market conditions. Our revenues for the sale of natural gas are not material relative to our oil production revenues.
Estimated Proved Reserves:
The following table sets forth our estimated proved crude oil and natural gas reserves as of December 31, 2012 based on fiscal-year end prices. We have only included estimates of our proved and have not included any estimates of probable and possible reserves.
| Crude Oil (MBbl) | Natural Gas (MMcf) | Crude Oil Equivalents (MBoe) | ||||||||||
Block I: | ||||||||||||
Proved developed producing | 2,129 | 9,351 | 3,791 | |||||||||
Proved undeveloped | 1,351 | 6,237 | 2,459 | |||||||||
|
|
|
|
|
| |||||||
Total proved reserves | 4,112 | 19,864 | 7,642 | |||||||||
Block V: | ||||||||||||
Proved developed producing | 406 | 0 | 406 | |||||||||
Proved undeveloped | 312 | 0 | 312 | |||||||||
|
|
|
|
|
| |||||||
Total proved reserves | 818 | 0 | 818 | |||||||||
Total: | ||||||||||||
Proved developed producing | 2,534 | 9,351 | 4,197 | |||||||||
Proved undeveloped | 1,663 | 6,237 | 2,771 | |||||||||
|
|
|
|
|
| |||||||
Total proved reserves | 4,930 | 19,864 | 8,460 | |||||||||
114
Table of Contents
Our proved reserve estimates included in this prospectus were prepared in accordance with generally accepted petroleum engineering and evaluation principles and definitions and guidelines established by the SEC. GMP is required to file an annual reserve report with the Peruvian Dirección General de Hidrocarburos (General Agency of Hydrocarbons of the Peruvian Ministry of Energy and Mines), which may differ from our proved reserve estimates presented in this prospectus.
Proved reserves are those quantities of oil and natural gas which, by analysis of geosciences and engineering data, can be estimated with reasonable certainty to be economically producible from a given date forward, from known reservoirs, and under existing economic conditions, operating methods, and government regulations. The term “reasonable certainty” implies a high degree of confidence that the quantities of oil and/or natural gas actually recovered will equal or exceed the estimate. To achieve reasonable certainty, we employed technologies that have been demonstrated to yield results with consistency and repeatability. The technologies and economic data used in the estimation of our proved reserves include, but are not limited to, well logs, geologic maps and available down hole and production data, seismic data, and well test data.
Our proved undeveloped reserves as of December 31, 2012 were 2,771 Mboe, consisting of 1,663 Mbbl of crude oil and 6,237 MMcf of natural gas. Changes in proved undeveloped reserves during 2012 were not material because reserves consumed during 2012 were replenished by reserves derived from 2012 drillings.
Production, Revenues, Prices and Costs:
The following table sets forth information regarding our production, revenues, prices and production costs for 2010, 2011 and 2012.
| Year ended December 31, | ||||||||||||
| 2010 | 2011 | 2012 | ||||||||||
Production volumes(1): | ||||||||||||
Crude oil (Mbbl) | ||||||||||||
Block I | 364.9 | 381.9 | 458.2 | |||||||||
Block V | 69.5 | 56.2 | 54.8 | |||||||||
Total (crude oil Mbbl) | 434.4 | 438.1 | 513.0 | |||||||||
Natural gas (MMcf) | ||||||||||||
Block I | 1,806.3 | 1,843.8 | 2,012.6 | |||||||||
Block V | 149.3 | 146.0 | 151.8 | |||||||||
Total (natural gas MMcf) | 1,955.6 | 1,989.8 | 2,164.4 | |||||||||
Crude oil equivalents (Mboe) | 347.6 | 353.7 | 384.7 | |||||||||
Total Company | 2,737.6 | 2,781.5 | 3,062.1 | |||||||||
Average sales prices:(2) | ||||||||||||
Crude oil (US$/bbl) | 58.6 | 83.9 | 86.1 | |||||||||
Natural Gas (US$/Mcf) | 1.4 | 1.4 | 1.4 | |||||||||
Crude oil equivalents (US$/boe) | 39.3 | 55.5 | 59.4 | |||||||||
Costs and expenses:(2) | ||||||||||||
Production expenses (US$/boe) | 7.5 | 7.9 | 7.8 | |||||||||
General and administrative expenses (US$/boe) | 4.5 | 4.7 | 5.2 | |||||||||
Depreciation, depletion, amortization and accretion expenses (US$/boe) | 4.5 | 8.4 | 13.9 | |||||||||
| (1) | Hydrocarbons extracted from our fields belong to Perupetro, which in turns pays us a per barrel fee for lifted hydrocarbons. |
| (2) | Crude oil sales volume differs from total production volume due to operational circumstances such as the inventory of product stored in our field batteries at the end of each monthly measurement. “Average sales prices” refers to the fees received in consideration for our extraction services, which do not equal the sales prices of crude oil. Average sales prices have been calculated using a basket price formula according to the service contracts of each block. Such formulation is at a discount to global oil prices and we do not otherwise pay royalties on the oil and gas extracted. Per unit costs have been calculated using sales volumes. |
115
Table of Contents
Acreage, Productive and Development Wells, Drilling:
The following table sets forth certain information regarding the total developed and undeveloped acreage as of December 31, 2012.
Formation | Developed Acreage | Undeveloped Acreage | ||||||
Block I | ||||||||
Pariñas | 2,271 | 70 | ||||||
Mogollón | 2,420 | 450 | ||||||
Basal Salina | 1,850 | 105 | ||||||
Mesa | 1,272 | 1,800 | ||||||
|
|
|
| |||||
Total Block I | 7,813 | 2,425 | ||||||
Block V | ||||||||
Verdún | 530 | 650 | ||||||
Ostrea | 165 | 120 | ||||||
Mogollón | 1,350 | 120 | ||||||
|
|
|
| |||||
Total Block V | 2,045 | 890 | ||||||
|
|
|
| |||||
Total | 9,858 | 3,315 | ||||||
As of December 31, 2012, we had a total of 199 producing wells. Our wells are oil wells, many of which also produce natural gas. We do not have interests in wells that only produce natural gas.
The following table shows the number of development and exploratory wells drilled during 2010, 2011 and 2012 in both Block I and Block V.
| Year ended December 31, | ||||||||||||
| 2010 | 2011 | 2012 | ||||||||||
Development Wells | ||||||||||||
Productive | 14 | 11 | 12 | |||||||||
Dry | 0 | 0 | 0 | |||||||||
|
|
|
|
|
| |||||||
Total | 14 | 11 | 12 | |||||||||
Exploratory Wells | ||||||||||||
Productive | 0 | 2 | 0 | |||||||||
Dry | 0 | 0 | 0 | |||||||||
|
|
|
|
|
| |||||||
Total | 0 | 2 | 0 | |||||||||
During 2010, 2011 and 2012 we invested approximately US$9.4 million, US$14.2 million and US$18.7 million, respectively, in drilling activities. Eleven of the twelve development wells drilled during 2012 were located in Block I with a depth average of approximately 8,300 feet. All of them are productive wells and they partially explain our production volume increase registered during 2012 compared to 2011. In 2011 we drilled two exploratory wells and the results of the exploratory formations on target were not productive. However, both wells still have production in their shallow formations.
The company continues to drill an average of 1.1 wells per month in its quest to accelerate the recovery of proved reserves. Most of the drilling is done in Block I where environmental permits allow us to drill up to 121 new wells. From time to time, based on geological analysis, we try to obtain more oil by increasing the depth of our productive formations. In this way, we minimize exploratory risks.
Under the terms of our service contracts, at the time the contract terminates, we are required to close non-producing wells that we have drilled. As of December 31, 2012, we estimated that we will be required to close 70 wells in Block I in December 2021 and 15 wells in Block V in October 2023, out of approximately 400 wells currently not in production. We have created a provision in our financial statements for the costs relating to those well closings. See note 19 to our consolidated financial statements included in this prospectus.
Gas Processing Plant
We own a gas processing plant located 7 km north of the city of Talara in Piura, Peru. We currently have under a long-term delivery and gas processing and fractioning contract with EEPSA, according to which EEPSA delivers wet natural gas that it purchases from onshore and offshore gas operators in the area. We then process and fraction the gas into two products: (i) dry natural gas, which can be used as fuel in EEPSA’s gas-fired turbine; and (ii) natural gas liquids, which are sold in the Peruvian market. Under the terms of the agreement, we are responsible for all operating
116
Table of Contents
costs of the gas processing plant but are also entitled to keep revenues from the sale of the natural gas liquids to third parties after payment of a variable royalty, based on the volume of gas processed, to EEPSA. Our current gas processing and fractionation contract with EEPSA expires in 2023.
Our gas processing plant has the capacity to process up to 44 MMcf per day. We processed 29.7 MMcf per day during 2010, 31 MMcf per day during 2011 and 26 MMcf per day during 2012. Volumes processed by our gas processing plant ultimately depend upon gas volumes demanded by EEPSA for its gas-fired turbines. These volumes vary per month and depend upon the power dispatch curve of EEPSA among Peruvian power generation plants. In rainy months (December to April) where hydroelectric power generation in Peru is typically higher, gas volumes demanded by EEPSA are lower than in dryer months (May to November) in which activity of thermal generators tends to be higher.
Fuel Storage Terminals
We are a 50% partner in Consorcio Terminales and have a contract with Petroperú to operate the largest fuel storage terminal business in Peru. Our 50% partner is a Peruvian affiliate of Oiltanking GmbH, one of the world’s largest operators of independent terminals for bulk liquid storage. Our open-access terminals are equipped with modern technologies and offer our customers dependable and critical handling and storage services for refined petroleum liquid products, maintaining high quality, safety and environmental standards. We have seven terminals strategically located along Peru’s Pacific coast. We also have two inland facilities. We provide storage, handling and loading and uploading services for a broad range of refined petroleum liquid products, including gasoline, aircraft fuel, diesel and heavy fuel oil. We deliver the liquids into two types of transportation systems, railroad cars and cistern trucks. Because of the strategic location of our assets, our deep-water access, inland terminals and our aggregate storage capacity of 2.6 MMbbl, we believe that we are well-positioned to cover the needs of our clients, the two principal refineries in Peru. The map below shows the location of each of our fuel storage terminals in Peru.
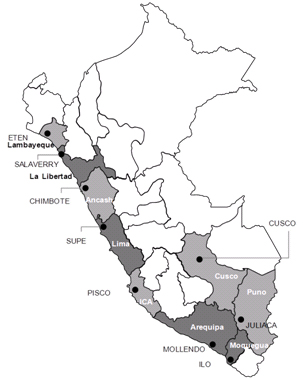
Our activities under Consorcio Terminales are carried out under a 15-year contract, which we entered into in January 1998 and which has been extended until August 2014. We cannot assure you that the current contract will be renewed or that the terms of such potential renewal will not differ materially from those of our current contract.
Under the current contract, Consorcio Terminales receives revenues paid in connection with monthly reserved volume in tanks for refined crude products (storage fee) and for volumes loaded and delivered into railroad cars or
117
Table of Contents
cistern trucks to each terminal (throughput fee). The storage fee per barrel, is based upon reserved volumes whether they are received or not. The throughput fee is paid based on effective barrels delivered per month. During 2010, 2011 and 2012 Consorcio Terminales generated revenues of approximately US$40.3 million, US$44.2 million and US$49.1 million, respectively. Under the contract, we are responsible for paying the fuel terminals operating costs and also paying a royalty fee to Petroperú based on effective barrels delivered each month.
At the current stage of the contract, any capital expenditure we invest in the fuel storage terminals can be recouped from any present and future royalties we owe to Petroperú.
Other Terminal Operations
We are a 50% partner in Terminal Marino Pisco Camisea and have a contract with Pluspetrol to operate an export terminal for gasoline, diesel, propane and butane. In 2012, this terminal dispatched 127 ships 2.8 million tonnes of natural gas liquids. We are also a 25% partner in Terminal de Químicos de Matarani, which in 2012 dispatched 34,930 tonnes of sodium hydrosulfide for international mining companies. During 2010, 2011 and 2012 these activities generated revenues in the aggregate of approximately US$3.6 million, US$4.1 million and US$4.3 million, respectively.
Competition
Our ability to grow through successful bids for new infrastructure concessions or other long-term contracts could be affected as a result of competition. We view our competition as including both Peruvian and international infrastructure concession operators including joint operations with partners with specialized expertise in the relevant sector. Competition varies on a case-by-case basis, depending on the main purpose of the concession.
Real Estate
Our Real Estate segment is the largest apartment building developer in Peru, in terms of number of units sold and value of sales in 2012, according to Tinsa, and is focused on the development and sale of affordable housing and housing as well as other real estate projects. Since commencing our operations in 1987, we have developed approximately 450,000 m2 of affordable housing (approximately 6,614 units); approximately 290,000 m2 of housing (approximately 1,400 units); approximately 115,000 m2 of office space (approximately 780 offices); and approximately 43,000 m2 of shopping centers (three shopping centers). Moreover, we are currently building approximately 160,000 m2 of affordable housing (approximately 2,520 units); approximately 22,000 m2 of housing (approximately 160 units); and approximately 24,000 m2 of office space (approximately 40 offices, with an average size of 600 m2 each). Our Real Estate segment also owns significant land parcels in Lima, comprising of approximately 888 hectares as of December 31, 2012, and we have sold undeveloped land in the past and intend to continue such sales in the future.
The table below sets forth selected financial information for our Real Estate business segment.
| Year ended December 31, | ||||||||||||||||
| 2010 | 2011 | 2012 | 2012 | |||||||||||||
| (in millions of S/.) | (in millions of US$) | |||||||||||||||
Revenues | 218.6 | 152.3 | 240.1 | 94.1 | ||||||||||||
EBITDA | 27.4 | 37.5 | 70.5 | 27.6 | ||||||||||||
EBITDA margin | 12.4 | % | 24.6 | % | 29.4 | % | ||||||||||
Net profit | 17.9 | 24.1 | 45.3 | 17.8 | ||||||||||||
Net profit attributable to controlling interest | 8.5 | 6.1 | 12.4 | 4.9 | ||||||||||||
We undertake a significant amount of the activities in our Real Estate segment with partners through financing and commercial arrangements we use to purchase land and to develop real estate projects. See “—Financing.” As a result, a significant amount of our net profit in the Real Estate segment is attributable to the non-controlling interest of our partners. See also “Management’s Discussion and Analysis of Financial Condition and Results of Operations—Results of Operations—General—Real Estate.”
118
Table of Contents
Principal Real Estate Activities
Our real estate developments include the following products:
| • | affordable housing; |
| • | housing; and |
| • | commercial real estate. |
We began developing affordable housing projects in 2001, following the Peruvian government’s efforts to address the country’s housing deficit, particularly for low-income families. We launched the first major affordable housing project in Peru in 2007, Parque Agustino in Lima’s El Agustino neighborhood. Since 2001, we have completed 11 affordable housing projects. As of December 31, 2012, we are developing 11 affordable housing projects, which are in various stages of development, including six which are in the construction phase and five for which we have purchased land, but are still in the process of obtaining the required approvals and permits. Two of our ongoing affordable housing projects consist of expansions of projects previously completed by us.
Affordable housing consists of apartments, usually ranging between 55 and 110 m2, that are purchased through government subsidies. The Peruvian government has adopted the Nuevo Crédito MiVivienda and Techo Propio programs, among others, which promote access to affordable housing in Peru by providing government subsidies to individuals for the purchase of homes. In order for a unit to qualify for the Nuevo Crédito MiVivienda program, its selling price must range between 14 UIT and 70 UIT (approximately between S/.52,000 and S/.259,000). In order for a unit to qualify for the Techo Propio program, its selling price must range between 5.5 UIT and 14 UIT (approximately between S/.20,000 and S/.52,000).
In order to be eligible for an affordable housing subsidy under the Nuevo Crédito MiVivienda program, a purchaser must not own any other home or have benefitted from a housing subsidy program in the past, among other requirements. A purchaser must also provide a down payment between 10% and 30% of the total purchase amount. Housing subsidies under this program fluctuate between S/.5,000 and S/.12,500, which incentivize purchasers with reduced monthly rates so long as they pay their mortgage loan payments on a timely basis. In order to be eligible for an affordable housing subsidy under the Techo Propio program, a purchaser must have a monthly income that does not exceed 0.45 UIT (approximately S/.1,665) and must not have received any other government-sponsored housing benefit in the past, among other requirements. A Techo Propio purchaser must also show proven savings equal to at least 10% of the total purchase amount. Housing subsidies under this program fluctuate between three UIT and five UIT (approximately between S/.11,100 and S/.18,500). Purchasers of subsidized housing under both programs are also not required to pay a value-added tax normally applicable to residential purchases.
We develop substantially all of our affordable housing projects on land purchased from the private sector. To the extent these projects meet the requirements of a particular government subsidy program, purchasers can purchase units with government subsidies. Some of our affordable housing projects, however, such as Parque Agustino, are developed through government bidding processes. Government subsidy programs like Nuevo Crédito MiVivienda and Techo Propio have driven the demand for affordable housing in Peru, which has in turn increased our sales of affordable housing units.
Our housing developments consist of residential buildings comprised of apartments with a mid- to high-price range that do not qualify for government subsidies. Since 1987, we have developed 36 housing developments. As of December 31, 2012, we are developing five housing projects, including four which are in the construction stage and one for which we have purchased land, but are still in the process of obtaining the required approvals and permits. Our housing units typically range between 130 and 400 m2 in size.
Substantially all of our affordable housing and housing development projects are located in Lima. We have also purchased land to develop two affordable housing projects in Piura and Chimbote, two cities north of Lima. We intend to develop affordable housing projects in other cities outside of Lima.
119
Table of Contents
The table below sets forth number of units sold and delivered, as well as the value of units sold and our sales revenue for the years indicated.
| 2010 | 2011 | 2012 | ||||||||||
Number of Units Delivered(1): | ||||||||||||
Affordable Housing | 1,964 | 1,239 | 1,251 | |||||||||
Housing | 171 | 1 | 113 | |||||||||
|
|
|
|
|
| |||||||
Total | 2,135 | 1,240 | 1,364 | |||||||||
Number of Units Sold(1): | ||||||||||||
Affordable Housing | 1,575 | 1,252 | 1,940 | |||||||||
Housing | 142 | 116 | 77 | |||||||||
|
|
|
|
|
| |||||||
Total | 1,717 | 1,368 | 2,017 | |||||||||
Total m2 Delivered: | ||||||||||||
Affordable Housing | 135,432 | 89,529 | 127,907 | |||||||||
Housing | 31,734 | 203 | 13,730 | |||||||||
|
|
|
|
|
| |||||||
Total | 167,167 | 89,732 | 141,637 | |||||||||
Total m2 Sold: | ||||||||||||
Affordable Housing | 96,470 | 65,764 | 123,958 | |||||||||
Housing | 15,660 | 16,440 | 10,109 | |||||||||
|
|
|
|
|
| |||||||
Total | 112,130 | 82,204 | 134,067 | |||||||||
S/. Value of Units Delivered: | ||||||||||||
Affordable Housing | S/. 145.8 Million | S/. 135.2 Million | S/. 153.5 Million | |||||||||
Housing | S/. 68.1 Million | S/. 0.0 Million | S/. 35.0 Million | |||||||||
|
|
|
|
|
| |||||||
Total | S/. 213.9 Million | S/. 135.2 Million | S/. 188.5 Million | |||||||||
| (1) | We typically pre-sell our affordable housing and housing units before construction begins and continue to sell during construction, although we recognize revenues at the time of delivery of units. |
We develop and sell office and commercial buildings, such as shopping centers. On certain occasions, we have operated our commercial real estate and later sold it, such as Larcomar, a landmark shopping center which we built in 1998 and sold in 2010. We have also developed commercial real estate buildings in connection with our affordable housing and housing projects, such as the Parque Agustino shopping center. Since 1987, we have developed 11 office buildings, three shopping centers and one medical center. We are currently in the process of developing five office buildings in Lima, two of which are in the construction phase, including the Real Ocho project, a 16-floor office building (30% of which is owned by us and 70% of which is owned by Inversiones Centenario S.A.A.); and three for which we have purchased land, but are still in the process of obtaining the requires approvals and permits.
Land Bank
We typically purchase land to develop real estate projects with the intention to begin construction within a 12- to 18-month period after the purchase of the land. We may also, from time to time, purchase land for subsequent resale. As of December 31, 2012, we owned approximately 888 hectares, of which 97.5% is located in Lima and 2.5% outside of Lima. We continually evaluate opportunities to purchase new land for our real estate development projects.
We have a 50.0% interest in Cuartel San Martín with Urbi Propiedades S.A. of Intergroup Financial Services Corp. owning the remaining 50.0%. Cuartel San Martín is a 68,000 m2 former military base located in Lima’s upscale Miraflores district, where we plan to invest approximately US$680 million to develop a premiere mixed-use development consisting of approximately 98,000 m2 of housing, 68,000 m2 of office towers, a 61,000 m2 shopping mall, and a 48,000 m2 luxury hotel and conference center. Although we are still in the pre-construction approval phase and have not yet obtained all required building permits, we plan to begin construction of this project in the fourth quarter of 2013 and expect to complete the project through multiple stages within four years.
We have a 50.4% interest in Almonte, which owns approximately 800 hectares of undeveloped land in Lurin, located 30 km south of Lima. We previously sold 20 hectares of the land for industrial use, and we expect to sell 71 hectares of the remaining land for industrial use in the next five years. We also expect to develop affordable housing projects on the land once water and sewage services become available.
120
Table of Contents
We also own a minority interest (approximately 20.8%) in Promoción Inmobiliaria del Sur S.A. (PRINSUR) of Inversiones Centenario, which owns approximately 990 hectares of undeveloped land also located in Lurin. We expect to develop affordable housing projects on the land once water and sewer services become available. Our proportional interest in this land is not included in our land bank.
Financing
We generally fund land purchases for our housing and commercial real estate projects through cash from our operations. For our affordable housing projects, we generally partner with real estate investment funds and insurance companies that provide between 60% and 70% of the total capital required to purchase the land and cover certain pre-construction costs in exchange for equity in the project. Once we acquire land for a particular real estate development project, we obtain working capital through a credit line from a financial institution, which we utilize to finance additional project needs as they arise. We also obtain financing through pre-construction sales for our affordable housing and housing projects and, to a lesser extent, our commercial real estate projects. Our affordable housing and housing projects generally require less outside financing because they are generally financed with pre-construction sales.
Sales and Marketing
We typically pre-sell our affordable housing and housing units prior to and during construction, and use the related proceeds we receive to finance the construction of the units. Our commercial and sales processes differ depending on the type of development and market segment of the development. We primarily sell our real estate development projects through an internal sales force that is assigned to particular projects and, to a lesser extent, external brokers on a non-exclusive, commission-fee basis. Our marketing efforts primarily consist of newspaper advertisements, radio and television commercials, billboards and promotional offers for referrals. We also advertise our real estate projects on our website.
We believe our brand is associated with product quality, professional operations and reliable post-sale customer service. We provide customer service call centers through which residents can report complaints or defects. Engineers respond with site visits, and repairs are made as long as the property continues to be covered by the applicable warranty or guarantee.
For our affordable housing projects, we provide post-sale customer service through our Ayni program, which aims to preserve the long-term value of our affordable housing developments by promoting a cooperative community life. Through this program, we distribute manuals that teach best practices for living in communities, offer leadership workshops, budget workshops, promote small business development, facilitate conflict resolution and provide other services. These services are provided for a six- to eight-month period following project delivery. In 2012, we initiated the Ayni contest for residents of our affordable housing projects with the aim of stimulating the sustainability of their community. Participants present an enhancement project for their community, such as a recreation center, and a jury selects the best project, which we fund and construct.
Competition
The Peruvian real estate development industry is highly competitive. The market is fragmented and no single company has a significant share of the national market. The principal competitors for our Real Estate segment are Paz Centenario Global S.A., Paz Centenario Inmobiliaria, Corporación Líder Perú S.A., Urbana Perú, Los Portales, Inmobiliari S.A., Imagina Grupo Inmobiliario, ENACORP, Besco S.A. and Gerpal. In the coming years, we expect more competition from domestic and foreign real estate development companies who recognize the growth potential in the Peruvian residential market. The main factors that drive competition are product design and amenities, price, location and post-sale service offerings.
121
Table of Contents
Technical Services
Our Technical Services segment undertakes a broad range of activities, including (i) the operation and maintenance of infrastructure assets; (ii) information technology (IT) services for private clients and the government; and (iii) electricity networks services. Characterized by mid-to long-term contracts, our Technical Services segment further adds a more stable cash flow stream to our consolidated activities. The table below sets forth selected financial information for our Technical Services business segment.
| As of and for the year ended December 31, | ||||||||||||||||
| 2010 | 2011 | 2012 | 2012 | |||||||||||||
| (in millions of S/.) | (in millions of US$) | |||||||||||||||
Revenues | 285.0 | 977.0 | 1,083.3 | 424.7 | ||||||||||||
EBITDA | 53.8 | 121.6 | 111.6 | 43.7 | ||||||||||||
EBITDA margin | 18.8 | % | 12.6 | % | 10.3 | % | ||||||||||
Net profit | 24.7 | 61.1 | 61.5 | 24.1 | ||||||||||||
Net profit attributable to controlling interest | 23.9 | 53.9 | 50.6 | 19.8 | ||||||||||||
Backlog | 750.3 | 1,391.9 | 2,228.9 | 873.7 | ||||||||||||
Backlog/revenues ratio(1) | 2.6x | 1.4x | 2.1x | |||||||||||||
| (1) | Backlog is calculated as of the last day of the applicable year. Revenues are calculated for such year and converted into U.S. dollars based on the exchange rate published by the SBS on December 31 of the corresponding year. |
The pie charts below set forth the breakdown of our revenues and EBITDA from our Technical Services for 2012.
| Revenues | EBITDA | |
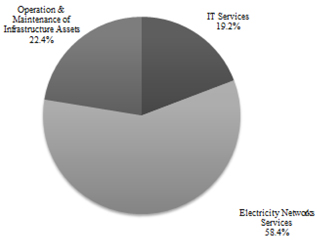 | 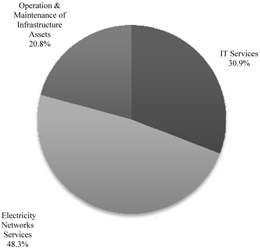 | |
| Total: US$424.7 million | Total: US$43.7 million | |
Operation and Maintenance of Infrastructure Assets
We began providing our operation and maintenance of infrastructure assets services in 1994 when we were awarded the concession for the Arequipa Matarani highway in southern Peru. With this experience, in 2003, we began providing operation and maintenance services to Norvial. In 2007, the Peruvian government initiated Proyecto Peru, a program aimed at maintaining roads not under concession to ensure their longevity. Proyecto Peru allowed us to develop new business opportunities providing maintenance services to more than 4,000 km of public roads in Peru. We believe the experience we have gained operating highway and transportation concessions positioned the company to capitalize on the Peruvian government’s initiatives to increase infrastructure development.
Our revenue in the operation and maintenance of infrastructure assets is generated either from fees we charge to Norvial, Survial, Canchaque and the Lima Metro to operate and maintain our concessions or from government payments through maintenance service contracts we have been awarded. As depicted in the chart below, we currently operate and maintain more than 5,000 km of Peruvian roads and highways, including our own highway concessions, in addition to the Lima Metro.
122
Table of Contents
Operation and Maintenance of Infrastructure Assets
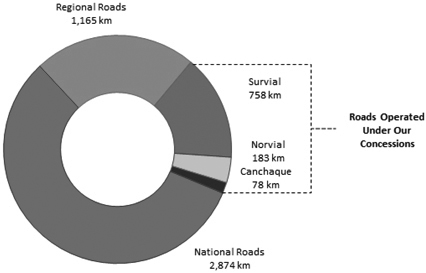
Total: 5,058 km
The table below sets forth selected financial information for our operation and maintenance of infrastructure assets activities.
| Year ended December 31, | ||||||||||||||||
| 2010 | 2011 | 2012 | 2012 | |||||||||||||
| (in millions of S/.) | (in millions of US$) | |||||||||||||||
Revenues | 143.8 | 232.9 | 242.8 | 95.2 | ||||||||||||
EBITDA | 30.4 | 53.6 | 23.2 | 9.1 | ||||||||||||
EBITDA margin | 21.2 | % | 23.0 | % | 9.6 | % | ||||||||||
Net profit | 17.5 | 34.9 | 12.6 | 4.9 | ||||||||||||
123
Table of Contents
The below map illustrates the roads in Peru for which we currently provide operation and maintenance services.
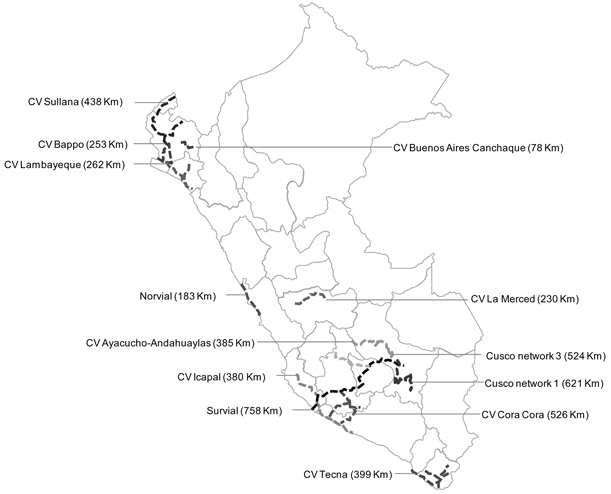
We provide the following road operation and maintenance services:
| • | Routine Maintenance. These services aim to preserve roads through ongoing maintenance, including: road demarcation; cleaning; drainage; road fissure treatment, which seals cracks in roads to prevent water infiltration; slurry sealing; and micro-paving, which seals asphalt to prevent aging and improve resistance to water and surface wear. |
| • | Periodic Maintenance. These services entail activities that are performed periodically, intended to prevent the occurrence or exacerbation of defects, conserve the structural integrity of roads and correct major defects. |
| • | Emergency maintenance. This maintenance work is performed whenever the need arises, such as when natural disasters damage road surfaces. |
We also administer toll stations and weighing stations; offer road patrolling services; operate assistance call centers; and provide emergency medical services.
The operation and maintenance services we provide to the Lima Metro aim to preserve the mass transit system through ongoing maintenance, including cleaning of the trains and stations and providing train operators, among other services.
With respect to operation and maintenance contracts with the Peruvian government, we obtain new contracts through public bidding. With respect to contracts with our Infrastructure segment, we participate in direct negotiation. Contract length typically ranges from three to five years.
124
Table of Contents
IT Services
We began our IT services business in 1984 providing computer equipment to companies and evolved into a technology solutions provider in 2000, becoming one of the two largest providers of IT services in terms of 2011 revenues in Peru, according to the International Data Corporation (IDC). In the early 1980s, Sonda, one of the main IT services providers in Latin America, was looking for a partner to represent Digital Equipment Corp. (currently, Hewlett-Packard) for the sale of hardware in Peru. Sonda’s need coincided with our diversification strategy and, therefore, we decided to jointly constitute GMD. In 1994, we bought out Sonda. Nowadays our main focus is the provision of business process and IT outsourcing services, and providing the necessary corresponding equipment, to well-known large companies and public institutions in Peru.
The infrastructure through which we operate our business includes two call centers with a total of 181 workstations and three data centers, amounting to 6,500 square feet. In addition, we have successfully entered into strategic partnerships with key international IT vendors such as Cisco Systems, Microsoft, Hewlett-Packard, Oracle, SAP, IBM, Citrix, VMware, CA Technologies and Louis Berger Group.
The table below sets forth selected financial information relating to our IT services.
| Year ended December 31, | ||||||||||||||||
| 2010 | 2011 | 2012 | 2012 | |||||||||||||
| (in millions of S/.) | (in millions of US$) | |||||||||||||||
Revenues | 141.2 | 185.9 | 208.0 | 81.5 | ||||||||||||
EBITDA | 23.4 | 31.6 | 34.5 | 13.5 | ||||||||||||
EBITDA margin | 16.5 | % | 17.0 | % | 16.6 | % | ||||||||||
Net profit | 7.2 | 9.1 | 11.3 | 4.4 | ||||||||||||
Services
We provide the following services to our clients:
| • | Systems Integration: includes installation and maintenance of hardware; 24-hour technical service; monitoring performance of IT systems; implementation of information recovery systems; and installation of systems that enable collaboration across multiple platforms such as Windows, Apple, Android and Blackberry, among others. For example, we provide equipment maintenance services to Backus, an affiliate of SABMiller. Our technology solutions optimize the reliability and performance of our client’s infrastructure with the goal of helping them reduce costs, improve security and integrate new technologies. |
| • | IT Outsourcing: includes servers on demand in the cloud (our internet network) which provide virtual memory, processing and storage capacities; virtual working spaces, including operating systems and databases; email accounts on the cloud; technical support help desk; among others. For example, we provide help desk services to Barrick Gold Corporation, serving a total of 3,300 users in four countries. Moreover, all of the trading transactions on the Lima Stock Exchange are electronically processed through our facilities. Our outsourcing services are designed to facilitate our clients’ operational continuity by means of an appropriate IT platform, managed in accordance with high standards of security and quality. |
| • | Application Outsourcing: includes corrective and continued maintenance of software; development of customized software (software factory); software testing and certification; and functional support through a service desk platform. For example, we have a software factory contract with an affiliate of Telefónica. Our application outsourcing services enable our clients to shift the burden of supporting, maintaining and operating their business software and systems. |
| • | Business Processes Outsourcing: consists of the outsourcing of specific business processes including billing, payments and collection; customer care services such as management of complaints; organization and control of voting processes; inventory, shipping and custody of documents; among others. For example, we provide billing services to an affiliate of Repsol, and provide document authentication services to BBVA Banco Continental. Moreover, in the latest local and regional presidential elections, we provided voting processing services to the Peruvian government. |
125
Table of Contents
The pie chart below shows our revenues by service for 2012.
Revenues by Service
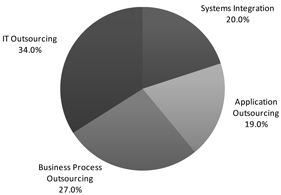
Total: US$81.5 million
Clients
We provide services to our clients pursuant to service level agreements which enable us to customize each contract to the needs of the particular client. We set specific parameters and standards which can include maximum times for response and levels of equipment performance, among others. The average term of our contracts is three to five years and we have achieved a significant level of contract renovation.
We have built a strong client base in Peru, including local affiliates of global companies, spanning a broad range of industries, including key clients from the energy, government, banking, insurance, pension funds, industrial, commercial, education and mining sectors. Our principal clients are affiliates of Barrick Gold Corporation, Repsol, BBVA Banco Continental, Honda, Telefónica, the Peruvian National Office of Electoral Processes (Oficina Nacional de Procesos Electorales), the Peruvian National Pension System (Sistema Nacional de Pensiones), the Peruvian Internal Revenue Service (SUNAT), AFP Integra- Sura Group, Backus, BELCORP and UNIQUE.
Competition
The IT services industry is highly competitive. The market includes both international companies and local or regional companies. Our main competitors, which are sometimes also our partners, include companies such as IBM, Tata Consultancy Services, Sonda, Indra, among others.
Electricity Networks Services
We offer field and specialized services consisting of installation and routine operation and maintenance of electricity infrastructure, primarily for power utility companies in Chile and, to a lesser extent, Colombia, Brazil and Peru. Field services include day-to-day services and troubleshooting required to maintain the electric grid. Specialized services require more sophisticated and more tailored technology and expertise. With over 20 years operating experience developing, installing, operating and maintaining metering systems, we have also developed a broad range of specialized solutions to reduce electricity theft, one of the main concerns for power utility companies in Latin America.
The table below sets forth selected financial information for our Electricity Networks Services.
| Year ended December 31, | ||||||||||||
| 2011(1) | 2012 | 2012 | ||||||||||
| (in millions of S/.) | (in millions of US$) | |||||||||||
Revenues | 558.2 | 632.5 | 247.9 | |||||||||
EBITDA | 36.4 | 53.9 | 21.1 | |||||||||
EBITDA margin | 6.5 | % | 8.5 | % | ||||||||
Net profit | 17.1 | 37.5 | 14.7 | |||||||||
| (1) | Due to our acquisition of CAM on February 24, 2011, only includes results for 10 months in 2011. |
126
Table of Contents
The field services we provide include, among others, installing and maintaining medium- and high-voltage electricity networks and public lighting networks; connecting new residential, commercial and industrial customers to the electrical grid; disconnecting and reconnecting the power supply of our clients’ customers; meter reading; verification of electricity theft; and the installation of meters and anti-theft solutions. We also provide services that include changing and repairing damaged electrical equipment and maintaining, transferring and expanding the electrical grid. We have developed a sophisticated management system to monitor the efficiency of the field services we provide and increase the daily productivity of our field crews.
We also provide specialized services, which involve more technical expertise and specialized equipment, including the monitoring of electrical consumption for approximately 340,000 industrial, commercial and residential customers. We have developed specialized metering systems and anti-theft solutions for the Latin American markets. We believe we are one of two companies with a relevant market penetration of these anti-theft solutions for power utility companies in our markets. We also operate laboratories that offer an array of services in response to local regulation requirements, such as meter certification, equipment testing and theft reports.
In Brazil and Chile, we also operate the warehouse facilities of local power utility companies, which store and distribute the necessary equipment for operations, such as cables, insulators and meters. In addition, in Chile, we lease residential electricity meters to a power utility company, for which we also provide maintenance services. We have formed strategic alliances with equipment manufacturers in order to develop and commercialize specialized metering systems and anti-theft solutions.
The chart below sets forth the percentage of our 2012 revenues in each of the countries where we operate.
Revenue by Country
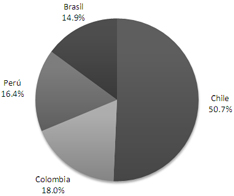
Total: US$247.9 million
Contracts and Clients
We typically provide our services pursuant to long-term contracts ranging between three and five years. Most of our contracts are awarded through a non-public bidding process, although some contracts are negotiated directly with the client.
Our principal clients are power utility companies and, to a lesser extent, industrial clients, predominantly in the private sector. In Peru, we also provide services to the telecommunications industry. Our principal clients are the distribution companies of Enersis. Over the years, we have worked with the principal power utility companies in the region, including Chilectra, Saesa, Chilquinta, AES, E-CL, Endesa Chile, Ampla, Coelce, Cemig, Coelba, Elektro, Light, Codensa, Emgesa, EEC, Enertolima, Emcalo, Edelnor, Electrocentro, Enosa, Claro and Telefonica.
Competition
The market for electricity networks services is highly fragmented and no single company has a significant share of the national market in the countries where we operate. We primarily compete with small, local privately-held service companies. We expect competition to increase in the coming years as electricity consumption grows in response to the economic growth, and relatively low per capita consumption, in the countries where we operate. The main factors that drive competition are safety; product and service quality; reliability; price; and ability to respond to increased industry regulations.
127
Table of Contents
Backlog
We define our backlog as the U.S. dollar equivalent value of revenue we expect to realize in the future as a result of performing work under multi-period contracts that we have entered into. Backlog is not a measure defined by IFRS, and our methodology for determining backlog may not be comparable to the methodology used by other companies in determining their backlog. For contracts denominated in nuevos soles or other local currencies, amounts have been converted into U.S. dollars based on the exchange rate published by the SBS on December 31 of the corresponding year.
We do not include backlog in this prospectus for our Real Estate segment, or, in our Infrastructure segment, for our Norvial toll road concession or our Energy line of business. When we present backlog on a segment basis, we do not include eliminations that are included in our consolidated backlog. For a description of how we calculate our backlog, see our segment backlog presented below. See “Risk Factors—Risks Related to Our Company— Our backlog and our ratio of historical backlog to revenues may not be reliable indicators of future revenues or profit.”
Our consolidated backlog as of December 31, 2012 was US$4,096.5 million. As of December 31, 2012, we expect to recognize as revenues 42.1% of our backlog by December 31, 2013, 31.0% of our backlog by December 31, 2014 and 26.9% of our backlog thereafter. The following table sets forth the growth of our consolidated backlog from 2008 to 2012.
Backlog Growth (in US$ million)
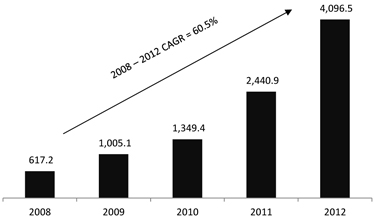
128
Table of Contents
The chart below sets forth our consolidated backlog breakdown by end-market, geography and client sector as of December 31, 2012.
| 2012 Backlog by End Market | 2012 Backlog by Client Type | |
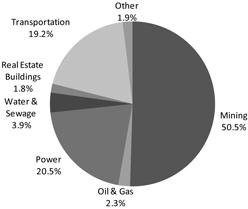 | 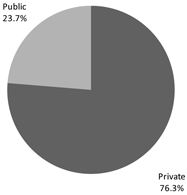 | |
| Total: US$4,096.5 million | Total: US$4,096.5 million | |
2012 Backlog by Geography
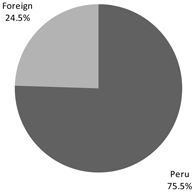
Total: US$4,096.5 million
E&C Backlog
To include an engineering and construction contract in our backlog, we assume that each party will satisfy all of its respective obligations under the contract. We also make assumptions, in agreement with the client, regarding the total expected contract price in the case of unit price and cost-plus fee contracts and the amount of the contract that will be completed in each year. We adjust our backlog periodically to account for developments related to each project. For projects related to joint operations, we only include our percentage ownership of the joint operation’s backlog. Our E&C segment backlog does not include intersegment eliminations.
Our E&C backlog as of December 31, 2012 was US$2,925.4 million. As of December 31, 2012, we expect to recognize as revenues 42.1% of our backlog by December 31, 2013, 31.5% of our backlog by 2014 and 26.4% of our backlog thereafter. The following table sets forth the growth of our E&C backlog from 2008 to 2012.
129
Table of Contents
E&C Backlog Growth (in US$ million)
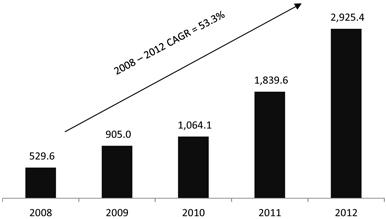
The following pie charts set forth our E&C backlog breakdown by end-market, geography, client sector and contract type as of December 31, 2012.
| Backlog by End-Market | Backlog by Geography | |
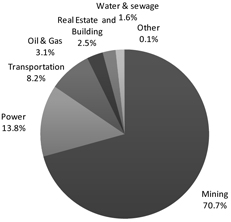 |
| |
| Total: US$ 2,925.4 million | Total: US$ 2,925.4 million | |
| Backlog by Client Type | Backlog by Contract Type | |
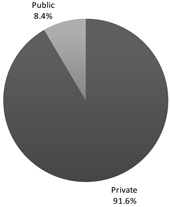 | 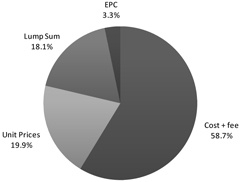 | |
| Total: US$ 2,925.4 million | Total: US$ 2,925.4 million | |
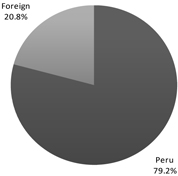
130
Table of Contents
The table below sets forth our ending E&C backlog for 2010, 2011 and 2012, accounting for opening backlog for each year, annual contract bookings and adjustments and annual revenues recognized.
| 2010 | 2011 | 2012 | ||||||||||
| (in millions of US$) | ||||||||||||
Opening backlog (December 31 of prior year) | 905.0 | 1,064.1 | 1,839.6 | |||||||||
Contract bookings and adjustments during the year | 764.5 | 1,807.8 | 2,467.4 | (1) | ||||||||
Revenues recognized during the year | (605.4 | ) | (1,032.3 | ) | (1,381.6 | ) | ||||||
|
|
|
|
|
| |||||||
Ending backlog (December 31 of respective year) | 1,064.1 | 1,839.6 | 2,925.4 | |||||||||
| (1) | US$1,240.7 million of this amount represented three new contracts, with the remainder being renewals or additions to existing contracts. |
The table below sets forth our backlog at the reported years end and the ratio of such backlog to revenues earned in the subsequent two years.
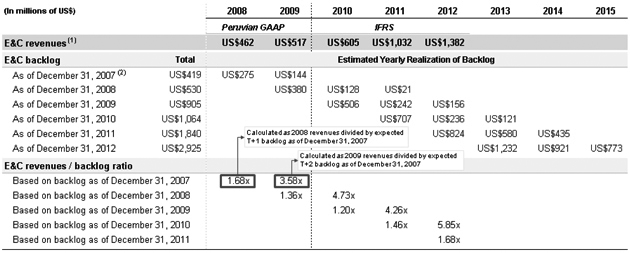
| (1) | Revenues are calculated for such year and converted into U.S. dollars based on the exchange rate published by the SBS on December 31 of the corresponding year, which was S/.2.81 to US$1.00 as of December 31, 2010, S/.2.70 as of December 31, 2011 and S/.2.55 as of December 31, 2012. |
| (2) | In 2007, we only reported estimated yearly realization on our backlog for the first year and for the second and subsequent years. |
The top row from the table above shows actual E&C revenues for each of the years in the 2008-2012 period. Revenues for 2008-2009 are presented in Peruvian GAAP and revenues for 2010-2012 are presented in IFRS. The next subsequent rows show what the estimated backlog for the E&C segment had been as of each year-end period, between 2007 and 2012, as well as the portion of each year-end backlog that was estimated at the time to be executed in each of the next two years and thereafter. For example, E&C backlog as of December 31, 2008 was US$530 million, of which US$380 million was estimated at the time to be executed in 2009 (“T+1”), US$128 million in 2010 (“T+2”) and US$21 million in 2011 and thereafter.
The second part of the table shows E&C revenues to backlog ratios, calculated as the actual E&C revenues that were obtained in a year divided by what the estimated E&C backlog realization for that same year had been one year before and two years before. For example, the ‘T+1’ revenues to backlog ratio for 2007 was 1.68x (calculated as 2008 revenues of US$462 million divided by US$275 million, which was the portion of the backlog as of December 31, 2007 that was estimated at the time to be executed in 2008). This means that in 2008 we were able to generate actual revenues of 1.68x times what the estimated backlog for 2008 had been as of the previous year-end period.
Our revenues in each of the reported years exceeded T+1 estimated backlog realization for the year because revenues were earned from, in addition to contracted amounts reflected in such backlog, new contracts signed during the year and change orders on backlog contracts. These positive effects were offset in part by delays in project execution and project cancellations. Our T+1 ratios have varied significantly from year to year because of the unpredictability and wide dispersion in size of new projects, change orders, delays and cancellations, and the variation in T+2 ratios is even greater because the effect of these factors increases with the passage of time. In
131
Table of Contents
particular, new project wins and change orders usually decline when economic conditions worsen. Our historical T+1 and T+2 ratios may not be indicative of future backlog realization ratios because the effect of these factors is unpredictable and we may not be able to generate revenues at multiples above our contracted backlog because of factors explained above and because we may not be able to increase the scale of our operations to realize such incremental revenues. In particular, we do not believe that the ratio of our E&C segment revenues for 2013 and 2014 to T+1 and T+2 backlog for those years will be comparable to our historic ratios.
Infrastructure Backlog
In reflecting an Infrastructure contract in our backlog, we assume that each party will satisfy all of its respective obligations under the contract. For our Infrastructure backlog, we only include contracted revenues expected to be paid during the next three years following the backlog calculation date. Infrastructure backlog in this prospectus does not include our Norvial toll road concession or our Energy line of business. Our Infrastructure segment backlog does not include intersegment eliminations. We calculate our Infrastructure backlog as follows:
| • | for the Lima Metro, we estimate the number of trains in operation in the applicable period. Our Infrastructure backlog assumes that: (i) for 2013, we will initially operate five trains and add one train per month beginning in May 2013, which in the aggregate will travel 1,436,000 km for that year; (ii) for 2014, we will operate 14 trains, which in the aggregate will travel 1,670,873 km for that year; and (iii) for 2015, we will operate 24 trains in both the first and second stretches of Line One, which in the aggregate will travel 2,603,453 for that year. The above assumptions are based on terms under our concession; |
| • | for our Survial and Canchaque concessions, we assume our contractually agreed upon annual fee, adjusted for inflation. For our 2014 and 2015 backlog, we utilize the same adjustment amount that was utilized for our 2013 fee, which has already been negotiated; and |
| • | for La Chira, the agreed-upon fee that the government will pay for the construction of the waste water treatment plant is reflected as backlog for 2013 and 2014. For 2015, backlog is calculated to include the fees we will receive under the concession for our operation and maintenance, with no adjustment for inflation because 2015 is expected to be the plant’s first year of operations. |
Our Infrastructure backlog as of December 31, 2012 was US$427.0 million. As of December 31, 2012, we expect to recognize as revenues 36.7% of our backlog by December 31, 2013, 40.7% of our backlog by December 31, 2014 and 22.6% of our backlog in 2015. The following chart sets forth the growth of our Infrastructure backlog from 2010 to 2012.
Infrastructure Backlog Growth (in US$ million)
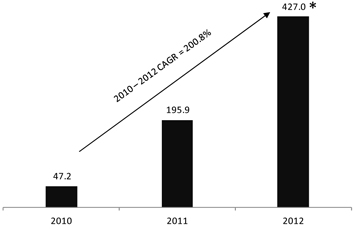
| * | The Lima Metro commenced operations on January 9, 2012. |
132
Table of Contents
The following pie charts set forth our Infrastructure backlog breakdown by line of business as of December 31, 2012.
2012 Backlog by Line of Business
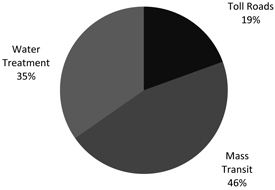
Total: US$427.0 million
The table below sets forth our ending Infrastructure backlog for 2010, 2011 and 2012, accounting for opening backlog for each year, annual contract bookings and adjustments and annual revenues recognized (excluding Norvial and our Energy line of business).
| 2010 | 2011 | 2012 | ||||||||||
| (in millions of US$) | ||||||||||||
Opening backlog (December 31 of prior year) | — | 47.2 | 195.9 | |||||||||
Contract bookings and adjustments during the year | 62.9 | 162.2 | 290.6 | (1) | ||||||||
Revenues recognized during the year | (15.6 | ) | (13.5 | ) | (59.5 | ) | ||||||
|
|
|
|
|
| |||||||
Ending backlog (December 31 of respective year) | 47.2 | 195.9 | 427.0 | |||||||||
| (1) | All of this amount represented renewals or additions for existing contracts. |
Technical Services Backlog
In reflecting a Technical Services contract in our backlog, we assume that each party will satisfy all of its respective obligations under the contract and that work under the contract will be completed on a straight-line basis. For contracts denominated in nuevos soles or other local currencies, amounts have been converted into U.S. dollars based on the exchange rate published by the SBS on December 31 of the corresponding year. Our Technical Services segment backlog does not include intersegment eliminations.
Our Technical Services backlog as of December 31, 2012 was US$873.7 million. As of December 31, 2012, we expect to recognize as revenues 44.8% of our backlog by December 31, 2013, 24.9% of our backlog in 2014 and 30.3% of our backlog thereafter. The following chart sets forth the growth of our Technical Services backlog from 2008 to 2012.
133
Table of Contents
Technical Services Backlog Growth (in US$ million)
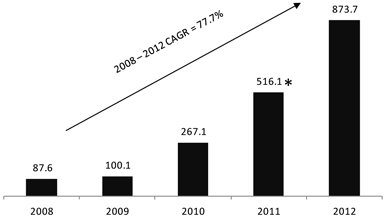
| * | Includes CAM, which we acquired on February 24, 2011. |
The table below sets forth our ending Technical Services backlog for 2010, 2011 and 2012, accounting for opening backlog for each year, annual contract bookings and adjustments and annual revenues recognized.
| 2010 | 2011 | 2012 | ||||||||||
| (in millions of US$) | ||||||||||||
Opening backlog (December 31 of prior year) | 100.1 | 267.1 | 516.1 | |||||||||
Contract bookings and adjustments during the year | 268.5 | 611.2 | 782.3 | (1) | ||||||||
Revenues recognized during the year | (101.5 | ) | (362.2 | ) | (424.7 | ) | ||||||
|
|
|
|
|
| |||||||
Ending backlog (December 31 of respective year) | 267.1 | 516.1 | 873.7 | |||||||||
| (1) | US$247.6 million of this amount represented new contracts, with the remainder being renewals or additions for existing contracts. |
The following pie charts set forth our Technical Services backlog breakdown by geography, end-market and client sector as of December 31, 2012.
| Backlog by End-Market | Backlog by Geography | Backlog by Client Sector | ||
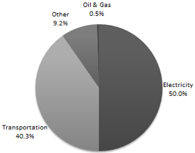 | 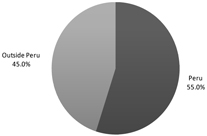 |
| ||
| Total: US$873.7 million | ||||
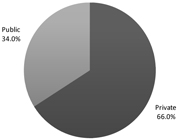
Employees
We have developed an extensive and talented team, including more than 3,500 engineers, that gives us the capability and scale to undertake large and complex projects. We also have access to a network of approximately 40,000 manual laborers throughout Peru that can supplement our workforce when required by our projects. Moreover, we have the flexibility to engage our own workers on projects outside Peru, avoiding the need to seek new employees in other countries.
134
Table of Contents
As of December 31, 2012, we had a total of 28,257 full-time employees, including approximately 12,000 manual laborers, a number that fluctuates depending on our project backlog. At such date, we also worked with 4,452 employees of subcontractors. Occasionally, we employ subcontractors for particular aspects of our projects, such as carpenters, specialists in elevator installation and specialists in glassworks. We are not dependent upon any particular subcontractor or group of subcontractors. As of December 31, 2012, 24% of our employees worked outside Peru. The following table sets forth a breakdown of our employees by category as of December 31, 2012.
Salaried Employees | Engineering and Construction | Infrastructure | Real Estate | Technical Services | Corporate | Total | ||||||||||||||||||
Engineers | 2,229 | 127 | 30 | 1,260 | 11 | 3,657 | ||||||||||||||||||
Other professionals | 902 | 72 | 45 | 861 | 38 | 1,918 | ||||||||||||||||||
Technical specialists | 1,014 | 245 | 36 | 4,520 | 9 | 5,824 | ||||||||||||||||||
Manual laborers(1) | 11,885 | 11,885 | ||||||||||||||||||||||
Joint operations employees(2) | 3,545 | 1,428 | 4,973 | |||||||||||||||||||||
|
|
|
|
|
|
|
|
|
|
|
| |||||||||||||
Subtotal | 19,575 | 1,872 | 111 | 6,641 | 58 | 28,257 | ||||||||||||||||||
Subcontracted employees | 4,452 | — | — | — | — | 4,452 | ||||||||||||||||||
|
|
|
|
|
|
|
|
|
|
|
| |||||||||||||
Total | 24,027 | 1,872 | 111 | 6,641 | 58 | 32,709 | ||||||||||||||||||
| (1) | The number of manual laborers, who form part of our network of approximately 40,000 manual laborers, varies in relation to the number and size of projects we have in process at any particular time. |
| (2) | Includes engineers, professionals, technical specialists and manual laborers employed by our joint operations. |
Our talent development system has allowed us to develop a team of professionals who are able to design and implement sophisticated projects. Our talent development system is based on three main pillars: (i) specialized training for all levels, including senior management; (ii) mentoring; and (iii) feedback from managers to employees.
We have implemented programs to attract young and qualified candidates. Our Trainee, Academic Excellence and Young Engineers programs, offer various types of internships and training opportunities to engineering students and recent graduates, rewarding the most successful candidates with the opportunity to work as full-time, permanent employees. Our focus is not only to attract talented people but also to retain them. Therefore, during the last five years we have worked together with Great Place to Work, a human resources consulting, research and training firm, to measure our employee’s satisfaction with the working environment. According to studies carried out by Great Place to Work during 2012, 70% of our engineers, technical specialists and other professional employees confirmed that we are a “great place to work.” Moreover, our subsidiaries Viva GyM and GMP were recognized by Great Place to Work as being among the 45 best companies to work for in Peru.
Through our Corporate Learning Center, we offer continued education opportunities through a wide selection of courses and training programs targeted at each level. We believe the knowledge that our employees gain through these programs is reflected in the way they work and relate to our clients, adding value in every step. During 2012, we invested US$7.7 million in continuing education, reaching approximately 304,000 hours of capacitation activities for our employees.
We place significant emphasis on instilling our core corporate values of quality, professionalism, reliability and efficiency and on promoting safety, environmental sustainability and social responsibility throughout the entire organization. Our Code of Conduct and Charter of Ethics regulate the conduct of our employees while promoting the foregoing values. In addition, our employees participate in ethics seminars on a periodic basis.
Substantially all of our manual laborers and some other employees are members of labor unions. Our practice is generally to extend the benefits we offer our unionized employees to non-unionized employees. We consider our current relationship with unions to be positive.
In our E&C segment, collective bargaining agreements are negotiated at two levels: on an annual basis between the National Federation of Civil Construction and the Peruvian Chamber of Construction, without our direct involvement; and on a per project basis directly between the unions and our project committees, in accordance with such annual agreement. In addition, some of our personnel in our gas processing plant belongs to the labor union
135
Table of Contents
Unicode Workers Union GMP S.A. We currently have collective bargaining agreements with some of our gas processing plant workers. In the case of our operation and maintenance of infrastructure assets business, some of our personnel in CAM Perú are subject to a collective bargaining agreement. These collective bargaining agreements are negotiated on an annual basis.
Safety
In 2012, our E&C subsidiary GyM had an accident incidence rate of 0.29, calculated over 63,833,386 hours worked. In 2011, GyM had an accident incidence rate of 0.52, calculated over 52,979,699 hours worked, which was lower than that of private construction companies in the United States for the year, which had an average of 3.80, as reported by the Bureau of Labor Statistics of the United States Department of Labor. In 2010, 2011 and 2012, we had two, two and six fatalities, respectively.
Our occupational health and safety management system in our subsidiaries GyM, GMP and GMI is certified by OHSAS 18001. We believe a safe job site contributes to our reputation and ability to gain new business while enhancing employee morale and reducing costs and exposure to liability. We train our employees in safety, environment, occupational health and related topics, and have trained and certified experts in risk management and prevention who disseminate and regulate risk prevention standards and procedures. We have more than 400 staff members across our subsidiaries dedicated to health, safety and environmental matters, and at least two and up to 35 health, safety and environmental employees are assigned to each E&C project we undertake depending on the nature of the project and the client’s requirements. Moreover, each project manager is responsible for compliance with our safety requirements and for the protection of our employees.
To ensure safe conditions, we perform preventive and routine maintenance on all of our properties, worksites, systems and machinery, and make repairs and replacements when necessary or appropriate. We also conduct routine and required inspections of those properties in accordance with applicable regulation. Furthermore, we continually monitor, test, and record the effectiveness of our safety measures and assure that the highest risk segments receive the highest priority for scheduling internal inspections or tests for integrity.
Insurance and Contingency Planning
We have insurance coverage for fire; strike, riot, malicious damage, vandalism and terrorism; loses or damages to construction machinery and equipment; destruction or disappearance of property; civil liability, including physical harm to third parties; professional liability; transportation; vehicle theft, collision, rollover, fire and accidents; and directors and officers liability. Additionally, we carry different policies for specific risks related to our business segments. Our management considers this coverage to be sufficient to cover probable losses and damages, taking into consideration the nature of our activities, the risks involved in our transactions and the advice of our insurance brokers.
We also have contingency plans in place in order to protect our company and the interests of our clients. In the event of an emergency, we have procedures in place designed to minimize any resulting interruption in service to our most critical business processes.
Moreover, in the event of an emergency, we have systems and procedures in place that minimize the impact of unplanned downtime to our IT services’ clients. Our data centers have redundant facility systems and infrastructure to provide continued operation on each of them, complying with international standards such as ISO/IEC 27001 and ISO 9001.
Warranties
For certain of our contracts, we are required to provide performance bonds to ensure compliance with contractual obligations such as construction works, operation and maintenance of infrastructure assets, among others. The amount of the performance bond varies on a case-by-case basis, depending on the value of the project. Performance bonds are usually renewed annually until the contractual obligation which they intend to guarantee is fully satisfied.
As part of our real estate sales contracts, we provide a six-months warranty for latent defects, which covers hidden flaws not discoverable through inspection. The warranty extends to a five-year term if the defects are caused by: (i) the use of materials below the requisite quality standards; (ii) poor execution; or (iii) faulty land. We also provide a five-year warranty for structural defects, and assume the terms and conditions of our finishes suppliers’ warranties.
136
Table of Contents
We provide warranties in connection with our IT services. All government contracts include a latent defects clause, in accordance with Article 51 of the Procurement Act which establishes a minimum warranty of one year, although, for some contracts, we provide warranties for two or three years. For contracts involving the sale of equipment or licensing, we provide the manufacturer’s warranty and, if a claim arises, we transfer the claim to the manufacturer unless we provided an extended warranty. For software development contracts, we provide a one to three years good performance warranty.
We have had no material disbursement or expenditure related to our warranties in the recent past.
Quality Assurance
The quality of our services is backed by the following certifications:
| • | Engineering and Construction: ISO 14001 and ISO 9001 |
| • | Infrastructure: |
| • | GMP: ISO 14001 and ISO 9001 |
| • | Technical Services: |
| • | Operation and Maintenance of Infrastructure Assets: ISO 9001 |
| • | IT Services: ISO 9001, ISO 27000 and CMMI-3 |
| • | Electricity Networks Services: ISO 14001 and ISO 9001 |
Properties, Plants and Equipment
Approximately 91% of our assets is located in Peru, with the balance located primarily in Chile. At December 31, 2012, the book value of all our land (excluding real estate inventories) and buildings, machinery and equipment was approximately US$207.5 million. We currently lease certain machinery and equipment from vendors. The term of our leasing contracts ranges from two to five years, depending on the nature of the equipment. Leased machinery and equipment are capitalized for accounting purposes. Our principal executive offices, which we lease, are located at Av. Paseo de la República 4667, Surquillo, Lima 34, Peru. We are constructing additional office space for our corporate use, which we expect to complete in the beginning of 2014.
Legal and Administrative Proceedings
We may, from time to time, become subject to various legal and administrative proceedings that are incidental to the ordinary conduct of our business. We are currently not party to any material legal or administrative proceedings.
Corporate Social Responsibility
We aim to attract and develop our human capital through various training, mentorship and rewards programs in order to maintain our position as the best place to learn and work in the engineering field in Peru. We also seek to promote social good by continuing to foster relationships with the communities that surround the areas of operation of each of our business segments. As part of our citizenship building efforts, among other things, we provide: necessary tools for improving the employability and economic livelihood of citizens; create basic infrastructure to promote the use of public spaces as cultural spaces and training grounds for citizens; and create spaces that not only provide benefits, but also encourage citizens to actively participate in their maintenance.
Our social responsibility efforts have been recently recognized by the award of prizes such as the “Latin American Award for Corporate Social Responsibility 2012” awarded by the Inter-American Federation of the Construction Industry (FIIC), the “Business Creativity Award” granted by the Peruvian University of Applied Sciences (UPC) and the recognition as the “Peruvian Model Company” by the Lima Chamber of Commerce (CCL).
137
Table of Contents
Our model of sustainable development is based upon building relationships of trust. In our projects we consider the needs of local communities with respect to generating employment; the expectations of our customers regarding the particular goals of the project; the demand of the state for a trained service provider; and investors who wish to entrust their capital to a company that follows best practices in corporate governance and social responsibility. The following is description of our main corporate social responsibility projects:
| • | Our social support program “Ayni” is intended to achieve the sustainability of our affordable housing projects by encouraging the responsible and committed participation of the owners of the units. This program has provided social training to more than 6,000 families in order to strengthen their leadership skills, integration and mutual respect. |
| • | Through our “Metro Culture” program, we transform our trains and train stations into centers of social and cultural education. According to a 2012 poll, 97% of the Lima Metro users think that we have contributed to the development of the city and 92% believes that we have generated better citizens. |
| • | Our “Road Management” program provides members of surrounding communities with the necessary civic and technical tools to make use of the roads and contribute to their maintenance by, for example, providing education on road safety and environmental protection. Moreover, we work on turning regular roads into touristic routes through the development and dissemination of guides, websites and training local communities to help develop skills in tourism. |
138
Table of Contents
Engineering and Construction
Regulatory Framework Applicable to Contracts with the Public Sector
Peru’s State Contracting Law approved by Legislative Decree No. 1017 (Ley de Contrataciones del Estado) and its regulation approved by Supreme Decree No. 184-2008-EF govern services and construction agreements entered into with public entities. Article 10 of the Supreme Decree No. 184-2008-EF establishes that at the beginning of the contracting process, the contracting public entity must prepare a technical file describing the characteristics of the services it intends to purchase and the selection process for its counterparts, among other specifications such as a feasibility statement in accordance with the Peruvian Public Investment National System.
The selection processes are established in Articles 15, 16, 17 and 18 of Peru’s State Contracting Law as follows:
| • | public biddings (licitación pública) applicable to goods, supplies and works; |
| • | public tenders (concurso público) applicable to services; |
| • | direct award (adjudicación directa) applicable to goods, services and works, which can be public or directed at select participants depending if the value is equal to, lower than, or higher than 50% of the maximum amount set forth in the state budget regulation for direct award; and |
| • | lowest amount award (adjudicación de menor cuantía) applicable to goods, services and works whose value is lower than one-tenth of the minimum limit established by the state budget regulation. |
With the exception set forth in Article 22 of the Supreme Decree No. 184-2008-EF, the selection processes include the following phases: notice; registration of participants; submission and reply of inquiries; submission and reply of comments; preparation of the terms and conditions of the selection process; submission of bids; evaluation and qualification of bids; and adjudication.
Article 9 of Peru’s State Contracting Law establishes that participants of any of the foregoing selection processes must be registered in the Peruvian National Registry of Suppliers (Registo Nacional de Proveedores) and must not be disqualified from contracting with the state. Article 252 of the Supreme Decree No. 184-2008-EF establishes that this registration is renewable as long as a request is submitted to the Peruvian National Registry of Suppliers 60 days prior to expiration of the registry.
Bidders may participate in the selection process as part of a joint operation, in which case all members of the joint operation must be registered in the Peruvian National Registry of Suppliers and will be jointly liable for all consequences arising from the joint operation’s participation in the selection process and the execution of the agreement.
GyM and GMI are registered in the Peruvian National Registry of Suppliers as a construction and a consulting company, respectively.
Article 40 of the Supreme Decree No. 184-2008-EF establishes the types of contracts that may be entered into by public entities:
| • | lump-sum (sistema a suma alzada), applicable when the amounts, magnitudes and quality are determined in the terms and conditions of the selection process. The bidder submits its proposal indicating a fixed amount and a term for the completion of the agreement; |
| • | unit price, rates or percentages (sistema de precio unitario, tarifas o porcentajes), applicable when the nature of the service to be provided does not allow accurate determination of the required quantities; and |
| • | lump-sum and unit price, rates or percentages mix (esquema mixto de suma alzada y precios unitarios), applicable when accurate determination of the quantities required for some of the components cannot be made. |
139
Table of Contents
Article 41 of the Supreme Decree No. 184-2008-EF establishes that, in the case of goods and works, the terms and conditions of the selection process must indicate the execution type of the agreement as follows:
| • | “turn-key” (llave en mano), when completion is subject to the construction, equipment and operations, and, if applicable, the submission of the technical file in connection with the bidding process; and |
| • | bid contest (concurso oferta), when completion is subject to the submission of the technical file, the completion of the work or land, as applicable. This completion type is only applicable to lump-sum contracts and public bidding selection process. |
Peru’s State Contracting Supervising Agency (Organismo Supervisor de las Contrataciones del Estado, or “OSCE”), a public-sector entity within the Peruvian Ministry of Economy and Finance, supervises and oversees the selection processes carried out by public entities; manages the Peruvian National Registry of Suppliers; imposes penalties to suppliers that violate the provisions set forth in Peru’s State Contracting Law, its regulation and other related provisions; and informs the government’s General Controller (Contraloría General de la República) regarding violations to the regulation when damages are caused against the state.
Regulatory Framework Applicable to Contracts with the Private Sector
Parties to a private-sector agreement may freely determine the contract type and its contents as long as it complies with certain legal requirements, including the provisions set forth in Article 1353 of the Peruvian Civil Code. GyM, GMI and Stracon GyM participate in private-sector contracts for engineering and constructions.
Construction Activities in Peru
Legal Framework
Legislative Decree No. 727 declared that construction activities in Peru are in the public interest and of preferential national interest. According to Section F of the Fourth review of the United Nations International Statistical Industrial Classification (ISIC), construction activities typically consist of the construction of dwellings, buildings and stores; and the construction of large scale infrastructure projects such as highways, bridges, tunnels, railways, irrigation systems, sewage systems, industrial facilities, pipelines and electric lines, among others. GyM has developed numerous projects in the construction sector. Currently, the company focuses on buildings (ISIC Division 41), civil works (ISIC Division 42) and specialized activities (ISIC Division 43).
Construction entities must comply with the National Building Regulation (Reglamento Nacional de Edificaciones approved by Supreme Decree No. 011-2006- VIVIENDA), which establishes that urban allotments and buildings must be developed in compliance with the rules governing safety, functionality, accessibility, habitability and environmental impact. According to Article 25 of the National Building Regulation, construction companies, such as GyM and GMI, are responsible for (i) executing works in accordance with project specifications and applicable regulation; (ii) possessing the organization and infrastructure that guarantee the feasibility of the project; (iii) appointing the party responsible for the construction to assume its technical representation; (iv) providing the resources and materials to complete the project pursuant to the terms of the agreement and required standards and within the approved budget; (v) executing subcontracts within contractual limitations; and (vi) delivering to the client documented information regarding the executed works.
Notwithstanding any legal actions that the construction company may take against suppliers, manufacturers or subcontractors, the construction company may be responsible for the construction including the work executed by subcontractors and for the use of defective materials or supplies.
Penalties for violating the National Building Regulation are determined by the municipal government in the jurisdiction where the project is developed, and set forth in its corresponding regulations. In addition, they may also pursue criminal actions or civil claims if applicable.
140
Table of Contents
Safety Regulation in Construction Projects
The Law on Safety and Health at Work (Law No. 29783) is intended to promote workplace accident prevention and applies to all economic sectors. The principal safety rules applicable to construction projects include the following:
| • | companies with 20 or more employees must establish a safety and health at work committee; |
| • | all projects must have a safety and health plan consisting of all the technical and administrative mechanisms to guarantee the physical integrity and health of workers and third parties during project execution; |
| • | occupational diseases detected during project execution must be recorded and the competent authority must be notified in accordance with the regulation of the Law on Safety and Health at Work approved by Supreme Decree No. 005-2012-TR, and with Ministerial Resolution No. 510-2005- MINSA; |
| • | companies must provide for medical examinations of its employees prior to, during and at the termination of their employment; |
| • | companies with 20 or more employees must have an internal safety and health regulation policy; |
| • | companies must show a safety and health plan; an index of frequency; and the company’s performance in safety and health in order to be awarded public and private projects; |
| • | use of individual protective equipment, including gloves, safety goggles, boots and helmets, is mandatory when risks to safety and health cannot be prevented by other means; and |
| • | personnel responsible for safety must comply with all requirements in Rule NTP S50.04S for fire prevention. |
The Peruvian Ministry of Labor and Employment Promotion and the Peruvian Ministry of Health are the competent organisms in the safety and health fields, respectively.
Regulations Applicable to Subsectors
Power and Utilities
GyM and CAM Peru must comply with the rules of Ministerial Resolution No. 161-2007-MEM-DM for its activities relating to the construction of hydroelectric plants, transmission lines and substations. OSINERGMIN is the authority responsible for supervising and enforcing compliance of the foregoing rules.
Mining
GyM and Stracon GyM must comply with the Mining Occupational Health and Safety Regulation, approved by Supreme Decree No. 055-2010-EM and other related regulations for their mining-related construction activities including the construction of mineral processing plants and other mining-related buildings, among others. In developing mining projects, our subsidiaries’ personnel must follow the safety programs and be familiar with internal rules from their mining client. The Peruvian Ministry of Labor and Employment Promotion and OSINERGMIN are the authorities responsible for supervising and enforcing compliance of the foregoing rules.
Oil and Gas
GyM must comply with Supreme Decree No. 043-2007-EM for its activities relating to the construction of gas processing plants. The Peruvian Ministry of Labor and Employment Promotion is the authority responsible for supervising and enforcing compliance of the foregoing rules. See “Regulatory Matters—Infrastructure—Peruvian Hydrocarbon Regulation—Environmental Regulation” for more information on environmental regulation applicable to the oil and gas sector.
141
Table of Contents
Industrial Construction
GyM must comply with the Industrial Safety Regulation approved by Supreme Decree No. 42-F (Reglamento de Seguridad Industrial) for its activities relating to the construction of industrial plants.
Registries and Permits
According to Supreme Decree No. 004-2007-TR, civil contractors must be registered in the National Civil Construction Contractors and Subcontractor Registry, and comply with the rules of Ministerial Resolution No. 195-2007-TR which establishes the requirements for registration. GyM and Stracon GyM are currently registered in this registry.
According to Supreme Decree No. 005-2008-EM mining contractors must be registered in the National Mining Contractors and Specialized Companies Registry. GyM and Stracon GyM are currently registered in this registry.
GyM and Stracon GyM have obtained all the material licenses, permits and approvals required by applicable regulation to conduct activities within the construction and mining sectors.
Labor Law Requirements in Civil Construction
Labor law requirements in civil construction consist of the specific legal framework for civil construction workers and the general legal framework applicable to the administrative personnel in the civil construction sector set forth in the Single Revised Text of the Labor Productivity and Competitiveness approved by D.S No. 003-97-TR.
Seasonality of services is one of the main features in the specific legal framework due to the temporary nature of construction contracts. Consequently, certain general rules such as the trial period are not applicable to construction workers.
The principal terms and conditions relating to collective bargaining from our civil construction workers have been agreed upon and recorded in the 2012-2013 agreement, dated August 16, 2012, and entered into between the Peruvian Chamber of Construction and the Federation of Civil Construction Workers (Federación de Trabajadores en Construcción Civil). The 2012-2013 agreement included the following benefits: (i) remuneration increase; (ii) bonuses and premiums rewarding high specialization degrees; (iii) bonuses for workers that work at elevations above 3,000 meters or below zero-level elevation (below a second basement or five meters under the zero-level elevation).
The Supreme Decree No. 009-97-SA, Law No. 26790 and Supreme Decree No. 003-98-SA require construction companies to have complementary high risk insurance for workers that perform high risk tasks. As of the date of this prospectus, GyM and Stracon GyM have this insurance coverage.
Environmental Regulations
Section 24 of the General Environmental Law approved by Law No. 28611 (the “General Environmental Law”) provides that all human activity likely to cause significant environmental impact is subject of regulation by the National System of Environmental Impact Assessment. The Peruvian Ministry of the Environment, through the Environmental Supervising and Enforcement Agency (Organismo de Evaluación y Supervisión Ambiental, or “OEFA”) supervises the compliance and enforces environmental rules related to mining, oil and gas, and electricity.
Civil Construction
The Supreme Decree No. 015-2012-VIVIENDA regulates the environmental aspects of projects related to housing, urbanism, construction and sanitation activities in urban or rural areas. The National Directorate of Housing, Urbanism, Construction and Sanitation supervises the compliance and enforces the applicable rules. Projects are categorized according to their environmental impact during and after their execution and different rules are established for each category including compliance with the following environmental studies prior to initiating construction works: (i) projects expected to cause minor environmental impacts require an environmental impact statement; (ii) projects expected to cause moderate environmental impacts require an semi-detailed environmental impact assessment; and (iii) projects expected to cause a major environmental impact require a detailed environmental impact assessment.
142
Table of Contents
Other Subsectors
Depending on the subsector in which they operate, GyM and Stracon GyM are required to follow specific environmental provisions issued by the competent authorities.
Tax Legal Regime Applicable to Construction
Section 63 of Peruvian Income Tax Law approved by Supreme Decree No. 179-2004-EF, establishes that construction companies engaged in construction contracts for a period longer than one fiscal year can choose to be taxed under any of the following systems:
| • | allocate to each fiscal year the gross income resulting from applying the percentage of gross margin estimated for the work over the amounts collected for the same work; or |
| • | allocate to each fiscal year the gross income calculated by deducting the costs corresponding to the tasks performed during that year from the amount collected or that is expected to be collected corresponding to that work. |
In both situations, a special accounting registry must be kept for each project, which is meant to keep a record of the costs, expenses and income of each project in an account separate from the general analytical accounts (cuentas analíticas de gestión).
Until December 31, 2012, construction companies could defer revenues related to each individual project until the total completion of the project, provided the project was completed in three years or less. In such cases, the income was to be recognized in the fiscal year in which the project concluded or was delivered. In case the project was scheduled to conclude in a period exceeding three years, the results would be determined in the third year in accordance with the progress of the works over the three-year period. Beginning in the fourth year, results were determined following the foregoing methods.
Starting on January 1, 2013, in accordance with Legislative Decree No. 1112, which amended the Peruvian Income Tax Law, construction companies that adopted the deferral method are authorized to continue with the use of such method only with respect to income arising from the execution of work contracts initiated prior to January 1, 2013, until its completion and for execution of work contracts initiated on or after January 1, 2013 the deferral method is no longer accepted.
The Peruvian Income Tax Law also provides that the difference that may result from a comparison between the real gross income and the income assessed pursuant to any of the methods described above shall be allocated to the fiscal year in which the work concluded. Additionally, the company must apply the same system to all its construction contracts and must receive prior authorization from tax authorities to change the applied system.
Prevention of Money Laundering and Financing of Terrorism
Regulations for money laundering and terrorism financing prevention (SBS Resolution No. 486-2008) require construction and real estate companies to implement a money laundering and terrorism financing prevention system, including the appointment of a compliance officer, setting up a registry of operations and notifying the Financial Intelligence Unit of the SBS, the entity responsible for of supervising and enforcing compliance, of any suspicious activity.
Infrastructure
Private Investment in Public Infrastructure and Services
In Peru, promotion of private investment in public infrastructure and services is undertaken by Proinversión and commonly awarded through multi-party concession agreements among the concessionaire, Proinversión and the respective public entity. Private investment in public infrastructure is regulated by the Single Revised Text approved by Supreme Decree No. 059-96-PCM (Texto Único Ordenado or “TUO”) and its additional regulation approved by Supreme Decree No. 108-2006-EF.
143
Table of Contents
In accordance with the TUO and its regulation, concessionaires are entitled to receive from the state: (i) in the case of self-financing projects, fees and tolls charged to end-users; (ii) in the case of co-financed projects, subsidies and payments from the public entity awarding the concession; and (iii) any other financing structure agreed upon by the parties.
The regulation of private-public partnerships allows public entities to participate, together with private investors, in the development or operation of public infrastructure and services. The regulation of private-public partnerships establishes that projects classified as self-financing and those classified as co-financed must comply with the requirements and procedures set forth in the Public Investment National System Law (Ley del Sistema Nacional de Inversión Pública) and in the Indebtedness National System law (Ley del Sistema Nacional de Endeudamiento) as amended.
Each of our subsidiaries Norvial, Survial, Canchaque and GyM Ferrovías has entered into a concession agreement with Proinversión and the Peruvian Ministry of Transport and Communications. La Chira has entered into concession agreements with Proinversión and Sedapal S.A. The abovementioned agreements were entered into in accordance with the provisions set forth in the TUO and its regulation, and with the regulation of private-public partnerships when applicable.
Infrastructure Construction and Safety
Companies engaged in the construction stage of infrastructure projects must comply with technical standards outlined in the National Building Regulation. The construction works undertaken by La Chira and GyM are in compliance with the provisions set forth in technical regulations No. OS.090 (for waste water treatment plants) and No. A.110 (for transport and communication projects), respectively.
The highway concessions of Norvial, Survial and Canchaque comply in all material respects with the guidelines issued by the Road and Railways General Directorate of the Peruvian Ministry of Transport and Communications and with the National Road Infrastructure Management Regulation regarding road construction, maintenance and safety.
Environmental Regulations
Peruvian environmental laws and regulations have become increasingly stringent over the last decade. All industries and projects are subject to Peruvian laws and regulations concerning water, air and noise pollution, and the discharge of hazardous substances. The principal legislation governing environmental matters is the General Environmental Law; the Law of the National System of the Environmental Impact Evaluation approved by General Law No. 27,446 (the “SEIA”); the regulations of the SEIA Law approved by Supreme Decree No. 019-2009-MINAM; and several environmental regulations that have been issued under the General Environmental Law, SEIA and other laws by the government with the collaboration of the Peruvian Ministry of the Environment.
Since the enactment of the General Environmental Law in October 15, 2005, several technical environmental regulations have been issued and this environmental regulatory framework is generally revised and updated regularly. Some regulations apply generally to Peruvian industries and some technical regulations are issued for specific industries.
Each of our infrastructure projects follows adequate environmental management systems, complies with applicable environmental laws and regulations and has all the required environmental permits and licenses, in each case in all material respects. There are currently no material legal or administrative proceedings pending against us with respect to environmental matters.
Peruvian Hydrocarbon Regulation
Our hydrocarbon operations are subject to governmental regulations as described below.
Exploration and Production
GMP is engaged in two major activities relating to the exploration and production of oil and gas: exploration and production of oil fields; and providing services to the oil industry.
144
Table of Contents
Exploration and Production of Oil fields
Peru’s hydrocarbon legislation regarding oil and gas exploration and production activities includes, among others, the Hydrocarbon Organic Law and the regulations governing the qualification of petroleum companies; the exploration and production of hydrocarbons; the transportation of hydrocarbons; hydrocarbons pipelines and safety requirements in such activities.
The foregoing regulations define the roles of Peruvian government agencies which regulate the oil and gas industry; provides the framework for the promotion and development of hydrocarbon activities based on the principles of private-sector competition and access to all economic activities; and sets the safety and security standards as well as the legal proceedings for carrying out operations.
The Peruvian Constitution establishes that the government is the sole proprietor of underground hydrocarbons within its national territory. However, the Peruvian government has granted Perupetro, a state-owned company authorized to negotiate and enter into agreements for the exploration and/or production of hydrocarbons, the ownership right over the hydrocarbons extracted which allows Perupetro to enter into such agreements. Furthermore, the Peruvian Ministry of Energy and Mines, the Environmental Evaluation and Supervision Agency (“OEFA”) and OSINERGMIN constitute public entities that play an active role in oil and gas regulation.
The Peruvian Ministry of Energy and Mines is responsible for devising energy and mining policies; supervising activities in the energy and mining sectors; and promoting investments in those sectors. Within the Peruvian Ministry of Energy and Mines, the General Directorate of Hydrocarbons (DGH) is responsible for regulating the development of oil and gas fields and the General Directorate of Energy-Related Environmental Affairs (DGAAE) is responsible for reviewing and approving regulations related to environmental risks associated with hydrocarbon exploration and production activities.
OEFA is a public entity ascribed to the Peruvian Ministry of the Environment and is responsible for evaluating and ensuring compliance with applicable environmental rules covering hydrocarbon activities, as well as for sanctioning proceedings. OSINERGMIN is a public entity ascribed to the Presidency of the Council of Ministers’ office and is responsible for ensuring compliance with safety and security standards in the hydrocarbon industry, as well as for sanctioning proceedings. GMP is subject to the supervision, authority and regulations enacted by the foregoing agencies.
Regarding hydrocarbon exploration and production activities, companies are required to enter into either a licensing or a services agreement with Perupetro; other contractual arrangements are permitted with prior approval from the Peruvian Ministry of Energy and Mines. The foregoing agreements are governed by private law and must be approved by the Peruvian Ministry of Energy and Mines and the Peruvian Ministry of Economy and Finance. In licensing agreements, licensees obtain authorizations to explore and produce hydrocarbons in a determined area, are granted ownership over the extracted hydrocarbons and are subject to the payment of royalties. Licensees may trade the hydrocarbons with no limitations on sales prices, except in the event of a national emergency.
Services agreements grant contractors the right to perform hydrocarbon exploration and production activities in a determined area and receive compensation according to the production of hydrocarbons. The contractor is technically and financially responsible for the operations, but Perupetro maintains the ownership over the hydrocarbons extracted. These are the type of contracts GMP is party to, with respect to Block I and Block V.
Services agreements are intended for the development, production and transportation of hydrocarbons, as well as for certain storage activities. Services agreement commonly include a minimum performance schedule guaranteed by performance bonds and require corporate guarantees to be issued to secure the contractor’s compliance to the provisions established by the parties.
Additionally, a company must be qualified by Perupetro prior to entering into hydrocarbon exploration and production agreements. In order to qualify, a company must meet the standards under the Regulations on the Qualification of Petroleum Companies, requiring companies to demonstrate that they have the technical, legal and financial capacity to comply with all the obligations they will assume under the agreement with Perupetro. Such capacities are measured according to the characteristics of the area to be explored or produced, the expected investment required for the project, and the strict fulfillment of the rules regarding prior consultation, citizen participation and environmental issues related to the operation’s performance. Upon a positive evaluation, the
145
Table of Contents
company is issued a qualification certificate that allows it to initiate the negotiations of the agreement; notwithstanding the company remains responsible for obtaining all other licenses, permits and approvals required by applicable regulation.
Under the current regulation, 30 years is the maximum term of services agreements for the production of crude oil. On the other hand, natural gas and condensates-related services agreement have a maximum term of 40 years. Graña y Montero acts as GMP’s guarantor in both our Block I and Block V production services agreements.
GMP must comply with Supreme Decree No. 043-2007-EM for its activities relating to exploration and production of hydrocarbons. The Peruvian Ministry of Labor and Employment Promotion is the authority responsible for the supervision and enforcement of the foregoing rules. See “Regulatory Matters—Infrastructure—Peruvian Hydrocarbon Regulation—Environmental Regulation” for more information on environmental regulation applicable to the oil and gas sector.
Services to the Petroleum Industry
Peruvian regulation provides that all companies that enter into a service agreement with any company that holds a licensing or services agreement must be registered as a subcontractor in the Hydrocarbons Public Registry in case they render any of the following services: (i) geological studies, geophysical studies, petroleum engineering related to drilling operations, production and well services; or (ii) construction of oil pipelines, gas pipelines, refineries and their maintenance, and specialized transportation by land, air, sea or river. In order to register a company as a subcontractor in the Hydrocarbons Public Registry, prior authorization from the General Directorate of Hydrocarbons (DGH) of the Peruvian Ministry of Energy and Mines is required.
On June 1, 2004, GMP was included as a subcontractor for the petroleum industry in the Hydrocarbons Registry of Lima’s Public Registry of Legal Entities; such registry remains in force as of the date of this prospectus.
Environmental Regulation
The Peruvian Ministry of Energy and Mines is responsible for enacting environmental regulation for the oil and gas sector. The Oil and Gas Environmental Protection Regulation, approved by Supreme Decree No. 015-2006-EM, sets out the legal framework and specific rules applicable to the exploration, production, refinement, processing, transportation, commercialization, storage and distribution of hydrocarbons, with the aim of preventing, controlling and remedying the negative environmental impacts arising from the foregoing activities.
The Peruvian Ministry of the Environment establishes general rules applicable to different activities in several sectors, in contrast to the specific rules enacted by the Peruvian Ministry of Energy and Mines regarding the oil and gas sector. A breach of the obligations contemplated in the Environmental Impact Assessments in the hydrocarbons sector may originate fines amounting to approximately US$14.5 million.
Operation of Terminals
In accordance with the Glossary, Acronyms and Abbreviations for the Hydrocarbons Subsector approved by Supreme Decree No. 032-2002-EM, a terminal is a facility that includes storage tanks, submarine lines or docks for receiving or dispatching liquid hydrocarbons and facilities related to activities of storage and reception and/or dispatch of liquid hydrocarbon from/to vessels.
Consorcio Terminales is a joint operation among GMP and Oiltanking Peru S.A.C. which currently operates nine of Petroperú’s terminals in Peru: (i) the South Terminals of Pisco, Mollendo, Ilo, Juliaca and Cuzco; and (ii) the North Terminals of Eten, Salaverry, Chimbote and Supe. Consorcio Terminales provides hydrocarbons handling and storage services in Peru for gasoline, aviation fuel and diesel, among others.
The operation of both the South and North Terminals, was granted through the “South Terminal Operation Agreement” and the “North Terminal Operation Agreement” (the “Operation Agreements”) dated February 2, 1998, by and among Petroperú and Consorcio Terminales. The Operation Agreements resulted from two tenders in accordance with Legislative Decree No. 674, and mandate that Consorcio Terminales, as operator of the terminals, be responsible for the storage, handling, additivation and dispatch of hydrocarbons in such facilities.
146
Table of Contents
The initial term of the Operation Agreements was fifteen years; however the parties agreed to extend the duration of the agreement to an additional eighteen months ending in August 2014. The purpose of this extension was to undertake the additional investments that were necessary to satisfy the national demand increase and to perform operative and safety-related improvements to the facilities.
In executing its operations, Consorcio Terminales is committed to develop and follow a work program which must include an investment schedule. The work program performed included the installation of fire protection systems and loading systems, among others and was secured by a performance bond.
The activities that GMP develops, as a part of Consorcio Terminales, under the operation agreements are performed in compliance in all material respects with the Hydrocarbons Storage Safety Regulation (Supreme Decree No. 052-93-EM). Consorcio Terminales is registered in the Hydrocarbon Registry of OSINERGMIN to be authorized to perform transportation activities such as loading and unloading hydrocarbons from vessels on the terminals. Additionally, Consorcio Terminales has all the required permits and licenses to operate hydrocarbon terminals and carry out its activities.
Gas Processing Plants
In accordance with the Glossary, Acronyms and Abbreviations for the Hydrocarbons Subsector approved by Supreme Decree No. 032-2002-EM, a processing plant is a facility where the natural characteristics of hydrocarbons are changed to break them into the different compounds that comprise them, as well as the subsequent transformations to convert the hydrocarbons into fuel of specific qualities and suitable for transportation. This includes the facilities where the impurities, hydrogen sulfide, carbon dioxide, water and hazardous components are removed from natural gas.
Our processing and fractionation activities are performed in compliance with the regulations governing Hydrocarbons Refinement and Processing including regulations on the design, construction, operation and maintenance of refineries and hydrocarbons processing plants, the oil refining process, the manufacture of natural asphalts, oil and lubricants, basic petrochemical activities and the processing of natural gas and condensates.
Terms of our Concessions
Our concessions are subject to certain terms and conditions established in each concession agreement. During the term of the concessions, we are responsible for the construction and maintenance of the infrastructure necessary to their operation. The concession agreements establish minimum capital stock requirements for our concessionaire subsidiaries as follows: US$15 million, US$8 million, US$0.8 million, S/.46 million and S/.100 million for Norvial, Survial, Canchaque, La Chira and the Lima Metro, respectively.
The concession agreements establish grounds for termination including mutual agreement of the parties thereto, force majeure and breach of certain contractual obligations. Additionally, in the case of La Chira and the Lima Metro, the agreement can be terminated unilaterally by the grantor. On the expiration date, all of the assets that are essential for the operation of the concession are considered the state’s property and no compensation is paid to the concessionaire.
In the event that changes in legislation or regulations that are exclusively related to the financial conditions of the earnings and/or costs associated with the investment, operation or conservation of the infrastructure, affect the economic terms of the contract by 10% or more, the concession agreements set forth economic terms adjustment mechanisms aimed at restoring the economic and financial equilibrium. See “Business—Infrastructure—Principal Infrastructure Lines of Business.”
Real Estate
Since 1987, we have been operating in the Peruvian real estate sector. In 2008, we incorporated Viva GyM to concentrate the group’s activities in this sector including promoting and managing real estate projects including affordable housing and housing and commercial real estate projects.
147
Table of Contents
Zoning Regulations
Article 79 of the Municipalities Organic Law (Law No. 27972) establishes that municipal governments are the exclusive authority responsible for approving urban and rural development plans, as well as the zoning of the urban areas under their jurisdiction. Peruvian regulation establishes that urban zoning refers to the division of a municipal jurisdiction in zones for specific usages, such as residential, commercial, industrial or mixed-use.
Environmental Regulations
The Environmental Protection Regulation for real estate, urbanism, construction and regularization related projects (Supreme Decree No. 015-2012-VIVIENDA) sets out to prevent, mitigate, control and remedy negative environmental impacts that may arise from real estate developments. Prior to initiating construction works, companies are required to obtain an environmental authorization from the Housing, Urbanism, Regularization or Construction National Directorate of the Peruvian Ministry of Housing, Construction and Sanitation and to comply with the provisions set forth in the corresponding environmental impact assessment.
Licenses
Article 10 of the Regulation of Urban Habilitation and Buildings Law, Law No. 29090 establishes the license requirements for urban habilitation and construction, depending on land size, the dimensions of the work to be undertaken and the financial target.
Upon completion of the real estate development and construction, as the case may be, the following requirements must be met:
| • | for urban development, the reception of the works (recepción de la obra) must be requested to the corresponding municipal government in compliance with Article 19 of the Habilitation and Construction Law; and |
| • | for construction, the conformity of the works (conformidad de obra) must be requested to the corresponding municipal government in compliance with Article 28 of the Habilitation and Construction Law, accompanying the request with the construction plans and the construction statement (a description of the technical conditions and characteristics of the work performed). |
Exclusive and Common Property Real Estate Units Regimes
The Regularization Buildings Factory Declaration Proceeding and Real Estate Units Regimen of Exclusive and Common Property Law (Law No. 27157) establishes the legal regime applicable to real estate comprised of assets with exclusive and common property, including, among others, (i) apartment buildings; (ii) condominiums; (iii) units under co-ownership; and (iv) commercial spaces, such as galleries and malls. The foregoing construction projects must include internal bylaws prepared or approved by the sponsor or builder, or by the owners with the vote of the majority of participating owners, the content of which is regulated in Article 42 of the Regularization Buildings Factory Declaration Proceeding and Real Estate Units Regimen of Exclusive and Common Property Law. Articles 40 and 41 of the foregoing law itemize the assets and services that qualify as common.
Owners of the real estate units have the opportunity to choose between the exclusive and common property regime, and the independent and co-ownership regime. The internal bylaws, the owner’s assembly minutes, all construction plans, architectural division plans, perimetric boundaries and the construction statement must be registered in the Real Estate Registry of the corresponding jurisdiction. Upon completion of the proper registries, units are registered independently from one another.
Fondo Mivivienda
The acquisition of affordable housing units developed by Viva GyM is often financed by Fondo Mivivienda S.A., a publicly owned financial institution established in 1998 by Law No. 26912, with the purpose of (i) promoting and financing the acquisition, bettering and construction of houses, especially those of social interest; (ii) carrying out activities related to the fostering of capital flows to the housing financing market; (iii) participating in the primary and secondary markets of mortgage credits; and (iv) contributing to the development of the capital markets.
148
Table of Contents
Prevention of Money Laundering and Financing of Terrorism
SBS Resolution No. 486-2008, as amended from time to time, requires construction and real estate companies to implement a money laundering and terrorism financing prevention system, including appointing a compliance officer, setting a registry of operations and notifying the Financial Intelligence Unit of the SBS, the entity responsible for supervising and enforcing compliance to the resolution referred to herein, of any suspicious activity.
Technical Services
Public- and Private-Sector Contracts
Concar provides services in compliance with Peru’s State Contracting Law and its regulation approved by Supreme Decree No. 184-2008-EF, as amended, when dealing with public counterparties; and with the regulation set forth in the Civil Code when dealing with private counterparties. See Section “Regulatory Matters—Engineering and Construction” of this prospectus for more information on the applicable legal frameworks. Concar is registered with the Peruvian National Registry of Suppliers, required to act as supplier for public entities.
Intellectual Property
Certain operations of GMI and GMD are protected by Peruvian Copyright Law approved by Legislative Decree No. 822; specifically the engineering drawings and software registered in the INDECOPI Copyright Registry.
Dimension Testing Services
CAM Perú S.R.L. provides the dimension testing service of electrical meters, for which it must be a registered testing entity as provided by Technical and Commercial Regulations Commission Resolution No. 0065-1999/INDECOPI-CRT. As of the date of this prospectus, Cam Perú S.R.L, is registered as an accredited dimension testing of electrical meters services provider. The pertaining registration can be renewed for consecutive periods, provided that a request is filled 60 days prior to expiration. If Cam Peru S.R.L. does not comply with the rules approved by the INDECOPI, said governmental authority may impose a suspension or revoke the registry.
149
Table of Contents
General
Our business and affairs are managed by our board of directors in accordance with our by-laws and Peruvian Corporate Law No. 26887 (“Peruvian Corporate Law”). Our by-laws provide for a board of directors of between five and nine members. Our shareholders may appoint an alternate director for each director to act on his or her behalf when absent from meetings or unable to exercise his or her duties. Alternate directors have the same responsibilities, duties and powers of directors to the extent they are called to replace them.
Directors are elected at a shareholders’ meeting and hold office for three years. Directors may be elected to multiple terms. Our current board of directors is composed of nine directors and no alternates. If a director resigns or otherwise becomes unable to continue with the duties, a majority of our directors may appoint one of the alternate directors, or in the absence of alternate directors, any other person, to serve as director for the remaining term of the board. In the first board meeting held after the annual shareholders’ meeting where members of the board are elected, the board of directors must elect among its members a chairman and a vice chairman if the shareholders’ meeting did not elect them.
The board of directors typically meets in regularly scheduled quarterly meetings and when called by any director or our Chief Executive Officer. Resolutions must be adopted by a majority of the directors present at the meeting and the chairman is entitled to cast the deciding vote in the event of a tie.
Duties and Liabilities of Directors
Pursuant to Article 177 of Peruvian Corporate Law, directors are jointly and severally liable to a corporation, shareholders and third parties for any damages caused by abuse of power, fraud, willful misconduct or gross negligence. In addition, pursuant to Article 3 of Law No. 29720, directors of companies listed on the Lima Stock Exchange are also strictly liable for any damages caused as a result of any transactions in which they were involved and which resulted in damages or other losses to the corporation, as determined by a competent court of law. A director cannot be found liable if the director expressed disagreement at the time the vote was cast or upon learning of such transaction and if there is a record expressing such opposition.
Article 180 of the Peruvian Corporate Law requires a director with a conflicting interest on a specific matter to disclose such interest and abstain from the deliberation and decision-making process with respect to such matter. A director who violates this requirement is liable for any damages caused to us and may be removed by a majority of the board of directors upon request of any member of the board or by a majority vote of the shareholders.
Pursuant to Article 181 of Peruvian Corporate Law, shareholders are entitled to protect the interest of a company through derivative law suits against directors in order to remedy or prevent a wrong to the corporation. In addition, pursuant to Article 4 of Law No. 29720, with respect to companies listed on the Lima Stock Exchange, a shareholder holding shares which represent at least 10% of the paid capital may bring said action against the directors.
Board of Directors
The following sets forth our directors and their respective positions as of the date of this prospectus. All directors were elected at our annual shareholders’ meeting held on March 30, 2011, and their term expires in March 2014, on the third anniversary from the date of election.
Name | Position | Year of Birth | Year of First | |||
José Graña Miró Quesada | Chairman of the Board | 1945 | 1996 | |||
Juan Carlos Antonio Montero Graña | Vice Chairman of the Board | 1942 | 1996 |
150
Table of Contents
Name | Position | Year of Birth | Year of First | |||
Roberto Abusada Salah* | Director | 1946 | 1998 | |||
José Chlimper Ackerman* | Director | 1955 | 2006 | |||
José Antonio Colomer Guiu | Director | 1952 | 2011 | |||
Hugo Santa María Guzmán* | Director | 1963 | 2011 | |||
Luis Miró Quesada Valega | Director | 1942 | 2011 | |||
Mario Alvarado Pflucker | Director, Chief Executive Officer | 1957 | 2003 | |||
Hernando Graña Acuña | Director | 1951 | 1996 |
| * | Independent Directors |
The following sets forth selected biographical information for each of the members of our board of directors. The business address of each of our current directors is Av. Paseo de la República 4667, Surquillo, Lima 34, Perú.
José Graña Miró Quesada. Mr. Graña joined the group in 1968 and has been a director and Chairman of our board of directors since August 1996. He is an architect and graduated from Universidad Nacional de Ingeniería. For graduate studies, he attended ESAN and the Universidad de Piura Senior Management Program. In addition, Mr. Graña serves as Chairman of the board of directors of our subsidiary Viva GyM and as a director of our subsidiaries GyM and GMD. In addition, Mr. Graña serves as a director of Empresa Editora El Comercio S.A., Prensa Popular S.A., Servicios Especiales de Edición S.A. and Mexichem Amanco Holding. He has previously served as a member of the board of directors of our subsidiaries Concar, GMP, as well as GMI Refinería La Pampilla S.A.A., Edegel S.A.A. and Telefónica S.A.A. He served as Chairman and First Executive of Graña y Montero S.A.A. until March 2011, when he decided to retire from his executive responsibilities and the position of President was eliminated.
Juan Carlos Antonio Montero Graña. Mr. Montero has been a director since August 1996 and is currently the Vice Chairman of our board of directors. He graduated from Universidad Nacional de Ingeniería as a civil engineer. For graduate studies, he attended the Universidad de Piura Senior Management Program. Mr. Montero is also the Chairman of the board of directors of our subsidiary Concar and a director of our subsidiaries GMP, Survial and GyM. He has previously served as Vice Executive Chairman of our subsidiary GyM until 2007.
Roberto Abusada Salah. Mr. Abusada has been a director since March 1998. He holds a Ph.D. in Economics, having studied at Pontificia Universidad Católica del Perú, Cornell University and Harvard University. In addition, Mr. Abusada is the Chairman of the board of directors of our subsidiary GMD and a director of TECSUP. He has previously served as a director of Post Graduate Studies in Economy at Pontificia Universidad Católica del Perú, member of the board of directors of the Peruvian Central Bank and Corporación Andina de Fomento (CAF), as well as Peru’s Vice-Minister of Economy. He is a founder and director of the Peruvian Institute of Economy (IPE).
José Chlimper Ackerman. Mr. Chlimper has been a director since March 2006. He received a degree in Economics and Business Administration from North Carolina State University. In addition, Mr. Chlimper is the Chairman of the board of directors and CEO of Agrokasa S.A. and a member of the board of directors of Corporación Drokasa S.A., Maestro Home Center Perú S.A., Aeropuertos del Perú S.A., ComexPerú, Instituto de Formación Bancaria (IFB) and our subsidiary GyM. He is Chairman of the board of directors of Compec. He is a member of the Agrarian Consultative Council for the master’s degree in Agrobusiness at Universidad del Pacífico. He has previously served as councilman for the municipality of Lima, President of the Fondo de Las Américas, Peru’s Minister of Agriculture and member of the board of directors of the Peruvian Central Bank.
José Antonio Colomer Guiu. Mr. Colomer has been a director since March 2009. He received a certificate in Corporate Management and another in Leadership and Innovation from Universidad de Navarra in Spain, a certificate in Business Administration and Marketing from ESADE in Spain and a certificate in Quality and Strategic Marketing from AEDEM—Alta Escuela de Dirección de Empresas in Spain. In addition, Mr. Colomer is a member of the board of directors of BBVA Banco Continental, Holding Continental, MAPFRE/Catalunya and our subsidiary Viva GyM. He is also President of ASF S.L. He has previously served as member of the board of directors of BBVA Provincial Venezuela and FC Barcelona.
151
Table of Contents
Hugo Santa María Guzmán. Mr. Santa María has been a director since March 2011. He is an Economist from Universidad del Pacífico and has a doctorate in Economics from Washington University in St. Louis, Missouri. He is also the Chairman of the board of directors of MiBanco and a director of APOYO Comunicación Corporativa, as well as a partner and chief economist at APOYO Consultoría. Mr. Santa María previously served as director of Fondo Consolidado de Reserva (FCR) and Compañía Minera Atacocha.
Luis Miró Quesada Valega. Mr. Miró Quesada has been a director since March 2011. He has been a member of the board of directors of Empresa Editora El Comercio S.A. since 1990. Mr. Miró Quesada has also been director and President of Grupo TV S.A.C, Plural TV S.A.C. and Compañía Peruana de Radiodifusión S.A. since 2007, as well as director of Zetta Comunicadores del Perú S.A. EMA since 1995.
Mario Alvarado Pflucker. Mr. Alvarado joined the group in 1980 and has been Chief Executive Officer of Graña y Montero since 1996 and a director since April 2003. He is a Civil Engineer with a master’s degree in Administration Engineering from George Washington University and graduate studies in the CEO Management program at Kellogg School of Management, Northwestern University. In addition, he is a member of the board of directors of our subsidiaries GyM, Vial y Vives, Viva GyM, Concar, CAM Chile, Survial, GyM Ferrovías, Almonte, as well as Larrain Vial Safi. He is also a member of the Consultive Council of the Tecnológico de Monterrey (Peru Site). Mr. Alvarado has previously served as member of the board of directors of Amerika Financiera S.A.
Hernando Graña Acuña. Mr. Graña joined the group in 1977 and has been a director since August 1996. He is an Industrial Engineer with a master’s degree in Mining Engineering from University of Minnesota. In addition, he is the Chairman of the board of directors of our subsidiary GyM, as well as a director of our subsidiaries GMI, GMP, Stracon GyM, Norvial, Survial, CAM Chile, Vial y Vives and La Chira. Since 1996, Mr. Graña has served as Chief Commercial Officer of GyM.
Board Committees
We have three board committees comprised of members of our board of directors.
Audit and Process Committee
Our Audit and Process Committee is comprised of three directors, all of which are independent in accordance with the SEC rules applicable to foreign private issuers. The current members of our Audit and Process Committee are Mr. Roberto Abusada Salah, Mr. José Chlimper Ackerman and Mr. José Antonio Colomer. These directors have extensive business and economic experience in Peru, but they do not qualify as financial experts in accordance with SEC rules. Our Audit and Process Committee oversees our corporate accounting and financial reporting process. Immediately prior to the closing of this offering, the Audit and Process Committee will be responsible for:
| • | reviewing our financial statements; |
| • | evaluating our internal controls and procedures, and identifying deficiencies; |
| • | recommending to our annual shareholders’ meeting the appointment, compensation, retention and oversight of our external auditors, |
| • | resolving any disagreements that could arise between the management and our external auditors; |
| • | evaluating the company’s compliance with the Board of Director’s internal regulation, as well as with general principles of corporate governance; |
152
Table of Contents
| • | informing our board of directors regarding any issues that arise with respect to the quality or integrity of our financial statements, our compliance with legal or regulatory requirements, the performance and independence of the external auditors, or the performance of the internal audit function; |
| • | overseeing measures adopted as a result of any observations made by our shareholders, directors, executive officers, employees or any third parties with respect to accounting, internal controls and internal and external audit, as well as any complaints regarding management irregularities, including anonymous and confidential methods for addressing concerns raised by employees; and |
| • | independently engaging its own counsel and any other advisers it deems necessary to fulfill its functions. |
Our board of directors will adopt a written charter for our Audit and Process Committee, which will be available on our website at www.granaymontero.com.pe upon the closing of this offering.
Human Resource Management and Social Responsibility Committee
Our Human Resource Management and Social Responsibility Committee is comprised of three directors, all of which are independent in accordance with SEC rules applicable to foreign private issuers. The current members of the committee are Mr. José Chlimper Ackerman, Mr. Roberto Abusada Salah and Mr. Hugo Santa María Guzmán. The Human Resource Management and Social Responsibility Committee is responsible for:
| • | reporting to our board of directors on the appointment and dismissal of senior executives; |
| • | establishing compensation arrangements for senior executives in accordance with the financial results of the company; |
| • | proposing measures to ensure transparency in the remuneration of directors and senior executives; |
| • | evaluating our human resources policies; |
| • | reporting to our board of directors on matters regarding related party transactions that could result in a conflict of interest; |
| • | establishing our social responsibility policies; and |
| • | supervising and reporting to our board of directors on social responsibility practices and management. |
As a foreign private issuer, we are not required to maintain a compensation committee that complies with all of the U.S. laws and regulations and NYSE requirements applicable to U.S. issuers.
Investment and Risk Committee
Our Investment and Risk Committee is comprised of three directors. The current members of the committee are Mr. José Graña Miró Quesada, Mr. José Antonio Colomer Guiu and Mr. Luis Miró Quesada Valega. The Investment and Risk Committee is responsible for:
| • | establishing our investment policies; |
| • | approving our annual investment plan; |
| • | analyzing the projects that would require an investment greater than US$5 million; and |
| • | assessing and seeking to mitigate the risks encountered by our company. |
153
Table of Contents
Operating Board Committees
We also have four operating board committees comprised of members of our board of directors.
Engineering and Construction Committee
Our Engineering and Construction Committee supervises the operations of our E&C segment, and is comprised of five directors. The current members of the committee are Mr. José Graña Miró Quesada, Mr. Mario Alvarado Pflucker, Mr. José Chlimper Ackerman, Mr. Hernando Graña Acuña and Mr. Juan Carlos Antonio Montero Graña.
Infrastructure Committee
Our Infrastructure Committee supervises the operations of our Infrastructure segment and is comprised of five directors. The current members of the committee are Mr. José Graña Miró Quesada, Mr. Mario Alvarado Pflucker, Mr. Hugo Santa María Guzmán, Mr. Luis Miró Quesada Valega and Mr. Hernando Graña Acuña.
Real Estate Committee
Our Real Estate Committee supervises the operations of the Real Estate segment and is comprised of three directors. The current members of the committee are Mr. José Graña Miró Quesada, Mr. Mario Alvarado Pflucker and Mr. José Antonio Colomer Guiu.
Technical Services Committee
Our Technical Services Committee supervises the operations of our Technical Services segment and is comprised of four directors. The current members of the committee are Mr. José Graña Miró Quesada, Mr. Mario Alvarado Pflucker, Mr. Roberto Abusada Salah and Mr. Carlos Montero Graña.
Executive Officers
Our executive officers oversee our business and are responsible for the execution of the decisions of the board of directors. The following table presents information concerning the current executive officers of the company and their respective positions:
Name | Position | Year of Birth | Year of | Year of First | ||||
Mario Alvarado Pflucker | Chief Executive Officer | 1957 | 1996 | 1980 | ||||
Mónica Miloslavich Hart | Chief Financial Officer | 1966 | 2009 | 1997 | ||||
Antonio Rodriguez Canales | Chief Investment Officer | 1963 | 2010 | 1999 | ||||
Claudia Drago Morante | Chief Legal Officer | 1970 | 2007 | 1997 | ||||
Juan José Arrieta Ocampo | Corporate Social Responsibility Manager | 1954 | 2011 | 1999 | ||||
José Carlos Ascarza Revoredo | Chief Human Resources Officer | 1975 | 2012 | 2007 | ||||
Dennis Gray Febres | Corporate Finance and Investor Relations Officer | 1975 | 2011 | 2011 | ||||
Jorge Luis Izquierdo Ramírez | Corporate Learning Center Manager | 1973 | 2011 | 1998 | ||||
Antonio Cueto Saco | Corporate Country Manager—Chile | 1966 | 2011 | 1996 | ||||
Gonzalo Ferraro Rey | Corporate Infrastructure Manager | 1956 | 2010 | 1996 | ||||
Hernando Graña Acuña | Executive President of GyM | 1951 | 2005 | 1977 | ||||
Francisco Dulanto Swayne | Executive President of GMP | 1949 | 2011 | 1974 | ||||
Juan Manuel Lambarri Hierro | Chief Executive Officer of GyM | 1958 | 2001 | 1982 |
154
Table of Contents
Name | Position | Year of Birth | Year of | Year of First | ||||
Luis Díaz Olivero | Chief Executive Officer of GMP | 1970 | 2011 | 1993 | ||||
Jaime Dasso Botto | Chief Executive Officer of GMD | 1966 | 2000 | 1994 | ||||
Walter Silva Santisteban Requejo | Chief Executive Officer of GMI | 1954 | 1998 | 1980 | ||||
Jaime Targarona Arata | Chief Executive Officer of CONCAR | 1968 | 2005 | 1996 | ||||
Rolando Ponce Vergara | Chief Executive Officer of Viva GyM | 1963 | 2008 | 1993 | ||||
Klaus Winkler Speringer | Executive Vice President of CAM | 1968 | 2011 | 2011* | ||||
César Neyra Rodriguez | Manager of Internal Auditing and Management Processes | 1958 | 2003 | 2003 |
| * | Appointed by CAM in 2007. |
The following sets forth selected biographical information for each of our executive officers:
Mario Alvarado Pflucker. See “—Board of Directors.”
Mónica Miloslavich Hart. Ms. Miloslavich joined the group in 1994 and she has been our Chief Financial Officer since 2009. She is an Economist graduated from Universidad de Lima and received a postgraduate diploma from Tecnológico de Monterrey. She previously served as Chief Financial Officer of Graña y Montero Edificaciones S.A.C. from 1998 to 2004 and Chief Financial Officer of our subsidiary GyM from 2004 to 2009. Additionally, Ms. Miloslavich is a member of the board of directors of our subsidiary GyM Ferrovías.
Antonio Rodriguez Canales. Mr. Rodriguez joined the group in 1999 and he has been our Chief Investment Officer since 2010. He is an Accountant graduated from Universidad de Lima, with a master’s degree in Business Administration from ESAN and a master’s degree in Business Administration from The Birmingham Business School in the United Kingdom. He previously served as Chief Executive Officer of Larcomar from 1999 to 2010. Currently, he is a director of our subsidiaries Concar and CAM Chile, and he is expected to join the board of directors of our subsidiaries Survial and GMD in March 2013.
Claudia Drago Morante. Ms. Drago joined the group in 1997 and she has been our Chief Legal Officer since 2007. She received a Bachelor of Laws from Universidad de Lima and pursued postgraduate studies in Finance and Corporate Law at ESAN, received a postgraduate diploma from Tecnológico de Monterrey and completed the Management Program for Lawyers at Yale School of Management. She has previously served as Legal Counsel of Graña y Montero from 2000 to 2007 and of our subsidiary GMD from 1997 to 2000. Ms. Drago is Graña y Montero’s representative to the Lima Stock Exchange and the Secretary of the board of directors.
Juan José Arrieta Ocampo. Mr. Arrieta joined the group in 1999 and has been our Corporate Social Responsibility Manager since 2011. He received a Bachelor’s degree in Sociology from Pontificia Universidad Católica del Perú, a postgraduate diploma in Business Administration from ESAN and a postgraduate diploma from Tecnológico de Monterrey. He previously served as our Human Resources and Social Responsibility Manager from 2007 to 2011 and as Human Resources Manager of our subsidiary GyM from 1999 to 2007.
José Carlos Ascarza Revoredo. Mr. Ascarza joined the group in 2007 and has been our Chief Human Resources Officer since 2012. He is an Industrial Engineer graduated from Universidad de Lima and received a postgraduate diploma from Tecnológico de Monterrey. He previously served as Human Resources Manager at our subsidiary GyM from 2007 to 2012.
Dennis Gray Febres. Mr. Gray joined the group in 2011 and has since been our Corporate Finance and Investor Relations Manager. He is an Economist with a degree from Universidad del Pacífico specializing in Finance and received a postgraduate diploma from Tecnológico de Monterrey. He previously served as Corporate Vice President of Finance at Citibank del Perú, General Manager of Citicorp Perú S.A.B. and Product Development Manager at Banco de Crédito del Perú.
155
Table of Contents
Jorge Luis Izquierdo Ramírez. Mr. Izquierdo joined the group in 1998 and he has been our Corporate Learning Center Manager since 2011, having previously served as manager of the Project Management Office. He is a Civil Engineer with a degree from the Pontificia Universidad Católica del Perú and a master’s degree in Construction Management from the University of California, Berkeley.
Antonio Cueto Saco. Mr. Cueto joined the group in 1996 and has been the Corporate Country Manager in Chile for the group since February 2011. He is an Economist graduated from Pontificia Universidad Católica del Perú and received a master’s degree in Management and Finance from HEC in France. He previously held the positions of Business Development Manager of Graña y Montero from 2007 to 2011, Commercial Manager and Project Manager of our subsidiary GyM from 2000 to 2007 and General Manager of Servisel S.A. from 1996 to 2000.
Gonzalo Ferraro Rey. Mr. Ferraro joined the group in 1996, where he has held a number of managerial positions, and has been our Corporate Infrastructure Manager since 2010. He is an Industrial Engineer graduated from Universidad Nacional de Ingeniería and Universidad de Lima, he completed additional graduate studies at the Universidad de Piura Senior Management Program and received a postgraduate diploma from Tecnológico de Monterrey. Mr. Ferraro is currently the Chairman of the board of directors of subsidiaries Survial, Norvial, La Chira, GyM Ferrovías, as well as Concesionaria Vía Expresa Sur. He is expected to join the board of directors of our subsidiary GMP in March 2013.
Hernando Graña Acuña. See “—Board of Directors.”
Francisco Dulanto Swayne. Mr. Dulanto joined the group in 1974 and is the Executive President and Chairman of the board of directors of GMP. He graduated from Universidad Nacional de Ingeniería and pursued graduate studies at ESAN and the Universidad de Piura Senior Management Program. He also received a postgraduate diploma from Tecnológico de Monterrey. He served as Chief Executive Officer of our subsidiary GMP between 1984 and 2011; as well as President of the Society of Petroleum Engineers (SPE), Lima Section, in 1991; and director of the Sociedad Nacional de Minería y Petróleo y Energía.
Juan Manuel Lambarri Hierro. Mr. Lambarri joined the group in 1982 and has been the Chief Executive Officer of our subsidiary GyM since 2001. He is a Civil Engineer graduated from Pontificia Universidad Católica del Perú. He also pursued graduate studies from Universidad de Piura Senior Management Program and received a postgraduate diploma from Tecnológico de Monterrey. He is currently a member of the board of directors of our subsidiaries GyM, Stracon GyM, Vial y Vives and GMI.
Luis Francisco Díaz Olivero. Mr. Díaz joined the group in 1993 and has been the Chief Executive Officer of our subsidiary GMP since March 2011. He is also a member of the board of directors of GMP. He is an Industrial Engineer with a master’s degree in Business Administration from the University of Pittsburgh and received a postgraduate diploma from Tecnológico de Monterrey. He previously served as Deputy Chief Executive Officer of GMP from 2009 to 2011, Chief Financial Officer of Graña y Montero from 2004 to 2009, and Financial Manager of our subsidiary GyM from 2001 to 2004.
Jaime Dasso Botto. Mr. Dasso joined the group in 1994 and has been the Chief Executive Officer of our subsidiary GMD since 2000. He is an electronic engineer and received a master’s degree in Software Development from Stevens Institute of Technology in the United States of America and a postgraduate diploma from Tecnológico de Monterrey. He previously served as Commercial Manager of GMD from 1994 to 1999. Currently, he is a member of the board of directors of GMD and the Chairman of the board of directors of GSD (a subsidiary of GMD); he is expected to join the board of directors of our subsidiary Concar in March 2013.
Walter Silva Santisteban Requejo. Mr. Silva Santisteban joined the group in 1980 and has been the Chief Executive Officer of our subsidiary GMI since 1998. He is a Civil Engineer graduated from Universidad Nacional de Ingeniería and received a postgraduate diploma from Tecnológico de Monterrey. Currently, he is a member of the board of directors of GMI and Ecotec.
Jaime Targarona Arata. Mr. Targarona joined the group in 1996 and has been the Chief Executive Officer of Concar since 2005. He is a Civil Engineer graduated from Universidad Autónoma de Guadalajara (Mexico), with a
156
Table of Contents
master’s degree in Business Administration from Universidad San Ignacio de Loyola. He also completed the Universidad de Piura Senior Management Program and received a postgraduate diploma from Tecnológico de Monterrey. He previously held positions as Civil Engineer on different projects, Commercial Manager of our subsidiary GyM’s Special Projects Divisions and as Chief Executive Officer of Graña y Montero Mexico. Additionally, Mr. Targarona is a member of the board of directors of Concar and is expected to join the board of directors of our subsidiary GMI in March 2013.
Rolando Ponce Vergara. Mr. Ponce joined the group in 1993 and has been the Chief Executive Officer of our subsidiary Viva GyM since 2008. He is a Civil Engineer graduated from Universidad Ricardo Palma and received a master’s degree in Construction and Real Estate Business Management from Pontificia Universidad Católica de Chile—Politécnica de Madrid (Spain) and a postgraduate diploma from Tecnológico de Monterrey. He has previously served as manager of GyM’s Real Estate Division. Mr. Ponce joined the group in 1993 and is currently a member of the board of directors of our subsidiaries Viva GyM and Almonte.
Klaus Winkler Speringer. Mr. Winkler joined the group in 2011 and has been the Executive Vice President of CAM Chile S.A. since 2007. He is a Commercial Engineer graduated from Universidad Gabriela Mistral in Chile. He also has a master’s degree in Business Administration from Stanford University and a postgraduate diploma from Tecnológico de Monterrey. He previously served as Chief Executive Officer of Compañía Americana de Multiservicios Ltda. (currently, CAM Chile) from 2007 to 2011; and held several managerial positions over 15 years in Endesa group in Chile, Spain and the United States.
César Neyra Rodriguez. Mr. Neyra joined the group in 2003 and has been our Manager of Internal Auditing and Management Processes since 2003. He received an Accounting degree from Universidad Nacional Federico Villareal and a master’s degree in Business Administration and Finance from Universidad del Pacífico. He has also studied Quality Improvement Systems and graduated from the Six Sigma Methodology program at Caterpillar University in Mexico and the United States of America.
Executive Commission
The Executive Commission is comprised by the group’s senior executives mentioned above, with the exception of Mr. César Neyra Rodríguez, Mr. Dennis Gray Febres and Mr. Jorge Luis Izquierdo Ramírez. The Executive Commission evaluates, at the management level, among other matters, our strategic plan, annual budget, and annual investment plan.
Kinship
Mr. José Graña Miró Quesada, the Chairman of our board of directors, is a first degree cousin with directors Hernando Graña Acuña and Luis Miró Quesada Valega.
Compensation of Directors and Executive Officers
Director compensation must be approved by a majority of shareholders at our annual shareholders’ meeting.
In 2012, total compensation paid to our board of directors amounted to S/.4,544,861 including compensation paid to directors that serve on our subsidiaries’ board of directors. In 2012 total compensation paid to our executive officers amounted to S/.24,308,652. See “Industry and Regulatory Matters—Labor Regulations” for additional information on profit sharing regulatory requirements.
Neither we nor any of our subsidiaries have entered into any agreement that provides for any benefit or compensation to any director or senior executive upon expiration of his or her term. Under Peruvian law, unless we dismiss someone for justified cause, we are required to pay the employee (but not directors) 1.5x annual salary for every year with the company for a period not to exceed 12 years. We have also agreed to provide such benefits to our executive officers upon their retirement.
157
Table of Contents
Executive Compensation Plan
We establish and pay executive compensation in compliance with applicable labor and tax regulations and corporate governance standards and in accordance with market conditions.
We establish pay scales taking into consideration executives’ responsibilities, including the degree of complexity of those responsibilities, power of decision-making and scope of supervision entrusted.
The fixed salary component of compensation is established for each position based on a pay scale. Fixed salary includes family allowance and cost of living payments, if applicable. We evaluate executives at least once a year to develop action plans in furtherance of continuously improving management performance. In addition, labor regulation establishes a mandatory profit sharing provision of 5% of our total annual taxable income, to be distributed among all employees, calculated based on a formula established by law that considers the days worked in the year and remuneration.
The variable component of compensation is paid to executives and other employees for meeting specific goals, and is related both to his or her performance and our financial results. Variable compensation is typically paid as an annual bonus.
Our executives also receive additional benefits, typically non-pecuniary. The benefits granted include: (i) a vehicle owned and maintained by the company, with the purpose of facilitating transportation of executives in the performance of their functions; (ii) a fuel allowance to offset transportation costs in the performance of their functions; and (iii) an insurance policy, including work accident and high risk coverage.
In addition, we have established a plan for certain executives effective March 2013 that awards cash bonuses for the exclusive use of purchasing shares of our company or of our subsidiaries. The executive must agree to hold the shares for a specific period. If the executive is no longer employed with the company during such period, we are entitled to repurchase the shares at the original purchase price. This benefit is awarded at the discretion and subject to the approval of the Human Resource Management and Social Responsibility Committee of our board of directors.
Share Ownership
As of February 28, 2013, the most recent date for which information is available, persons who are currently members of our board of directors and our executive officers held as a group 205,183,398 of our common shares. This amount represented 36.97% of our outstanding share capital as of such date.
Our directors and executive officers hold less than 1% of our outstanding share capital, with the exception of: Mr. José Graña Miró Quesada who owns 117,538,203 common shares, representing 21.05% of our outstanding share capital, through GH Holding Group; Mr. Carlos Montero Graña who owns 33,785,285 common shares, representing 6.05% of our outstanding share capital, through Bethel Enterprises; Mr. Mario Alvarado Pflucker who owns 22,432,223 common shares, representing 4.02% of our outstanding share capital, through Byron Development; Mr. Hernando Graña Acuña who owns 15,150,061 common shares, representing 2.71% of our outstanding share capital; and Mr. Francisco Dulanto Swayne who owns 12,684,187 common shares, representing 2.27% of our outstanding share capital.
Our other directors and executive officers who in the aggregate hold less than 1% interest in our company are Mr. Juan Manuel Lambarri Hierro, Mr. Walter Silva Santisteban, Mr. Luis Díaz Olivero, Mr. Gonzalo Ferraro Rey, Mr. Antonio Rodríguez Canales, Ms. Mónica Miloslavich Hart, Ms. Claudia Drago Morante, Mr. Juan José Arrieta Ocampo, Mr. Jaime Targarona Arata, Mr. Luis Miró Quesada Valega and Mr. Roberto Abusada Salah.
158
Table of Contents
As of February 28, 2013, our issued and outstanding share capital was comprised of 558,284,190 common shares.
The following table sets forth the beneficial ownership of our common shares before the offering and after the offering, assuming no exercise of the underwriters’ over-allotment option.
| Common Shares Owned Before the Offering | Common Shares Owned After the Offering | |||||||||||||
| Shareholder | Number of shares | Percentage owned | Number of shares | Percentage owned | ||||||||||
GH Holding Group(1) | 117,538,203 | 21.05 | % | |||||||||||
RI-CARTADM (Prima AFP-Grupo Crédito) | 65,889,092 | 11.80 | % | |||||||||||
IN-CARTADM (AFP Integra-Sura Group) | 64,017,772 | 11.47 | % | |||||||||||
HO-CARTADM (AFP Horizonte-Grupo BBVA) | 51,132,031 | 9.16 | % | |||||||||||
Bethel Enterprises Inc.(2) | 33,785,285 | 6.05 | % | |||||||||||
PR-CARTADM (Profuturo AFP-Grupo Scotiabank) | 29,965,919 | 5.37 | % | |||||||||||
Other shareholders(3) | 195,955,888 | 35.10 | % | |||||||||||
|
|
|
|
|
|
| ||||||||
Total | 558,284,190 | 100 | % | 100 | % | |||||||||
| (1) | Mr. José Graña Miró Quesada indirectly owns 117,538,203 common shares, representing 21.05% of our outstanding share capital, through GH Holding Group. |
| (2) | Mr. Carlos Montero Graña indirectly owns 33,785,258 common shares, representing 6.05% of our outstanding share capital, through Bethel Enterprises Inc. |
| (3) | The following directors and executive officers hold directly or indirectly common shares of our outstanding share capital: |
| (a) | Mr. Mario Alvarado Pflucker, director and Chief Executive Officer, indirectly owns 22,432,223 common shares, representing 4.02% of our outstanding share capital, through Byron Development; |
| (b) | Mr. Hernando Graña Acuña, director, Executive President of GyM and director in certain of our subsidiaries, owns 15,150,061 common shares, representing 2.71% of our outstanding share capital; |
| (c) | Mr. Francisco Dulanto Swayne, Executive President and director of GMP, owns 12,684,187 common shares, representing 2.27% of our outstanding share capital; |
| (d) | Mr. Juan Manuel Lambarri Hierro, Chief Executive Officer of GyM, Mr. Walter Silva Santisteban, Chief Executive Officer of GMI, Mr. Luis Díaz Olivero, Chief Executive Officer of GMP, Mr. Gonzalo Ferraro Rey, our Corporate Infrastructure Manager, Mr. Antonio Rodríguez Canales, our Chief Investment Officer, Ms. Mónica Miloslavich Hart, our Chief Financial Officer, Ms. Claudia Drago Morante, our Chief Legal Officer, Mr. Juan José Arrieta Ocampo, our Corporate Social Responsibility Manager, Mr. Jaime Targarona Arata, Chief Executive Officer of Concar, Mr. Luis Miró Quesada Valega, one of our directors, and Mr. Roberto Abusada Salah, one of our directors and Chairman of the board of directors of GMD, hold in aggregate less than 1% of our outstanding share capital. |
159
Table of Contents
Certain of our shareholders directly or indirectly own shares of our subsidiaries: Mr. Francisco Dulanto Swayne, Executive President of GMP, owns 5,060,105 common shares of GMP, representing 5.0% of its outstanding capital share; Mr. Juan Manuel Lambarri, Chief Executive Officer of GyM, owns 5,091,699 and 3,093,857 common shares of GyM and Viva GyM, representing 2.25% and 1.37% of their outstanding capital share, respectively; Mr. Jaime Targarona Arata, Chief Executive Officer of Concar, owns 47,692 common shares of Concar, representing 0.43% of its outstanding capital share; Mr. Roberto Abusada Salah, one of our directors and Chairman of the board of directors of GMD, owns 700,952 common shares of GMD, representing 5.47% of its outstanding capital share; and Mr. Rolando Ponce Vergara, Chief Executive Officer of Viva GyM, owns 1,218,017 common shares of Viva GyM, representing 0.54% of its outstanding capital share.
160
Table of Contents
Peruvian Law Concerning Related Party Transactions
Peruvian law sets forth certain restrictions and limitations on transactions with certain related parties.
For instance, from a tax standpoint, the value of those transactions must be equal to the fair market value assessed under transfer pricing rules,i.e., the value agreed to by non-related parties under the same or similar circumstances. Similarly, companies with securities registered in the Peruvian Public Registry of Securities (Registro Público del Mercado de Valores), such as us, are required to comply with the following rules:
| • | The directors and managers of the company cannot, without the prior authorization of the board of directors, (i) receive in the form of a loan money or assets of the company; or (ii) use, for their own benefit or for the benefit of related parties, assets, services or credits of the company. |
| • | The execution of agreements that involve at least 5% of the assets of the company with persons or entities related to directors, managers or shareholders that own, directly or indirectly, 10% of the share capital, requires the prior authorization of the board of directors (with no participation of the director involved in the transaction, if any). |
| • | The execution of agreements with a party controlled by the company’s controlling shareholder requires the prior authorization of the board of directors and an evaluation of the terms of the transaction by an external independent company (audit companies or other to be determined by the Peruvian Securities Commission). |
The external independent company that reviews the transaction should not be related to the parties involved therein, nor to directors, managers or shareholders that own at least 10% of the share capital of the company.
As a general policy, we do not enter into transactions with directors and executive officers on terms more favorable than what we would offer third parties. Any related party transaction we have entered into in the past has been in the ordinary course of business and on an arm’s length basis.
Article 32 of the internal regulations of our board of directors establishes a review procedure for identifying, approving and accounting for related party transactions. Related party transactions are defined as any transaction that exceeds US$50,000 entered into by and among our company and any shareholder that owns 1% or more of our company’s or of our subsidiaries’ outstanding shares, directors, senior executives and persons related to them. The Human Resource Management and Social Responsibility Committee is responsible for identifying, analyzing and approving each such transaction considering market conditions and potential benefits for us and the related party. For more information, see “Management.”
Related Party Transactions
The following set forth the related party transactions we have entered in the past three years:
| • | construction agreement, dated December 2011, entered into by and among GyM as contractor and Teresa Graña and Francisca Graña, daughters of José Graña Miró Quesada, as owners, for an amount of US$1,199,841; |
| • | landscaping design services agreement entered into among Claudia Gutierrez de Alvarado, Mario Alvarado Pflucker’s spouse, as designer, and Viva GyM, as customer, for an aggregate amount of US$38,000, between 2010 and 2012 (part of which will be paid upon completion in 2015); |
| • | architectural services agreements entered into among Mr. Oscar Borasino, Mario Alvarado Pflucker’s brother-in-law, as architect, and Viva GyM, as customer, for an aggregate amount of US$691,990 between 2010 and 2012. |
161
Table of Contents
| • | Advertising services agreements entered into among Servicios Empresariales El Administrador E.I.R.L., a company related to Rolando Ponce Vergara’s brother, as advertising intermediary, and Viva GyM as customer, for an aggregate amount of US$164,025 between 2009 and 2012. |
| • | Between the years 2010 and 2012, our company and our subsidiaries GMP, GyM, GMD, Viva GyM, GMI, Survial, Canchaque, Norvial and Concar paid an aggregate amount of US$2,280,089 to Editora El Comercio S.A.A., of which José Graña Miró Quesada is a shareholder, for advertising, publishing and editing services. |
During the three years prior to the date of this prospectus, our subsidiary Viva GyM had entered into purchase agreements for an aggregate amount of US$7,675,788 for the sale of apartments with the following related parties: Ms. Claudia Gutierrez Benavides, the spouse of Mario Alvarado; Mr. Salvador Gutierrez Benavides, the brother-in-law of Mario Alvarado Pflucker; Mr. Oscar Borasino Peschiera, the brother-in-law of Mario Alvarado Pflucker; Mr. Alejandro Miró Quesada Cisneros, José Graña Miró Quesada’s cousin; Ms. Elizabeth Dulanto de Miró Quesada, José Graña Miró Quesada’s cousin-in-law; Mr. Hernando Graña Acuña, one of our directors and a director of GyM, GMI and Stracon GyM, Vial y Vives, GMP, Norvial, La Chira, GyM Ferrovías and CAM Chile, and Executive Officer of GyM; Ms. Yamile Brahim Graña, José Graña Miró Quesada’s niece; Ms. Maria Teresa Graña Canepa, José Graña Miró Quesada’s daughter; Ms. Maria Francisca Graña Canepa, José Graña Miró Quesada’s daughter; Mr. Luis Alonso Brahim Graña, José Graña Miró Quesada’s nephew; Mr. Rolando Ponce Vergara, Chief Executive Officer and director of Viva GyM; Ms. Jenny Ponce Gilardi, Rolando Ponce Vergara’s aunt; Ms. Mónica Miloslavich Hart, our Chief Financial Officer and director of Norvial, Survial and GyM Ferrovías; Mr. Roberto Abusada Salah, one of our directors and Chairman of the board of directors of GMD; Ms. Elisa Alvarado Pflucker, Mario Alvarado Pflucker’s sister; Mr. Daniel Graña Tori, Hernando Graña Acuña’s son; Mr. Santiago Graña Taboada, Hernando Graña Acuña’s nephew; Mr. Sergio Graña Tori, Hernando Graña Acuña’s son; Mr. Martin Ferraro Murdoch, Gonzalo Ferraro Rey’s son; Ms. Maria Teresa Saavedra Villanueva, Rolando Ponce Vergara’s spouse; Mr. Juan Manuel Lambarri Hierro, Chief Executive Officer of GyM and director of GyM, Stracon GyM, Vial y Vives, Viva GyM and GMI; Ms. Viviana Figueroa Alvear, Juan Manuel Lambarri Hierro’s spouse; Mr. Luis Diaz Imiela-Gentimur, Luis Díaz Olivero’s father; Mr. Enrique Ponce and Ms. Mercedes Vergara, Rolando Ponce Vergara’s parents; Jorge Luis Izquierdo Ramírez, our Corporate Learning Center Manager; and Ms. Cristina Abusada Dahuod, Roberto Abusada Salah’s niece.
162
Table of Contents
DESCRIPTION OF OUR SHARE CAPITAL
Set forth below is certain information relating to our share capital, including brief summaries of certain material provisions of our by-laws, Peruvian Corporate Law and certain other laws and regulations of Peru, all as in effect as of the date hereof.
General
We are a publicly-held corporation under Peruvian Corporate Law and registered with the Public Registry of Corporations in Lima. We are currently listed on the Lima Stock Exchange.
Our by-laws provide that our principal corporate purposes are to engage in any and all activities related to the construction and real estate businesses; to provide services related to the mining and hydrocarbons industries; to participate in all stages of development of public services and other infrastructure concessions; and to provide management and corporate services to related and third parties. In addition, our company can realize investments and corporate transactions, including the acquisition, holding and transfer of securities of Peruvian and foreign companies.
Common Shares
As of February 28, 2013, we had 558,284,190 common shares outstanding. As of February 28, 2013, there were 1,216 owners of record of our common shares. Our common shares have a par value of S/.1.00 per share and have been fully subscribed and are fully paid. Our common shares are registered in the Securities Public Registry of the Peruvian Securities Commission and are listed on the Lima Stock Exchange.
Shareholders’ Liability
Under Peruvian Corporate Law, holders of our common shares cannot vote on matters with respect to which they have a conflict of interest.
Under Article 133 of the Peruvian Corporate Law, a shareholder must abstain from voting when faced with a conflict of interest. A resolution approved in disregard of this provision may be challenged under Article 139 of the Peruvian Corporate Law and the shareholders that participated in the determination in breach of this provision, if their vote was key in attaining the required majority, may be held jointly liable.
Redemption and Rights of Withdrawal
Under Article 200 of the Peruvian Corporate Law, holders of our common shares have redemption rights if: (i) we change our corporate purpose; (ii) a change occurs in the place of organization to a foreign country; or (iii) any transformation, merger or significant spin-off occurs with respect to our company.
Preemptive and Accretion Rights
If we increase our share capital, holders of our common shares have the right to subscribe to new common shares on a pro rata basis. Holders of common shares have preemptive rights in order to maintain their share interest in our share capital, unless the capital increase (i) results from a conversion of debt to common shares, (ii) is approved by shareholders representing at least 40% of the subscribed voting shares provided that the capital increase does not favor, directly or indirectly, certain shareholders to the detriment of others, or (iii) results from a corporate reorganization.
Shareholders who are in default of any payments relating to subscribed but unpaid shares may not exercise their preemptive rights.
163
Table of Contents
Voting Rights and Dividends
Holders of common shares are entitled to one vote per share, with the exception of the election of the board of directors, where each holder is entitled to one vote per share per nominee. Each holder’s votes may be cast for a single nominee or distributed among the nominees at the holder’s discretion. To that effect, each of our common shares gives the holder the right to as many votes as there are directors to be elected. Shareholders may pool votes in favor of one person or distribute them among various persons. Those candidates for the board who receive the most votes are elected directors. Holders of common shares may attend and vote at shareholders’ meetings either in person or through a proxy.
Holders of common shares have the right to participate in the distribution of dividends and shareholder equity resulting from liquidation. Our by-laws do not establish a maximum time limit for the payment of the dividends. However, according to Article 232 of the Peruvian Corporate Law, the right to collect past-due dividends in the case of companies that are publicly held companies, such as ours, expires ten years after the date on which the dividend payment was due.
Our share capital may be increased by a decision of holders of common shares at a shareholders’ meeting. Capital reductions may be voluntary or mandatory and must be approved by holders of common shares at a shareholders’ meeting. Capital reductions are mandatory when accumulated losses exceed 50% of the capital and to the extent such accumulated losses are not offset by accumulated earnings and capital increases within the following fiscal year. Capital increases and reductions must be communicated to the Peruvian Securities Commission, the Lima Stock Exchange and the Superintendencia Nacional de Administración Tributaria (SUNAT). Voluntary capital reductions must also be published in the official gazette El Peruano and in a widely circulated newspaper in the city in which we are located.
Liquidation Rights
If we are liquidated, our shareholders have the right to receive net assets resulting from the liquidation, after we comply with our obligation to pay all our creditors and after discounting any existing dividend liabilities. For this reason, we cannot assure that we will be able to reimburse 100% of the book value of the common shares in case of bankruptcy or liquidation.
Ordinary and Extraordinary Meetings
Pursuant to Peruvian Corporate Law and our by-laws, the annual shareholders’ meeting must be held during the three-month period after the end of each fiscal year. Additional shareholders’ meetings may be held during the year. Because we are a publicly-held corporation, we are subject to the special control of the Peruvian Securities Commission, as provided in Article 253 of the Peruvian Corporate Law. If we do not hold the annual shareholders’ meeting during the three-month period after the end of each fiscal year or any other shareholders’ meeting required by our by-laws, a public notary or a competent judge shall call for such a meeting at the request of at least one shareholder of the common shares. Such meeting will take place within a reasonable period of time.
Pursuant to the Peruvian Corporate Law, other shareholders’ meetings are convened by the board of directors when deemed convenient by the company or when it is requested by notarized letter, by the holders of at least 20% of our common shares. If, at the request of holders of at least 20% of the common shares, the shareholders’ meeting is not convened by the board of directors within 15 days of the receipt of such request, or the board expressly or implicitly refuses to convene the shareholders’ meeting, a public notary or a competent judge will call pursuant to Law No. 29560 for such meeting at the request of holders of at least 20% of our common shares. If a public notary or competent judge calls for a shareholders’ meeting, the place, time and hour of the meeting, the agenda and the person who will preside shall be indicated on the meeting notice. If the meeting called is other than the annual shareholders’ meeting or a shareholders’ meeting required by the Peruvian Corporate Law or the by-laws, the agenda will contain those matters requested by the shareholders who requested the meeting.
164
Table of Contents
Notices of Meetings
Since we are a publicly-held corporation, notice of shareholders’ meetings must be given by publication of a notice. The publication shall occur at least 25 days prior to any shareholders’ meeting in the Peruvian Official Gazette, El Peruano, and in a widely circulated newspaper in the city in which we are located.
Quorum and Voting Requirements
According to Article 33 of our by-laws and Article 257 of the Peruvian Corporate Law, shareholders’ meetings called for the purpose of considering a capital increase or decrease, the issuance of obligations, a change in the by-laws, the sale in a single act of assets with an accounting value that exceeds 50% of our share capital, a merger, division, reorganization, transformation or dissolution, are subject to a first, second and third quorum call, with each of the second and third quorum call to occur upon the failure of the preceding one. A quorum for the first call requires the presence of shareholders holding 50% of our total common shares. For the second call, the presence of shareholders holding at least 25% of our total common shares is adequate, while for the third call there is no quorum requirement. These decisions require the approval of the majority of the common shares represented at the shareholders’ meeting. Shareholders’ meetings convened to consider all other matters are subject to a first and second quorum call, with the second quorum call to occur upon the failure of the first quorum.
In accordance with Peruvian Corporate Law, only those holders of common shares whose names are registered in the company’s stock ledger not less than 10 days in advance of a meeting will be entitled to attend the shareholders’ meeting and to exercise their rights.
Limitations on the Rights of Non-residents or Foreign Shareholders
There are no limitations under our by-laws or Peruvian Corporate Law on the rights of non-residents or foreign shareholders to own securities or exercise voting rights with respect to our securities.
Disclosure of Shareholdings and Tender Offer Regulations
Disclosure of Shareholdings
There are no provisions in our by-laws governing the ownership threshold above which share ownership must be disclosed.
However, according to Article 10 of CONASEV Resolution Nº 090-2005-EF-94.10, as amended, we must inform the Peruvian Securities Commission of the members of our economic group, comprised by our subsidiaries, and a list of our holders of common shares owning more than a 5% share interest, as well as any change to such information.
Tender Offer Regulations
Peruvian securities regulations include mandatory takeover rules applicable to the acquisition of control of a publicly held company.
Subject to certain conditions, such regulations generally establish the obligation to launch a tender offer when a person or group of persons acquires a significant interest in a publicly held company. According to the provisions set forth in CONASEV Resolution No. 009-2006-EF-94.10, a person acquires a significant interest in a listed company when such person (a) holds or has the power to exercise directly or indirectly 25%, 50% or 60% of the voting rights in a listed company, or (b) has the power to appoint or remove the majority of the board members or to amend its by-laws.
A tender offer may be launched prior or following an acquisition of the significant interest. The tender offer may be launched after the “significant interest” is acquired if it is acquired (a) by means of an indirect transaction, defined as a relevant acquisition or interest increase through the acquisition of securities issued by a company that in turn holds share capital of the target company; (b) as a consequence of a public sale offer, or (c) in no more than four transactions within a three-year period.
165
Table of Contents
This mandatory procedure has the effect of alerting other shareholders and the market that an individual or financial group has acquired a significant percentage of a company’s voting shares, and gives other shareholders the opportunity to sell their shares at the price offered by the purchaser. The purchaser is required to launch a tender offer unless: (a) shareholders representing 100% of the voting rights consent in writing, (b) voting shares are acquired by a depositary in order to subsequently issue ADSs, or (c) voting shares are acquired pursuant to the exercise of preemptive rights.
Changes in Capital
Our by-laws do not establish special conditions to increase or reduce our share capital beyond what is required under Peruvian Corporate Law.
Anti-Takeover Provisions
Our by-laws do not contain any provision that would have the effect of delaying, deferring or preventing a change of control.
Form and Transfer
Common shares may be either physical share certificates in registered form or book-entry securities in the CAVALI S.A. ICLV book-entry settlement system also in registered form.
Furthermore, the Peruvian Corporate Law forbids publicly-held corporations, such as us, from including in their by-laws stipulations limiting the transfer of their shares or restraining their trading in other ways. According to Article 18 of our by-laws, we cannot recognize a shareholders’ agreement that contemplates limitations, restrictions or preferential rights on the transfer of shares, even if such an agreement is recorded in our stock ledger (matrícula de acciones) or in CAVALI. As of the date of this offering, no shareholders’ agreement is recorded in our stock ledger.
Arbitration
Our bylaws include an arbitration clause applicable to disputes arising from the interpretation of our bylaws or Peruvian Corporate Law and their complementary provisions, among our company, our management and our shareholders. Any arbitration will be subject to the regulations of the Abritration Center of the Lima Chamber of Commerce.
166
Table of Contents
Dividend Policy
Our dividend policy is to distribute 30% of the net profit from the preceding year. Holders of our common shares are entitled to receive dividends on a pro rata basis in accordance with their respective number of shares held. Our dividend policy can be modified by a favorable vote of a majority of our shareholders and any changes become effective 30 days after approval.
Article 23 of our by-laws establishes that dividends distribution must be approved by our shareholders during the annual shareholders’ meeting. The recommendation of our board of directors is required for the distribution of interim dividends, which must be subsequently ratified at a shareholders’ meeting.
Under Peruvian law, companies may distribute up to 100% of their profit (after payment of income tax) subject to a 10% legal reserve until the legal reserve equals 20% of shareholders’ equity. According to Article 40 of the Peruvian Corporate Law, in order to distribute dividends, profits must be determined in accordance with the individual financial statements of the company.
Payment of Dividends
Dividends are paid to holders of our common shares as of a record date determined by us. In order to allow for the settlement of securities, under the rules of the Peruvian Securities Commission, investors who purchase shares of a publicly-held company three business days prior to a dividend payment date do not have the right to receive such dividend payment. Dividends on issued and outstanding common shares are distributed pro rata.
Our syndicated loan agreement contains certain customary covenants, including restrictions on our ability to pay dividends if we are in default under the agreement. Our subsidiaries have also agreed to limitations on their ability to pay dividends based on compliance with certain financial ratios. See “Management’s Discussion and Analysis of Financial Condition and Results of Operations—Liquidity and Capital Resources—Indebtedness.”
Holders of common shares are not entitled to interest on accrued dividends. In addition, under Article 232 of the Peruvian Corporate Law, the right to collect accrued dividends declared by a publicly-held company expires ten years from the original dividend payment date.
Previous Dividend Payments
The following table sets forth the amounts of cash dividends declared and paid from 2008 through 2012 for our common shares.
| Dividends Paid | Per Share | |||||||
| (in S/.) | ||||||||
2008 | 25,979,911 | 0.0606690 | ||||||
2009 | 29,437,792 | 0.05272905 | ||||||
2010 | 26,879,790 | 0.04814715 | ||||||
2011 | 55,015,923 | 0.098544656 | ||||||
2012 | 86,722,433 | 0.155337434 | ||||||
167
Table of Contents
Market Price of Our Common Shares and ADSs
Our ADSs
Prior to this offering, there has been no public market for our ADSs. We intend to apply to have our ADSs listed on The New York Stock Exchange. We cannot assure you that an active trading market will develop for our ADSs or that our ADSs will trade in the public market subsequent to the offering at or above the initial public offering price.
Our Shares
Our common shares are registered in the Public Registry of Securities held with the Peruvian Securities Commission and are listed on the Lima Stock Exchange under the symbols “GRAMONC1”. On March 22, 2013, the closing price on the Lima Stock Exchange was S/.11.46 per common share. Our shares represent 4.06% of the General Index of the Lima Stock Exchange (IGBVL) 2013 portfolio.
The following table sets forth for the five most recent full years and for the current year the high and low closing prices of our common shares on the Lima Stock Exchange as reported by the Lima Stock Exchange.
| High | Low | |||||||
| (in S/.) | ||||||||
2008 | 5.75 | 2.00 | ||||||
2009 | 3.13 | 1.79 | ||||||
2010 | 7.21 | 2.83 | ||||||
2011 | 6.90 | 4.60 | ||||||
2012 | 9.70 | 6.30 | ||||||
2013: | ||||||||
January | 10.90 | 9.70 | ||||||
February | 11.65 | 11.00 | ||||||
March (through March 22) | 11.85 | 11.35 | ||||||
The following table sets forth for each quarter of the two most recent years the high and low closing prices of our common shares on the Lima Stock Exchange as reported by the Lima Stock Exchange.
| High | Low | |||||||
| (in S/.) | ||||||||
2011: | ||||||||
First quarter | 6.90 | 6.00 | ||||||
Second quarter | 6.55 | 4.60 | ||||||
Third quarter | 6.30 | 5.24 | ||||||
Fourth quarter | 6.60 | 5.29 | ||||||
2012: | ||||||||
First quarter | 8.75 | 6.30 | ||||||
Second quarter | 9.12 | 7.50 | ||||||
Third quarter | 8.53 | 8.10 | ||||||
Fourth quarter | 9.82 | 8.93 | ||||||
168
Table of Contents
The following table sets forth for each of the most recent six months the high and low closing prices in nuevos soles of our common shares on the Lima Stock Exchange as reported by the Lima Stock Exchange.
| High | Low | |||||||
| (in S/.) | ||||||||
2012: | ||||||||
September | 8.80 | 8.29 | ||||||
October | 9.02 | 8.65 | ||||||
November | 9.50 | 8.78 | ||||||
December | 9.70 | 9.36 | ||||||
2013: | ||||||||
January | 10.90 | 9.70 | ||||||
February | 11.65 | 11.00 | ||||||
March (through March 22) | 11.85 | 11.35 | ||||||
Trading in the Peruvian Securities Market
Lima Stock Exchange
As of December 31, 2012, there were 282 companies listed on the Lima Stock Exchange. Established in 1970, the Lima Stock Exchange is Peru’s only securities exchange. On November 19, 2003, the members of the Lima Stock Exchange approved to convert its corporate status to a publicly held corporation. As of December 31, 2012, Lima Stock Exchange had a share capital of S/.59,715,840, divided into 56,405,407 class “A” shares and 3,310,433 class “B” shares of par value S/.1.00 each. Class “A” shares are entitled to one vote per share while class “B” shares do not have voting rights. As of December 31, 2012, the Lima Stock Exchange had 131 class “A” shareholders and 72 class “B” shareholders.
Trading on the Lima Stock Exchange is primarily done on an electronic trading system that became operational in August 1995. From the first Monday of November through the second Sunday of March of each year, trading hours are Monday through Friday (except holidays) as follows: 8:20 a.m.–8:30 a.m. (pre-market ordering); 8:30 a.m.–2:55 p.m. (trading); 2:55 p.m.–3:00 p.m. (after-market sales); and 3:00 p.m.–3:10 p.m. (after-market trading). At all other times, trading hours are from Monday to Friday (except holidays) as follows: 9:00 a.m.–9:30 a.m. (pre-market ordering); 9:30 a.m.–3:55 p.m. (trading); 3:55 p.m.–4:00 p.m. (after-market sales); and 4:00 p.m.–4:10 p.m. (after-market trading).
Substantially all of the transactions on the Lima Stock Exchange are traded on the electronic system. Transactions during the electronic sessions are executed through brokerage firms and stock brokers on behalf of their clients. Brokers submit orders in the order in which they are received. The orders must specify the type of security as well as the amount and price of the proposed sale or purchase. In order to control price volatility, the Lima Stock Exchange imposes a 15 minute suspension on trading when the price of a security varies on a single day by more than 15% for Peruvian companies and 30% for non-Peruvian companies.
Certain information regarding trading on the Lima Stock Exchange is set forth in the table below:
| 2008 | 2009 | 2010 | 2011 | 2012 | ||||||||||||||||
Market capitalization (in billions of nuevos soles)(1) | 179,163 | 310,116 | 451,796 | 327,823 | 391,181 | |||||||||||||||
Volume (in millions of nuevos soles) | 14,890 | 11,862 | 14,155 | 17,243 | 19,951 | |||||||||||||||
Average daily trading volume (in millions of nuevos soles) | 93 | 68 | 76 | 86 | 79 | |||||||||||||||
| (1) | End-of-period figures for trading on the Lima Stock Exchange. |
169
Table of Contents
The stock market capitalization of companies listed on the Lima Stock Exchange was US$153.4 billion at the end of 2012, compared to US$57.1 billion, US$107.3 billion, US$160.9 billion and US$121.6 billion at the end of 2008, 2009, 2010 and 2011, respectively.
Total market volume in 2012 was US$7.6 billion, reflecting a 2.6% decrease compared with 2011. Equity market volume, which represented 80.2% of total market volume, ended the year at US$6.1 billion, 2.1% less than the previous year. The repo market, which represented 12.3% of total market volume, reported volume of US$937 million in 2012, reflecting an increase of 1.9%.
The total number of operations in the market in 2012 decreased by 19.5%, closing the year at 249,148 operations. The number of operations in the equity market in 2012 declined by 32.9% amounting to 237,137 operations.
The General Index of the Lima Stock Exchange (Índice General de la Bolsa de Valores de Lima) decreased, in U.S. dollars terms, 59.8% in 2008, but increased 101.0% in 2009 and 65.0% in 2010, reaching 23,274 points as of December 31, 2010, the highest value over the past three years. In 2011, the index reported losses amounting to 17.0%, while 2012 registered an increase of 5.9%.
Regulation of the Peruvian Securities Market
The regulatory framework for the Peruvian securities market is established in the Securities Market Law approved by Legislative Decree No. 861, whose unified sole text was enacted by Supreme Decree No. 093-2002-EF, as amended (Ley del Mercado de Valores), and the resolutions issued from time to time by the Peruvian Securities Commission. The purpose of the Securities Market Law is to promote the ordered development and transparency of the securities markets, adequate protection for investors and the principles under which the Peruvian securities market is intended to operate. The Securities Market Law contains the general rules for: (i) primary and secondary public offerings of securities; (ii) public offering of securities for acquisitions; (iii) local and international offerings, including simultaneous offerings; (iv) the Public Registry of Securities (the Registro Público del Mercado de Valores); (v) reporting obligations of material information (hechos de importancia) by the issuers of securities recorded in the Public Registry of Securities and by the entities that are subject to the regulation and supervision of the Peruvian Securities Commission; (vi) the enforcement of insider trading; (vii) privileged information and confidentiality regulations and prohibitions against price manipulation, (viii) the broker-dealers; (ix) the Lima Stock Exchange; (x) CAVALI (the settlement and registry entity for transactions executed on the Lima Stock Exchange); (xi) other entities that are required to be registered at the Public Registry of Securities; (xii) capital market instruments and operations, including securitizations; and (xiii) mutual funds and investments funds publicly placed and their respective management companies.
The Peruvian securities market is regulated and supervised by the Peruvian Securities Commission, a governmental entity reporting to the Peruvian Ministry of Economy and Finance, with functional, administrative, economic, technical and budgetary autonomy. The Peruvian Securities Commission is governed by the Superintendent, designated by the Peruvian Ministry of Economy and Finance, and by a five member board of directors convened by the Superintendent (who acts as Chairman of the board). The other four members are appointed by the government under applicable legislation. The Peruvian Securities Commission issues from time to time resolutions which provide specific regulations or may impose sanctions in cases of violations of the Securities Market Law or the resolutions issued by the Peruvian Securities Commission.
The Peruvian Securities Commission, in order to achieve the Securities Market Law’s purposes, has broad regulatory and supervisory powers, including (i) issuing general mandatory rules; (ii) supervision and oversight of compliance with applicable legislation (including the power to order inspections and require the submission of information and documentation by entities that are under its jurisdiction and summon and interrogate any person that may contribute to its investigations); (iii) imposing sanctions; (iv) managing the Public Registry of Securities; (v) authorizing public offerings of securities and the recording at the Public Registry of Securities that may be the
170
Table of Contents
subject of such public offerings and the respective programs for issuances; (vi) authorizing the incorporation and functioning of entities under its scope of supervision; and (vii) monitoring the content and accuracy of the financial and other information that is filed with the Peruvian Securities Commission. The Peruvian Securities Commission is responsible for the enactment, interpretation and enforcement of rules and regulations issued under the Securities Market Law.
Disclosure Obligations
Issuers of securities registered with the Peruvian Securities Commission are required to disclose material information relating to the issuer. Pursuant to the Securities Market Law and relevant regulations enacted thereunder, all material information in connection with the issuer of registered securities (such as our common shares), its activities or securities issued or secured by such issuer which may influence the liquidity or price of such securities must be disclosed. Accordingly, issuers must file with the Peruvian Securities Commission mainly two types of information: (a) financial information, including interim unaudited financial statements on a quarterly basis (which are not required to be subject to limited review by external auditors), and annual audited consolidated financial statements on an annual basis, and (b) material information relating to the issuer and its activities that may significantly affect the price, offering or trading of the issued securities, and in general, all the information that may be relevant for investors to be able to make investment decisions.
In order to comply with the foregoing disclosure obligations, issuers must disclose information to the Peruvian Securities Commission and, if the securities are listed, with the Lima Stock Exchange as soon as practicable but not later than one business day after having become aware of such information.
171
Table of Contents
DESCRIPTION OF AMERICAN DEPOSITARY SHARES
General
[—], as depositary, will issue the ADSs which you will be entitled to receive in this offering. Each ADS will represent an ownership interest in [—] common shares which we will deposit with the custodian, [—], as agent of the depositary, under the deposit agreement among us, the depositary and you as an ADS holder. In the future, each ADS will also represent any securities, cash or other property deposited with the depositary but which they have not distributed directly to you. Unless specifically requested by you, all ADSs will be issued on the books of our depositary in book-entry form and periodic statements will be mailed to you which reflect your ownership interest in such ADSs. In our description, references to ADRs, shall include the statements you will receive which reflect your ownership of ADSs.
The depositary’s office is located at [—] United States.
You may hold ADSs either directly or indirectly through your broker or other financial institution. If you hold ADSs directly, by having an ADS registered in your name on the books of the depositary, you are an ADR holder. This description assumes you hold your ADSs directly. If you hold the ADSs through your broker or financial institution nominee, you must rely on the procedures of such broker or financial institution to assert the rights of an ADR holder described in this section. You should consult with your broker or financial institution to find out what those procedures are.
As an ADR holder, we will not treat you as a shareholder of ours and you will not have any shareholder rights. Peruvian law governs shareholder rights. ADR holders have no direct ownership interest in our common shares and only have such rights as specified in the deposit agreement. Your rights are those of an ADR holder. Such rights derive from the terms of the deposit agreement to be entered into among us, the depositary and all registered holders from time to time of ADSs issued under the deposit agreement. The obligations of the depositary and its agents are also set out in the deposit agreement. Because the depositary or its nominee will actually be the registered owner of the common shares, you must rely on the depositary or its nominee to exercise the rights of a shareholder on your behalf. The deposit agreement and the ADSs are governed by the law of the State of New York. However, our obligations to the holders of common shares represented by the ADSs will continue to be governed by the laws of Peru, which may be different from the law of the State of New York.
The following is a summary of what we believe to be the material terms of the deposit agreement. This summary is qualified in its entirety by reference to, and should be read in conjunction with, the entire deposit agreement and the form of ADR which contains the complete terms of your ADSs. You can read a copy of the deposit agreement, which is filed as exhibit [—] to the registration statement of which this prospectus forms a part. You may also obtain a copy of the deposit agreement at the SEC’s Public Reference Room which is located at 100 F Street, NE, Washington, DC 20549. You may obtain information on the operation of the Public Reference Room by calling the SEC at 1-800-732-0330. You may also find the registration statement and the attached deposit agreement on the SEC’s website athttp://www.sec.gov.
Dividends and Other Distributions
We may make various types of distributions with respect to our securities. The depositary has agreed that, to the extent practicable, it will pay to you the cash dividends or other distributions it or the custodian receives on common shares or other deposited securities, after converting any cash received into U.S. dollars and, in all cases, making any necessary deductions provided for in the deposit agreement. You will receive these distributions in proportion to the number of underlying securities that your ADSs represent.
Except as stated below, the depositary will deliver such distributions to ADR holders in proportion to their interests in the following manner:
Distribution of Cash.The depositary will distribute any U.S. dollars available to it resulting from a cash dividend or other cash distribution or the net proceeds of sales of any other distribution or portion thereof (to the
172
Table of Contents
extent applicable), on an averaged or other practicable basis, subject to (i) appropriate adjustments for taxes withheld, (ii) such distribution being impermissible or impracticable with respect to certain registered ADR holders, and (iii) deduction of the depositary’s expenses in (1) converting any foreign currency to U.S. dollars to the extent that it determines that such conversion may be made on a reasonable basis, (2) transferring foreign currency or U.S. dollars to the United States by such means as the depositary may determine to the extent that it determines that such transfer may be made on a reasonable basis, (3) obtaining any approval or license of any governmental authority required for such conversion or transfer, which is obtainable at a reasonable cost and within a reasonable time and (4) making any sale by public or private means in any commercially reasonable manner. If exchange rates fluctuate during a time when the depositary cannot convert a foreign currency, you may lose some or all of the value of the distribution.
Distribution of Common Shares. In the case of a distribution of common shares, the depositary will issue additional ADRs to evidence the number of ADSs representing such common shares. Only whole ADSs will be issued. Any common shares which would result in fractional ADSs will be sold and the net proceeds will be distributed in the same manner as cash to the ADR holders entitled thereto.
No distribution of ADRs as described above will be made if it violates U.S. securities laws, or any other law, or if it is not operationally practicable. If the depositary does not distribute new ADRs as described above, it will use its best efforts to sell the common shares received and distribute the proceeds of the sale in the same manner as a cash distribution.
Rights to Receive Additional Common Shares. In the case of a distribution of rights to subscribe for additional common shares or other rights, if we provide evidence satisfactory to the depositary that it may lawfully distribute such rights, the depositary will distribute warrants or other instruments in the discretion of the depositary representing such rights. If we do not furnish such evidence, the depositary may:
| • | sell such rights if practicable and distribute the net proceeds in the same manner as cash distributions to the ADR holders entitled thereto; or |
| • | if it is not reasonably practicable to sell such rights, do nothing and allow such rights to lapse, in which case ADR holders will receive nothing. |
We have no obligation to file a registration statement under the Securities Act in order to make any rights available to ADR holders.
Other Distributions. In the case of a distribution of securities or property other than those described above, the depositary may either (i) distribute such securities or property in any manner it deems equitable and practicable or (ii) to the extent the depositary deems distribution of such securities or property not to be equitable and practicable, sell such securities or property and distribute any net proceeds in the same manner it distributes cash.
If the depositary determines that any distribution described above is not practicable with respect to any specific registered ADR holder, the depositary may choose any method of distribution that it deems practicable for such ADR holder, including the distribution of foreign currency, securities or property, or it may retain such items, without paying interest on or investing them, on behalf of the ADR holder as deposited securities, in which case the ADSs will also represent the retained items.
U.S. dollars will be distributed by checks drawn on a bank in the United States for whole U.S. dollars and cents. Fractional cents will be withheld without liability and dealt with by the depositary in accordance with its then current practices.
The depositary is not responsible if it decides that it is unlawful or impractical to make a distribution available to any ADR holders.
173
Table of Contents
There can be no assurance that the depositary will be able to convert any currency at a specified exchange rate or sell any property, rights, common shares or other securities at a specified price, nor that any of such transactions can be completed within a specified time period.
Issuance of ADSs upon Deposit of Common Shares
The depositary will issue ADSs if you or your broker deposit common shares or evidence of rights to receive common shares with the custodian and pay the fees and expenses owing to the depositary in connection with such issuance. In the case of the ADSs to be issued under this prospectus, we will deposit such common shares.
Common shares deposited in the future with the custodian must be accompanied by the delivery of certain documentation and shall, at the time of such deposit, be registered in the name of [—], as depositary for the benefit of holders of ADRs or in such other name as the depositary shall direct.
The custodian will hold all deposited common shares (including those being deposited by us or on our behalf in connection with the offering to which this prospectus relates) for the account of the depositary. ADR holders thus have no direct ownership interest in our common shares and only have such rights as are contained in the deposit agreement. The custodian will also hold any additional securities, property and cash received on or in substitution for the deposited common shares. The deposited common shares and any such additional items are referred to as “deposited securities.”
Upon each deposit of common shares, receipt of related documentation and compliance with the other provisions of the deposit agreement, including the payment of the fees and charges of the depositary and any taxes or other fees or charges owing, the depositary will issue an ADR or ADRs in the name or upon the order of the person entitled thereto evidencing the number of ADSs to which such person is entitled. All of the ADSs issued will, unless specifically requested to the contrary, be part of the depositary’s direct registration system, and a registered holder will receive periodic statements from the depositary which will show the number of ADSs registered in such holder’s name. An ADR holder can request that the ADSs not be held through the depositary’s direct registration system and that a certificated ADR be issued.
The term common shares in this section shall also refer to preliminary stock certificates (certificados provisionales), which will be converted to common shares once the capital increase is registered with the Peruvian public registry and new common shares are listed on the Lima Stock Exchange and registered in the CAVALI S.A. ICLV book-entry settlement system.
Withdrawal of Common Shares upon Cancellation of ADSs
When you turn in your ADR certificate at the depositary’s office, or when you provide proper instructions and documentation in the case of direct registration ADSs, the depositary will, upon payment of certain applicable fees, charges and taxes, deliver the underlying common shares to you upon your written order. At your risk, expense and request, the depositary may deliver deposited securities at such other place as you may request.
The depositary may only restrict the withdrawal of deposited securities in connection with:
| • | temporary delays caused by closing our transfer books or those of the depositary or the deposit of common shares in connection with voting at a shareholders’ meeting, or the payment of dividends; |
| • | the payment of fees, taxes and similar charges; or |
| • | compliance with any Peruvian, U.S. or other foreign laws or governmental regulations relating to the ADRs or to the withdrawal of deposited securities. |
Notwithstanding the foregoing, no withdrawal of deposited securities shall be permitted until the preliminary stock certificate (certificados provisionales) have been converted to common shares once the capital increase has been recorded with the Peruvian public registry.
174
Table of Contents
This right of withdrawal may not be limited by any other provision of the deposit agreement.
Record Dates
The depositary may, after consultation with us if practicable, fix record dates for the determination of the registered ADR holders who will be entitled (or obligated, as the case may be):
| • | to receive any distribution on or in respect of common shares; |
| • | to give instructions for the exercise of voting rights at a meeting of holders of common shares; |
| • | to pay the fee assessed by the depositary for administration of the ADR program and for any expenses as provided for in the ADR; or |
| • | to receive any notice or to act in respect of any other matter, in each case, subject to the provisions of the deposit agreement. |
Voting Rights
A holder of an ADR representing common shares will generally have the right under the deposit agreement to instruct the depositary to exercise the voting rights for the underlying common shares represented by such ADRs. The voting rights of holders of common shares are described under “Description of our Share Capital.”
If you are an ADR holder and the depositary asks you to provide it with voting instructions, you may instruct the depositary how to exercise the voting rights for the common shares which underlie your ADSs. As soon as practicable after receiving notice of any meeting or solicitation of consents or proxies from us, the depositary will distribute to the registered ADR holders a notice stating such information as is contained in the voting materials received by the depositary and describing how you may instruct the depositary to exercise the voting rights for the common shares which underlie your ADSs, including instructions for giving a discretionary proxy to a person designated by us. For instructions to be valid, the depositary must receive them in the manner and on or before the date specified. The depositary will try, as far as is practical, subject to the provisions of and governing the underlying common shares or other deposited securities, to vote or to have its agents vote the common shares or other deposited securities as you instruct. The depositary will only vote or attempt to vote as you instruct. The depositary will not itself exercise any voting discretion. Furthermore, neither the depositary, nor its agents, are responsible for any failure to carry out any voting instructions, for the manner in which any vote is cast or for the effect of any vote, other than for failure caused directly by gross negligence, bad faith or willful misconduct on the part of the depositary or its agents. Notwithstanding anything contained in the deposit agreement or any ADR, the depositary may, to the extent not prohibited by law or applicable regulations, or by the requirements of the stock exchange on which the ADSs are listed, in lieu of distribution of the materials provided to the depositary in connection with any meeting of, or solicitation of consents or proxies from, holders of deposited securities, distribute to the registered holders of ADRs a notice that provides such holders with, or otherwise publicizes to such holders, instructions on how to retrieve such materials or receive such materials upon request (i.e., by reference to a website containing the materials for retrieval or a contact for requesting copies of the materials).
There is no assurance that you will receive voting materials in time to instruct the depositary to vote and it is possible that you, or persons who hold their ADSs through brokers, dealers or other third parties, will not have the opportunity to exercise a right to vote.
Reports and Other Communications
The depositary will make available for inspection by ADR holders at the offices of the depositary and the custodian the deposit agreement, the provisions of or governing deposited securities, and any written communications from us which are both received by the custodian or its nominee as a holder of deposited securities and made generally available to the holders of deposited securities.
175
Table of Contents
Additionally, if we make any written communications generally available to holders of our common shares, and we furnish copies thereof (or English translations or summaries) to the depositary, it will distribute the same to registered ADR holders.
Fees and Expenses
The depositary may charge each person to whom ADSs are issued, including, without limitation, issuances against deposits of common shares, issuances in respect of common share distributions, rights and other distributions, issuances pursuant to a stock dividend or stock split declared by us or issuances pursuant to a merger, exchange of securities or any other transaction or event affecting the ADSs or deposited securities, and each person surrendering ADSs for withdrawal of deposited securities or whose ADRs are cancelled or reduced for any other reason, US$[—] for each 100 ADSs (or any portion thereof) issued, delivered, reduced, cancelled or surrendered, as the case may be. The depositary may sell (by public or private sale) sufficient securities and property received in respect of a common share distribution, rights and/or other distribution prior to such deposit to pay such charge.
The following additional charges shall be incurred by the ADR holders, by any party depositing or withdrawing common shares or by any party surrendering ADSs or to whom ADSs are issued (including, without limitation, issuance pursuant to a stock dividend or stock split declared by us or an exchange of stock regarding the ADRs or the deposited securities or a distribution of ADSs), whichever is applicable:
| • | a fee of US$[—] per ADR or ADRs for transfers of certificated or direct registration ADRs; |
| • | a fee of US$[—] or less per ADS for any cash distribution made pursuant to the deposit agreement; |
| • | a fee of US$[—] or less per ADS per calendar year (or portion thereof) for services performed by the depositary in administering the ADRs (which fee may be charged on a periodic basis during each calendar year and shall be assessed against holders of ADRs as of the record date or record dates set by the depositary during each calendar year and shall be payable in the manner described in the next succeeding provision); |
| • | reimbursement of such fees, charges and expenses as are incurred by the depositary and/or any of the depositary’s agents (including, without limitation, the custodian and expenses incurred on behalf of holders in connection with compliance with foreign exchange control regulations or any law or regulation relating to foreign investment) in connection with the servicing of the common shares or other deposited securities, the delivery of deposited securities or otherwise in connection with the depositary’s or the custodian’s compliance with applicable law, rule or regulation (which charge shall be assessed on a proportionate basis against holders as of the record date or dates set by the depositary and shall be payable at the sole discretion of the depositary by billing such holders or by deducting such charge from one or more cash dividends or other cash distributions); |
| • | a fee for the distribution of securities (or the sale of securities in connection with a distribution), such fee being in an amount equal to the US$[—] per ADS issuance fee for the execution and delivery of ADSs which would have been charged as a result of the deposit of such securities (treating all such securities as if they were common shares) but which securities or the net cash proceeds from the sale thereof are instead distributed by the depositary to those holders entitled thereto; |
| • | stock transfer or other taxes and other governmental charges; |
| • | cable and facsimile transmission and delivery charges incurred at your request in connection with the deposit or delivery of common shares; |
| • | transfer or registration fees for the registration of transfer of deposited securities on any applicable register in connection with the deposit or withdrawal of deposited securities; and |
| • | expenses of the depositary in connection with the conversion of foreign currency into U.S. dollars. |
176
Table of Contents
We will pay all other charges and expenses of the depositary and any agent of the depositary (except the custodian) pursuant to agreements from time to time between us and the depositary. The charges described above may be amended from time to time by agreement between us and the depositary.
Our depositary has agreed to reimburse us for certain expenses we incur that are related to establishment and maintenance of the ADR program, including investor relations expenses and exchange application and listing fees. The amounts of reimbursements available to us are not based upon the amounts of fees the depositary collects from investors. The depositary collects its fees for issuance and cancellation of ADSs directly from investors depositing common shares or surrendering ADSs for the purpose of withdrawal or from intermediaries acting on their behalf. The depositary collects fees for making distributions to investors by deducting those fees from the amounts distributed or by selling a portion of distributable property to pay the fees. The depositary may collect its annual fee for depositary services by deduction from cash distributions, or by directly billing investors, or by charging the book-entry system accounts of participants acting for them. The depositary will generally set off the amounts owing from distributions made to holders of ADSs. If, however, no distribution exists and payment owing is not timely received by the depositary, the depositary may refuse to provide any further services to holders that have not paid those fees and expenses owing until such fees and expenses have been paid. At the discretion of the depositary, all fees and charges owing under the deposit agreement are due in advance and/or when declared owing by the depositary.
Payment of Taxes
ADS holders or ADR holders, as the case may be, must pay any tax or other governmental charge payable by the custodian or the depositary on any ADS or ADR, deposited security or distribution. If an ADS holder or ADR holder, as the case may be, owes any tax or other governmental charge, the depositary may (i) deduct the amount thereof from any cash distributions, or (ii) sell deposited securities (by public or private sale) and deduct the amount owing from the net proceeds of such sale. In either case the ADS holder or ADR holder, as the case may be, remains liable for any shortfall. Additionally, if any taxes or other governmental charges (including any penalties and/or interest) shall become payable by or on behalf of the custodian or the depositary with respect to any ADR, any deposited securities represented by the ADSs evidenced thereby or any distribution thereon, such tax or other governmental charge shall be paid by the holder thereof to the depositary. By holding or having held an ADS or an ADR, as the case may be, the holders agree to indemnify, defend and save harmless each of the depositary, its agents and us in respect thereof. If any tax or governmental charge is unpaid, the depositary may also refuse to effect any registration, registration of transfer, split up or combination of deposited securities or withdrawal of deposited securities until such payment is made. If any tax or governmental charge is required to be withheld on any cash distribution, the depositary may deduct the amount required to be withheld from any cash distribution or, in the case of a non-cash distribution, sell the distributed property or securities (by public or private sale) to pay such taxes and distribute any remaining net proceeds to the ADS holders or the ADR holders entitled thereto.
By holding an ADR or an ADS, as the case may be, or an interest therein, you will be agreeing to indemnify us, the depositary, the custodian and any of our or their respective directors, employees, agents and affiliates against, and hold each of them harmless from, any claims by any governmental authority with respect to taxes, additions to tax, penalties or interest arising out of any refund of taxes, reduced rate of withholding at source or other tax benefit obtained.
Reclassifications, Recapitalizations and Mergers
If we take certain actions that affect the deposited securities, including (i) any change in par value, split up, consolidation, cancellation or other reclassification of deposited securities or (ii) any distributions not made to holders of ADRs or (iii) any recapitalization, reorganization, merger, consolidation, liquidation, receivership, bankruptcy or sale of all or substantially all of our assets, then the depositary may choose to:
| • | amend the form of ADR; |
177
Table of Contents
| • | distribute additional or amended ADRs; |
| • | distribute cash, securities or other property it has received in connection with such actions; |
| • | sell any securities or property received and distribute the proceeds as cash; or |
| • | none of the above. |
If the depositary does not choose any of the above options, any of the cash, securities or other property it receives will constitute part of the deposited securities and each ADS will then represent a proportionate interest in such property.
Amendment and Termination
We may agree with the depositary to amend the deposit agreement and the ADSs without your consent for any reason. ADR holders must be given at least 30 days’ notice of any amendment that imposes or increases any fees or charges (other than stock transfer or other taxes and other governmental charges, transfer or registration fees, cable, telex or facsimile transmission costs, delivery costs or other such expenses), or otherwise prejudices any substantial existing right of ADR holders. Such notice need not describe in detail the specific amendments effectuated thereby, but must give ADR holders a means to access the text of such amendment. If an ADR holder continues to hold an ADR or ADRs after being so notified, such ADR holder is deemed to agree to such amendment and to be bound by the deposit agreement as so amended. Notwithstanding the foregoing, if any governmental body or regulatory body should adopt new laws, rules or regulations which would require amendment or supplement of the deposit agreement or the form of ADR to ensure compliance therewith, we and the depositary may amend or supplement the deposit agreement and the ADR at any time in accordance with such changed laws, rules or regulations, which amendment or supplement may take effect before a notice is given or within any other period of time as required for compliance. No amendment, however, will impair your right to surrender your ADSs and receive the underlying securities, except in order to comply with mandatory provisions of applicable law.
The depositary may, and shall at our written direction, terminate the deposit agreement and the ADRs by mailing notice of such termination to the registered holders of ADRs at least 30 days prior to the date fixed in such notice for such termination; provided, however, if the depositary shall have (1) resigned as depositary under the deposit agreement, notice of such termination by the depositary shall not be provided to registered holders unless a successor depositary shall not be operating under the deposit agreement within 60 days of the date of such resignation, and (2) been removed as depositary under the deposit agreement, notice of such termination by the depositary shall not be provided to registered holders of ADRs unless a successor depositary shall not be operating under the deposit agreement on the 60th day after our notice of removal was first provided to the depositary. After termination, the depositary’s only responsibility will be (1) to deliver deposited securities to ADR holders who surrender their ADRs, and (2) to hold or sell distributions received on deposited securities. As soon as practicable after the expiration of six months from the termination date, the depositary will sell the deposited securities which remain and hold the net proceeds of such sales (as long as it may lawfully do so), without liability for interest, in trust for the ADR holders who have not yet surrendered their ADRs. After making such sale, the depositary shall have no obligations except to account for such proceeds and other cash.
Limitations on Obligations and Liability to ADR Holders
Prior to the issue, registration, registration of transfer, split-up, combination, or cancellation of any ADRs, or the delivery of any distribution in respect thereof, and from time to time, we or the depositary or the custodian may require:
| • | payment with respect thereto of (i) any stock transfer or other tax or other governmental charge, (ii) any stock transfer or registration fees in effect for the registration of transfers of common shares or other deposited securities upon any applicable register and (iii) any applicable fees and expenses described in the deposit agreement; |
178
Table of Contents
| • | the production of proof satisfactory to it of (i) the identity of any signatory and genuineness of any signature and (ii) such other information, including without limitation, information as to citizenship, residence, exchange control approval, beneficial ownership of any securities, compliance with applicable law, regulations, provisions of or governing deposited securities and terms of the deposit agreement and the ADRs, as it may deem necessary or proper; and |
| • | compliance with such regulations as the depositary may establish consistent with the deposit agreement. |
The issuance of ADRs, the acceptance of deposits of common shares, the registration, registration of transfer, split-up or combination of ADRs or the withdrawal of common shares, may be suspended, generally or in particular instances, when the ADR register or any register for deposited securities is closed or when any such action is deemed advisable by the depositary or when reasonably requested by us in order to enable us to comply with applicable law; provided that the ability to withdraw common shares may only be limited under the following circumstances: (i) temporary delays caused by closing transfer books of the depositary or our transfer books or the deposit of common shares in connection with voting at a shareholders’ meeting, or the payment of dividends, (ii) the payment of fees, taxes, and similar charges, and (iii) compliance with any laws or governmental regulations relating to ADRs or to the withdrawal of deposited securities.
The deposit agreement expressly limits the obligations and liability of the depositary, ourselves and our respective agents. Neither we nor the depositary nor any such agent will be liable if:
| • | any present or future law, rule, regulation, fiat, order or decree of the United States, Peru or any other country, or of any governmental or regulatory authority or securities exchange or market or automated quotation system, the provisions of or governing any deposited securities, any present or future provision of our charter, any act of God, war, terrorism or other circumstance beyond our, the depositary’s or our respective agents’ control shall prevent or delay, or shall cause any of them to be subject to any civil or criminal penalty in connection with, any act which the deposit agreement or the ADRs provide shall be done or performed by us, the depositary or our respective agents (including, without limitation, voting); |
| • | it exercises or fails to exercise discretion under the deposit agreement or the ADRs issued thereunder; |
| • | it performs its obligations under the deposit agreement and ADRs issued thereunder without gross negligence or bad faith; |
| • | it takes any action or refrains from taking any action in reliance upon the advice of or information from legal counsel, accountants, any person presenting common shares for deposit, any registered holder of ADRs, or any other person believed by it to be competent to give such advice or information; or |
| • | it relies upon any written notice, request, direction or other document believed by it to be genuine and to have been signed or presented by the proper party or parties. |
Neither the depositary nor its agents have any obligation to appear in, prosecute or defend any action, suit or other proceeding in respect of any deposited securities or the ADRs. We and our agents shall only be obligated to appear in, prosecute or defend any action, suit or other proceeding in respect of any deposited securities or the ADRs, which in our opinion may involve us in expense or liability, if indemnity satisfactory to us against all expense (including fees and disbursements of counsel) and liability is furnished as often as may be required. The depositary and its agents may fully respond to any and all demands or requests for information maintained by or on its behalf in connection with the deposit agreement, any registered holder or holders of ADRs, any ADRs or otherwise related to the deposit agreement or ADRs to the extent such information is requested or required by or pursuant to any lawful authority, including, without limitation, laws, rules, regulations, administrative or judicial processes, banking, securities or other regulators. The depositary shall not be liable for the acts or omissions made by any securities depository, clearing agency or settlement system in connection with or arising out of book-entry settlement of deposited securities or otherwise. Furthermore, the depositary shall not be responsible for, and shall incur no liability in connection with or arising from, the insolvency of any custodian that is not a branch or affiliate of [—]. The depositary and the custodian may use third party delivery services and providers of information
179
Table of Contents
regarding matters such as pricing, proxy voting, corporate actions, class action litigation and other services in connection with the ADRs and the deposit agreement, and use local agents to provide extraordinary services such as attendance at annual meetings of issuers of securities.
The depositary shall be under no obligation to inform holders of ADSs regarding the requirements of Peruvian law, rules or regulations or any changes therein or thereunder.
Additionally, none of us, the depositary or the custodian will be liable for the failure by any registered holder of ADRs or beneficial owner therein to obtain the benefits of credits on the basis of non-U.S. tax paid against such holder’s or beneficial owner’s income tax liability. Neither we nor the depositary shall incur any liability for any tax consequences that may be incurred by holders or beneficial owners on account of their ownership of ADRs or ADSs.
Neither the depositary nor its agents will be responsible for any failure to carry out any instructions to vote any of the deposited securities, for the manner in which any such vote is cast or for the effect of any such vote. None of us, the depositary, or our agents shall be liable to registered holders of ADRs or beneficial owners of interests in ADSs for any indirect, special, punitive or consequential damages (including, without limitation, lost profits) of any form incurred by any person or entity, whether or not foreseeable and regardless of the type of action in which such a claim may be brought.
In the deposit agreement each party thereto (including, for avoidance of doubt, each holder and beneficial owner and/or holder of interests in ADRs) irrevocably waives, to the fullest extent permitted by applicable law, any right it may have to a trial by jury in any suit, action or proceeding against the depositary and/or us directly or indirectly arising out of or relating to the common shares or other deposited securities, the ADSs or the ADRs, the deposit agreement or any transaction contemplated therein, or the breach thereof (whether based on contract, tort, or common law or any other theory).
The depositary may own and deal in any class of our securities and in ADSs.
Disclosure of Interest in ADSs
To the extent that the provisions of, or governing, any deposited securities may require disclosure of or impose limits on beneficial or other ownership of deposited securities, other common shares and other securities and may provide for blocking transfer, voting or other rights to enforce such disclosure or limits, you agree to comply with all such disclosure requirements and ownership limitations and to comply with any reasonable instructions we may provide in respect thereof. We reserve the right to instruct you to deliver your ADSs for cancellation and withdrawal of the deposited securities so as to permit us to deal with you directly as a holder of common shares and, by holding an ADS or an interest therein, you will be agreeing to comply with such instructions.
Books of Depositary
The depositary or its agent will maintain a register for the registration, registration of transfer, combination and split-up of ADRs, which register shall include the depositary’s direct registration system. Registered holders of ADRs may inspect such records at the depositary’s office at all reasonable times, but solely for the purpose of communicating with other holders in the interest of the business of our company or a matter relating to the deposit agreement. Such register may be closed from time to time, when deemed expedient by the depositary.
The depositary will maintain facilities for the delivery and receipt of ADRs.
Pre-release of ADSs
In its capacity as depositary, the depositary shall not lend common shares or ADSs; provided, however, that the depositary may (i) issue ADSs prior to the receipt of common shares and (ii) deliver common shares prior to the receipt of ADSs for withdrawal of deposited securities, including ADSs which were issued under (i) above but for which common shares may not have been received (each such transaction a “pre-release”). The depositary may
180
Table of Contents
receive ADSs in lieu of common shares under (i) above (which ADSs will promptly be canceled by the depositary upon receipt by the depositary) and receive common shares in lieu of ADSs under (ii) above. Each such pre-release will be subject to a written agreement whereby the person or entity (the “applicant”) to whom ADSs or common shares are to be delivered (1) represents that at the time of the pre-release the applicant or its customer owns the common shares or ADSs that are to be delivered by the applicant under such pre-release, (2) agrees to indicate the depositary as owner of such common shares or ADSs in its records and to hold such common shares or ADSs in trust for the depositary until such common shares or ADSs are delivered to the depositary or the custodian, (3) unconditionally guarantees to deliver to the depositary or the custodian, as applicable, such common shares or ADSs, and (4) agrees to any additional restrictions or requirements that the depositary deems appropriate. Each such pre-release will be at all times fully collateralized with cash, U.S. government securities or such other collateral as the depositary deems appropriate, terminable by the depositary on not more than five business days’ notice and subject to such further indemnities and credit regulations as the depositary deems appropriate. The depositary will normally limit the number of ADSs and common shares involved in such pre-release at any one time to 30% of the ADSs outstanding (without giving effect to ADSs outstanding under (i) above), provided, however, that the depositary reserves the right to change or disregard such limit from time to time as it deems appropriate. The depositary may also set limits with respect to the number of ADSs and common shares involved in pre-release with any one person on a case-by-case basis as it deems appropriate. The depositary may retain for its own account any compensation received by it in conjunction with the foregoing. Collateral provided in connection with pre-release transactions, but not the earnings thereon, shall be held for the benefit of the registered holders of ADRs (other than the applicant).
Appointment
In the deposit agreement, each registered holder of ADRs and each person holding an interest in ADSs, upon acceptance of any ADSs (or any interest therein) issued in accordance with the terms and conditions of the deposit agreement will be deemed for all purposes to:
| • | be a party to and bound by the terms of the deposit agreement and the applicable ADR or ADRs; and |
| • | appoint the depositary as its attorney-in-fact, with full power to delegate, to act on its behalf and to take any and all actions contemplated in the deposit agreement and the applicable ADR or ADRs, to adopt any and all procedures necessary to comply with applicable laws and to take such action as the depositary in its sole discretion may deem necessary or appropriate to carry out the purposes of the deposit agreement and the applicable ADR and ADRs, the taking of such actions to be the conclusive determinant of the necessity and appropriateness thereof. |
Governing Law
The deposit agreement and the ADRs will be governed by and construed in accordance with the laws of the State of New York. In the deposit agreement, we have submitted to the jurisdiction of the courts of the State of New York and appointed an agent for service of process on our behalf.
181
Table of Contents
Peruvian Tax Considerations
The following is a general summary of material Peruvian tax matters under Peruvian law, as in effect on the date of this prospectus and describes the principal tax consequences of ownership of ADSs by non-resident individuals or entities (“Non-Peruvian Holders”). Legislative, judicial or administrative changes or interpretations may, however, be forthcoming. Any such changes or interpretations could affect the tax consequences to holders of ADSs and could alter or modify the conclusions set forth herein. This summary does not purport to be a legal opinion nor is it intended to be a comprehensive description of all of the tax considerations that may be relevant to a decision to make an investment in the ADSs. In addition, it does not describe any tax consequences arising under the laws of any taxing jurisdiction other than Peru or applicable to an individual or entity resident of Peru or to a person with a permanent establishment in Peru.
For purposes of Peruvian taxation:
| • | individuals are residents of Peru, if they are Peruvian nationals who have established their place of residence in Peru or if they are foreign nationals with a permanence of 183 days in Peru in any 12-month period (in the latter case, the condition of Peruvian resident can only be acquired as of the 1st of January of the year following the fulfillment of residence conditions); and |
| • | legal entities are residents of Peru if they are established or incorporated in Peru. |
Cash Dividends and Other Distributions
Cash dividends paid to Non-Peruvian Holders with respect to common shares and amounts distributed with respect to ADSs are currently subject to Peruvian withholding income tax at a rate of 4.1%. As a general rule, the distribution of additional common shares representing profits, the distribution of shares which differ from the distribution of earnings or profits, as well as the distribution of preemptive rights with respect to common shares, which are carried out as part of a pro rata distribution to all shareholders, will not be subject to Peruvian income tax or withholding taxes.
Capital Gains
Pursuant to Article 6 of the Peruvian income tax law, individuals and entities resident in Peru are subject to Peruvian income tax on their worldwide income while Non-Peruvian Holders are subject to Peruvian income tax only on their Peruvian source income.
Peruvian income tax law provides that income derived from the disposal of securities issued by Peruvian entities is considered Peruvian source income and is therefore subject to income tax. Under current Peruvian income tax law, capital gains resulting from the disposal of ADRs that represent shares issued by Peruvian entities are considered Peruvian source income and therefore are subject to Peruvian income tax. Peruvian income tax law also provides that the taxable income resulting from the disposal of securities is equal to the difference between the sale price of the securities (which may not be less than their fair market value) and their tax basis.
Notwithstanding the foregoing, capital gains resulting from the disposal of ADSs or beneficial interest in ADSs that represent shares issued by a Peruvian entity are not considered Peruvian source income, and therefore are not subject to Peruvian income tax.
In the event ADSs are exchanged into common shares and such common shares are disposed of, capital gains resulting therefrom will be subject to an income tax rate of either 5% or 30%, depending on where the transaction takes place. If the transaction is consummated in Peru, any capital gain will be subject to an income tax rate of 5%; and if the transaction is consummated outside of Peru, any capital gain will be subject to a 30% income tax rate. Peruvian income tax law regulations have stated with respect to the transfer of common shares that transactions are deemed to be consummated in Peru if the common shares are transferred through the Lima Stock Exchange. Any gain resulting from the conversion of ADSs into common shares or common shares into ADSs will not be subject to taxation in Peru.
182
Table of Contents
Any Non-Peruvian Holder who acquires common shares will have the following tax basis: (i) for common shares purchased by the transferor, the acquisition price paid for the shares; (ii) for common shares received by the transferor as a result of a share capital increase because of a capitalization of net profits, the par value of such common shares; (iii) for other common shares received free of any payment, tax basis will be: (x) zero or the cost borne by the transferor, in the case of individuals and (y) the fair market value at the time of the acquisition, in the case of entities, and (iv) for common shares of the same type acquired at different opportunities and at different values, the tax basis will be the weighted average cost. In cases where common shares are sold by Non-Peruvian Holders outside the Lima Stock Exchange, the tax basis must be certified by the Peruvian tax administration prior to the time payment is made to the transferor; otherwise it would not be possible to deduct the tax basis and the 30% Peruvian income tax would apply to the total sale price. Under Peruvian income tax law, tax basis certification is granted by the Peruvian tax authorities within 30 business days after the filing of the corresponding application. If the Peruvian tax authorities do not respond within such 30 day period, the tax basis calculation presented for approval by the transferor is deemed automatically approved.
In any transaction relating to Peruvian securities through the Lima Stock Exchange, CAVALI (the Peruvian clearing house) will act as withholding agent of the Peruvian income tax. If the purchaser is resident in Peru and the sale is not performed through the Lima Stock Exchange, the purchaser will act as withholding agent. In other cases, the transferor shall be obliged to self-assess the tax and pay it to the Peruvian tax authorities within the first 12 business days of the month following the transfer.
Other Considerations
No Peruvian estate or gift taxes are imposed on the gratuitous transfer of ADSs or common shares. No stamp, transfer or similar tax applies to any transfer of common shares, except for commissions payable by seller and buyer to the Lima Stock Exchange (0.15% of value sold), fees payable to the Peruvian Securities Commission (0.1% of value sold), brokers’ fees (about 0.05% to 0.50% of value sold) and value added tax (at the rate of 18%) on commissions and fees. Any investor who sells its common shares on the Lima Stock Exchange will incur these fees and taxes upon purchase and sale of the common shares.
United States Federal Income Tax Considerations
The following summary describes certain United States federal income tax consequences to a United States Holder (as defined below) of the purchase, ownership and disposition of our common shares and ADSs as of the date hereof. Except where noted, this summary deals only with common shares and ADSs held as capital assets (generally, property held for investment). As used herein, the term “United States Holder” means a beneficial owner of common shares or ADSs that is for United States federal income tax purposes:
| • | an individual citizen or resident of the United States; |
| • | a corporation (or other entity treated as a corporation for United States federal income tax purposes) created or organized in or under the laws of the United States, any state thereof or the District of Columbia; |
| • | an estate the income of which is subject to United States federal income taxation regardless of its source; or |
| • | a trust if it (1) is subject to the primary supervision of a court within the United States and one or more United States persons have the authority to control all substantial decisions of the trust, or (2) has a valid election in effect under applicable United States Treasury regulations to be treated as a United States person. |
183
Table of Contents
This summary does not represent a detailed description of the United States federal income tax consequences applicable to you if you are subject to special treatment under the United States federal income tax laws, including if you are:
| • | a dealer in securities or currencies; |
| • | a financial institution; |
| • | a regulated investment company; |
| • | a real estate investment trust; |
| • | an insurance company; |
| • | a tax-exempt organization; |
| • | a person holding our common shares or ADSs as part of a hedging, integrated or conversion transaction, a constructive sale or a straddle; |
| • | a trader in securities that has elected the mark-to-market method of accounting for your securities; |
| • | a person liable for alternative minimum tax; |
| • | a person who owns or is deemed to own 10% or more of our voting stock; |
| • | a partnership or other pass-through entity for United States federal income tax purposes; or |
| • | a person whose “functional currency” is not the U.S. dollar. |
The discussion below is based upon the provisions of the Internal Revenue Code of 1986, as amended (the “Code”), and regulations, rulings and judicial decisions thereunder as of the date hereof, and such authorities may be replaced, revoked or modified so as to result in United States federal income tax consequences different from those discussed below. There is currently no income tax treaty between the United States and Peru that would provide for United States federal income tax consequences different than the consequences under the foregoing authorities. In addition, this summary is based, in part, upon representations made by the depositary to us and assumes that the deposit agreement, and all other related agreements, will be performed in accordance with their terms.
If a partnership (or other entity treated as a partnership for United States federal income tax purposes) holds our common shares or ADSs, the tax treatment of a partner in the partnership will generally depend upon the status of the partner and the activities of the partnership. If you are a partner of a partnership holding our common shares or ADSs, you should consult your tax advisors.
This summary does not contain a detailed description of all the United States federal income tax consequences to you in light of your particular circumstances and does not address the effects of any state, local or non-United States tax laws. If you are considering the purchase, ownership or disposition of our common shares or ADSs, you should consult your own tax advisors concerning the United States federal income tax consequences to you in light of your particular situation as well as any consequences arising under the laws of any other taxing jurisdiction.
ADSs
If you hold ADSs, for United States federal income tax purposes, you generally will be treated as the owner of the underlying common shares that are represented by such ADSs. Accordingly, deposits or withdrawals of common shares for ADSs will not be subject to United States federal income tax.
Taxation of Dividends
The gross amount of distributions, other than certain pro rata distributions of common shares, on the ADSs or common shares (including amounts withheld to reflect Peruvian withholding taxes) will be taxable as dividends, to the extent paid out of our current or accumulated earnings and profits, as determined under United States federal income tax principles.
184
Table of Contents
To the extent that the amount of any distribution (including amounts withheld to reflect Peruvian withholding taxes) exceeds our current and accumulated earnings and profits for a taxable year, as determined under United States federal income tax principles, the distribution will first be treated as a tax-free return of capital, causing a reduction in the adjusted basis of the ADSs or common shares, and the balance in excess of adjusted basis will be taxed as capital gain recognized on a sale or exchange. However, we do not expect to keep earnings and profits in accordance with United States federal income tax principles. Therefore, you should expect that a distribution will generally be treated as a dividend. Such dividends (including any withheld taxes) will be includable in your gross income as ordinary income on the day actually or constructively received by you, in the case of the common shares, or by the depositary, in the case of ADSs. Such dividends will not be eligible for the dividends received deduction allowed to corporations under the Code.
With respect to non-corporate United States Holders, certain dividends received from a qualified foreign corporation may be subject to reduced rates of taxation. A non-United States corporation is treated as a qualified foreign corporation with respect to dividends received from that corporation on common shares (or ADSs backed by such shares) that are readily tradable on an established securities market in the United States. United States Treasury Department guidance indicates that upon the listing of our ADSs on the NYSE, our ADSs will be considered readily tradable on an established securities market in the United States. Based on existing guidance, it is not entirely clear whether our common shares will be considered readily tradable on an established securities market in the United States because only the ADSs, not the underlying common shares, will be listed on a securities market in the United States. We believe that dividends we pay on our common shares that are represented by ADSs, but not our common shares that are not so represented, will meet such conditions required for the reduced tax rates. There can be no assurance that our ADSs will be considered readily tradable on an established securities market in later years. Non-corporate United States Holders that do not meet a minimum holding period requirement during which they are not protected from the risk of loss or that elect to treat the dividend income as “investment income” pursuant to Section 163(d)(4) of the Code will not be eligible for the reduced rates of taxation regardless of our status as a qualified foreign corporation. In addition, the rate reduction will not apply to dividends if the recipient of a dividend is obligated to make related payments with respect to positions in substantially similar or related property. This disallowance applies even if the minimum holding period has been met. You should consult your own tax advisors regarding the application of these rules given your particular circumstances.
The amount of any dividend paid in nuevos soles will equal the U.S. dollar value of the nuevos soles received, calculated by reference to the exchange rate in effect on the date the dividend is actually or constructively received by you, in the case of the common shares, or by the depositary, in the case of ADSs, regardless of whether the nuevos soles are converted into U.S. dollars at that time. If the nuevos soles received as a dividend are converted into U.S. dollars on the date they are received, you generally will not be required to recognize foreign currency gain or loss in respect of the dividend income. If the nuevos soles received as a dividend are not converted into U.S. dollars on the date of receipt, you will have a tax basis in the nuevos soles equal to their U.S. dollar value on the date of receipt. Any gain or loss realized on a subsequent conversion or other disposition of the nuevos soles will be treated as United States source ordinary income or loss.
Subject to certain conditions and limitations, Peruvian withholding taxes on dividends may be treated as foreign taxes eligible for credit against your United States federal income tax liability. For purposes of calculating the foreign tax credit, dividends paid on the ADSs or common shares will be treated as foreign source income and will generally constitute passive category income. However, in certain circumstances, if you have held the ADSs or common shares for less than a specified minimum period during which you are not protected from risk of loss, or are obligated to make payments related to the dividends, you will not be allowed a foreign tax credit for any Peruvian withholding taxes imposed on dividends paid on the ADSs or common shares. If you do not elect to claim a United States foreign tax credit, you may instead claim a deduction for Peruvian income tax withheld, but only for a taxable year in which you elect to do so with respect to all foreign income taxes paid or accrued in such taxable year. The rules governing the foreign tax credit are complex. You are urged to consult your tax advisors regarding the availability of the foreign tax credit under your particular circumstances.
185
Table of Contents
Taxation of Capital Gains
For United States federal income tax purposes, you will recognize taxable gain or loss on any sale or exchange of ADSs or common shares in an amount equal to the difference between the amount realized for the ADSs or common shares and your tax basis in the ADSs or common shares, in each case as determined in U.S. dollars. Such gain or loss will generally be capital gain or loss. Capital gains of non-corporate United States Holders derived with respect to capital assets held for more than one year are eligible for reduced rates of taxation. The deductibility of capital losses is subject to limitations.
If a Peruvian income tax is withheld on the sale or other disposition of our ADSs or common shares, your amount realized will include the gross amount of the proceeds of that sale or other disposition before deduction of the Peruvian income tax. See “Peruvian Tax Considerations—Capital Gains” for a description of when a sale or other disposition of our ADSs or common shares may be subject to taxation by Peru. Any gain or loss recognized by you will generally be treated as United States source gain or loss for foreign tax credit purposes. Consequently, in the case of gain from the disposition of ADSs or common shares that is subject to Peruvian income tax, you may not be able to benefit from the foreign tax credit for that Peruvian income tax (i.e., because the gain from the disposition would be United States source), unless you can apply the credit (subject to applicable limitations) against United States federal income tax payable on other income from foreign sources. Alternatively, you may take a deduction for the Peruvian income tax if you do not take a credit for any foreign taxes paid or accrued during the taxable year. You are urged to consult your tax advisors regarding the tax consequences if Peruvian income tax is imposed on a disposition of ADSs or common shares, including the availability of the foreign tax credit under your particular circumstances.
Passive Foreign Investment Company
We do not believe that we are, for United States federal income tax purposes, a passive foreign investment company (a “PFIC”), and we expect to operate in such a manner so as not to become a PFIC. If, however, we are or become a PFIC, you could be subject to additional United States federal income taxes on gain recognized with respect to the ADSs or common shares and on certain distributions, plus an interest charge on certain taxes treated as having been deferred under the PFIC rules. Non-corporate United States Holders will not be eligible for reduced rates of taxation on any dividends received from us (as discussed above under “—Taxation of Dividends”) if we are a PFIC in the taxable year in which such dividends are paid or in the preceding taxable year.
Information Reporting and Backup Withholding
In general, information reporting will apply to dividends in respect of our ADSs or common shares and the proceeds from the sale, exchange or redemption of our ADSs or common shares that are paid to you within the United States (and in certain cases, outside the United States), unless you are an exempt recipient. Backup withholding may apply to such payments if you fail to provide a taxpayer identification number or certification of other exempt status or fail to report in full dividend and interest income.
Any amounts withheld under the backup withholding rules will be allowed as a refund or a credit against your United States federal income tax liability provided the required information is furnished to the Internal Revenue Service in a timely manner.
The above description is not intended to constitute a complete analysis of all tax consequences relating to the acquisition, ownership or disposition of our ADSs or common shares. You should consult your own tax advisors concerning the overall tax consequences to you, including the consequences under laws other than United States federal income tax laws, of an investment in our ADSs or common shares.
186
Table of Contents
Under the terms and subject to the conditions contained in an underwriting agreement dated , 2013, we have agreed to sell to the underwriters named below, for whom Credit Suisse Securities (USA) LLC, J.P. Morgan Securities LLC and Morgan Stanley & Co. LLC are acting as representatives, and the underwriters have agreed to purchase, at a public offering price less the underwriting discounts and commissions set forth on the cover page of this prospectus, the following respective numbers of ADSs:
Underwriter | Number of ADSs | |
Credit Suisse Securities (USA) LLC | ||
J.P. Morgan Securities LLC | ||
Morgan Stanley & Co. LLC | ||
| ||
Total | ||
|
The underwriting agreement provides that the underwriters are obligated to purchase all the ADSs in the offering if any are purchased, other than those ADSs covered by the over-allotment option to purchase additional ADSs described below. The underwriting agreement also provides that if an underwriter defaults, the purchase commitments of non-defaulting underwriters may be increased or the offering may be terminated.
All sales of the ADSs in the United States will be made by U.S. registered broker/dealers.
We have granted to the underwriters a 30-day option to purchase on a pro rata basis up to additional ADSs from us at the initial public offering price less the underwriting discounts and commissions. The option may be exercised only to cover any over-allotments of ADSs.
The underwriters propose to offer the ADSs initially at the public offering price on the cover page of this prospectus and to selling group members at that price less a selling concession of US$ per ADS. The underwriters and selling group members may allow a discount of US$ per ADS on sales to other broker/dealers. After the initial public offering, the representatives may change the public offering price and concession and discount to broker/dealers.
The following table summarizes the compensation we will pay to the underwriters:
| Per ADS | Total | |||||||||||||||
| Without Exercise of Over- allotment Option | With Exercise of Over- allotment Option | Without Exercise of Over- allotment Option | With Exercise of Over- allotment Option | |||||||||||||
Underwriting discounts and commissions | US$ | US$ | US$ | US$ | ||||||||||||
The representatives have informed us that the underwriters do not expect sales to accounts over which the underwriters have discretionary authority to exceed 5% of the ADSs being offered.
We estimate that the total expenses of this offering, including registration, filing and listing fees, printing fees, legal and accounting expenses, but excluding underwriting discounts and commissions, will be approximately US$[—]. See “Expenses of the Offering.”
In addition, we have agreed to reimburse the underwriters for road show expenses of the underwriters, other accountable expenses of the underwriters payable by us and legal fees for qualifying the securities with the Financial Industry Regulatory Authority, which expenses and fees do not exceed US$[—].
187
Table of Contents
We have agreed that we will not offer, sell, issue, contract to sell, pledge, or otherwise dispose of, directly or indirectly, or file with the SEC a registration statement under the Securities Act, relating to, any of our ADSs, common shares or securities convertible into or exchangeable or exercisable for, or that represent the right to receive, our ADSs or common shares, or enter into any swap, hedge or other arrangement that transfers to another, in whole or in part, any of the economic consequences of ownership of our ADSs or common shares, or publicly disclose that we will or may enter into any transaction described above, without the prior written consent of the representatives of the underwriters for a period of 180 days after the date of this prospectus, whether any transaction described above is to be settled by delivery of ADSs, common shares or such other securities, in cash or otherwise, except for issuances pursuant to the sale of ADSs or common shares to the underwriters. However, in the event that either (1) during the last 17 days of the “lock-up” period, we release earnings results or material news or a material event relating to us occurs or (2) prior to the expiration of the “lock-up” period, we announce that we will release earnings results during the 16-day period beginning on the last day of the “lock-up” period, then in either case the expiration of the “lock-up” will be extended until the expiration of the 18-day period beginning on the date of the release of the earnings results or the occurrence of the material news or event, as applicable, unless the representatives of the underwriters waive, in writing, such an extension.
Our directors and officers and certain of our other shareholders have agreed that they will not offer, sell, contract to sell, pledge or otherwise transfer or dispose of, directly or indirectly, any of our ADSs, common shares or securities convertible into or exchangeable or exercisable for, or that represent the right to receive, ADSs or common shares, enter into any transaction which would have the same effect, or enter into any swap, hedge or other arrangement that transfers to another, in whole or in part, any of the economic consequences of ownership of our ADSs or common shares, or publicly disclose the intention to enter into any transaction described above, without the prior written consent of the representatives of the underwriters for a period of 180 days after the date of this prospectus, whether any transaction described above is to be settled by delivery of ADSs, common shares or such other securities, in cash or otherwise. However, in the event that either (1) during the last 17 days of the “lock-up” period, we release earnings results or material news or a material event relating to us occurs or (2) prior to the expiration of the “lock-up” period, we announce that we will release earnings results during the 16-day period beginning on the last day of the “lock-up” period, then in either case the expiration of the “lock-up” will be extended until the expiration of the 18-day period beginning on the date of the release of the earnings results or the occurrence of the material news or event, as applicable, unless the representatives of the underwriters waive, in writing, such an extension.
The representatives, in their sole discretion, may release the ADSs and other securities subject to the lock-up agreements described above in whole or in part at any time with or without notice.
We have agreed to indemnify the underwriters against liabilities under the Securities Act, or contribute to payments that the underwriters may be required to make in that respect.
We have applied to have our ADSs approved for listing on the New York Stock Exchange under the symbol “[GRAM]”. Our common shares are listed on the Lima Stock Exchange under the symbol “GRAMONC1”.
In connection with the offering, the underwriters may engage in stabilizing transactions, over-allotment transactions, syndicate covering transactions and penalty bids in accordance with Regulation M under the Exchange Act.
| • | Stabilizing transactions permit bids to purchase the underlying security so long as the stabilizing bids do not exceed a specified maximum. |
| • | Over-allotment involves sales by the underwriters of ADSs in excess of the number of ADSs the underwriters are obligated to purchase, which creates a syndicate short position. The short position may be either a covered short position or a naked short position. In a covered short position, the number of ADSs over-allotted by the underwriters is not greater than the number of ADSs that they may purchase in the over-allotment option. In a naked short position, the number of ADSs involved is greater than the number of ADSs in the over-allotment option. The underwriters may close out any covered short position by either exercising their over-allotment option and/or purchasing ADSs in the open market. |
188
Table of Contents
| • | Syndicate covering transactions involve purchases of the ADSs in the open market after the distribution has been completed in order to cover syndicate short positions. In determining the source of ADSs to close out the short position, the underwriters will consider, among other things, the price of ADSs available for purchase in the open market as compared to the price at which they may purchase ADSs through the over-allotment option. If the underwriters sell more ADSs than could be covered by the over-allotment option, a naked short position, the position can only be closed out by buying ADSs in the open market. A naked short position is more likely to be created if the underwriters are concerned that there could be downward pressure on the price of the ADSs in the open market after pricing that could adversely affect investors who purchase in the offering. |
| • | Penalty bids permit the representatives to reclaim a selling concession from a syndicate member when the ADSs originally sold by the syndicate member is purchased in a stabilizing or syndicate covering transaction to cover syndicate short positions. |
These stabilizing transactions, syndicate covering transactions and penalty bids may have the effect of raising or maintaining the market price of our ADSs or preventing or retarding a decline in the market price of the ADSs. As a result the price of our ADSs may be higher than the price that might otherwise exist in the open market. These transactions may be effected on the NYSE or otherwise and, if commenced, may be discontinued at any time.
The underwriters and/or their affiliates may enter into derivative transactions with clients, at their request, in connection with the ADSs. The underwriters and/or their affiliates may also purchase some of the ADSs to hedge their risk exposure in connection with such transactions. These transactions may have an effect on demand, price or other terms of the offering.
The underwriters and/or their respective affiliates have provided, currently provide or may provide in the future various investment banking, commercial banking, financial advisory and/or similar services to us on a regular basis, and maintain normal business relationships with us in their capacity as credit institutions or as lenders under credit facilities, for which they have received and may continue to receive customary fees and commissions.
A prospectus in electronic format may be made available on the web sites maintained by one or more of the underwriters, or selling group members, if any, participating in this offering and one or more of the underwriters participating in this offering may distribute prospectuses electronically. The representatives may agree to allocate a number of ADSs to underwriters and selling group members for sale to their online brokerage account holders. Internet distributions will be allocated by the underwriters and selling group members that will make internet distributions on the same basis as other allocations.
Selling Restrictions
Argentina
This prospectus has not been registered with the Comisión Nacional de Valores and may not be offered publicly in Argentina. The prospectus may not be publicly distributed in Argentina. Neither we nor the underwriters will solicit the public in Argentina in connection with this prospectus.
Australia
This prospectus is not a formal disclosure document and has not been, nor will be, lodged with the Australian Securities and Investments Commission. It does not purport to contain all information that an investor or their professional advisers would expect to find in a prospectus or other disclosure document (as defined in the Corporations Act 2001 (Australia)) for the purposes of Part 6D.2 of the Corporations Act 2001 (Australia) or in a product disclosure statement for the purposes of Part 7.9 of the Corporations Act 2001 (Australia), in either case, in relation to the securities.
The securities are not being offered in Australia to “retail clients” as defined in sections 761G and 761GA of the Corporations Act 2001 (Australia). This offering is being made in Australia solely to “wholesale clients” for the purposes of section 761G of the Corporations Act 2001 (Australia) and, as such, no prospectus, product disclosure statement or other disclosure document in relation to the securities has been, or will be, prepared.
189
Table of Contents
This prospectus does not constitute an offer in Australia other than to persons who do not require disclosure under Part 6D.2 of the Corporations Act 2001 (Australia) and who are wholesale clients for the purposes of section 761G of the Corporations Act 2001 (Australia). By submitting an application for our securities, you represent and warrant to us that you are a person who does not require disclosure under Part 6D.2 and who is a wholesale client for the purposes of section 761G of the Corporations Act 2001 (Australia). If any recipient of this prospectus is not a wholesale client, no offer of, or invitation to apply for, our securities shall be deemed to be made to such recipient and no applications for our securities will be accepted from such recipient. Any offer to a recipient in Australia, and any agreement arising from acceptance of such offer, is personal and may only be accepted by the recipient. In addition, by applying for our securities you undertake to us that, for a period of 12 months from the date of issue of the securities, you will not transfer any interest in the securities to any person in Australia other than to a person who does not require disclosure under Part 6D.2 and who is a wholesale client.
Brazil
The offer of ADSs described in this prospectus will not be carried out by any means that would constitute a public offering in Brazil under Law No. 6,385, of December 7, 1976, as amended, and under CVM Rule (Instrução) No. 400, of December 29, 2003, as amended. The offer and sale of the ADSs have not been and will not be registered with the Comissão de Valores Móbilearios in Brazil. The ADSs have not been offered or sold, and will not be offered or sold in Brazil, except in circumstances that do not constitute a public offering or distribution under Brazilian laws and regulations.
Chile
The offer of the ADSs begins on [—], 2013, and is governed by the General Rule (Norma de Carácter General) 336 of June 27, 2012, issued by the Chilean Superintendency of Securities and Insurance (‘‘SVS’’). The offer relates to securities not registered with the Securities Registry or the Registry of Foreign Securities of the SVS, so the ADSs are not subject to the oversight of the SVS. Since the ADSs are unregistered securities in Chile, we have no obligation to deliver in Chile public information regarding the ADSs. The ADSs may not be sold in a public offering in Chile unless they are registered in the Securities Registry or the Registry of Foreign Securities of the SVS.
La oferta de los valores comienza el [—] de 2013 y está acogida a la Norma de Carácter General 336 de fecha 27 de junio de 2012 de la Superintendencia de Valores y Seguros de Chile. La oferta versa sobre valores no inscritos en el Registro de Valores o en el Registro de Valores Extranjeros que lleva la SVS, por lo que los valores no están sujetos a la fiscalización de dicho organismo. Por tratarse de valores no inscritos, no existe obligación por parte del emisor de entregar en Chile información pública respecto de los valores. Estos valores no pueden ser objeto de oferta pública a menos que sean inscritos en el Registro de Valores correspondiente.
Colombia
The ADSs have not been and will not be offered in Colombia through a public offering of securities pursuant to Colombian laws and regulations, nor will they be registered in the Colombian National Registry of Securities and Issuers or listed on a regulated securities trading system such as the Colombian Stock Exchange.
Dubai International Financial Center
This prospectus relates to an Exempt Offer in accordance with the Offered Securities Rules of the Dubai Financial Services Authority (“DFSA”). This prospectus is intended for distribution only to persons of a type specified in the Offered Securities Rules of the DFSA. It must not be delivered to, or relied on by, any other person. The DFSA has no responsibility for reviewing or verifying any documents in connection with Exempt Offers. The DFSA has not approved this prospectus nor taken steps to verify the information set forth herein and has no responsibility for the prospectus. The ADSs to which this prospectus relates may be illiquid and/or subject to
190
Table of Contents
restrictions on their resale. Prospective purchasers of the ADSs offered should conduct their own due diligence on the ADSs. If you do not understand the contents of this prospectus you should consult an authorized financial advisor.
European Economic Area
In relation to each Member State of the European Economic Area which has implemented the Prospectus Directive (each, a “Relevant Member State”) an offer of securities described in this prospectus may not be made to the public in that Relevant Member State, except that an offer to the public in that Relevant Member State of any such securities may be made at any time under the following exemptions under the Prospectus Directive, if they have been implemented in that Relevant Member State:
| • | to any legal entity which is a qualified investor as defined in the Prospectus Directive; |
| • | to fewer than 100 or, if the Relevant Member State has implemented the relevant provision of the 2010 PD Amending Directive, 150, natural or legal persons (other than qualified investors as defined in the Prospectus Directive), as permitted under the Prospectus Directive, subject to obtaining the prior consent of the representatives for any such offer; or |
| • | in any other circumstances falling within Article 3(2) of the Prospectus Directive. |
provided that no such offer of ADSs shall require us or any representative to publish a prospectus pursuant to Article 3 of the Prospectus Directive.
For the purposes of this provision, the expression an “offer of securities to the public” in relation to any ADSs in any Relevant Member State means the communication in any form and by any means of sufficient information on the terms of the offer and the securities to be offered so as to enable an investor to decide to purchase or subscribe for the securities, as the same may be varied in that Member State by any measure implementing the Prospectus Directive in that Member State, the expression “Prospectus Directive” means Directive 2003/71/EC (and amendments thereto, including the 2010 PD Amending Directive, to the extent implemented in the Relevant Member State), and includes any relevant implementing measure in the Relevant Member State, and the expression “2010 PD Amending Directive” means Directive 2010/73/EU.
Hong Kong
The ADSs may not be offered or sold in Hong Kong by means of any document other than (i) in circumstances which do not constitute an offer to the public within the meaning of the Companies Ordinance (Cap. 32, Laws of Hong Kong), or (ii) to “professional investors” within the meaning of the Securities and Futures Ordinance (Cap. 571, Laws of Hong Kong) and any rules made thereunder, or (iii) in other circumstances which do not result in the document being a “prospectus” within the meaning of the Companies Ordinance (Cap. 32, Laws of Hong Kong) and no advertisement, invitation or document relating to the ADSs may be issued or may be in the possession of any person for the purpose of issue (in each case whether in Hong Kong or elsewhere), which is directed at, or the contents of which are likely to be accessed or read by, the public in Hong Kong (except if permitted to do so under the laws of Hong Kong) other than with respect to ADSs which are or are intended to be disposed of only to persons outside Hong Kong or only to “professional investors” within the meaning of the Securities and Futures Ordinance (Cap. 571, Laws of Hong Kong) and any rules made thereunder.
Japan
The ADSs offered in this prospectus have not been registered under the Securities and Exchange Law of Japan. The ADSs have not been offered or sold and will not be offered or sold, directly or indirectly, in Japan or to or for the account of any resident of Japan, except (i) pursuant to an exemption from the registration requirements of the Securities and Exchange Law and (ii) in compliance with any other applicable requirements of Japanese law.
191
Table of Contents
Kuwait
Unless all necessary approvals from the Kuwait Capital Markets Authority pursuant to Law No. 7/2010, its Executive Regulations and the various Resolutions and Announcements issued pursuant thereto or in connection therewith have been given in relation to the marketing, of and sale of the ADSs, these may not be offered for sale, nor sold in the State of Kuwait. Neither this prospectus nor any of the information contained herein is intended to lead to the conclusion of any contract of whatsoever nature within the State of Kuwait.
Mexico
The ADSs described in this prospectus are not being offered, sold or traded in Mexico pursuant to, and do not constitute, an oferta pública (public offering) in accordance with the Ley del Mercado de Valores, as amended (Mexican Securities Market Law, or “LMV”), or Disposiciones de carácter general aplicables a las emisoras de valores y a otros participantes del mercado de valores (the general rules, regulations and other general provisions issued by the Comisión Nacional Bancaria y de Valores (Mexican Banking and Securities Commission, or “CNBV”), or “General Issuer’s Rules”), nor is the offering contemplated hereby being authorized by the CNBV; therefore, any such ADSs may not be offered or sold publicly, or otherwise be the subject of brokerage activities, in Mexico, except pursuant to a private placement exemption or other exemptions set forth in the Mexican Securities Market Law. As such, this offering can be made to any person in Mexico so long as the offering is conducted on a direct and personal basis and it complies, among other requirements as set forth under the LMV and the General Issuer’s Rules, with the following:
| (i) | it is made to persons who are inversionistas institucionales (institutional investors) within the meaning of Article 2, Roman numeral XVII, of the LMV and regarded as such pursuant to the laws of Mexico, or inversionistas calificados (qualified investors) within the meaning of Article 2, Roman numeral XVI, of the LMV, and have the income, assets or qualitative characteristics provided for under Article 1, Roman numeral XIII of the General Issuer’s Rules, which require maintenance, in average over the past year, of investments in securities (within the meaning of the LMV) for an amount equal or greater than 1,500,000 Unidades de Inversión (Investment Units or “UDIs”), or in each of the last two years had a gross annual income equal to or greater than 500,000 UDIs; or |
| (ii) | it is made to persons who are stockholders of companies which fulfill their corporate purpose exclusively or substantially with such securities (e.g., investment companies authorized to invest in such securities); or |
| (iii) | it is made pursuant to a plan or applicable program for our or our affiliates’ employees or groups of employees; or |
| (iv) | it is made to less than 100 persons, to the extent such persons do not qualify under (i), (ii) or (iii) above. |
In identifying proposed purchasers for the ADSs in Mexico, the underwriters will only contact persons or entities whom they reasonably believe are within one of the four categories described in the immediately preceding paragraph in items (i) through (iv). The underwriters may further require you to expressly reiterate that you fall into one of the above mentioned categories, that you further understand that the private offering of ADSs has less documentary and information requirements than public offerings do, and to waive the right to claim on any lacking thereof.
This prospectus may not be publicly distributed in Mexico, whether through mass media to indeterminate subjects or otherwise, and they are not intended to serve as an application for the registration of the ADSs before the CNBV or listing of the ADSs before the Bolsa Mexicana de Valores, S.A.B. de C.V. (Mexican Stock Exchange, or “BMV”), nor as a prospectus in connection with a public offering in Mexico. This prospectus is solely our responsibility and has not been reviewed or authorized by the CNBV. The CNBV has not assessed or passed on the investment quality of ADSs, our solvency, liquidity or credit quality or the accuracy or completeness of the information provided in this prospectus. In making an investment decision, all investors, including any Mexican investors who may acquire ADSs from time to time, must rely on their own review and examination of our company. The acquisition of the ADSs by an investor who is a resident of Mexico will be made under its own responsibility.
192
Table of Contents
Panama
The ADSs have not been, and will not be, registered for public offering in Panama with the Panamanian Superintendency of the Securities Market (Superintendencia del Mercado de Valores, previously the National Securities Commission of Panama) under Decree-Law 1 of July 8, 1999, as reformed by Law 67 of 2011 (the “Panamanian Securities Act”). Accordingly, the ADSs may not be offered or sold in Panama nor to persons domiciled in Panama, except in certain limited transactions exempted from the registration requirements of the Panamanian Securities Act. The ADSs do not benefit from tax incentives accorded by the Panamanian Securities Act, and are not subject to regulation or supervision by the Panamanian Superintendency of the Securities Market as long as the ADSs are privately offered to no more than 25 persons domiciled in Panama and result in the sale to no more than 10 of such persons.
People’s Republic of China
This offering has not been approved or registered in the People’s Republic of China (the “PRC”). This prospectus may not be circulated or distributed in the PRC and the ADSs may not be offered or sold, and will not be offered or sold to any person for re-offering or resale, directly or indirectly, to any person in the PRC, except to the extent consistent with applicable laws and regulations of the PRC. For the purpose of this paragraph, the PRC does not include Taiwan and the special administrative regions of Hong Kong and Macau.
Peru
The ADSs and the information contained in this prospectus have not been and will not be registered with or approved by the Peruvian Securities Commission or the Lima Stock Exchange. Accordingly, the ADSs cannot be offered or sold in Peru, except if such offering is considered a private offering under the securities laws and regulations of Peru.
Qatar
The ADSs have not been and will not be offered, sold or delivered, at any time, directly or indirectly in the State of Qatar in a manner that would constitute a public offering. The ADSs are not and will not be listed on the Qatar Exchange.
This prospectus has not been, and will not be, reviewed or approved by or filed or registered with the Qatar Financial Markets Authority, Qatar Central Bank or the Qatar Financial Centre Regulatory Authority and may not be publicly distributed. This prospectus is intended for the original recipient only and must not be provided to any other person. It is not for general circulation in the State of Qatar and may not be reproduced or used for any other purpose.
Singapore
This prospectus has not been registered as a prospectus with the Monetary Authority of Singapore. Accordingly, this prospectus and any other document or material in connection with the offer or sale, or invitation for subscription or purchase, of the ADSs may not be circulated or distributed, nor may the ADSs be offered or sold, or be made the subject of an invitation for subscription or purchase, whether directly or indirectly, to persons in Singapore other than (i) to an institutional investor under Section 274 of the Securities and Futures Act, Chapter 289 of Singapore (the “SFA”), (ii) to a relevant person pursuant to Section 275(1), or any person pursuant to Section 275(1A), and in accordance with the conditions specified in Section 275 of the SFA or (iii) otherwise pursuant to, and in accordance with the conditions of, any other applicable provision of the SFA, in each case subject to compliance with conditions set forth in the SFA.
193
Table of Contents
Switzerland
No ADSs will be publicly offered or distributed in Switzerland. ADSs shall be offered in Switzerland privately only to a select circle of investors without the use of any public means of information or advertisement.
This prospectus does not constitute an offer prospectus within the meaning of Art. 652a of the Swiss Code of Obligations. It has not been filed with or approved by any Swiss regulatory authority or stock exchange. The ADSs will not be registered in Switzerland or listed at any Swiss stock exchange. This document may not be distributed or used in Switzerland without our prior written approval.
United Arab Emirates
The ADSs will be sold outside the United Arab Emirates and are not part of a public offering and are being offered to a limited number of institutional and private investors in the United Arab Emirates. We have not been reviewed, approved or licensed by the United Arab Emirates Central Bank or any other relevant licensing authorities or governmental agencies in the United Arab Emirates. This document is strictly private and confidential and has not been reviewed, deposited or registered with any licensing authority or governmental agency in the United Arab Emirates, and is being issued to a limited number of institutional and private investors and must not be provided to any person other than the original recipient and may not be reproduced or used for any other purpose. Our ADSs may not be offered or sold directly or indirectly to the public in the United Arab Emirates.
United Kingdom
Each underwriter has represented and agreed that:
| (a) | it has only communicated or caused to be communicated and will only communicate or cause to be communicated an invitation or inducement to engage in investment activity (within the meaning of Section 21 of the Financial Services and Markets Act 2000 (“FSMA”)) received by it in connection with the issue or sale of the ADSs in circumstances in which Section 21(1) of the FSMA does not apply to us; and |
| (b) | it has complied and will comply with all applicable provisions of the FSMA with respect to anything done by it in relation to the ADSs in, from or otherwise involving the United Kingdom. |
Global Coordinators
The addresses of the global coordinators are as follows:
Credit Suisse Securities (USA) LLC
Eleven Madison Avenue
New York, NY 10010
United States of America
J.P. Morgan Securities LLC
383 Madison Avenue
New York, NY 10179
United States of America
Morgan Stanley & Co. LLC
1585 Broadway
New York, NY 10036
United States of America
194
Table of Contents
EXPENSES OF THE GLOBAL OFFERING
We estimate that our expenses in connection with the offering, other than underwriting discounts and commissions, will be as follows:
| Amount (in US$) | Percentage of Net Proceeds of the Offering (%) | |||||||
SEC registration fee | [— | ] | [— | ] | ||||
New York Stock Exchange listing fees | [— | ] | [— | ] | ||||
FINRA filing fee | [— | ] | [— | ] | ||||
Printing expenses | [— | ] | [— | ] | ||||
Legal fees and expenses | [— | ] | [— | ] | ||||
Accountant fees and expenses | [— | ] | [— | ] | ||||
Miscellaneous fees | [— | ] | [— | ] | ||||
|
|
|
| |||||
Total | [— | ] | [— | ] | ||||
All amounts in the table are estimated except for the SEC registration fee, The New York Stock Exchange listing fee and the FINRA filing fee.
The depositary has agreed to pay some of these expenses on our behalf, subject to the closing of the offering.
195
Table of Contents
The validity of the ADSs will be passed upon for us by Simpson Thacher & Bartlett LLP, New York, New York and for the underwriters by Davis Polk & Wardwell LLP, New York, New York. The validity of the common shares and other matters governed by Peruvian law will be passed upon for us by Muñiz, Ramírez, Pérez-Taiman & Olaya Abogados and for the underwriters by Rubio Leguia Normand.
The financial statements as of December 31, 2011 and 2012 and for each of the three years in the period ended December 31, 2012 included in this prospectus have been so included in reliance on the report of Dongo, Soria, Gaveglio y Asociados Sociedad Civil de Responsabilidad Limitada, a member firm of PricewaterhouseCoopers, an independent registered public accounting firm, given on the authority of said firm as experts in auditing and accounting.
196
Table of Contents
WHERE YOU CAN FIND MORE INFORMATION
We have filed with the SEC a registration statement (including amendments and exhibits to the registration statement) on Form F-1 under the U.S. Securities Act. This prospectus, which is part of the registration statement, does not contain all of the information set forth in the registration statement and the exhibits and schedules to the registration statement. For further information, we refer you to the registration statement and the exhibits and schedules filed as part of the registration statement. If a document has been filed as an exhibit to the registration statement, we refer you to the copy of the document that has been filed.
Upon completion of this offering, we will become subject to the informational requirements of the U.S. Securities Exchange Act of 1934, or the Exchange Act. Accordingly, we will be required to file reports and other information with the SEC, including annual reports on Form 20-F and reports on Form 6-K. You may inspect and copy reports and other information to be filed with the SEC at the public reference facilities maintained by the SEC at 100 F Street, N.E., Washington, D.C. Copies of the materials may be obtained from the Public Reference Room of the SEC at 100 F Street, N.E., Washington, D.C. 20549 at prescribed rates. The public may obtain information on the operation of the SEC’s Public Reference Room by calling the SEC in the United States at 1-800-SEC-0330. In addition, the SEC maintains an Internet website at http://www.sec.gov, from which you can electronically access the registration statement and its materials.
As a foreign private issuer, we are not subject to the same disclosure requirements as a domestic U.S. registrant under the Exchange Act. For example, we are not required to prepare and issue quarterly reports. However, we intend to furnish our shareholders with annual reports containing financial statements audited by our independent auditors and to make available to our shareholders quarterly reports containing unaudited financial data for the first three quarters of each fiscal year. In addition, as a foreign issuer, we are not subject to the proxy rules under Section 14 of the Exchange Act and our officers and directors will not be subject to Section 16 of the Exchange Act relating to insider short-swing profit disclosure and recovery regime.
We will send the depositary a copy of all notices that we give relating to meetings of our shareholders or to distributions to shareholders or the offering of rights and a copy of any other report or communication that we make generally available to our shareholders. The depositary will make all these notices, reports and communications that it receives from us available for inspection by registered holders of ADSs at its office. The depositary will mail copies of those notices, reports and communications to you if we ask the depositary to do so and furnish sufficient copies of materials for that purpose.
We will file financial statements and other periodic reports with the Peruvian Securities Commission in Peru. Issuers of securities registered with the Peruvian Securities Commission are required to disclose material information relating to the issuer. Pursuant to the Securities Market Law and relevant regulations enacted thereunder, all material information in connection with the issuer of registered securities, its activities or securities issued or secured by such issuer which may influence the liquidity or price of such securities must be disclosed. Accordingly, issuers must file with the Peruvian Securities Commission mainly two types of information: (a) financial information, including interim unaudited financial statements on a quarterly basis (which are not required to be subject to limited review), and annual audited consolidated financial statements on an annual basis, and (b) material information relating to the issuer and its activities that may significantly affect the price, offering or negotiation of the issued securities, and in general, all the information that may be relevant for investors to be able to make investment decisions.
197
Table of Contents
ENFORCEMENT OF JUDGMENTS AGAINST FOREIGN PERSONS
Graña y Montero is a publicly-held corporation (sociedad anónima abierta) organized and existing under the laws of Peru. All of our directors and officers reside in Peru or elsewhere outside the United States, and a significant portion of the assets of such persons may be, and substantially all of our assets are, located in Peru or elsewhere outside the United States. As a result, it may not be possible for investors to effect service of process within the United States upon us or upon our directors or officers, or to enforce against them, or us, in U.S. federal or state courts judgments predicated upon the provisions of civil liabilities of U.S. federal securities laws.
We have been advised by our Peruvian counsel, Muñiz, Ramírez, Pérez-Taiman & Olaya Abogados, that there is uncertainty as to the enforceability, in original actions in Peruvian courts, of liabilities predicated upon the U.S. federal securities laws. In addition, we have been advised by Muñiz, Ramírez, Pérez-Taiman & Olaya Abogados that any final and conclusive judgment for a fixed and definitive sum obtained against us in any foreign court having jurisdiction in respect of any suit, action or proceeding against us for the enforcement of any of our obligations under the common shares that are governed by New York law will, upon request, be deemed valid and enforceable in Peru through an exequatur judiciary proceeding (which does not involve the reopening of the case), provided that: (i) there is in effect a treaty between the country where said foreign court sits and Peru regarding the recognition and enforcement of foreign judgments; or (ii) in the absence of such a treaty, the original judgment is ratified by the Peruvian Courts (Cortes de la República del Perú), provided that the following conditions and requirements are met:
| • | the judgment does not resolve matters under the exclusive jurisdiction of Peruvian courts (and the matters contemplated in respect of this prospectus or the common shares are not matters under the exclusive jurisdiction of Peruvian courts); |
| • | such court had jurisdiction under its own conflicts of law rules and under general principles of international procedural jurisdiction; |
| • | Graña y Montero received service of process in accordance with the laws of the place where the proceeding took place, was granted a reasonable opportunity to appear before such foreign court, and was guaranteed due process rights; |
| • | the judgment has the status ofres judicata as defined in the jurisdiction of the court rendering such judgment; |
| • | no pending litigation in Peru between the same parties for the same dispute was initiated before the commencement of the proceeding that concluded with the foreign judgment; |
| • | the foreign judgment is not incompatible with another judgment that fulfills the requirements of recognition and enforceability established by Peruvian Corporations law, unless such foreign judgment was rendered first; |
| • | the foreign judgment is not contrary to Peruvian public policy or good morals; |
| • | it is not proven that such foreign court denies enforcement of Peruvian judgments or engages in a review of the merits thereof; and |
| • | such judgment has been (i) duly apostilled by the competent authority of the jurisdiction of the issuing court, in case of jurisdictions that are party to the Hague Apostille Convention, and is accompanied by a certified and officially translated copy of such judgment into Spanish; and (ii) the applicable court taxes or fees have been paid. |
Our properties and subsidiaries have no immunity from a court’s jurisdiction, except, to the extent applicable, immunities set forth in Article 616 of the Peruvian Code of Civil Procedure (Código Procesal Civil) for attachments on assets dedicated to the rendering of public services.
198
Table of Contents
We have no reason to believe that any of our obligations relating to the common shares would be contrary to Peruvian public policy, good morals and international treaties binding upon Peru or generally accepted principles of international law. No treaty exists between the United States and Peru for the reciprocal enforcement of foreign judgments. Peruvian courts, however, have enforced judgments rendered in the United States based on legal principles of reciprocity and comity.
Our bylaws include an arbitration clause applicable to disputes arising from the interpretation of our bylaws or Peruvian Corporate Law and their complementary provisions, among us, our management and our shareholders. We have been advised by our Peruvian Counsel, Muñiz, Ramirez, Perez-Taiman & Olaya Abogados, that the arbitration clause does not apply to claims based on violations of United States securities laws in connection with this offering.
199
Table of Contents
INDEX TO CONSOLIDATED FINANCIAL STATEMENTS
December 31, 2010, 2011 and 2012 | ||||
| F-2 | ||||
| F-3 | ||||
| F-4 | ||||
| F-5 | ||||
Consolidated Statement of Changes in Net Shareholders’ Equity | F-6 | |||
| F-7 | ||||
| F-8 | ||||
F-1
Table of Contents

Report of Independent Registered Public Accounting Firm
March 25, 2013
To Graña y Montero S.A.A. shareholders and Board of Directors:
In our opinion, the accompanying consolidated statement of financial position and the related consolidated statements of comprehensive income, shareholder’s equity and cash flows present fairly, in all material respects, the financial position of Graña y Montero S.A.A. and its subsidiaries at December 31, 2012 and December 31, 2011, and the results of their operations and their cash flows for each of the three years in the period ended December 31, 2012 in conformity with International Financial Reporting Standards as issued by the International Accounting Standards Board. These financial statements are the responsibility of the Company’s management. Our responsibility is to express an opinion on these financial statements based on our audits. We conducted our audits of these statements in accordance with the standards of the Public Company Accounting Oversight Board (United States). Those standards require that we plan and perform the audit to obtain reasonable assurance about whether the financial statements are free of material misstatement. An audit includes examining, on a test basis, evidence supporting the amounts and disclosures in the financial statements, assessing the accounting principles used and significant estimates made by management, and evaluating the overall financial statement presentation. We believe that our audits provide a reasonable basis for our opinion.
 |
| Countersigned by |
| (partner) | |
| Felix U. Horna | ||
| Peruvian Certified Public Accountant | ||
| Registration No. 01-13774 | ||

Dongo-Soria Gaveglio y Asociados Sociedad Civil de Responsabilidad Limitada
Av. Santo Toribio 143, Piso 7, San Isidro, Lima, Perú T: +51 (1) 211 6500, F: +51 (1) 211-6565
www.pwc.com/pe
Dongo-Soria Gaveglio y Asociados Sociedad Civil de Responsabilidad Limitada es una firma miembro de la red global de PricewaterhouseCoopers International Limited (PwCIL). Cada una de las firmas es una entidad legal separada e independiente que no actúa en nombre de PwCIL ni de cualquier otra firma miembro de la red.
Inscrita en la Partida N°. 11028527, Registro de Personas Juridicas de Lima y Callao
F-2
Table of Contents
(All amounts are expressed in thousands of S/. unless otherwise stated)
GRAÑA Y MONTERO S.A.A. AND SUBSIDIARIES
CONSOLIDATED STATEMENT OF FINANCIAL POSITION
| ASSETS | ||||||||||||
| As of December 31, | ||||||||||||
| Note | 2012 | 2011 | ||||||||||
| S/.000 | S/.000 | |||||||||||
CURRENT ASSETS | ||||||||||||
Cash and cash equivalents | 7 | 780,114 | 658,187 | |||||||||
Available-for-sale financial asset | 5,005 | 5,347 | ||||||||||
Trade accounts receivables, net | 8 | 444,593 | 488,310 | |||||||||
Outstanding work in progress | 9 | 525,251 | 393,826 | |||||||||
Accounts receivable from related parties | 10 | 49,761 | 25,310 | |||||||||
Other accounts receivable | 11 | 436,451 | 341,591 | |||||||||
Inventories | 12 | 747,416 | 546,265 | |||||||||
Prepaid expenses | 22,839 | 43,439 | ||||||||||
|
|
|
| |||||||||
Total current assets | 3,011,430 | 2,502,275 | ||||||||||
|
|
|
| |||||||||
Non-current assets | ||||||||||||
Long-term trade accounts receivable | 8 | 305,887 | — | |||||||||
Other long-term accounts receivable | 11 | 87,484 | 75,215 | |||||||||
Investments in associates | 13 | 37,446 | 25,953 | |||||||||
Investment Property | 35,972 | 36,528 | ||||||||||
Property, plant and equipment | 14 | 938,093 | 686,913 | |||||||||
Intangible assets | 15 | 505,108 | 317,797 | |||||||||
Derivative financial instruments | 6 | 128 | — | |||||||||
Deferred income tax asset | 21 | 71,078 | 49,044 | |||||||||
|
|
|
| |||||||||
Total non-current assets | 1,981,196 | 1,191,450 | ||||||||||
|
|
|
| |||||||||
|
|
|
| |||||||||
| 4,992,626 | 3,693,725 | |||||||||||
|
|
|
| |||||||||
| LIABILITIES AND NET SHAREHOLDERS’ EQUITY | ||||||||||||
| As of December 31, | ||||||||||||
| Note | 2012 | 2011 | ||||||||||
| S/.000 | S/.000 | |||||||||||
CURRENT LIABILITIES | ||||||||||||
Borrowings | 16 | 452,819 | 230,973 | |||||||||
Trade accounts payable | 17 | 937,287 | 754,520 | |||||||||
Accounts payable to related parties | 10 | 42,734 | 19,665 | |||||||||
Current taxes | 158,834 | 172,333 | ||||||||||
Other accounts payable | 18 | 1,015,129 | 539,422 | |||||||||
Other provisions | 19 | 11,312 | 24,466 | |||||||||
|
|
|
| |||||||||
Total current liabilities | 2,618,115 | 1,741,379 | ||||||||||
|
|
|
| |||||||||
Non-current liabilities | ||||||||||||
Borrowings | 16 | 392,655 | 298,875 | |||||||||
Other accounts payable | 18 | 52,776 | 58,128 | |||||||||
Other provisions | 19 | 51,315 | 109,476 | |||||||||
Derivative financial instruments | 6 | 18,696 | 3,645 | |||||||||
Deferred income tax liability | 21 | 82,179 | 29,136 | |||||||||
|
|
|
| |||||||||
Total non-current liabilities | 597,621 | 499,260 | ||||||||||
|
|
|
| |||||||||
Total liabilities | 3,215,736 | 2,240,639 | ||||||||||
|
|
|
| |||||||||
Equity | 20 | |||||||||||
Capital | 558,284 | 390,488 | ||||||||||
Legal reserve | 107,011 | 78,104 | ||||||||||
Premium for share issuance | 6,656 | 4,880 | ||||||||||
Other comprehensive income | (3,716 | ) | (310 | ) | ||||||||
Retained earnings | 723,972 | 715,860 | ||||||||||
|
|
|
| |||||||||
Equity attributable to controlling interest in the Company | 1,392,207 | 1,189,022 | ||||||||||
Non-controlling interest | 384,683 | 264,064 | ||||||||||
|
|
|
| |||||||||
Total equity | 1,776,890 | 1,453,086 | ||||||||||
|
|
|
| |||||||||
|
|
|
| |||||||||
| 4,992,626 | 3,693,725 | |||||||||||
|
|
|
| |||||||||
The accompanying notes on pages 7 to 81 are an integral part of the consolidated financial statements.
F-3
Table of Contents
(All amounts are expressed in thousands of S/. unless otherwise stated)
GRAÑA Y MONTERO S.A.A. AND SUBSIDIARIES
CONSOLIDATED STATEMENT OF COMPREHENSIVE INCOME
| For the year ended December 31, | ||||||||||||||||
| Note | 2012 | 2011 | 2010 | |||||||||||||
| S/.000 | S/.000 | S/.000 | ||||||||||||||
Revenues from construction activities | 3,341,539 | 2,650,334 | 1,605,181 | |||||||||||||
Revenues from services provided | 1,536,275 | 1,316,682 | 651,225 | |||||||||||||
Revenue from real estate and sale of goods | 354,071 | 274,250 | 246,269 | |||||||||||||
|
|
|
|
|
| |||||||||||
| 5 | 5,231,885 | 4,241,266 | 2,502,675 | |||||||||||||
|
|
|
|
|
| |||||||||||
Cost of construction activities | (2,969,687 | ) | (2,360,521 | ) | (1,399,118 | ) | ||||||||||
Cost of services provided | (1,335,092 | ) | (1,077,236 | ) | (416,429 | ) | ||||||||||
Cost of goods and others sold | (215,040 | ) | (171,760 | ) | (242,299 | ) | ||||||||||
|
|
|
|
|
| |||||||||||
| 23 | (4,519,819 | ) | (3,609,517 | ) | (2,057,846 | ) | ||||||||||
|
|
|
|
|
| |||||||||||
Gross profit | 712,066 | 631,749 | 444,829 | |||||||||||||
Administrative expenses | 23 | (257,180 | ) | (199,582 | ) | (123,159 | ) | |||||||||
Other income and expenses | 25 | 75,944 | 4,330 | 2,684 | ||||||||||||
Profit from the sale of investments | 1 y 13 | — | 4,769 | 74,959 | ||||||||||||
Other (losses) gains, net | (277 | ) | (2,845 | ) | 230 | |||||||||||
Gain from business combination | 28 | — | 45,152 | — | ||||||||||||
|
|
|
|
|
| |||||||||||
Operating profit | 530,553 | 483,573 | 399,543 | |||||||||||||
Financial expenses | 24 | (297,975 | ) | (188,456 | ) | (154,806 | ) | |||||||||
Financial income | 24 | 287,644 | 182,305 | 144,817 | ||||||||||||
Share of the profit or loss in associates under the equity method of accounting | 13 | 604 | 223 | 11,474 | ||||||||||||
|
|
|
|
|
| |||||||||||
Profit before income tax | 520,826 | 477,645 | 401,028 | |||||||||||||
Income tax | 26 | (154,575 | ) | (141,447 | ) | (124,342 | ) | |||||||||
|
|
|
|
|
| |||||||||||
Net Profit for the year | 366,251 | 336,198 | 276,686 | |||||||||||||
|
|
|
|
|
| |||||||||||
Net Profit attributable to: | ||||||||||||||||
Controlling interest in the Company | 289,954 | 289,076 | 252,802 | |||||||||||||
Non-controlling interest | 76,297 | 47,122 | 23,884 | |||||||||||||
|
|
|
|
|
| |||||||||||
| 366,251 | 336,198 | 276,686 | ||||||||||||||
|
|
|
|
|
| |||||||||||
Net Profit attributable to controlling interest in the Company | 289,954 | 289,076 | 252,802 | |||||||||||||
|
|
|
|
|
| |||||||||||
Weighted average number of shares in issue at S/.1.00 each, at December 31, 2012 | 558,284,190 | 558,284,190 | 558,284,190 | |||||||||||||
|
|
|
|
|
| |||||||||||
(S/.0.70 each, at December 31, 2011 and 2010) | ||||||||||||||||
Basic and diluted earning per share (S/.) | 0.519 | 0.518 | 0.453 | |||||||||||||
|
|
|
|
|
| |||||||||||
The accompanying notes on pages 7 to 81 are an integral part of the consolidated financial statements.
F-4
Table of Contents
(All amounts are expressed in thousands of S/. unless otherwise stated)
GRAÑA Y MONTERO S.A.A. AND SUBSIDIARIES
CONSOLIDATED STATEMENT OF OTHER COMPREHENSIVE INCOME
| For the year ended December 31, | ||||||||||||||
| Note | 2012 | 2011 | 2010 | |||||||||||
| S/.000 | S/.000 | S/.000 | ||||||||||||
Net Profit for the year | 366,251 | 336,198 | 276,686 | |||||||||||
|
|
|
|
|
| |||||||||
Other comprehensive income: | ||||||||||||||
Increase in fair value of available-for-sale investments, net of tax | — | — | 7,460 | |||||||||||
Cash flow hedge, net of tax | 20 | (2,369 | ) | 695 | (342 | ) | ||||||||
Foreign currency translation adjustment, net of tax | (2,019 | ) | (3,940 | ) | (382 | ) | ||||||||
|
|
|
|
|
| |||||||||
Total other comprehensive income | (4,388 | ) | (3,245 | ) | 6,736 | |||||||||
|
|
|
|
|
| |||||||||
Total Comprehensive Income | 361,863 | 332,953 | 283,422 | |||||||||||
|
|
|
|
|
| |||||||||
Comprehensive income attributable to: | ||||||||||||||
Controlling interest in the Company | 286,548 | 285,796 | 259,555 | |||||||||||
Non-controlling interest | 75,315 | 47,157 | 23,867 | |||||||||||
|
|
|
|
|
| |||||||||
| 361,863 | 332,953 | 283,422 | ||||||||||||
|
|
|
|
|
| |||||||||
The accompanying notes on pages 7 to 81 are an integral part of the consolidated financial statements.
F-5
Table of Contents
(All amounts are expressed in thousands of S/. unless otherwise stated)
GRAÑA Y MONTERO S.A.A. AND SUBSIDIARIES
CONSOLIDATED STATEMENT OF CHANGES IN NET SHAREHOLDERS’ EQUITY
FOR THE YEARS ENDED DECEMBER 31, 2012, 2011 AND 2010
| Attributable to the controlling interests of the Company | ||||||||||||||||||||||||||||||||||||
| Number of shares | Capital | Legal reserve | Premium for issuance of shares | Other comprehensive income | Retained earnings | Total | Non-controlling interest | Total | ||||||||||||||||||||||||||||
| In thousands | S/.000 | S/.000 | S/.000 | S/.000 | S/.000 | S/.000 | S/.000 | S/.000 | ||||||||||||||||||||||||||||
Balances as of January 1, 2010 | 558,284 | 390,628 | 41,165 | 4,862 | (3,783 | ) | 292,175 | 725,047 | 193,775 | 918,822 | ||||||||||||||||||||||||||
|
|
|
|
|
|
|
|
|
|
|
|
|
|
|
|
|
| |||||||||||||||||||
Net profit for the year | — | — | — | — | — | 252,802 | 252,802 | 23,884 | 276,686 | |||||||||||||||||||||||||||
Increase in fair value of available-for-sale investments | — | — | — | — | 7,460 | — | 7,460 | — | 7,460 | |||||||||||||||||||||||||||
Cash flow hedge | — | — | — | — | (325 | ) | — | (325 | ) | (17 | ) | (342 | ) | |||||||||||||||||||||||
Conversion adjustment | — | — | — | — | (382 | ) | (382 | ) | — | (382 | ) | |||||||||||||||||||||||||
|
|
|
|
|
|
|
|
|
|
|
|
|
|
|
|
|
| |||||||||||||||||||
Comprehensive income of the year | — | — | — | — | 6,753 | 252,802 | 259,555 | 23,867 | 283,422 | |||||||||||||||||||||||||||
|
|
|
|
|
|
|
|
|
|
|
|
|
|
|
|
|
| |||||||||||||||||||
Transactions with shareholders: | ||||||||||||||||||||||||||||||||||||
- Transfer to legal reserve | — | — | 13,440 | — | — | (13,440 | ) | — | — | — | ||||||||||||||||||||||||||
- Acquisiton of treasury shares | (110 | ) | 229 | 119 | — | 119 | ||||||||||||||||||||||||||||||
- Dividends distribution | — | — | — | — | — | (26,880 | ) | (26,880 | ) | — | (26,880 | ) | ||||||||||||||||||||||||
- Contribution of non-controlling shareholders (Note 31 d) | — | — | — | — | — | — | (1,073 | ) | (1,073 | ) | ||||||||||||||||||||||||||
- Decrease in non-controlling interest for sale of subsidiary | — | — | — | — | — | — | — | (25,670 | ) | (25,670 | ) | |||||||||||||||||||||||||
- Other | 2,020 | 2,020 | (1,852 | ) | 168 | |||||||||||||||||||||||||||||||
|
|
|
|
|
|
|
|
|
|
|
|
|
|
|
|
|
| |||||||||||||||||||
Total transactions with shareholders | — | (110 | ) | 13,440 | 229 | — | (38,300 | ) | (24,741 | ) | (28,595 | ) | (53,336 | ) | ||||||||||||||||||||||
|
|
|
|
|
|
|
|
|
|
|
|
|
|
|
|
|
| |||||||||||||||||||
Balances as of December 31, 2010 | 558,284 | 390,518 | 54,605 | 5,091 | 2,970 | 506,677 | 959,861 | 189,047 | 1,148,908 | |||||||||||||||||||||||||||
|
|
|
|
|
|
|
|
|
|
|
|
|
|
|
|
|
| |||||||||||||||||||
Balances as of January 1, 2011 | 558,284 | 390,518 | 54,605 | 5,091 | 2,970 | 506,677 | 959,861 | 189,047 | 1,148,908 | |||||||||||||||||||||||||||
|
|
|
|
|
|
|
|
|
|
|
|
|
|
|
|
|
| |||||||||||||||||||
Net profit for the year | — | — | — | — | — | 289,076 | 289,076 | 47,122 | 336,198 | |||||||||||||||||||||||||||
Cash flow hedge | — | — | — | — | 660 | — | 660 | 35 | 695 | |||||||||||||||||||||||||||
Adjustment for conversion | — | — | — | — | (3,940 | ) | — | (3,940 | ) | — | (3,940 | ) | ||||||||||||||||||||||||
|
|
|
|
|
|
|
|
|
|
|
|
|
|
|
|
|
| |||||||||||||||||||
Comprehensive income of the year | — | — | — | — | (3,280 | ) | 289,076 | 285,796 | 47,157 | 332,953 | ||||||||||||||||||||||||||
|
|
|
|
|
|
|
|
|
|
|
|
|
|
|
|
|
| |||||||||||||||||||
Transactions with shareholders: | ||||||||||||||||||||||||||||||||||||
- Transfer to legal reserve | — | — | 23,499 | — | — | (23,499 | ) | — | — | — | ||||||||||||||||||||||||||
- Dividend distribution | — | — | — | — | — | (55,015 | ) | (55,015 | ) | (14,850 | ) | (69,865 | ) | |||||||||||||||||||||||
- Purchase of subsidiaries (Note 28 c) | — | — | — | — | — | — | — | 24,722 | 24,722 | |||||||||||||||||||||||||||
- Contributions of non-controlling shareholders (Note 31 d) | — | — | — | — | — | — | — | (13,328 | ) | (13,328 | ) | |||||||||||||||||||||||||
- Subsidiaries constitution (Note 31 d) | — | — | — | — | — | — | — | 30,776 | 30,776 | |||||||||||||||||||||||||||
- Sale and purchase of treasury shares | — | (30 | ) | — | (211 | ) | — | — | (241 | ) | — | (241 | ) | |||||||||||||||||||||||
- Others | — | — | — | — | — | (1,379 | ) | (1,379 | ) | 540 | (839 | ) | ||||||||||||||||||||||||
|
|
|
|
|
|
|
|
|
|
|
|
|
|
|
|
|
| |||||||||||||||||||
Total transactions with shareholders | — | (30 | ) | 23,499 | (211 | ) | — | (79,893 | ) | (56,635 | ) | 27,860 | (28,775 | ) | ||||||||||||||||||||||
|
|
|
|
|
|
|
|
|
|
|
|
|
|
|
|
|
| |||||||||||||||||||
Balances as of December 31, 2011 | 558,284 | 390,488 | 78,104 | 4,880 | (310 | ) | 715,860 | 1,189,022 | 264,064 | 1,453,086 | ||||||||||||||||||||||||||
|
|
|
|
|
|
|
|
|
|
|
|
|
|
|
|
|
| |||||||||||||||||||
Balances as of January 1, 2012 | 558,284 | 390,488 | 78,104 | 4,880 | (310 | ) | 715,860 | 1,189,022 | 264,064 | 1,453,086 | ||||||||||||||||||||||||||
|
|
|
|
|
|
|
|
|
|
|
|
|
|
|
|
|
| |||||||||||||||||||
Net profit for the year | 289,954 | 289,954 | 76,297 | 366,251 | ||||||||||||||||||||||||||||||||
Cash flow hedge | — | — | — | — | (2,251 | ) | — | (2,251 | ) | (118 | ) | (2,369 | ) | |||||||||||||||||||||||
Adjustment for actuarial gains and losses | — | — | — | — | — | (3,678 | ) | (3,678 | ) | — | (3,678 | ) | ||||||||||||||||||||||||
Adjustment for conversion | — | — | — | — | (1,155 | ) | — | (1,155 | ) | (864 | ) | (2,019 | ) | |||||||||||||||||||||||
|
|
|
|
|
|
|
|
|
|
|
|
|
|
|
|
|
| |||||||||||||||||||
Comprehensive income of the year | 558,284 | — | — | — | (3,406 | ) | 286,276 | 282,870 | 75,315 | 358,185 | ||||||||||||||||||||||||||
|
| �� |
|
|
|
|
|
|
|
|
|
|
|
|
|
|
|
| ||||||||||||||||||
Transactions with shareholders: | ||||||||||||||||||||||||||||||||||||
- Transfer to legal reserve | — | — | 28,907 | — | — | (28,907 | ) | — | — | — | ||||||||||||||||||||||||||
- Dividend distribution | — | — | — | — | — | (86,723 | ) | (86,723 | ) | — | (86,723 | ) | ||||||||||||||||||||||||
- Dividend distribution to subsidiaries | — | — | — | — | — | — | — | (37,512 | ) | (37,512 | ) | |||||||||||||||||||||||||
- Capitalization | — | 167,485 | — | — | — | (167,485 | ) | — | — | — | ||||||||||||||||||||||||||
- Subsidiaries constitution | — | — | — | — | — | — | — | 5,750 | 5,750 | |||||||||||||||||||||||||||
- Purchase of subsidiaries (Note 28) | — | — | — | — | — | — | — | 41,704 | 41,704 | |||||||||||||||||||||||||||
- Debt capitalization | — | — | — | — | — | — | — | 12,232 | 12,232 | |||||||||||||||||||||||||||
- Contributions of non-controlling shareholders | — | — | — | — | — | — | — | 26,096 | 26,096 | |||||||||||||||||||||||||||
- Acquisition of non-controlling interest in Survial S.A. | — | — | — | 364 | — | — | 364 | (4,757 | ) | (4,393 | ) | |||||||||||||||||||||||||
- Sale of non-controlling interest in GyM S.A. and Concar S.A. | — | — | — | 291 | — | — | 291 | 902 | 1,193 | |||||||||||||||||||||||||||
- Sale and purchase of treasury shares | — | 140 | — | 1,292 | — | — | 1,432 | — | 1,432 | |||||||||||||||||||||||||||
- Others | — | 171 | — | (171 | ) | — | 4,951 | 4,951 | 889 | 5,840 | ||||||||||||||||||||||||||
|
|
|
|
|
|
|
|
|
|
|
|
|
|
|
|
|
| |||||||||||||||||||
Total transactions with shareholders | — | 167,796 | 28,907 | 1,776 | — | (278,164 | ) | (79,685 | ) | 45,304 | (34,381 | ) | ||||||||||||||||||||||||
|
|
|
|
|
|
|
|
|
|
|
|
|
|
|
|
|
| |||||||||||||||||||
Balances as of December 31, 2012 | 558,284 | 558,284 | 107,011 | 6,656 | (3,716 | ) | 723,972 | 1,392,207 | 384,683 | 1,776,890 | ||||||||||||||||||||||||||
|
|
|
|
|
|
|
|
|
|
|
|
|
|
|
|
|
| |||||||||||||||||||
The accompanying notes on pages 7 to 81 are an integral part of the consolidated financial statements.
F-6
Table of Contents
(All amounts are expressed in thousands of S/. unless otherwise stated)
GRAÑA Y MONTERO S.A.A. AND SUBSIDIARIES
CONSOLIDATED STATEMENT OF CASH FLOWS
| For the year ended December 31, | ||||||||||||
| 2012 | 2011 | 2010 | ||||||||||
| S/.000 | S/.000 | S/.000 | ||||||||||
OPERATING ACTIVITIES | ||||||||||||
Profit before income tax | 520,826 | 477,645 | 401,028 | |||||||||
Adjustments to profit not affecting cash flows from operating activities: | ||||||||||||
Depreciation | 173,018 | 127,023 | 91,982 | |||||||||
Impairment of intangibles | — | 3,436 | — | |||||||||
Amortization of other assets | 71,485 | 51,223 | 50,942 | |||||||||
Impairment of inventory | 9,822 | — | — | |||||||||
Impairment of accounts receivable | 2,719 | — | — | |||||||||
Deferred income tax | 8,666 | (41,795 | ) | 22,209 | ||||||||
Share of the profit and loss in associates under the equity method of accounting | (604 | ) | (223 | ) | (11,474 | ) | ||||||
Business combination gain | — | (45,152 | ) | — | ||||||||
Payments for intangible purchase - Concessions | (28,406 | ) | (25,378 | ) | (2,805 | ) | ||||||
Profit on sale of property, plant and equipment | (1,261 | ) | 1,661 | (4,316 | ) | |||||||
Profit on sale of investments in associates | — | (4,769 | ) | (74,959 | ) | |||||||
Net variations in assets and liabilities: | ||||||||||||
Increase in trade accounts receivable | 33,516 | (177,076 | ) | (66,219 | ) | |||||||
Decrease in other accounts receivable | (343,579 | ) | (183,468 | ) | 13,490 | |||||||
Decrease in other accounts receivable from related parties | (24,451 | ) | (812 | ) | (19,556 | ) | ||||||
Decrease in inventories | (184,325 | ) | (140,410 | ) | (46,385 | ) | ||||||
Increase in pre-paid expenses and other assets | 21,644 | (4,256 | ) | 8,532 | ||||||||
Increase in trade accounts payable | 139,694 | 265,626 | 28,304 | |||||||||
Increase (decrease) in other accounts payable | 256,858 | (68,469 | ) | 123,581 | ||||||||
Increase (decrease) in other accounts payable to related parties | 23,069 | 2,022 | (70,308 | ) | ||||||||
Decrease in current income tax | (168,074 | ) | (97,516 | ) | (41,994 | ) | ||||||
Decrease in other provisions | (71,315 | ) | (5,973 | ) | — | |||||||
|
|
|
|
|
| |||||||
Net cash provided by operating activities | 439,302 | 133,339 | 402,052 | |||||||||
|
|
|
|
|
| |||||||
INVESTING ACTIVITIES | ||||||||||||
Sale of investment in associates | — | 26,565 | 21,900 | |||||||||
Sale of investment in subsidiaries | — | — | 107,162 | |||||||||
Sale of available-for-sale investment | 342 | — | — | |||||||||
Sale of property, machinery and equipment | 23,471 | 6,436 | 20,849 | |||||||||
Dividends received | 2,057 | 34,709 | 8,117 | |||||||||
Payment for purchase of property investments | (956 | ) | — | — | ||||||||
Payments for intangible purchase | (10,851 | ) | (44,146 | ) | (20,662 | ) | ||||||
Payments for investments in associates (Note 13) | — | — | (973 | ) | ||||||||
Direct cash inflow from acquisition (Payment for investment purchase) (Note 28) | (172,536 | ) | 31,660 | 7,746 | ||||||||
Payments for fixed asset purchase | (43,780 | ) | (140,803 | ) | (124,212 | ) | ||||||
|
|
|
|
|
| |||||||
Net cash (applied to) provided by investing activities | (202,253 | ) | (85,579 | ) | 19,927 | |||||||
|
|
|
|
|
| |||||||
FINANCING ACTIVITIES | ||||||||||||
Loans received | 315,626 | 185,701 | 48,939 | |||||||||
Amortization of loans received | (289,932 | ) | (181,307 | ) | (129,874 | ) | ||||||
Interest payment | (46,659 | ) | (24,198 | ) | (18,009 | ) | ||||||
Dividends paid | (86,723 | ) | (55,015 | ) | (26,880 | ) | ||||||
Dividends paid to non-controlling interest | (37,512 | ) | (14,850 | ) | — | |||||||
Cash received (contribution return) to non-controlling shareholders (Note 31 d) | 26,096 | (13,328 | ) | (1,073 | ) | |||||||
Acquisition of interest in a subsidiary of non-controlling shareholders | (4,393 | ) | — | — | ||||||||
Sale of interest in subsidiary to non-controlling interest | 1,193 | — | — | |||||||||
Capital contribution | 5,750 | 30,776 | — | |||||||||
Repurchase of shares | 1,432 | (241 | ) | (119 | ) | |||||||
|
|
|
|
|
| |||||||
Net cash applied to financing activities | (115,122 | ) | (72,462 | ) | (127,016 | ) | ||||||
|
|
|
|
|
| |||||||
(Net decrease) net increase in cash | 121,927 | (24,702 | ) | 294,963 | ||||||||
Cash and cash equivalents at the beginning of the year | 658,187 | 682,889 | 387,926 | |||||||||
|
|
|
|
|
| |||||||
Cash and cash equivalents at the end of the year | 780,114 | 658,187 | 682,889 | |||||||||
|
|
|
|
|
| |||||||
NON-CASH TRANSACTIONS: | ||||||||||||
Capitalization of retained earnings | 167,485 | — | — | |||||||||
Debt capitalization | 12,232 | — | — | |||||||||
Acquisition of assets through finance leases | 225,874 | 146,580 | 108,027 | |||||||||
The accompanying notes on pages 7 to 81 are an integral part of the consolidated financial statements.
F-7
Table of Contents
GRAÑA Y MONTERO S.A.A. AND SUBSIDIARIES
NOTES TO THE CONSOLIDATED FINANCIAL STATEMENTS
DECEMBER 31, 2012, 2011 AND 2010
| 1 | GENERAL INFORMATION |
| a) | Incorporation and operations - |
Graña y Montero S.A.A. (hereinafter the Company) was established in Peru on August 12, 1996 as a result of the equity spin-off of Inversiones GyM S.A. (formerly Graña y Montero S.A.). The Company’s legal address is Av. Paseo de la República 4675, Surquillo and it is listed on the Lima Stock Exchange.
The Company is the parent company of the Graña y Montero Group (hereinafter the Group) and its principal activity is the holding of the investments in the different companies of the Group. Additionally, the Company provides services of general management, financial management, commercial management, legal advisory and human resources management to Group companies; it is also engaged in the leasing of offices to Group companies and third parties.
The Group is a conglomerate of companies with operations including different business activities, of which the most significant are engineering and construction, infrastructure (public concession ownership and operation), real estate businesses and technical services. See details of operating segments in Note 5.
| b) | Subsidiaries and Joint Operations - |
The consolidated financial statements of the Group include the accounts of the Company and of its subsidiaries. Additionally, the consolidated financial statements of the Group include Joint Operations accounts in which the Company or certain subsidiaries maintain joint control with their Joint Operations partners.
Subsidiaries -
Name | Country | Economic activity | ||
| GyM S.A. | Peru, Chile and Dominican Republic | Civil construction, electro-mechanic assembly buildings, management and implementing housing development projects and other related services. | ||
| GMP S.A. | Peru | Services of producing, treating and selling oil, natural gas and by-products as well as storage and dispatch of fuel. Oil and gas fields have undergone feasibility studies demonstrating that it is feasible to obtain resources from production; under this assumption, a concession was granted to the Company by the Peruvian government. | ||
| GMD S.A. | Peru | Information technology services. (Include Telefónica Servicios Digitales S.A. (TSD) - 100% | ||
| GMI S.A. | Peru | Advisory and consultancy services in engineering, carrying out studies and projects, managing projects and supervision of works. | ||
| Concar S.A. | Peru | Operating and maintaining roads under concession. | ||
| Survial S.A. | Peru | Carrying out the concession agreement of road section 1 (“Tramo 1”) of the Southern Inter-oceanic highway. | ||
| Concesión Canchaque S.A. | Peru | Implementing the concession agreement for the Buenos Aires - Canchaque highway. | ||
| VIVA GyM | Peru | Real estate business, management services and managing | ||
| projects and other activities related to the real-estate and | ||||
| construction sector. | ||||
F-8
Table of Contents
(All amounts are expressed in thousands of S/. unless otherwise stated)
Name | Country | Economic activity | ||
| Norvial S.A. | Peru | Holding the concession of the “Ancón - Huacho - Pativilca” road section of the Panamericana Norte Highway. | ||
| Promotora Larcomar S.A. | Peru | Construction of a hotel complex on a plot of land located in the district of Miraflores. | ||
| Generadora Arabesco S.A. | Peru | Implementing projects related to electric power-generating activities. | ||
| GyM Ferrovías S.A. | Peru | Lima Electric Train concession operator. | ||
| CAM Holding S.p.A. | Chile, Peru, Brazil and Colombia | Specialized in providing services to the electric power sector. | ||
| Concesionaria La Chira S.A. | Peru | Engaged in activities related to waste water treatment plants | ||
| (WTP) and Emisor Submarino La Chira (outfall) | ||||
| Ingeniería y Construcción Vial y Vives S.A. | Chile | Developing activities related to the construction of engineering projects, civil construction projects and electromechanical assemblies, as well as architectural design and installations in general. | ||
| Stracon GyM S.A. | Peru | Engaged in mining contracting activities, providing mining services and carrying out drilling, demolition and any other activity related to construction and mining operations. | ||
| Promotores Asociados S.A. | Peru | Operating in the real-estate industry and engaged in the development and selling office facilities in Peru. | ||
| Larcomar S.A. | Peru | A company that owns the land use right of Larcomar Shopping Center and assigned to Fashion Center S.A. | ||
| Fashion Center S.A. | Peru | A company engaged in developing and operating the project for the conditioning and commercial and recreational use of Parque Salazar in the district of Miraflores, in Lima. | ||
The following are the Group’s subsidiaries and related interests at December 31:
| Percentage of interest | ||||||||||||
Subsidiaries | 2012 | 2011 | 2010 | |||||||||
GyM S.A. | 93.67 | % | 93.84 | % | 93.84 | % | ||||||
GMP S.A. | 95.00 | % | 95.00 | % | 95.00 | % | ||||||
GMD S.A. | 88.68 | % | 88.68 | % | 88.68 | % | ||||||
GMI S.A. | 89.41 | % | 89.41 | % | 89.41 | % | ||||||
Concar S.A. | 99.57 | % | 99.97 | % | 99.97 | % | ||||||
Survial S.A. | 99.99 | % | 73.00 | % | 73.00 | % | ||||||
Concesión Canchaque S.A. | 99.97 | % | 99.97 | % | 99.97 | % | ||||||
Viva GyM | 59.12 | % | 52.43 | % | 52.43 | % | ||||||
Norvial S.A. (*) | 50.10 | % | 50.01 | % | 50.01 | % | ||||||
Promotora Larcomar S.A. (*) | 42.80 | % | 42.80 | % | 42.80 | % | ||||||
Generadora Arabesco S.A. | 99.00 | % | 99.00 | % | 99.00 | % | ||||||
GyM Ferrovias S.A. | 75.00 | % | 75.00 | % | 0.00 | % | ||||||
Fashion Center S.A. (***) | — | 65.71 | % | 65.71 | % | |||||||
CAM Holding S.P.A. | 100.00 | % | 100.00 | % | — | |||||||
Concesionaria La Chira S.A. (*) | 50.00 | % | 50.00 | % | — | |||||||
Ingenieria y Construcción Vial y Vives S.A. (**) | 74.00 | % | — | — | ||||||||
Stracon GyM S.A. (**) | 74.15 | % | — | — | ||||||||
Promotores Asociados | 99.99 | % | 99.99 | % | 99.99 | % | ||||||
Larcomar S. A. | 79.66 | % | 79.66 | % | 79.66 | % | ||||||
Oiltanking Andina S.A. (*) (**) | 50.00 | % | — | — | ||||||||
Cam Chile (**) | 75.00 | % | 75.00 | % | — | |||||||
Telefónica Servicios Digitales S.A. (TSD) (**) | 100.00 | % | 100.00 | % | 100.00 | % | ||||||
| (*) | Management has control over these subsidiaries because it has total financial and operating decision-making power. Graña y Montero has the largest number of representatives on the Board and the general management of the companies. There were no transactions with the non-controlling interest. |
| (**) | These entities are indirect subsidiaries as of December 31, 2012. (See Notes 13 and 28). |
F-9
Table of Contents
(All amounts are expressed in thousands of S/. unless otherwise stated)
| (***) | In July 2010, the Group sold its of 65.71% interest in Fashion Center S.A. for S/.107,162 thousand, which carrying amount was S/.49,191 thousand. This transaction resulted in a profit of S/.57.971 million and the cash inflows from this sale are stated in the consolidated statement of cash flows within “sale of investments” under investing activities. |
In the subsidiaries described above, the Company has maintained control directly or indirectly through its subsidiaries both during in 2012 and 2011, except for Ingeniería y Construcción Vial y Vives S.A., and Stracon GyM S.A., which were acquired in 2012.
Joint Operations -
As of December 31, 2012, the Group participates in 55 Joint Operations (49 as of December 31, 2011 and 39 as of December 31, 2010). The following table contains all the Joint Operations in which the Group is participating:
| Percentage of interest | ||||||||||||
Joint Operations | 2012 | 2011 | 2010 | |||||||||
Graña y Montero S.A.A. | ||||||||||||
- Asociación en participación Torre Siglo XXI | 58.00 | % | 58.00 | % | 58.00 | % | ||||||
- Asociación Edificio T6 | 50.00 | % | 50.00 | % | 50.00 | % | ||||||
GyM S.A. | ||||||||||||
- Consorcio Pasco | 70.00 | % | 70.00 | % | 70.00 | % | ||||||
- Consorcio Constructor Alto Cayma | 50.00 | % | 50.00 | % | 50.00 | % | ||||||
- Consorcio Rio Pallca - Huanza | 40.00 | % | 40.00 | % | 40.00 | % | ||||||
- Consorcio Tren eléctrico | 33.00 | % | 33.00 | % | 33.00 | % | ||||||
- Consorcio GyM Concar | 10.00 | % | 10.00 | % | 10.00 | % | ||||||
- Consorcio GyM Ayahuaylas | 10.00 | % | 10.00 | % | 10.00 | % | ||||||
- Consorcio Alto Cayma | 49.00 | % | 40.00 | % | 40.00 | % | ||||||
- Consorcio Vial Ayacucho | 50.00 | % | 50.00 | % | 50.00 | % | ||||||
- Consorcio Vial Sullana | 10.00 | % | 10.00 | % | 10.00 | % | ||||||
- Consorcio ICAPAL | 10.00 | % | 10.00 | % | 10.00 | % | ||||||
- Consorcio Lima Actividades Comerciales | 50.00 | % | 50.00 | % | 50.00 | % | ||||||
- Consorcio GyM - COSAPI | 50.00 | % | 50.00 | % | 50.00 | % | ||||||
- Consorcio Lima Actividades Comerciales Sur | 50.00 | % | 50.00 | % | 50.00 | % | ||||||
- Consorcio Atocongo | 40.00 | % | 40.00 | % | — | |||||||
- Consorcio Norte Pachacutec | 49.00 | % | 49.00 | % | — | |||||||
- Consorcio La Chira | 50.00 | % | 50.00 | % | — | |||||||
- Consorcio Río Urubamba | 60.00 | % | 60.00 | % | — | |||||||
- Consorcio Vial Quinua | 46.00 | % | 46.00 | % | — | |||||||
- Consorcio Rio Mantaro | 50.00 | % | 50.00 | % | — | |||||||
- Consorcio GyM - CONCIVILES | 66.70 | % | — | — | ||||||||
- Consorcio Toromocho | 55.00 | % | — | — | ||||||||
- Consorcio Marcona (*) | 70.00 | % | 70.00 | % | 70.00 | % | ||||||
- Consorcio IIRSA-Norte | — | 17.00 | % | 17.00 | % | |||||||
- Consorcio GyM Sade Skanska (*) | 50.00 | % | 50.00 | % | 50.00 | % | ||||||
- Consorcio Heroes Navales (*) | 50.00 | % | 50.00 | % | 50.00 | % | ||||||
- Consorcio GyM Evisac (*) | 70.00 | % | 70.00 | % | 70.00 | % | ||||||
- Consorcio Chiquintirca (*) | 40.00 | % | 40.00 | % | 40.00 | % | ||||||
- Consorcio La Gloria (*) | 49.00 | % | 49.00 | % | 49.00 | % | ||||||
- Consorcio Cementero - Yura (*) | 37.50 | % | 37.50 | % | 37.50 | % | ||||||
- Consorcio La Zanja (*) | 70.00 | % | 70.00 | % | 70.00 | % | ||||||
F-10
Table of Contents
(All amounts are expressed in thousands of S/. unless otherwise stated)
| Percentage of interest | ||||||||||||
Joint Operations | 2012 | 2011 | 2010 | |||||||||
GyM S.A. | ||||||||||||
- Consorcio Tiwu (*) | 70.00 | % | 70.00 | % | — | |||||||
- Consorcio STRACON JV (*) | 70.00 | % | 70.00 | % | 70.00 | % | ||||||
GMP S.A. | ||||||||||||
- Consorcio Terminales | 50.00 | % | 50.00 | % | 50.00 | % | ||||||
CONCAR S.A. | ||||||||||||
- Consorcio Vial Sullana | 90.00 | % | 90.00 | % | 90.00 | % | ||||||
- Consorcio ICAPAL | 90.00 | % | 90.00 | % | 90.00 | % | ||||||
- Consorcio GyM Ayahuaylas | 90.00 | % | 90.00 | % | 90.00 | % | ||||||
- Consorcio GyM Concar | 90.00 | % | 90.00 | % | 90.00 | % | ||||||
- Consorcio Ancón-Pativilca | 50.00 | % | 50.00 | % | 50.00 | % | ||||||
- Consorcio Peruano de Conservación | 50.00 | % | 50.00 | % | 50.00 | % | ||||||
- Consorcio Red Vial 1 | 70.00 | % | 70.00 | % | 70.00 | % | ||||||
GMD S.A. | ||||||||||||
- Consorcio Telefónica del Perú S.A.A. - GMD S.A. | 50.00 | % | 50.00 | % | 50.00 | % | ||||||
- Consorcio Ransa | 50.00 | % | 50.00 | % | 50.00 | % | ||||||
- Consorcio Cosapi-Data | 50.00 | % | 50.00 | % | 50.00 | % | ||||||
- Consorcio Lima Actividades Sur | 50.00 | % | 50.00 | % | 50.00 | % | ||||||
- Consorcio TLBG | 66.45 | % | 66.45 | % | — | |||||||
- Consorcio Procesos digitales | 24.25 | % | 24.25 | % | — | |||||||
- Consorcio Indra | 50.00 | % | 50.00 | % | — | |||||||
- Consorcio Fábrica de Software | 50.00 | % | — | — | ||||||||
- Consorcio Gestión de Procesos Electorales (ONPE) | 50.00 | % | 50.00 | % | 50.00 | % | ||||||
- Consorcio GMD - Cosapi - Data (RENIEC) | 70.00 | % | — | — | ||||||||
- Consorcio Corporación TX (*) | — | 50.00 | % | 50.00 | % | |||||||
VIVA GyM S.A. | ||||||||||||
- Consorcio Cuartel San Martín | 50.00 | % | — | — | ||||||||
GMI S.A. | ||||||||||||
- Consorcio Vial Ayahuaylas | 5.00 | % | — | — | ||||||||
- Consorcio Norte Pachacútec | 1.00 | % | — | — | ||||||||
| (*) | The Joint Operations listed above are currently undergoing a closing process and therefore, in the current year have not shown any significant commercial operations. |
The Group’s consolidated financial statements do not include any other additional entities than those mentioned above, such as trust funds or special purpose entities.
| c) | Acquisition of subsidiaries - |
In 2012, the Group, through some of its subsidiaries obtained control over certain entities. It obtained control over a Chilean entity called Ingeniería y Construcción Vial y Vives S.A. (hereinafter Vial y Vives) for a purchase price of US$55.6 million; and it acquired control of a business of an entity called Stracon GyM at a purchase price of US$16.4 million. In 2011, the Group acquired control of CAM Holding S.p.A. at a purchase price of US$10.8 million. The detail of the related transactions and their resulting accounting impact are described in Note 28.
F-11
Table of Contents
(All amounts are expressed in thousands of S/. unless otherwise stated)
| d) | Approval of the financial statements - |
The consolidated financial statements of Graña y Montero S.A.A. for the year ended December 31, 2012 have been prepared and approved by Management on February 28, 2013 and will be submitted to the Board of Directors within the term established by law.
| 2 | SUMMARY OF SIGNIFICANT ACCOUNTING POLICIES |
The principal accounting policies applied in the preparation of these consolidated financial statements are set out below. These policies have been consistently applied to all the years presented, unless otherwise stated.
| 2.1 | Basis of preparation |
The consolidated financial statements of Graña y Montero S.A.A. have been prepared in accordance with International Financial Reporting Standards (IFRS) and IFRIC interpretations as issued by the International Accounting Standards Board.
The consolidated financial statements have been prepared under the historical cost convention, except for derivative financial instruments and available-for-sale financial assets which are measured at fair value. The financial statements are presented in thousands of New Peruvian Soles, unless otherwise stated.
The preparation of the consolidated financial statements in conformity with IFRS requires the use of certain critical accounting estimates. It also requires management to exercise its judgment in the process of applying the Group’s accounting policies. The areas involving a higher degree of judgment or complexity, or areas where assumptions and estimates are significant to the consolidated financial statements are disclosed in Note 4.
| 2.2 | Consolidation of financial statements |
| a) | Subsidiaries - |
Subsidiaries are all entities over which the Company has the power to govern the financial and operating policies, generally accompanying a shareholding of more than one half of the voting rights.
Subsidiaries are fully consolidated from the date on which control is transferred to the Group. They are deconsolidated from the date that control ceases.
The Group applies the acquisition method to account for business combinations. The consideration transferred for the acquisition of a subsidiary is the fair value of the assets transferred, the liabilities assumed and the equity instruments issued by the Group. The consideration transferred includes the fair value of any asset or liability resulting from a contingent consideration arrangement. Identifiable assets acquired and liabilities and contingent liabilities assumed in a business combination are measured initially at their fair values at the acquisition date. The Group recognizes any non-controlling interest in the acquiree on an acquisition-by-acquisition basis, either at fair value or at the non-controlling interest’s proportionate share of the recognized amounts of acquiree’s identifiable net assets.
Acquisition-related costs are expensed as incurred.
Goodwill is initially measured as the excess of the aggregate of the consideration transferred and the fair value of non-controlling interest over the net identifiable assets acquired and liabilities assumed. If this consideration is lower than the fair value of the net assets of the subsidiary acquired, the difference is recognized in profit or loss at the time of acquisition.
F-12
Table of Contents
(All amounts are expressed in thousands of S/. unless otherwise stated)
Balances, income and expenses from transactions between Group companies are eliminated. Profits and losses resulting from inter-company transactions that are recognized as assets are also eliminated. Accounting policies of subsidiaries have been changed where necessary to ensure consistency with the policies adopted by the Group.
| b) | Changes in ownership interests in subsidiaries without change of control - |
Transactions with non-controlling interests that do not result in loss of control are accounted for as equity transactions - that is, as transactions with the owners in their capacity as owners. The difference between fair value of any consideration paid and the relevant share acquired of the carrying value of net assets of the subsidiary is recorded in equity. Gains or losses on disposals to non-controlling interests, which do not result in changes in the control of the subsidiary, are also recorded in equity at the time of disposal.
| c) | Disposal of subsidiaries - |
When the Group ceases to have control over a subsidiary any retained interest in the entity is re-measured to its fair value at the date when control is lost, with the change in carrying amount recognized in profit or loss at such date. The fair value is the initial carrying amount for the purposes of subsequently accounting for the retained interest as an associate, joint venture or financial asset. In addition, any amounts previously recognized in other comprehensive income in respect of that entity are accounted for as if the Group had directly disposed of the related assets or liabilities. This may mean that amounts previously recognized in other comprehensive income are reclassified to profit or loss.
| d) | Joint Operations - |
Jointly controlled operations involve the use of assets and other resources of the venturers rather than the establishment of a separate entity. Each venturer uses its own assets, incurs its own expenses and liabilities, and raises its own finance. Because the assets, liabilities, income and expenses are recognised in the financial statements of the venturer, no adjustments or other consolidation procedures are required in respect of these items when the venturer presents consolidated financial statements.
| e) | Associates - |
Associates are all entities over which the Group has significant influence but not control, generally accompanying a shareholding of between 20% and 50% of the voting rights. Investments in associates are accounted for using the equity method of accounting. Under the equity method, the investment is initially recognized at cost, and the carrying amount is increased or decreased to recognize the Group’s share of the profit or loss of the investee after the date of acquisition. The Group’s investment in associates includes goodwill identified on acquisition, if the associate was acquired and not established with capital contributions.
If ownership interest in an associate of the Group is reduced but significant influence is retained, only a proportionate share of the amounts previously recognized in other comprehensive income is reclassified to profit or loss where appropriate.
The Group’s share of post-acquisition profit or loss is recognized in the income statement, and its share of post acquisition movements in other comprehensive income is recognized in other comprehensive income with a corresponding adjustment to the cost of the investment. When the Group’s share of losses in an associate equals or exceeds its interest in the associate, including any other unsecured receivables, the Group does not recognize further losses, unless it has incurred legal or constructive obligations or made payments on behalf of the associate.
F-13
Table of Contents
(All amounts are expressed in thousands of S/. unless otherwise stated)
The Group determines at each reporting date whether there is any objective evidence that the investment in the associate is impaired. If this is the case, the Group calculates the amount of impairment as the difference between the recoverable amount of the associate and its carrying value and recognizes the amount adjacent to ‘share of profit of an associate’ in the statement of comprehensive income.
Profits and losses resulting from upstream and downstream transactions between the Group and its associates are recognized in the Group’s financial statements only to the extent of unrelated investor’s interests in the associates. Unrealized losses are eliminated unless the transaction provides evidence of an impairment of the asset transferred. Accounting policies of associates have been changed where necessary to ensure consistency with the policies adopted by the Group.
| 2.3 | Segment reporting |
Operating segments are reported in a manner consistent with the internal reporting provided to the chief operating decision-maker of the Group. The chief operating decision-maker, who is responsible for allocating resources and assessing performance of the operating segments, has been identified as the Corporate General Manager.
If an entity changes the structure of its internal organization in a manner that causes the composition of its reportable segments to change, the Group restates the information for earlier periods unless the information is not available. Operating segments are identified based on the internal information effective at the date of the financial statements.
| 2.4 | Foreign currency translation |
| a) | Functional and presentation currency - |
Items included in the financial statements of each of the Group’s entities are measured using the currency of the primary economic environment in which each entity operates (the functional currency). The consolidated financial statements are presented in New Peruvian Soles, which is the Company’s functional currency and the Group’s presentation currency. All subsidiaries and Joint Operations use the New Peruvian Sol as their functional currency, except for subsidiaries abroad, for which the functional currency is the currency of the country in which they operate.
| b) | Transactions and balances - |
Foreign currency transactions are translated into the functional currency using the exchange rates prevailing at the date of the transactions or valuation when items are re-measured. Foreign exchange gains and losses resulting from the settlement of such transactions and from the changes at year-end exchange rates of monetary assets and liabilities denominated in foreign currencies are recognized in the income statement, except when deferred in equity as qualifying cash flow hedges.
Foreign exchange gains and losses that relate to borrowings, cash and cash equivalents and other monetary items are presented in the income statement within exchange difference, net.
| c) | Group companies - |
The results, assets and liabilities of Group entities (none of which has the currency of a hyper-inflationary economy) that have a functional currency different from the presentation currency are changed into the presentation currency as follows:
F-14
Table of Contents
(All amounts are expressed in thousands of S/. unless otherwise stated)
| i) | assets and liabilities for each statement of the financial position presented are changed using the closing rate at the date of the statement of financial position; |
| ii) | income and expenses for each income statement are changed at the average exchange rate (unless this average is not a reasonable approximation of the cumulative effect of the rates prevailing on the transaction dates, in which case income and expenses are changed using the rate on the date of the transaction); |
| iii) | Capital is changed by using the historical exchange rate for each capital contribution made; and |
| iv) | all resulting exchange differences are recognized as separate components in other comprehensive income. As of December 31, 2012 and 2011 the translation of foreign investments, with a currency other than the nuevo sol (Global change), did not generate relevant conversion differences. |
Goodwill and fair value adjustments arising on the acquisition of a foreign entity are treated as assets and liabilities of the foreign entity and changed at the closing rate. Exchange differences arising are recognized in other comprehensive income.
| 2.5 | Public services concessions |
Concession agreements signed between the Group and the Peruvian Government are where the Group, as a concessionaire, assumes obligations for the construction or improvement of infrastructure and which qualify as public service concessions as defined by IFRIC 12, “Service Concession Arrangements”. The consideration to be received from the Government for the services of constructing or improving public infrastructure is recognized as a financial asset or as an intangible asset, as set forth below.
The Group manages two types of recognition for these concessions, it:
| a) | recognizes a financial asset to the extent that it has a contractual right to receive cash or another financial assets either because the Government secures the payment of specified or determinable amounts or because the Government will cover any difference arising from the amounts actually received from public service users in relation with the specified or determinable amounts. |
| b) | recognizes an intangible asset to the extent that the service agreement grants the Group a contractual right to charge users of the public service. (Note 2.15). |
| a) | The following are the concessions recognized by the Group as a financial asset: |
| i) | Survial S.A. concession |
Under the Survial concession, the Company operates and maintains a 750 km road from the San Juan de Marcona port to Urcos, Peru, which is connected to an interoceanic road that runs up to the Peruvian-Brazilian border. The road has five toll stations and three weigh stations. The concession was awarded to Survial in 2007 for a 25-year term. The Company owns 99.9% of Survial.
The obligations under the concession include the construction of the road, which was completed in 2010. The revenue from this concession consists of an annual fee paid to Survial by the Peruvian Ministry of Transport and Communications in consideration for the operation and maintenance of the road, which fee can vary depending on the amount of maintenance required due to road damages. The revenue in this concession does not depend on traffic volume.
F-15
Table of Contents
(All amounts are expressed in thousands of S/. unless otherwise stated)
This concession is recognized as a financial asset because Survial has the unconditional contractual right to receive cash or other financial asset; such operation is secured contractually by the Peruvian Government. Survial receives specific and determinable amounts of cash and measures the financial asset at amortized cost, taking into consideration the effective interest rate set forth in IAS 39, ‘Financial Instruments: Recognition and Measurement’.
| ii) | Canchaque S.A.C. concession |
Under the Canchaque concession, the Company operates and maintains a 78 km road from the towns of Buenos Aires to Canchaque, in Peru. The road has one toll station. The concession was awarded to Canchaque in 2006 for a 15-year term. The Company owns 99.9% of Canchaque. The obligations under the concession include the construction of the road, which was completed in 2009. Revenue from this concession consists of an annual fee paid by the Peruvian Ministry of Transport and Communications in consideration for the operation and maintenance of the road, which fee can vary depending on the amount of road maintenance required due to road wear and tear. The revenue received by the Company in this concession does not depend on traffic volume.
This concession granted to the Company comprises public services and investments qualifying as a financial asset as the Company has the unconditional right to receive cash or other financial assets from the collection of annual payments for maintenance and operation. Canchaque recognizes such financial asset at amortized cost, using in its calculation the interest rate set forth under IAS 39 Financial instruments: recognition and measurement.
| iii) | La Chira S.A. concession |
In 2011, the Company was awarded a 25-year concession for the construction, operation and maintenance of La Chira waste water treatment plant in the south of Lima. The project is aimed at addressing Lima’s environmental problems caused by sewage discharged directly into the sea. The Company holds a 50% share in this project and the Company´s partner Acciona Agua holds the remaining 50%. La Chira’s annual revenues under the concession are in the form of a fee paid by Sedapal S.A., the public utility company responsible for the supervision of the water service in Lima.
This concession granted to the Company comprises public services and investments qualifying as a financial asset as the Company has the unconditional right to receive cash or other financial assets through collections of revenue charged for maintaining the plant.
The concession is recognized as a financial asset at its amortized cost, taking into consideration the effective interest rate calculation set forth in IAS 39, ‘Financial Instruments: Recognition and Measurement’.
| iv) | GyM Ferrovías S.A. concession |
In 2011, the Company was awarded a 30-year concession for the operation of Line One of the Lima Metro, Peru’s only urban railway system. The concession was awarded to the subsidiary GyM Ferrovías, in which the Company holds a 75% ownership interest, with the other 25% being held by Ferrovías S.A.C. The obligations under the contract include (i) the operation and maintenance of the five existing trains provided by the government; (ii) the acquisition of 19 new trains on behalf of the Peruvian government, which will be the legal owner of such trains; (iii) the operation and maintenance of the 19 additional trains; and (iv) the design and construction of the railway maintenance and repair yard. Revenue from this concession consists of a quarterly fee that received from the Ministry of Transport and Communications based on the kilometers travelled per train. The revenue does not depend on passenger traffic volume.
F-16
Table of Contents
(All amounts are expressed in thousands of S/. unless otherwise stated)
The concession given to the Company comprises public services and investments qualifying as a financial asset as the Company has the unconditional right to receive cash or other financial asset for the collection of the secured kilometers.
The concession is recognized as a financial asset at its amortized cost, taking into consideration the effective interest rate calculation set forth in IAS 39, ‘Financial Instruments: Recognition and Measurement’.
| b) | The following are the concession is recognized by the Group as an intangible asset: |
| i) | Norvial S.A. concession |
Under the Norvial concession, the Company operates and maintains part of the only highway that connects Lima to the northwest of Peru. This 183-km road known as Red Vial 5, runs from the cities of Ancón to Pativilca and has three toll stations. The concession was awarded to Norvial in 2003 for a 25-year term. The Company owns 50.1% of Norvial. Norvial’s revenue derives from the collection of tolls. The toll fee is determined by the Peruvian Ministry of Transport and Communications and adjusted on a yearly basis in accordance with a contractual formula that takes into account the nuevo sol/U.S. dollar exchange rate and Peruvian and U.S. inflation. The Company is required to transfer 5.5% of monthly toll revenue to the Peruvian Ministry of Transport and Communications and pay a 1% regulatory fee to the Peruvian Supervisory Agency for Investment in Public Transportation Infrastructure. The obligations under the concession include expanding the already existing road by, among other things, adding two additional lanes. The first stage of construction was completed in 2008 and the second stage is expected to begin between 2014 and 2015. When the construction of the second stage begins, the Company will also be required to pay a one-time estimated fee of approximately US$1.8 million to the Peruvian Supervisory Agency for Investment in Public Transportation Infrastructure.
The concession given to the Company comprises public services and investments qualifying as an intangible asset because the concession agreement grants the right to charge a predefined and adjustable rate to users. The cost of the intangible comprises the investment committed, executed or to be executed to the extent their amount and borrowing costs can be estimated reliably.
See revenue recognition policy in Note 2.25-vii.
| 2.6 | Cash and cash equivalents |
In the consolidated statement of cash flows, cash and cash equivalents include cash on hand, on-demand bank deposits, other highly liquid investments with original maturities of three months or less and bank overdrafts. In the consolidated financial statements, bank overdrafts are included in the balance of financial obligations as current liabilities.
| 2.7 | Financial assets |
2.7.1 Classification
The Group classifies its financial assets in the following categories: financial assets at fair value through profit or loss, financial assets held-to-maturity, loans and account receivables and financial assets available for sale. The classification depends on the purpose for which the financial assets were acquired. Management determines the classification of its financial assets at initial recognition. As of the date of the financial statements, the Group has classified its financial assets in the following two categories:
F-17
Table of Contents
(All amounts are expressed in thousands of S/. unless otherwise stated)
| a) | Loans and accounts receivable - |
Loans and receivables are non-derivative financial assets with fixed or determinable payments that are not quoted in an active market. They are included in current assets, except for maturities greater than 12 months after the statement of financial position. These are classified as non-current assets. The Group’s loans and receivables comprise ‘trade and other receivables’ and ‘cash and cash equivalents’.
| b) | Available-for-sale financial assets - |
Available-for-sale financial assets are non-derivatives that are either designated in this category or not classified in any of the other categories. They are included in non-current assets unless Management intends to dispose of it within 12 months of the date of the statement of financial position.
Available-for-sale financial assets are measured at fair value and changes in their value are recognized in Other comprehensive income.
2.7.2 Recognition and measurement
Regular purchases and sales of financial assets are recognized on the trade-date, the date on which the Group commits to purchase or sell the asset. Investments are initially recognized at fair value plus transaction costs for all financial assets not carried at fair value through profit or loss. Investments are derecognized when the rights to receive cash flows from the investments have expired or have been transferred and the Group has transferred substantially all risks and rewards of ownership. Available-for-sale financial assets are subsequently carried at fair value. Loans and receivables are subsequently carried at amortized cost using the effective interest method.
If the fair value of available-for-sale assets cannot be estimated initially, they are maintained at cost.
Changes in the fair value of financial assets classified as available for sale are recognized in other comprehensive income.
When a financial asset classified as available for sale is sold or impaired, the accumulated fair value adjustments recognized in equity are included in the statement of comprehensive income.
Interest on available-for-sale securities, calculated using the effective interest method are recognized in the statement of comprehensive income as part of “other income”. Dividends on available-for-sale equity instruments are recognized in the statement of comprehensive income as part of “other income” when the Group’s right to receive payments is established.
| 2.8 | Offsetting financial instruments |
Financial assets and liabilities are offset and its net amount is reported in the statement of financial position when there is a legally enforceable right to offset the recognized amounts and there is an intention to settle on a net basis or realize the asset and settle the liability simultaneously.
| 2.9 | Impairment of financial assets |
| a) | Assets carried at amortized cost - |
The Group assesses at the end of each reporting period whether there is objective evidence that a financial asset or a group of financial assets is impaired. If a financial asset or a group of financial assets is impaired, the impairment losses are incurred only if there is objective evidence of impairment as a result of one or more events that occurred after the initial recognition of the asset (a ‘loss event’) and that loss event (or events) has an impact on the estimated future cash flows of the financial asset or group of financial assets that can be reliably estimated.
F-18
Table of Contents
(All amounts are expressed in thousands of S/. unless otherwise stated)
Evidence of impairment may include, for example, indications that a debtor or a group of debtors is experiencing significant financial difficulty, default or delinquency in interest or principal payments, the probability that they will enter bankruptcy or other financial reorganization, and where observable data indicate that there is a measurable decrease in the estimated future cash flows.
For the loans and receivables category, the amount of the loss is measured as the difference between the asset’s carrying amount and the present value of estimated future cash flows (excluding future credit losses that have not been incurred) discounted at the financial asset’s original effective interest rate. The carrying amount of the asset is reduced and the amount of the loss is recognized in the statement of comprehensive income. If a loan or an account receivable has a variable interest rate, the discount rate for measuring any impairment loss is the current effective interest rate determined under the contract. As a practical expedient, the Group may measure impairment on the basis of an instrument’s fair value using an observable market price, as long as it is verifiable.
If, in a subsequent period, the amount of the impairment loss decreases and the decrease can be related objectively to an event occurring after the impairment was recognized (such as an improvement in the debtor’s credit rating), the reversal of the previously recognized impairment loss is recognized in the statement of comprehensive income.
| b) | Assets classified as available for sale - |
The Group assesses at the end of each reporting period whether there is objective evidence that a financial asset or a group of financial assets is impaired. For debt securities, the Group uses the criteria referred to in (a) above. In the case of equity investments, a significant or prolonged decline in the fair value of the security below its cost is also evidence that the assets are impaired. If any such evidence exists for available-for-sale financial assets, the cumulative loss - measured as the difference between the acquisition cost and the current fair value, less any impairment loss on that financial asset previously recognized in profit or loss - is removed from equity and recognized in profit or loss. Impairment losses recognized in the statement of comprehensive income on equity instruments are not reversed through the statement of comprehensive income. If, in a subsequent period, the fair value of a debt instrument classified as available for sale increases and the increase can be objectively related to an event occurring after the impairment loss was recognized in profit or loss, the impairment loss is reversed through the profit or loss of the period.
| 2.10 | Derivative financial instruments and hedging activities |
Derivatives are initially recognized at fair value on the date a derivative contract is entered into and are subsequently re-measured at their fair value. The method of recognizing the resulting gain or loss depends on whether the derivative is designated as a hedging instrument, and if so, the nature of the item being hedged. The Group designates certain derivatives as hedges of a particular risk associated with a recognized asset or liability or a highly probable forecast transaction (cash flow hedge).
The Group documents, at the inception of the transaction, the relationship between hedging instruments and hedged items, as well as its risk management objectives and strategy for undertaking various hedging transactions. The Group also documents its assessment, both at hedge inception and on an ongoing basis, of whether the derivatives that are used in hedging transactions are highly effective in offsetting changes in fair values or cash flows of hedged items.
The fair values of various derivative instruments used for hedging purposes and changes in the account reserves for hedging in equity are disclosed in Note 3.3. The full fair value of a hedging derivative is classified as a non-current asset or liability when the remaining hedged item is more than 12 months and as a current asset or liability when the remaining maturity of the hedged item is less than 12 months. Trading derivatives are classified as a current asset or liability.
F-19
Table of Contents
(All amounts are expressed in thousands of S/. unless otherwise stated)
Cash flow hedge -
The effective portion of changes in the fair value of derivatives that are designated and qualify as fair value hedges is recognized as other comprehensive income. The gain or loss relating to the ineffective portion is recognized immediately in the statement of comprehensive income within ‘other comprehensive income’.
Amounts accumulated in equity are reclassified to profit or loss in the periods when the hedged item affects profit or loss (for example, when the forecast sale that is hedged takes place). The gain or loss relating to the effective portion of interest rate swaps hedging variable rate borrowings is recognized in the statement of comprehensive income. However, when the forecast transaction that is hedged results in the recognition of a non-financial asset (for example, inventory or fixed assets), the gains and losses previously deferred in equity are transferred from equity and are included in the initial measurement of the cost of the non-financial asset. The deferred amounts are ultimately recognized in cost of goods sold in the case of inventory or in depreciation in the case of fixed assets.
When a hedging instrument expires or is sold, or when a hedge no longer meets the criteria for hedge accounting, any cumulative gain or loss existing in equity at that time remains in equity and is recognized when the forecast transaction is ultimately recognized in the statement of comprehensive income. When a forecast transaction is no longer expected to occur, the cumulative gain or loss that was reported in equity is immediately transferred to the statement of comprehensive income within ‘other (losses) gains- net’.
| 2.11 | Trade accounts receivable |
Trade accounts receivable are amounts due from customers for goods sold or services performed by the Company’s subsidiaries. If collection is expected in one year or less, they are classified as current assets. If not, they are presented as non-current assets.
Trade accounts receivable are recognized initially at fair value and subsequently measured at amortized cost using the effective interest method, less provision for impairment.
| 2.12 | Inventories |
Inventory mainly includes land, work in progress and finished property which is assigned to the real-estate activity carried out by the Group. It also includes material used in the construction activity. Goods and supplies correspond to goods that the Group trades as part of its IT segment. Materials and supplies used in construction activities and IT equipment are determined under the weighted average cost method.
Land intended to carry out real estate projects is recognized at acquisition cost. Work in progress and finished property comprise design costs, material, labor costs, other indirect costs and general expenses related to the construction and do not include exchange differences.
Net realizable value is the estimated selling price in the ordinary course of business, less applicable variable selling expenses. For the reductions in the carrying amount of inventories to their net realizable value, a provision is made for inventory impairment with a charge to the results of the period in which such reductions are made.
IT equipment is stated at the lower of cost or net realizable value. Such cost does not exceed its net realizable value.
F-20
Table of Contents
(All amounts are expressed in thousands of S/. unless otherwise stated)
| 2.13 | Investment properties |
Investment properties are shown at cost less accumulated depreciation and impairment losses, if any. Subsequent costs attributable to investment properties are capitalized only if it is probable that future economic benefits will flow to the Company and the cost of these assets can be measured reliably; if not, they are recognized as expenses when incurred.
Repair and maintenance expenses are recognized in profit and loss when they are incurred. A property’s carrying amount is written down immediately to its recoverable amount if the property’s carrying amount is greater than its estimated recoverable amount. The cost and accumulated depreciation on disposals are eliminated from the respective accounts and the resulting gain or loss is recognized in profit or loss for the period. The depreciation of this asset is calculated under the straight-line method at a rate that is considered sufficient to absorb the property’s cost over its estimated useful life. The estimated useful life of this property is approximately 25 years.
The investment property maintained by the Group corresponds to a land owned by the subsidiary Viva GyM S.A. This investment is leased out under operating leases with third parties (see Note 2.32).
| 2.14 | Property, plant and equipment |
Property, plant and equipment are stated at historical cost less depreciation. Historical cost includes expenditure that is directly attributable to the acquisition of these items.
Subsequent costs are included in the asset’s carrying amount or are recognized as a separate asset, as appropriate, only when it is probable that future economic benefits associated with the item will flow to the Group and the cost of the item can be measured reliably. The carrying amount of the replaced asset is derecognized. All other repairs and maintenance are charged to the income statement during the financial period in which they are incurred.
Assets in the construction stage are capitalized as a separate component. At their completion, the cost of such assets is transferred to their definitive category.
Replacement units comprises long-term repairs which started to be depreciated at the date they replace for the related part.
Land is not depreciated. Depreciation of machinery and equipment and vehicles recognized as “Major equipment” are depreciated based on their hours of use. Under this method, the total number of work hours that machinery and equipment is capable to produce is estimated and a charge per hour is determined. The depreciation of other assets that do not qualify as “Major equipment” is calculated under the straight-line method to allocate their cost less their residual values over their estimated useful lives, as follows:
| Years | ||||
Buildings | 33 | |||
Machinery and equipment | From 4 to 10 | |||
Vehicles | From 4 to 10 | |||
Furniture and fixtures | From 2 to 10 | |||
Other equipment | From 2 to 10 | |||
Replacement units | 5 | |||
The assets’ residual values and useful lives are reviewed, and adjusted if appropriate, at each date of the statement of financial position. An asset’s carrying amount is written down immediately to its recoverable amount if the asset’s carrying amount is greater than its estimated recoverable amount. Gains and losses on disposals are determined by comparing the proceeds with the carrying amount and are recognized in “Other (losses) gains, net” in the statement of comprehensive income.
F-21
Table of Contents
(All amounts are expressed in thousands of S/. unless otherwise stated)
| 2.15 | Intangible assets |
| a) | Goodwill - |
Goodwill arises on the acquisition of subsidiaries and represents the excess of the cost of acquisition as compared to the fair value of the Group’s share in the net identifiable assets at the acquisition date.
Goodwill acquired in a business combination is allocated to each of the cash-generating units (CGU), or group of CGUs, that is expected to benefit from the synergies of the combination. Each unit or group of units to which the goodwill is allocated represents the lowest level within the entity at which the goodwill is monitored for internal management purposes. Goodwill is monitored at the operating segment level.
Goodwill impairment reviews are undertaken annually or more frequently if events or changes in circumstances indicate a potential impairment. The carrying value of goodwill is compared to the recoverable amount, which is the higher of value in use and the fair value less costs to sell. Any impairment is recognized immediately as an expense and is not subsequently reversed.
| b) | Trademarks - |
Separately acquired trademarks are shown at historical cost. Trademarks acquired in a business combination are recognized at fair value at the acquisition date. Trademarks have a finite useful life and are carried at cost less accumulated amortization. Amortisation is calculated using the straight-line method to allocate the cost of trademarks to profit or loss over their estimated useful lives, which has been estimated to be 30 years.
| c) | Concessions - |
The intangible asset related to the right to charge users for the services under the Norvial concession is amortized under the straight-line method, from the date when toll collection started or from the date it is recognized as an asset using the lower of its estimated expected useful life or effective period of the concession agreement. See Note 2.5 regarding details of the Norvial concession.
| d) | Contractual relationships with customers - |
Contractual relationships with customers are assets resulting from businesses that were initially recognized at fair value, as determined based on the future cash flows expected from those relationships over a period of time based on an estimation of the time period those customers remain customers for the Group. These assets are assessed periodically in order to determine whether they have been impaired, either from termination or deterioration of the relationship.
| e) | Block I and Block V - |
The Company operates and extracts oil from two fields (Block I and Block V) located in the province of Talara in northern Peru. Both fields are operated under long-term service contracts in which the Company provides hydrocarbon extraction services to Perupetro, the state oil company. Hydrocarbons extracted from each field belong to Perupetro, which in turn pays the Company a variable fee per barrel of lifted hydrocarbons, which fee is based on a basket of international crude prices and the level of production. The fee is paid on a monthly basis. The Company’s activities are focused on proved reserves development and production and are conducted in mature oil fields, which have been producing oil for over 100 years in the case of Block I and over 50 years in the case of Block V. Such service contracts do not qualify as public services concessions, as defined by IFRIC 12.
As part of the company´s obligations under the service contracts, it is required to incur certain costs to prepare the wells to extract the hydrocarbons. The Company has capitalized as an intangible asset the development stage costs associated with preparing the wells for extraction. These costs are being
F-22
Table of Contents
(All amounts are expressed in thousands of S/. unless otherwise stated)
amortized based on the useful life of the wells, which is less than the overall period of the service contract with Perupetro.
| f) | Internally generated software and development costs - |
Costs associated with maintaining computer software programs are recognized as an expense as incurred. Development costs that are directly attributable to the design and testing of identifiable and unique software products controlled by the Group are recognized as intangible assets when the following criteria are met:
| • | it is technically feasible to complete the software product so that it will be available for use; |
| • | management intends to complete the software product and use or sell it; |
| • | there is an ability to use or sell the software product; |
| • | it can be demonstrated how the software product will generate probable future economic benefits; |
| • | adequate technical, financial and other resources to complete the development and to use or sell the software product are available; and |
| • | the expenditure attributable to the software product during its development can be reliably measured. |
Directly attributable costs that are capitalised as part of the software product include the software development employee costs and an appropriate portion of relevant overheads.
Other development expenditures that do not meet these criteria are recognised as an expense as incurred. Development costs previously recognised as an expense are not recognised as an asset in a subsequent period. Computer software development costs recognised as assets are amortised over their estimated useful lives, which does not exceed three years.
| g) | Land use rights - |
This item comprises the rights of use of a physical space for the construction of future projects. The useful life of land use rights is 60 years under the agreement signed and their effective period can be extended if agreed by the parties. Amortization begins when it becomes ready for its intended use by Management.
| 2.16 | Impairment of non-financial assets |
Assets that have an indefinite useful life are not subject to amortization and are tested annually for impairment. Assets that are subject to amortization are reviewed for impairment whenever events or changes in circumstances indicate that the carrying amount may not be recoverable. An impairment loss is recognized for the amount by which the asset’s carrying amount exceeds its recoverable amount. The recoverable amount is the higher of an asset’s fair value less costs to sell and value in use. For the purposes of assessing impairment, assets are grouped at the lowest levels for which there are separately identifiable cash flows (cash-generating units). Non-financial assets other than goodwill that suffered impairment are reviewed for possible reversal of the impairment at each reporting date.
| 2.17 | Trade payables |
Trade payables are obligations to pay for goods or services that have been acquired in the ordinary course of business. Accounts payable are classified as current liabilities if payment is due within one year or less (or in the normal operating cycle of the business if longer). If not, they are presented as non-current liabilities.
Trade payables are recognized initially at fair value and subsequently measured at amortized cost using the effective interest method.
F-23
Table of Contents
(All amounts are expressed in thousands of S/. unless otherwise stated)
| 2.18 | Borrowings |
Borrowings are recognized initially at fair value, net of transaction costs incurred. Borrowings are subsequently carried at amortized cost; any difference between the proceeds (net of transaction costs) and the redemption value is recognized in the income statement over the period of the borrowings using the effective interest method.
Fees paid for entering into loan facilities are recognized as transaction costs of the loan to the extent that it is probable that some or all of the facility will be drawn down. In this case, the fee is deferred until the draw-down occurs.
| 2.19 | Borrowing costs |
General and specific borrowing costs directly attributable to acquisitions, construction or development of qualifying assets, which are assets that necessarily take a substantial period of time to get ready for their intended use or sale, are added to the cost of those assets, until such time as the assets are substantially ready for their intended use or sale.
Investment income earned on the temporary investment of specific borrowings pending their expenditure on qualifying assets is deducted from the borrowing costs eligible for capitalization. All other borrowing costs are recognized in profit or loss in the period in which they are incurred.
| 2.20 | Current and deferred income tax |
The tax expense for the period comprises current and deferred tax. Tax is recognized in the income statement, except to the extent that it relates to items recognized in other comprehensive income or directly in equity. In this case, the tax is also recognized in statement of other comprehensive income or directly in equity, respectively
The current income tax charge is calculated on the basis of the tax laws enacted or substantively enacted at the date of the statement of financial position in the countries where the Company and its subsidiaries operate and generate taxable income. Management periodically evaluates positions taken in tax returns with respect to situations in which applicable tax regulation is subject to interpretation. Management, where appropriate, establishes provisions on the basis of amounts expected to be paid to the tax authorities.
Deferred income tax is recognized, using the liability method, on temporary differences arising between the tax bases of assets and liabilities and their carrying amounts in the consolidated financial statements. However, deferred tax liabilities are not recognized if they arise from the initial recognition of goodwill; deferred income tax is not accounted for if it arises from initial recognition of an asset or liability in a transaction other than a business combination that at the time of the transaction affects neither accounting nor taxable profit or loss. Deferred income tax is determined using tax rates (and laws) that have been enacted or substantially enacted by the balance sheet date and are expected to apply when the related deferred income tax asset is realized or the deferred income tax liability is settled.
Deferred income tax assets are recognized only to the extent that it is probable that future taxable profit will be available against which the temporary differences can be utilized.
Deferred income tax is provided on temporary differences arising on investments in subsidiaries and associates, except for deferred income tax liability where the timing of the reversal of the temporary difference is controlled by the Group and it is probable that the temporary difference will not reverse in the foreseeable future.
F-24
Table of Contents
(All amounts are expressed in thousands of S/. unless otherwise stated)
Deferred income tax assets and liabilities are offset when there is a legally enforceable right to offset current tax assets against current tax liabilities and when the deferred income tax assets and liabilities relate to income taxes levied by the same taxation authority.
The deferred income tax arising from the temporary differences in subsidiaries, associates and interest in joint-controlled businesses is not recognized following the exception of IAS 12 in this regard, since the period for reversal of temporary differences is controlled by the Group and it is probable that these temporary differences will not be reversed in the near future.
| 2.21 | Employee Benefits |
| a) | Profit sharing - |
The Group recognizes a liability and an expense for statutory workers’ profit sharing, based on the Peruvian legal regulations in force. Workers’ profit sharing is equivalent to 5% of the taxable income determined by each of the Group’s entities, according to the income tax law currently in force. Regarding the branch based in the Dominican Republic, the profit sharing rate is 10%.
| b) | Bonuses - |
The Group recognizes an expense and the related liability for statutory bonuses based on applicable laws and regulations effective in Peru. Statutory bonuses comprise an additional one-month salary paid every year in July and December, respectively.
| c) | Severance indemnities - |
The employees severance payments for time of service of the Group’s staff comprise their indemnification rights, calculated in accordance with the regulations in force, which have to be credited to the bank accounts designated by workers in May and November each year. The compensation for time of service amounts to an additional one-month’s salary effective at the date of bank deposits. The Group has no obligations to make any additional payments once the annual deposits to which workers are entitled to have been made.
| d) | Vacation leave - |
Annual vacation leave is recognized on an accrual and cumulative basis. Provision for the estimated obligations of annual vacations is recognized at the date of the statement of financial position.
| e) | Pension plans - |
The subsidiary CAM has commitments of pension plans with its workers. These commitments comprise both defined benefit and defined contribution plans. A defined benefit plan defines an amount of pension benefit that an employee will receive on retirement, usually dependent on one or more factors such as age, years of service and compensation.
The defined benefit obligation is calculated annually by independent actuaries using the projected unit credit method. The present value of the defined benefit obligation is determined by discounting the estimated future cash outflows using interest rates as per IAS 19 that are denominated in the currency in which the benefits will be paid, and that have terms to maturity approximating to the terms of the related pension obligation. The discount rate reflects the time value of money but not the actuarial or investment risk. Additionally, the discount rate does not reflect the risk that the future events or circumstances may differ from actuarial assumptions.
F-25
Table of Contents
(All amounts are expressed in thousands of S/. unless otherwise stated)
Actuarial gains and losses arising from experience adjustments of pension benefits, are stated directly in other comprehensive income items.
Past-service costs are recognised immediately in income, unless the changes to the pension plan are conditional on the employees remaining in service for a specified period of time. In this case, the past-service costs are amortised on a straight-line basis over this period.
| 2.22 | Provisions |
| a) | General - |
Provisions are recognized when the Group has a present legal or constructive obligation as a result of past events; it is probable that an outflow of resources will be required to settle the obligation; and the amount has been reliably estimated. If the time value of money is significant, provisions are discounted using a pre-tax rate that reflects, when applicable, the specific risks related to the liability. Reversal of the discount due to the passage of time results in the obligation being recognized with a charge to the statement of comprehensive income as a financial expense. Restructuring provisions comprise lease termination penalties and employee termination payments. Provisions are not recognized for future operating losses.
Contingent obligations are disclosed only when their existence will be confirmed with future events or when their amount cannot be reliably estimated. Contingent assets are not recognized and only revealed if it is probable that future economic benefits will flow to the Company.
| b) | Provision for the closure of production wells - |
Group entities recognize a provision for the closure of operating units that correspond to the legal obligation to close oil production wells once the production phase has been completed. At the initial date of recognition, the liability that arises from said obligation is measured at fair value discounted to present value, the same amount is simultaneously charged to the intangible account in the statement of financial position.
Subsequently, the liability will increase in each period to reflect the financial cost considered in the initial measurement of the discount, and the capitalized cost is depreciated based on the useful life of the related asset. When a liability is settled, the Group’s entities will recognize any gain or loss that may arise. The fair value changes estimated for the initial obligation and interest rates are recognized as an increase or decrease of the carrying amount of the obligation and related asset, according to IAS 38, “Intangible assets”. Any decrease in the provision, and any decrease of the asset that may exceed the carrying amount of said asset is immediately recognized in the statement of comprehensive income.
If the review of the estimated obligation results in the need to increase the provison and, accordingly, increase the carrying amount of the asset, the Group’s entities will also take into consideration if said increase corresponds to an indicator that asset has been impaired and, if so, impairment tests are carried out, according to the guidelines of IAS 36, “Impairment of assets” (Note 2.16).
| 2.23 | Earnings per share |
Basic and diluted earnings per share are calculated considering that the Group does not have financial instruments with dilutive effects, as shown below:
| i) | The numerator corresponds to the net profit of the period for the Group. |
| ii) | The denominator is the weighted average number of shares in issue at the date of the Group’s consolidated financial statements. |
F-26
Table of Contents
(All amounts are expressed in thousands of S/. unless otherwise stated)
| 2.24 | Capital |
Common shares are classified as equity.
Incremental costs directly attributable to the issue of new shares or options are shown in equity, as a deduction, net of taxes, of the proceeds.
Where any Group company purchases the company’s equity shares (treasury shares), the consideration paid, including any directly attributable incremental costs (net of income taxes) is deducted from equity attributable to the company’s equity holders until the shares are cancelled or reissued. Where such shares are subsequently reissued, any consideration received, net of any directly attributable incremental transaction costs and the related income tax effects, is included in equity attributable to the Group’s equity holders.
| 2.25 | Revenue recognition |
Revenue is measured at the fair value of the consideration received or receivable. Revenue is stated net of sales rebates, discounts and after eliminating sales between Group companies.
The Group recognizes revenue when the amount of revenue can be reliably measured; when it is probable that future economic benefits will flow to the entity; and when specific criteria have been met for each of the Group’s activities.
The Group’s revenue recognition policy is described as follows:
| i) | Revenue from construction activities - |
Revenues from construction contracts are recognized using the percentage-of-completion method based on the costs incurred method or the units of work method, considering total costs and revenues estimated at the end of the project, in accordance with IAS 11, Construction Contracts. Under this method, revenues are determined based on the contract costs incurred in comparison to total contract costs, representing the profits that can be attributed to the portion of work completed.
Revenue is billed once approval is received by the owners of the work in progress.
With respect to services that have been provided but not billed, due to a lack of approval on behalf of owners the Company recognizes a deferred revenue liability for revenue with an increase in accounts receivable.
Accounts receivable derived from work services are shown net of the advances received from customers to the extent the related contracts include liquidation provisions.
| ii) | Revenue from engineering, advisory and consulting services - |
Revenue from services is recognized in the accounting period when they are provided, based on the services performed to date as a percentage of the total services to be performed.
| iii) | Sales of real-estate properties - |
Revenue from sales of real estate properties is recognized in the results of the period when sales occur, that is, when the properties are delivered and the risks and rewards inherent to ownership are transferred to the buyer and the collection of the corresponding receivables is reasonably assured. Sales agreement terminations for the period, if any, are recognized with a reduction in sales and cost of sales for the period.
F-27
Table of Contents
(All amounts are expressed in thousands of S/. unless otherwise stated)
| iv) | Revenue from IT Services - |
The sale of computer equipment includes some services to be provided in a subsequent date to the asset sale as installation and maintenance. When sales agreements include multiple elements, the amount of the revenue is attributed to each element based on the related fair values. The fair value of each element is determined based on the market price prevailing for each element when sold separately. Revenue derived from computer equipment is recognized when the related risks and rewards are transferred to the customer, which occurs upon delivery. Revenue relating to each service element is recognized as a percentage of the total services to be performed during the period of service.
| v) | Interest income - |
Revenue from interest is recognized on a time-proportion basis, using the effective interest method.
| vi) | Dividend income - |
Dividend income s is recognized when the right to receive payment is established.
| vii) | Revenue for concession services - |
Revenue for concession services is recognized in the accounting period when they are provided, based on the services performed or as a percentage of the total services to be performed (see Note 2.5).
| 2.26 | Construction contract costs |
Construction contract costs are recognized as an expense in the period in which they are incurred.
Contract costs include all direct costs such as materials, labor, subcontracting costs, manufacturing and supply costs of equipment, start-up costs and indirect costs. Periodically, the Company evaluates the reasonableness of the estimates used in the determination of the percentage-of-completion. If, as a result of this evaluation, there are modifications to the revenue or cost previously estimated, or if the total estimated cost of the project exceeds expected revenues, an adjustment is made in order to reflect the effect in results of the period in which the adjustment or loss is incurred.
When the outcome of a construction work cannot be estimated reliably, the revenue of the contract is recognized only up to the amount of the contractual costs incurred and that are likely to be recovered.
Changes in contract relating to the work to be performed, lawsuits and payment of incentives are included in the revenue from the contract to the extent that they have been agreed with the client and can be measured reliably.
| 2.27 | Leases |
Leases in which a significant portion of the risks and rewards of ownership are retained by the lessor are classified as operating leases. Payments made under operating leases (net of any incentives received from the lessor) are charged to the profit or loss of the period on a straight-line basis over the period of the lease.
The Group leases certain property, plant and equipment. Leases of property, plant and equipment where the Group has substantially assumed all the risks and rewards of ownership are classified as finance leases. Finance leases are capitalized at the lease’s commencement at the lower of the fair value of the leased property and the present value of the minimum lease payments.
F-28
Table of Contents
(All amounts are expressed in thousands of S/. unless otherwise stated)
Each lease payment is allocated between the liability and finance charges in order to obtain a constant rate on the balance pending payment. The corresponding rental obligations, net of finance charges, are included in other long-term payables. The interest element of the finance cost is charged to the statement of comprehensive income over the lease period so as to produce a constant periodic rate of interest on the remaining balance of the liability for each period. The property, plant and equipment acquired under finance leases are depreciated over the shorter of the useful life of the asset and the lease term.
| 2.28 | Dividend distribution |
Dividend distribution to the Company’s shareholders is recognized as a liability in the financial statements in the period in which the dividends are approved by the Company’s shareholders.
| 2.29 | Contingent liabilities and assets |
Contingent liabilities are not recognized in the financial statements, they are only disclosed in the Notes to the financial statements, unless it is probable that the use of resources is remote. Contingent assets are not recognized in the financial statements and are only disclosed when it is probable that an inflow of resources will flow to the Company.
| 2.30 | Significant non-operating items |
Significant non-operating items are disclosed in the financial statements when they are necessary to provide a better understanding of the Group’s financial performance. These material items are income or expenses shown separately due to the significance or their nature or amount.
| 2.31 | Standards, amendments and interpretations not yet effective |
| a) | Standards, amendments and interpretations adopted by the Group |
There are no IFRSs or IFRIC interpretations that are effective for the first time for the financial year beginning on or after January 1, 2012 that would be expected to have a material impact on the Group.
| b) | Standards, amendments and interpretations issued but not yet effective for 2012 and which were not early adopted - |
The following standards are relevant to the Group’s activities:
| • | IFRS 7, ‘Financial instruments: Disclosures’ as amended in October 2010. The IASB modified the disclosures required so that the users of the financial statements may assess the risk exposure related to financial asset transfers and the effect of these risk on the entity’s financial position. For the Company, this amendments will come into effect on January 1, 2013. |
| • | IFRS 9, ‘Financial instruments’, addresses the classification, measurement and recognition of financial assets and financial liabilities. It replaces the parts of IAS 39 that relate to the classification and measurement of financial instruments. IFRS 9 requires financial assets to be classified into two measurement categories: those measured at fair value and those measured at amortized cost. The classification depends on the entity’s business model for managing its financial instruments and the contractual cash flow characteristics of the instrument. For financial liabilities, the standard retains most of the IAS 39 requirements. Application of IFRS 9 will be mandatory from January 1, 2015. |
| • | IFRS 10, ‘Consolidated financial statements’, replaces IAS 27 and SIC 12 and builds on existing principles by identifying the concept of control as the determining factor in whether an entity should be included within the consolidated financial statements of the parent company. The standard |
F-29
Table of Contents
(All amounts are expressed in thousands of S/. unless otherwise stated)
provides additional guidance to assist in the determination of control where this is difficult to assess. IFRS 10 will be applied with effect from January 1, 2013. |
| • | IFRS 11, ‘Joint arrangements’, which replaces IAS 31 and amends the classification of joint arrangements in only two categories (joint operations and joint ventures), depending on whether the investors have contractual rights and obligations on the assets and liabilities of the arrangement (joint operation) or whether investors have a residual right on the equity of the arrangement (joint venture). This standard discontinues the application of proportional consolidation method. IFRS 11 will be applied with effect from 1 January 2013. |
| • | IFRS 12, ‘Disclosures of interests in other entities’ includes the disclosure requirements for all forms of interests in other entities, including joint arrangements, associates, special purpose vehicles and other off balance sheet vehicles. IFRS 12 will be applied with effect from January 1, 2013. |
| • | IFRS 13, ‘Fair value measurement’, aims to improve consistency and reduce complexity by providing a precise definition of fair value and a single source of fair value measurement and disclosure requirements for use across IFRSs. The requirements do not extend the use of fair value accounting but provide guidance on how it should be applied where its use is already required or permitted by other standards within IFRSs. The application of this standard is mandatory from January 1, 2013. |
| • | Amendment to IAS 1, ‘Presentation of financial statements’ relating to other comprehensive income. The major change resulting from this amendment is the requirement for entities to group the items of “other comprehensive income” (OCI) depending on whether they are reclassifiable or not to the statement of comprehensive income. These amendments do not specify which items should be included in OCI. |
| • | IAS 19, ‘Employee benefits’ was amended in June 2011 by the IASB. The amendments eliminate the corridor approach and recognize financial expenses on a net basis. This amendments will be effective for the Company on January 1, 2013. |
| • | IAS 27, ‘Separte financial statements’. It was amended in May 2011 by the IASB under the new heading ‘Separate financial statements’. The new standard include the alignment of the separate financial statements which remain effective once the provisions of control were included in IFRS 10. For the company, this standard is effective as of January 1, 2013. |
| • | IAS 28, ‘Investments in Associates and Joint Ventures’. It was amended in May 2011 by the IASB. The new standard includes guidelines to recognize joint ventures and associates under the equity method. This standard will become effective for the Company on January 1, 2013. |
The Group has carried out an initial assessment of the impact of these new standards on its financial position and results. The adoption of IFRS 11 required a more detailed analysis of the effect, given the Groups participation in several joint operations. However, after such initial assessment, management considers that the standard will not have a material impact on the Group’s financial position or performance because it has joint controlled operations and does not apply the proportional consolidation method, as defined under IFRS 11. The other standards described above will only affect certain disclosures in the financial statements.
There are no other IFRS or IFRIC interpretations that are not yet effective that would be expected to have a significant impact on the Group’s financial statements.
F-30
Table of Contents
(All amounts are expressed in thousands of S/. unless otherwise stated)
| 2.32 | Reclassifications |
The following reclassifications have been carried out in the financial statements of 2011 to make them comparable with the balances of the financial statements of 2012:
| • | The cost of the investment in Shopping Mall Parque El Agustino classified in 2011 under property, plant and equipment, owned by subsidiary Viva GyM and amounting to S/.36.5 million (Note 14), was reclassified to Investment property in 2012. |
| • | The balances of work in progress - construction and rights to be billed were classified in 2011 in the statement of financial position as inventories and trade accounts receivable, respectively. In 2012 they were reclassified as “work in progress due from customers” (Note 9). |
| 3 | FINANCIAL RISK MANAGEMENT |
Financial risk management is carried out by the Group’s Management. Management oversees the general management of risks in specific areas, such as exchange rate risk, price risk, interest rate risk, credit risk, the use of derivative and non-derivative financial instruments and the investment of excess liquidity as well as financial risks and carries out periodic supervision and monitoring.
| 3.1 | Financial risk factors |
The Group’s activities expose it to a variety of financial risks: market risk (including currency risk, price risk, fair value interest rate risk and cash flow interest rate risk), credit risk and liquidity risk. The Group’s overall risk management program focuses on the unpredictability of financial markets and seeks to minimize potential adverse effects on the Group’s financial performance. The Group uses derivative financial instruments to hedge certain risk exposures in one of its subsidiaries and considers the use of other derivatives, in the event that it identifies risks that may generate an effect for the Group in the short- and medium-term.
| a) | Market risks - |
| i) | Foreign exchange risk - |
The Group is exposed to exchange rate risk as a result of the transactions carried out locally in foreign currency and due to its operations abroad. As of December 31, 2012, this exposure is mainly concentrated in fluctuations of the U.S. dollar and Chilean pesos. As of December 31 and January 1, 2011, it is mainly concentrated in U.S. dollars.
Management has set up a policy to require Group companies to manage their foreign exchange risk against their functional currency. The Group companies are required to hedge their entire foreign exchange risk exposure with the Group treasury. To manage their foreign exchange risk arising from future commercial transactions and recognized assets and liabilities, Group companies use forward contracts, entered into with Group treasury. Foreign exchange risk arises when future commercial transactions or recognised assets or liabilities are denominated in a currency other than the entity’s functional currency.
In order to reduce its exposure, efforts are made to maintain an appropriate balance between assets and liabilities, as well as between income and expenses in foreign currency. It should be Noted that Management has alternatively approved a policy to use derivative financial instruments to protect from foreign exchange risk.
As of December 31, 2012, the consolidated statement of financial position includes assets and liabilities in foreign currency equivalent to S/.1,673 million and S/.1,568 million, respectively (S/.1,040 million and S/.1,374 million, respectively, as of December 31, 2011).
F-31
Table of Contents
(All amounts are expressed in thousands of S/. unless otherwise stated)
The Group’s exchange gains and losses for 2012 amounted to S/.264 million and S/.243 million, respectively (S/.166 million and S/.164 million respectively in 2011).
If at December 31, 2012, the new Peruvian sol had strengthened/weakened by 10% against the U.S. dollar, with all variables held constant, the pre-tax profit for the year would have increased/decreased by S/.2 million (S/.0.19 million in 2011 and S/.0.82 million in 2010).
| ii) | Price risk - |
The Company is exposed to the risk of prices of construction materials because steel is a major component of cost associated with the commodities necessary to provide its services, which is managed via negotiations with the respective suppliers. No significant liabilities relating to the purchase of commodities have been shown at December 31, 2012, 2011 and 2010; accordingly, the Company has not considered it relevant to include a sensitivity analysis of the effect of commodity price fluctuations on its performance.
Also, the Company is exposed to the risk of prices of services provided as a result of the concessions it has signed ( See Note 2.5 b-i). The regulated rate system, applicable to the Group concessions, Sets maximum rates (agreed in local currency) for each concession. This rate will be regularly adjusted every 12 months and in the event that more than 10% variance occurs from the last regular price adjustment, the rate can be modified on an exceptional basis.
At December 31, 2012, 2011 and 2010, the maximum rate has been collected.
Concessions maintain an ongoing monitoring and adjustment of its revenues to make sure their annual billing do not exceed the maximum rate allowable.
| iii) | Cash flow and fair value interest rate risk - |
The Group’s interest rate risk mainly arises from its long-term borrowings. Borrowings issued at variable rates expose the Group to cash flow interest rate risk. Borrowings issued at fixed rates expose the Group to fair value interest rate risk on its liabilities. Group policy is to maintain most of its borrowings in fixed rate instruments; 86% of total debt in 2012 (85% in 2011) was contracted at fixed rates. During 2012 and 2011 the Group’s borrowings at variable rates were denominated in U.S. dollars and the Group policy is to manage this risk by using interest-rateswaps, which are recognized under hedge accounting.
Management considers it unnecessary to prepare a sensitivity analysis of the variable-rate debt and the variable portion of the hedging derivative because it only comprises a 14% of the total debt for 2012 (15% in 2011) and any increase or decrease in interest rate would not have a material effect on the Group’s results. No relevant hedge ineffectiveness occurred in fiscal 2012 and 2011.
| b) | Credit risk - |
Credit risk arises from cash and cash equivalents and deposits with banks and financial institutions, as well as customer credit counterparties, including the balances outstanding of accounts receivable and committed transactions. For banks and financial institutions, only independently rated parties with a minimum rating of ‘A’ are accepted. The Management of each of the Group’s companies evaluate the credit quality of the client taking into consideration its financial position, past experience and other factors. Individual risk limits are set based on internal or external ratings in accordance with limits set by the board. The utilization of credit limits is regularly monitored.
With respect to loans to related parties, the Group has measures in place to ensure the recovery of said loans through the controls maintained by the Corporate Finance Management and the performance evaluation conducted by the Board.
F-32
Table of Contents
(All amounts are expressed in thousands of S/. unless otherwise stated)
No credit limits were exceeded during the reporting period, and Management does not expect the Group to incur any losses from non-performance by these counterparties.
| c) | Liquidity risk - |
Prudent liquidity risk implies maintaining sufficient cash and cash equivalents, the availability of funding through an adequate number of sources of committed credit facilities and the capacity to close out positions in the market. In this sense, the Group has no significant liquidity risks given the fact that historically its operating cash flows have enabled it to maintain sufficient cash to meet its obligations.
Group Corporate Finance monitors rolling forecasts of the Group’s liquidity requirements to ensure it has sufficient cash to meet operational needs while maintaining sufficient headroom on its undrawn committed borrowing facilities (Note 16), so that the Group does not breach borrowing limits or covenants, where applicable, on any of its borrowing facilities. Less significant financing transactions are controlled by the Finance Management of each subsidiary.
Such forecasting takes into consideration the Group’s debt financing plans, covenant compliance, compliance with internal statement of financial position ratio targets and, if applicable, external regulatory or legal requirements; for example, currency restrictions.
Surplus cash held by the operating entities over and above the balance required for working capital management are invested in interest-bearing checking accounts or time deposits, selecting instruments with appropriate maturities and sufficient liquidity.
The following table analyzes the Group’s financial liabilities into relevant maturity groupings based on the remaining period from the date of the statement of financial position to the contractual maturity date. The amounts disclosed in the table are the contractual undiscounted cash flows.
| Less than 1 year | From 1 to 2 years | From 2 to 5 years | Over 5 years | Total | ||||||||||||||||
| S/.000 | S/.000 | S/.000 | S/.000 | S/.000 | ||||||||||||||||
As of December 31, 2012 | ||||||||||||||||||||
Borrowing (except for finance leases) | 366,032 | 58,571 | 62,992 | 25,440 | 513,035 | |||||||||||||||
Finance leases | 70,028 | 53,378 | 154,474 | 70,846 | 348,726 | |||||||||||||||
Trade accounts payable | 937,287 | — | — | — | 937,287 | |||||||||||||||
Other accounts payable | 340,547 | 38,135 | — | — | 378,682 | |||||||||||||||
Accounts payables to related parties | 42,734 | — | — | — | 42,734 | |||||||||||||||
|
|
|
|
|
|
|
|
|
| |||||||||||
| 1,756,628 | 150,084 | 217,466 | 96,286 | 2,220,464 | ||||||||||||||||
|
|
|
|
|
|
|
|
|
| |||||||||||
As of December 31, 2011 | ||||||||||||||||||||
Borrowing (except for finance leases) | 162,033 | 77,205 | 80,171 | — | 319,409 | |||||||||||||||
Finance leases | 74,455 | 52,130 | 104,258 | 17,376 | 248,219 | |||||||||||||||
Trade accounts payable | 754,520 | — | — | — | 754,520 | |||||||||||||||
Other accounts payable | 327,047 | 21,861 | — | — | 348,908 | |||||||||||||||
Accounts payable to related parties | 19,665 | — | — | — | 19,665 | |||||||||||||||
|
|
|
|
|
|
|
|
|
| |||||||||||
| 1,337,720 | 151,196 | 184,429 | 17,376 | 1,690,721 | ||||||||||||||||
|
|
|
|
|
|
|
|
|
| |||||||||||
| 3.2 | Capital management - |
The Group’s objectives when managing capital are to safeguard the Group’s ability to continue as a going concern in order to provide returns for shareholders, benefits for other stakeholders and to maintain an optimal capital structure to reduce the cost of capital.
In order to maintain or adjust the capital structure, the Group may adjust the amount of dividends paid to shareholders, return capital to shareholders, issue new shares or sell assets to reduce debt.
F-33
Table of Contents
(All amounts are expressed in thousands of S/. unless otherwise stated)
The Group monitors capital on the basis of the gearing ratio. This ratio is calculated as net debt divided by total capital. Net debt is calculated as total borrowings (including current and non-current borrowings), less cash and cash equivalents. Total capital is calculated as ‘equity’ as shown in the consolidated statement of financial position plus net debt.
As of December 31, 2011, no gearing ratio was part of the analysis because cash surpluses were higher than financial obligations and equity had not been used to secure compliance with financial obligations as it is shown in the table below. As of December 31, 2012, due to the fact that the Company has acquired significant borrowings, the Company’s strategy was to maintain a gearing ratio between 0.03 and 1.00.
As of December 31, 2012 and 2011 the gearing ratio was as follows:
| December 31, | December 31, | |||||||
| 2012 | 2011 | |||||||
| S/.000 | S/.000 | |||||||
Total borrowing | 845,474 | 529,848 | ||||||
Less: Cash and cash equivalents | (780,114 | ) | (658,187 | ) | ||||
|
|
|
| |||||
Net debt | 65,360 | (128,339 | ) | |||||
Total equity | 1,776,890 | 1,453,086 | ||||||
|
|
|
| |||||
Total capital | 1,842,250 | 1,324,747 | ||||||
|
|
|
| |||||
Gearing ratio | 0.04 | 0.00 | ||||||
|
|
|
| |||||
| 3.3 | Fair value estimation - |
For the classification of the type of valuation used by the Group for its financial instruments at fair value, the following levels of measurement have been established.
| • | Level 1: Measurement based on quoted prices in active markets for identical assets or liabilities. |
| • | Level 2: Measurement based on inputs other than quoted prices included within Level 1 that are observable for the asset or liability (level 1), either directly (that is, as prices) or indirectly (that is, derived from prices). |
| • | Level 3: Measurement based on inputs for the asset or liability that are not based on observable market data (that is, unobservable inputs, generally based on internal estimates and assumptions of the Group). |
The only financial instruments measured at fair value by the Group are the interest rate swaps signed with subsidiary GMP S.A., by which a variable-interest instrument is changed to a fixed interest rate and forward foreign exchange contracts signed by subsidiaries GyM Ferrovías S.A. and Viva GyM S.A. to hedge its exposure to changes in the exchange rate of the Euros and U.S. dollars. The measurement at fair value of these instruments corresponds to the characteristics of Level 2 and has been determined based on the present value of discounted future cash flows applied to the interest-rate change projections of Citibank New York.
The investment maintained in Transportadora de Gas del Perú S.A. (TGP) has been recorded at cost; however, the fair value of this investment approximates its cost.
The carrying amount of cash and cash equivalents corresponds to its fair value. The Company considers that the carrying amount of the short- and long-term accounts receivable and payable is similar to their fair values. The fair value of financial liabilities, disclosed in Note 16-c), has been estimated by discounting the future contractual cash flows at the interest rate currently prevailing in the market and which is available to the Company for similar financial instruments.
F-34
Table of Contents
(All amounts are expressed in thousands of S/. unless otherwise stated)
| 4 | CRITICAL ACCOUNTING ESTIMATES AND JUDGMENTS |
Estimates and judgments used are continuously evaluated and are based on historical experience and other factors, including expectations of future events that are believed to be reasonable under the circumstances.
| 4.1 | Critical accounting estimates and assumptions |
The Group makes estimates and assumptions concerning the future. The resulting accounting estimates will, by definition, seldom equal the related actual results. However, Management considers that the estimates and assumptions do not have a significant risk of causing a material adjustment to the balances of assets and liabilities in the following year.
| a) | Goodwill impairment reviews - |
Impairment reviews are undertaken annually to determine if goodwill arising from business acquisitions has suffered any impairment, in accordance with the policy described in Note 2.15-a). For this purpose, goodwill is attributed to the different CGUs to which it relates. The recoverable amount of the CGUs has been determined based on its value-in-use calculations. This evaluation requires the exercise of Management’s professional judgment to analyze any potential indicators of impairment as well as the use of estimates in determining the value in use, including the preparation of future cash flows, macro-economic forecasts as well as defining the interest rate at which said cash flows will be discounted.
Based on the impairment testings performed by Group Management, no goodwill impairment losses were required to be recognized because the recoverable amount of the CGUs subject to testing was substantially higher than their related carrying amounts.
| b) | Taxes - |
Determination of the tax obligations and expenses requires interpretations of the applicable tax laws and regulations. The Company seeks legal tax counsel’s advice before making any decision on tax matters. Although Management considers its estimates to be prudent and appropriate, differences of interpretation may arise with the Peruvian Tax Authorities which may require future tax adjustments.
| c) | Percentage of completion revenue recognition - |
Revenue from construction contracts is recognized under the percentage-of-completion method which requires the final margin from construction contracts to be estimated. Projections of these margins are performed by Management based on work execution budgets and adjusted periodically based on updated information reflecting the actual performance of work. In this regard, Management considers that the estimates made at the year-end closing are reasonable.
At December 31, 2012, 2011 and 2010, a sensibility analysis was performed considering a 10% increase/decrease in the margins, as follows:
F-35
Table of Contents
(All amounts are expressed in thousands of S/. unless otherwise stated)
| 2012 | 2011 | 2010 | ||||||||||
| S/. | S/. | S/. | ||||||||||
Sales | 3,341,539 | 2,650,334 | 1,605,181 | |||||||||
Gross profit | 371,852 | 289,813 | 206,063 | |||||||||
% | 11.13 | 10.93 | 12.84 | |||||||||
Over 10% | 12.24 | 12.03 | 14.12 | |||||||||
|
|
|
|
|
| |||||||
| 409,037 | 318,794 | 226,669 | ||||||||||
|
|
|
|
|
| |||||||
Increase in profits before taxes | 37,185 | 28,981 | 20,606 | |||||||||
|
|
|
|
|
| |||||||
Less 10% | 10.02 | 9.84 | 11.55 | |||||||||
|
|
|
|
|
| |||||||
| 334,667 | 260,832 | 185,457 | ||||||||||
|
|
|
|
|
| |||||||
Decrease in profit before taxes | (37,185 | ) | (28,981 | ) | (20,606 | ) | ||||||
|
|
|
|
|
| |||||||
d) Provision for well closure costs -
The Company estimates the present value of its future obligation for well closure costs, or “ well closure liability, and increases the carrying amount of the asset that will be withdrawn in the future and that is shown under the heading of intangibles in the statement of financial position. Subsequently, this liability is attributed to profit or loss during the useful life of the assets that gave rise to it. The well closure liability is adjusted to reflect the changes that resulted from the passage of time and from revisions of either the date of occurrence or the amount of the present value of the obligations originally estimated.
During 2012, the Company recorded an additional S/.4.9 million, charged to the intangible asset account, credited to the well closure liability. This is to reflect estimated obligations to close 70 productive wells included in the service agreements for Blocks I and IV. This provision is increased monthly, charged to results, on an incremental value basis.
| 4.2 | Critical judgments in applying the entity’s accounting policies |
For the transactions recognized in the financial statements of 2012 and 2011 no special exercise of judgment was required, except for the accounting treatment of the acquisition of the CAM Group described in the following paragraphs:
CAM acquisition -
Under IFRS 3, an entity recognizes a profit on an acquisition when the fair value of the assets acquired, net of the liabilities assumed exceeds the consideration paid. This accounting standard presumes that recognition of a profit on a business acquisition is unusual; therefore, it requires the buyer to review the determination of the fair values of the acquired assets, liabilities and price paid before recognizing any gains. Furthermore, IFRS 3 authorizes a review period of 12 months from the acquisition date for an entity to adjust the determination of the fair values of the acquired assets and liabilities and, therefore, adjust the goodwill or gain generated from the acquisition, as applicable.
On February 24, 2011, the Group acquired the CAM Group and as a result of the process of allocating the purchase price paid, the fair value of the assets acquired, net of the liabilities assumed, was determined to have exceeded the consideration paid by S/.45.2 million. At the date of issue of the financial statements, the 12-month period requirement for fair value review had been met and Management considers that it has reasonably reviewed the values attributable to the assets and liabilities of the business acquired; accordingly, it has completed the process of allocating the consideration paid, and has therefore, recognized the above-mentioned profit on acquisition in the year-end profit or loss.
F-36
Table of Contents
(All amounts are expressed in thousands of S/. unless otherwise stated)
In this context, Management considers that the profit on acquisition resulted from a bargain purchase in which the selling party, an entity with different business units additional to the business sold, was required to dispose of its investment because of a restructuring process intended to, among other matters, focus on business activities other than the CAM Group’s current businesses.
Estimated useful life of machinery and equipment -
The Company reviews on an annual basis the useful lives of its machinery and equipment. The evaluation of the useful lives is made based on the hours of use and is performed by the technical internal area. This estimation of work hours is performed based on historical data considering the estimated productive capacity of the asset and is expressed in a rate per unit of production or hour. Management determined not to change the useful life over the current year because, based on its own assessments, the useful lives already reflected the current economic conditions of the Company’s operating environment.
| 5 | SEGMENT REPORTING |
Operating segments are reported consistently with the internal reports that are reviewed by the Corporate General Manager, who is the chief operating decision maker, responsible for allocating resources and evaluating the performance of each operating segment.
The Group’s operating segments are assessed by the activity of the following business units: (i) engineering and construction, (ii) infrastructure, (iii) real estate, (iv) technical services and (v) the operation of the Parent Company.
During 2012, in line with the Group’s business monitoring strategy, Corporate Management has revised its operating segments and has decided to consider the operations of subsidiary GMP within the infrastructure segment, which includes the following business units (i) energy, (ii) tolls roads, (iii) mass transit; and (vi) water treatment. As a result of the new regrouping the services segment has been renamed as technical services segment.
Given this change, prior-year comparative information has been restated to reflect the revised structure of operating segments.
As set forth under IFRS 8, reportable segments by significance of income are: ‘engineering and construction’ and ‘technical services’. However, the Group has voluntarily decided to report on all its operating segments as detailed in this Note.
Until 2010 the Group’s revenues were substantially derived from local operations. In 2011, with the purchase of the CAM subsidiary and Vial y Vives (Note 28), the revenues derived from foreign operations (Chile, Brazil, Colombia) comprise 17.21% of the Group’s total revenue in 2012 (14.93% in 2011).
Inter-segmental sales transactions are entered into at prices that are similar to those that would have been agreed with unrelated third parties. Revenues from external customers reported to the Corporate General Management are measured in a manner consistent with the preparation basis of the financial statements.
Group sales and receivables are not concentrated in a few customers.
The following segments set forth the principal activities of each of the Group:
| a) | Engineering and construction: This segment includes: (i) engineering, from traditional engineering services such as structural, civil and design engineering, and architectural planning to advanced specialties including process design, simulation, and environmental services; (ii) civil works, such |
F-37
Table of Contents
(All amounts are expressed in thousands of S/. unless otherwise stated)
| as the construction of hydroelectric power stations and other large infrastructure facilities; (iii) electromechanic construction, such as concentrator plants, oil and natural gas pipelines, and transmission lines; (iv) building construction, such as office buildings, residential buildings, hotels, affordable housing projects, shopping centers and industrial facilities; (v) contract mining, such as earthworks, blasting, loading and hauling ore. |
| b) | Infrastructure: The Group has long-term concessions or similar contractual arrangements in Peru for three toll roads, the Lima Metro, a waste water treatment plant in Lima, multiple fuel storage facilities, two producing oil fields, and a gas processing plant. |
| c) | Real Estate: The Group develops and sells homes targeted to low- and middle-income population sectors which are experiencing a significant increase in disposable income, as well as, to a lesser extent, office and commercial space. |
| d) | Technical Services: The Group provides: (i) operation and maintenance services for infrastructure assets; (ii) information technology (IT) services, including IT outsourcing, systems integration, application outsourcing and business process outsourcing services; and (iii) electricity networks services (maintenance). |
| e) | Parent Company Operation: The Holding provides managing, logistics and accounting services, among others, to the different related entities of the Group. |
Below are shown the financial statements of the Group according to its operating segments:
F-38
Table of Contents
(All amounts are expressed in thousands of S/. unless otherwise stated)
Assets and liabilities by operating segments
Segment reporting
| Engineering and construction | Infrastructure | Parent Company Operations | ||||||||||||||||||||||||||||||||||||||
| Energy | Toll Roads | Mass transit | Water treatment | Real estate | Technical services | Eliminations | Consolidated | |||||||||||||||||||||||||||||||||
| S/.000 | S/.000 | S/.000 | S/.000 | S/.000 | S/.000 | S/.000 | S/.000 | S/.000 | S/.000 | |||||||||||||||||||||||||||||||
As of December 31, 2012 | ||||||||||||||||||||||||||||||||||||||||
Assets - | ||||||||||||||||||||||||||||||||||||||||
Cash and cash equivalents | 423,332 | 30,650 | 90,644 | 28,312 | 68 | 73,004 | 85,287 | 48,491 | 326 | 780,114 | ||||||||||||||||||||||||||||||
Available-for-sale financial asset | — | — | — | — | — | — | — | 5,005 | — | 5,005 | ||||||||||||||||||||||||||||||
Accounts receivable | 181,107 | 26,922 | 6,560 | 20 | 43,692 | 19,336 | 166,895 | 61 | — | 444,593 | ||||||||||||||||||||||||||||||
Work in progress receivable | 417,073 | — | 11,722 | 15,029 | — | — | 81,427 | — | — | 525,251 | ||||||||||||||||||||||||||||||
Accounts receivable from related parties | 67,913 | — | 300 | 159 | 134 | 4,867 | 52,243 | 304,812 | (380,667 | ) | 49,761 | |||||||||||||||||||||||||||||
Other accounts receivable | 306,744 | 16,783 | 17,970 | 6,326 | — | 13,479 | 40,444 | 34,705 | — | 436,451 | ||||||||||||||||||||||||||||||
Inventories | 145,301 | 8,287 | — | 6,419 | — | 523,722 | 64,048 | 1,392 | (1,753 | ) | 747,416 | |||||||||||||||||||||||||||||
Prepaid expenses | 5,882 | 1,309 | 583 | 7,220 | — | 1,589 | 5,149 | 1,107 | — | 22,839 | ||||||||||||||||||||||||||||||
|
|
|
|
|
|
|
|
|
|
|
|
|
|
|
|
|
|
|
| |||||||||||||||||||||
Current assets | 1,547,352 | 83,951 | 127,779 | 63,485 | 43,894 | 635,997 | 495,493 | 395,573 | (382,094 | ) | 3,011,430 | |||||||||||||||||||||||||||||
|
|
|
|
|
|
|
|
|
|
|
|
|
|
|
|
|
|
|
| |||||||||||||||||||||
Long-term account receivable | — | — | — | 305,887 | — | — | — | — | — | 305,887 | ||||||||||||||||||||||||||||||
Other long-term accounts receivable | 11,256 | 14,696 | 13,833 | 11,206 | 3,720 | 6,803 | 24,274 | 1,696 | — | 87,484 | ||||||||||||||||||||||||||||||
Investments in associates | 113,601 | — | — | — | — | 17,151 | 2 | 801,824 | (895,132 | ) | 37,446 | |||||||||||||||||||||||||||||
Property invesment | — | — | — | — | — | 35,972 | — | — | — | 35,972 | ||||||||||||||||||||||||||||||
Property, machinery and equipment | 539,018 | 205,853 | 2,034 | 3,365 | — | 4,470 | 109,259 | 76,317 | (2,223 | ) | 938,093 | |||||||||||||||||||||||||||||
Intangible assets | 197,205 | 95,283 | 146,186 | 7,830 | 2,406 | 772 | 24,461 | 14,855 | 16,110 | 505,108 | ||||||||||||||||||||||||||||||
Derivative financial instruments | — | — | — | — | — | 128 | — | — | — | 128 | ||||||||||||||||||||||||||||||
Deferred income tax asset | 14,751 | — | 6,184 | 8,287 | — | 6,110 | 34,190 | — | 1,556 | 71,078 | ||||||||||||||||||||||||||||||
|
|
|
|
|
|
|
|
|
|
|
|
|
|
|
|
|
|
|
| |||||||||||||||||||||
Non-current assets | 875,831 | 315,832 | 168,237 | 336,575 | 6,126 | 71,406 | 192,186 | 894,692 | (879,689 | ) | 1,981,196 | |||||||||||||||||||||||||||||
|
|
|
|
|
|
|
|
|
|
|
|
|
|
|
|
|
|
|
| |||||||||||||||||||||
Total assets | 2,423,183 | 399,783 | 296,016 | 400,060 | 50,020 | 707,403 | 687,679 | 1,290,265 | (1,261,783 | ) | 4,992,626 | |||||||||||||||||||||||||||||
|
|
|
|
|
|
|
|
|
|
|
|
|
|
|
|
|
|
|
| |||||||||||||||||||||
Liabilities - | ||||||||||||||||||||||||||||||||||||||||
Short-term debt | 119,960 | 16,216 | 14,226 | — | 8,271 | 43,216 | 96,015 | 154,915 | — | 452,819 | ||||||||||||||||||||||||||||||
Accounts payable | 663,454 | 21,996 | 744 | 15,111 | 27 | 70,571 | 163,495 | 1,889 | — | 937,287 | ||||||||||||||||||||||||||||||
Accounts payable to related parties | 42,973 | 1,610 | 13,970 | 290,601 | 15,763 | 9,231 | 46,376 | 14,189 | (391,979 | ) | 42,734 | |||||||||||||||||||||||||||||
Current taxes | 110,515 | 4,506 | 1,977 | 873 | 167 | 8,614 | 28,187 | 3,995 | — | 158,834 | ||||||||||||||||||||||||||||||
Other accounts payable | 650,079 | 10,640 | 68,658 | 223 | — | 131,967 | 144,373 | 9,189 | — | 1,015,129 | ||||||||||||||||||||||||||||||
Other provisions | — | 401 | — | — | — | — | 10,911 | — | — | 11,312 | ||||||||||||||||||||||||||||||
|
|
|
|
|
|
|
|
|
|
|
|
|
|
|
|
|
|
|
| |||||||||||||||||||||
Current liability | 1,586,981 | 55,369 | 99,575 | 306,808 | 24,228 | 263,599 | 489,357 | 184,177 | (391,979 | ) | 2,618,115 | |||||||||||||||||||||||||||||
|
|
|
|
|
|
|
|
|
|
|
|
|
|
|
|
|
|
|
| |||||||||||||||||||||
Long-term debt | 180,857 | 97,777 | 48,513 | — | — | 49,657 | 12,427 | 3,424 | — | 392,655 | ||||||||||||||||||||||||||||||
Other accounts payable | — | 14,640 | — | — | — | 12,858 | 24,681 | 597 | — | 52,776 | ||||||||||||||||||||||||||||||
Other provisions | 16,133 | 7,558 | — | — | — | — | 27,624 | — | — | 51,315 | ||||||||||||||||||||||||||||||
Derivative financial instruments | — | 5,999 | — | 12,697 | — | — | — | — | — | 18,696 | ||||||||||||||||||||||||||||||
Deferred income tax liability | 63,858 | 2,563 | 24 | — | 722 | 68 | 9,634 | 5,310 | — | 82,179 | ||||||||||||||||||||||||||||||
|
|
|
|
|
|
|
|
|
|
|
|
|
|
|
|
|
|
|
| |||||||||||||||||||||
Total non-current liabilities | 260,848 | 128,537 | 48,537 | 12,697 | 722 | 62,583 | 74,366 | 9,331 | — | 597,621 | ||||||||||||||||||||||||||||||
|
|
|
|
|
|
|
|
|
|
|
|
|
|
|
|
|
|
|
| |||||||||||||||||||||
Total liabilities | 1,847,829 | 183,906 | 148,112 | 319,505 | 24,950 | 326,182 | 563,723 | 193,508 | (391,979 | ) | 3,215,736 | |||||||||||||||||||||||||||||
|
|
|
|
|
| �� |
|
|
|
|
|
|
|
|
|
|
|
|
|
| ||||||||||||||||||||
Equity | 472,097 | 192,411 | 90,124 | 60,416 | 12,535 | 147,054 | 103,015 | 1,086,774 | (772,219 | ) | 1,392,207 | |||||||||||||||||||||||||||||
Non-controlling interest | 103,257 | 23,466 | 57,780 | 20,139 | 12,535 | 234,167 | 20,941 | 9,983 | (97,585 | ) | 384,683 | |||||||||||||||||||||||||||||
|
|
|
|
|
|
|
|
|
|
|
|
|
|
|
|
|
|
|
| |||||||||||||||||||||
Total liabilities and Equity | 2,423,183 | 399,783 | 296,016 | 400,060 | 50,020 | 707,403 | 687,679 | 1,290,265 | (1,261,783 | ) | 4,992,626 | |||||||||||||||||||||||||||||
|
|
|
|
|
|
|
|
|
|
|
|
|
|
|
|
|
|
|
| |||||||||||||||||||||
F-39
Table of Contents
(All amounts are expressed in thousands of S/. unless otherwise stated)
Assets and liabilities by operating segments
Segment reporting
| Engineering and construction | Infrastructure | Parent Company Operations | ||||||||||||||||||||||||||||||||||||||
| Energy | Toll Roads | Mass transit | Water treatment | Real estate | Technical services | Eliminations | Consolidated | |||||||||||||||||||||||||||||||||
| S/.000 | S/.000 | S/.000 | S/.000 | S/.000 | S/.000 | S/.000 | S/.000 | S/.000 | S/.000 | |||||||||||||||||||||||||||||||
As of December 31, 2011 | ||||||||||||||||||||||||||||||||||||||||
Assets - | ||||||||||||||||||||||||||||||||||||||||
Cash and cash equivalents | 400,479 | 39,085 | 23,478 | 1,705 | 608 | 49,254 | 73,401 | 70,177 | — | 658,187 | ||||||||||||||||||||||||||||||
Available-for-sale financial asset | — | — | — | — | — | — | — | 5,347 | — | 5,347 | ||||||||||||||||||||||||||||||
Trade Accounts receivable | 270,058 | 20,565 | 7,656 | — | 1,501 | 435 | 188,056 | 39 | — | 488,310 | ||||||||||||||||||||||||||||||
Outstanding work in progress | 218,657 | — | 12,567 | 92,846 | — | — | 69,756 | — | — | 393,826 | ||||||||||||||||||||||||||||||
Accounts receivable from related parties | 63,137 | 44,822 | — | — | — | 799 | 51,308 | 86,770 | (221,526 | ) | 25,310 | |||||||||||||||||||||||||||||
Other accounts receivable | 205,984 | 17,074 | 15,252 | 5,751 | 4,772 | 18,315 | 37,308 | 37,135 | — | 341,591 | ||||||||||||||||||||||||||||||
Inventories | 76,415 | 7,234 | — | 168 | — | 381,860 | 79,365 | 2,243 | (1,020 | ) | 546,265 | |||||||||||||||||||||||||||||
Prepaid expenses | 18,183 | 1,071 | 509 | 4,082 | 1,615 | — | 13,830 | 4,149 | — | 43,439 | ||||||||||||||||||||||||||||||
|
|
|
|
|
|
|
|
|
|
|
|
|
|
|
|
|
|
|
| |||||||||||||||||||||
Total current assets | 1,252,913 | 129,851 | 59,462 | 104,552 | 8,496 | 450,663 | 513,024 | 205,860 | (222,546 | ) | 2,502,275 | |||||||||||||||||||||||||||||
|
|
|
|
|
|
|
|
|
|
|
|
|
|
|
|
|
|
|
| |||||||||||||||||||||
Borrowings | — | — | — | — | — | — | — | — | — | — | ||||||||||||||||||||||||||||||
Other long-term accounts receivable | 2,335 | 13,661 | 27,388 | — | — | — | 30,125 | 62,558 | (60,852 | ) | 75,215 | |||||||||||||||||||||||||||||
Investments in associates | 76,929 | 3,653 | — | — | — | 816 | 2 | 692,019 | (747,466 | ) | 25,953 | |||||||||||||||||||||||||||||
Investment property | — | — | — | — | — | 36,528 | — | — | — | 36,528 | ||||||||||||||||||||||||||||||
Plant and equipment | 329,637 | 187,857 | 2,331 | 2,302 | — | 5,049 | 96,815 | 67,726 | (4,804 | ) | 686,913 | |||||||||||||||||||||||||||||
Intangible assets | 39,174 | 53,440 | 153,608 | 6,658 | 2,774 | 303 | 29,381 | 15,295 | 17,164 | 317,797 | ||||||||||||||||||||||||||||||
Derivative financial instruments | — | — | — | — | — | — | — | — | — | — | ||||||||||||||||||||||||||||||
Deferred income tax asset | 4,619 | — | 7,515 | 4,704 | 83 | 3,394 | 27,409 | — | 1,320 | 49,044 | ||||||||||||||||||||||||||||||
|
|
|
|
|
|
|
|
|
|
|
|
|
|
|
|
|
|
|
| |||||||||||||||||||||
Non-current assets | 452,694 | 258,611 | 190,842 | 13,664 | 2,857 | 46,090 | 183,732 | 837,598 | (794,638 | ) | 1,191,450 | |||||||||||||||||||||||||||||
|
|
|
|
|
|
|
|
|
|
|
|
|
|
|
|
|
|
|
| |||||||||||||||||||||
Total assets | 1,705,607 | 388,462 | 250,304 | 118,216 | 11,353 | 496,753 | 696,756 | 1,043,458 | (1,017,184 | ) | 3,693,725 | |||||||||||||||||||||||||||||
|
|
|
|
|
|
|
|
|
|
|
|
|
|
|
|
|
|
|
| |||||||||||||||||||||
Liabilities - | ||||||||||||||||||||||||||||||||||||||||
Borrowings | 70,436 | 14,403 | 19,029 | — | — | 41,609 | 84,971 | 525 | — | 230,973 | ||||||||||||||||||||||||||||||
Accounts payable | 546,721 | 22,406 | 1,411 | 7,668 | 41 | 13,387 | 161,780 | 1,106 | — | 754,520 | ||||||||||||||||||||||||||||||
Accounts payable to related parties | 23,918 | 329 | 18,103 | 16,219 | 8 | 57,020 | 34,551 | 91,043 | (221,526 | ) | 19,665 | |||||||||||||||||||||||||||||
Current taxes | 112,165 | 16,666 | 3,718 | 49 | — | 9,172 | 27,474 | 3,089 | — | 172,333 | ||||||||||||||||||||||||||||||
Other accounts payable | 361,308 | 5,007 | 1,758 | 2,701 | — | 76,300 | 79,190 | 13,158 | — | 539,422 | ||||||||||||||||||||||||||||||
Other provisions | — | — | — | — | — | — | 24,466 | — | — | 24,466 | ||||||||||||||||||||||||||||||
|
|
|
|
|
|
|
|
|
|
|
|
|
|
|
|
|
|
|
| |||||||||||||||||||||
Total current liability | 1,114,548 | 58,811 | 44,019 | 26,637 | 49 | 197,488 | 412,432 | 108,921 | (221,526 | ) | 1,741,379 | |||||||||||||||||||||||||||||
|
|
|
|
|
|
|
|
|
|
|
|
|
|
|
|
|
|
|
| |||||||||||||||||||||
Long-term debt | 136,606 | 60,599 | 66,539 | — | — | 16,536 | 14,625 | 3,970 | — | 298,875 | ||||||||||||||||||||||||||||||
Other accounts payable | — | — | 445 | — | — | 79,555 | 38,383 | 597 | (60,852 | ) | 58,128 | |||||||||||||||||||||||||||||
Other provisions | 6,702 | — | — | — | — | — | 102,774 | — | — | 109,476 | ||||||||||||||||||||||||||||||
Derivative financial instruments | — | 3,645 | — | — | — | — | — | — | — | 3,645 | ||||||||||||||||||||||||||||||
Deferred income tax liability | 11,670 | 2,939 | — | — | — | 285 | 12,741 | 1,530 | (29 | ) | 29,136 | |||||||||||||||||||||||||||||
|
|
|
|
|
|
|
|
|
|
|
|
|
|
|
|
|
|
|
| |||||||||||||||||||||
Total non-current liabilities | 154,978 | 67,183 | 66,984 | — | — | 96,376 | 168,523 | 6,097 | (60,881 | ) | 499,260 | |||||||||||||||||||||||||||||
|
|
|
|
|
|
|
|
|
|
|
|
|
|
|
|
|
|
|
| |||||||||||||||||||||
Total liabilities | 1,269,526 | 125,994 | 111,003 | 26,637 | 49 | 293,864 | 580,955 | 115,018 | (282,407 | ) | 2,240,639 | |||||||||||||||||||||||||||||
|
|
|
|
|
|
|
|
|
|
|
|
|
|
|
|
|
|
|
| |||||||||||||||||||||
Equity | 406,293 | 248,376 | 79,862 | 68,684 | 5,652 | 50,103 | 91,747 | 918,057 | (679,752 | ) | 1,189,022 | |||||||||||||||||||||||||||||
Non-controlling interest | 29,788 | 14,092 | 59,439 | 22,895 | 5,652 | 152,786 | 24,054 | 10,383 | (55,025 | ) | 264,064 | |||||||||||||||||||||||||||||
|
|
|
|
|
|
|
|
|
|
|
|
|
|
|
|
|
|
|
| |||||||||||||||||||||
Total liabilities and Equity | 1,705,607 | 388,462 | 250,304 | 118,216 | 11,353 | 496,753 | 696,756 | 1,043,458 | (1,017,184 | ) | 3,693,725 | |||||||||||||||||||||||||||||
|
|
|
|
|
|
|
|
|
|
|
|
|
|
|
|
|
|
|
| |||||||||||||||||||||
F-40
Table of Contents
(All amounts are expressed in thousands of S/. unless otherwise stated)
Operating segment performance
Segment Reporting
| Engineering and construction | Infrastructure | Parent Company operations | ||||||||||||||||||||||||||||||||||||||
| Energy | Toll Roads | Mass transit | Water treatment | Real estate | Technical services | Eliminations | Consolidated | |||||||||||||||||||||||||||||||||
| S/.000 | S/.000 | S/.000 | S/.000 | S/.000 | S/.000 | S/.000 | S/.000 | S/.000 | S/.000 | |||||||||||||||||||||||||||||||
Year 2012 - | ||||||||||||||||||||||||||||||||||||||||
Revenues | 3,524,585 | 287,040 | 123,345 | 73,067 | 41,007 | 240,110 | 1,083,323 | 44,654 | (185,246 | ) | 5,231,885 | |||||||||||||||||||||||||||||
Gross profit | 408,021 | 110,847 | 53,341 | (2,712 | ) | 11,155 | 86,706 | 103,935 | (26 | ) | (59,201 | ) | 712,066 | |||||||||||||||||||||||||||
Administrative expenses | (159,845 | ) | (14,739 | ) | (6,361 | ) | (7,926 | ) | (1,485 | ) | (17,409 | ) | (105,363 | ) | (3,971 | ) | 59,919 | (257,180 | ) | |||||||||||||||||||||
Other income (expenses) | (1,928 | ) | (927 | ) | (61 | ) | (21 | ) | — | (1,711 | ) | (73,585 | ) | (8,426 | ) | (1,583 | ) | (75,944 | ) | |||||||||||||||||||||
Other (losses) gains, net | 1,326 | (1,603 | ) | — | — | — | — | — | — | — | (277 | ) | ||||||||||||||||||||||||||||
|
|
|
|
|
|
|
|
|
|
|
|
|
|
|
|
|
|
|
| |||||||||||||||||||||
Profit before interests and taxes (EBIT) | 247,574 | 93,578 | 47,041 | (10,617 | ) | 9,670 | 67,586 | 72,157 | 4,429 | (865 | ) | 530,553 | ||||||||||||||||||||||||||||
Financial expenses | (179,089 | ) | (25,041 | ) | (16,517 | ) | (15,278 | ) | (6,560 | ) | (14,469 | ) | (29,093 | ) | (17,009 | ) | 5,081 | (297,975 | ) | |||||||||||||||||||||
Financial income | 198,755 | 23,277 | 11,354 | 11,287 | 129 | 12,165 | 24,028 | 15,909 | (9,260 | ) | 287,644 | |||||||||||||||||||||||||||||
Others | 9,178 | — | — | — | — | — | — | 252,288 | ) | (260,862 | ) | 604 | ||||||||||||||||||||||||||||
|
|
|
|
|
|
|
|
|
|
|
|
|
|
|
|
|
|
|
| |||||||||||||||||||||
Profit before income tax (EBT) | 276,418 | 91,814 | 41,878 | (14,608 | ) | 3,239 | 65,282 | 67,092 | 255,617 | (265,906 | ) | 520,826 | ||||||||||||||||||||||||||||
Income tax | (87,918 | ) | (28,457 | ) | (12,526 | ) | (3,584 | ) | (972 | ) | (19,967 | ) | (5,638 | ) | (4,235 | ) | (1,554 | ) | (154,575 | ) | ||||||||||||||||||||
|
|
|
|
|
|
|
|
|
|
|
|
|
|
|
|
|
|
|
| |||||||||||||||||||||
Net Profit for the year | 188,500 | (63,357 | ) | (29,352 | ) | (11,024 | ) | (2,267 | ) | 45,315 | 61,454 | (251,382 | ) | (264,352 | ) | 366,251 | ||||||||||||||||||||||||
|
|
|
|
|
|
|
|
|
|
|
|
|
|
|
|
|
|
|
| |||||||||||||||||||||
Profit attributable to: | ||||||||||||||||||||||||||||||||||||||||
Controlling interest in the Company | 165,116 | 58,029 | 15,800 | (8,268 | ) | 1,134 | 12,375 | 50,623 | 250,923 | (255,778 | ) | 289,954 | ||||||||||||||||||||||||||||
Non-controlling interest | 23,384 | 5,328 | 13,552 | (2,756 | ) | 1,133 | 32,940 | 10,831 | 459 | (8,574 | ) | 76,297 | ||||||||||||||||||||||||||||
|
|
|
|
|
|
|
|
|
|
|
|
|
|
|
|
|
|
|
| |||||||||||||||||||||
Net Profit for the year | 188,500 | (63,357 | ) | (29,352 | ) | (11,024 | ) | (2,267 | ) | 45,315 | 61,454 | (251,382 | ) | (264,352 | ) | 366,251 | ||||||||||||||||||||||||
|
|
|
|
|
|
|
|
|
|
|
|
|
|
|
|
|
|
|
| |||||||||||||||||||||
F-41
Table of Contents
(All amounts are expressed in thousands of S/. unless otherwise stated)
Operating segment performance
Segment Reporting
| Engineering and construction | Infrastructure | Parent Company operations | ||||||||||||||||||||||||||||||||||||||
| Energy | Toll Roads | Mass transit | Water treatment | Real estate | Technical services | Eliminations | Consolidated | |||||||||||||||||||||||||||||||||
| S/.000 | S/.000 | S/.000 | S/.000 | S/.000 | S/.000 | S/.000 | S/.000 | S/.000 | S/.000 | |||||||||||||||||||||||||||||||
Year 2011 - | ||||||||||||||||||||||||||||||||||||||||
Revenues | 2,784,185 | 289,041 | 115,189 | — | — | 152,266 | 976,956 | 39,840 | (116,211 | ) | 4,241,266 | |||||||||||||||||||||||||||||
Gross profit | 329,276 | 115,950 | 40,134 | (9,888 | ) | — | 45,334 | 109,671 | 1,995 | (723 | ) | 631,749 | ||||||||||||||||||||||||||||
Administrative expenses | (104,358 | ) | (13,065 | ) | (7,086 | ) | (5,226 | ) | (269 | ) | (10,093 | ) | (72,061 | ) | (5,555 | ) | 18,131 | (199,582 | ) | |||||||||||||||||||||
Other income (expenses) | (4,762 | ) | (318 | ) | 88 | — | — | (357 | ) | 6,240 | (11,056 | ) | 4,971 | 4,330 | ||||||||||||||||||||||||||
Profit from the sale of investments | — | — | — | — | — | — | — | 4,769 | — | 4,769 | ||||||||||||||||||||||||||||||
Other (losses) gains, net | (2,165 | ) | (2,054 | ) | — | — | — | 22 | 406 | 946 | — | (2,845 | ) | |||||||||||||||||||||||||||
Gain from business combination | — | — | — | — | — | — | 45,152 | — | — | 45,152 | ||||||||||||||||||||||||||||||
|
|
|
|
|
|
|
|
|
|
|
|
|
|
|
|
|
|
|
| |||||||||||||||||||||
Profit before interests and taxes (EBIT) | 227,515 | 100,513 | 33,136 | (15,114 | ) | (269 | ) | 34,906 | 89,408 | (8,901 | ) | 22,379 | 483,573 | |||||||||||||||||||||||||||
Financial expenses | (105,906 | ) | (14,608 | ) | (21,043 | ) | (5,819 | ) | (15 | ) | (7,718 | ) | (25,523 | ) | (16,266 | ) | 8,442 | (188,456 | ) | |||||||||||||||||||||
Financial income | 111,180 | 12,714 | 15,108 | 7,704 | 5 | 7,175 | 17,014 | 19,847 | (8,442 | ) | 182,305 | |||||||||||||||||||||||||||||
Other | 5,100 | 223 | — | — | — | — | — | 133,291 | (138,391 | ) | 223 | |||||||||||||||||||||||||||||
|
|
|
|
|
|
|
|
|
|
|
|
|
|
|
|
|
|
|
| |||||||||||||||||||||
Profit before income tax (EBT) | 237,889 | 98,842 | 27,201 | (13,229 | ) | (279 | ) | 34,363 | 80,899 | 127,971 | (116,012 | ) | 477,645 | |||||||||||||||||||||||||||
Income tax | (71,514 | ) | (29,730 | ) | (5,822 | ) | 4,703 | 83 | (10,232 | ) | (19,812 | ) | (3,990 | ) | (5,133 | ) | (141,447 | ) | ||||||||||||||||||||||
|
|
|
|
|
|
|
|
|
|
|
|
|
|
|
|
|
|
|
| |||||||||||||||||||||
Net Profit for the year | 166,375 | 69,112 | 21,379 | (8,526 | ) | (196 | ) | 24,131 | 61,087 | 123,981 | (121,145 | ) | 336,198 | |||||||||||||||||||||||||||
|
|
|
|
|
|
|
|
|
|
|
|
|
|
|
|
|
|
|
| |||||||||||||||||||||
Profit attributable to: | ||||||||||||||||||||||||||||||||||||||||
Controlling interest in the Company | 153,125 | 64,726 | 9,944 | (6,394 | ) | (98 | ) | 6,079 | 53,901 | 124,032 | (116,239 | ) | 289,076 | |||||||||||||||||||||||||||
Non-controlling interest | 13,250 | 4,386 | 11,435 | (2,132 | ) | (98 | ) | 18,052 | 7,186 | (51 | ) | (4,906 | ) | 47,122 | ||||||||||||||||||||||||||
|
|
|
|
|
|
|
|
|
|
|
|
|
|
|
|
|
|
|
| |||||||||||||||||||||
Net Profit for the year | 166,375 | 69,112 | 21,379 | (8,526 | ) | (196 | ) | 24,131 | 61,087 | 123,981 | (121,145 | ) | 336,198 | |||||||||||||||||||||||||||
|
|
|
|
|
|
|
|
|
|
|
|
|
|
|
|
|
|
|
| |||||||||||||||||||||
F-42
Table of Contents
(All amounts are expressed in thousands of S/. unless otherwise stated)
Operating segment performance
Segment Reporting
| Engineering and construction | Infrastructure | Parent Company operations | ||||||||||||||||||||||||||||||||||||||
| Energy | Toll Roads | Mass transit | Water treatment | Real estate | Technical services | Eliminations | Consolidated | |||||||||||||||||||||||||||||||||
| S/.000 | S/.000 | S/.000 | S/.000 | S/.000 | S/.000 | S/.000 | S/.000 | S/.000 | S/.000 | |||||||||||||||||||||||||||||||
Year 2010 - | ||||||||||||||||||||||||||||||||||||||||
Revenues | 1,700,473 | 239,815 | 114,878 | — | — | 218,604 | 284,976 | 362,170 | (418,241 | ) | 2,502,675 | |||||||||||||||||||||||||||||
Gross profit | 230,858 | 79,059 | 53,270 | — | — | 33,264 | 61,046 | 18,625 | (31,293 | ) | 444,829 | |||||||||||||||||||||||||||||
Administrative expenses | (82,540 | ) | (10,550 | ) | (9,237 | ) | — | — | (6,755 | ) | (22,984 | ) | (10,360 | ) | 19,267 | (123,159 | ) | |||||||||||||||||||||||
Other income (expenses) | (1,515 | ) | 2,098 | (58 | ) | — | — | 239 | (141 | ) | 1,347 | 598 | 2,684 | |||||||||||||||||||||||||||
Profit from the sale of investments | — | 16,988 | — | — | — | — | — | 57,971 | — | 74,959 | ||||||||||||||||||||||||||||||
Other (losses) gains, net | 3,019 | (2,789 | ) | — | — | — | — | — | — | — | 230 | |||||||||||||||||||||||||||||
|
|
|
|
|
|
|
|
|
|
|
|
|
|
|
|
|
|
|
| |||||||||||||||||||||
Profit before interests and taxes (EBIT) | 149,822 | 84,806 | 44,091 | — | — | 26,748 | 37,921 | 67,583 | (11,428 | ) | 399,543 | |||||||||||||||||||||||||||||
Financial expenses | (82,759 | ) | (13,427 | ) | (25,310 | ) | — | — | (4,704 | ) | (8,890 | ) | (23,031 | ) | 3,315 | (154,806 | ) | |||||||||||||||||||||||
Financial income | 85,451 | 12,543 | 15,488 | — | — | 4,579 | 7,052 | 21,697 | (1,993 | ) | 144,817 | |||||||||||||||||||||||||||||
Other | 7,685 | 386 | — | — | — | — | — | 211,496 | (208,093 | ) | 11,474 | |||||||||||||||||||||||||||||
|
|
|
|
|
|
|
|
|
|
|
|
|
|
|
|
|
|
|
| |||||||||||||||||||||
Profit before income tax (EBT) | 160,199 | 84,308 | 34,269 | — | — | 26,623 | 36,083 | 277,745 | (218,199 | ) | 401,028 | |||||||||||||||||||||||||||||
Income tax | (49,026 | ) | (21,754 | ) | (8,746 | ) | — | — | (8,714 | ) | (11,339 | ) | (27,345 | ) | 2,582 | (124,342 | ) | |||||||||||||||||||||||
|
|
|
|
|
|
|
|
|
|
|
|
|
|
|
|
|
|
|
| |||||||||||||||||||||
Net Profit for the year | 111,173 | 62,554 | 25,523 | — | — | 17,909 | 24,744 | 250,400 | (215,617 | ) | 276,686 | |||||||||||||||||||||||||||||
|
|
|
|
|
|
|
|
|
|
|
|
|
|
|
|
|
|
|
| |||||||||||||||||||||
Profit attributable to: | ||||||||||||||||||||||||||||||||||||||||
Controlling interest in the Company | 104,083 | 59,427 | 14,150 | — | — | 8,467 | 23,924 | 249,912 | (207,161 | ) | 252,802 | |||||||||||||||||||||||||||||
Non-controlling interest | 7,090 | 3,127 | 11,373 | — | — | 9,442 | 820 | 488 | (8,456 | ) | 23,884 | |||||||||||||||||||||||||||||
|
|
|
|
|
|
|
|
|
|
|
|
|
|
|
|
|
|
|
| |||||||||||||||||||||
Net Profit for the year | 111,173 | 62,554 | 25,523 | — | — | 17,909 | 24,744 | 250,400 | (215,617 | ) | 276,686 | |||||||||||||||||||||||||||||
|
|
|
|
|
|
|
|
|
|
|
|
|
|
|
|
|
|
|
| |||||||||||||||||||||
F-43
Table of Contents
(All amounts are expressed in thousands of S/. unless otherwise stated)
Operating segment cash flows
Segment Reporting
| Engineering and construction | Infrastructure | Parent Company operations | ||||||||||||||||||||||||||||||||||||||
| Energy | Toll roads | Mass transit | Water treatment | Real estate | Technical services | Eliminations | Consolidated | |||||||||||||||||||||||||||||||||
| S/.000 | S/.000 | S/.000 | S/.000 | S/.000 | S/.000 | S/.000 | S/.000 | S/.000 | S/.000 | |||||||||||||||||||||||||||||||
Year 2012 - | ||||||||||||||||||||||||||||||||||||||||
Profit before income tax | 276,418 | 91,814 | 41,878 | (14,608 | ) | 3,239 | 65,282 | 67,092 | 255,618 | (265,907 | ) | 520,826 | ||||||||||||||||||||||||||||
Adjustment | ||||||||||||||||||||||||||||||||||||||||
Depreciation and amortization | 131,133 | 42,821 | 24,494 | 454 | 104 | 2,922 | 39,447 | 2,075 | 1,053 | 244,503 | ||||||||||||||||||||||||||||||
Accounts receivable | 21,364 | (6,356 | ) | 1,941 | (5,464 | ) | (37,419 | ) | (18,902 | ) | 5,868 | (22 | ) | 72,506 | 33,516 | |||||||||||||||||||||||||
Inventories | (49,150 | ) | (908 | ) | — | (6,251 | ) | — | (154,804 | ) | 14,197 | 851 | 11,740 | (184,325 | ) | |||||||||||||||||||||||||
Accounts payable | 74,356 | (26,566 | ) | (667 | ) | 9,866 | (14 | ) | 58,190 | (5,976 | ) | 782 | 29,723 | 139,694 | ||||||||||||||||||||||||||
Other variations | 12,956 | 5,047 | 51,143 | 47,270 | 31,836 | 52,416 | (33,573 | ) | (433,651 | ) | (48,356 | ) | (314,912 | ) | ||||||||||||||||||||||||||
|
|
|
|
|
|
|
|
|
|
|
|
|
|
|
|
|
|
|
| |||||||||||||||||||||
Cash flows from operating activities | 467,077 | 105,852 | 118,789 | 31,267 | (2,254 | ) | 5,104 | 87,055 | (174,347 | ) | (199,241 | ) | 439,302 | |||||||||||||||||||||||||||
|
|
|
|
|
|
|
|
|
|
|
|
|
|
|
|
|
|
|
| |||||||||||||||||||||
Sale of assets | (60,205 | ) | 392 | (17 | ) | (458 | ) | — | (1,032 | ) | (961 | ) | 9,637 | 76,115 | 23,471 | |||||||||||||||||||||||||
Dividends received | 4,119 | — | — | — | — | — | — | 252,288 | (254,350 | ) | (2,057 | ) | ||||||||||||||||||||||||||||
Purchase of assets | (196,122 | ) | (63,113 | ) | 101 | (3,940 | ) | — | (3,126 | ) | (30,582 | ) | (166,389 | ) | 235,390 | (227,781 | ) | |||||||||||||||||||||||
|
|
|
|
|
|
|
|
|
|
|
|
|
|
|
|
|
|
|
| |||||||||||||||||||||
Cash flows from investing activities | (252,208 | ) | (62,721 | ) | 84 | (4,398 | ) | — | (4,158 | ) | (31,543 | ) | 95,536 | 57,155 | (202,253 | ) | ||||||||||||||||||||||||
|
|
|
|
|
|
|
|
|
|
|
|
|
|
|
|
|
|
|
| |||||||||||||||||||||
Debt repayment | (76,842 | ) | 38,991 | (23,108 | ) | — | 8,271 | 34,728 | (2,934 | ) | 153,845 | (107,257 | ) | 25,694 | ||||||||||||||||||||||||||
Dividend distribution | (100,820 | ) | (87,429 | ) | (20,750 | ) | — | — | (10,571 | ) | (29,956 | ) | (124,235 | ) | 249,526 | (124,235 | ) | |||||||||||||||||||||||
Contribution of non-controlling shareholders | — | — | — | — | — | — | — | 26,096 | — | 26,096 | ||||||||||||||||||||||||||||||
Acquisition of interest in non-controlling subsidiary | — | — | — | — | — | — | — | (4,393 | ) | — | (4,393 | ) | ||||||||||||||||||||||||||||
Sale of interest in non-controlling subsidiary | — | — | — | — | — | — | — | 1,193 | — | 1,193 | ||||||||||||||||||||||||||||||
Other payments | (14,354 | ) | (3,128 | ) | (7,849 | ) | (262 | ) | (6,557 | ) | (1,353 | ) | (10,736 | ) | 4,619 | 143 | (39,477 | ) | ||||||||||||||||||||||
|
|
|
|
|
|
|
|
|
|
|
|
|
|
|
|
|
|
|
| |||||||||||||||||||||
Cash flows from financing activities | (192,016 | ) | (51,566 | ) | (51,707 | ) | (262 | ) | 1,714 | 22,804 | (43,626 | ) | 57,125 | 142,412 | (115,122 | ) | ||||||||||||||||||||||||
|
|
|
|
|
|
|
|
|
|
|
|
|
|
|
|
|
|
|
| |||||||||||||||||||||
Cash increase (decrease) | 22,853 | (8,435 | ) | 67,166 | 26,607 | (540 | ) | 23,750 | 11,886 | (21,686 | ) | 326 | 121,927 | |||||||||||||||||||||||||||
|
|
|
|
|
|
|
|
|
|
|
|
|
|
|
|
|
|
|
| |||||||||||||||||||||
Cash at the beginning of the year | 400,479 | 39,085 | 23,478 | 1,705 | 608 | 49,254 | 73,401 | 70,177 | — | 658,187 | ||||||||||||||||||||||||||||||
|
|
|
|
|
|
|
|
|
|
|
|
|
|
|
|
|
|
|
| |||||||||||||||||||||
Cash at the end of the year | 423,332 | 30,650 | 90,644 | 28,312 | 68 | 73,004 | 85,287 | 48,491 | 326 | 780,114 | ||||||||||||||||||||||||||||||
|
|
|
|
|
|
|
|
|
|
|
|
|
|
|
|
|
|
|
| |||||||||||||||||||||
F-44
Table of Contents
(All amounts are expressed in thousands of S/. unless otherwise stated)
Operating segment cash flows
Segment Reporting
| Engineering and construction | Infrastructure | Parent Company operations | ||||||||||||||||||||||||||||||||||||||
| Energy | Toll roads | Mass transit | Water treatment | Real estate | Technical services | Eliminations | Consolidated | |||||||||||||||||||||||||||||||||
| S/.000 | S/.000 | S/.000 | S/.000 | S/.000 | S/.000 | S/.000 | S/.000 | S/.000 | S/.000 | |||||||||||||||||||||||||||||||
Year 2011 - | ||||||||||||||||||||||||||||||||||||||||
Profit before income tax | 237,889 | 98,842 | 27,201 | (13,229 | ) | (279 | ) | 34,363 | 80,899 | 127,971 | (116,012 | ) | 477,645 | |||||||||||||||||||||||||||
Adjustment | ||||||||||||||||||||||||||||||||||||||||
Depreciation and amortization | 82,351 | 36,112 | 21,316 | 73 | ) | 87 | 2,607 | 32,160 | 3,540 | — | 178,246 | |||||||||||||||||||||||||||||
Accounts receivable | (170,212 | ) | 3,181 | 42,364 | (92,846 | ) | (1,501 | ) | (178 | ) | (674 | ) | — | 42,790 | (177,076 | ) | ||||||||||||||||||||||||
Inventories | (52,330 | ) | (630 | ) | — | — | — | (56,086 | ) | (10,359 | ) | — | (21,005 | ) | (140,410 | ) | ||||||||||||||||||||||||
Accounts payable | 328,670 | 8,650 | (761 | ) | 5,245 | (1,615 | ) | (598 | ) | (20,374 | ) | 302 | (53,893 | ) | 265,626 | |||||||||||||||||||||||||
Other variations | (255,857 | ) | (28,247 | ) | (60,221 | ) | 7,564 | (4,986 | ) | 5,703 | (110,623 | ) | (124,648 | ) | 100,623 | (470,692 | ) | |||||||||||||||||||||||
|
|
|
|
|
|
|
|
|
|
|
|
|
|
|
|
|
|
|
| |||||||||||||||||||||
Cash flows from operating activities | 170,511 | 117,908 | 29,899 | (93,193 | ) | (8,294 | ) | (14,189 | ) | (28,971 | ) | 7,165 | (47,497 | ) | 133,339 | |||||||||||||||||||||||||
|
|
|
|
|
|
|
|
|
|
|
|
|
|
|
|
|
|
|
| |||||||||||||||||||||
Sale of assets | 5,251 | 77 | (152 | ) | — | — | — | 2,214 | 28,047 | (2,436 | ) | 33,001 | ||||||||||||||||||||||||||||
Dividends received | 20,891 | — | — | — | — | 245 | 1,766 | 133,291 | (121,484 | ) | 34,709 | |||||||||||||||||||||||||||||
Purchase of assets | (80,544 | ) | (51,083 | ) | (363 | ) | (6,432 | ) | (2,598 | ) | (36,585 | ) | (22,916 | ) | (144,892 | ) | 192,124 | (153,289 | ) | |||||||||||||||||||||
|
|
|
|
|
|
|
|
|
|
|
|
|
|
|
|
|
|
|
| |||||||||||||||||||||
Cash flows from investing activities | (54,402 | ) | (51,006 | ) | (515 | ) | (6,432 | ) | (2,598 | ) | (36,340 | ) | (18,936 | ) | 16,446 | 68,204 | (85,579 | ) | ||||||||||||||||||||||
|
|
|
|
|
|
|
|
|
|
|
|
|
|
|
|
|
|
|
| |||||||||||||||||||||
Debt repayment | (41,245 | ) | 1,775 | (15,379 | ) | 4,048 | 11,500 | 71,396 | 59,527 | (583 | ) | (86,645 | ) | 4,394 | ||||||||||||||||||||||||||
Dividend distribution | (70,983 | ) | (67,329 | ) | (12,690 | ) | — | — | (3,102 | ) | (7,263 | ) | (69,866 | ) | 161,368 | (69,865 | ) | |||||||||||||||||||||||
Acquisition of interest in non-controlling subsidiary | — | — | — | — | — | — | — | — | — | — | ||||||||||||||||||||||||||||||
Sale of interest in non-controlling subsidiary | — | — | — | — | — | — | — | — | — | — | ||||||||||||||||||||||||||||||
Other payments | (4,456 | ) | (5,373 | ) | (8,906 | ) | 97,282 | — | (13,490 | ) | (6,797 | ) | 30,179 | (95,430 | ) | (6,991 | ) | |||||||||||||||||||||||
|
|
|
|
|
|
|
|
|
|
|
|
|
|
|
|
|
|
|
| |||||||||||||||||||||
Cash flows from financing activities | (116,684 | ) | (70,927 | ) | (36,975 | ) | 101,330 | 11,500 | 54,804 | 45,467 | (40,270 | ) | (20,707 | ) | (72,462 | ) | ||||||||||||||||||||||||
|
|
|
|
|
|
|
|
|
|
|
|
|
|
|
|
|
|
|
| |||||||||||||||||||||
Cash increase (decrease) | (575 | ) | (4,025 | ) | (7,591 | ) | 1,705 | 608 | 4,275 | (2,440 | ) | (16,659 | ) | — | (24,702 | ) | ||||||||||||||||||||||||
Cash at the beginning of the year | 401,054 | 43,110 | 31,069 | — | — | 44,979 | 75,841 | 86,836 | — | 682,889 | ||||||||||||||||||||||||||||||
|
|
|
|
|
|
|
|
|
|
|
|
|
|
|
|
|
|
|
| |||||||||||||||||||||
Cash at the end of the year | 400,479 | 39,085 | 23,478 | 1,705 | 608 | 49,254 | 73,401 | 70,177 | — | 658,187 | ||||||||||||||||||||||||||||||
|
|
|
|
|
|
|
|
|
|
|
|
|
|
|
|
|
|
|
| |||||||||||||||||||||
F-45
Table of Contents
(All amounts are expressed in thousands of S/. unless otherwise stated)
Operating segment cash flows
Segment Reporting
| Engineering and construction | Infrastructure | Parent Company operations | ||||||||||||||||||||||||||||||||||||||
| Energy | Toll roads | Mass transit | Water treatment | Real estate | Technical services | Eliminations | Consolidated | |||||||||||||||||||||||||||||||||
| S/.000 | S/.000 | S/.000 | S/.000 | S/.000 | S/.000 | S/.000 | S/.000 | S/.000 | S/.000 | |||||||||||||||||||||||||||||||
Year 2010 - | ||||||||||||||||||||||||||||||||||||||||
Profit before income tax | 160,199 | 84,308 | 34,269 | — | — | 26,623 | 36,083 | 276,050 | (216,504 | ) | 401,028 | |||||||||||||||||||||||||||||
Adjustment | ||||||||||||||||||||||||||||||||||||||||
Depreciation and amortization | 60,788 | 33,900 | 27,943 | — | — | 663 | 15,857 | 3,773 | — | 142,924 | ||||||||||||||||||||||||||||||
Accounts receivable | (56,455 | ) | (3,911 | ) | 18,115 | — | — | 1,770 | (35,369 | ) | 9,631 | — | (66,219 | ) | ||||||||||||||||||||||||||
Inventories | 34,750 | (749 | ) | — | — | — | (77,962 | ) | (3,834 | ) | 1,410 | — | (46,385 | ) | ||||||||||||||||||||||||||
Accounts payable | 10,657 | 113 | (19,099 | ) | — | — | 8,683 | 16,646 | 5,508 | 5,796 | 28,304 | |||||||||||||||||||||||||||||
Other variations | 118,486 | (26,477 | ) | (27,043 | ) | — | — | (43,117 | ) | 37,782 | ) | (309,662 | ) | 192,431 | (57,600 | ) | ||||||||||||||||||||||||
|
|
|
|
|
|
|
|
|
|
|
|
|
|
|
|
|
|
|
| |||||||||||||||||||||
Cash flows from operating activities | 328,425 | 87,184 | 34,185 | — | — | (83,340 | ) | 67,165 | (13,290 | ) | (18,277 | ) | 402,052 | |||||||||||||||||||||||||||
|
|
|
|
|
|
|
|
|
|
|
|
|
|
|
|
|
|
|
| |||||||||||||||||||||
Sale of assets | 8,642 | 21,802 | — | — | — | 2,438 | — | 117,029 | — | 149,911 | ) | |||||||||||||||||||||||||||||
Dividends received | 16,714 | 2,868 | — | — | — | — | — | 118,611 | (130,076 | ) | 8,117 | |||||||||||||||||||||||||||||
Purchase of assets | (40,785 | ) | (39,661 | ) | (13,779 | ) | — | — | (7,473 | ) | (35,288 | ) | (20,037 | ) | 18,922 | (138,101 | ) | |||||||||||||||||||||||
Other payments | — | — | — | — | — | — | 8,277 | (50,000 | ) | 41,723 | — | |||||||||||||||||||||||||||||
|
|
|
|
|
|
|
|
|
|
|
|
|
|
|
|
|
|
|
| |||||||||||||||||||||
Cash flows from investing activities | (15,429 | ) | (14,991 | ) | (13,779 | ) | — | — | (5,035 | ) | (27,011 | ) | (165,603 | ) | (69,431 | ) | 19,927 | |||||||||||||||||||||||
|
|
|
|
|
|
|
|
|
|
|
|
|
|
|
|
|
|
|
| |||||||||||||||||||||
Debt repayment | (49,637 | ) | (40,555 | ) | 10,894 | — | — | 10,507 | 19,052 | (65,951 | ) | 34,755 | (80,935 | ) | ||||||||||||||||||||||||||
Dividend distribution | (71,639 | ) | — | (16,225 | ) | — | — | (18,731 | ) | (12,226 | ) | (26,880 | ) | 118,821 | (26,880 | ) | ||||||||||||||||||||||||
Acquisition of interest in non-controlling subsidiary | — | — | — | — | — | — | — | — | — | — | ||||||||||||||||||||||||||||||
Sale of interest in non-controlling subsidiary | — | — | — | — | — | — | — | — | — | — | ||||||||||||||||||||||||||||||
Other payments | — | — | 3,625 | — | — | 70,750 | 500 | — | (94,076 | ) | (19,201 | ) | ||||||||||||||||||||||||||||
|
|
|
|
|
|
|
|
|
|
|
|
|
|
|
|
|
|
|
| |||||||||||||||||||||
Cash flows from financing activities | (121,276 | ) | (40,555 | ) | (1,706 | ) | — | — | 62,526 | 7,326 | (92,831 | ) | 59,500 | (127,016 | ) | |||||||||||||||||||||||||
|
|
|
|
|
|
|
|
|
|
|
|
|
|
|
|
|
|
|
| |||||||||||||||||||||
Cash (decrease) increase | 191,720 | 31,638 | 18,700 | — | — | (25,849 | ) | 47,480 | 59,482 | (28,208 | ) | 294,963 | ||||||||||||||||||||||||||||
Cash at the beginning of the year | 209,334 | 11,472 | 12,369 | — | — | 70,828 | 28,361 | 27,354 | 28,208 | 387,926 | ||||||||||||||||||||||||||||||
|
|
|
|
|
|
|
|
|
|
|
|
|
|
|
|
|
|
|
| |||||||||||||||||||||
Cash at the end of the year | 401,054 | 43,110 | 31,069 | — | — | 44,979 | 75,841 | 86,836 | — | 682,889 | ||||||||||||||||||||||||||||||
|
|
|
|
|
|
|
|
|
|
|
|
|
|
|
|
|
|
|
| |||||||||||||||||||||
F-46
Table of Contents
(All amounts are expressed in thousands of S/. unless otherwise stated)
| 6 | FINANCIAL INSTRUMENTS |
| 6.1 | Financial instruments by category - |
The classification of financial liabilities per category is as follows:
| December 31, | ||||||||
| 2012 | 2011 | |||||||
| S/.000 | S/.000 | |||||||
Assets according to the statement of financial position | ||||||||
Loans and accounts receivable: | ||||||||
- Cash and cash equivalents | 780,114 | 658,187 | ||||||
- Trade and other accounts receivable not including advances to suppliers (*) | 1,450,045 | 1,078,097 | ||||||
- Accounts receivable from related parties | 49,761 | 25,310 | ||||||
|
|
|
| |||||
| 2,279,920 | 1,761,594 | |||||||
|
|
|
| |||||
Available-for-sale financial assets | 5,005 | 5,347 | ||||||
|
|
|
| |||||
Hedging derivatives: | ||||||||
- Derivative financial instruments | 128 | — | ||||||
|
|
|
| |||||
Liabilities according to the statement of financial position | ||||||||
Other financial liabilities | ||||||||
- Borrowings | 501,692 | 303,250 | ||||||
- Finance leases | 343,782 | 226,598 | ||||||
- Trade and other accounts payable (excluding non-financial liabilities) | 1,129,317 | 931,095 | ||||||
- Accounts payable to related parties | 42,734 | 19,665 | ||||||
|
|
|
| |||||
| 2,017,525 | 1,480,608 | |||||||
|
|
|
| |||||
Hedging derivative: | ||||||||
- Derivative financial instruments | 18,696 | 3,645 | ||||||
|
|
|
| |||||
| (*) | Includes the financial assets related to the concession agreements. |
In seeking to mitigate the exposure resulting from the expenditures incurred in Euros to a foreign supplier for the purchase of the infrastructure required under the concession agreement signed between a subsidiary, GyM Ferrovías S.A., (see Note 2.5) and the Peruvian Government, this subsidiary entered into a cross currency swap contract by which the purchase of Euros at a future date is secured at a fixed exchange rate. This contract is accounted for as a fair value hedge by the Group and it recognizes the fair value of the financial instrument (cross currency swap) in profit or loss and, as a counterpart, it recognizes the fair value of the firm commitment associated with the contract with the foreign supplier. At December 31, 2012 the derivative financial instrument constitutes a liability at a fair value of S/.12.7 million.
| 6.2 | Credit quality of financial assets - |
The credit quality of financial assets that are neither past due nor impaired can be assessed by reference to external risk ratings (if available) or to historical information about counterparty default rates:
F-47
Table of Contents
(All amounts are expressed in thousands of S/. unless otherwise stated)
The credit quality of financial assets is presented as follows:
| December 31, | ||||||||
| 2012 | 2011 | |||||||
| S/.000 | S/.000 | |||||||
Cash and cash equivalents (*) | ||||||||
Banco de Crédito del Perú (A+) | 426,762 | 269,982 | ||||||
Banco Continental (A+) | 156,419 | 145,266 | ||||||
Banco Santander (Chile) (A) | 40,745 | — | ||||||
Banco Interbank (A) | 33,864 | 60,336 | ||||||
Banco Scotiabank (A+) | 26,648 | 19,730 | ||||||
Banco de la Nación (A) | 24,784 | 33,006 | ||||||
Banco de Chile (A+) | 16,828 | 24,045 | ||||||
Banco Santander (A) | 9,024 | 61,873 | ||||||
Citibank (A) | 4,610 | 3,158 | ||||||
Banco BCI (Chile) (A) | 3,451 | — | ||||||
Banco Interamericano de Finanzas (A) | 30 | 2,543 | ||||||
Other lesser amounts | 33,859 | 36,195 | ||||||
|
|
|
| |||||
Total cash and cash equivalent | 777,024 | 656,134 | ||||||
|
|
|
| |||||
The ratings in the above table “A and A+” represent high quality credit ratings. For banks located in Peru, the ratings were derived from risk rating agencies authorized by the Banking and Insurance Superintendency of Peru (Superintendencia de Banca, Seguros y AFP). For banks located in Chile, the ratings were derived from risk rating agencies authorized by the Stock and Insurance Superintendency of Chile (Superintendencia de Valores y Seguros).
| (*) | The rest of cash equivalents in the statement of financial position corresponds to cash. |
The credit quality of customers is assessed in three categories (internal classification):
| A: | new customers/related parties (less than 6 months), |
| B: | existing customers/related parties (with more than 6 months of trade relationship) with no previous default history; and |
| C: | existing customers/related parties (with more than 6 months of trade relationship) with previous default history. |
At December 31, 2012 and 2011 the majority of the Group’s portfolio has been risk-rated as category B. Also, of the total number of accounts in compliance with contract terms and conditions, none of them have been re-negotiated.
With respect to available-for-sale financial assets, the counterparty held an external credit rating of AAA at December 31, 2012 and 2011.
| 7 | CASH AND CASH EQUIVALENTS |
This account comprises:
| December 31, | ||||||||
| 2012 | 2011 | |||||||
| S/.000 | S/.000 | |||||||
Cash on hand | 3,090 | 2,053 | ||||||
Checking accounts | 501,912 | 317,885 | ||||||
Time deposits | 273,404 | 332,220 | ||||||
In-transit remittances | 1,641 | — | ||||||
Mutual funds | 67 | 6,029 | ||||||
|
|
|
| |||||
| 780,114 | 658,187 | |||||||
|
|
|
| |||||
F-48
Table of Contents
(All amounts are expressed in thousands of S/. unless otherwise stated)
| 8 | TRADE ACCOUNTS RECEIVABLE |
This account comprises:
| December 31, | ||||||||
| 2012 | 2011 | |||||||
| S/.000 | S/.000 | |||||||
Invoices receivable | 444,593 | 488,310 | ||||||
Constructions services to be billed | 305,887 | — | ||||||
|
|
|
| |||||
| 750,480 | 488,310 | |||||||
Less: non-current portion | ||||||||
Construction services to be billed | (305,887 | ) | — | |||||
|
|
|
| |||||
| 444,593 | 488,310 | |||||||
|
|
|
| |||||
The fair value of receivables is similar to their carrying amount since their average collection turnover is less than 60 days. These receivables are of current maturity, are not interest-bearing and have no specific guarantees.
Invoices receivable are related to percentage of completion estimates. As of December 31, 2012 and 2011, trade receivable balances are shown net of the advances received from customers of S/.849 million and S/.327 million, respectively. These advances are substantially related to the subsidiary GyM S.A. and their terms vary based on each contract. At December 31, 2012, a significant portion of these advances of S/.555 million corresponds to the funds given by certain customers with which a monthly revolving advances system has been agreed that are settled with the billing of the immediately previous month. Other advances that are netted from accounts receivable correspond to funds netted gradually as services are provided; which in the event of an anticipated termination of the contractual relationship will be offset with the balances due for work progress.
Long-term accounts receivable comprise the collection rights of GyM Ferrovías S.A., which under the concession signed with the Peruvian Government comprising Line 1 of the Lima Metro/(train line) is required to acquire, on its behalf, certain infrastructure needed for the implementation of the transport system to be operated once completed. This account will be amortized with the cash flows resulting from the consideration to be received by the subsidiary at the inception of the concession under the “price per kilometer traveled” (PKT). For this purpose, the subsidiary has applied certain criteria to determine the amount of the interest to be accrued on these balances and the beginning of this amortization. These balances bear interest at a 7.7% rate and their amortization is expected to begin in 2015 at the time the infrastructure begins operation. Additionally, these balances also include the collection rights of concessions related to Survial S.A., Canchaque S.A.C. and La Chira S.A. (see Note 2.5-a).
The aging detail of trade accounts receivable is as follows:
| December 31, | ||||||||
| 2012 | 2011 | |||||||
| S/.000 | S/.000 | |||||||
Current | 436,215 | 351,116 | ||||||
Past due up to 30 days | 153,440 | 89,106 | ||||||
Past due for over 30 days | 160,825 | 48,088 | ||||||
|
|
|
| |||||
| 750,480 | 488,310 | |||||||
|
|
|
| |||||
As of December 31, 2012, trade accounts receivable totalling S/.314 million (S/.137.1 million as of December 31, 2011) are past due but not impaired, and the customers do not have a historical record of default.
F-49
Table of Contents
(All amounts are expressed in thousands of S/. unless otherwise stated)
The maximum exposure to credit risk at the reporting date is the carrying amount of the accounts receivable.
At December 2012, the Group recorded in profit or loss for the period an impairment of trade accounts receivable amounting to S/.2.7 million resulting from the assessment of the customer portfolio of subsidiary CAM Holding S.P.A, which, after a specific review and assessment of balances outstanding by Management, has certain customers who were undergoing financial difficulties and shown payment delinquency during 2012. Such provision for impairment shows no movement from the date of CAM Holding acquisition.
| 9 | WORK IN PROGRESS DUE FROM CUSTOMERS |
This account comprises:
| December 31, | ||||||||
| 2012 | 2011 | |||||||
| S/.000 | S/.000 | |||||||
Rights receivable | 465,741 | 333,436 | ||||||
Work in progress | 59,510 | 60,390 | ||||||
|
|
|
| |||||
| 525,251 | 393,826 | |||||||
|
|
|
| |||||
The balance of rights to be billed at December 31, 2012 and 2011 comprises accounts receivable recognized on a percentage-of-completion basis (Note 2.25-i).
The balance of work in progress includes the provision for a decline in margins charged to this account at the time when the associated costs under the construction agreement become higher than the estimated valuation of work progress prepared by the technical area.
| 10 | TRANSACTIONS WITH RELATED PARTIES |
| a) | Transactions with related parties - |
Major transactions between the Company and its related parties are summarized as follows:
| 2012 | 2011 | 2010 | ||||||||||
| S/.000 | S/.000 | S/.000 | ||||||||||
Revenue from sale of goods and services: | ||||||||||||
- Associates | 49,252 | 52,158 | 77,518 | |||||||||
- Joint Operations | 51,385 | 177,254 | 110,427 | |||||||||
|
|
|
|
|
| |||||||
| 100,637 | 229,412 | 187,945 | ||||||||||
|
|
|
|
|
| |||||||
Inter-company services are agreed at arm’s length as if the services had been agreed with third parties.
| b) | Key management compensation - |
Key management includes directors (executives and non-executives), members of the Executive Committee and Internal Audit Management. The compensation paid or payable to key management in 2012 amounted to S/.60.04 million (S/.32.7 million as of December 31, 2011).
F-50
Table of Contents
(All amounts are expressed in thousands of S/. unless otherwise stated)
| c) | Balances at the end of the year resulting from the sale/purchase of goods/services - |
| December 31, | ||||||||||||||||
| 2012 | 2011 | |||||||||||||||
| Receivable | Payable | Receivable | Payable | |||||||||||||
| S/.000 | S/.000 | S/.000 | S/.000 | |||||||||||||
Related: | ||||||||||||||||
Proyectos Inmobiliarios Consultores (PICSA) | 223 | — | 233 | — | ||||||||||||
Sierra Morena | — | 243 | — | 405 | ||||||||||||
|
|
|
|
|
|
|
| |||||||||
| 223 | 243 | 233 | 405 | |||||||||||||
|
|
|
|
|
|
|
| |||||||||
Joint Operations: | ||||||||||||||||
Consorcio Rio Mantaro | 8,974 | — | — | — | ||||||||||||
Consorcio Grupo 12 | 8,699 | — | — | — | ||||||||||||
Consorcio Brocal Pasco | 4,711 | — | 232 | 591 | ||||||||||||
Consorcio La Gloria | 3,430 | 3,443 | 1,654 | 1,144 | ||||||||||||
Consorcio GyM Conciviles | 2,197 | 2,426 | — | — | ||||||||||||
Consorcio Toromocho | 1,819 | 3,432 | — | — | ||||||||||||
Consorcio Rio Urubamba | 1,790 | — | — | — | ||||||||||||
Consorcio Tren Electrico | 1,622 | — | 2,039 | — | ||||||||||||
Consorcio Atocongo | 1,650 | — | — | 1,110 | ||||||||||||
Consorcio Marcona | 1,600 | 2,168 | 643 | 290 | ||||||||||||
Consorcio Constructor Alto Cayma | 1,533 | — | 3,602 | 291 | ||||||||||||
Consorcio Lima | 1,232 | — | 2,800 | 178 | ||||||||||||
Consorcio GyM Concar | 1,088 | — | — | — | ||||||||||||
Consorcio - Sermesa Zhejian | 1,013 | — | — | — | ||||||||||||
Consorcio Rios Pallca | 975 | — | 1,975 | — | ||||||||||||
Consorcio Norte Pachacutec | 971 | 800 | — | 505 | ||||||||||||
Consorcio Tiwu | 963 | 1,716 | 1,067 | — | ||||||||||||
Consorcio Vial Ipacal | 694 | 700 | 1,333 | 1,358 | ||||||||||||
Consorcio Terminales | 628 | — | — | — | ||||||||||||
Consorcio Vial Quinua | 561 | 4,422 | 1,885 | — | ||||||||||||
Consorcio CAM Lima | 458 | 231 | — | — | ||||||||||||
Consorcio Sermesa | 405 | — | — | — | ||||||||||||
Consorcio Pacifico | 280 | — | — | — | ||||||||||||
Consorcio Vial Sullana | 348 | 341 | 531 | 835 | ||||||||||||
Consorcio La Zanja | 309 | 349 | 2,149 | — | ||||||||||||
Consorcio Ancon Pativilca (consolidada con CONCAR) | 303 | 1,054 | — | 951 | ||||||||||||
Consorcio Ferrovias Argentina | — | 7,118 | — | — | ||||||||||||
Consorcio La Chira | — | 7,868 | — | 1,482 | ||||||||||||
Consorcio Alto Cayma | — | 942 | — | — | ||||||||||||
Constructores Transmantaro | — | 677 | 2,791 | 3,628 | ||||||||||||
Consorcio GyM Cosapi | — | 321 | 140 | 827 | ||||||||||||
Comerciales Sur | — | — | 334 | 2,891 | ||||||||||||
Consorcio Proyecto Chiquitilca | — | — | 108 | 139 | ||||||||||||
Consorcio Heroes Navales | — | — | 108 | — | ||||||||||||
Consorcio GyM - Stracon | — | — | 64 | 515 | ||||||||||||
Consorcio Vial Ayacucho | — | — | 32 | 1,327 | ||||||||||||
Other | 977 | 962 | 1,127 | 1,043 | ||||||||||||
|
|
|
|
|
|
|
| |||||||||
| 49,230 | 38,970 | 24,614 | 19,105 | |||||||||||||
|
|
|
|
|
|
|
| |||||||||
Other related parties: | ||||||||||||||||
Besco | — | 2,155 | — | — | ||||||||||||
El Condor Combustibles | — | 1,366 | — | — | ||||||||||||
Other minor | 308 | — | 463 | 155 | ||||||||||||
|
|
|
|
|
|
|
| |||||||||
| 308 | 3,521 | 463 | 155 | |||||||||||||
|
|
|
|
|
|
|
| |||||||||
| 49,761 | 42,734 | 25,310 | 19,665 | |||||||||||||
|
|
|
|
|
|
|
| |||||||||
Accounts receivable and payable are of current maturity and do not have specific guarantees.
F-51
Table of Contents
(All amounts are expressed in thousands of S/. unless otherwise stated)
Accounts receivable from related parties mainly arise from sales transactions for goods and services with maturity periods of 60 days. Such accounts are non interest-bearing, because they have short-term maturities and do not require a provision for impairment.
Accounts payable to related parties mainly arise from transactions to provide services of engineering, construction, maintenance and others and have maturity periods of 60 days. Such accounts are not interest bearing because they are short-term.
Transactions with non-controlling interest are disclosed in Note 31.
| 11 | OTHER ACCOUNTS RECEIVABLE |
This account comprises:
| December 31, | ||||||||
| 2012 | 2011 | |||||||
| S/.000 | S/.000 | |||||||
Advances to suppliers | 181,790 | 137,300 | ||||||
Fiscal credit | 76,991 | 82,452 | ||||||
Deposits in guarantees for contracts | 57,716 | 68,529 | ||||||
Income tax on-account payment | 68,502 | — | ||||||
Accounts receivable from sale of investments (Note 13) | 26,739 | 27,908 | ||||||
Petróleos del Perú S.A.- Petroperú S.A. | 23,236 | 19,425 | ||||||
Claims to Sunat | 17,388 | — | ||||||
Accounts receivable from personnel | 12,946 | 13,922 | ||||||
Account receivable from Ferrocarriles del Estado - Chile | 9,209 | 9,996 | ||||||
Claims to third-parties | 7,221 | 4,519 | ||||||
Temporary taxes on net assets (Note 26-f) | 4,643 | 1,093 | ||||||
Restricted fund | 3,822 | 2,713 | ||||||
Right to recover taxes (Brazil and Colombia) | 3,168 | — | ||||||
Legal credits CAM Brasil | 2,955 | — | ||||||
Accounts receivable from suppliers (Transportadora de Gas del Perú) | 2,290 | — | ||||||
Project reimbursements | 1,926 | — | ||||||
Loans receivable | 1,760 | 2,009 | ||||||
Compensation funds | 1,637 | 7,188 | ||||||
Marineer zona franca | — | 6,397 | ||||||
Loans receivable from Consorcio SEC | — | 3,769 | ||||||
Others | 19,996 | 29,586 | ||||||
|
|
|
| |||||
| 523,935 | 416,806 | |||||||
|
|
|
| |||||
Less non-current portion: | ||||||||
Fiscal credit | (48,493 | ) | (24,675 | ) | ||||
Petróleos del Perú S.A. | (14,696 | ) | (13,661 | ) | ||||
Ferrocarriles del Estado SEC | (9,209 | ) | — | |||||
Legal credits CAM Brasil | (2,955 | ) | — | |||||
Accounts receivable from Transportadora de Gas del Perú | (2,290 | ) | — | |||||
Right to recover taxes | (2,010 | ) | — | |||||
Debtors for sale, according to legal agreement (Chile) | (662 | ) | — | |||||
Loans receivable | (659 | ) | — | |||||
Others | (6,510 | ) | (36,879 | ) | ||||
|
|
|
| |||||
| (87,484 | ) | (75,215 | ) | |||||
|
|
|
| |||||
Current portion | 436,451 | 341,591 | ||||||
|
|
|
| |||||
Other non-current accounts receivable have maturities from 2 to 5 years. In the particular case of fiscal credit, Company Management estimates that this balance will be applied against the fiscal debit from future operations over the medium term.
F-52
Table of Contents
(All amounts are expressed in thousands of S/. unless otherwise stated)
The following contains a description of major accounts receivable:
Advances to suppliers -
Mainly corresponds to advances that the subsidiary GyM S.A. provided for approximately S/.171.5 million to import equipment to be used in different projects, which are detailed as follows, based on the related project:
| December 31, | ||||||||
| 2012 | 2011 | |||||||
| S/.000 | S/.000 | |||||||
Project: | ||||||||
Consorcio Tren Eléctrico | 58,203 | 28,484 | ||||||
Consorcio Rio Mantaro | 27,067 | — | ||||||
Consorcio GyM Conciviles | 26,730 | — | ||||||
Central Hidroeléctrica Machu Picchu | 15,132 | 45,569 | ||||||
Inversiones y Construcciones GyM Ltda | 9,110 | 5,665 | ||||||
Ciudad Nueva Fuerabambas | 10,525 | 5,311 | ||||||
Ampliación Red Principal Calidda | 8,759 | 4,645 | ||||||
Servicios para proyectos inmobiliarios | 4,663 | 2,906 | ||||||
Edificio Real 8 | 3,442 | — | ||||||
GyM Chile SPA | 1,709 | — | ||||||
Stracon GyM | 1,557 | — | ||||||
Mantenimiento Periodico/Red Vial 1 | 1,474 | — | ||||||
Consorcio Peruano de Conservación | 1,421 | — | ||||||
Consorcio Rio Urubamba | 1,194 | — | ||||||
Consorcio Atocongo | 925 | — | ||||||
Consorcio La Gloria | 827 | 4,591 | ||||||
Central de Equipos | 683 | — | ||||||
Planta de Emulsión | 459 | — | ||||||
Consorcio Constructor Alto Cayma | 417 | 3,896 | ||||||
Gran Teatro Nacional (segunda etapa) | — | 4,948 | ||||||
Proyecto La Chira | — | 4,772 | ||||||
Link Tower | — | 2,536 | ||||||
Universidad del Pacifico | — | 2,282 | ||||||
Teatro Colegio Roosevelt | — | 1,961 | ||||||
Universidad UCAL | — | 1,447 | ||||||
Ampliación Clínica San Felipe | — | 1,154 | ||||||
Hotel Libertador | — | 78 | ||||||
Other smaller projects | 7,493 | 17,055 | ||||||
|
|
|
| |||||
| 181,790 | 137,300 | |||||||
|
|
|
| |||||
Fiscal credit -
Mainly corresponds to the subsidiaries Survial S.A., GyM S.A. and GyM Ferrovías S.A. for S/.25 million, S/.14.9 million and S/.14 million, respectively, (Survial S.A., Grupo CAM and Viva GyM S.A. for S/.34.7 million, S/.11 million and S/.6.1 million, respectively in 2011). Based on its estimates, Management considers that this fiscal credit will be recovered during the ordinary course of the future operations of these subsidiaries.
Guarantee deposits -
Guarantee deposits are the funds retained by customers for work contracts mainly of subsidiary GyM S.A. which secures compliance with the contracts and are recovered once the work has been completed. Such deposits mainly correspond to the following projects:
F-53
Table of Contents
(All amounts are expressed in thousands of S/. unless otherwise stated)
| December 31, | ||||||||
| 2012 | 2011 | |||||||
| S/.000 | S/.000 | |||||||
Project: | ||||||||
Stracon GyM | 16,516 | — | ||||||
Campamentos Congas | 8,783 | 10,691 | ||||||
Conga Reticulation Camp 3000/4500 K | 7,738 | — | ||||||
Consorcio GyM Cosapi | 7,501 | 4,593 | ||||||
Pueblo Viejo (Dominican Republic) | 7,212 | 20,934 | ||||||
Proyecto Machupicchu | 4,513 | 3,195 | ||||||
Ampla Brasil | 1,402 | — | ||||||
Consorcio GyM Cosapi | 909 | — | ||||||
Conga- Campamento 400 personas K12 | 387 | — | ||||||
Edificio Real 8 | 351 | — | ||||||
Distrito S | 319 | — | ||||||
Local Euromotors | 289 | — | ||||||
Proyecto Power Chilca | — | 5,678 | ||||||
Movimientos de Tierra Antapaccay | — | 5,590 | ||||||
Proyecto Conga | — | 2,054 | ||||||
Clínica Delgado Etapa I | — | 1,790 | ||||||
Edificio Educativo Universidad Pacifico | — | 1,554 | ||||||
Universidad UCAL | — | 1,173 | ||||||
Others | 1,796 | 11,277 | ||||||
|
|
|
| |||||
| 57,716 | 68,529 | |||||||
|
|
|
| |||||
Petroleos del Perú S.A. - Petroperú SA.
These balances comprise additional investments established in the operating agreement and completed by Consorcio Terminales (a joint venture of the subsidiary GMP S.A.) for the modernization and extension of 9 terminals subject to the agreement. These investments which are presently works in progress will be transferred to Petróleos del Perú S.A. - Petroperú S.A., once a technical audit has been completed and after obtaining the written approval and accreditation of said institution; the value thus determined will be considered for billing. During fiscal 2012 and 2011, said Consortium has incurred additional investments of US$11.5 million and US$7.6 million, respectively; which will be collected over the effective period of the agreement, once Petróleos del Perú - Petroperú S.A., confirms the investment made as a result of technical audits.
This agreement consists in the operation of the oil terminals of Petroleos del Peru to store and distribute the oil to the different customers of this entity of the State.
Compensation Fund -
The balance receivable from the compensation fund corresponds to subsidiary GMP S.A. and relates to the Fund created by the Government to prevent the high volatility of the price of crude oil and its by-products from affecting the end users. In 2012 GMP S.A. received payments of S/.9.3 million (S/.20.4 million in 2011) and applications of contribution items amounting to S/.3.7 million (S/.18.1 million in 2011). In January 2011, the Fund provided this subsidiary with the amount of S/.7.2 million.
General -
Other receivables do not present past due amounts or impairment and the non-current balances are supported by contractual agreements with third-parties and in the particular case of the fiscal credit, its maturity has been determined based on the period, estimated by Management for using said fiscal credit.
The fair value of other short - term accounts receivable is similar to their carrying amount due to the fact of short term maturity.
F-54
Table of Contents
(All amounts are expressed in thousands of S/. unless otherwise stated)
At December 31, 2012, the fair value of other accounts receivable from Petróleos del Perú S.A., originates from the subsidiary GMP S.A., does not bear interest and, therefore, was discounted at the market rate prevailing at the date of the disbursements, which on average is 6% per annum (5.26% in 2011). This rate corresponds to the weighted average borrowing rate of the subsidiary.
The maximum exposure to credit risk as of the date of the report is the carrying amount of each class of other accounts receivable mentioned. The Group does not request collaterals as guarantee.
| 12 | INVENTORIES |
This account comprises:
| December 31, | ||||||||
| 2012 | 2011 | |||||||
| S/.000 | S/.000 | |||||||
Land | 326,451 | 214,899 | ||||||
Work in progress - real estate | 181,956 | 151,361 | ||||||
Construction materials | 148,565 | 77,992 | ||||||
Materials and supplies | 78,755 | 84,530 | ||||||
Finished properties | 11,689 | 17,483 | ||||||
|
|
|
| |||||
| 747,416 | 546,265 | |||||||
|
|
|
| |||||
Land -
As of December 31, 2012, this item mainly includes a plot of land of 823 hectares (S/.90.2 million) located in the district of Lurin, a province of Lima, intended for industrial and public housing development purposes (S/.85.8 million at December 31, 2011); a plot of land located in the district of Comas (S/.53.4 million), in which it is intended to implement a large green area project called Los Parques de Comas, with approximately 8,000 affordable houses (S/.51.1 million as of December 31, 2011); and Cuartel San Martín (S/.76.2 million), located in Av. El Ejército, Urb. Santa Cruz Miraflores which will be a development complex consisting of a 5-star hotel, convention, business, cultural, commercial and residential building center (S/.67 million as of December 31, 2011).
Work in progress - real estate -
As of December 31, 2012, this item mainly includes project “Parque Central Club Residencial” (S/.23.6 million), comprising 22 multi-family buildings of 12 floors each, located in Cercado de Lima, and the affordable housing project “Los Parques de Carabayllo” (S/.19.3 million) comprising 24 buildings of 4 floors each, located in Carabayllo. The affordable housing project “Los Parques de San Martin” (S/.39.6 million) comprising 20 multi-family buildings of 5, 10 and 12 floors, located in San Martin de Porres, the affordable housing project “Los Parques de Villa El Salvador” (S/.15.4 million) comprising 20 buildings of 5 floors, both projects located in Villa El Salvador, and the traditional housing project “Cipreses (S/.44.2 million). As of December 31, 2011, this item mainly included project “Parque Central Club Residencial” (S/.34.87 million), “Los Parques de Carabayllo” (S/.15.8 million), and “Los Parques de San Martin” (S/.30.63 million).
During the year, Company has capitalized financing costs in these construction works amounting to S/.4.3 million (S/.8.4 million in 2011), related to qualifying assets.
Construction materials -
The higher balance at December 31, 2012, as compared to 2011, is mainly due to the construction materials of the subsidiary Stracon GyM, which was acquired in March 2012 by consolidating its balances at the end of 2012, which amounted to S/.29.3 million; additionally, this balance includes the
F-55
Table of Contents
(All amounts are expressed in thousands of S/. unless otherwise stated)
construction materials for the new construction work in Machupicchu for S/.12.8 million and the Joint Operations established in 2012 (Vial La Quinua, Río Urubamba, Río Mantaro, GyM Conciviles and Toromocho) for a total of S/.26.2 million.
Others -
In 2012, the cost of inventory recognized as expenses is included within the cost of sales and amounted to S/.144.5 million (S/.101.3 million in 2011).
At December 31, 2012, the Group recognizes a provision for the impairment of inventories amounting to S/.9.8 million, recognized in profit or loss for the period.
| 13 | INVESTMENTS IN ASSOCIATES |
This account comprises:
| Carrying amount | ||||||||||||||||||
| Interest in capital | At December 31, | |||||||||||||||||
Entity | Class | 2012 | 2011 | 2012 | 2011 | |||||||||||||
| % | % | S/.000 | S/.000 | |||||||||||||||
Prinsur | Common | 23.86 | 23.86 | 14,807 | 14,807 | |||||||||||||
Investment Real Once S.A. | Common | 29.07 | 29.07 | 4,276 | 4,276 | |||||||||||||
Oiltanking Andina S.A.C. | Common | — | 50.00 | — | 3,652 | |||||||||||||
Sierra Morena S.A. | Common | 33.33 | 33.33 | 310 | 1,605 | |||||||||||||
Inmobiliaria Viena S.A. | Common | 13.99 | 13.99 | 20 | 20 | |||||||||||||
Consorcio Vial y Vives Mena y Ovalle Ltda. | Common | 50.00 | — | 143 | — | |||||||||||||
Ingeniería y Construcción Bechtel Vial y Vives Ltda. | Common | 40.00 | — | 2,660 | — | |||||||||||||
Constructora SK-VyV Ltda. | Common | 50.00 | — | 12,584 | — | |||||||||||||
Ingeniería y Construcción Bechtel Vial y Vives OGP-1 Ltda. | Common | 40.00 | — | 288 | — | |||||||||||||
Inmobiliaria San Silvestre S.A. | Common | 21.73 | 21.73 | 2,324 | 1,557 | |||||||||||||
Other | 34 | 36 | ||||||||||||||||
|
|
|
| |||||||||||||||
| 37,446 | 25,953 | |||||||||||||||||
|
|
|
| |||||||||||||||
Investment in Inmobiliaria Viena S. A.
Management has evaluated the degree of influence that the Group has over Inmobiliaria Viena S.A. and has determined that the Group has a significant influence regardless of the fact that its ownership interest is less than 20%, since it has a Board member with voting rights. Consequently, this investment has been classified as an associate.
The most significant investments that are not quoted in a stock exchange are described as follows:
| a) | Ingeniería y Construcción Bechtel - Vial y Vives Limitada - |
The entity is mainly engaged in providing construction and acquisition services as well as other related services to Bechtel Chile Limitada, its partner to carry out construction work.
F-56
Table of Contents
(All amounts are expressed in thousands of S/. unless otherwise stated)
| b) | Constructora SK - VyV - |
The entity is mainly engaged in the execution of civil construction work and industrial assembly, construction, buildings and carrying out engineering works, in general, and any other business agreed upon by the partners for the project “Caserones” of the client Minera Lumina Cooper.
| c) | Prinsur - |
An entity whose major asset is a plot of land of 24,957,300 m2 located in Lurin, which will be used for real estate developments. Based on recent appraisals of the property, Management believes that the commercial value of this propery is higher that its carrying amount.
| d) | Investments Real Once S.A. - |
Entity of which the major asset is a building used for real estate rental which is located in Centro Empresarial de San Isidro.
| e) | Oiltanking Andina S.A.C. - |
This entity was treated as an associate until 2011; however, at January 1, 2012, this entity entered into a merger with Oiltanking Andina Services S.A. which was mainly engaged in operating and responding to emergencies for Terminal Marino Pisco Camisea. The subsidiary GMP S.A. has control over the casting vote; therefore, this entity is consolidated as a subsidiary since January 1, 2012.
General -
The Group’s share in the assets, liabilities, revenues and expenses, and gains and losses of its major associates are as follows:
Entity | Country | Assets | Liability | Revenue | Gain/ Loss | |||||||||||||
| S/.000 | S/.000 | S/.000 | S/.000 | |||||||||||||||
As of December 31, 2012 | ||||||||||||||||||
Prinsur | Peru | 3,449 | 569 | 7 | 5 | |||||||||||||
Consorcio Vial y Vives Mena y Ovalle Ltda. | Chile | 437 | 72 | 110 | 58 | |||||||||||||
Ingenieria y Construccion Bechtel Vial y Vives Ltda. | Chile | 10,392 | 3,560 | 20,846 | 3,920 | |||||||||||||
Constructora SK-VyV Ltda. | Chile | 114,447 | 89,278 | 255,129 | 13,874 | |||||||||||||
Ingenieria y Construccion Bechtel Vial y Vives OGP-1 Ltda. | Chile | 7,888 | 7,165 | 6,337 | 688 | |||||||||||||
Sierra Morena S.A. | Peru | 976 | 46 | — | 59 | |||||||||||||
Inversiones Real Once S.A. | Peru | 21,049 | 7,201 | 3,946 | 2,428 | |||||||||||||
Inmobiliaria San Silvestre S.A. | Peru | 11,579 | 480 | 4,973 | 1 | |||||||||||||
Inmobiliaria Viena S.A. | Peru | 240 | — | 1 | 152 | |||||||||||||
|
|
|
|
|
|
|
| |||||||||||
| 170,457 | 108,371 | 291,349 | 21,185 | |||||||||||||||
|
|
|
|
|
|
|
| |||||||||||
As of December 31, 2011 | ||||||||||||||||||
Prinsur S.A. | Peru | 3,449 | 571 | — | 4 | |||||||||||||
Inversiones Real Once S.A. | Peru | 21,591 | 21,533 | 898 | 6 | |||||||||||||
Oiltanking Andina S.A.C. | Peru | 7,854 | 539 | 4,766 | 448 | |||||||||||||
Sierra Morena S.A. | Peru | 4,870 | 49 | — | 3 | |||||||||||||
Inmobiliaria San Silvestre S.A. | Peru | 6,614 | 487 | 9 | 13 | |||||||||||||
Inmobiliaria Viena S.A. | Peru | 422 | 31 | 762 | 1,053 | |||||||||||||
|
|
|
|
|
|
|
| |||||||||||
| 44,800 | 23,210 | 6,435 | 1,527 | |||||||||||||||
|
|
|
|
|
|
|
| |||||||||||
F-57
Table of Contents
(All amounts are expressed in thousands of S/. unless otherwise stated)
The movement of the investments is as follows:
| 2012 | 2011 | 2010 | ||||||||||
| S/.000 | S/.000 | S/.000 | ||||||||||
Opening balance | 25,953 | 82,234 | 88,508 | |||||||||
Acquisition and/or contributions received | 15,128 | — | 973 | |||||||||
Equity interest in results | 604 | 223 | 11,474 | |||||||||
Dividends received | — | (34,709 | ) | (8,117 | ) | |||||||
Return of capital | (2,057 | ) | — | — | ||||||||
Sale of investments | — | (21,948 | ) | (10,667 | ) | |||||||
Others | (2,182 | ) | 153 | 63 | ||||||||
|
|
|
|
|
| |||||||
Final balance | 37,446 | 25,953 | 82,234 | |||||||||
|
|
|
|
|
| |||||||
In 2012, 2011 and 2010 the following significant movements were carried out:
| • | In October 2012, as a result of the acquisition of 74% of shares capital in Ingenieria y Construccion Vial y Vives (Vial y Vives), the Group recognized its investments in the associates maintained by Vial y Vives. Such investments mainly comprise investments in Ingeniería y Construccion Bechtel, Vial y Vives Limitada and Constructora SK-VyV Ltda. for S/.2.6 million and S/.12.5 million, respectively. Additionally, these investments also include Consorcios Vial y Vives Mena y Ovalle Ltda. and Ingenieria y Construccion Bechtel Vial y Vives OGP-1 Ltda. |
| • | In December 2011, the Group sold the investments it maintained in Concesionaria Interoceánica Tramo 2 S.A., Concesionaria Interoceánica Tramo 3 S.A. and Concesionaria IIRSA Norte S.A. for S/.26.7 million, which net of their cost amounting to S/.21.9 million, generated a profit of S/.4.8 million, which is presented in the item “Profit on sale of investments” in the statement of comprehensive income. |
| • | In 2011, the investment in CONIRSA S.A. was diluted by the receipt of dividends of S/.18.6 million from GyM S.A. (S/.8.1 million in 2010). Additionally, the parent company operations received dividends of S/.16.1 million by IIRSA Sur S.A Tramo 2 and IIRSA Sur S.A. Tramo 3. |
| • | In 2010, investments in associates resulted in the recognition of S/.11.4 million under the equity method; of which, S/.9.8 million are derived from Concesionaria IIRSA Sur S.A. - Tramo 3, Concesionaria IIRSA Sur S.A. - Tramo 2, Concesionaria IIRSA Norte S.A. and CONIRSA S.A. |
| • | In 2010, the investment maintained in Oiltanking Investments Bolivia S.A., which carrying amount was S/.5.1 million, was sold for S/.21.9 million and a profit was recognized of S/.16.8 million, which is shown in “Profit on sale of investments” in the statement of comprehensive income. |
| • | In 2010, the Company completed a spin-off of subsidiary Fashion Center S.A., comprising a plot of land of 8,997.40 m2, in order to contribute it to Promotora Larcomar S.A. Subsequent to this spin-off, the Company sold its entire interest in Fashion Center S.A. for a total of S/.107.162 million, resulting in a gain of S/.57.971 million, shown in “Profit on sale of investments” in the statement of comprehensive income. Prior to this sale, the Company had merged Inversiones Larcomar S.A., a transaction which resulted in the decrease in this investment by S/.5.6 million. |
F-58
Table of Contents
(All amounts are expressed in thousands of S/. unless otherwise stated)
| 14 | PROPERTY, PLANT AND EQUIPMENT |
The movement in property, plant and equipment accounts and its corresponding accumulated depreciation for the year ended December 31, 2012 and 2011 is as follows:
| Land | Buildings | Machinery | Vehicles | Furniture and fixtures | Other equipment | Replacement units | In-transit units | Work in progress | Total | |||||||||||||||||||||||||||||||
| S/.000 | S/.000 | S/.000 | S/.000 | S/.000 | S/.000 | S/.000 | S/.000 | S/.000 | S/.000 | |||||||||||||||||||||||||||||||
At January 1, 2012 | ||||||||||||||||||||||||||||||||||||||||
Cost | 17,674 | 86,265 | 629,163 | 222,227 | 28,501 | 91,542 | 9,071 | 6,922 | 65,712 | 1,157,077 | ||||||||||||||||||||||||||||||
Accumulated depreciation | — | (15,624 | ) | (288,659 | ) | (89,600 | ) | (16,530 | ) | (59,751 | ) | — | — | — | (470,164 | ) | ||||||||||||||||||||||||
|
|
|
|
|
|
|
|
|
|
|
|
|
|
|
|
|
|
|
| |||||||||||||||||||||
Net cost | 17,674 | 70,641 | 340,504 | 132,627 | 11,971 | 31,791 | 9,071 | 6,922 | 65,712 | 686,913 | ||||||||||||||||||||||||||||||
|
|
|
|
|
|
|
|
|
|
|
|
|
|
|
|
|
|
|
| |||||||||||||||||||||
Initial net cost | 17,674 | 70,641 | 340,504 | 132,627 | 11,971 | 31,791 | 9,071 | 6,922 | 65,712 | 686,913 | ||||||||||||||||||||||||||||||
Additions | 3,713 | 17,955 | 136,853 | 82,363 | 7,161 | 29,962 | 784 | 28,033 | 96,149 | 402,973 | ||||||||||||||||||||||||||||||
Acquisition of subsidiaria - Vial y Vives | — | — | 21,745 | 75 | 1,547 | 379 | — | — | — | 23,746 | ||||||||||||||||||||||||||||||
Acquisition of subsidiaria - Stracon GyM | — | — | 24,504 | 47,233 | 31 | — | — | — | — | 71,768 | ||||||||||||||||||||||||||||||
Transfers | — | (608 | ) | (21,555 | ) | 20,459 | (216 | ) | 22,045 | 1,218 | (15,609 | ) | (65,489 | ) | (59,755 | ) | ||||||||||||||||||||||||
Deduction for sale of assets | — | (5,790 | ) | (45,868 | ) | (16,284 | ) | (633 | ) | (6,281 | ) | (63 | ) | — | — | (74,919 | ) | |||||||||||||||||||||||
Adjustments and/or reclassifications for cost - asset disposal | — | 1,791 | (3,216 | ) | 1,994 | 1,675 | (1,729 | ) | (806 | ) | (23 | ) | 683 | 369 | ||||||||||||||||||||||||||
Depreciation charge | — | (6,664 | ) | (81,798 | ) | (53,306 | ) | (8,738 | ) | (21,642 | ) | (47 | ) | — | — | (172,195 | ) | |||||||||||||||||||||||
Depreciation for sales deductions | — | 1,198 | 34,234 | 10,987 | 537 | 5,704 | — | — | — | 52,660 | ) | |||||||||||||||||||||||||||||
Adjustments and/or reclassifications for asset depreciation | — | — | 1,821 | (1,185 | ) | 5,248 | 644 | 5 | — | — | 6,533 | |||||||||||||||||||||||||||||
Depreciation for transfers | — | 362 | 22,427 | (2,565 | ) | 236 | (20,449 | ) | (11 | ) | — | — | — | |||||||||||||||||||||||||||
|
|
|
|
|
|
|
|
|
|
|
|
|
|
|
|
|
|
|
| |||||||||||||||||||||
Net final cost | 21,387 | 78,885 | 429,651 | 222,398 | 18,819 | 40,424 | 10,151 | 19,323 | 97,055 | 938,093 | ||||||||||||||||||||||||||||||
|
|
|
|
|
|
|
|
|
|
|
|
|
|
|
|
|
|
|
| |||||||||||||||||||||
At December 31, 2012 | ||||||||||||||||||||||||||||||||||||||||
Cost | 21,387 | 99,613 | 741,626 | 358,067 | 38,066 | 135,918 | 10,204 | 19,323 | 97,055 | 1,521,259 | ||||||||||||||||||||||||||||||
Accumulated depreciation | — | (20,728 | ) | (311,975 | ) | (135,669 | ) | (19,247 | ) | (95,494 | ) | (53 | ) | — | — | (583,166 | ) | |||||||||||||||||||||||
|
|
|
|
|
|
|
|
|
|
|
|
|
|
|
|
|
|
|
| |||||||||||||||||||||
Net cost | 21,387 | 78,885 | 429,651 | 222,398 | 18,819 | 40,424 | 10,151 | 19,323 | 97,055 | 938,093 | ||||||||||||||||||||||||||||||
|
|
|
|
|
|
|
|
|
|
|
|
|
|
|
|
|
|
|
| |||||||||||||||||||||
F-59
Table of Contents
(All amounts are expressed in thousands of S/. unless otherwise stated)
| Land | Buildings | Machinery | Vehicles | Furniture and fixtures | Other equipment | Replacement units | In-transit units | Work in progress | Total | |||||||||||||||||||||||||||||||
| S/.000 | S/.000 | S/.000 | S/.000 | S/.000 | S/.000 | S/.000 | S/.000 | S/.000 | S/.000 | |||||||||||||||||||||||||||||||
At January 1, 2011 | ||||||||||||||||||||||||||||||||||||||||
Cost | 20,260 | 83,939 | 497,710 | 144,596 | 16,646 | 74,615 | 5,384 | 9,515 | 30,488 | 883,153 | ||||||||||||||||||||||||||||||
Accumulated depreciation | — | (11,170 | ) | (249,578 | ) | (67,966 | ) | (9,771 | ) | (46,644 | ) | — | — | — | (385,129 | ) | ||||||||||||||||||||||||
|
|
|
|
|
|
|
|
|
|
|
|
|
|
|
|
|
|
|
| |||||||||||||||||||||
Net cost | 20,260 | 72,769 | 248,132 | 76,630 | 6,875 | 27,971 | 5,384 | 9,515 | 30,488 | 498,024 | ||||||||||||||||||||||||||||||
|
|
|
|
|
|
|
|
|
|
|
|
|
|
|
|
|
|
|
| |||||||||||||||||||||
Net initial cost | 20,260 | 72,769 | 248,132 | 76,630 | 6,875 | 27,971 | 5,384 | 9,515 | 30,488 | 498,024 | ||||||||||||||||||||||||||||||
Additions | — | 6,393 | 117,924 | 80,160 | 6,621 | 17,929 | 630 | 11,158 | 92,507 | 333,322 | ||||||||||||||||||||||||||||||
Acquisition of subsidiary - net cost | — | 1,031 | 45,656 | 4,930 | 3,969 | 1,123 | — | — | 16,447 | 73,156 | ||||||||||||||||||||||||||||||
Deductions for sale of assets | — | (2,160 | ) | (31,625 | ) | (10,299 | ) | (1,134 | ) | (2,829 | ) | — | (51 | ) | — | (48,098 | ) | |||||||||||||||||||||||
Adjustments and/or reclassifications for cost - asset disposal | (2,220 | ) | (29,379 | ) | (8,473 | ) | (1,540 | ) | 1,471 | 1,327 | — | (1,472 | ) | (710 | ) | (40,996 | ) | |||||||||||||||||||||||
Write-offs and transfers | (366 | ) | 26,441 | 7,971 | 4,380 | 928 | (623 | ) | 3,057 | (12,228 | ) | (73,020 | ) | (43,460 | ) | |||||||||||||||||||||||||
Depreciation charge | — | (5,701 | ) | (71,960 | ) | (29,899 | ) | (4,283 | ) | (15,180 | ) | — | — | — | (127,023 | ) | ||||||||||||||||||||||||
Depreciation for sales deductions | — | 834 | 25,327 | 6,782 | 948 | 1,843 | — | — | — | 35,734 | ||||||||||||||||||||||||||||||
Adjustments and/or reclassifications of asset depreciation | — | 193 | 3,793 | 1,483 | (3,222 | ) | 65 | — | — | — | 2,312 | |||||||||||||||||||||||||||||
Depreciation for disposals and transfers | — | 220 | 3,759 | — | (202 | ) | 165 | — | — | — | 3,942 | |||||||||||||||||||||||||||||
|
|
|
|
|
|
|
|
|
|
|
|
|
|
|
|
|
|
|
| |||||||||||||||||||||
Net final cost | 17,674 | 70,641 | 340,504 | 132,627 | 11,971 | 31,791 | 9,071 | 6,922 | 65,712 | 686,913 | ||||||||||||||||||||||||||||||
|
|
|
|
|
|
|
|
|
|
|
|
|
|
|
|
|
|
|
| |||||||||||||||||||||
At December 31, 2011 | ||||||||||||||||||||||||||||||||||||||||
Cost | 17,674 | 86,265 | 629,163 | 222,227 | 28,501 | 91,542 | 9,071 | 6,922 | 65,712 | 1,157,077 | ||||||||||||||||||||||||||||||
Accumulated depreciation | — | (15,624 | ) | (288,659 | ) | (89,600 | ) | (16,530 | ) | (59,751 | ) | — | — | — | (470,164 | ) | ||||||||||||||||||||||||
|
|
|
|
|
|
|
|
|
|
|
|
|
|
|
|
|
|
|
| |||||||||||||||||||||
Net cost | 17,674 | 70,641 | 340,504 | 132,627 | 11,971 | 31,791 | 9,071 | 6,922 | 65,712 | 686,913 | ||||||||||||||||||||||||||||||
|
|
|
|
|
|
|
|
|
|
|
|
|
|
|
|
|
|
|
| |||||||||||||||||||||
F-60
Table of Contents
(All amounts are expressed in thousands of S/. unless otherwise stated)
In 2012 and 2011, additions to cost correspond to acquisition of fixed assets under finance leases or direct acquisition.
In 2012 the sale of fixed assets amounted to S/.23.5 million (S/.6.4 million in 2011), resulting in a profit of S/.1.2 million (profit of S/.0.7 million in 2011), which is shown in the statement of comprehensive income under “other (losses), gains, net”.
In 2012, the Group assessed the classification of certain ítems of property, plant and equipment based on their actual function. As a result, the Group identified the need to reclassify the value of property maintained by the subsidiary Viva GyM from property, plant and equipment to property investments for S/.36 million (S/.2.2 million land and S/.33.8 million building).
Depreciation charged for the year which is depreciation on fixed assets and investment properties is broken down in the statement of comprehensive income as follows:
| 2012 | 2011 | |||||||
| S/.000 | S/.000 | |||||||
Cost of services provided | 159,526 | 113,063 | ||||||
Administrative expenses | 13,492 | 13,960 | ||||||
|
|
|
| |||||
| 173,018 | 127,023 | |||||||
|
|
|
| |||||
Depreciation distributed to comprehensive income contains S/.1,512 thousand comprising the depreciation for the year on investment properties and the capitalization of S/.689 thousand to inventories under the heading Real Estate work in progress.
The net carrying amount of machinery and equipment, vehicles and furniture and fixtures acquired under finance leases or leaseback agreements are broken down as follows:
| December 31, | ||||||||
| 2012 | 2011 | |||||||
| S/.000 | S/.000 | |||||||
Cost | 621,974 | ) | 396,100 | ) | ||||
Accumulated depreciation | (268,372 | ) | (161,626 | ) | ||||
|
|
|
| |||||
Net cost | 353,602 | 234,474 | ||||||
|
|
|
| |||||
Borrowings are guaranteed with property, plant and equipment for S/.444.6 million (S/.336.8 million as of December 31, 2011).
F-61
Table of Contents
(All amounts are expressed in thousands of S/. unless otherwise stated)
| 15 | INTANGIBLE ASSETS |
The movement of intangible assets and that of their corresponding accumulated amortization, as of December 31, 2012 and 2011, is as follows:
| Goodwill | Trademarks | Concession | Contractual relations with clients | Costs of generated internally software and development costs | Block I and Block V | Development expenses | Land use right | Other assets | Totals | |||||||||||||||||||||||||||||||
| S/.000 | S/.000 | S/.000 | S/.000 | S/.000 | S/.000 | S/.000 | S/.000 | S/.000 | S/.000 | |||||||||||||||||||||||||||||||
At January 1, 2012 | ||||||||||||||||||||||||||||||||||||||||
Net initial cost | 24,909 | — | 182,390 | 12,611 | 14,531 | 48,779 | — | 13,288 | 21,289 | 317,797 | ||||||||||||||||||||||||||||||
Additions | — | — | 28,406 | — | 3,998 | 4,897 | — | — | 1,956 | 39,257 | ||||||||||||||||||||||||||||||
Acquisition of subsidiary - net cost | 67,020 | 75,845 | — | 33,000 | — | — | — | — | — | 175,865 | ||||||||||||||||||||||||||||||
Deductions | — | — | (263 | ) | — | (20 | ) | — | — | — | (13,962 | ) | (14,245 | ) | ||||||||||||||||||||||||||
Transfer | — | — | — | — | — | 59,686 | — | — | 69 | 59,755 | ||||||||||||||||||||||||||||||
Disposals - cost | — | — | (537 | ) | — | (7,654 | ) | — | — | — | (38 | ) | (8,229 | ) | ||||||||||||||||||||||||||
Amortization charge | — | (410 | ) | (31,413 | ) | (7,147 | ) | (10,427 | ) | (21,828 | ) | — | — | (260 | ) | (71,485 | ) | |||||||||||||||||||||||
Disposals - amortization | — | — | 29 | — | 6,307 | — | — | — | 57 | 6,393 | ||||||||||||||||||||||||||||||
|
|
|
|
|
|
|
|
|
|
|
|
|
|
|
|
|
|
|
| |||||||||||||||||||||
Net final cost | 91,929 | 75,435 | 178,612 | 38,464 | 6,735 | 91,534 | — | 13,288 | 9,111 | 505,108 | ||||||||||||||||||||||||||||||
|
|
|
|
|
|
|
|
|
|
|
|
|
|
|
|
|
|
|
| |||||||||||||||||||||
At December 31, 2012 | ||||||||||||||||||||||||||||||||||||||||
Cost | 113,924 | 75,845 | 417,645 | 50,518 | 23,095 | 178,910 | 3,623 | 13,288 | 9,401 | 886,249 | ||||||||||||||||||||||||||||||
Accumulated amortization and impairment | (21,995 | ) | (410 | ) | (239,033 | ) | (12,054 | ) | (16,360 | ) | (87,376 | ) | (3,623 | ) | — | (290 | ) | (381,141 | ) | |||||||||||||||||||||
|
|
|
|
|
|
|
|
|
|
|
|
|
|
|
|
|
|
|
| |||||||||||||||||||||
Net cost | 91,929 | 75,435 | 178,612 | 38,464 | 6,735 | 91,534 | — | 13,288 | 9,111 | 505,108 | ||||||||||||||||||||||||||||||
|
|
|
|
|
|
|
|
|
|
|
|
|
|
|
|
|
|
|
| |||||||||||||||||||||
At January 1, 2011 | ||||||||||||||||||||||||||||||||||||||||
Cost | 46,904 | — | 365,046 | 6,391 | 8,907 | 96,298 | 3,623 | 13,288 | — | 540,457 | ||||||||||||||||||||||||||||||
Accumulated amortization and impairment | (21,995 | ) | — | (180,845 | ) | (2,467 | ) | (4,404 | ) | (48,154 | ) | (3,623 | ) | — | — | (261,488 | ) | |||||||||||||||||||||||
|
|
|
|
|
|
|
|
|
|
|
|
|
|
|
|
|
|
|
| |||||||||||||||||||||
Net cost | 24,909 | — | 184,201 | 3,924 | 4,503 | 48,144 | — | 13,288 | — | 278,969 | ||||||||||||||||||||||||||||||
|
|
|
|
|
|
|
|
|
|
|
|
|
|
|
|
|
|
|
| |||||||||||||||||||||
Net initial cost | 24,909 | — | 184,201 | 3,924 | 4,503 | 48,144 | — | 13,288 | — | 278,969 | ||||||||||||||||||||||||||||||
Additions | — | — | 25,378 | 175 | 17,864 | 18,029 | — | — | 21,376 | 82,822 | ||||||||||||||||||||||||||||||
Acquisition of subsidiary - net cost | — | — | — | 10,952 | — | — | — | — | — | 10,952 | ||||||||||||||||||||||||||||||
Impairment charge | — | — | — | — | (3,436 | ) | — | — | — | — | (3,436 | ) | ||||||||||||||||||||||||||||
Disposals - cost | — | — | (385 | ) | — | — | — | — | — | — | (385 | ) | ||||||||||||||||||||||||||||
Amortization charge | — | — | (26,902 | ) | (2,440 | ) | (4,400 | ) | (17,394 | ) | — | — | (87 | ) | (51,223 | ) | ||||||||||||||||||||||||
Disposal of intangibles - amortization | — | — | 98 | — | — | — | — | — | — | 98 | ||||||||||||||||||||||||||||||
|
|
|
|
|
|
|
|
|
|
|
|
|
|
|
|
|
|
|
| |||||||||||||||||||||
Net final cost | 24,909 | — | 182,390 | 12,611 | 14,531 | 48,779 | — | 13,288 | 21,289 | 317,797 | ||||||||||||||||||||||||||||||
|
|
|
|
|
|
|
|
|
|
|
|
|
|
|
|
|
|
|
| |||||||||||||||||||||
At December 31, 2011 | ||||||||||||||||||||||||||||||||||||||||
Cost | 46,904 | — | 390,039 | 17,518 | 26,771 | 114,327 | 3,623 | 13,288 | 21,376 | 633,846 | ||||||||||||||||||||||||||||||
Accumulated amortization and impairment | (21,995 | ) | — | (207,649 | ) | (4,907 | ) | (12,240 | ) | (65,548 | ) | (3,623 | ) | — | (87 | ) | (316,049 | ) | ||||||||||||||||||||||
|
|
|
|
|
|
|
|
|
|
|
|
|
|
|
|
|
|
|
| |||||||||||||||||||||
Net cost | 24,909 | — | 182,390 | 12,611 | 14,531 | 48,779 | — | 13,288 | 21,289 | 317,797 | ||||||||||||||||||||||||||||||
|
|
|
|
|
|
|
|
|
|
|
|
|
|
|
|
|
|
|
| |||||||||||||||||||||
F-62
Table of Contents
(All amounts are expressed in thousands of S/. unless otherwise stated)
| a) | Goodwill - |
Management reviews the results of its businesses based on the type of economic activity carried out. Economic activities which have given rise to goodwill in the Group are construction, electro-mechanical, engineering services and sale of IT equipment and services.
Goodwill per cash-generating unit is broken down as follows:
| December 31, | ||||||||
| 2012 | 2011 | |||||||
| S/.000 | S/.000 | |||||||
Construction - Engineering (Note 28 a) | 53,654 | — | ||||||
Construction - Mining services (Note 28 b) | 13,366 | — | ||||||
Construction - Electromechanical | 20,737 | 20,737 | ||||||
Information goods and services (Note 28 d) | 4,172 | 4,172 | ||||||
|
|
|
| |||||
| 91,929 | 24,909 | |||||||
|
|
|
| |||||
Goodwill from the electromechanical engineering business corresponds to the acquisition in prior years of the subsidiary GMA S.A., which was later merged with subsidiary GyM S.A.
As a result of the impairment testing on goodwill performed by Management on an annual basis the recoverable amount of the related cash-generating unit (CGU) is determined based on its value in use. Value in use is determined based on the future cash flows expected to be generated by the assessed CGU. As a result of these assessments no provisions for impairment was required.
The main criteria used by the Group to determine the value in use are as follows:
| Mining construction services | Engineering construction | Electro- mechanical | IT equipment and services | |||||||||||||
2012 - | ||||||||||||||||
Gross margin | 10.2 | % | 38.9 | % | 11.15 | % | 34.92 | % | ||||||||
Growth rate | 5 | % | 5 | % | 1 | % | 1.6 | % | ||||||||
Discount rate | 14 | % | 12 | % | 14 | % | 11 | % | ||||||||
2011 - | ||||||||||||||||
Gross margin | — | — | 11.8 | % | 30.6 | % | ||||||||||
Growth rate | — | — | 1 | % | 0 | % | ||||||||||
Discount rate | — | — | 14 | % | 11.3 | % | ||||||||||
A 14% rate was applied as the discount rate on the expected cash flows from the Electro-mechanical construction business unit.
These assumptions have been used for the analysis of each cash-generating unit (CGU) included in the operating segments for a period of 5 years and considering a recoverable residual value with no growth.
Management determines the budgeted gross margins based on past results and market development expectations. Average growth rates are consistent with those prevailing in the industry. Discount rates used are pre-tax and reflect the specific risk relating to the assessed CGUs.
F-63
Table of Contents
(All amounts are expressed in thousands of S/. unless otherwise stated)
| b) | Concessions - |
The intangible asset includes the value attributable to the concession for the Ancón-Huacho-Pativilca road section of the Panamericana Norte highway. The intangibles arising from this concession at December 31, 2012 mainly comprise the EPC contract for S/.98.2 million, highway improvement for S/.31.2 million, and equity trust for S/.7.9 million. By those contracts the Concessionaire has to construct, improve and rehabilitate the road infrastructure over the effective period of the concession.
Amortization of intangible assets -
The amortization of intangibles is distributed in the statement of comprehensive income as follows:
| 2012 | 2011 | |||||||
| S/.000 | S/.000 | |||||||
Cost of sales | 60,517 | 44,553 | ||||||
Administrative expenses | 10,968 | 6,670 | ||||||
|
|
|
| |||||
| 71,485 | 51,223 | |||||||
|
|
|
| |||||
Block I and V
Comprising the investments in oil production, development and right to enter into concession agreements won by subsidiary GMP S.A., by which rights are obtained to oil and hydrocarbon exploration services for Blocks I and V, with a carrying amount at December 31, 2012 amounting to to S/.82.5 million and S/.9 million, respectively (S/.39.9 million and S/.8.2 million at December 31, 2011, respectively). These blocks are amortized from the period revenue is obtained from their operation until the corresponding agreements reach maturity, that is, in 2021 for Block I and 2023 for Block V.
| 16 | BORROWINGS |
This item comprises:
| Total | Current | Non- current | ||||||||||||||||||||||
| As of December 31, | As of December 31, | As of December 31, | ||||||||||||||||||||||
| 2012 | 2011 | 2012 | 2011 | 2012 | 2011 | |||||||||||||||||||
| S/.000 | S/.000 | S/.000 | S/.000 | S/.000 | S/.000 | |||||||||||||||||||
Bank loans | 501,692 | 303,250 | 337,196 | 161,083 | 164,496 | 142,167 | ||||||||||||||||||
Finance leases | 343,782 | 226,598 | 115,623 | 69,890 | 228,159 | 156,708 | ||||||||||||||||||
|
|
|
|
|
|
|
|
|
|
|
| |||||||||||||
Total debt | 845,474 | 529,848 | 452,819 | 230,973 | 392,655 | 298,875 | ||||||||||||||||||
|
|
|
|
|
|
|
|
|
|
|
| |||||||||||||
| a) | Bank loans - |
As of December 31, 2012 and 2011 this item comprises bank loans in local and foreign currency for working capital purposes. These obligations bear interest at fixed rates which fluctuate between 2% and 9% (2.5% and 7.7% in 2011).
In April 2005, the subsidiary Norvial S.A. signed with IFC and IDB, respectively, two agreements called “Loan Agreements” by which these multilateral financial institutions agree to provide financing for the engineering, construction, completion and acceptance of the works of the first stage of the Concession Agreement amounting to US$36 million (S/. 123.5 million). As of December 31, 2012, the balance of these loans amounts to S/.47.8 million (S/.50.8 million as of December 31, 2011).
Fair values are based on the cash flows discounted by using borrowing rates of 5.61% and 6.45%.
F-64
Table of Contents
(All amounts are expressed in thousands of S/. unless otherwise stated)
Subsidiary GMP S.A., maintains a loan with Citibank N.A. as per the loan agreement signed on September 19, 2008 (amended on August 29, 2012), which was applied to the financing of the construction, equipment and operating the new Gas Pariñas Plant of the subsidiary. The major amendments to the original agreement include: an increase in the financed amount to S/.72 million US$28 million, an extension of the repayment period and a reduction of accrued interest. The guarantees given to secure this obligation are: a mortgage on the land on which the Gas Pariñas Plant has been constructed; a pledge on the equipment and assignment of the cash flows to be obtained from sales to customers (Repsol, Llama Gas, Zeta Gas and Herco). Said loan reaches maturity in August 2020, as per the new conditions agreed upon.
This debt bears interest at Libor (3m) + 1.75%, if the exchange rate, at the installment payment date, remains within the range from S/.2.60 to S/.2.75 per US$1 or (ii) 1.95%, if the above range is not maintained. In order to reduce the exposure to Libor variation, the Company signed an interest rate swap with Citibank N.A., which establishes a fixed rate of 4.80% or 5.05%, based on each of the above cases. At December 31, 2012, the balance of this loan is S/.69.2 million (S/.37.8 million as of December 31, 2011).
In September 2012 subsidiary Viva GyM S.A. has signed financial instrument contracts (forward foreign exchange contracts) to hedge the next 12 monthly foreign currency denominated cash disbursements to be provided by Banco de Crédito del Perú through a line of credit. The purpose of the hedge is to set a fixed exchange rate of the U.S. dollars to be received by the Company, with the loan proceeds obtained from BCP, and consequently, the Company would obtain a fixed amount in Peruvian nuevos Soles to cover the construction costs of a building (Torre Real 8) expressed in said currency.
The total amount subject to hedging is US$3.6 million (broken down in 12 monthly payments of US$300 thousand each). Given the fact that the hedged transaction is considered a highly probable transaction, the initial recognition of this transaction will not affect the the Company’s results for the year. Foreign exchange movements that may have an effect on the Company’s results may arise from the remeasurement of the obligation in foreign currency at each reporting date until its settlement.
The Company also obtained a loan in October 2012 from Banco Continental for a total S/.156 million (US$60 million) at a rate of 4.15%, with maturity in January 2013. This loan was acquired for working capital and the acquisition of new business from its subsidiary GyM Ferrovías S.A. and GyM S.A., respectively.
As of December 31, 2012, the Company maintains unused credit limits for S/.1,728 million, which expire within one year (S/.1,594 million as of December 31, 2011).
| b) | Finance lease obligations - |
The minimum payments to be made by maturity and present value of the finance lease obligations are as follows:
| December 31, | ||||||||
| 2012 | 2011 | |||||||
| S/.000 | S/.000 | |||||||
Up to 1 year | 124,709 | 78,572 | ||||||
From 1 to 5 years | 255,738 | 169,647 | ||||||
|
|
|
| |||||
| 380,447 | 248,219 | |||||||
Future financial charges on finance leases | (36,665 | ) | (21,621 | ) | ||||
|
|
|
| |||||
Present value of the obligations for finance lease contracts | 343,782 | 226,598 | ||||||
|
|
|
| |||||
F-65
Table of Contents
(All amounts are expressed in thousands of S/. unless otherwise stated)
The present value of finance lease obligations is as follows:
| December 31, | ||||||||
| 2012 | 2011 | |||||||
| S/.000 | S/.000 | |||||||
Up to 1 year | 115,623 | 69,890 | ||||||
From 1 to 5 years | 228,159 | 156,708 | ||||||
|
|
|
| |||||
| 343,782 | 226,598 | |||||||
|
|
|
| |||||
| c) | Fair value of borrowings - |
The carrying amount and fair value of borrowings are broken down as follows:
| Carrying amount current and non-current portion | Fair value | |||||||||||||||
| As of December 31, | As of December 31, | |||||||||||||||
| 2012 | 2011 | 2012 | 2011 | |||||||||||||
| S/.000 | S/.000 | S/.000 | S/.000 | |||||||||||||
Loans from multilateral organizations | 47,815 | 50,795 | 50,567 | 64,379 | ||||||||||||
Other loans | 797,659 | 479,053 | 828,208 | 486,203 | ||||||||||||
|
|
|
|
|
|
|
| |||||||||
| 845,474 | 529,848 | 878,775 | 550,582 | |||||||||||||
|
|
|
|
|
|
|
| |||||||||
Fair values are based on the cash flows discounted by using borrowing rates of 5.61% and 6.45%.
| 17 | TRADE ACCOUNTS PAYABLE |
This item comprises:
| December 31, | ||||||||
| 2012 | 2011 | |||||||
| S/.000 | S/.000 | |||||||
Invoices payable | 936,718 | 729,639 | ||||||
Notes payable | 569 | 24,881 | ||||||
|
|
|
| |||||
| 937,287 | 754,520 | |||||||
|
|
|
| |||||
As of December 31, 2012 and 2011, invoices payable mainly originate from the acquisition of material, supplies and services for the development of works.
| 18 | OTHER ACCOUNTS PAYABLE |
This item comprises:
F-66
Table of Contents
(All amounts are expressed in thousands of S/. unless otherwise stated)
| December 31, | ||||||||
| 2012 | 2011 | |||||||
| S/.000 | S/.000 | |||||||
Advances received from customers | 848,057 | 420,975 | ||||||
Salaries and profit sharing payable | 135,137 | 77,074 | ||||||
Loans from third-parties | 21,559 | 27,541 | ||||||
Deposits in guarantee | 7,539 | 6,295 | ||||||
Account payable for the purchase of fixed assets | 6,370 | 4,075 | ||||||
Post-retirement benefits | 5,593 | 1,239 | ||||||
Unbilled services | 3,841 | — | ||||||
Legal claims | 798 | — | ||||||
Deferred Income | 458 | — | ||||||
Other accounts payables | 38,553 | 60,351 | ||||||
|
|
|
| |||||
| 1,067,905 | 597,550 | |||||||
|
|
|
| |||||
Less: | ||||||||
Non-current portion | (52,776 | ) | (58,128 | ) | ||||
|
|
|
| |||||
Current portion | 1,015,129 | 539,422 | ||||||
|
|
|
| |||||
Advances received from customers are discounted from billing, in accordance with the terms of the agreements. These advances mainly comprise:
| December 31, | ||||||||
| 2012 | 2011 | |||||||
| S/.000 | S/.000 | |||||||
Projects: | ||||||||
Consorcio Tren Eléctrico Lima | 243,961 | 151,595 | ||||||
Consorcio Rio Mantaro | 117,315 | — | ||||||
Ministerio de Transportes y Comunicaciones | 67,366 | 43,618 | ||||||
GyM Chile SPA | 63,036 | — | ||||||
Los Cipreses | 53,064 | 20,855 | ||||||
Contrato Cora Cora | 48,658 | — | ||||||
EPC Planta Minera Inmaculada | 44,170 | — | ||||||
Consorcio Vial La Quinua | 22,463 | 34,977 | ||||||
Los Parques del Agustino 2 | 22,389 | — | ||||||
Consorcio Rio Urubamba | 15,801 | 8,676 | ||||||
Central Hidroeléctrica Machu Picchu | 15,536 | 63,904 | ||||||
Chilectra S.A. | 15,389 | — | ||||||
Southern Perú Cooper Corporation | 14,640 | — | ||||||
Inversiones y Construccion GyM | 13,041 | — | ||||||
Pezet 961 | 11,911 | 3,039 | ||||||
Parque Central Club Residencial | 9,999 | 7,819 | ||||||
Edificio Real 8 | 8,372 | — | ||||||
Consorcio GyM Conciviles | 8,307 | — | ||||||
Los Parques San Martín y Piura | 7,012 | — | ||||||
Neo 10 y Real 8-9 | 6,539 | 26,022 | ||||||
Consorcio Vial Ipacal | 6,321 | 1,481 | ||||||
Consorcio Vial Sullana | 5,161 | 580 | ||||||
Los Parques de Villa El Salvador | 4,809 | 1,592 | ||||||
Contrato Red Vial 1 | 4,476 | — | ||||||
Los Parques de Carabayllo | 1,138 | 1,239 | ||||||
Los Parques de Comas | 204 | 204 | ||||||
Los Parques del Agustino | 384 | 84 | ||||||
Rio Pallca | — | 9,562 | ||||||
Consorcio Cerro del Águila | — | 7,125 | ||||||
Consorcio La Gloria | — | 3,804 | ||||||
Oficina de Normalización Previsional | — | 2,818 | ||||||
Other projects | 16,595 | 31,981 | ||||||
|
|
|
| |||||
| 848,057 | 420,975 | |||||||
|
|
|
| |||||
F-67
Table of Contents
(All amounts are expressed in thousands of S/. unless otherwise stated)
The fair value of the other short - term accounts payable is similar to their carrying amounts due the fact to the short maturity.
| 19 | OTHER PROVISIONS |
The movement of these accounts for 2012 and 2011 is as follows:
| December 31, | ||||||||
| 2012 | 2011 | |||||||
| S/.000 | S/.000 | |||||||
Legal claims | 11,380 | 6,700 | ||||||
Contingent liabilities CAM Chile and affiliates | — | 24,466 | ||||||
Contingent liabilities Vial y Vives (Note 28) | 11,130 | — | ||||||
Provisions for the year for the acquisition of CAM (Note 28) | 35,220 | 102,776 | ||||||
Provision for well closure | 4,897 | — | ||||||
|
|
|
| |||||
| 62,627 | 133,942 | |||||||
Less: | ||||||||
Non-current portion | (51,315 | ) | (109,476 | ) | ||||
|
|
|
| |||||
Current portion | 11,312 | 24,466 | ||||||
|
|
|
| |||||
Legal claims as of December 31, 2012 and 2011 comprise provisions for labor-related obligations and tax claims recognized by subsidiaries GyM S.A., GMP S.A. and CAM Chile amounting to S/.5 million, S/.3 million and S/.3 million, respectively, see Note 27.
In 2012 a write-off of approximately S/.68 million was made comprising provisions recognized in 2011 in the business combination process and which were not used during the course of that year. (See Note 25).
In 2011 contingent liabilities were maintained from CAM Chile and affiliates involving services to be billed for S/.12.9 million and statutory bonuses and other workers’ benefits amounting to S/.11.5 million. In 2012, given the fact that the contingent liabilities became executable obligations, they were reclassified to other accounts payable.
The provision for oil well closure was set forth in the Service Agreements for Blocks I and V, in which the subsidiary GMP S.A. agreed to permanently close wells that no longer prove to have oil reserves and that were operated by the entity during the effective period of the related agreements. A preliminary estimate was made of the wells that should be permanently closed: 70 wells from Block I and 15 wells from Block V. The closure processes will start in 2013 and be completed in 2021 and 2023, respectively. As of December 31, 2012, the discounted value of the estimated provision for closure activities for the 85 wells amounted to S/.4.9 million at a discount rate of 1.78%.
It should be Noted that at the end of the effective periods of the agreements for Blocks I and V, there will be greater information and certainty regarding the amount of wells that should be permanently closed.
The gross movement of other provision is broken down as follows:
F-68
Table of Contents
(All amounts are expressed in thousands of S/. unless otherwise stated)
Other provisions | Legal claims | Contingent liabilities from acquisitions | Provisions for the for the acquisition of CAM | Provision for well closure | Total | |||||||||||||||
| S/.000 | S/.000 | S/.000 | S/.000 | S/.000 | ||||||||||||||||
At January 1, 2011 | 6,700 | — | — | — | 6,700 | |||||||||||||||
Additions | — | — | — | — | — | |||||||||||||||
Additions from business combinations | — | 24,466 | 102,776 | — | 127,242 | |||||||||||||||
|
|
|
|
|
|
|
|
|
| |||||||||||
At December 31, 2011 | 6,700 | 24,466 | 102,776 | — | 133,942 | |||||||||||||||
|
|
|
|
|
|
|
|
|
| |||||||||||
Additions | 4,680 | — | — | 4,897 | 9,577 | |||||||||||||||
Additions from business combinations | — | 11,130 | — | — | 11,130 | |||||||||||||||
Reclassifications | — | (24,466 | ) | — | — | (24,466 | ) | |||||||||||||
Write-offs | — | — | (67,556 | ) | — | (67,556 | ) | |||||||||||||
|
|
|
|
|
|
|
|
|
| |||||||||||
At December 31, 2012 | 11,380 | 11,130 | 35,220 | 4,897 | 62,627 | |||||||||||||||
|
|
|
|
|
|
|
|
|
| |||||||||||
| 20 | SHAREHOLDERS’ EQUITY |
| a) | Capital - |
As of December 31, 2012 and 2011, the authorized, subscribed and paid-in capital, according to the Company’s bylaws and amendments, is represented by 558,284,190 common shares at S/.1.00 par value each.
As of December 31, 2012 the Company’s capital structure is as follows:
Percentage of individual interest in capital | Number of shareholders | Total percentage of interest | ||||||
Up to 1.00 | 1,135 | 19.90 | ||||||
From 1.01 to 5.00 | 14 | 39.83 | ||||||
From 5.01 to 10.00 | 3 | 19.22 | ||||||
Over 10 | 1 | 21.05 | ||||||
|
|
|
| |||||
| 1,153 | 100.00 | |||||||
|
|
|
| |||||
As of December 31, 2012 the year-end quoted price of the Company’s shares was S/.9.70 per share and a trading frequency of 95% (quoted price of S/.6.66 per share and a trading frequency of 90%).
At the General Shareholders’ Meeting held on March 31, 2007, the Company established the policy of maintaining in portfolio up to 2% of its own shares for the purpose of selling them in the open market and using the cash proceeds for the sale to partially pay annual bonuses of the principal executives of the Group. As of December 31, 2011, in application of said policy, the Company maintained 200,000 shares as treasury shares; however, at December 31, 2012 the Company decided to change its policy because all shares were sold and no longer maintains the above-mentioned shares.
| b) | Legal reserve - |
In accordance with Peruvian Company Law, the legal reserve is formed by the transfer of 10% of the annual net profit, up to a maximum of 20% of the paid-in capital. In the absence of profits or freely available reserves, this legal reserve must be applied to offset losses but it has to be replenished with the profits of subsequent years. This reserve can also be capitalized but its subsequent replenishment is equally mandatory.
| c) | Share issue premiums - |
This item mainly includes both changes in the price paid and the carrying amount of acquisitions/sales of treasury shares.
F-69
Table of Contents
(All amounts are expressed in thousands of S/. unless otherwise stated)
| d) | Other comprehensive income - |
Comprising the fair value of the variable-fixed interest rate hedge signed by GMP S.A. as well as the adjustments of foreign currency translation related to foreign subsidiaries and adjustments for actuarial gains or losses. These movements are shown net of income tax, except for the translation adjustment.
The analysis of the movement of provisions is as follows:
Other provisions | Cash flow hedge | Translation adjustment | Actuarial gains/ losses | Increase in fair value of available-for-sale assets | Total | |||||||||||||||
| S/.000 | S/.000 | S/.000 | S/.000 | S/.000 | ||||||||||||||||
At January 1, 2010 | (3,783 | ) | — | — | — | (3,783 | ) | |||||||||||||
Additions | (325 | ) | (382 | ) | — | 7,460 | 6,753 | |||||||||||||
|
|
|
|
|
|
|
|
|
| |||||||||||
At December 31, 2010 | (4,108 | ) | (382 | ) | — | 7,460 | 2,970 | |||||||||||||
|
|
|
|
|
|
|
|
|
| |||||||||||
Additions | 660 | (3,940 | ) | �� | — | — | (3,280 | ) | ||||||||||||
|
|
|
|
|
|
|
|
|
| |||||||||||
At December 31, 2011 | (3,448 | ) | (4,322 | ) | — | 7,460 | (310 | ) | ||||||||||||
|
|
|
|
|
|
|
|
|
| |||||||||||
Additions | (2,251 | ) | — | (1,155 | ) | — | (3,406 | ) | ||||||||||||
|
|
|
|
|
|
|
|
|
| |||||||||||
At December 31, 2012 | (5,699 | ) | (4,322 | ) | (1,155 | ) | 7,460 | (3,716 | ) | |||||||||||
|
|
|
|
|
|
|
|
|
| |||||||||||
| 21 | DEFERRED INCOME TAX |
Deferred income tax is broken down by its estimated reversal period as follows:
| December 31, | ||||||||
| 2012 | 2011 | |||||||
| S/.000 | S/.000 | |||||||
Deferred income tax asset: | ||||||||
Reversal expected in the following 12 months | 35,574 | 21,636 | ||||||
Reversal expected after 12 months | 35,504 | 27,408 | ||||||
|
|
|
| |||||
Total deferred tax asset | 71,078 | 49,044 | ||||||
|
|
|
| |||||
Deferred income tax liability: | ||||||||
Reversal expected in the following 12 months | (38,464 | ) | (8,220 | ) | ||||
Reversal expected after 12 months | (43,715 | ) | (20,916 | ) | ||||
|
|
|
| |||||
Total deferred tax liability | (82,179 | ) | (29,136 | ) | ||||
|
|
|
| |||||
Deferred income tax asset (liability), net | (11,101 | ) | 19,908 | |||||
|
|
|
| |||||
The gross movement of the deferred income tax item is as follows:
| 2012 | 2011 | |||||||
| S/.000 | S/.000 | |||||||
As of January 1 | 19,908 | (32,828 | ) | |||||
Acquisition of subsidiary (CAM Group) | — | 3,869 | ||||||
Acquisition of subsidiary (Vial y Vives) | (14,195 | ) | — | |||||
Acquisition of subsidiary (Stracon GyM) | (6,653 | ) | — | |||||
Credit (charge) to results | (8,666 | ) | 41,795 | |||||
Tax charged to other comprehensive income | (1,158 | ) | (298 | ) | ||||
Other increases | (337 | ) | 7,370 | |||||
|
|
|
| |||||
Total as of December 31 | (11,101 | ) | 19,908 | |||||
|
|
|
| |||||
The movement of deferred tax assets and liabilities in the year, without taking into account the offsetting of balances, is as follows:
F-70
Table of Contents
(All amounts are expressed in thousands of S/. unless otherwise stated)
Deferred income tax liability | Difference from depreciation rates | Fair value gains | Results from deferred works | Investments in subsidiaries | Difference from depreciation rates on leases | Others | Total | |||||||||||||||||||||
| S/.000 | S/.000 | S/.000 | S/.000 | S/.000 | S/.000 | S/.000 | ||||||||||||||||||||||
At January 1, 2011 | 9,329 | (413 | ) | 16,768 | 7,581 | 10,266 | 5,634 | 49,165 | ||||||||||||||||||||
Charge (credit) to results | (4,872 | ) | 56 | (20,686 | ) | (5,580 | ) | — | (6,040 | ) | (37,122 | ) | ||||||||||||||||
Acquisition of subsidiary CAM Group (Note 28) | 6,545 | — | 6,692 | — | — | 4,569 | 17,806 | |||||||||||||||||||||
Charge (credit) to other comprehensive income | 53 | — | — | — | — | (873 | ) | (820 | ) | |||||||||||||||||||
Other increases | — | — | — | — | — | 107 | 107 | |||||||||||||||||||||
|
|
|
|
|
|
|
|
|
|
|
|
|
| |||||||||||||||
At December 31, 2011 | 11,055 | (357 | ) | 2,774 | 2,001 | 10,266 | 3,397 | 29,136 | ||||||||||||||||||||
|
|
|
|
|
|
|
|
|
|
|
|
|
| |||||||||||||||
Charge (credit) to results | 1,335 | — | 22,346 | (3,389 | ) | (1,221 | ) | 7,120 | 26,191 | |||||||||||||||||||
Acquisition of subsidiary Stracon GyM (Note 28) | 2,184 | — | 4,472 | — | — | — | 6,656 | |||||||||||||||||||||
Acquisition of subsidiary Vial y Vives (Note 28) | — | 14,195 | — | — | — | — | 14,195 | |||||||||||||||||||||
Charge (credit) to other comprehensive income | (2,640 | ) | — | 2,805 | 3,557 | 2 | (4,335 | ) | (611 | ) | ||||||||||||||||||
Other increases | — | — | — | — | — | 6,612 | 6,612 | |||||||||||||||||||||
|
|
|
|
|
|
|
|
|
|
|
|
|
| |||||||||||||||
At December 31, 2012 | 11,934 | 13,838 | 32,397 | 2,169 | 9,047 | 12,794 | 82,179 | |||||||||||||||||||||
|
|
|
|
|
|
|
|
|
|
|
|
|
| |||||||||||||||
Deferred income tax asset | Provisions | Accelerated tax depreciation | Tax losses | Impairment loss | Results from deferred work | Vacation leave | Others | Total | ||||||||||||||||||||||||
| S/.000 | S/.000 | S/.000 | S/.000 | S/.000 | S/.000 | S/.000 | ||||||||||||||||||||||||||
At January 1, 2011 | 1,692 | 4,919 | 6,809 | 40 | — | 1,322 | 1,555 | 16,337 | ||||||||||||||||||||||||
Charge (credit) to results | 4,695 | 1,918 | (4,883 | ) | — | 737 | 53 | 2,153 | 4,673 | |||||||||||||||||||||||
Acquisition of subsidiary | ||||||||||||||||||||||||||||||||
CAM Group (Note 28) | 7,442 | — | 2,074 | 7,103 | — | — | 5,056 | 21,675 | ||||||||||||||||||||||||
Charge (credit) to other comprehensive income | — | (659 | ) | — | 1,742 | — | — | 28 | 1,111 | |||||||||||||||||||||||
Other increases | — | — | — | — | — | — | 5,248 | 5,248 | ||||||||||||||||||||||||
|
|
|
|
|
|
|
|
|
|
|
|
|
|
|
| |||||||||||||||||
At December 31, 2011 | 13,829 | 6,178 | 4,000 | 8,885 | 737 | 1,375 | 14,040 | 49,044 | ||||||||||||||||||||||||
|
|
|
|
|
|
|
|
|
|
|
|
|
|
|
| |||||||||||||||||
Charge (credit) to results | 1,996 | 3,759 | 12,471 | (8,653 | ) | 13,456 | 1,506 | (7,010 | ) | 17,525 | ||||||||||||||||||||||
Acquisition of subsidiary (Note 28) | — | 4 | — | — | — | — | — | 4 | ||||||||||||||||||||||||
Charge (credit) to other comprehensive income | — | 154 | — | — | — | — | 1,614 | 1,768 | ||||||||||||||||||||||||
Other increases | 134 | 299 | — | — | — | 55 | 2,249 | 2,737 | ||||||||||||||||||||||||
|
|
|
|
|
|
|
|
|
|
|
|
|
|
|
| |||||||||||||||||
At December 31, 2012 | 15,959 | 10,394 | 16,471 | 232 | 14,193 | 2,936 | 10,893 | 71,078 | ||||||||||||||||||||||||
|
|
|
|
|
|
|
|
|
|
|
|
|
|
|
| |||||||||||||||||
F-71
Table of Contents
(All amounts are expressed in thousands of S/. unless otherwise stated)
As of December 31, 2012, total tax losses amounted to S/.93 million, of which S/.12.5 million are expected to be applied in 2013, S/.18.7 million in 2014 and the remaining balance in the following periods.
| 22 | WORKERS’ PROFIT SHARING |
As established under current legislation, workers’ profit sharing of Graña y Montero S.A.A., consortiums and local subsidiaries is 5% of the net income. This share is deductible for the purposes of income tax calculation.
In the case of the Dominican Republic, workers’ profit sharing rate is 10%. In the specific case of Chile, workers’ profit sharing is a component of remuneration and not a determinable percentage of profit. In Brazil and Colombia workers’ profit sharing does not exist.
In 2012, workers’ profit sharing amounted to S/.22.7 million (S/.23.6 million in 2011).
The distribution of workers’ profit sharing in the statement of comprehensive income at December 31 is as follows:
| 2012 | 2011 | |||||||
| S/.000 | S/.000 | |||||||
Cost of sales | 18,633 | 19,134 | ||||||
Administrative expenses | 4,088 | 4,431 | ||||||
|
|
|
| |||||
Total at December 31 | 22,721 | 23,565 | ||||||
|
|
|
| |||||
| 23 | EXPENSES BY NATURE |
For the years ending December 31 this item comprises the following:
| Cost of sales | Administrative expenses | Total | ||||||||||
| S/.000 | S/.000 | S/.000 | ||||||||||
2012: | ||||||||||||
Purchase of goods | 252,186 | — | 252,186 | |||||||||
Personnel charges | 1,458,715 | 125,558 | 1,584,273 | |||||||||
Services provided by third-parties | 1,389,371 | 51,378 | 1,440,749 | |||||||||
Taxes | 7,238 | 863 | 8,101 | |||||||||
Other management charges | 292,740 | 52,425 | 345,165 | |||||||||
Depreciation | 159,526 | 13,492 | 173,018 | |||||||||
Amortization | 60,517 | 10,968 | 71,485 | |||||||||
Impairment (inventories and accounts receivable) | 11,192 | 2,496 | 13,688 | |||||||||
Variation of inventories | 888,334 | — | 888,334 | |||||||||
|
|
|
|
|
| |||||||
| 4,519,819 | 257,180 | 4,776,999 | ||||||||||
|
|
|
|
|
| |||||||
2011: | ||||||||||||
Purchase of goods | 28,468 | — | 28,468 | |||||||||
Personnel charges | 1,056,356 | 114,267 | 1,170,623 | |||||||||
Services provided by third-parties | 1,379,555 | 40,730 | 1,420,285 | |||||||||
Taxes | 4,190 | 191 | 4,381 | |||||||||
Other management charges | 233,549 | 23,764 | 257,313 | |||||||||
Depreciation | 113,063 | 13,960 | 127,023 | |||||||||
Amortization | 44,553 | 6,670 | 51,223 | |||||||||
Variation of inventories | 749,783 | — | 749,783 | |||||||||
|
|
|
|
|
| |||||||
| 3,609,517 | 199,582 | 3,809,099 | ||||||||||
|
|
|
|
|
| |||||||
F-72
Table of Contents
(All amounts are expressed in thousands of S/. unless otherwise stated)
| Cost of sales | Administrative expenses | Total | ||||||||||
| S/.000 | S/.000 | S/.000 | ||||||||||
2010: | ||||||||||||
Purchase of goods | 31,585 | — | 31,585 | |||||||||
Personnel charges | 596,635 | 75,128 | 671,763 | |||||||||
Services provided by third-parties | 899,170 | 35,351 | 934,521 | |||||||||
Taxes | 30,256 | 326 | 30,582 | |||||||||
Other management charges | 180,076 | 3,813 | 183,889 | |||||||||
Depreciation | 86,723 | 5,259 | 91,982 | |||||||||
Amortization | 47,660 | 3,282 | 50,942 | |||||||||
Variation of inventories | 185,741 | — | 185,741 | |||||||||
|
|
|
|
|
| |||||||
| 2,057,846 | 123,159 | 2,181,005 | ||||||||||
|
|
|
|
|
| |||||||
| 24 | FINANCIAL INCOME AND EXPENSES |
For the years ending December 31 these items included the following:
| 2012 | 2011 | 2010 | ||||||||||
| S/.000 | S/.000 | S/.000 | ||||||||||
Financial income: | ||||||||||||
Interest on loans granted to related parties | 3,005 | 875 | 2,177 | |||||||||
Interest on short-term bank deposits | 2,007 | 8,749 | 4,809 | |||||||||
Commercial income / other income | 51 | 3,943 | 1,056 | |||||||||
Interest on loans | 14,644 | 1,470 | 1,002 | |||||||||
Income from reimbursement of performance bond | 968 | 1,108 | 1,595 | |||||||||
Commissions and guarantees | 290 | 626 | 89 | |||||||||
Interest on third-party loans | 350 | — | — | |||||||||
Recovered interest - INSS Brazil | 2,589 | — | — | |||||||||
Exchange difference gains | 263,669 | 165,534 | 134,089 | |||||||||
Other | 71 | — | — | |||||||||
|
|
|
|
|
| |||||||
| 287,644 | 182,305 | 144,817 | ||||||||||
|
|
|
|
|
| |||||||
Financial expenses: | ||||||||||||
Interest expense: | ||||||||||||
- Bank loans | 25,897 | 8,636 | 7,140 | |||||||||
- Finance lease | 19,119 | 8,476 | 2,746 | |||||||||
- Multilateral loans | 6,422 | 7,086 | 8,124 | |||||||||
- Third party loans | 1,333 | — | — | |||||||||
Expense from exchange losses | 242,543 | 163,657 | 125,874 | |||||||||
Other financial expenses | 7,441 | 9,043 | 12,913 | |||||||||
Less capitalized interest | (4,780 | ) | (8,442 | ) | (1,991 | ) | ||||||
|
|
|
|
|
| |||||||
| 297,975 | 188,456 | 154,806 | ||||||||||
|
|
|
|
|
| |||||||
| 25 | OTHER INCOME AND EXPENSES |
At December 31, 2012 the amount recognized as other income and expenses amounting to S/.75,944 thousands (S/.3,616 thousands and S/.2,684 thousands in 2011 and in 2010, respectively) primarily reflects the write-off of provisions that were recognized in 2011 for the business combination with CAM, the liabilities that expired during the year amounting to S/.68 million relating to labor-related and tax contingencies (from Brazil and Colombia for S/.32 million and S/.8 million, respectively) and trade liabilities amounting to S/.28 million, the payment probability of which became remote during the course of 2012.
F-73
Table of Contents
(All amounts are expressed in thousands of S/. unless otherwise stated)
| 26 | INCOME TAX EXPENSES |
| a) | In accordance with current legislation, each Group company is individually subject to the taxes applicable to it. Management considers that it has determined the taxable income under the general regime of income tax in accordance with the current tax legislation in each country. |
| b) | The income tax expense shown in the consolidated statement of comprehensive income comprises: |
| 2012 | 2011 | 2010 | ||||||||||
| S/.000 | S/.000 | S/.000 | ||||||||||
Current tax: | ||||||||||||
- Current tax on profit of the year | 145,909 | 184,410 | 102,133 | |||||||||
- Prior year adjustments | — | (1,168 | ) | — | ||||||||
|
|
|
|
|
| |||||||
Total current tax | 145,909 | 183,242 | 102,133 | |||||||||
|
|
|
|
|
| |||||||
Deferred tax: | ||||||||||||
- Generation and reversal of temporary differences | 8,666 | (41,795 | ) | 22,209 | ||||||||
|
|
|
|
|
| |||||||
Total deferred tax | 8,666 | (41,795 | ) | 22,209 | ||||||||
|
|
|
|
|
| |||||||
Income tax expense | 154,575 | 141,447 | 124,342 | |||||||||
|
|
|
|
|
| |||||||
| c) | The Group’s income tax on profit before taxes differs from the theoretical amount that would have resulted from applying the weighted-average income tax rate applicable to the profit of the consolidated companies, as follows: |
| 2012 | 2011 | 2010 | ||||||||||
| S/.000 | S/.000 | S/.000 | ||||||||||
Profit before income tax | 520,826 | 477,645 | 401,028 | |||||||||
|
|
|
|
|
| |||||||
Income tax by applying local applicable tax rates on profit generated in the respective countries | 156,248 | 143,294 | 120,308 | |||||||||
Tax effect on: | ||||||||||||
- Non-taxable income | (11,550 | ) | (67,353 | ) | (74,849 | ) | ||||||
- Non-deductible expenses | 19,756 | 65,506 | 78,883 | |||||||||
- Prior year adjustment | (7,432 | ) | — | — | ||||||||
- Others | (2,447 | ) | — | — | ||||||||
|
|
|
|
|
| |||||||
Income tax charge | 154,575 | 141,447 | 124,342 | |||||||||
|
|
|
|
|
| |||||||
| d) | Peruvian tax authorities have the right to examine, and, if necessary, amend the income tax determined by the Company in the last four years, as from January 1 of the year after the date when the tax returns are filed (years subject to examination). Years 2008 through 2012 are subject to examination by the tax authorities. Since differences may arise over the interpretation by the tax authorities of the regulations applicable to the Company, it is not possible at present to estimate if any additional tax liabilities will arise as a result of any eventual examinations. Any additional tax, fines and interest, if they occur, will be recognized in the results of the period when such differences with the tax authorities are resolved. Management considers that no significant liabilities will arise as a result of these possible tax examinations. |
| e) | As established under regulations in force in Peru, for purposes of determining income tax and the general sales tax, transfer pricing must be taken into account for operations with related parties and/or tax havens, which must have documentation and information supporting the methods and valuation criteria applied in their determination. Peruvian tax authorities are entitled to request such information from the taxpayer. |
F-74
Table of Contents
(All amounts are expressed in thousands of S/. unless otherwise stated)
| f) | Temporary tax on net assets - |
The temporary tax on net assets is applied to third category income generators subject to the Peruvian Income Tax General Regime. Effective 2012, the tax rate is 0.4%, applicable to the amount of the net assets exceeding S/.1 million.
The amount effectively paid may be used as a fiscal credit against payments on account of income tax under the General Regime or against the provisional tax payment of the income tax of the related period.
| g) | The weighted-average tax rate was 29.68% (29.61% in 2011). The increase in the effective rate as compared to the previous year is due to the effect of the permanent differences in the income tax calculation. |
| 27 | CONTINGENCIES, COMMITMENTS AND GUARANTEES |
As of December 31, 2012 the Group presents the following contingencies:
| a) | Tax contingencies - |
During the course of 2012, Graña y Montero S.A.A. was subject to tax audit for fiscal 2007, 2008 and 2009. As a result of this tax records examination, the Peruvian tax authorities (SUNAT) have issued resolutions of determination and penalties against which the Company has filed the respective appeals, which are pending resolution and the outcome of which Management and legal counsel consider will be favorable.
As a result of this tax records examination for fiscal years 1999 and 2001 of subsidiary GyM S.A., SUNAT has issued resolutions of determination and penalties totaling S/.29 million.
The Company has made a provision of S/.5 million which is the best estimate of the expected future expenses to be incurred any potential tax contingency and is included in the account “Other provisions”. Management considers that the outcome of the remaining court actions will be favorable, based on the analysis of their characteristics, performed by its legal counsel.
| b) | Other contingencies - |
As of December 31, 2012, civil court actions have been brought against the Company mainly relating to claims of Municipalities in respect of work execution with no municipal authorization and failure to pay municipal rights for S/.4.7 million (S/.7.7 million in 2011).
Also, similar actions have been brought against joint-controlled businesses in which the Company has an interest, mainly relating to work executed without the respective municipal authorization; these actions total approximately S/.0.8 million (S/.2 million in 2011).
The Company’s Management considers that the above-mentioned court actions will be declared unfounded, and therefore, no liabilities will arise in addition to those already paid as of December 31, 2012.
In February 2003 the Company was served notice of General Management Resolution No.004-2003-GG-OSITRAN issued by the Peruvian regulator of infrastructure and public transport investment - (OSITRAN) by which payment of S/.250,000 plus interest was ordered on the grounds of alleged withholdings of the Transport Fund (Fondo Vial) by the Company. To date, the Company has challenged said resolution and the conciliation hearing date remains to be set by the Administrative Court. Management considers that the outcome of this claim will be favorable to the Company and will not affect future financial results.
F-75
Table of Contents
(All amounts are expressed in thousands of S/. unless otherwise stated)
| c) | Commitments and Guarantees |
As of December 31, 2012, the Group maintains guarantee commitments with different financial institutions securing transactions for US$170.8 million and S/.6.3 million.
| 28 | BUSINESS COMBINATIONS |
| a) | Acquisition of Vial y Vives |
In October 2012, the Group’s subsidiary GyM S.A. acquired 74% of equity shares in Vial y Vives S.A.C., an entity based in Chile, which is mainly engaged in carrying out activities related to construction, engineering works, civil work projects and electromechanical assemblies, architecture, installations. This acquisition is part of the Group’s plan to increase its presence in markets that present high growth potential, as in Chile, and in attractive industries, such as mining and energy.
The price paid by GyM for the acquisition of Vial y Vives amounted to US$55.6 million (equivalent to S/.142 million) and resulted in the recognition of goodwill for S/.53.7 million, at the acquisition date, which is detailed as follows:
| S/.000 | US$000 | |||||||
Cash and cash equivalents | 10,445 | 4,094 | ||||||
Marketable securities | 61,664 | 24,172 | ||||||
Trade accounts receivable, net | 10,862 | 4,258 | ||||||
Other accounts receivable | 4,002 | 1,569 | ||||||
Inventories | 2,182 | 855 | ||||||
Prepaid expenses | 1,020 | 400 | ||||||
Property, plant and equipment | 23,746 | 9,309 | ||||||
Intangibles (“Order Backlog” and Brand) | 98,869 | 38,757 | ||||||
Investments | 15,128 | 5,930 | ||||||
Deferred income tax | 535 | 210 | ||||||
Accounts payable from related parties | (9,550 | ) | (3,744 | ) | ||||
Trade accounts payable | (3,806 | ) | (1,492 | ) | ||||
Other accounts payable | (17,115 | ) | (6,709 | ) | ||||
Provisions | (4,965 | ) | (1,946 | ) | ||||
Advances from clients | (47,085 | ) | (18,457 | ) | ||||
Contingent liabilities | (11,130 | ) | (4,363 | ) | ||||
Deferred income tax liability | (14,730 | ) | (5,774 | ) | ||||
|
|
|
| |||||
Fair value of net assets | 120,072 | 47,069 | ||||||
|
|
|
| |||||
Non-controlling interest (26.42%) | (31,757 | ) | (12,449 | ) | ||||
Goodwill | 53,654 | 21,033 | ||||||
|
|
|
| |||||
Total paid for acquisition | 141,969 | 55,652 | ||||||
|
|
|
| |||||
Cash payment for the acquisition | 141,969 | 55,652 | ||||||
Cash and cash equivalent of the acquired subsidiary | (10,445 | ) | (4,094 | ) | ||||
|
|
|
| |||||
Direct cash inflow from acquisition | 131,524 | 51,558 | ||||||
|
|
|
| |||||
The income and the profit generated for the period from the acquisition date to December 31, 2012 amounted to S/.23.9 million and S/.1.7 million, respectively.
If Vial y Vives had been consolidated from January 1, 2012, the income and results generated would have been S/.59.6 million and S/.7.9 million, respectively.
| b) | Acquisition of Stracon GyM - |
On March 1, 2012 GyM obtained control over certain business which it carry jointly with an entity called Stracon S.A.C. (hereinafter Stracon), as well as the control over certain interests owned by Stracon both individually and with other partners.
F-76
Table of Contents
(All amounts are expressed in thousands of S/. unless otherwise stated)
This acquisition was made effective through an entity that GyM and Stracon formed for this purpose. In fact, both entities established Stracon GyM S.A. (hereinafter Stracon - GyM), over which GyM exercises control and to which both the above-mentioned companies contributed with equity packages comprising various assets and liabilities associated with the mining industry.
This acquisition is part of the Group’s strategy to group in one single entity all businesses related to the mining industry, including existing businesses that were conducted jointly with Stracon, own business, and business owned by Stracon conducted with third parties. This strategy is intended to generate synergies, economies of scale and tax efficiencies from the integration of the mining-related businesses and taking advantage of the individual experience of both entities now conducting this restructured business.
The structure of this transaction consisted of transactions made by both entities to obtain a certain percentage of interest in Stracon - GyM, and an additional contribution of GyM. As a result of the several contributions that each party engages to make , the share capital structure of Stracon - GyM was attributed to shareholders as follows: 74.15% to GyM and 25.85% to Stracon. GyM has control over the overall operation and it applies IFRS 3 to account for this transaction.
The consideration paid by GyM for the purchase of Stracon - GyM comprising the fair value of the shares that Stracon obtain from the business combination plus a cash amount of US$16.4 million (equivalent to S/.42 million, see Note 1-c) and resulting in the recognition of goodwill of S/.13.4 million at the acquisition date, is as follows:
| S/.000 | US$000 | |||||||
Cash and cash equivalents | 885 | 347 | ||||||
Trade accounts receivable, net | 120,184 | 47,131 | ||||||
Other accounts receivable | 3,862 | 1,515 | ||||||
Inventories | 16,674 | 6,539 | ||||||
Prepaid expenses | 24 | 9 | ||||||
Property, plant and equipment | 206,153 | 80,844 | ||||||
Intangibles (“Order Backlog” and customer relationships) | 9,976 | 3,912 | ||||||
Deferred income tax assets | 674 | 264 | ||||||
Other assets | 36 | 14 | ||||||
Financial obligations | (64,058 | ) | (25,121 | ) | ||||
Trade accounts payable | (39,267 | ) | (15,399 | ) | ||||
Accounts payable to related parties | (81,820 | ) | (32,086 | ) | ||||
Other accounts payable | (1,316 | ) | (516 | ) | ||||
long-term liabilities | (126,202 | ) | (49,491 | ) | ||||
Deferred income tax liability | (7,327 | ) | (2,873 | ) | ||||
|
|
|
| |||||
Fair value of net assets | 38,478 | 15,089 | ||||||
|
|
|
| |||||
Non-controlling interest (25.85%) | (9,947 | ) | (3,901 | ) | ||||
Goodwill | 13,366 | 5,242 | ||||||
|
|
|
| |||||
Consideration paid for the purchase | 41,897 | 16,430 | ||||||
|
|
|
| |||||
Cash payment for the acquisition | 41,897 | 16,430 | ||||||
Cash and cash equivalent of the acquired subsidiary | (885 | ) | (347 | ) | ||||
|
|
|
| |||||
Direct cash inflow from acquisition | 41,012 | 16,083 | ||||||
|
|
|
| |||||
| c) | Acquisition of Compañía América de Multiservicios Limitada - CAM - |
On January 19, 2011, CAM Holding SPA and Inversiones y Construcción GyM Limitada, two subsidiaries created by the Group to carry out this transaction, signed an agreement of “Assignment of Capital Stock” with Enersis S.A. and Chilectra S.A. (the “selling parties”) under which they transferred their respective holdings of 99.958802% and 0.041197%, respectively, in the capital stock of
F-77
Table of Contents
(All amounts are expressed in thousands of S/. unless otherwise stated)
Compañía América de Multiservicios Limitada - CAM (hereinafter CAM). As consideration, Group subsidiaries paid the sellers an initial price of US$20.2 million, subject to adjustments based on several variables, such as changes in equity of CAM between the date the price was set and the date the transaction was executed.
CAM is en entity based in Chile and formed in 1998 with three business units: energy consumption measurement, implementation of electric power work and logistical services, that are provided directly or through subsidiaries operating in 5 countries in South America (Chile, Argentina, Brazil, Peru and Colombia).
On February 24, 2011, the CAM purchase transaction was closed. Immediately following the closing, the Company sold to a partner 25% of the capital stock of CAM under the same terms and conditions under which it was acquired. Such partner paid US$5.0 million for the 25% interest. The final purchase price paid by the Group was reduced by both the effect of the incoming partner, as well as certain seller adjustments to the final purchase price. Taking into account these adjustments, the price paid by the Group for the 75% interest in CAM’s capital stock amounted to US$10.8 million.
This purchase has been performed as part of the Group’s strategy to position its investments in Chile, and enter into profitable business segments which generate an increase in the operations of the Group.
The Group distributed the price paid based on the fair values of the assets acquired and liabilities assumed on February 24, 2011, the date of acquisition. A breakdown of this calculation is shown as follows:
| S/.000 | US$000 | |||||||
Fair value of assets and liabilities of CAM: | ||||||||
Cash and cash equivalents | 60,675 | 22,497 | ||||||
Trade and other accounts receivable | 220,783 | 81,862 | ||||||
Inventories | 57,150 | 21,190 | ||||||
Other accounts receivable | 20,311 | 7,531 | ||||||
Long-term trade accounts receivable | 27,696 | 10,269 | ||||||
Property, plant and equipment | 73,156 | 27,125 | ||||||
Intangibles (“Order Backlog”) | 10,952 | 4,061 | ||||||
Deferred income tax | 21,675 | 8,037 | ||||||
Other assets | 13,010 | 4,824 | ||||||
Short- and long-term loans | (35,781 | ) | (13,267 | ) | ||||
Trade and other accounts payable | (155,464 | ) | (57,643 | ) | ||||
Contingent liabilities | (24,466 | ) | (9,072 | ) | ||||
Provisions | (102,776 | ) | (38,107 | ) | ||||
Deferred income | (12,946 | ) | (4,800 | ) | ||||
Other accounts payable | (15,076 | ) | (5,410 | ) | ||||
Long-term trade accounts payable | (29,675 | ) | (11,003 | ) | ||||
Deferred income tax liability | (17,806 | ) | (6,602 | ) | ||||
Other long-term liabilities | (12,529 | ) | (4,645 | ) | ||||
|
|
|
| |||||
Fair value of net assets | 98,889 | 36,667 | ||||||
|
|
|
| |||||
Non-controlling interest (25%)(*) | (24,722 | ) | (9,167 | ) | ||||
Gain on acquisition | (45,152 | ) | (16,742 | ) | ||||
|
|
|
| |||||
Total paid for purchase | 29,015 | 10,758 | ||||||
|
|
|
| |||||
Cash payment for the acquisition | 29,015 | 10,758 | ||||||
Cash and cash equivalent of the acquired subsidiary | (60,675 | ) | (22,497 | ) | ||||
|
|
|
| |||||
Direct cash inflow from acquisition | (31,660 | ) | (11,739 | ) | ||||
|
|
|
| |||||
| (*) | Non-controlling interest was determined as the proportion of assets acquired and liabilities assumed from CAM. |
F-78
Table of Contents
(All amounts are expressed in thousands of S/. unless otherwise stated)
This acquisition has generated a gain of S/.45.2 million which resulted in, as established by IFRS 3, a review of the values initially attributed to assets and liabilities of the acquired entity. As of the date of the financial statements, the Group completed this review and in accordance with Note 4.2, concluded its distribution process of the amount paid for the purchase and accordingly, it recognized this gain in the statement of comprehensive income under “Business combination gain”.
The contribution of CAM to the income and profit of the Group from February 24 to December 31, 2011 amounts to S/.466.7 million and S/.29.4 million, respectively. If CAM had been consolidated with effect from January 1, 2011, income and profit would have been S/.558.2 million and S/.21 million, respectively.
| d) | Acquisition of Telefónica Servicios Digitales S.A. (TSD) - |
In December 2010, the subsidiary GMD S.A. acquired all of the share capital of Telefónica Servicios Digitales S.A. (TSD), an entity engaged in digitalizing and automating bank processes. The purpose of the purchase was to generate a wider range of activities for the Group, by creating a business line related to digitalization and certification of documents; the market mainly consists of companies in the financial industry and public-sector entities. The price paid for this transaction amounted to US$3.6 million (equivalent to S/.10 million) and resulted in the recognition of goodwill for S/.4.2 million which is broken down as follows:
| S/.000 | ||||
Cash and cash equivalent | 2,290 | |||
Trade and other receivables, net | 2,152 | |||
Other receivables | 19 | |||
Property, plant and equipment | 700 | |||
Intangibles (“Order Backlog”) | 2,302 | |||
Deferred taxes | (329 | ) | ||
Trade and other payables | (1,270 | ) | ||
|
| |||
| 5,864 | ||||
|
| |||
Goodwill | 4,172 | |||
|
| |||
Total cost of business combination | 10,036 | |||
|
| |||
Cash payment for the acquisition | 10,036 | |||
Cash and cash equivalent of the acquired subsidiary | (2,290 | ) | ||
|
| |||
Direct cash inflow from acquisition | 7,746 | |||
|
| |||
Revenues and profit or loss generated for 2010 amounted to S/.45 thousand and S/.10 thousand, respectively.
If TSD had been consolidated as from January 1, 2010, the revenue and profits or loss generated would have been S/.8.4 million and S/.2 million, respectively.
| 29 | DIVIDENDS |
At the General Shareholders’ meeting held on March 30, 2012, it was agreed to distribute dividends amounting to S/.86,722,434 (S/.0.156 per share), which correspond to the profits of 2011.
Additionally, at the General Shareholders’ meeting held on March 30, 2011, it was agreed to distribute dividends for S/.55,015,923 (S/.0.098 per share), which correspond to the profits of 2010.
A dividend of December 31, 2012, for S/.0.155 per share, amounting to S/.87,015,231, will be submitted to the Annual General Shareholders’ meeting which will be held on March 26, 2013. The financial statements do not reflect these dividends payable.
F-79
Table of Contents
(All amounts are expressed in thousands of S/. unless otherwise stated)
| 30 | EARNINGS PER SHARE |
Basic earnings per share are calculated by dividing the net profit of the period attributable to common shareholders of the Group by the weighted average number of common shares in issue during the year. No diluted earnings per common share were calculated because there are no common or investment shares with potential dilutive effects (i.e., financial instruments or agreements that give the right to obtain common or investments shares); therefore, it is equal to basic earnings per share. The basic earnings per share are broken down as follows:
| 2012 | 2011 | |||||||
| S/.000 | S/.000 | |||||||
Profit attributable to the controlling interest in the Company | 289,954 | 289,076 | ||||||
|
|
|
| |||||
Weighted average number of shares in issue at S/.1.00 each, at December 31, 2012 (S/.0.7 each at December 31, 2011 and at December 31, 2010) | 558,284,190 | 558,284,190 | ||||||
|
|
|
| |||||
Basic and diluted earnings per share (in S/.) | 0.519 | 0.518 | ||||||
|
|
|
| |||||
| 31 | TRANSACTIONS WITH NON-CONTROLLING INTERESTS |
(a) Acquisition of an additional interest in a subsidiary
In May 2012, the Group acquired the remaining 26.99% of the shares issued of Survial S.A. at a sales price of S/.4,393 thousand. The Group holds now 99.99% of the total share capital of Survial S.A. The carrying amount of the Group’s non-controlling interests at the acquisition date was S/.4,757,000. The Group derecognized these non-controlling interests for S/.4,757,000 and recorded and increase in capital attributable to parent owners of S/.364 thousand.
The effect of the changes in the interest held by Survial S.A. in the share capital attributable to the Company’s controllers is broken down as follows:
| At December 31, 2012 | ||||
| S/.000 | ||||
Carrying amount of acquired non-controlling interest | 4,757 | |||
Consideration paid to non-controlling interest | (4,393 | ) | ||
|
| |||
Lower consideration paid attributable to the Company’s controllers | 364 | |||
|
| |||
| (b) | Disposal of interests in subsidiary with no loss of control |
In January 2012, the Company sold 0.17% (S/.708,000) of its total interest of 93.84% held in GyM S.A. for S/.555,000. The carrying amount of the non-controlling interest in GyM S.A. at the disposal date was S/.25,682,000 (that is, 6.16% interest).
In January 2012, the Company sold 0.40% (194,000) of its total interest of 99.97% held in Concar S.A. for S/.638,000. The carrying amount of the non-controlling interest in Concar S.A. at the disposal date was S/.14,500 (that is, 0.03% interest).
F-80
Table of Contents
(All amounts are expressed in thousands of S/. unless otherwise stated)
The effect of the changes in the interests held by GyM S.A. and Concar S.A. in the share capital attributable to the Company’s controllers is broken down as follows:
| At December 31, 2012 | ||||
| S/.000 | ||||
Carrying amount of non-controlling interest sold | (902 | ) | ||
Consideration received from non-controlling interests | 1,193 | |||
|
| |||
Increase in equity of the Company’s controllers | 291 | |||
|
| |||
There were no transactions with non-controlling interest in 2010 and 2011.
| (c) | Effects of transactions with non-controlling interests on equity attributable to Parent owners for the year ended December 31, 2012. |
| At December 31, 2012 | ||||
| S/.000 | ||||
Changes in equity attributable to Company controllers arising from: | ||||
acquisition of additional interest in subsidiary | (364 | ) | ||
Disposal of interest in a subsidiary without loss of control | 291 | |||
|
| |||
Decrease in equity of the Company controllers | (73 | ) | ||
|
| |||
| (d) | Contributions of non-controlling shareholders |
Comprising the contributions made by the partners of subsidiary Viva GyM S.A. for their real estate projects. At December 31 the amounts contributed were the following:
| 2012 | 2011 | 2010 | ||||||||||
| S/.000 | S/.000 | S/.000 | ||||||||||
Contributions | 30,224 | — | 18,377 | |||||||||
Returns of contributions | (4,128 | ) | (13,328 | ) | (19,450 | ) | ||||||
|
|
|
|
|
| |||||||
Increase in equity of non-controlling interest | 26,096 | (13,328 | ) | (1,073 | ) | |||||||
|
|
|
|
|
| |||||||
Contribution returns mainly correspond to profit attributable to the party for the housing project El Agustino I, which has been completed and most of the apartments have been delivered to the customers.
| (e) | Subsidiaries constitution - |
This item corresponds to the constitution of subsidiaries GyM Ferrovías and Concesionaria La Chira. In 2011, capital contributions were made for these entities amounting to S/.30,776 thousand, which comprise 100% of GyM Ferrovías amounting to S/.25,026 thousand and 50% of Concesionaria La Chira amounting to S/.5,750 thousand. In 2012, the remaining 50% of the capital contribution related to Concesionaria La Chira was made, which amounted to S/.5,750 thousand.
| (f) | Debt capitalization - |
Comprising the capitalization of debt arising from obligations maintained by Stracon GyM with its investors, GyM and Stracon S.A.C., amounting to S/.12.2 millions.
F-81
Table of Contents
(All amounts are expressed in thousands of S/. unless otherwise stated)
| (g) | Dividends |
At December 31, 2012 and 2011 dividends were distributed for S/.37.5 million and S/.14.9 million, respectively. In 2010, no dividends were distributed.
| 32 | EVENTS AFTER THE DATE OF THE STATEMENT OF FINANCIAL POSITION |
On February 27, 2013 the Group entered into a syndicated loan for US$150 million (S/.387.5 million). As of February 28, 2013, the group had US$90 million (S/.232.7 million) outstanding under this loan. On March 5, 2013, the Group used part of the proceeds from this loan to repay in full US$60 million bridge loan reflected in its short-term indebtedness.
No other subsequent events have occurred that are required to be disclosed in the Notes to the financial statements.
F-82
Table of Contents
![]()
Table of Contents
PART II
INFORMATION NOT REQUIRED IN THE PROSPECTUS
Item 6. Indemnification of Directors and Officers
According to the Registrant’s by-laws, the directors and the chief executive officer of the company shall be indemnified by the company for any reasonable expenses incurred and for any loss or damage suffered in connection with any action, lawsuit or proceeding to which they have been a party as a result of their position as director or chief executive officer, to the extent such action, lawsuit or proceeding is not attributable to them. We maintain liability insurance which insure our directors and officers against liability which he or she may incur in his or her capacity as such.
Item 7. Recent Sales of Unregistered Securities
Within the past three years, the Registrant has not sold any securities, other than its common shares in transactions on the Lima Stock Exchange in the aggregate amounts of 443,872 common shares in 2010, 157,026 common shares in 2011 and 1,200,000 common shares in 2012. The Registrant believes that these sales did not require registration under the Securities Act because these securities were offered and sold outside the United States in reliance upon the exemption from the registration requirements of the Securities Act contained in Regulation S under the Securities Act or, alternatively, in transactions exempt from the registration requirements of the Securities Act pursuant to Section 4(2) thereof.
Item 8. Exhibits and Financial Statement Schedules
| (a) | Exhibits |
| Exhibit Number | Description of Document | |
| 1.1* | Form of Underwriting Agreement | |
| 3.1* | By-laws of the Registrant, as currently in effect | |
| 4.1* | Registrant’s Form of American Depositary Receipt (included in Exhibit 4.2) | |
| 4.2* | Form of Deposit Agreement among the Registrant, [—], as depositary, and the holders from time to time of American depositary shares issued thereunder. | |
| 5.1* | Form of Opinion of Muñiz, Ramírez, Pérez-Taiman & Olaya Abogados regarding the validity of the common shares being registered | |
| 8.1* | Form of Opinion of Simpson Thacher & Bartlett LLP regarding certain U.S. tax matters | |
| 8.2* | Form of Opinion of Estudio Muñiz, Ramírez, Pérez-Taiman & Olaya regarding certain Peruvian tax matters | |
| 21.1* | Subsidiaries of the Registrant | |
| 23.1* | Consent of Dongo, Soria, Gaveglio y Asociados Sociedad Civil de Responsabilidad Limitada, a member firm of PricewaterhouseCoopers | |
| 23.2* | Consent of Muñiz, Ramírez, Pérez-Taiman & Olaya Abogados, Peruvian legal counsel of the Registrant (included in Exhibits 5.1 and 8.2) | |
| 23.3* | Consent of Simpson Thacher & Bartlett LLP (included in Exhibit 8.1) | |
| 24.1* | Powers of Attorney (included in signature pages in Part II of this registration statement) | |
| * | To be filed by amendment. |
II-1
Table of Contents
| (b) | Financial Statement Schedules |
None.
Item 9. Undertakings
The undersigned registrant hereby undertakes:
Insofar as indemnification for liabilities arising under the Securities Act may be permitted to directors, officers and controlling persons of the Registrant pursuant to the provisions described in Item 6 of this Registration Statement, or otherwise, the Registrant has been advised that in the opinion of the Securities and Exchange Commission such indemnification is against public policy as expressed in the Securities Act and is, therefore, unenforceable. In the event that a claim for indemnification against such liabilities (other than the payment by the Registrant of expenses incurred or paid by a director, officer or controlling person of the Registrant in the successful defense of any action, suit or proceeding) is asserted against the Registrant by such director, officer or controlling person in connection with the securities being registered, the Registrant will, unless in the opinion of its counsel the matter has been settled by controlling precedent, submit to a court of appropriate jurisdiction the question whether such indemnification by it is against public policy as expressed in the Securities Act and will be governed by the final adjudication of such issue.
1. For purposes of determining any liability under the Securities Act, the information omitted from the form of prospectus filed as part of this registration statement in reliance upon Rule 430A and contained in a form of prospectus filed by the Registrant pursuant to Rule 424(b)(1) or (4) or 497(h) under the Securities Act shall be deemed to be part of this registration statement at the time it was declared effective.
2. For the purpose of determining any liability under the Securities Act, each post-effective amendment that contains a form of prospectus shall be deemed to be a new registration statement relating to the securities offered therein, and the offering of such securities at that time shall be deemed to be the initialbona fideoffering thereof.
For the purposes of Item 512(F) of Regulation S-K, the Registrant hereby also undertakes to provide to the underwriters at the closing specified in the underwriting agreement, certificates in such denominations registered in such names as required by the underwriters to permit prompt delivery to each purchaser.
II-2
Table of Contents
SIGNATURES
Pursuant to the requirements of the Securities Act of 1933, the Registrant certifies that it has reasonable grounds to believe that it meets all of the requirements for filing on Form F-1 and has duly caused this registration statement to be signed on its behalf by the undersigned, thereunto duly authorized, in the City of Lima, Peru, on [—], 2013.
| GRAÑA Y MONTERO S.A.A. | ||
| By: |
| |
| Name: | ||
| Title: | ||
II-3
Table of Contents
POWER OF ATTORNEY
KNOW ALL PERSONS BY THESE PRESENTS, that each person whose signature appears below hereby constitutes and appoints [—] and [—], and each of them, individually, as his true and lawful attorneys-in-fact and agents, with full power of substitution and resubstitution, for him and in his name, place and stead in any and all capacities, in connection with this Registration Statement, including to sign in the name and on behalf of the undersigned, this Registration Statement and any and all amendments thereto, including post-effective amendments and registrations filed pursuant to Rule 462 under the Securities Act of 1933, and to file the same, with all exhibits thereto, and other documents in connection therewith, with the Securities and Exchange Commission, granting unto such attorneys-in-fact and agents full power and authority to do and perform each and every act and thing requisite and necessary to be done in and about the premises, as fully to all intents and purposes as he might or could do in person, hereby ratifying and confirming all that said attorneys-in-fact and agents, or his substitute, may lawfully do or cause to be done by virtue hereof.
Pursuant to the requirements of the Securities Act of 1933, as amended, this Registration Statement has been signed by the following persons on the [—], 2013 in the capacities indicated.
Signature
| Chief Executive Officer / Director | |||
| Mario Alvarado Pflucker | ||||
| Chief Financial Officer and Principal Accounting Officer | |||
| Mónica Miloslavich Hart | ||||
| Director | |||
| José Graña Miró Quesada | ||||
| Director | |||
| Carlos Montero Graña | ||||
| Director | |||
| Luis Miró Quesada Valega | ||||
| Director | |||
| José Chlimper Ackerman | ||||
| Director | |||
| Roberto Abusada Salah | ||||
| Director | |||
| José Antonio Colomer Guiu | ||||
| Director | |||
| Hernando Graña Acuña | ||||
| Director | |||
| Hugo Santa María Guzmán | ||||
II-4
Table of Contents
SIGNATURE OF AUTHORIZED REPRESENTATIVE IN THE UNITED STATES
Pursuant to the Securities Act of 1933, the undersigned, the duly authorized representative in the United States of GRAÑA Y MONTERO S.A.A., has signed this registration statement or amendment thereto in New York, New York, on [—], 2013.
| Authorized Representative | ||
| By: |
| |
II-5