Exhibit 99.1
Investor PresentationMay 2016
Forward-Looking Statements We make forward-looking statements in this presentation that are subject to risks and uncertainties. These forward-looking statements include information about possible or assumed future results of our business, beliefs, expectations or intentions, financial condition, liquidity, results of operations, cash flow and plans and objectives. When we use the words “believe,” “expect,” “anticipate,” “estimate,” “plan,” “project,” “goal,” “potential,” “predict,” “continue,” “intend,” “should,” “may” or similar expressions, we intend to identify forward-looking statements. Statements regarding the following subjects, among others, may be forward-looking: economic changes, either nationally or in the markets in which we operate, including declines in employment, volatility of mortgage interest rates, consumer sentiment and inflation; downturns in the homebuilding industry, either nationally or in the markets in which we operate; continued volatility and uncertainty in the credit markets and broader financial markets; our business operations; changes in our business and investment strategy; availability of land to acquire and our ability to acquire such land on favorable terms or at all; availability, terms and deployment of capital; disruptions in the availability of mortgage financing or increases in the number of foreclosures in our markets; shortages of or increased prices for labor, land or raw materials used in housing construction; delays or restrictions in land development or home construction or reduced consumer demand resulting from adverse weather and geological conditions or other events outside our control; the cost and availability of insurance and surety bonds; changes in, or the failure or inability to comply with, governmental laws and regulations; the timing of receipt of regulatory approvals and the opening of communities; the degree and nature of our competition; our leverage and debt service obligations; our future operating expenses, which may increase disproportionately to our revenue; our ability to achieve operational efficiencies with future revenue growth; our relationship, and actual and potential conflicts of interest, with PICO Holdings Inc.; and availability of qualified personnel and our ability to retain our key personnel.The forward-looking statements are based on our beliefs, assumptions and expectations of our future performance, taking into account all information currently available to us. Forward-looking statements are not predictions of future events. These beliefs, assumptions and expectations can change as a result of many possible events or factors, not all of which are known to us. If a change occurs, our business, financial condition, liquidity and results of operations may vary materially from those expressed in our forward-looking statements. Any forward-looking statement speaks only as of the date on which it is made. New risks and uncertainties arise over time, and it is not possible for us to predict those events or how they may affect us. Except as required by law, we are not obligated to, and do not intend to, update or revise any forward-looking statements, whether as a result of new information, future events or otherwise. 2
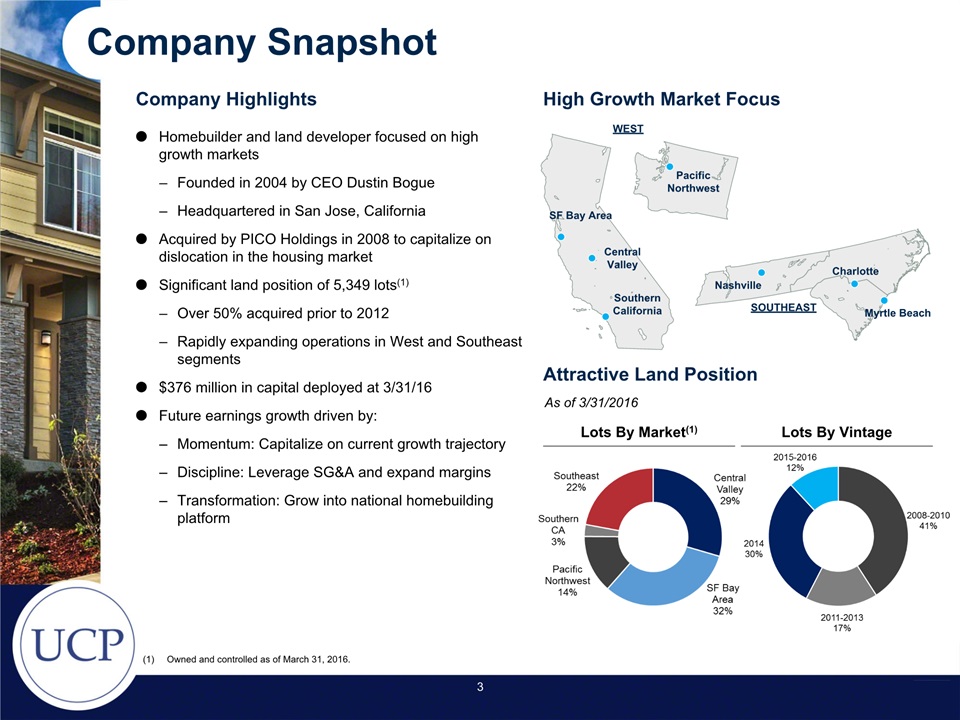
Company Snapshot Owned and controlled as of March 31, 2016. Attractive Land Position Homebuilder and land developer focused on high growth markets Founded in 2004 by CEO Dustin BogueHeadquartered in San Jose, CaliforniaAcquired by PICO Holdings in 2008 to capitalize on dislocation in the housing marketSignificant land position of 5,349 lots(1)Over 50% acquired prior to 2012Rapidly expanding operations in West and Southeast segments$376 million in capital deployed at 3/31/16 Future earnings growth driven by:Momentum: Capitalize on current growth trajectoryDiscipline: Leverage SG&A and expand marginsTransformation: Grow into national homebuilding platform High Growth Market Focus Company Highlights Lots By Vintage Lots By Market(1) As of 3/31/2016 3 Nashville SouthernCalifornia CentralValley SF Bay Area Pacific Northwest Charlotte Myrtle Beach SOUTHEAST WEST

Geographic Segment Overview Company management, data as of March 31, 2016. Company management, data as of March 31, 2016. Active communities consist of those developments with more than 15 homes remaining to deliver. 4 SF Bay Area Central Valley Southern California Pacific Northwest Southeast Primary Counties / Metros Santa ClaraMontereySan Benito FresnoMaderaSan JoaquinTulareKern Los AngelesVenturaInland Empire SeattleOlympia CharlotteNashvilleMyrtle Beach 2015 Deliveries 146 151 57 78 269 2015 Avg. Sales Price ($000s) $579 $358 $356 $423 $226 2015 Homebuilding Revenue ($mm) $84.5 $54.1 $20.3 $33.0 $60.7 Total Inventory(1)(Owned & Controlled Lots) 1,711 1,579 149 729 1,181 Active Communities(2) 7 7 1 4 9 Market Highlights Among best performing U.S. economies Constrained land supplyHigh barrier to entry markets Active in desirable submarkets UCP offers wide range of homes Deep land positions Large and diverse marketUCP strategically positioned across multiple sub markets, price points, buyer typesStrong growth market for UCP Dynamic market with job growth, low unemployment and a highly educated workforceDiversified product mix by market segment Employment growth exceeds national averages Focused primarily on the 1st and 2nd time move-up buyers Well situated in high demand markets
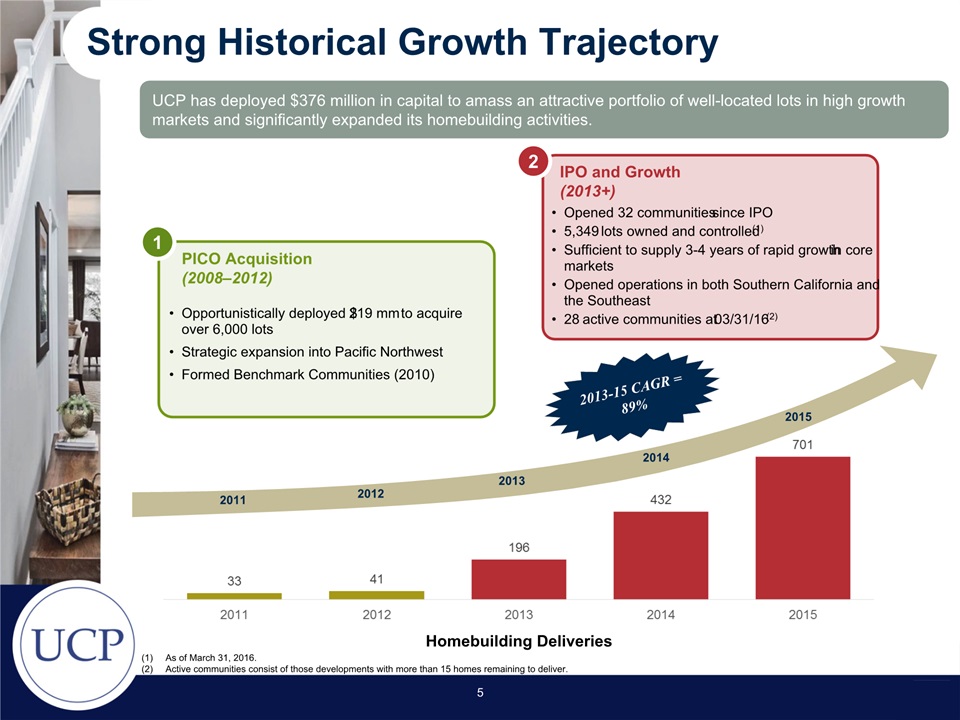
Strong Historical Growth Trajectory As of March 31, 2016. Active communities consist of those developments with more than 15 homes remaining to deliver. Homebuilding Deliveries UCP has deployed $376 million in capital to amass an attractive portfolio of well-located lots in high growth markets and significantly expanded its homebuilding activities. Opened 32 communities since IPO5,349 lots owned and controlled(1)Sufficient to supply 3-4 years of rapid growth in core marketsOpened operations in both Southern California and the Southeast28 active communities at 03/31/16(2) IPO and Growth(2013+) 2 Opportunistically deployed $219 mm to acquire over 6,000 lotsStrategic expansion into Pacific NorthwestFormed Benchmark Communities (2010) PICO Acquisition(2008–2012) 1 2011 2012 2013 2014 2015 5 2013-15 CAGR = 89%

Foundation Built To Drive Success Momentum 1 Discipline 2 3 6 Transformation
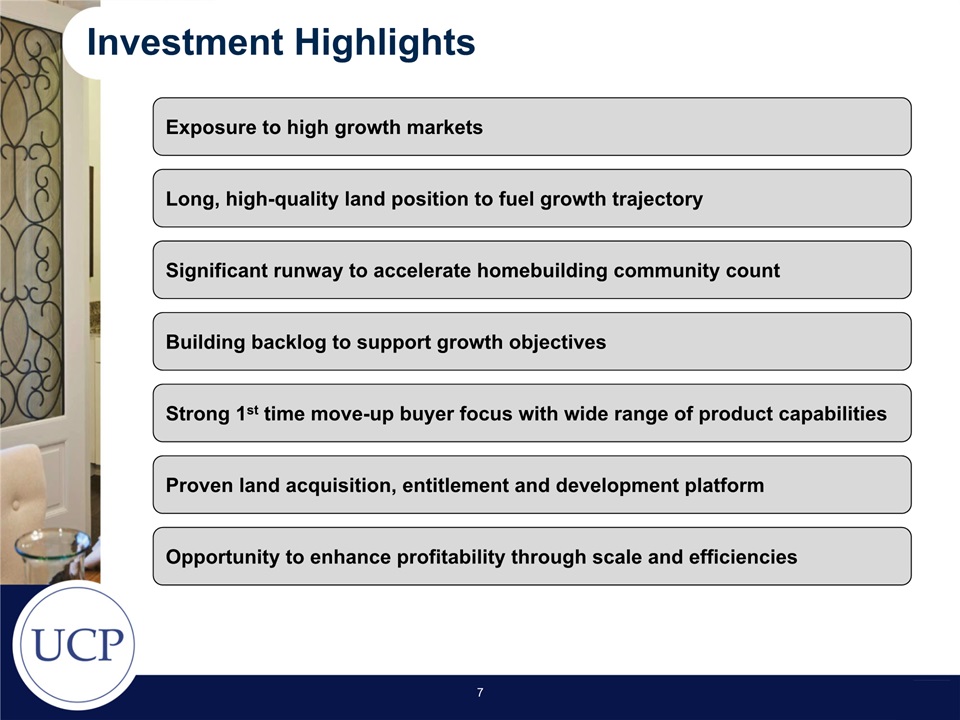
Investment Highlights Long, high-quality land position to fuel growth trajectory Exposure to high growth markets Significant runway to accelerate homebuilding community count Strong 1st time move-up buyer focus with wide range of product capabilities Proven land acquisition, entitlement and development platform Opportunity to enhance profitability through scale and efficiencies Building backlog to support growth objectives 7
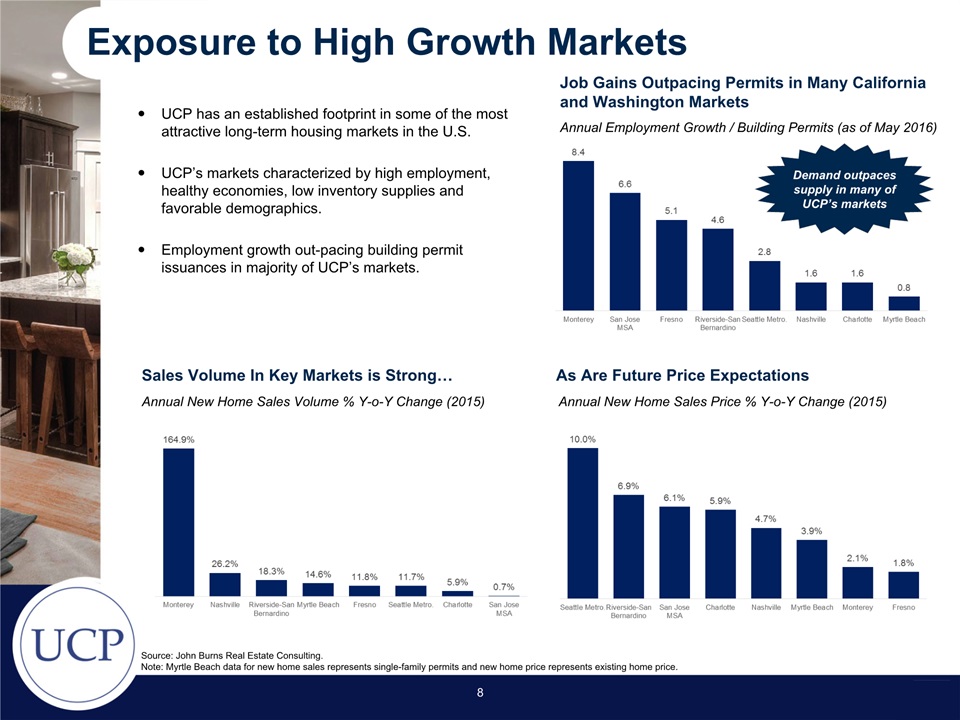
Exposure to High Growth Markets Annual New Home Sales Volume % Y-o-Y Change (2015) Job Gains Outpacing Permits in Many California and Washington Markets UCP has an established footprint in some of the most attractive long-term housing markets in the U.S. UCP’s markets characterized by high employment, healthy economies, low inventory supplies and favorable demographics.Employment growth out-pacing building permit issuances in majority of UCP’s markets. 8 Annual New Home Sales Price % Y-o-Y Change (2015) Source: John Burns Real Estate Consulting. Note: Myrtle Beach data for new home sales represents single-family permits and new home price represents existing home price. Sales Volume In Key Markets is Strong… As Are Future Price Expectations Demand outpaces supply in many of UCP’s markets Annual Employment Growth / Building Permits (as of May 2016)

Opportunity to accelerate community openingsStrategic and well-positioned lot supply Adequate supply to fulfill growth objectives Long Land Position to Fuel Growth Lots as of 3/31/2016 Lots as of 3/31/2016 Lot Supply by Market Owned and Controlled Lot Vintage 9 West Reporting Segment East Reporting Segment Years land supply defined as total owned and controlled lots divided by 2015 deliveries. Lots Market Owned Controlled Total 2015 Deliveries Years Land Supply(1) Central Valley 1,470 109 1,579 151 10+ SF Bay Area 1,470 241 1,711 146 10+ Pacific Northwest 672 57 729 78 9.3 Southern California 149 0 149 57 2.8 Southeast 861 320 1,181 269 4.4 Total 4,622 727 5,349 701 7+
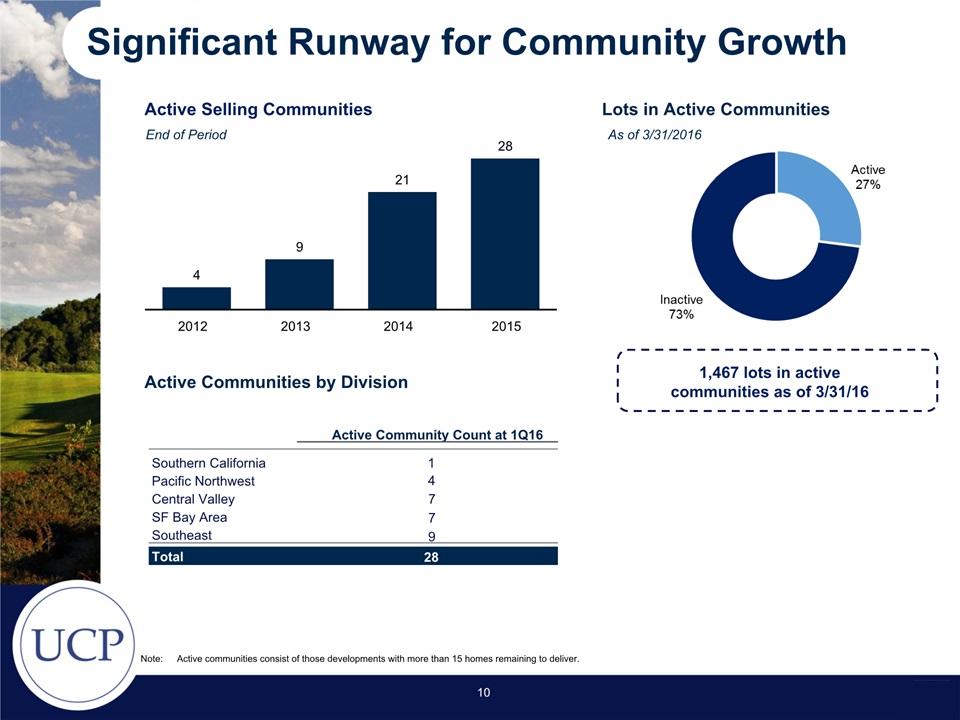
Significant Runway for Community Growth Active Selling Communities Lots in Active Communities End of Period As of 3/31/2016 1,467 lots in active communities as of 3/31/16 10 23% Active Note: Active communities consist of those developments with more than 15 homes remaining to deliver. 4 9 21 28 2012 2013 2014 2015 Active Communities by Division Active Community Count at 1Q16 Southern California 1 Pacific Northwest 4 Central Valley 7 SF Bay Area 7 Southeast 9 Total 28

Building Backlog to Fuel Future Growth UCP has substantially grown it’s backlog since 2013, in both unit count and dollar value. Backlog Over Time (Units) Backlog Units By Reporting Segment 11 As of 3/31/2016 Division 2015 ASP ($000’s) Current Base Price Range ($000’s) Commentary Central Valley $358 $199 - $520 Home sizes range from 1,500 – 3,500 sq. ft. in variety of plan offerings SF Bay Area $579 $330 - $700 Current communities positioned to local move-up families and regional move-down empty nesters Pacific Northwest $423 $253 - $973 Segmented by geography with King County offering move-up product and Thurston County featuring mixed array of first time and move-up Southern California $356 $700 - $779 Rancho Cucamonga predominantly move-up view-oriented homes. Infill locations planned for 2017 deliveries. Southeast $234 $160 - $720 Flexible product array designed to compete across multiple price points and geographies

Proven Land Acquisition, Entitlement and Development Platform UCP’s Entitlement and Development Expertise Land entitlement and development is a key skill set of UCP’s senior managementUCP’s substantial land position allows flexibility to either build homes or sell lots to third-party homebuildersLong-standing relationships with key land owners, broker, lenders and development companies facilitates the strategyUCP management excels in complex land acquisition scenarios where other buyers are deterred, allowing the company to maximize risk adjusted returns Disciplined Sourcing Focused on privately negotiated dealsTarget specific markets and assets using local market knowledge and strategic analysisLarge pipeline of potential deals 1 Closing / Execution Transparent communication with sellersEstablished goodwill and track recordTransactional experience 4 Structuring / Negotiation 2 Up front asset valuation and downside analysis Senior executive approval processMatch contract terms to risk profile Evaluation / Diligence 3 Risk identification, analysis, and mitigationDeep local expertise and extensive diligenceCreation and approval of business plan 12
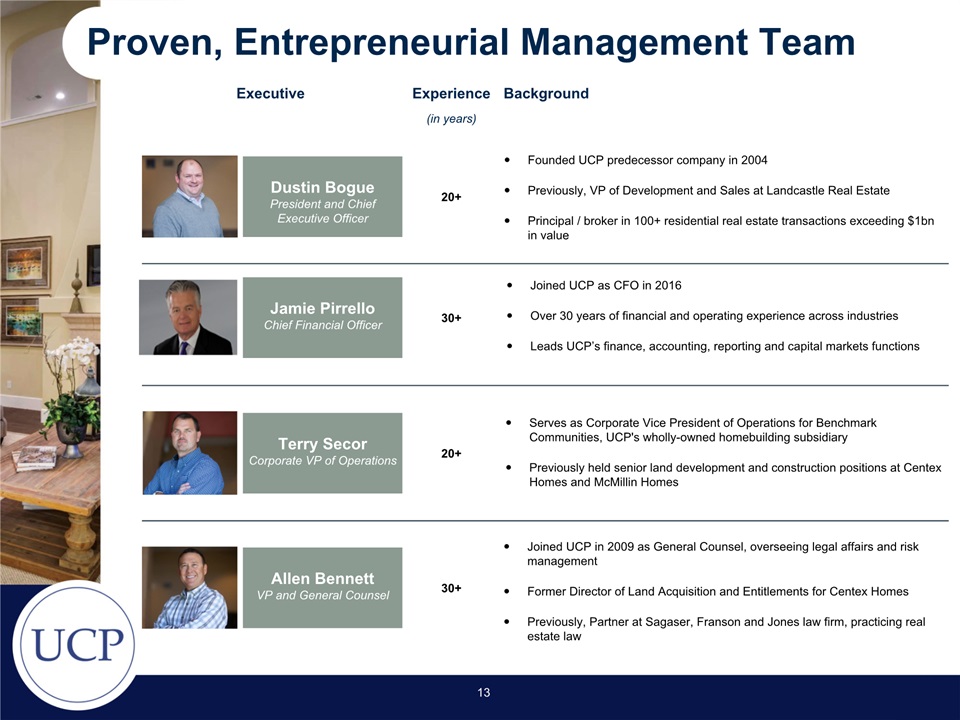
Proven, Entrepreneurial Management Team Background Experience (in years) Executive Allen BennettVP and General Counsel 30+ Joined UCP in 2009 as General Counsel, overseeing legal affairs and risk managementFormer Director of Land Acquisition and Entitlements for Centex HomesPreviously, Partner at Sagaser, Franson and Jones law firm, practicing real estate law Jamie PirrelloChief Financial Officer 30+ Joined UCP as CFO in 2016Over 30 years of financial and operating experience across industriesLeads UCP’s finance, accounting, reporting and capital markets functions Dustin BoguePresident and Chief Executive Officer 20+ Founded UCP predecessor company in 2004Previously, VP of Development and Sales at Landcastle Real EstatePrincipal / broker in 100+ residential real estate transactions exceeding $1bn in value Terry SecorCorporate VP of Operations 20+ Serves as Corporate Vice President of Operations for Benchmark Communities, UCP's wholly-owned homebuilding subsidiaryPreviously held senior land development and construction positions at Centex Homes and McMillin Homes 13

1Q 2016 Homebuilding Revenue Dynamics Homebuilding Revenue Homes Delivered Average Selling Price Mix of Homes Delivered by Region Homes Delivered $360k $370k 14
1Q 2016 Highlights Net income increased to $0.2 million, or net income attributable to UCP Class A Stockholders of $0.1 per shareTotal consolidated revenue grew 56.8% to $68.2 million Revenue from homebuilding increased 60.0% to $68.2 millionHomes delivered grew 36.9% to 167 unitsHomebuilding adjusted gross margin* percentage increased 130 bps to 19.9%Selling, general and administrative expense as a percentage of total revenue improved to 16.6%, compared to 26.5%Backlog units expanded 37.7% to 307 unitsAverage active selling communities of 28, compared to 25 1Q 2016 Compared to 1Q 2015 15 * See Appendix – Homebuilding Adjusted Gross Margin Reconciliation.

Financial Summary 16 * See Appendix – Homebuilding Adjusted Gross Margin Reconciliation.

Appendix – Homebuilding Adj. Gross Margin Reconciliation (1) Homebuilding adjusted gross margin percentage is a non-U.S. GAAP financial measure. Adjusted gross margin is defined as gross margin plus capitalized interest, impairment and abandonment charges. We use adjusted gross margin information as a supplemental measure when evaluating our operating performance. We believe this information is meaningful, because it isolates the impact that leverage and non-cash impairment and abandonment charges have on gross margin. However, because adjusted gross margin information excludes interest expense and impairment and abandonment charges, all of which have real economic effects and could materially impact our results, the utility of adjusted gross margin information as a measure of our operating performance is limited. In addition, other companies may not calculate adjusted gross margin information in the same manner that we do. Accordingly, adjusted gross margin information should be considered only as a supplement to gross margin information as a measure of our performance. The table above provides a reconciliation of adjusted gross margin numbers to the most comparable U.S. GAAP financial measure. . 17