1 © 2017 UCP | CONFIDENTIAL 4Q16 Investor Presentation March 8, 2017
Forward-Looking Statements © 2017 UPC | CONFIDENTIAL 2 We make forward-looking statements in this presentation that are subject to risks, uncertainties and assumptions. All statements other than statements of historical fact included in this presentation are forward-looking statements. You can identify forward- looking statements by the fact that they do not relate strictly to historical facts. These statements may include words such as “may,” “might,” “will,” “should,” “expects,” “plans,” “anticipates,” “believes,” “estimates,” “predicts,” “potential” “project,” “goal,” “intend” or “continue,” the negative of these terms and other comparable terminology. These forward- looking statements may include projections of our future financial or operating performance, our anticipated growth strategies, anticipated trends in our business and other future events or circumstances. These statements are based on our current expectations and projections about future events and may prove to be inaccurate. Forward-looking statements involve numerous risks and uncertainties and you should not rely on them as predictions of future events. Forward-looking statements depend on assumptions, data or methods which may prove to be incorrect or imprecise and may prove to be inaccurate. We do not guarantee that the transactions and events described in any forward-looking statements will happen as described (or that they will happen at all). The following factors, among others, could cause actual results and future events to differ materially from those set forth or contemplated in the forward-looking statements: economic changes, either nationally or in the markets in which we operate, including declines in employment, volatility of mortgage interest rates, declines in consumer sentiment and an increase in inflation; downturns in the homebuilding industry, either nationally or in the markets in which we operate; continued volatility and uncertainty in the credit markets and broader financial markets; the operating performance of our business; changes in our business and investment strategy; availability of land to acquire and our ability to acquire land on favorable terms or at all; availability, terms and deployment of capital; disruptions in the availability of mortgage financing or increases in the number of foreclosures in our markets; shortages of or increased prices for labor, land or raw materials used in housing construction; delays or restrictions in land development or home construction, or reduced consumer demand resulting from adverse weather and geological conditions or other events outside our control; the cost and availability of insurance and surety bonds; changes in, or the failure or inability to comply with, governmental laws and regulations; the timing of receipt of regulatory approvals and the opening of communities; the degree and nature of our competition; our leverage and debt service obligations; our future operating expenses, which may increase disproportionately to our revenue; our ability to achieve operational efficiencies with future revenue growth; our relationship, and actual and potential conflicts of interest, with PICO, which owns a majority economic interest in UCP, LLC; and availability of, and our ability to retain, qualified personnel. For a further discussion of these and other factors, see the “Risk Factors” disclosed in our Annual Report on Form 10-K for the year ended December 31, 2016, which is filed with the Securities and Exchange Commission. In light of these risks and uncertainties, the forward-looking statements discussed in this presentation might not occur. You are cautioned not to place undue reliance on forward-looking statements, which speak only as of the date of this presentation. While forward-looking statements reflect our good faith beliefs, they are not guarantees of future performance, and our actual results could differ materially from those expressed in any forward-looking statement. We disclaim any obligation to publicly update or revise any forward-looking statement to reflect changes in underlying assumptions or factors, new information, data or methods, future events or other changes, except as required by law.
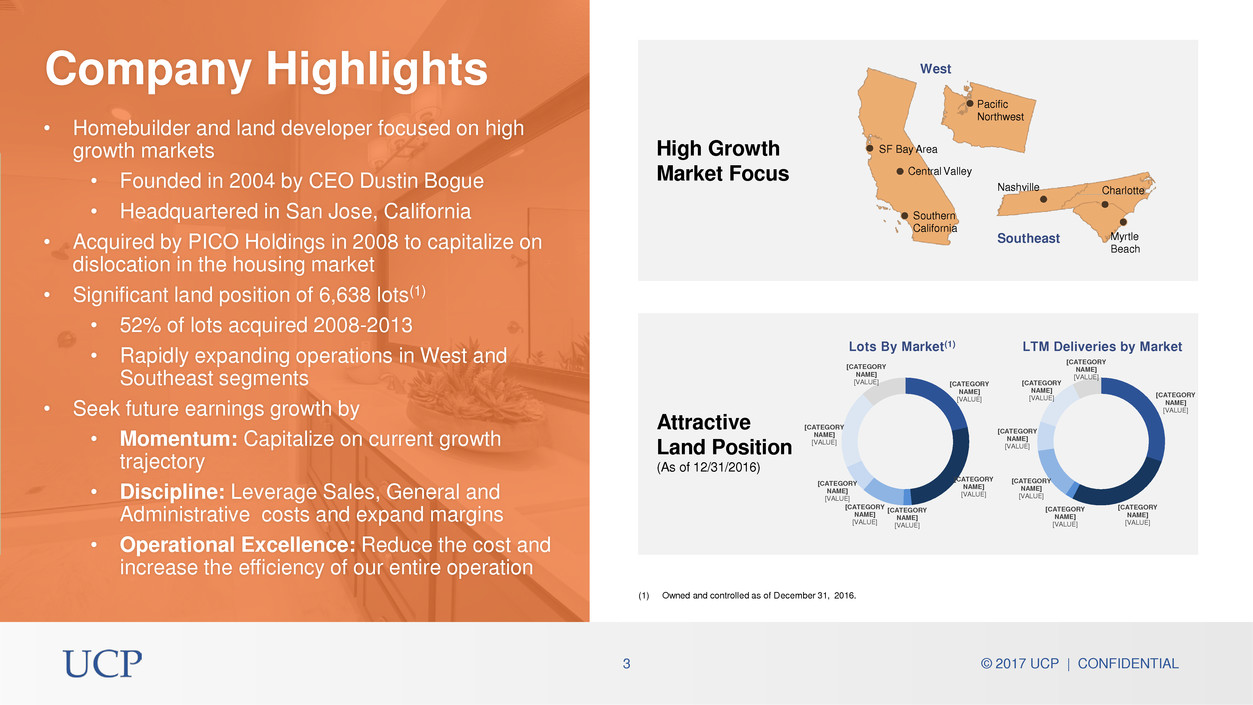
• Homebuilder and land developer focused on high growth markets • Founded in 2004 by CEO Dustin Bogue • Headquartered in San Jose, California • Acquired by PICO Holdings in 2008 to capitalize on dislocation in the housing market • Significant land position of 6,638 lots(1) • 52% of lots acquired 2008-2013 • Rapidly expanding operations in West and Southeast segments • Seek future earnings growth by • Momentum: Capitalize on current growth trajectory • Discipline: Leverage Sales, General and Administrative costs and expand margins • Operational Excellence: Reduce the cost and increase the efficiency of our entire operation (1) Owned and controlled as of December 31, 2016. Company Highlights 3 © 2017 UCP | CONFIDENTIAL High Growth Market Focus West Southeast SF Bay Area Central Valley Southern California Nashville Charlotte Myrtle Beach Pacific Northwest Attractive Land Position (As of 12/31/2016) [CATEGORY NAME] [VALUE] [CATEGORY NAME] [VALUE] [CATEGORY NAME] [VALUE] [CATEGORY NAME] [VALUE] [CATEGORY NAME] [VALUE] [CATEGORY NAME] [VALUE] [CATEGORY NAME] [VALUE] Lots By Market(1) [CATEGORY NAME] [VALUE] [CATEGORY NAME] [VALUE] [CATEGORY NAME] [VALUE] [CATEGORY NAME] [VALUE] [CATEGORY NAME] [VALUE] [CATEGORY NAME] [VALUE] [CATEGORY NAME] [VALUE] LTM Deliveries by Market
© 2017 UCP | CONFIDENTIAL 4 2017 Focus Areas Momentum Discipline Operational Excellence Strengthening the Benchmark Brand
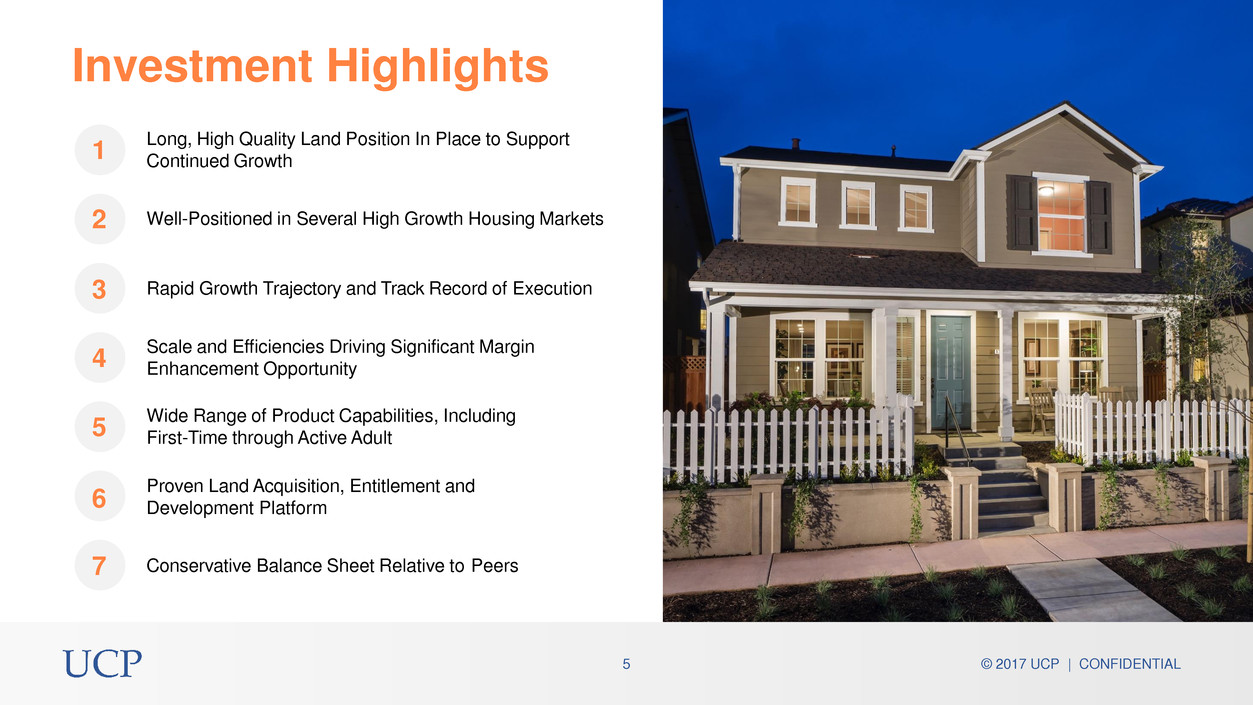
© 2017 UCP | CONFIDENTIAL 5 5 Well-Positioned in Several High Growth Housing Markets Long, High Quality Land Position In Place to Support Continued Growth Rapid Growth Trajectory and Track Record of Execution Wide Range of Product Capabilities, Including First-Time through Active Adult Proven Land Acquisition, Entitlement and Development Platform Conservative Balance Sheet Relative to Peers Scale and Efficiencies Driving Significant Margin Enhancement Opportunity Investment Highlights 1 2 3 4 6 7
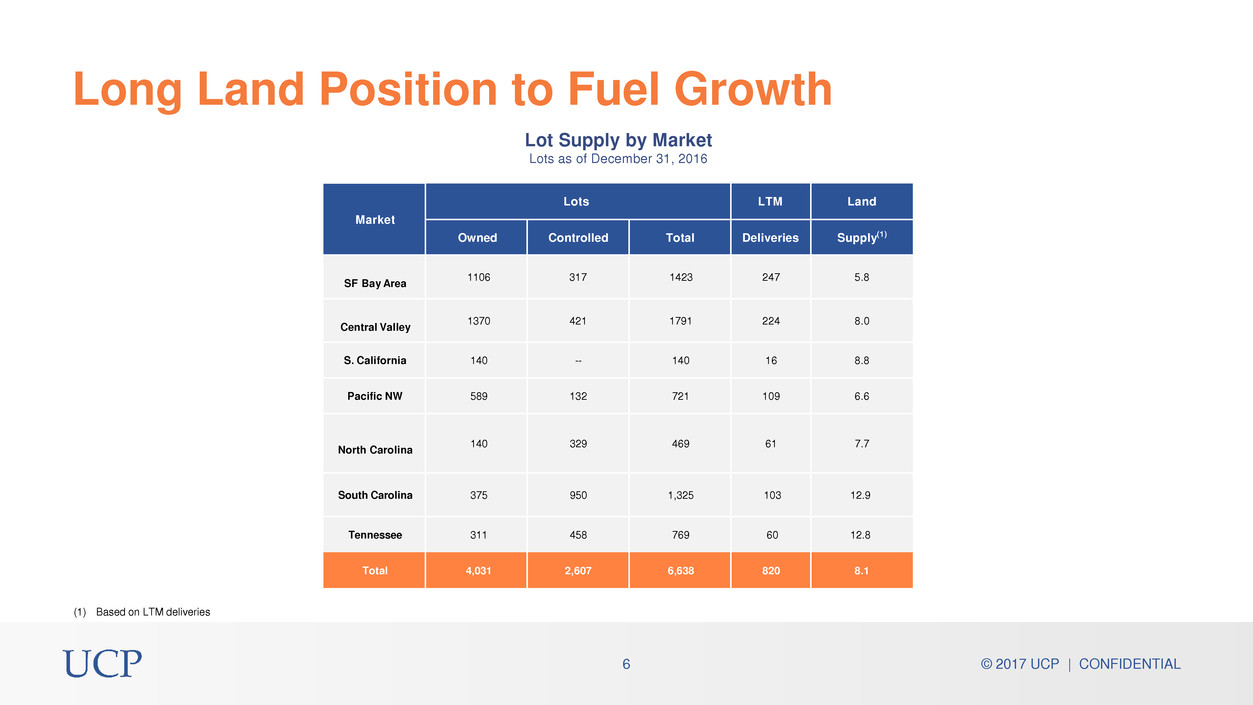
© 2017 UCP | CONFIDENTIAL 6 Long Land Position to Fuel Growth Lot Supply by Market Lots as of December 31, 2016 Market Lots LTM Land Owned Controlled Total Deliveries Supply(1) SF Bay Area 1106 317 1423 247 5.8 Central Valley 1370 421 1791 224 8.0 S. California 140 -- 140 16 8.8 Pacific NW 589 132 721 109 6.6 North Carolina 140 329 469 61 7.7 South Carolina 375 950 1,325 103 12.9 Tennessee 311 458 769 60 12.8 Total 4,031 2,607 6,638 820 8.1 (1) Based on LTM deliveries
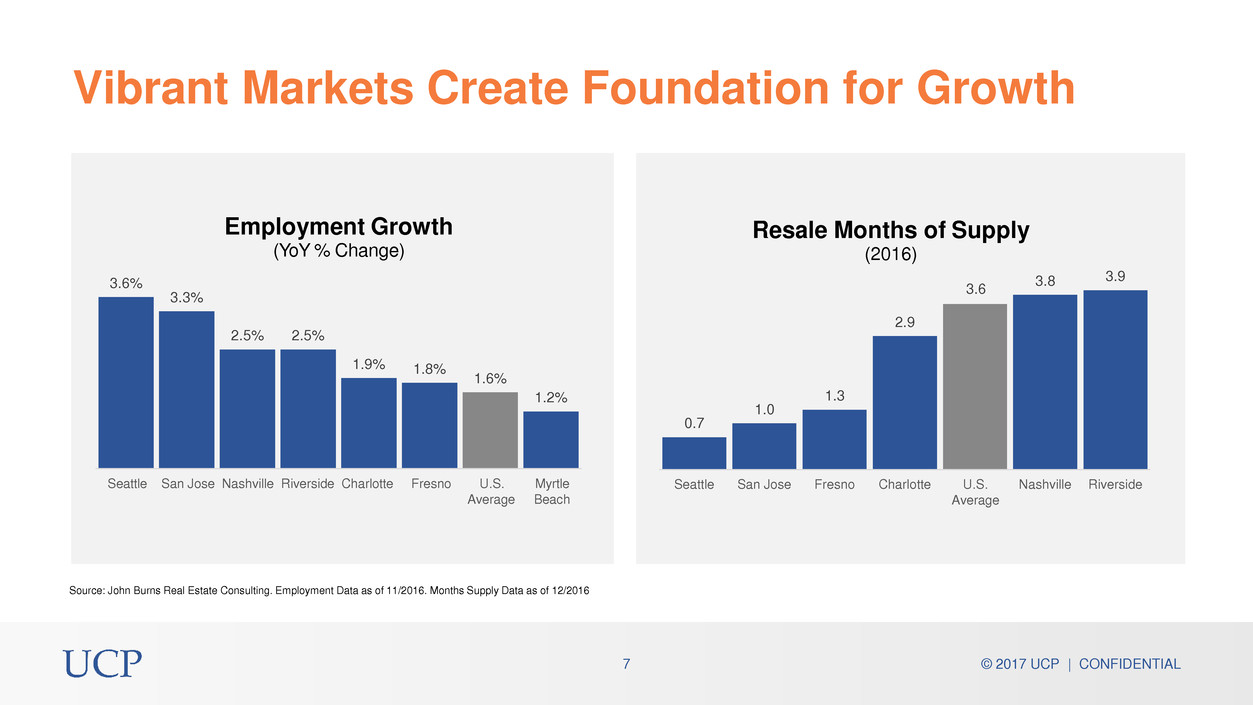
© 2017 UCP | CONFIDENTIAL 7 3.6% 3.3% 2.5% 2.5% 1.9% 1.8% 1.6% 1.2% Seattle San Jose Nashville Riverside Charlotte Fresno U.S. Myrtle Average Beach Employment Growth (YoY % Change) Source: John Burns Real Estate Consulting. Employment Data as of 11/2016. Months Supply Data as of 12/2016 Vibrant Markets Create Foundation for Growth 0.7 1.0 1.3 2.9 3.8 3.9 Seattle San Jose Fresno Charlotte U.S. Average Nashville Riverside Resale Months of Supply (2016) 3.6
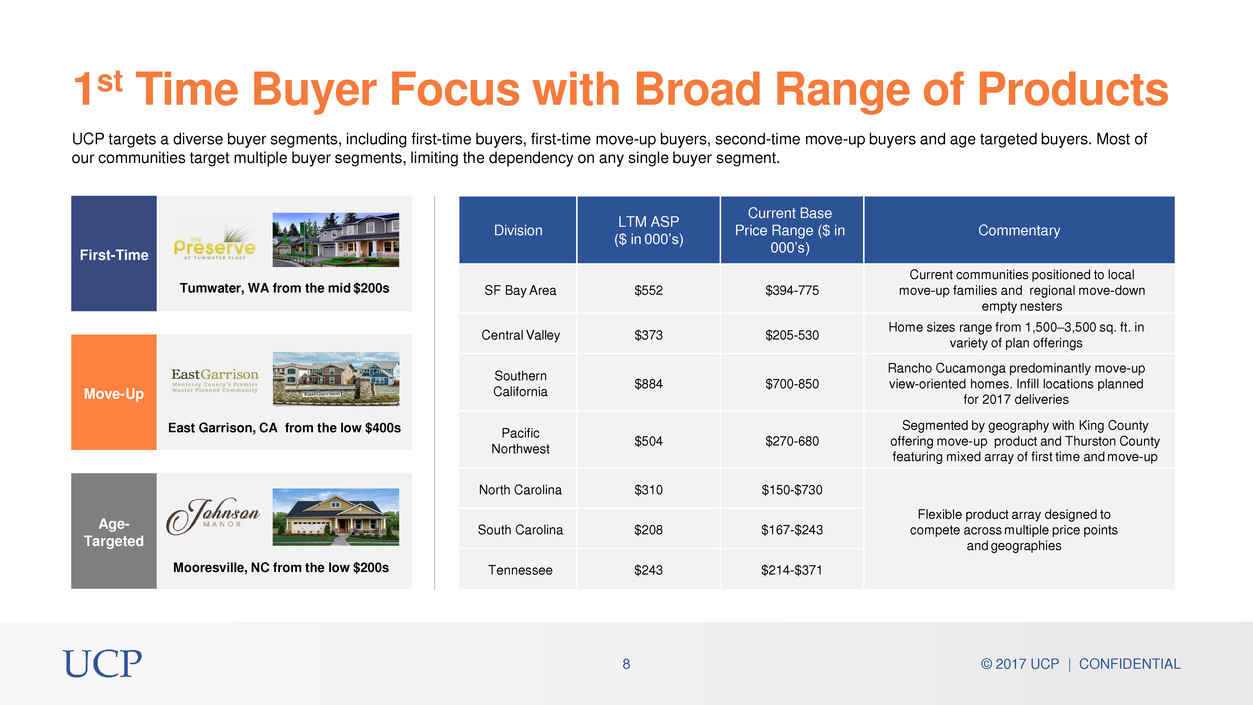
© 2017 UCP | CONFIDENTIAL 8 1st Time Buyer Focus with Broad Range of Products UCP targets a diverse buyer segments, including first-time buyers, first-time move-up buyers, second-time move-up buyers and age targeted buyers. Most of our communities target multiple buyer segments, limiting the dependency on any single buyer segment. First-Time Tumwater, WA from the mid $200s Move-Up East Garrison, CA from the low $400s Age- Targeted Mooresville, NC from the low $200s Division LTM ASP ($ in 000’s) Current Base Price Range ($ in 000’s) Commentary SF Bay Area $552 $394-775 Current communities positioned to local move-up families and regional move-down empty nesters Central Valley $373 $205-530 Home sizes range from 1,500–3,500 sq. ft. in variety of plan offerings Southern California $884 $700-850 Rancho Cucamonga predominantly move-up view-oriented homes. Infill locations planned for 2017 deliveries Pacific Northwest $504 $270-680 Segmented by geography with King County offering move-up product and Thurston County featuring mixed array of first time and move-up North Carolina $310 $150-$730 Flexible product array designed to compete across multiple price points and geographies South Carolina $208 $167-$243 Tennessee $243 $214-$371
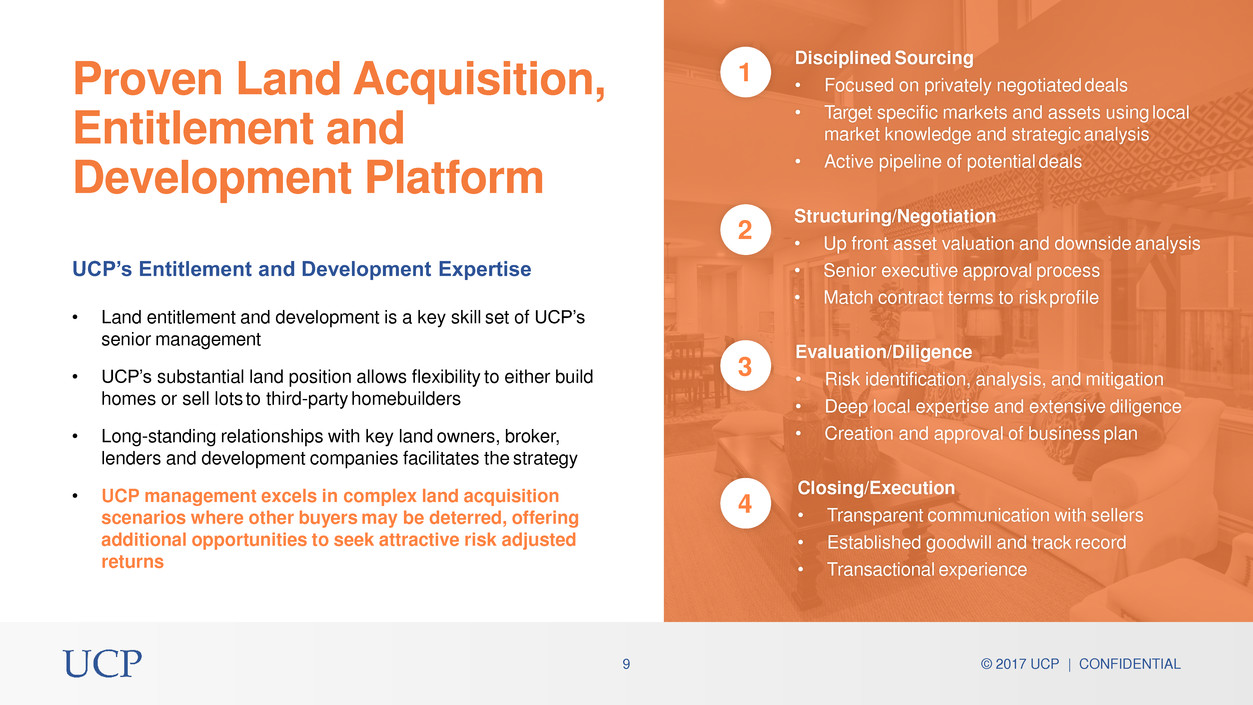
© 2017 UCP | CONFIDENTIAL 9 Proven Land Acquisition, Entitlement and Development Platform UCP’s Entitlement and Development Expertise • Land entitlement and development is a key skill set of UCP’s senior management • UCP’s substantial land position allows flexibility to either build homes or sell lots to third-party homebuilders • Long-standing relationships with key land owners, broker, lenders and development companies facilitates the strategy • UCP management excels in complex land acquisition scenarios where other buyers may be deterred, offering additional opportunities to seek attractive risk adjusted returns 1 Disciplined Sourcing • Focused on privately negotiated deals • Target specific markets and assets using local market knowledge and strategic analysis • Active pipeline of potential deals 2 Structuring/Negotiation • Up front asset valuation and downside analysis • Senior executive approval process • Match contract terms to risk profile 3 Evaluation/Diligence • Risk identification, analysis, and mitigation • Deep local expertise and extensive diligence • Creation and approval of business plan 4 Closing/Execution • Transparent communication with sellers • Established goodwill and track record • Transactional experience
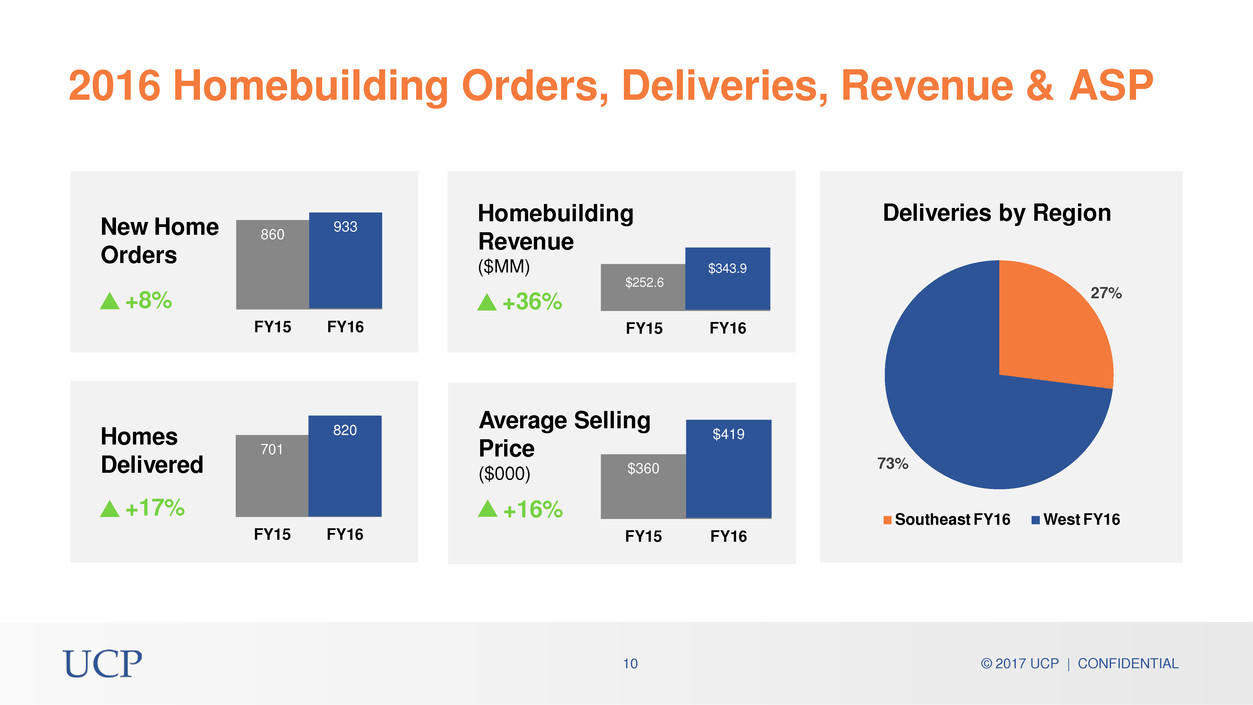
New Home Orders +8% 2016 Homebuilding Orders, Deliveries, Revenue & ASP $343.9 Homebuilding Revenue ($MM) $252.6 +36% FY15 FY16 Deliveries by Region 27% 73% Southeast FY16 West FY16 860 933 FY15 FY16 Homes Delivered +17% 701 820 FY15 FY16 Average Selling Price ($000) +16% $360 10 © 2017 UCP | CONFIDENTIAL $419 FY15 FY16
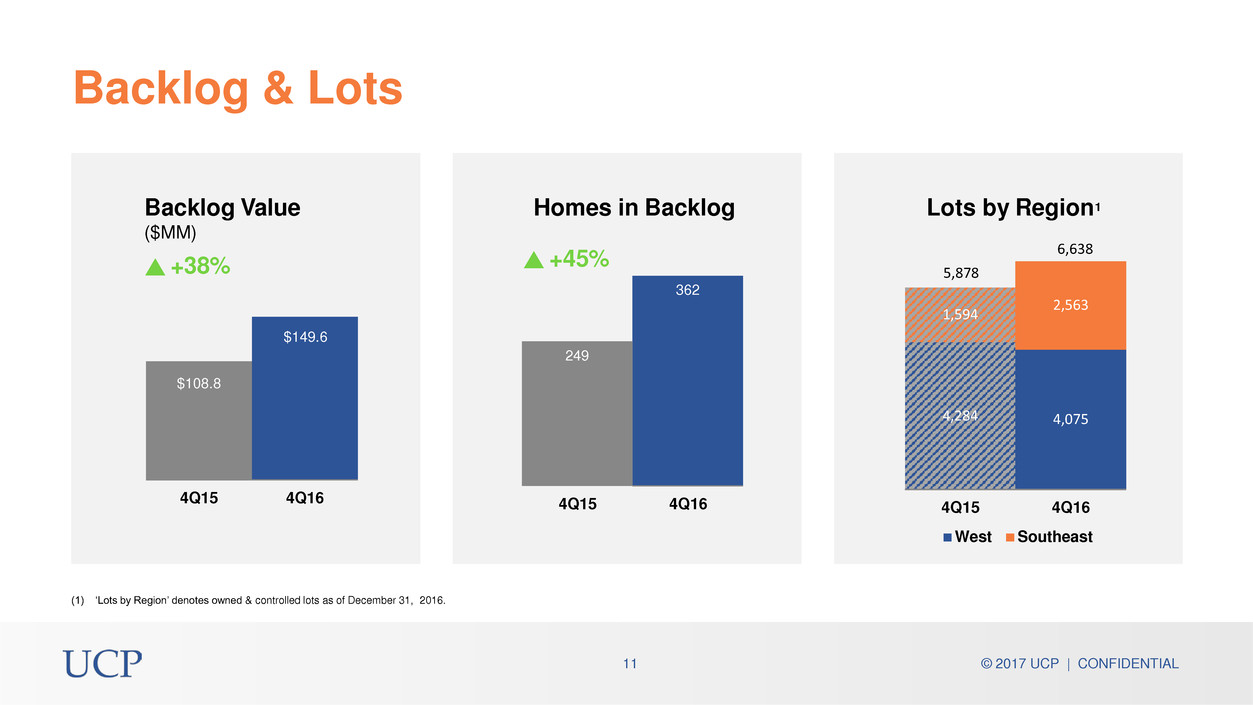
Backlog & Lots 362 249 4Q15 4Q16 Homes in Backlog 4,284 4,075 1,594 2,563 4Q15 4Q16 West Southeast Lots by Region1 6,638 5,878 (1) ‘Lots by Region’ denotes owned & controlled lots as of December 31, 2016. $149.6 $108.8 4Q15 4Q16 Backlog Value ($MM) +38% +45% 11 © 2017 UCP | CONFIDENTIAL
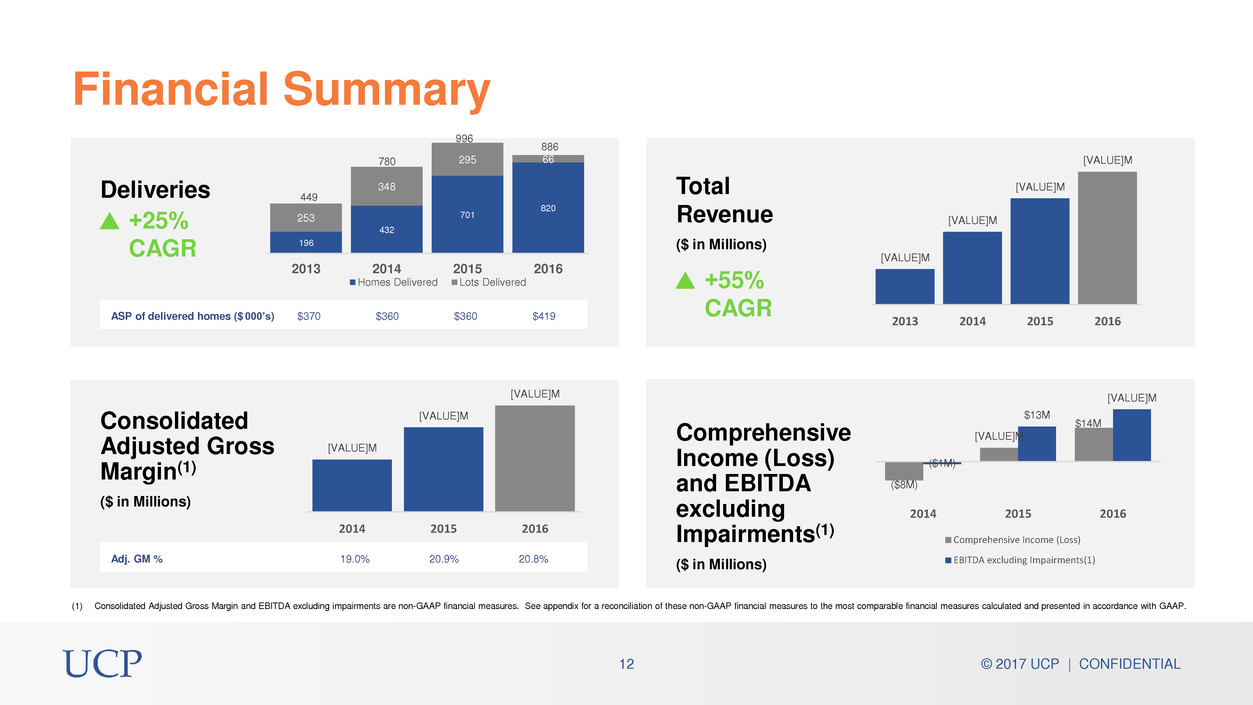
© 2017 UCP | CONFIDENTIAL 12 Financial Summary Deliveries +25% CAGR 196 432 701 820 253 348 295 66 2013 2014 2015 2016 Homes Delivered Lots Delivered ASP of delivered homes ($ 000’s) $370 $360 $360 $419 Consolidated Adjusted Gross Margin(1) ($ in Millions) Adj. GM % 19.0% 20.9% 20.8% (1) Consolidated Adjusted Gross Margin and EBITDA excluding impairments are non-GAAP financial measures. See appendix for a reconciliation of these non-GAAP financial measures to the most comparable financial measures calculated and presented in accordance with GAAP. 449 780 996 886 Total Revenue ($ in Millions) +55% CAGR Comprehensive Income (Loss) and EBITDA excluding Impairments(1) ($ in Millions) [VALUE]M [VALUE]M [VALUE]M [VALUE]M 2013 2014 2015 2016 [VALUE]M [VALUE]M [VALUE]M 2014 2015 2016 ($8M) [VALUE]M $14M ($1M) $13M [VALUE]M 2014 2015 2016 Comprehensive Income (Loss) EBITDA excluding Impairments(1)
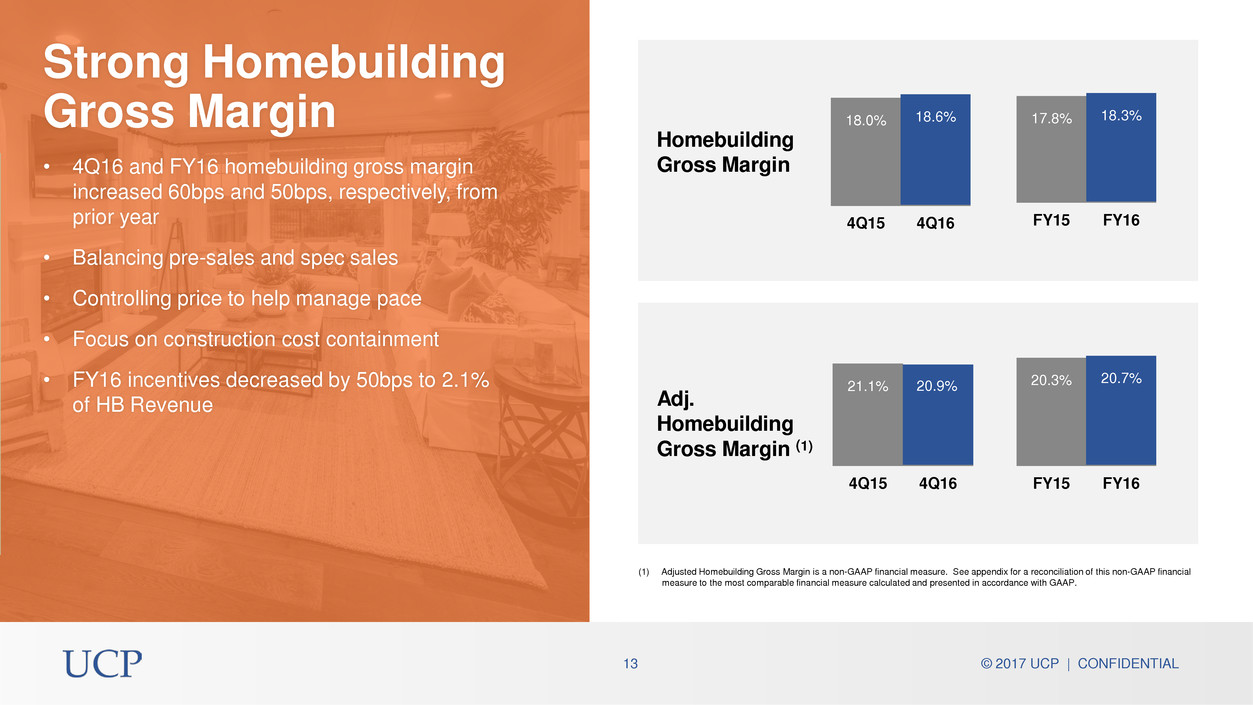
• 4Q16 and FY16 homebuilding gross margin increased 60bps and 50bps, respectively, from prior year • Balancing pre-sales and spec sales • Controlling price to help manage pace • Focus on construction cost containment • FY16 incentives decreased by 50bps to 2.1% of HB Revenue (1) Adjusted Homebuilding Gross Margin is a non-GAAP financial measure. See appendix for a reconciliation of this non-GAAP financial measure to the most comparable financial measure calculated and presented in accordance with GAAP. Strong Homebuilding Gross Margin 18.0% 18.6% 4Q15 4Q16 17.8% 18.3% FY15 FY16 21.1% 4Q15 4Q16 20.3% 13 © 2017 UCP | CONFIDENTIAL 20.7% FY15 FY16 Homebuilding Gross Margin Adj. Homebuilding Gross Margin (1) 20.9%
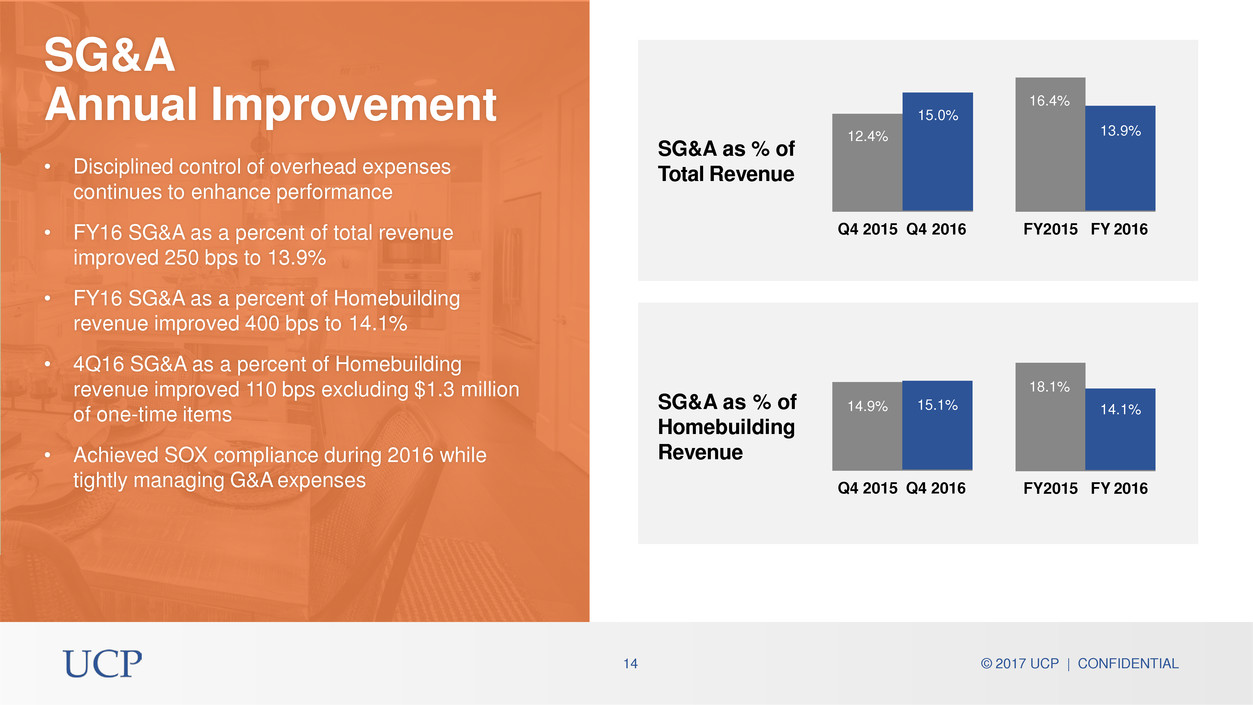
SG&A Annual Improvement SG&A as % of Total Revenue SG&A as % of Homebuilding Revenue 16.4% 13.9% FY2015 FY 2016 18.1% 14.1% FY2015 FY 2016 12.4% 15.0% Q4 2015 Q4 2016 14.9% 14 © 2017 UCP | CONFIDENTIAL 15.1% Q4 2015 Q4 2016 • Disciplined control of overhead expenses continues to enhance performance • FY16 SG&A as a percent of total revenue improved 250 bps to 13.9% • FY16 SG&A as a percent of Homebuilding revenue improved 400 bps to 14.1% • 4Q16 SG&A as a percent of Homebuilding revenue improved 110 bps excluding $1.3 million of one-time items • Achieved SOX compliance during 2016 while tightly managing G&A expenses
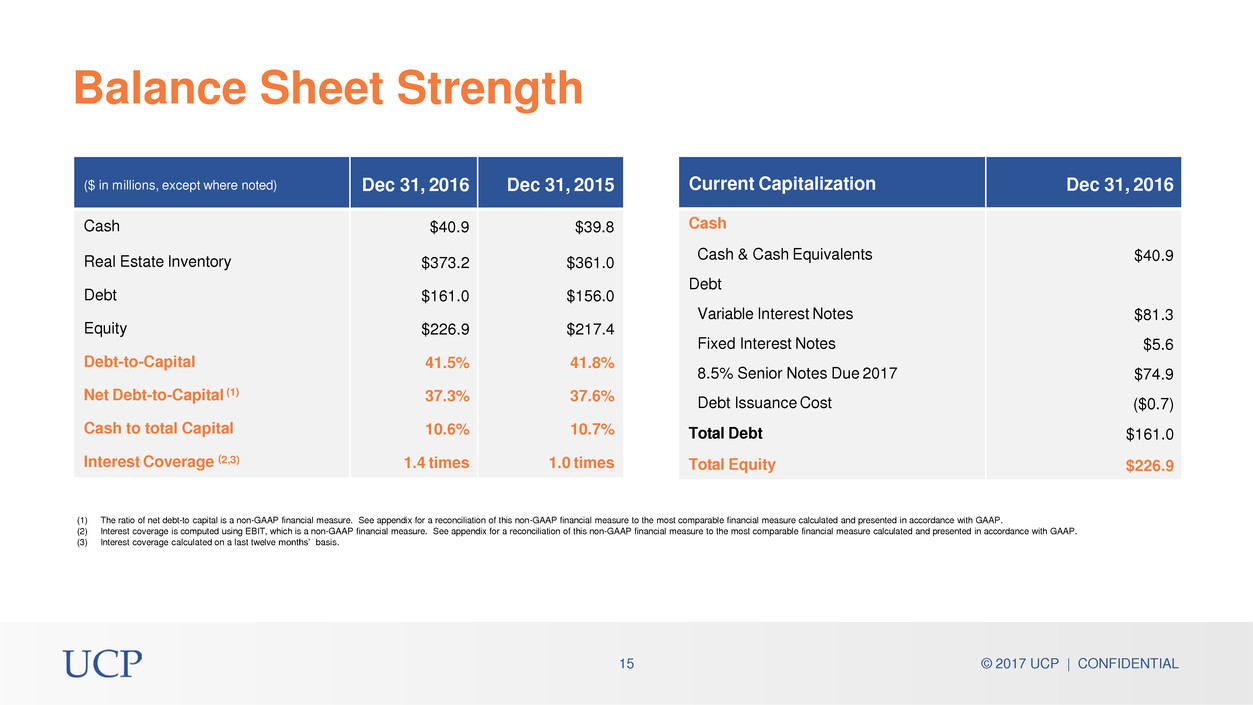
(1) The ratio of net debt-to capital is a non-GAAP financial measure. See appendix for a reconciliation of this non-GAAP financial measure to the most comparable financial measure calculated and presented in accordance with GAAP. (2) Interest coverage is computed using EBIT, which is a non-GAAP financial measure. See appendix for a reconciliation of this non-GAAP financial measure to the most comparable financial measure calculated and presented in accordance with GAAP. (3) Interest coverage calculated on a last twelve months’ basis. 15 © 2017 UCP | CONFIDENTIAL ($ in millions, except where noted) Dec 31, 2016 Dec 31, 2015 Cash $40.9 $39.8 Real Estate Inventory $373.2 $361.0 Debt $161.0 $156.0 Equity $226.9 $217.4 Debt-to-Capital 41.5% 41.8% Net Debt-to-Capital (1) 37.3% 37.6% Cash to total Capital 10.6% 10.7% Interest Coverage (2,3) 1.4 times 1.0 times Balance Sheet Strength Current Capitalization Dec 31, 2016 Cash Cash & Cash Equivalents $40.9 Debt Variable Interest Notes $81.3 Fixed Interest Notes $5.6 8.5% Senior Notes Due 2017 $74.9 Debt Issuance Cost ($0.7) Total Debt $161.0 Total Equity $226.9
Appendix 16 © 2017 UCP | CONFIDENTIAL
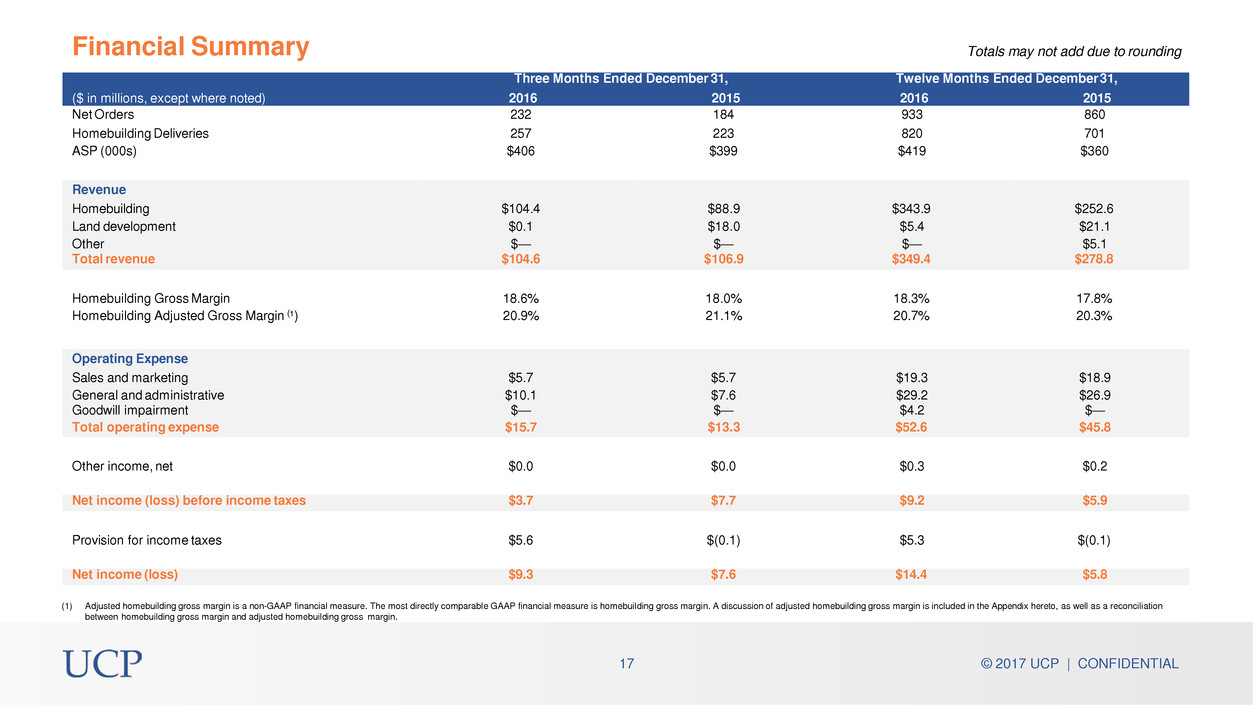
(1) Adjusted homebuilding gross margin is a non-GAAP financial measure. The most directly comparable GAAP financial measure is homebuilding gross margin. A discussion of adjusted homebuilding gross margin is included in the Appendix hereto, as well as a reconciliation between homebuilding gross margin and adjusted homebuilding gross margin. 17 © 2017 UCP | CONFIDENTIAL Three Months Ended December 31, Twelve Months Ended December 31, ($ in millions, except where noted) 2016 2015 2016 2015 Net Orders 232 184 933 860 Homebuilding Deliveries 257 223 820 701 ASP (000s) $406 $399 $419 $360 Revenue Homebuilding $104.4 $88.9 $343.9 $252.6 Land development $0.1 $18.0 $5.4 $21.1 Other $— $— $— $5.1 Total revenue $104.6 $106.9 $349.4 $278.8 Homebuilding Gross Margin 18.6% 18.0% 18.3% 17.8% Homebuilding Adjusted Gross Margin (¹) 20.9% 21.1% 20.7% 20.3% Operating Expense Sales and marketing $5.7 $5.7 $19.3 $18.9 General and administrative $10.1 $7.6 $29.2 $26.9 Goodwill impairment $— $— $4.2 $— Total operating expense $15.7 $13.3 $52.6 $45.8 Other income, net $0.0 $0.0 $0.3 $0.2 Net income (loss) before income taxes $3.7 $7.7 $9.2 $5.9 Provision for income taxes $5.6 $(0.1) $5.3 $(0.1) Net income (loss) $9.3 $7.6 $14.4 $5.8 Totals may not add due to rounding Financial Summary
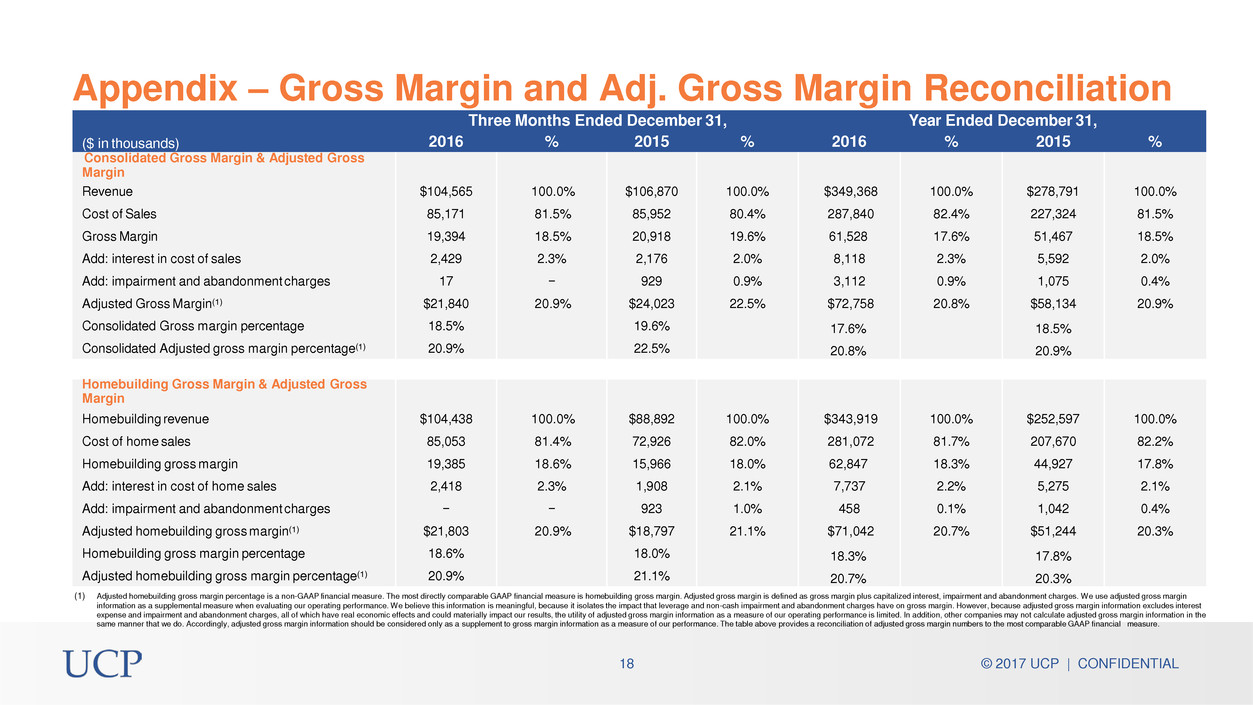
(1) Adjusted homebuilding gross margin percentage is a non-GAAP financial measure. The most directly comparable GAAP financial measure is homebuilding gross margin. Adjusted gross margin is defined as gross margin plus capitalized interest, impairment and abandonment charges. We use adjusted gross margin information as a supplemental measure when evaluating our operating performance. We believe this information is meaningful, because it isolates the impact that leverage and non-cash impairment and abandonment charges have on gross margin. However, because adjusted gross margin information excludes interest expense and impairment and abandonment charges, all of which have real economic effects and could materially impact our results, the utility of adjusted gross margin information as a measure of our operating performance is limited. In addition, other companies may not calculate adjusted gross margin information in the same manner that we do. Accordingly, adjusted gross margin information should be considered only as a supplement to gross margin information as a measure of our performance. The table above provides a reconciliation of adjusted gross margin numbers to the most comparable GAAP financial measure. 18 © 2017 UCP | CONFIDENTIAL Three Months Ended December 31, Year Ended December 31, ($ in thousands) 2016 % 2015 % 2016 % 2015 % Consolidated Gross Margin & Adjusted Gross Margin Revenue $104,565 100.0% $106,870 100.0% $349,368 100.0% $278,791 100.0% Cost of Sales 85,171 81.5% 85,952 80.4% 287,840 82.4% 227,324 81.5% Gross Margin 19,394 18.5% 20,918 19.6% 61,528 17.6% 51,467 18.5% Add: interest in cost of sales 2,429 2.3% 2,176 2.0% 8,118 2.3% 5,592 2.0% Add: impairment and abandonment charges 17 − 929 0.9% 3,112 0.9% 1,075 0.4% Adjusted Gross Margin(1) $21,840 20.9% $24,023 22.5% $72,758 20.8% $58,134 20.9% Consolidated Gross margin percentage 18.5% 19.6% 17.6% 18.5% Consolidated Adjusted gross margin percentage(1) 20.9% 22.5% 20.8% 20.9% Homebuilding Gross Margin & Adjusted Gross Margin Homebuilding revenue $104,438 100.0% $88,892 100.0% $343,919 100.0% $252,597 100.0% Cost of home sales 85,053 81.4% 72,926 82.0% 281,072 81.7% 207,670 82.2% Homebuilding gross margin 19,385 18.6% 15,966 18.0% 62,847 18.3% 44,927 17.8% Add: interest in cost of home sales 2,418 2.3% 1,908 2.1% 7,737 2.2% 5,275 2.1% Add: impairment and abandonment charges − − 923 1.0% 458 0.1% 1,042 0.4% Adjusted homebuilding gross margin(1) $21,803 20.9% $18,797 21.1% $71,042 20.7% $51,244 20.3% Homebuilding gross margin percentage 18.6% 18.0% 18.3% 17.8% Adjusted homebuilding gross margin percentage(1) 20.9% 21.1% 20.7% 20.3% Appendix – Gross Margin and Adj. Gross Margin Reconciliation
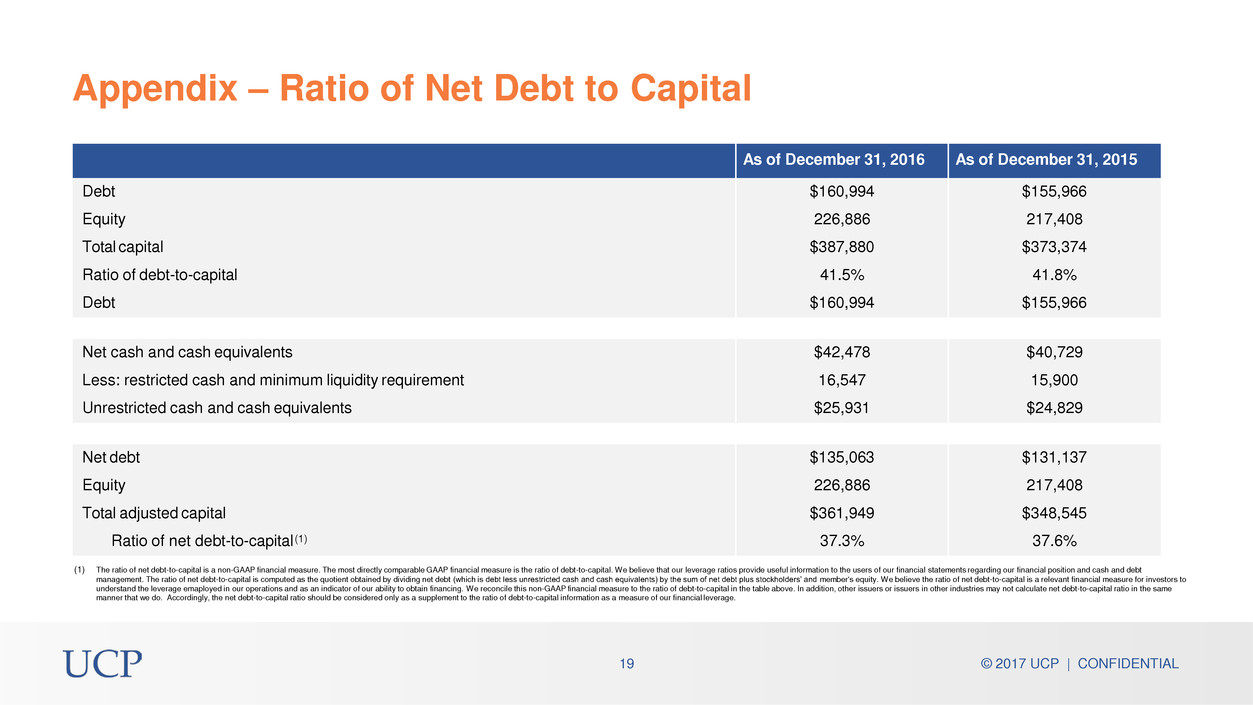
(1) The ratio of net debt-to-capital is a non-GAAP financial measure. The most directly comparable GAAP financial measure is the ratio of debt-to-capital. We believe that our leverage ratios provide useful information to the users of our financial statements regarding our financial position and cash and debt management. The ratio of net debt-to-capital is computed as the quotient obtained by dividing net debt (which is debt less unrestricted cash and cash equivalents) by the sum of net debt plus stockholders’ and member's equity. We believe the ratio of net debt-to-capital is a relevant financial measure for investors to understand the leverage emaployed in our operations and as an indicator of our ability to obtain financing. We reconcile this non-GAAP financial measure to the ratio of debt-to-capital in the table above. In addition, other issuers or issuers in other industries may not calculate net debt-to-capital ratio in the same manner that we do. Accordingly, the net debt-to-capital ratio should be considered only as a supplement to the ratio of debt-to-capital information as a measure of our financial leverage. 19 © 2017 UCP | CONFIDENTIAL As of December 31, 2016 As of December 31, 2015 Debt $160,994 $155,966 Equity 226,886 217,408 Total capital $387,880 $373,374 Ratio of debt-to-capital 41.5% 41.8% Debt $160,994 $155,966 Net cash and cash equivalents $42,478 $40,729 Less: restricted cash and minimum liquidity requirement 16,547 15,900 Unrestricted cash and cash equivalents $25,931 $24,829 Net debt $135,063 $131,137 Equity 226,886 217,408 Total adjusted capital $361,949 $348,545 Ratio of net debt-to-capital (1) 37.3% 37.6% Appendix – Ratio of Net Debt to Capital

(1) EBIT (“earnings before interest & tax”) is a non-GAAP financial measure. The most directly comparable GAAP financial measure is net income before taxes. EBIT is computed from GAAP pre-taxable income by adding back interest expense. We believe that EBIT provides useful information to the users of our financial statements regarding our operating profitability. We reconcile this non-GAAP financial measure to net income before taxes, based on the last twelve months, in the table above. In addition, other issuers or issuers in other industries may not calculate EBIT in the same manner that we do. Accordingly, EBIT should be considered only as a supplement to the net income before taxes as a measure of our operating profitability. (2) Interest coverage is computed using EBIT, a non-GAAP financial measure. The interest coverage ratio is calculated by comparing EBIT to interest expensed. We believe that interest coverage ratio is a relevant financial measure for investors to understand our debt and profitability of our operations and as an indicator of our ability to pay interest on our debt. 20 © 2017 UCP | CONFIDENTIAL UCP Interest Coverage Twelve Months Ended Twelve Months Ended 12/31/2015 12/31/2016 Pre-Tax Income $5,852,371 $9,163,055 Interest Expense included in COS 5,592,089 8,117,453 EBIT(1) 11,444,460 17,280,508 Depreciation 587,581 597,051 Amortization 34,000 34,000 EBITDA 12,066,041 17,911,559 Impairments (net of contingent consideration) 923,031 4,464,792 EBITDA (excluding Impairments) $12,989,072 $22,376,321 Interest Incurred $11,567,368 $12,502,682 Interest Coverage(2) 1.0 1.4 Appendix – EBIT


