
Filed by Griffin Capital Essential Asset REIT, Inc. (Commission File No. 000-55605) pursuant to Rule 425 under the Securities Act of 1933 and deemed filed pursuant to Rule 14a-12 under the Securities Exchange Act of 1934 Subject Company: Cole Office & Industrial REIT (CCIT II), Inc. (Commission File No. 000-55436) On November 10, 2020, Griffin Capital Essential Asset REIT, Inc. posted on its website the following investor presentation it furnished to the Securities and Exchange Commission on a Current Report on Form 8-K on November 10, 2020.

America’s Blue-Chip Landlord™ Third Quarter 2020 Investor Update

Disclaimer ADDITIONAL INFORMATION ABOUT THE MERGER In connection with the proposed merger, GCEAR intends to file a registration statement on Form S-4 with the SEC that will include a proxy statement of CCIT II and will also constitute a prospectus of GCEAR. This communication is not a substitute for the registration statement, the proxy statement/prospectus or any other documents that will be made available to the stockholders of CCIT II. In connection with the proposed merger, GCEAR and CCIT II also plan to file relevant materials with the SEC. STOCKHOLDERS OF CCIT II ARE URGED TO READ ALL RELEVANT DOCUMENTS FILED WITH THE SEC, INCLUDING THE RELEVANT PROXY STATEMENT/PROSPECTUS, WHEN THEY BECOME AVAILABLE, BECAUSE THEY WILL CONTAIN IMPORTANT INFORMATION ABOUT THE PROPOSED MERGER. A definitive proxy statement/prospectus will be sent to CCIT II’s stockholders. Investors may obtain a copy of the proxy statement/prospectus (if and when it becomes available) and other relevant documents filed by GCEAR and CCIT II free of charge at the SEC’s website, www.sec.gov. Copies of the documents filed by GCEAR with the SEC will be available free of charge on GCEAR’s website at http://www.gcear.com or by contacting GCEAR’s Investor Services at (888) 926-2688, as they become available. Copies of the documents filed by CCIT II with the SEC will be available free of charge on CCIT II’s external advisor’s website, at https://www.cimgroup.com/investment- strategies/individual/for-shareholders, as they become available. PARTICIPANTS IN SOLICITATION RELATING TO THE MERGER CCIT II, GCEAR and their respective directors and executive officers and other members of management and employees, as well as certain affiliates of CIM Group, LLC serving as CCIT II’s external advisor, may be deemed to be participants in the solicitation of proxies from CCIT II stockholders in respect of the proposed merger among GCEAR, CCIT II and their respective subsidiaries. Information regarding the directors, executive officers and external advisor of CCIT II is contained in the Annual Report on Form 10-K for the year ended December 31, 2019 filed with the SEC on March 30, 2020, as amended on April 27, 2020. Information about directors and executive officers of GCEAR is available in the proxy statement for its 2020 annual meeting of stockholders, which was filed with the SEC on April 15, 2020. Other information regarding the participants in the proxy solicitation and a description of their direct and indirect interests, by security holdings or otherwise, will be contained in the proxy statement/prospectus and other relevant materials filed with the SEC regarding the proposed merger when they become available. Stockholders of CCIT II should read the proxy statement/prospectus carefully when it becomes available before making any voting or investment decisions. Investors may obtain free copies of these documents from GCEAR or CCIT II using the sources indicated above. NO OFFER OR SOLICITATION This communication and the information contained herein does not constitute an offer to sell or the solicitation of an offer to buy or sell any securities or a solicitation of a proxy or of any vote or approval, nor shall there be any sale of securities in any jurisdiction in which such offer, solicitation or sale would be unlawful prior to registration or qualification under the securities laws of any such jurisdiction. No offering of securities shall be made except by means of a prospectus meeting the requirements of Section 10 of the Securities Act of 1933, as amended. This communication may be deemed to be solicitation material in respect of the proposed merger. 2
Disclaimer on Forward-Looking Statements This presentation contains statements that constitute forward-looking statements within the meaning of Section 27A of the Securities Act of 1933, as amended, and Section 21E of the Securities Exchange Act of 1934, as amended. Statements can generally be identified as forward-looking because they include words such as “believes,” “anticipates,” “expects,” “would,” “could,” or words of similar meaning. Statements that describe future plans and objectives are also forward-looking statements. These statements are based on management’s current expectations and beliefs and are subject to a number of trends and uncertainties that could cause actual results to differ materially from those described in the forward-looking statements; GCEAR can give no assurance that its expectations will be attained. Factors that could cause actual results to differ materially from GCEAR’s expectations include, but are not limited to, the risk that the merger will not be consummated within the expected time period or at all; the occurrence of any event, change or other circumstance that could give rise to the termination of the merger agreement; the failure to satisfy the conditions to the consummation of the proposed merger, including the approval of the stockholders of CCIT II; statements about the benefits of the proposed merger involving GCEAR and CCIT II and statements that address operating performance, events or developments that GCEAR expects or anticipates will occur in the future, including but not limited to statements regarding anticipated synergies and G&A savings, future financial and operating results, plans, objectives, expectations and intentions, expected sources of financing, anticipated asset dispositions, anticipated leadership and governance, creation of value for stockholders, benefits of the proposed merger to customers, employees, stockholders and other constituents of the Combined Company, the integration of GCEAR and CCIT II, cost savings and the expected timetable for completing the proposed merger, and other non-historical statements; risks related to the disruption of management’s attention from ongoing business operations due to the proposed merger; the availability of suitable investment or disposition opportunities; changes in interest rates; the availability and terms of financing; the impact of the COVID-19 pandemic on the operations and financial condition of each of GCEAR and CCIT II and the real estate industries in which they operate, including with respect to occupancy rates, rent deferrals and the financial condition of their respective tenants; general financial and economic conditions, which may be affected by government responses to the COVID-19 pandemic; market conditions; legislative and regulatory changes that could adversely affect the business of GCEAR or CCIT II; and other factors, including those set forth in the section entitled “Risk Factors” in GCEAR’s and CCIT II’s most recent Annual Reports on Form 10-K, as amended, and Quarterly Reports on Form 10-Q filed with the SEC, and other reports filed by GCEAR and CCIT II with the SEC, copies of which are available on the SEC’s website, www.sec.gov. Forward-looking statements are not guarantees of performance or results and speak only as of the date such statements are made. Except as required by law, neither GCEAR nor CCIT II undertakes any obligation to update or revise any forward-looking statement in this communication, whether to reflect new information, future events, changes in assumptions or circumstances or otherwise. 3
Table of Contents PAGE Third Quarter 2020 Highlights 5 Portfolio Update 7 Financial Performance Review 14 4

Third Quarter 2020 Highlights RESTORATION HARDWARE Patterson, CA
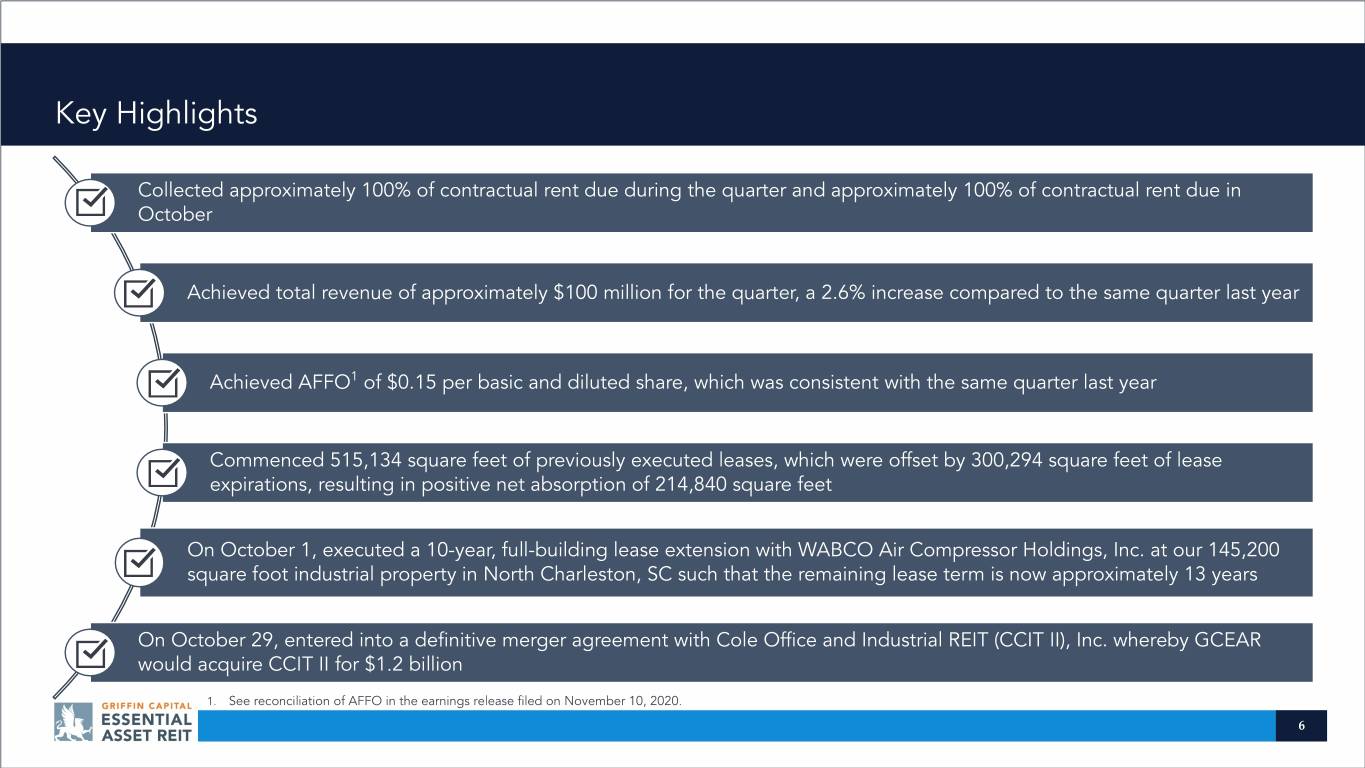
Key Highlights Collected approximately 100% of contractual rent due during the quarter and approximately 100% of contractual rent due in October Achieved total revenue of approximately $100 million for the quarter, a 2.6% increase compared to the same quarter last year Achieved AFFO1 of $0.15 per basic and diluted share, which was consistent with the same quarter last year Commenced 515,134 square feet of previously executed leases, which were offset by 300,294 square feet of lease expirations, resulting in positive net absorption of 214,840 square feet On October 1, executed a 10-year, full-building lease extension with WABCO Air Compressor Holdings, Inc. at our 145,200 square foot industrial property in North Charleston, SC such that the remaining lease term is now approximately 13 years On October 29, entered into a definitive merger agreement with Cole Office and Industrial REIT (CCIT II), Inc. whereby GCEAR would acquire CCIT II for $1.2 billion 1. See reconciliation of AFFO in the earnings release filed on November 10, 2020. 6

Portfolio Update NETGEAR San Jose, CA
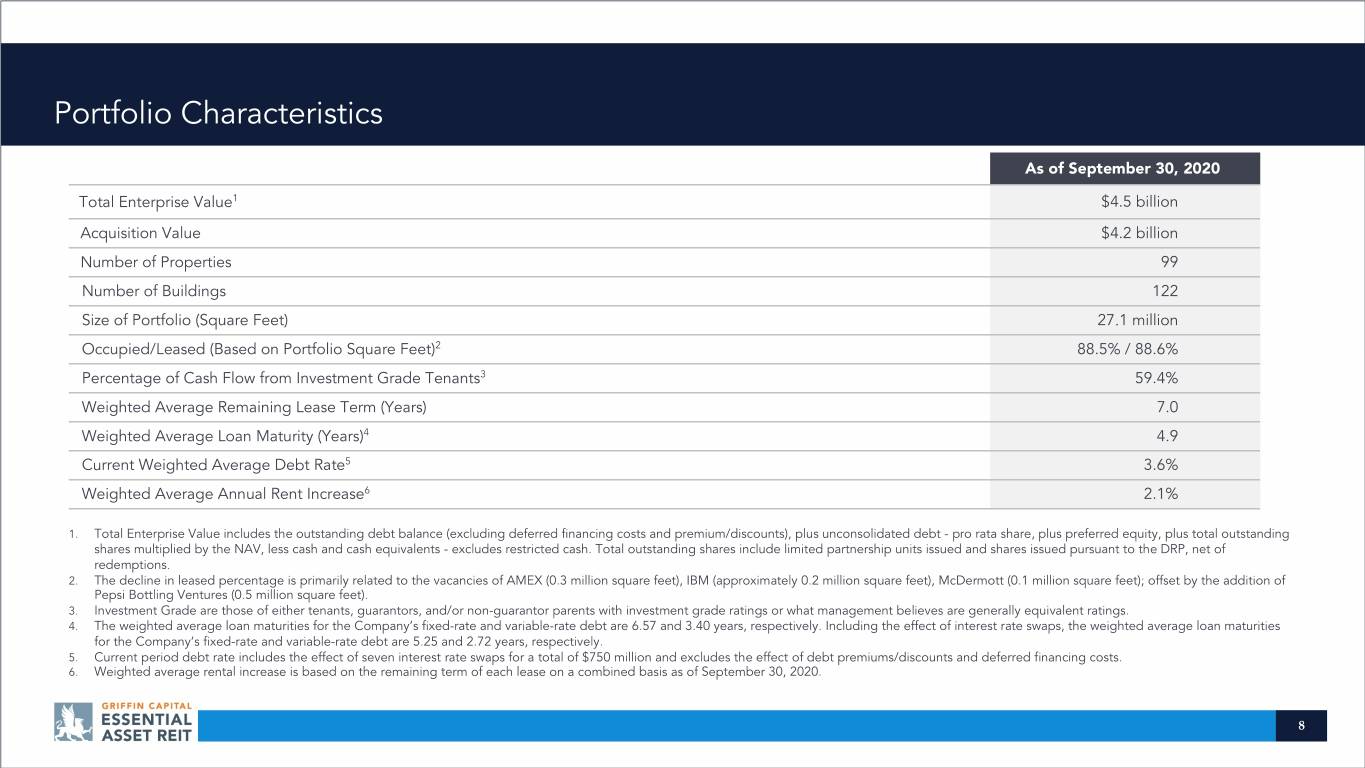
Portfolio Characteristics As of September 30, 2020 Total Enterprise Value1 $4.5 billion Acquisition Value $4.2 billion Number of Properties 99 Number of Buildings 122 Size of Portfolio (Square Feet) 27.1 million Occupied/Leased (Based on Portfolio Square Feet)2 88.5% / 88.6% Percentage of Cash Flow from Investment Grade Tenants3 59.4% Weighted Average Remaining Lease Term (Years) 7.0 Weighted Average Loan Maturity (Years)4 4.9 Current Weighted Average Debt Rate5 3.6% Weighted Average Annual Rent Increase6 2.1% 1. Total Enterprise Value includes the outstanding debt balance (excluding deferred financing costs and premium/discounts), plus unconsolidated debt - pro rata share, plus preferred equity, plus total outstanding shares multiplied by the NAV, less cash and cash equivalents - excludes restricted cash. Total outstanding shares include limited partnership units issued and shares issued pursuant to the DRP, net of redemptions. 2. The decline in leased percentage is primarily related to the vacancies of AMEX (0.3 million square feet), IBM (approximately 0.2 million square feet), McDermott (0.1 million square feet); offset by the addition of Pepsi Bottling Ventures (0.5 million square feet). 3. Investment Grade are those of either tenants, guarantors, and/or non-guarantor parents with investment grade ratings or what management believes are generally equivalent ratings. 4. The weighted average loan maturities for the Company’s fixed-rate and variable-rate debt are 6.57 and 3.40 years, respectively. Including the effect of interest rate swaps, the weighted average loan maturities for the Company’s fixed-rate and variable-rate debt are 5.25 and 2.72 years, respectively. 5. Current period debt rate includes the effect of seven interest rate swaps for a total of $750 million and excludes the effect of debt premiums/discounts and deferred financing costs. 6. Weighted average rental increase is based on the remaining term of each lease on a combined basis as of September 30, 2020. 8
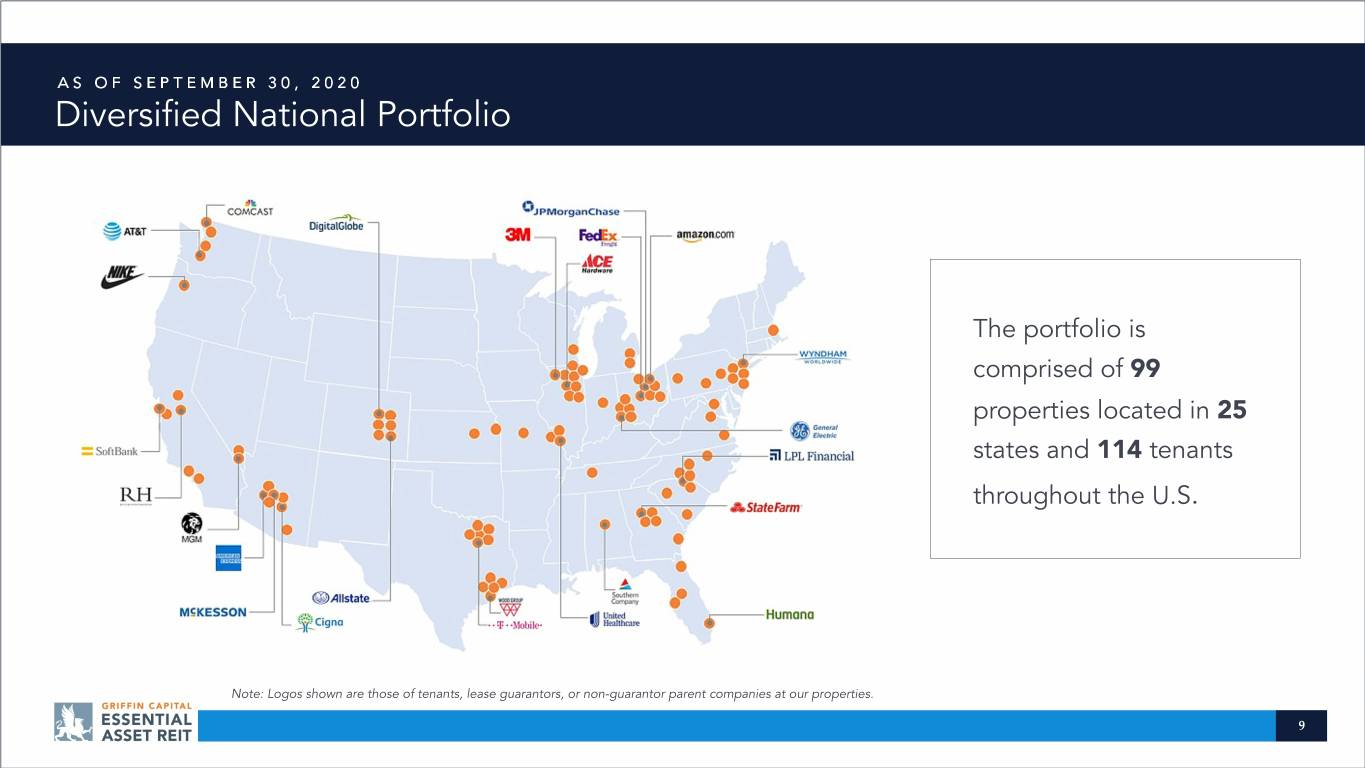
AS OF SEPTEMBER 30, 2020 Diversified National Portfolio The portfolio is comprised of 99 properties located in 25 states and 114 tenants throughout the U.S. Note: Logos shown are those of tenants, lease guarantors, or non-guarantor parent companies at our properties. 9

AS OF SEPTEMBER 30, 2020 Portfolio Concentration Tenant Business Diversity 1 (By % of Net Rent) Our management makes a conscious effort to achieve 2 Capital Goods, 13.7% diversification by tenant industry Retailing, 9.9% Health Care Equipment & Services, 9.5% as our portfolio grows. As of Insurance, 8.9% September 30, 2020, our analysis Consumer Services, 7.8% Telecommunication Services, 6.7% segmented the REIT’s portfolio Diversified Financials, 6.5% into 22 industry groups.1 Technology Hardware & Equipment, 5.7% Consumer Durables & Apparel, 5.1% Energy, 5.1% 3 All Others, 21.1% 1. Industry classification based on the Global Industry Classification Standards (GICS). 2. Capital goods includes the following industry sub-groups: Aerospace & Defense (5.8%); Industrial Conglomerates (4.6%); Construction & Engineering (1.3%); Electrical Components & Equipment (0.9%); Industrial Machinery (0.5%); Construction Machinery & Heavy Trucks (0.4%); Building Products (0.2%). 3. All others consists of revenue concentration by industry equal to or less than 4.1%, as follows: Software & Services (4.1%); Utilities (4.0%); Banks (3.2%); Materials (2.3%); Commercial & Professional Services (2.0%); Food, Beverage & Tobacco (1.7%); Media (1.5%); Pharmaceuticals, Biotechnology & Life Sciences (1.0%); Automobiles & Components (0.7%); Transportation (0.6%). 10

AS OF SEPTEMBER 30, 2020 Portfolio Concentration (cont’d) Geographic Distribution Asset Allocation (By % of Net Rent) (By % of Net Rent) Texas 11.7% All Others1 24.4% California 10.1% Office 83.4% Florida 3.7% Ohio 8.9% North Carolina 4.6% Industrial/ Manufacturing/ Flex Colorado Arizona 16.6% 5.0% 8.8% New Jersey 6.3% Georgia Illinois 8.7% 7.8% 1. All others account for less than 3.5% of total net rent for the 12-month period subsequent to September 30, 2020 on an individual basis. 11
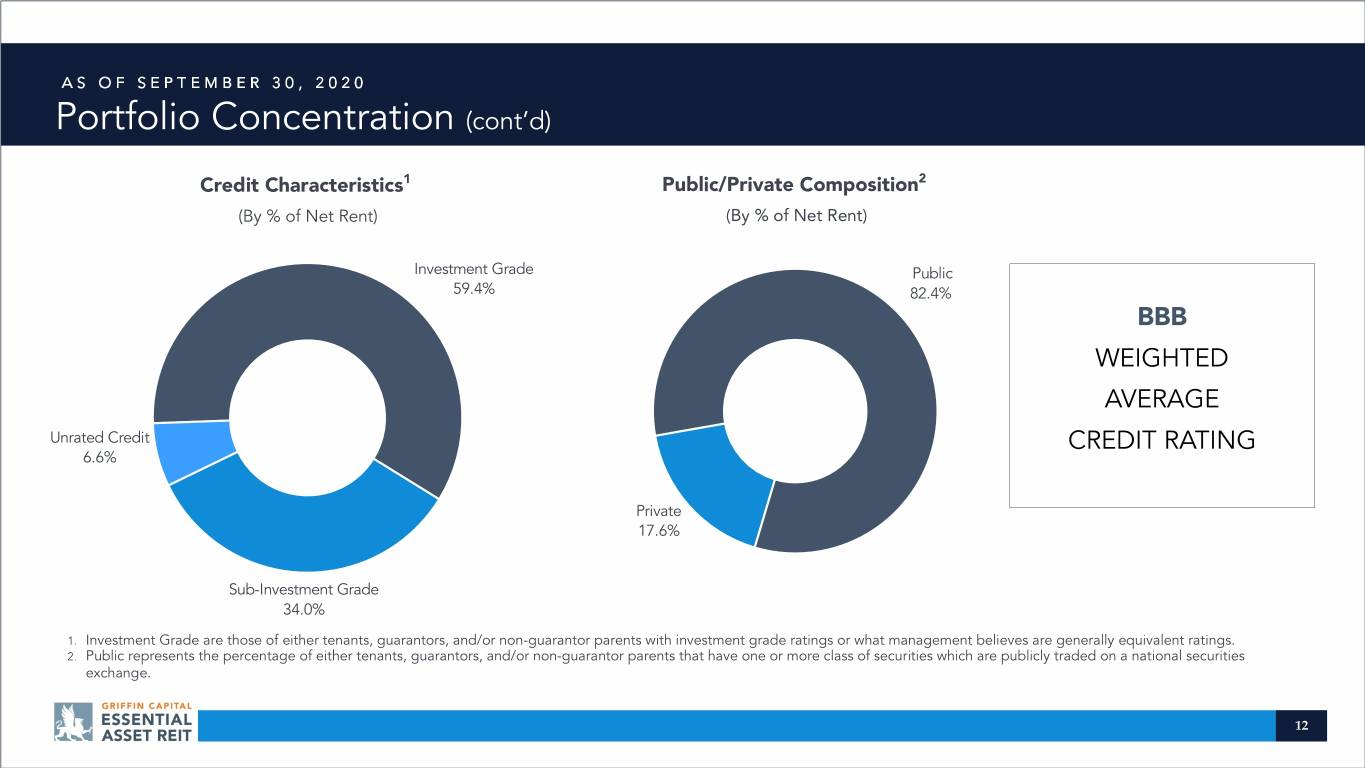
AS OF SEPTEMBER 30, 2020 Portfolio Concentration (cont’d) Credit Characteristics1 Public/Private Composition2 (By % of Net Rent) (By % of Net Rent) Investment Grade Public 59.4% 82.4% BBB WEIGHTED AVERAGE Unrated Credit CREDIT RATING 6.6% Private 17.6% Sub-Investment Grade 34.0% 1. Investment Grade are those of either tenants, guarantors, and/or non-guarantor parents with investment grade ratings or what management believes are generally equivalent ratings. 2. Public represents the percentage of either tenants, guarantors, and/or non-guarantor parents that have one or more class of securities which are publicly traded on a national securities exchange. 12

Strong Tenant Profile: Top 10 Tenants As of 9/30/20 As of 6/30/20 Top Tenants % of Portfolio1 Ratings2 Ratings2 3 1. Based on net rental payment 12-month period 3.5% BBB+ BBB+ subsequent to September 30, 2020. 2. Represents S&P ratings of tenants, guarantors, 3.4% 4 5 or non-guarantor parent entities, unless BB+ B+ otherwise noted. 3. Represents the combined net rental revenue for 3.1% A- A- the Atlanta, GA; West Chester, OH; and Houston, TX properties. 4. Represents what management believes to be 3.0% BBB+ BBB+ the equivalent of what would have been issued by S&P as derived from an HY1 rating issued by Bloomberg. 2.9% BB+ BB+ 5. Represents what management believes to be the equivalent of what would have been issued 2.5% AA AA by S&P as derived from an HY4 rating issued by Bloomberg. 6. Represents what management believes to be 2.5% B B the equivalent of what would have been issued by S&P as derived from an IG9 rating issued by 6 7 Bloomberg. 2.5% BBB BBB- 7. Represents what management believes to be the equivalent of what would have been issued 2.4% BB- BB+8 by S&P as derived from an IG10 rating issued by Bloomberg. 8. Represents what management believes to be 2.3% BB+ BB+ the equivalent of what would have been issued by S&P as derived from an BB+ rating issued by Egan-Jones. TOTAL 28.1% 13
Financial Performance Review WASTE MANAGEMENT Phoenix, AZ
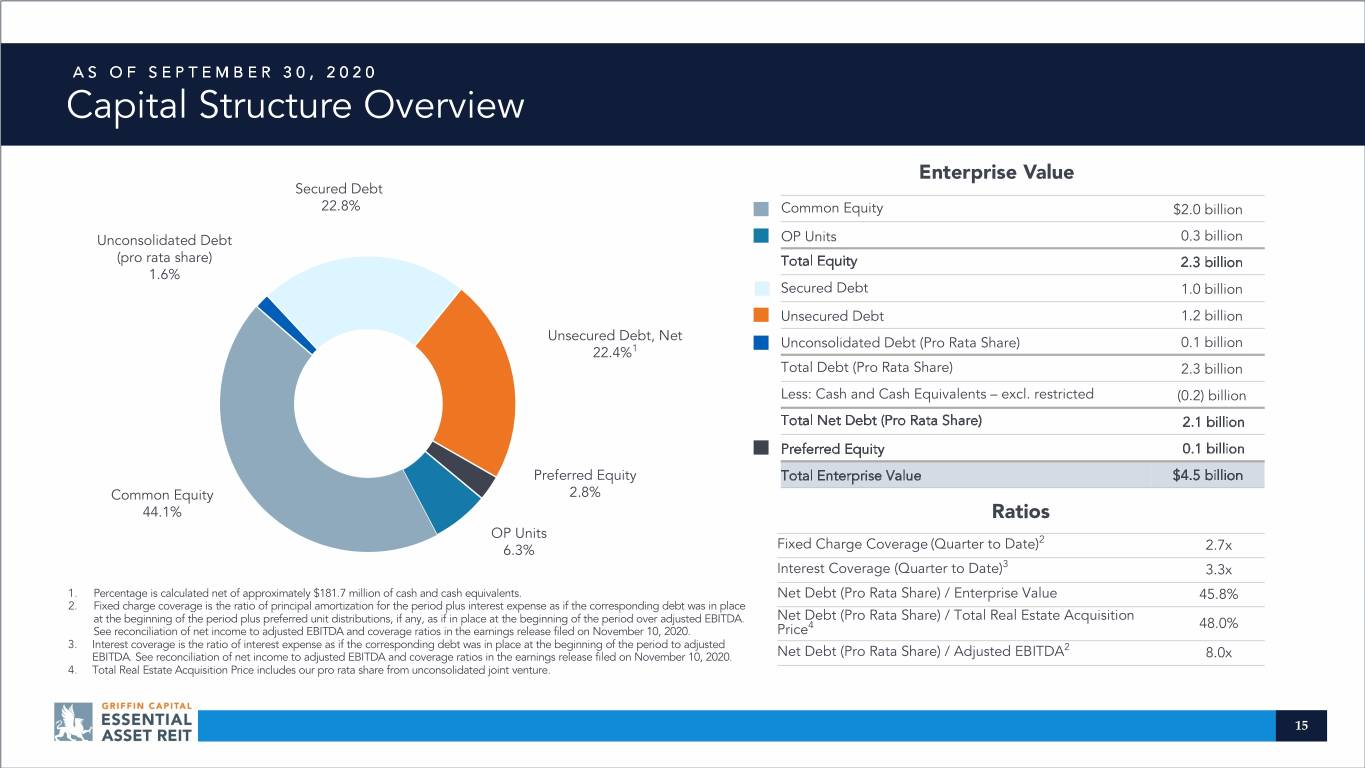
AS OF SEPTEMBER 30, 2020 Capital Structure Overview Enterprise Value Secured Debt 22.8% Common Equity $2.0 billion Unconsolidated Debt OP Units 0.3 billion (pro rata share) Total Equity 2.3 billion 1.6% Secured Debt 1.0 billion Unsecured Debt 1.2 billion Unsecured Debt, Net Unconsolidated Debt (Pro Rata Share) 0.1 billion 22.4%1 Total Debt (Pro Rata Share) 2.3 billion Less: Cash and Cash Equivalents – excl. restricted (0.2) billion Total Net Debt (Pro Rata Share) 2.1 billion Preferred Equity 0.1 billion Preferred Equity Total Enterprise Value $4.5 billion Common Equity 2.8% 44.1% Ratios OP Units 2 6.3% Fixed Charge Coverage (Quarter to Date) 2.7x Interest Coverage (Quarter to Date)3 3.3x 1. Percentage is calculated net of approximately $181.7 million of cash and cash equivalents. Net Debt (Pro Rata Share) / Enterprise Value 45.8% 2. Fixed charge coverage is the ratio of principal amortization for the period plus interest expense as if the corresponding debt was in place at the beginning of the period plus preferred unit distributions, if any, as if in place at the beginning of the period over adjusted EBITDA. Net Debt (Pro Rata Share) / Total Real Estate Acquisition 4 48.0% See reconciliation of net income to adjusted EBITDA and coverage ratios in the earnings release filed on November 10, 2020. Price 3. Interest coverage is the ratio of interest expense as if the corresponding debt was in place at the beginning of the period to adjusted 2 EBITDA. See reconciliation of net income to adjusted EBITDA and coverage ratios in the earnings release filed on November 10, 2020. Net Debt (Pro Rata Share) / Adjusted EBITDA 8.0x 4. Total Real Estate Acquisition Price includes our pro rata share from unconsolidated joint venture. 15
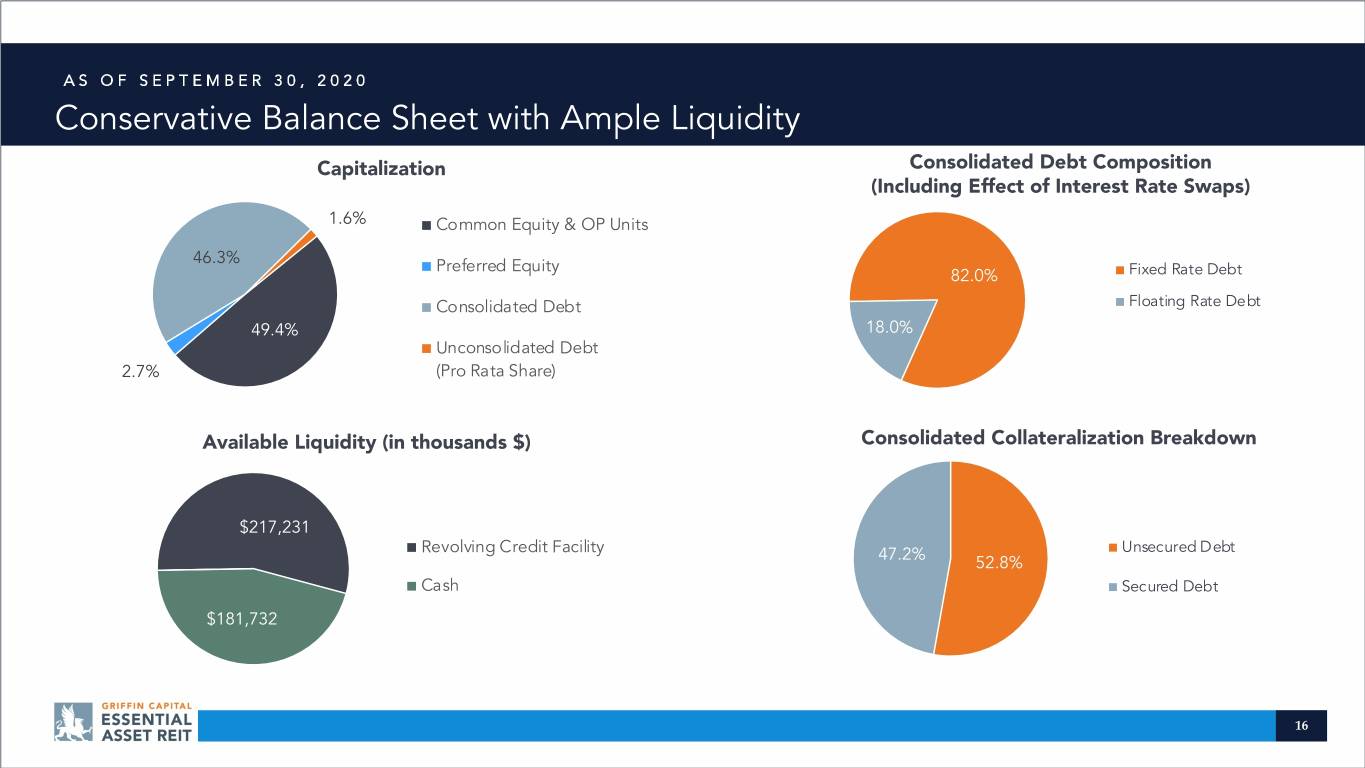
AS OF SEPTEMBER 30, 2020 Conservative Balance Sheet with Ample Liquidity Capitalization Consolidated Debt Composition (Including Effect of Interest Rate Swaps) 1.6% Common Equity & OP Units 46.3% Preferred Equity 82.0% Fixed Rate Debt Consolidated Debt Floating Rate Debt 49.4% 18.0% Unconsolidated Debt 2.7% (Pro Rata Share) Available Liquidity (in thousands $) Consolidated Collateralization Breakdown $217,231 Revolving Credit Facility Unsecured Debt 47.2% 52.8% Cash Secured Debt $181,732 16
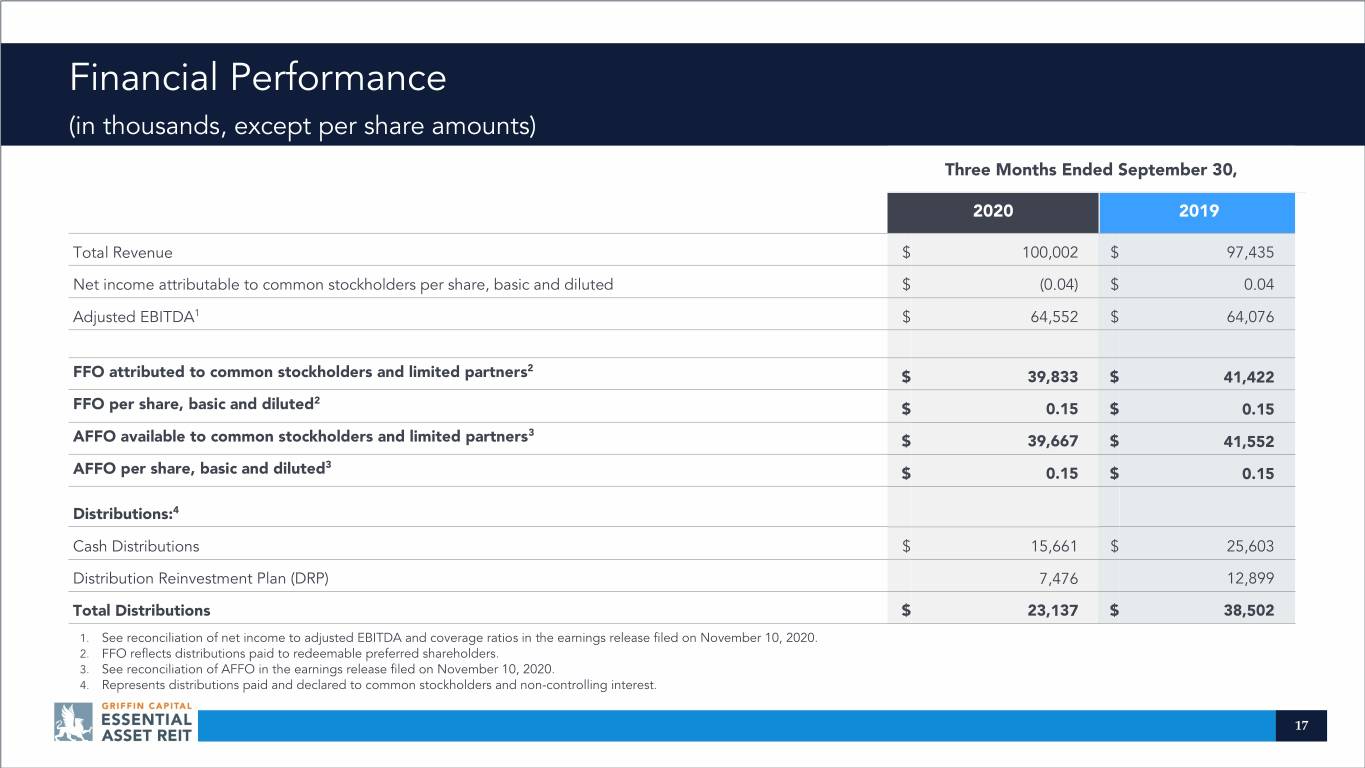
Financial Performance (in thousands, except per share amounts) Three Months Ended September 30, 2020 2019 Total Revenue $ 100,002 $ 97,435 Net income attributable to common stockholders per share, basic and diluted $ (0.04) $ 0.04 Adjusted EBITDA1 $ 64,552 $ 64,076 2 FFO attributed to common stockholders and limited partners $ 39,833 $ 41,422 2 FFO per share, basic and diluted $ 0.15 $ 0.15 3 AFFO available to common stockholders and limited partners $ 39,667 $ 41,552 3 AFFO per share, basic and diluted $ 0.15 $ 0.15 Distributions:4 Cash Distributions $ 15,661 $ 25,603 Distribution Reinvestment Plan (DRP) 7,476 12,899 Total Distributions $ 23,137 $ 38,502 1. See reconciliation of net income to adjusted EBITDA and coverage ratios in the earnings release filed on November 10, 2020. 2. FFO reflects distributions paid to redeemable preferred shareholders. 3. See reconciliation of AFFO in the earnings release filed on November 10, 2020. 4. Represents distributions paid and declared to common stockholders and non-controlling interest. 17
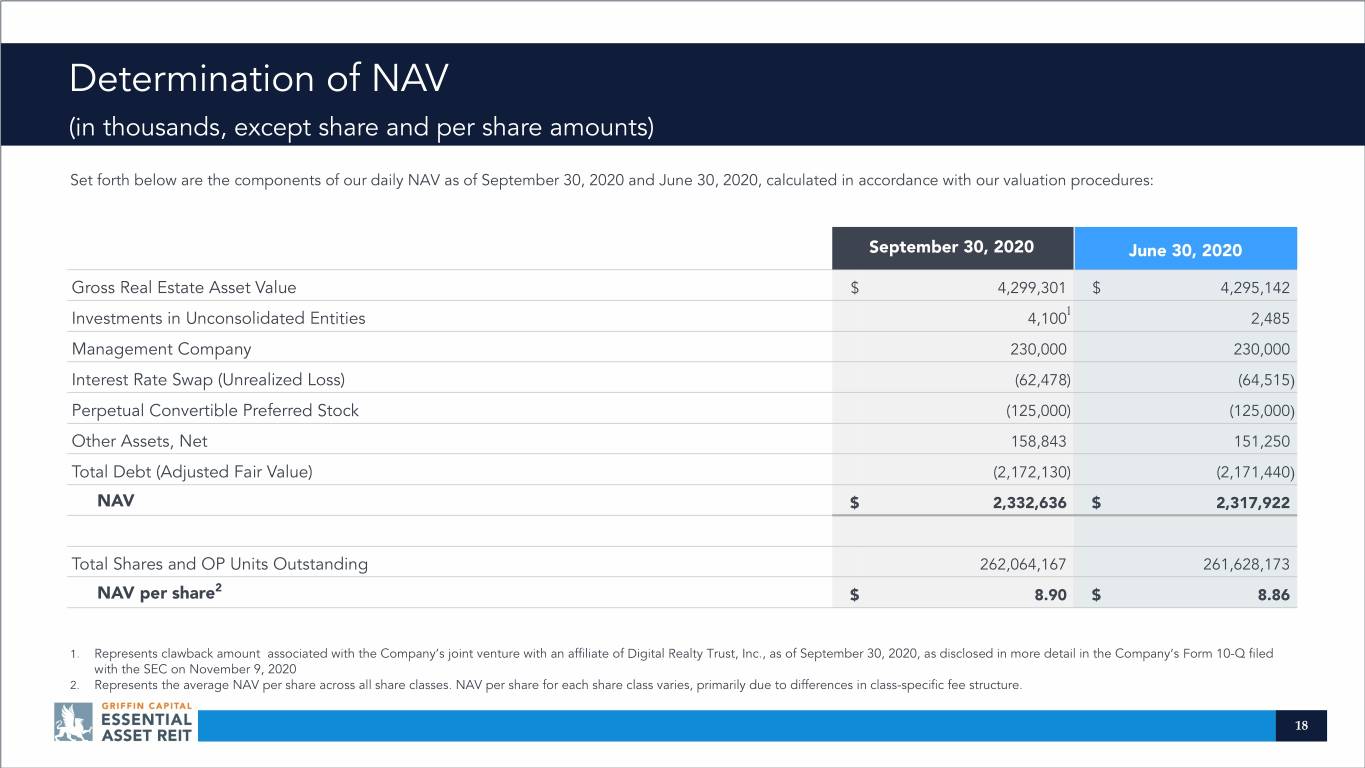
Determination of NAV (in thousands, except share and per share amounts) Set forth below are the components of our daily NAV as of September 30, 2020 and June 30, 2020, calculated in accordance with our valuation procedures: September 30, 2020 June 30, 2020 Gross Real Estate Asset Value $ 4,299,301 $ 4,295,142 1 Investments in Unconsolidated Entities 4,100 2,485 Management Company 230,000 230,000 Interest Rate Swap (Unrealized Loss) (62,478) (64,515) Perpetual Convertible Preferred Stock (125,000) (125,000) Other Assets, Net 158,843 151,250 Total Debt (Adjusted Fair Value) (2,172,130) (2,171,440) NAV $ 2,332,636 $ 2,317,922 Total Shares and OP Units Outstanding 262,064,167 261,628,173 2 NAV per share $ 8.90 $ 8.86 1. Represents clawback amount associated with the Company’s joint venture with an affiliate of Digital Realty Trust, Inc., as of September 30, 2020, as disclosed in more detail in the Company’s Form 10-Q filed with the SEC on November 9, 2020 2. Represents the average NAV per share across all share classes. NAV per share for each share class varies, primarily due to differences in class-specific fee structure. 18
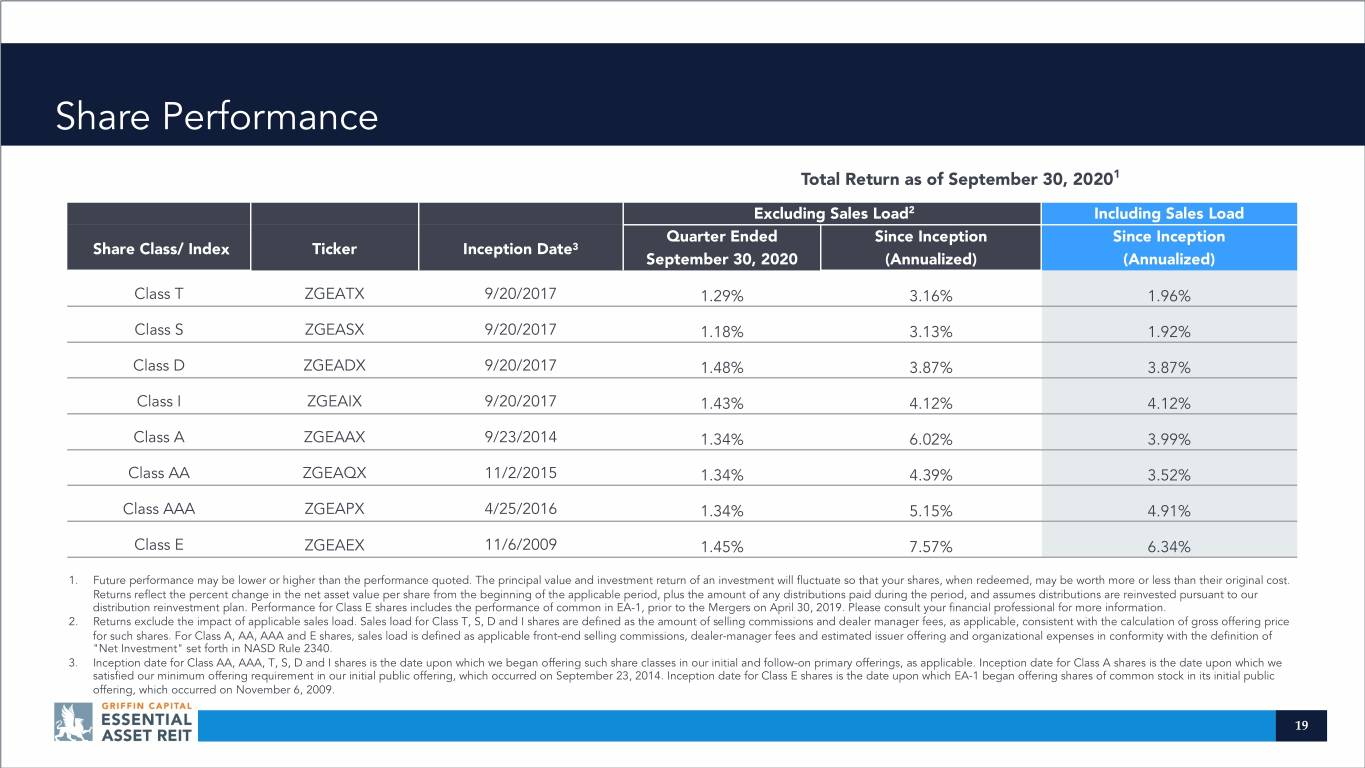
Share Performance Total Return as of September 30, 20201 Excluding Sales Load2 Including Sales Load Quarter Ended Since Inception Since Inception Share Class/ Index Ticker Inception Date3 September 30, 2020 (Annualized) (Annualized) Class T ZGEATX 9/20/2017 1.29% 3.16% 1.96% Class S ZGEASX 9/20/2017 1.18% 3.13% 1.92% Class D ZGEADX 9/20/2017 1.48% 3.87% 3.87% Class I ZGEAIX 9/20/2017 1.43% 4.12% 4.12% Class A ZGEAAX 9/23/2014 1.34% 6.02% 3.99% Class AA ZGEAQX 11/2/2015 1.34% 4.39% 3.52% Class AAA ZGEAPX 4/25/2016 1.34% 5.15% 4.91% Class E ZGEAEX 11/6/2009 1.45% 7.57% 6.34% 1. Future performance may be lower or higher than the performance quoted. The principal value and investment return of an investment will fluctuate so that your shares, when redeemed, may be worth more or less than their original cost. Returns reflect the percent change in the net asset value per share from the beginning of the applicable period, plus the amount of any distributions paid during the period, and assumes distributions are reinvested pursuant to our distribution reinvestment plan. Performance for Class E shares includes the performance of common in EA-1, prior to the Mergers on April 30, 2019. Please consult your financial professional for more information. 2. Returns exclude the impact of applicable sales load. Sales load for Class T, S, D and I shares are defined as the amount of selling commissions and dealer manager fees, as applicable, consistent with the calculation of gross offering price for such shares. For Class A, AA, AAA and E shares, sales load is defined as applicable front-end selling commissions, dealer-manager fees and estimated issuer offering and organizational expenses in conformity with the definition of "Net Investment" set forth in NASD Rule 2340. 3. Inception date for Class AA, AAA, T, S, D and I shares is the date upon which we began offering such share classes in our initial and follow-on primary offerings, as applicable. Inception date for Class A shares is the date upon which we satisfied our minimum offering requirement in our initial public offering, which occurred on September 23, 2014. Inception date for Class E shares is the date upon which EA-1 began offering shares of common stock in its initial public offering, which occurred on November 6, 2009. 19

AS OF SEPTEMBER 30, 2020 Debt Maturity Schedule (including effect of interest rate swaps) Weighted Average Debt Maturity: 4.9 years $900,000 $742,6941 $750,000 $600,000 $433,5992 $375,0005 $450,000 $250,0006 (Thousands) $300,000 $126,9703 $150,0004 $104,3527 $150,000 $0 $0 $0 $0 2020 2021 2022 2023 2024 2025 2026 2027 2028 2029 1. Represents the Revolving Credit Facility, assuming the one-year extension on the Revolving 4. Represents the 2026 Term Loan. NOTE: Principal repayments on the individual Credit Facility is exercised upon maturity as well as the Emporia, Midland, Samsonite, and 5. Represents the Bank of America Loan. mortgages do not include the net debt HealthSpring mortgage loans and the 2023 Term Loan. 6. Represents the Bank of America/KeyBank Loan. premium/(discount) of ($0.7) million and 2. Represents the Highway 94 and PBV mortgage loan and the 2024 Term Loan. 7. Represents the AIG loan II. deferred financing costs of $7.6 million. 3. Represents the AIG mortgage loan. 20

1520 E. Grand Avenue 949.270.9300 El Segundo, CA 90245 www.gcear.com For more information visit www.gcear.com


