UNITED STATES
SECURITIES AND EXCHANGE COMMISSION
Washington, D.C. 20549
Form N-CSR
CERTIFIED SHAREHOLDER REPORT OF REGISTERED
MANAGEMENT INVESTMENT COMPANIES
Investment Company Act File Number: 811-22982
Eaton Vance NextShares Trust
(Exact Name of Registrant as Specified in Charter)
Two International Place, Boston, Massachusetts 02110
(Address of Principal Executive Offices)
Maureen A. Gemma
Two International Place, Boston, Massachusetts 02110
(Name and Address of Agent for Services)
(617) 482-8260
(Registrant’s Telephone Number)
October 31
Date of Fiscal Year End
April 30, 2017
Date of Reporting Period
Item 1. Reports to Stockholders

Eaton Vance
Global Income Builder NextShares (EVGBC)
Listing Exchange: The NASDAQ Stock Market LLC
Semiannual Report
April 30, 2017

NextSharesTM is a trademark of NextShares Solutions LLC. Used with permission.

Commodity Futures Trading Commission Registration. Effective December 31, 2012, the Commodity Futures Trading Commission (“CFTC”) adopted certain regulatory changes that subject registered investment companies and advisers to regulation by the CFTC if a fund invests more than a prescribed level of its assets in certain CFTC-regulated instruments (including futures, certain options and swap agreements) or markets itself as providing investment exposure to such instruments. The Fund has claimed an exclusion from the definition of the term “commodity pool operator” under the Commodity Exchange Act. Accordingly, neither the Fund nor the adviser with respect to the operation of the Fund is subject to CFTC regulation. Because of its management of other strategies, the Fund’s adviser is registered with the CFTC as a commodity pool operator and a commodity trading advisor.
Fund shares are not insured by the FDIC and are not deposits or other obligations of, or guaranteed by, any depository institution. Shares are subject to investment risks, including possible loss of principal invested.
This report must be preceded or accompanied by a current summary prospectus or prospectus. Before investing in NextShares, investors should consider carefully the investment objectives, risks, charges and expenses. This and other important information is contained in the prospectus and summary prospectus, which can be obtained from a financial advisor. Prospective investors should read the prospectus carefully before investing. For further information, please call 1-800-262-1122.
Semiannual Report April 30, 2017
Eaton Vance
Global Income Builder NextShares
Table of Contents
| | | | |
Performance | | | 2 | |
| |
Fund Profile | | | 3 | |
| |
Endnotes and Additional Disclosures | | | 4 | |
| |
Fund Expenses | | | 5 | |
| |
Financial Statements | | | 6 | |
| |
Board of Trustees’ Contract Approval | | | 36 | |
| |
Officers and Trustees | | | 40 | |
| |
Important Notices | | | 41 | |
Eaton Vance
Global Income Builder NextShares
April 30, 2017
Performance1,2,3
Portfolio Managers Michael A. Allison, CFA and John H. Croft, CFA, of Eaton Vance and Boston Management and Research; Christopher M. Dyer, CFA and Jeffrey D. Mueller, of Eaton Vance Management (International) Limited
| | | | | | | | | | | | | | | | | | | | | | | | | | | | |
| % Average Annual Total Returns | | Fund
Inception Date | | | Performance
Inception Date | | | Six Months | | | One Year | | | Five Years | | | Ten Years | | | Since
Fund
Inception | |
Fund at NAV | | | 03/30/2016 | | | | 11/30/2005 | | | | 8.60 | % | | | 10.48 | % | | | 8.73 | % | | | 2.42 | % | | | 10.78 | % |
Fund at Market Price | | | 03/30/2016 | | | | 03/30/2016 | | | | 8.39 | | | | 10.21 | | | | — | | | | — | | | | 10.64 | |
MSCI World Index | | | — | | | | — | | | | 12.12 | % | | | 14.65 | % | | | 9.93 | % | | | 3.91 | % | | | 14.78 | % |
Blended Index | | | — | | | | — | | | | 9.70 | | | | 13.52 | | | | 8.65 | | | | 5.02 | | | | 14.73 | |
| | | | | | | |
| | | | | | | | | | | | | | | | | | | | | | | | | | | | |
% Total Annual Operating Expense Ratio4
| | | | | | | | | | | | | | | | | | | | | |
Gross | | | | | | | | | | | | | | | | | | | | | | | | | | | 2.99 | % |
Net | | | | | | | | | | | | | | | | | | | | | | | | | | | 0.91 | |
See Endnotes and Additional Disclosures in this report.
Past performance is no guarantee of future results. Investment return and principal value will fluctuate so that shares, when sold, may be worth more or less than their original cost. Performance is for the stated time period only; due to market volatility, the Fund current performance may be lower or higher than indicated. The Fund performance at market price will differ from its results at net asset value (NAV). The market price used to calculate the Market Price return is the midpoint between the highest bid and the lowest offer on the exchange on which the shares of the Fund are listed for trading, as of the time that the Fund’s NAV is calculated. If you trade your shares at another time during the day, your return may differ. Returns are historical and are calculated by determining the percentage change in NAV or market price (as applicable) with all distributions reinvested at NAV or closing market price (as applicable) on the payment date of the distribution, and are net of management fees and other expenses. Returns are before taxes unless otherwise noted. Performance less than or equal to one year is cumulative. For performance as of the most recent month-end, including historical trading premiums/discounts relative to NAV, please refer to eatonvance.com.
Eaton Vance
Global Income Builder NextShares
April 30, 2017
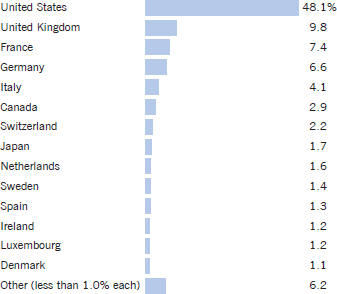
Fund Profile5
Country Allocation (% of net assets)6
Top 10 Holdings (% of net assets)7
| | | | |
Alphabet, Inc., Class C | | | 1.7 | % |
| |
AXA SA | | | 1.0 | |
| |
Allianz SE | | | 1.0 | |
| |
Facebook, Inc., Class A | | | 0.9 | |
| |
InterContinental Hotels Group PLC | | | 0.9 | |
| |
Bayerische Motoren Werke AG | | | 0.8 | |
| |
Bouygues SA | | | 0.8 | |
| |
Sampo Oyj, Class A | | | 0.8 | |
| |
Amazon.com, Inc. | | | 0.8 | |
| |
Melrose Industries PLC | | | 0.8 | |
| |
Total | | | 9.5 | % |
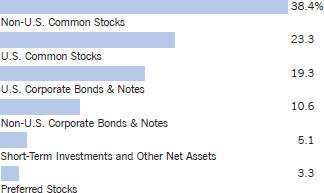
Asset Allocation (% of net assets)8
See Endnotes and Additional Disclosures in this report.
Eaton Vance
Global Income Builder NextShares
April 30, 2017
Endnotes and Additional Disclosures
| 1 | Shares of NextShares funds are normally bought and sold in the secondary market through a broker, and may not be individually purchased or redeemed from the fund. In the secondary market, buyers and sellers transact with each other, rather than with the fund. Market trading prices of NextShares are linked to the fund’s next-computed net asset value (NAV) and will vary from NAV by a market-determined premium or discount, which may be zero. Buyers and sellers of NextShares will not know the value of their purchases and sales until after the fund’s NAV is determined at the end of the trading day. Market trading prices may vary significantly from anticipated levels. NextShares do not offer investors the opportunity to buy and sell intraday based on current (versus end-of-day) determinations of fund value. NextShares trade execution prices will fluctuate based on changes in NAV. Although limit orders may be used to control trading costs, they cannot be used to control or limit trade execution prices. As a new type of fund, NextShares have a limited operating history and may initially be available through a limited number of brokers. There can be no guarantee that an active trading market for NextShares will develop or be maintained, or that their listing will continue unchanged. Buying and selling NextShares may require payment of brokerage commissions and expose transacting shareholders to other trading costs. Frequent trading may detract from realized investment returns. The return on a shareholder’s NextShares investment will be reduced if the shareholder sells shares at a greater discount or narrower premium to NAV than he or she acquired the shares. NextShares funds issue and redeem shares only in specified creation unit quantities in transactions by or through authorized participants. In such transactions, a fund issues and redeems shares in exchange for the basket of securities, other instruments and/or cash that the fund specifies each business day. A fund’s basket is not intended to be representative of the fund’s current portfolio positions and may vary significantly from current positions. |
| 2 | MSCI World Index is an unmanaged index of equity securities in the developed markets. MSCI indexes are net of foreign withholding taxes. Source: MSCI. MSCI data may not be reproduced or used for any other purpose. MSCI provides no warranties, has not prepared or approved this report, and has no liability hereunder. BofA Merrill Lynch Developed Markets High Yield Ex-Subordinated Financial Index is an unmanaged index of global developed market below investment grade corporate bonds and reflects gross returns. BofA Merrill Lynch® indices not for redistribution or other uses; provided “as is”, without warranties, and with no liability. Eaton Vance has prepared this report, BofAML does not endorse it, or guarantee, review, or endorse Eaton Vance’s products. The Blended Index consists of 65% MSCI World Index and 35% BofA Merrill Lynch Developed Markets High Yield Ex-Subordinated Financial Index. Unless otherwise stated, index returns do not reflect the effect of any applicable sales charges, commissions, expenses, taxes or leverage, as applicable. It is not possible to invest directly in an index. Performance since inception for an index, if presented, is the performance since the Fund’s or oldest share class’ inception, as applicable. |
| 3 | The Fund pursues its investment objective by investing in a separate investment fund (the Portfolio). The returns at NAV for periods before the date the Fund commenced operations are for a mutual fund that invests in the Portfolio (the Portfolio Investor). The performance during such period does not represent the performance of the Fund. The prior investment performance of the Portfolio Investor (rather than the Portfolio itself) is shown because it reflects the expenses typically borne by a retail fund investing in the Portfolio. The Portfolio Investor returns are not adjusted to reflect differences between the total net operating expenses of the Fund and the Portfolio Investor during the periods shown. If such an adjustment were made, the performance presented would be higher, because the Fund’s total net operating expenses are lower than those of the Portfolio Investor. Performance is for a share class of the Portfolio Investor offered at net asset value. Performance presented in the Financial Highlights included in the financial statements is not linked. |
| | Prior to December 7, 2015, the Portfolio Investor invested at least 80% of net assets in dividend-paying common and preferred stocks. Effective December 7, 2015, the Portfolio Investor changed its name and its principal investment strategies to invest in common stocks, preferred stocks and other hybrid securities and income instruments of U.S. and foreign issuers. As of such date, the Portfolio Investor is no longer required to invest at least 80% of its net assets in dividend-paying common and preferred stocks. |
| 4 | Source: Fund prospectus. Net expense ratio reflects a contractual expense reimbursement that continues through 2/28/18. Without the reimbursement, performance would have been lower. The expense ratios for the current reporting period can be found in the Financial Highlights section of this report. |
| 5 | Fund primarily invests in an affiliated investment company (Portfolio) with substantially the same objective(s) and policies as the Fund and may also invest directly. Unless otherwise noted, references to investments are to the aggregate holdings of the Fund and the Portfolio. |
| 6 | The Portfolio may obtain exposure to certain market segments through investments in exchange-traded funds (ETFs). For purposes of the chart, the Portfolio’s investments in ETFs are included based on the portfolio composition of each ETF. |
| 7 | Excludes cash and cash equivalents. |
| 8 | Other Net Assets represents other assets less liabilities and includes any investment type that represents less than 1% of net assets. |
| | Fund profile subject to change due to active management. |
Eaton Vance
Global Income Builder NextShares
April 30, 2017
Fund Expenses
Example: As a Fund shareholder, you incur two types of costs: (1) transaction costs, including brokerage commissions on purchases and sales of Fund shares; and (2) ongoing costs, including management fees and other Fund expenses. This Example is intended to help you understand your ongoing costs (in dollars) of Fund investing and to compare these costs with the ongoing costs of investing in other funds. The Example is based on an investment of $1,000 invested at the beginning of the period and held for the entire period (November 1, 2016 – April 30, 2017).
Actual Expenses: The first section of the table below provides information about actual account values and actual expenses. You may use the information in this section, together with the amount you invested, to estimate the expenses that you paid over the period. Simply divide your account value by $1,000 (for example, an $8,600 account value divided by $1,000 = 8.6), then multiply the result by the number in the first section under the heading entitled “Expenses Paid During Period” to estimate the expenses you paid on your account during this period.
Hypothetical Example for Comparison Purposes: The second section of the table below provides information about hypothetical account values and hypothetical expenses based on the actual Fund expense ratio and an assumed rate of return of 5% per year (before expenses), which is not the actual Fund return. The hypothetical account values and expenses may not be used to estimate the actual ending account balance or expenses you paid for the period. You may use this information to compare the ongoing costs of investing in your Fund and other funds. To do so, compare this 5% hypothetical example with the 5% hypothetical examples that appear in the shareholder reports of the other funds.
Please note that the expenses shown in the table are meant to highlight your ongoing costs only and do not reflect any transactional costs, such as brokerage commissions on purchases and sales of Fund shares. Therefore, the second section of the table is useful in comparing ongoing costs only, and will not help you determine the relative total costs of owning different funds. In addition, if these transactional costs were included, your costs would be higher.
| | | | | | | | | | | | | | | | |
| | | Beginning Account Value
(11/1/16) | | | Ending Account Value
(4/30/17) | | | Expenses Paid
During Period*
(11/1/16 – 4/30/17) | | | Annualized Expense
Ratio | |
| | | | |
| | | | | | | | | | | | | | | | |
Actual | | | | | | | | | | | | | | | | |
| | $ | 1,000.00 | | | $ | 1,086.00 | | | $ | 4.65 | ** | | | 0.90 | % |
| | | | | | | | | | | | | | | | | |
| | | | |
| | | | | | | | | | | | | | | | |
Hypothetical | | | | | | | | | | | | | | | | |
(5% return per year before expenses) | | | | | | | | | | | | | | | | |
| | $ | 1,000.00 | | | $ | 1,020.30 | | | $ | 4.51 | ** | | | 0.90 | % |
| * | Expenses are equal to the Fund’s annualized expense ratio, multiplied by the average account value over the period, multiplied by 181/365 (to reflect the one-half year period). The Example assumes that the $1,000 was invested at the net asset value per share determined at the close of business on October 31, 2016. The Example reflects the expenses of both the Fund and the Portfolio. |
| ** | Absent an allocation of certain expenses to affiliates, expenses would be higher. |
Eaton Vance
Global Income Builder NextShares
April 30, 2017
Statement of Assets and Liabilities (Unaudited)
| | | | |
| Assets | | April 30, 2017 | |
Investment in Global Income Builder Portfolio, at value (identified cost, $20,295,107) | | $ | 20,607,522 | |
Receivable from affiliates | | | 6,694 | |
Total assets | | $ | 20,614,216 | |
| |
| Liabilities | | | | |
Payable to affiliates: | | | | |
Administration fee | | $ | 2,730 | |
Operations agreement fee | | | 910 | |
Trustees’ fees | | | 42 | |
Accrued expenses | | | 41,422 | |
Total liabilities | | $ | 45,104 | |
Net Assets | | $ | 20,569,112 | |
|
| Sources of Net Assets | |
Paid-in capital | | $ | 19,241,219 | |
Accumulated net realized gain from Portfolio | | | 834,113 | |
Accumulated undistributed net investment income | | | 181,365 | |
Net unrealized appreciation from Portfolio | | | 312,415 | |
Total | | $ | 20,569,112 | |
|
| Net Asset Value Per Share | |
($20,569,112 ÷ 950,000 shares issued and outstanding) | | $ | 21.65 | |
| | | | |
| | 6 | | See Notes to Financial Statements. |
Eaton Vance
Global Income Builder NextShares
April 30, 2017
Statement of Operations (Unaudited)
| | | | |
| Investment Income | | Six Months Ended April 30, 2017 | |
Dividends allocated from Portfolio (net of foreign taxes, $69,466) | | $ | 291,769 | |
Interest allocated from Portfolio (net of foreign taxes, $423) | | | 201,788 | |
Other income allocated from Portfolio | | | 14,519 | |
Expenses allocated from Portfolio | | | (77,116 | ) |
Total investment income from Portfolio | | $ | 430,960 | |
| |
| Expenses | | | | |
Administration fee | | $ | 15,098 | |
Operations agreement fee | | | 5,033 | |
Trustees’ fees and expenses | | | 250 | |
Custodian fee | | | 9,639 | |
Transfer and dividend disbursing agent fees | | | 5,812 | |
Legal and accounting services | | | 12,696 | |
Printing and postage | | | 2,675 | |
Listing fee | | | 7,100 | |
Intraday pricing fee | | | 4,000 | |
Miscellaneous | | | 133 | |
Total expenses | | $ | 62,436 | |
Deduct — | | | | |
Allocation of expenses to affiliates | | $ | 48,216 | |
Total expense reductions | | $ | 48,216 | |
| |
Net expenses | | $ | 14,220 | |
| |
Net investment income | | $ | 416,740 | |
| |
| Realized and Unrealized Gain (Loss) from Portfolio | | | | |
Net realized gain (loss) — | | | | |
Investment transactions | | $ | 627,937 | (1) |
Financial futures contracts | | | (4,694 | ) |
Foreign currency and forward foreign currency exchange contract transactions | | | 56 | |
Net realized gain | | $ | 623,299 | |
Change in unrealized appreciation (depreciation) — | | | | |
Investments | | $ | 752,777 | |
Financial futures contracts | | | (87,628 | ) |
Foreign currency and forward foreign currency exchange contracts | | | 3,783 | |
Net change in unrealized appreciation (depreciation) | | $ | 668,932 | |
| |
Net realized and unrealized gain | | $ | 1,292,231 | |
| |
Net increase in net assets from operations | | $ | 1,708,971 | |
| (1) | Includes $23,548 of net realized gains from redemptions in-kind. |
| | | | |
| | 7 | | See Notes to Financial Statements. |
Eaton Vance
Global Income Builder NextShares
April 30, 2017
Statements of Changes in Net Assets
| | | | | | | | |
| Increase (Decrease) in Net Assets | | Six Months Ended April 30, 2017 (Unaudited) | | | Period Ended
October 31, 2016(1) | |
From operations — | | | | | | | | |
Net investment income | | $ | 416,740 | | | $ | 147,076 | |
Net realized gain from investment transactions, financial futures contracts, and foreign currency and forward foreign currency exchange contract transactions | | | 623,299 | (2) | | | 269,949 | (3) |
Net change in unrealized appreciation (depreciation) from investments, financial futures contracts, foreign currency and forward foreign currency exchange contracts | | | 668,932 | | | | (356,517 | ) |
Net increase in net assets from operations | | $ | 1,708,971 | | | $ | 60,508 | |
Distributions to shareholders — | | | | | | | | |
From net investment income | | $ | (335,603 | ) | | $ | (105,980 | ) |
Total distributions to shareholders | | $ | (335,603 | ) | | $ | (105,980 | ) |
Transactions in Fund shares — | | | | | | | | |
Proceeds from sale of shares | | $ | 8,202,093 | | | $ | 14,738,676 | |
Cost of shares redeemed | | | (3,714,449 | ) | | | — | |
Transaction fees | | | 2,123 | | | | 2,640 | |
Net increase in net assets from Fund share transactions | | $ | 4,489,767 | | | $ | 14,741,316 | |
Other capital — | | | | | | | | |
Portfolio transaction fee contributed to Portfolio | | $ | (2,078 | ) | | $ | (416 | ) |
Portfolio transaction fee allocated from Portfolio | | | 7,717 | | | | 4,910 | |
Net increase in net assets from other capital | | $ | 5,639 | | | $ | 4,494 | |
| | |
Net increase in net assets | | $ | 5,868,774 | | | $ | 14,700,338 | |
| | |
| Net Assets | | | | | | | | |
At beginning of period | | $ | 14,700,338 | | | $ | — | |
At end of period | | $ | 20,569,112 | | | $ | 14,700,338 | |
| | |
Accumulated undistributed net investment income
included in net assets | | | | | | | | |
At end of period | | $ | 181,365 | | | $ | 100,228 | |
| | |
| Changes in shares outstanding | | | | | | | | |
Shares outstanding, beginning of period | | | 725,000 | | | | — | |
Shares sold | | | 400,000 | | | | 725,000 | |
Shares redeemed | | | (175,000 | ) | | | — | |
Shares outstanding, end of period | | | 950,000 | | | | 725,000 | |
| (1) | For the period from the start of business, March 30, 2016, to October 31, 2016. |
| (2) | Includes $23,548 of net realized gains from redemptions in-kind. |
| (3) | Includes $230,274 of net realized gains from redemptions in-kind. |
| | | | |
| | 8 | | See Notes to Financial Statements. |
Eaton Vance
Global Income Builder NextShares
April 30, 2017
Financial Highlights
| | | | | | | | |
| | | Six Months Ended
April 30, 2017
(Unaudited) | | | Period Ended October 31, 2016(1) | |
Net asset value — Beginning of period | | $ | 20.280 | | | $ | 20.000 | |
|
| Income (Loss) From Operations | |
Net investment income(2) | | $ | 0.426 | | | $ | 0.386 | |
Net realized and unrealized gain | | | 1.292 | | | | 0.181 | |
| | |
Total income from operations | | $ | 1.718 | | | $ | 0.567 | |
|
| Less Distributions | |
From net investment income | | $ | (0.354 | ) | | $ | (0.299 | ) |
| | |
Total distributions | | $ | (0.354 | ) | | $ | (0.299 | ) |
| | |
Portfolio transaction fee, net(2) | | $ | 0.006 | | | $ | 0.012 | |
| | |
Net asset value — End of period | | $ | 21.650 | | | $ | 20.280 | |
| | |
Total Return on Net Asset Value(3)(4) | | | 8.60 | %(5) | | | 2.90 | %(5) |
|
| Ratios/Supplemental Data | |
Net assets, end of period (000’s omitted) | | $ | 20,569 | | | $ | 14,700 | |
Ratios (as a percentage of average daily net assets):(6) | | | | | | | | |
Expenses(4) | | | 0.90 | %(7) | | | 0.90 | %(7) |
Net investment income | | | 4.13 | %(7) | | | 3.22 | %(7) |
Portfolio Turnover of the Portfolio | | | 71 | %(5) | | | 66 | %(5)(8) |
| (1) | For the period from the start of business, March 30, 2016, to October 31, 2016. |
| (2) | Computed using average shares outstanding. |
| (3) | Returns are historical and are calculated by determining the percentage change in net asset value with all distributions reinvested and do not reflect the effect of a market-determined premium or discount. Investment returns assume that all distributions have been reinvested at net asset value. |
| (4) | The administrator and sub-adviser reimbursed certain operating expenses (equal to 0.48% and 2.08% of average daily net assets for the six months ended April 30, 2017 and the period ended October 31, 2016, respectively). Absent this reimbursement, total return would be lower. |
| (6) | Includes the Fund’s share of the Portfolio’s allocated expenses. |
| (8) | For the period from the Portfolio’s start of business, March 28, 2016, to October 31, 2016. |
| | | | |
| | 9 | | See Notes to Financial Statements. |
Eaton Vance
Global Income Builder NextShares
April 30, 2017
Notes to Financial Statements (Unaudited)
1 Significant Accounting Policies
Eaton Vance Global Income Builder NextShares (the Fund) is a diversified series of Eaton Vance NextShares Trust (the Trust), a Massachusetts business trust registered under the Investment Company Act of 1940, as amended (the 1940 Act). The Fund is an exchange-traded managed fund operating pursuant to an order issued by the SEC granting an exemption from certain provisions of the 1940 Act. Individual shares of the Fund may be purchased and sold only on a national securities exchange or alternative trading system through a broker-dealer that offers NextShares, and may not be directly purchased or redeemed from the Fund. Market trading prices for the Fund are directly linked to the Fund’s next-computed net asset value per share (NAV) and will vary from NAV by a market-determined premium or discount, which may be zero. The Fund commenced operations on March 30, 2016. The Fund invests all of its investable assets in interests in Global Income Builder Portfolio (the Portfolio), a Massachusetts business trust having substantially the same investment objective and policies as the Fund. The value of the Fund’s investment in the Portfolio reflects the Fund’s proportionate interest in the net assets of the Portfolio (5.4% at April 30, 2017). The performance of the Fund is directly affected by the performance of the Portfolio. The financial statements of the Portfolio, including the portfolio of investments, are included elsewhere in this report and should be read in conjunction with the Fund’s financial statements.
The following is a summary of significant accounting policies of the Fund. The policies are in conformity with accounting principles generally accepted in the United States of America (U.S. GAAP). The Fund is an investment company and follows accounting and reporting guidance in the Financial Accounting Standards Board (FASB) Accounting Standards Codification Topic 946.
A Investment Valuation — Valuation of securities by the Portfolio is discussed in Note 1A of the Portfolio’s Notes to Financial Statements, which are included elsewhere in this report.
B Income — The Fund’s net investment income or loss consists of the Fund’s pro-rata share of the net investment income or loss of the Portfolio, less all actual and accrued expenses of the Fund.
C Federal Taxes — The Fund’s policy is to comply with the provisions of the Internal Revenue Code applicable to regulated investment companies and to distribute to shareholders each year substantially all of its net investment income, and all or substantially all of its net realized capital gains. Accordingly, no provision for federal income or excise tax is necessary.
As of April 30, 2017, the Fund had no uncertain tax positions that would require financial statement recognition, de-recognition, or disclosure. The Fund files a U.S. federal income tax return annually after its fiscal year-end, which is subject to examination by the Internal Revenue Service for a period of three years from the date of filing.
D Expenses — The majority of expenses of the Trust are directly identifiable to an individual fund. Expenses which are not readily identifiable to a specific fund are allocated taking into consideration, among other things, the nature and type of expense and the relative size of the funds.
E Use of Estimates — The preparation of the financial statements in conformity with U.S. GAAP requires management to make estimates and assumptions that affect the reported amounts of assets and liabilities at the date of the financial statements and the reported amounts of income and expense during the reporting period. Actual results could differ from those estimates.
F Indemnifications — Under the Trust’s organizational documents, its officers and Trustees may be indemnified against certain liabilities and expenses arising out of the performance of their duties to the Fund. Under Massachusetts law, if certain conditions prevail, shareholders of a Massachusetts business trust (such as the Trust) could be deemed to have personal liability for the obligations of the Trust. However, the Trust’s Declaration of Trust contains an express disclaimer of liability on the part of Fund shareholders and the By-laws provide that the Trust shall assume the defense on behalf of any Fund shareholders. Moreover, the By-laws also provide for indemnification out of Fund property of any shareholder held personally liable solely by reason of being or having been a shareholder for all loss or expense arising from such liability. Additionally, in the normal course of business, the Fund enters into agreements with service providers that may contain indemnification clauses. The Fund’s maximum exposure under these arrangements is unknown as this would involve future claims that may be made against the Fund that have not yet occurred.
G Other — Investment transactions are accounted for on a trade date basis.
H Interim Financial Statements — The interim financial statements relating to April 30, 2017 and for the six months then ended have not been audited by an independent registered public accounting firm, but in the opinion of the Fund’s management, reflect all adjustments, consisting only of normal recurring adjustments, necessary for the fair presentation of the financial statements.
2 Distributions to Shareholders and Income Tax Information
It is the present policy of the Fund to make monthly distributions of all or substantially all of its net investment income and to distribute annually all or substantially all of its net realized capital gains. Distributions are paid in cash and cannot be automatically reinvested in additional shares of the Fund. Distributions to shareholders are recorded on the ex-dividend date. Distributions to shareholders are determined in accordance with income tax regulations, which may differ from U.S. GAAP. As required by U.S. GAAP, only distributions in excess of tax basis earnings and profits are reported in the financial
Eaton Vance
Global Income Builder NextShares
April 30, 2017
Notes to Financial Statements (Unaudited) — continued
statements as a return of capital. Permanent differences between book and tax accounting relating to distributions are reclassified to paid-in capital. For tax purposes, distributions from short-term capital gains are considered to be from ordinary income.
At October 31, 2016, the Fund, for federal income tax purposes, had deferred capital losses of $354,074 which would reduce its taxable income arising from future net realized gains on investment transactions, if any, to the extent permitted by the Internal Revenue Code, and thus would reduce the amount of distributions to shareholders, which would otherwise be necessary to relieve the Fund of any liability for federal income or excise tax. The deferred capital losses are treated as arising on the first day of the Fund’s next taxable year and retain the same short-term or long-term character as when originally deferred. Of the deferred capital losses at October 31, 2016, $118,527 are short-term and $235,547 are long-term.
3 Investment Adviser and Administration Fee and Other Transactions with Affiliates
The investment adviser fee is earned by Eaton Vance Management (EVM) as compensation for investment advisory services rendered to the Fund. The fee is computed at an annual rate of 0.65% of the Fund’s average daily net assets that are not invested in other investment companies for which EVM or its affiliates serve as investment adviser and receive an advisory fee (“Direct Assets”) up to $500 million and is payable monthly. On Direct Assets of $500 million and over, the annual fee is reduced. Pursuant to an investment sub-advisory agreement, EVM pays Eaton Vance Management (International) Limited (EVMI), an indirect, wholly-owned subsidiary of Eaton Vance Corp., a portion of its investment adviser fee for sub-advisory services provided to the Fund. For the six months ended April 30, 2017, the Fund incurred no investment adviser fee on Direct Assets. To the extent the Fund’s assets are invested in the Portfolio, the Fund is allocated its share of the Portfolio’s investment adviser fee. The Portfolio has engaged Boston Management and Research (BMR), a subsidiary of EVM, to render investment advisory services. See Note 2 of the Portfolio’s Notes to Financial Statements which are included elsewhere in this report. EVM also serves as the administrator of the Fund. The administration fee is earned by EVM as compensation for administrative services rendered to the Fund. The fee is computed at an annual rate of 0.15% of the Fund’s average daily net assets. For the six months ended April 30, 2017, the administration fee amounted to $15,098.
The Trust, on behalf of the Fund, has entered into an operations agreement with EVM pursuant to which EVM provides the Fund with services required for it to operate as a NextShares exchange-traded managed fund in accordance with the exemptive order obtained by EVM and the Trust. Pursuant to the agreement, the Fund pays EVM a monthly fee at an annual rate of 0.05% of the Fund’s average daily net assets provided the average net assets of NextShares funds sponsored by EVM (“Covered Assets”) are less than $10 billion. The annual rate is reduced if Covered Assets are $10 billion and above. For the six months ended April 30, 2017, the operations agreement fee amounted to $5,033 or 0.05% (annualized) of the Fund’s average daily net assets.
EVM and EVMI have agreed to reimburse the Fund’s expenses to the extent that total annual operating expenses (relating to ordinary operating expenses only) exceed 0.90% of the Fund’s average daily net assets through February 28, 2018. Thereafter, the reimbursement may be changed or terminated at any time. Pursuant to this agreement, EVM and EVMI were allocated $48,216 in total of the Fund’s operating expenses for the six months ended April 30, 2017.
Trustees and officers of the Fund who are members of EVM’s or BMR’s organizations receive remuneration for their services to the Fund out of the investment adviser fee. Certain officers and Trustees of the Fund and the Portfolio are officers of the above organizations.
4 Investment Transactions
For the six months ended April 30, 2017, increases and decreases in the Fund’s investment in the Portfolio aggregated $8,263,908 and $4,130,976, respectively. In addition, a Portfolio transaction fee is imposed by the Portfolio on the combined daily inflows or outflows of the Fund and the Portfolio’s other investors as more fully described at Note 1K of the Portfolio’s financial statements included herein. Such fee is allocated to the Fund based on its pro-rata interest in the Portfolio. The amount of the Portfolio transaction fee imposed on the Fund, if any, and the allocation of such fee are presented as Other capital on the Statements of Changes in Net Assets.
5 Capital Share Transactions
The Trust may issue an unlimited number of shares of capital stock (no par value per share) in one or more series (such as the Fund). The Fund issues and redeems shares only in blocks of 25,000 shares or multiples thereof (“Creation Units”). The Fund issues and redeems Creation Units in return for the securities, other instruments and/or cash (the “Basket”) that the Fund specifies each business day. Creation Units may be purchased or redeemed only by or through Authorized Participants, which are broker-dealers or institutional investors that have entered into agreements with the Fund’s distributor for this purpose. The Fund imposes a transaction fee on Creation Units issued and redeemed to offset the estimated cost to the Fund of processing the transaction, which is paid by the Authorized Participants directly to a third-party administrator. In addition, Authorized Participants pay the Fund a variable charge for converting the Basket to or from the desired portfolio composition. Such variable charges are reflected as Transaction fees on the Statements of Changes in Net Assets.
At April 30, 2017, EVM owned approximately 98% of the outstanding shares of the Fund.
Global Income Builder Portfolio
April 30, 2017
Portfolio of Investments (Unaudited)
| | | | | | | | | | | | |
| Common Stocks — 61.7% | |
| | | |
| | | | | | | | | | | | |
| Security | | | | | Shares | | | Value | |
| | | | | | | | | | | | |
|
Aerospace & Defense — 0.5% | |
CAE, Inc. | | | | | | | 116,395 | | | $ | 1,777,836 | |
| | | | | | | | | | | | | |
| | | | | | | | | | $ | 1,777,836 | |
| | | | | | | | | | | | | |
|
Air Freight & Logistics — 0.3% | |
C.H. Robinson Worldwide, Inc. | | | | | | | 14,412 | | | $ | 1,047,752 | |
| | | | | | | | | | | | | |
| | | | | | | | | | $ | 1,047,752 | |
| | | | | | | | | | | | | |
|
Auto Components — 0.6% | |
Goodyear Tire & Rubber Co. (The) | | | | | | | 61,516 | | | $ | 2,228,725 | |
| | | | | | | | | | | | | |
| | | | | | | | | | $ | 2,228,725 | |
| | | | | | | | | | | | | |
|
Automobiles — 0.8% | |
Bayerische Motoren Werke AG | | | | | | | 33,250 | | | $ | 3,176,763 | |
| | | | | | | | | | | | | |
| | | | | | | | | | $ | 3,176,763 | |
| | | | | | | | | | | | | |
|
Banks — 5.6% | |
Bank Pekao SA | | | | | | | 48,988 | | | $ | 1,775,336 | |
Credit Agricole SA | | | | | | | 88,250 | | | | 1,312,616 | |
DNB ASA | | | | | | | 148,793 | | | | 2,322,110 | |
ING Groep NV | | | | | | | 101,361 | | | | 1,652,136 | |
Intesa Sanpaolo SpA | | | | | | | 1,027,412 | | | | 2,999,117 | |
JPMorgan Chase & Co. | | | | | | | 34,459 | | | | 2,997,933 | |
KBC Group NV | | | | | | | 20,337 | | | | 1,469,691 | |
Mitsubishi UFJ Financial Group, Inc. | | | | | | | 227,390 | | | | 1,440,878 | |
Natixis SA | | | | | | | 194,040 | | | | 1,350,360 | |
Societe Generale SA | | | | | | | 21,587 | | | | 1,183,673 | |
Wells Fargo & Co. | | | | | | | 50,352 | | | | 2,710,952 | |
| | | | | | | | | | | | | |
| | | | | | | | | | $ | 21,214,802 | |
| | | | | | | | | | | | | |
|
Beverages — 1.3% | |
Anheuser-Busch InBev SA/NV | | | | | | | 12,954 | | | $ | 1,460,827 | |
Constellation Brands, Inc., Class A | | | | | | | 8,438 | | | | 1,455,893 | |
Diageo PLC | | | | | | | 71,173 | | | | 2,071,643 | |
| | | | | | | | | | | | | |
| | | | | | | | | | $ | 4,988,363 | |
| | | | | | | | | | | | | |
|
Biotechnology — 1.6% | |
Alexion Pharmaceuticals, Inc.(1) | | | | | | | 8,201 | | | $ | 1,047,924 | |
BioMarin Pharmaceutical, Inc.(1) | | | | | | | 10,378 | | | | 994,627 | |
Celgene Corp.(1) | | | | | | | 14,418 | | | | 1,788,553 | |
Shire PLC | | | | | | | 40,650 | | | | 2,396,671 | |
| | | | | | | | | | | | | |
| | | | | | | | | | $ | 6,227,775 | |
| | | | | | | | | | | | | |
| | | | | | | | | | | | |
| Security | | | | | Shares | | | Value | |
| | | | | | | | | | | | |
|
Building Products — 0.6% | |
Assa Abloy AB, Class B | | | | | | | 106,327 | | | $ | 2,301,433 | |
| | | | | | | | | | | | | |
| | | | | | | | | | $ | 2,301,433 | |
| | | | | | | | | | | | | |
|
Capital Markets — 1.1% | |
Azimut Holding SpA | | | | | | | 139,119 | | | $ | 2,713,756 | |
Credit Suisse Group AG | | | | | | | 38,293 | | | | 584,005 | |
Credit Suisse Group AG(2) | | | | | | | 63,032 | | | | 961,299 | |
| | | | | | | | | | | | | |
| | | | | | | | | | $ | 4,259,060 | |
| | | | | | | | | | | | | |
|
Chemicals — 1.3% | |
Arkema SA | | | | | | | 8,095 | | | $ | 857,123 | |
BASF SE | | | | | | | 7,808 | | | | 760,647 | |
Ecolab, Inc. | | | | | | | 7,064 | | | | 911,892 | |
Evonik Industries AG | | | | | | | 46,944 | | | | 1,567,459 | |
Novozymes A/S, Class B | | | | | | | 22,687 | | | | 979,468 | |
| | | | | | | | | | | | | |
| | | | | | | | | | $ | 5,076,589 | |
| | | | | | | | | | | | | |
|
Commercial Services & Supplies — 0.4% | |
Brambles, Ltd. | | | | | | | 210,483 | | | $ | 1,628,736 | |
| | | | | | | | | | | | | |
| | | | | | | | | | $ | 1,628,736 | |
| | | | | | | | | | | | | |
|
Construction & Engineering — 0.8% | |
Bouygues SA | | | | | | | 73,048 | | | $ | 3,070,490 | |
Carillion PLC | | | | | | | 2,912 | | | | 8,388 | |
| | | | | | | | | | | | | |
| | | | | | | | | | $ | 3,078,878 | |
| | | | | | | | | | | | | |
|
Containers & Packaging — 0.4% | |
Sealed Air Corp. | | | | | | | 32,153 | | | $ | 1,415,375 | |
| | | | | | | | | | | | | |
| | | | | | | | | | $ | 1,415,375 | |
| | | | | | | | | | | | | |
|
Diversified Telecommunication Services — 1.3% | |
Bezeq The Israeli Telecommunication Corp., Ltd. | | | | | | | 470,491 | | | $ | 790,484 | |
Deutsche Telekom AG | | | | | | | 124,370 | | | | 2,181,549 | |
Telefonica Deutschland Holding AG | | | | | | | 426,325 | | | | 2,067,135 | |
| | | | | | | | | | | | | |
| | | | | | | | | | $ | 5,039,168 | |
| | | | | | | | | | | | | |
|
Electric Utilities — 2.0% | |
American Electric Power Co., Inc. | | | | | | | 22,786 | | | $ | 1,545,574 | |
EDP-Energias de Portugal SA | | | | | | | 631,599 | | | | 2,084,416 | |
Electricite de France SA | | | | | | | 230,408 | | | | 1,923,390 | |
NextEra Energy, Inc. | | | | | | | 15,089 | | | | 2,015,287 | |
| | | | | | | | | | | | | |
| | | | | | | | | | $ | 7,568,667 | |
| | | | | | | | | | | | | |
| | | | |
| | 12 | | See Notes to Financial Statements. |
Global Income Builder Portfolio
April 30, 2017
Portfolio of Investments (Unaudited) — continued
| | | | | | | | | | | | |
| Security | | | | | Shares | | | Value | |
| | | | | | | | | | | | |
|
Electrical Equipment — 1.7% | |
ABB, Ltd. | | | | | | | 32,284 | | | $ | 791,095 | |
Legrand SA | | | | | | | 21,060 | | | | 1,363,234 | |
Melrose Industries PLC | | | | | | | 987,687 | | | | 3,023,504 | |
Zhuzhou CRRC Times Electric Co., Ltd., Class H | | | | | | | 221,808 | | | | 1,140,257 | |
| | | | | | | | | | | | | |
| | | | | | | | | | $ | 6,318,090 | |
| | | | | | | | | | | | | |
|
Electronic Equipment, Instruments & Components — 1.1% | |
CDW Corp. | | | | | | | 46,324 | | | $ | 2,737,285 | |
Keyence Corp. | | | | | | | 3,573 | | | | 1,436,396 | |
| | | | | | | | | | | | | |
| | | | | | | | | | $ | 4,173,681 | |
| | | | | | | | | | | | | |
|
Energy Equipment & Services — 0.6% | |
Halliburton Co. | | | | | | | 21,129 | | | $ | 969,399 | |
Schlumberger, Ltd. | | | | | | | 14,999 | | | | 1,088,777 | |
| | | | | | | | | | | | | |
| | | | | | | | | | $ | 2,058,176 | |
| | | | | | | | | | | | | |
|
Equity Real Estate Investment Trusts (REITs) — 1.1% | |
American Tower Corp. | | | | | | | 16,445 | | | $ | 2,071,083 | |
Equity Residential | | | | | | | 31,867 | | | | 2,057,971 | |
| | | | | | | | | | | | | |
| | | | | | | | | | $ | 4,129,054 | |
| | | | | | | | | | | | | |
|
Food Products — 0.9% | |
Kerry Group PLC, Class A | | | | | | | 12,529 | | | $ | 1,024,351 | |
Nestle SA | | | | | | | 15,842 | | | | 1,220,158 | |
Orkla ASA | | | | | | | 43,548 | | | | 395,106 | |
Pinnacle Foods, Inc. | | | | | | | 15,614 | | | | 907,954 | |
| | | | | | | | | | | | | |
| | | | | | | | | | $ | 3,547,569 | |
| | | | | | | | | | | | | |
|
Health Care Equipment & Supplies — 0.3% | |
Edwards Lifesciences Corp.(1) | | | | | | | 10,385 | | | $ | 1,138,923 | |
| | | | | | | | | | | | | |
| | | | | | | | | | $ | 1,138,923 | |
| | | | | | | | | | | | | |
|
Hotels, Restaurants & Leisure — 1.1% | |
Accor SA | | | | | | | 21,042 | | | $ | 959,497 | |
InterContinental Hotels Group PLC | | | | | | | 62,678 | | | | 3,322,064 | |
| | | | | | | | | | | | | |
| | | | | | | | | | $ | 4,281,561 | |
| | | | | | | | | | | | | |
|
Household Durables — 1.2% | |
Newell Brands, Inc. | | | | | | | 61,952 | | | $ | 2,957,588 | |
Persimmon PLC | | | | | | | 57,809 | | | | 1,744,277 | |
| | | | | | | | | | | | | |
| | | | | | | | | | $ | 4,701,865 | |
| | | | | | | | | | | | | |
| | | | | | | | | | | | |
| Security | | | | | Shares | | | Value | |
| | | | | | | | | | | | |
|
Household Products — 0.4% | |
Reckitt Benckiser Group PLC | | | | | | | 16,918 | | | $ | 1,558,781 | |
| | | | | | | | | | | | | |
| | | | | | | | | | $ | 1,558,781 | |
| | | | | | | | | | | | | |
|
Insurance — 7.8% | |
AIA Group, Ltd. | | | | | | | 425,407 | | | $ | 2,944,427 | |
Allianz SE | | | | | | | 19,312 | | | | 3,676,572 | |
Assicurazioni Generali SpA | | | | | | | 112,695 | | | | 1,785,090 | |
AXA SA | | | | | | | 140,500 | | | | 3,748,558 | |
Chubb, Ltd. | | | | | | | 21,513 | | | | 2,952,659 | |
Muenchener Rueckversicherungs-Gesellschaft AG in Muenchen | | | | | | | 12,515 | | | | 2,399,366 | |
Poste Italiane SpA(3) | | | | | | | 176,538 | | | | 1,208,906 | |
Prudential PLC | | | | | | | 82,704 | | | | 1,835,519 | |
Sampo Oyj, Class A | | | | | | | 63,741 | | | | 3,050,490 | |
SCOR SE | | | | | | | 44,746 | | | | 1,770,016 | |
St. James’s Place PLC | | | | | | | 151,535 | | | | 2,252,316 | |
Swiss Re AG | | | | | | | 25,889 | | | | 2,251,807 | |
| | | | | | | | | | | | | |
| | | | | | | | | | $ | 29,875,726 | |
| | | | | | | | | | | | | |
|
Internet & Direct Marketing Retail — 0.8% | |
Amazon.com, Inc.(1) | | | | | | | 3,284 | | | $ | 3,037,667 | |
| | | | | | | | | | | | | |
| | | | | | | | | | $ | 3,037,667 | |
| | | | | | | | | | | | | |
|
Internet Software & Services — 2.6% | |
Alphabet, Inc., Class C(1)(4) | | | | | | | 7,065 | | | $ | 6,400,607 | |
Facebook, Inc., Class A(1) | | | | | | | 23,352 | | | | 3,508,638 | |
| | | | | | | | | | | | | |
| | | | | | | | | | $ | 9,909,245 | |
| | | | | | | | | | | | | |
|
IT Services — 0.8% | |
Visa, Inc., Class A | | | | | | | 32,553 | | | $ | 2,969,485 | |
| | | | | | | | | | | | | |
| | | | | | | | | | $ | 2,969,485 | |
| | | | | | | | | | | | | |
|
Machinery — 0.9% | |
Fortive Corp. | | | | | | | 39,378 | | | $ | 2,491,052 | |
Komatsu, Ltd. | | | | | | | 35,416 | | | | 946,370 | |
| | | | | | | | | | | | | |
| | | | | | | | | | $ | 3,437,422 | |
| | | | | | | | | | | | | |
|
Media — 1.7% | |
Interpublic Group of Cos., Inc. | | | | | | | 98,860 | | | $ | 2,330,130 | |
ITV PLC | | | | | | | 260,771 | | | | 709,199 | |
ProSiebenSat.1 Media SE | | | | | | | 35,261 | | | | 1,496,816 | |
Time Warner, Inc. | | | | | | | 10,526 | | | | 1,044,916 | |
Toho Co., Ltd. | | | | | | | 29,243 | | | | 839,359 | |
| | | | | | | | | | | | | |
| | | | | | | | | | $ | 6,420,420 | |
| | | | | | | | | | | | | |
| | | | |
| | 13 | | See Notes to Financial Statements. |
Global Income Builder Portfolio
April 30, 2017
Portfolio of Investments (Unaudited) — continued
| | | | | | | | | | | | |
| Security | | | | | Shares | | | Value | |
| | | | | | | | | | | | |
|
Metals & Mining — 0.3% | |
Rio Tinto, Ltd. | | | | | | | 24,227 | | | $ | 1,096,797 | |
| | | | | | | | | | | | | |
| | | | | | | | | | $ | 1,096,797 | |
| | | | | | | | | | | | | |
|
Multi-Utilities — 2.9% | |
A2A SpA | | | | | | | 815,291 | | | $ | 1,211,795 | |
Centrica PLC | | | | | | | 664,026 | | | | 1,701,532 | |
National Grid PLC | | | | | | | 230,824 | | | | 2,988,767 | |
Suez | | | | | | | 137,268 | | | | 2,254,871 | |
Veolia Environnement SA | | | | | | | 156,199 | | | | 2,972,524 | |
| | | | | | | | | | | | | |
| | | | | | | | | | $ | 11,129,489 | |
| | | | | | | | | | | | | |
|
Oil, Gas & Consumable Fuels — 3.3% | |
Anadarko Petroleum Corp. | | | | | | | 37,682 | | | $ | 2,148,628 | |
Exxon Mobil Corp. | | | | | | | 17,847 | | | | 1,457,208 | |
Occidental Petroleum Corp. | | | | | | | 28,842 | | | | 1,774,937 | |
Royal Dutch Shell PLC, Class B | | | | | | | 60,059 | | | | 1,597,987 | |
Saras SpA | | | | | | | 593,493 | | | | 1,239,918 | |
Seven Generations Energy, Ltd., Class A(1) | | | | | | | 70,679 | | | | 1,251,464 | |
Snam SpA | | | | | | | 678,433 | | | | 2,997,361 | |
| | | | | | | | | | | | | |
| | | | | | | | | | $ | 12,467,503 | |
| | | | | | | | | | | | | |
|
Personal Products — 1.1% | |
Estee Lauder Cos., Inc. (The), Class A | | | | | | | 23,845 | | | $ | 2,077,853 | |
Unilever PLC | | | | | | | 42,844 | | | | 2,204,251 | |
| | | | | | | | | | | | | |
| | | | | | | | | | $ | 4,282,104 | |
| | | | | | | | | | | | | |
|
Pharmaceuticals — 3.9% | |
Allergan PLC | | | | | | | 9,734 | | | $ | 2,373,733 | |
Eli Lilly & Co. | | | | | | | 22,037 | | | | 1,808,356 | |
Johnson & Johnson | | | | | | | 23,329 | | | | 2,880,432 | |
Novo Nordisk A/S, Class B | | | | | | | 39,834 | | | | 1,551,011 | |
Roche Holding AG PC | | | | | | | 7,089 | | | | 1,854,938 | |
Sanofi | | | | | | | 23,575 | | | | 2,227,691 | |
Zoetis, Inc. | | | | | | | 35,509 | | | | 1,992,410 | |
| | | | | | | | | | | | | |
| | | | | | | | | | $ | 14,688,571 | |
| | | | | | | | | | | | | |
|
Professional Services — 0.6% | |
Verisk Analytics, Inc.(1) | | | | | | | 28,385 | | | $ | 2,350,562 | |
| | | | | | | | | | | | | |
| | | | | | | | | | $ | 2,350,562 | |
| | | | | | | | | | | | | |
|
Road & Rail — 0.9% | |
CSX Corp. | | | | | | | 38,782 | | | $ | 1,971,677 | |
Union Pacific Corp. | | | | | | | 13,030 | | | | 1,458,839 | |
| | | | | | | | | | | | | |
| | | | | | | | | | $ | 3,430,516 | |
| | | | | | | | | | | | | |
| | | | | | | | | | | | |
| Security | | | | | Shares | | | Value | |
| | | | | | | | | | | | |
|
Semiconductors & Semiconductor Equipment — 0.9% | |
ASML Holding NV | | | | | | | 17,957 | | | $ | 2,374,440 | |
Sumco Corp. | | | | | | | 67,427 | | | | 1,180,357 | |
| | | | | | | | | | | | | |
| | | | | | | | | | $ | 3,554,797 | |
| | | | | | | | | | | | | |
|
Specialty Retail — 1.5% | |
Advance Auto Parts, Inc. | | | | | | | 6,059 | | | $ | 861,226 | |
Industria de Diseno Textil SA | | | | | | | 57,343 | | | | 2,197,452 | |
Lowe’s Cos., Inc. | | | | | | | 29,582 | | | | 2,510,920 | |
| | | | | | | | | | | | | |
| | | | | | | | | | $ | 5,569,598 | |
| | | | | | | | | | | | | |
|
Technology Hardware, Storage & Peripherals — 0.8% | |
Apple, Inc. | | | | | | | 21,024 | | | $ | 3,020,098 | |
| | | | | | | | | | | | | |
| | | | | | | | | | $ | 3,020,098 | |
| | | | | | | | | | | | | |
|
Textiles, Apparel & Luxury Goods — 1.3% | |
Hugo Boss AG | | | | | | | 24,209 | | | $ | 1,840,932 | |
LVMH Moet Hennessy Louis Vuitton SE | | | | | | | 6,420 | | | | 1,584,897 | |
Pandora A/S | | | | | | | 15,055 | | | | 1,626,394 | |
| | | | | | | | | | | | | |
| | | | | | | | | | $ | 5,052,223 | |
| | | | | | | | | | | | | |
|
Tobacco — 0.4% | |
Altria Group, Inc. | | | | | | | 19,012 | | | $ | 1,364,681 | |
| | | | | | | | | | | | | |
| | | | | | | | | | $ | 1,364,681 | |
| | | | | | | | | | | | | |
|
Trading Companies & Distributors — 0.4% | |
Brenntag AG | | | | | | | 13,263 | | | $ | 786,254 | |
MISUMI Group, Inc. | | | | | | | 39,598 | | | | 750,186 | |
| | | | | | | | | | | | | |
| | | | | | | | | | $ | 1,536,440 | |
| | | | | | | | | | | | | |
|
Wireless Telecommunication Services — 1.8% | |
Freenet AG | | | | | | | 53,526 | | | $ | 1,679,824 | |
Tele2 AB, Class B | | | | | | | 287,758 | | | | 2,895,904 | |
Vodafone Group PLC | | | | | | | 883,817 | | | | 2,276,394 | |
| | | | | | | | | | | | | |
| | | | | | | | | | $ | 6,852,122 | |
| | | | | | | | | | | | | |
| |
Total Common Stocks
(identified cost $220,040,471) | | | $ | 234,983,088 | |
| | | | | | | | | | | | | |
|
| Preferred Stocks — 3.3% | |
| | | |
| | | | | | | | | | | | |
| Security | | | | | Shares | | | Value | |
|
Banks — 2.0% | |
AgriBank FCB, 6.875% to 1/1/24(5) | | | | | | | 9,798 | | | $ | 1,089,415 | |
CoBank ACB, Series F,
6.25% to 10/1/22(5) | | | | | | | 8,600 | | | | 891,712 | |
| | | | |
| | 14 | | See Notes to Financial Statements. |
Global Income Builder Portfolio
April 30, 2017
Portfolio of Investments (Unaudited) — continued
| | | | | | | | | | | | |
| Security | | | | | Shares | | | Value | |
| | | | | | | | | | | | |
|
Banks (continued) | |
Farm Credit Bank of Texas, 6.75% to 9/15/23(5) | | | | | | | 1,115 | | | $ | 121,187 | |
Farm Credit Bank of Texas, Series 1, 10.00% | | | | | | | 230 | | | | 282,900 | |
Huntington Bancshares, Inc., Series A, 8.50% (Convertible) | | | | | | | 400 | | | | 556,300 | |
IBERIABANK Corp., Series C, 6.60% to 5/1/26(5) | | | | | | | 15,030 | | | | 414,828 | |
KeyCorp, Series E, 6.125% to 12/15/26(5) | | | | | | | 20,550 | | | | 577,866 | |
People’s United Financial, Inc., Series A, 5.625% to 12/15/26(5) | | | | | | | 6,900 | | | | 190,164 | |
Regions Financial Corp., Series A, 6.375% | | | | | | | 18,416 | | | | 477,527 | |
SunTrust Banks, Inc., Series E, 5.875% | | | | | | | 34,002 | | | | 877,592 | |
Texas Capital Bancshares, Inc., 6.50% | | | | | | | 20,005 | | | | 504,326 | |
Texas Capital Bancshares, Inc., Series A, 6.50% | | | | | | | 14,549 | | | | 375,073 | |
Wells Fargo & Co., Series L, 7.50% (Convertible) | | | | | | | 890 | | | | 1,130,300 | |
| | | | | | | | | | | | | |
| | | | | | | | | | $ | 7,489,190 | |
| | | | | | | | | | | | | |
|
Capital Markets — 0.1% | |
KKR & Co., LP, Series A, 6.75% | | | | | | | 7,197 | | | $ | 190,145 | |
Legg Mason, Inc., 5.45% | | | | | | | 12,825 | | | | 306,774 | |
| | | | | | | | | | | | | |
| | | | | | | | | | $ | 496,919 | |
| | | | | | | | | | | | | |
|
Electric Utilities — 0.2% | |
NextEra Energy Capital Holdings, Inc., Series G, 5.70% | | | | | | | 5,893 | | | $ | 149,682 | |
NextEra Energy Capital Holdings, Inc., Series I, 5.125% | | | | | | | 9,163 | | | | 229,075 | |
Southern Co. (The), 6.25% | | | | | | | 22,549 | | | | 597,323 | |
| | | | | | | | | | | | | |
| | | | | | | | | | $ | 976,080 | |
| | | | | | | | | | | | | |
|
Equity Real Estate Investment Trusts (REITs) — 0.4% | |
CBL & Associates Properties, Inc., Series D, 7.375% | | | | | | | 700 | | | $ | 16,345 | |
DDR Corp., Series J, 6.50% | | | | | | | 25,300 | | | | 636,295 | |
DDR Corp., Series K, 6.25% | | | | | | | 6,500 | | | | 163,280 | |
PS Business Parks, Inc., Series W, 5.20% | | | | | | | 4,991 | | | | 119,684 | |
Vornado Realty Trust, Series K, 5.70% | | | | | | | 21,500 | | | | 547,605 | |
| | | | | | | | | | | | | |
| | | | | | | | | | $ | 1,483,209 | |
| | | | | | | | | | | | | |
|
Food Products — 0.1% | |
Dairy Farmers of America, Inc., 7.875%(3) | | | | | | | 4,700 | | | $ | 504,075 | |
Ocean Spray Cranberries, Inc., 6.25%(3) | | | | | | | 540 | | | | 48,448 | |
| | | | | | | | | | | | | |
| | | | | | | | | | $ | 552,523 | |
| | | | | | | | | | | | | |
|
Machinery — 0.1% | |
Stanley Black & Decker, Inc., 5.75% | | | | | | | 18,050 | | | $ | 459,553 | |
| | | | | | | | | | | | | |
| | | | | | | | | | $ | 459,553 | |
| | | | | | | | | | | | | |
| | | | | | | | | | | | |
| Security | | | | | Shares | | | Value | |
| | | | | | | | | | | | |
|
Multi-Utilities — 0.1% | |
DTE Energy Co., Series C, 5.25% | | | | | | | 9,407 | | | $ | 236,774 | |
| | | | | | | | | | | | | |
| | | | | | | | | | $ | 236,774 | |
| | | | | | | | | | | | | |
|
Oil, Gas & Consumable Fuels — 0.2% | |
NuStar Energy, LP, Series B, 7.625% to 6/15/22(5) | | | | | | | 23,750 | | | $ | 602,063 | |
| | | | | | | | | | | | | |
| | | | | | | | | | $ | 602,063 | |
| | | | | | | | | | | | | |
|
Thrifts & Mortgage Finance — 0.1% | |
EverBank Financial Corp., Series A, 6.75% | | | | | | | 19,973 | | | $ | 507,334 | |
| | | | | | | | | | | | | |
| | | | | | | | | | $ | 507,334 | |
| | | | | | | | | | | | | |
| |
Total Preferred Stocks
(identified cost $12,271,020) | | | $ | 12,803,645 | |
| | | | | | | | | | | | | |
|
| Corporate Bonds & Notes — 29.9% | |
| | | |
| | | | | | | | | | | | |
| Security | | | | | Principal Amount* (000’s omitted) | | | Value | |
|
Aerospace & Defense — 0.1% | |
TransDigm, Inc., 6.00%, 7/15/22 | | | | | | | 500 | | | $ | 516,250 | |
| | | | | | | | | | | | | |
| | | | | | | | | | $ | 516,250 | |
| | | | | | | | | | | | | |
|
Auto Components — 0.1% | |
American Axle & Manufacturing, Inc., 6.25%, 4/1/25(3) | | | | | | | 95 | | | $ | 94,762 | |
American Axle & Manufacturing, Inc., 6.50%, 4/1/27(3) | | | | | | | 75 | | | | 74,625 | |
Deck Chassis Acquisition, Inc., 10.00%, 6/15/23(3) | | | | | | | 205 | | | | 225,244 | |
| | | | | | | | | | | | | |
| | | | | | | | | | $ | 394,631 | |
| | | | | | | | | | | | | |
|
Automobiles — 0.1% | |
FTE Verwaltungs GmbH, 9.00%, 7/15/20(7) | | | EUR | | | | 400 | | | $ | 456,020 | |
| | | | | | | | | | | | | |
| | | | | | | | | | $ | 456,020 | |
| | | | | | | | | | | | | |
|
Banks — 3.0% | |
Australia and New Zealand Banking Group, Ltd., 6.75% to 6/15/26(3)(5)(8) | | | | | | | 200 | | | $ | 222,192 | |
Banco do Brasil SA, 6.25% to 4/15/24(3)(5)(8) | | | | | | | 859 | | | | 756,994 | |
Banco Santander SA, 6.375% to 5/19/19(5)(7)(8) | | | | | | | 400 | | | | 408,821 | |
Bank of America Corp., Series AA, 6.10% to 3/17/25(5)(8) | | | | | | | 1,018 | | | | 1,091,805 | |
Barclays PLC, 8.25% to 12/15/18(5)(8) | | | | | | | 974 | | | | 1,038,640 | |
Caixa Economica Federal, 7.25% to 7/23/19,
7/23/24(3)(5) | | | | | | | 215 | | | | 223,127 | |
CIT Group, Inc., 5.375%, 5/15/20 | | | | | | | 500 | | | | 539,375 | |
Citigroup, Inc., Series M, 6.30% to 5/15/24(5)(8) | | | | | | | 380 | | | | 401,489 | |
Credit Agricole SA, 7.875% to 1/23/24(3)(5)(8) | | | | | | | 327 | | | | 350,651 | |
| | | | |
| | 15 | | See Notes to Financial Statements. |
Global Income Builder Portfolio
April 30, 2017
Portfolio of Investments (Unaudited) — continued
| | | | | | | | | | | | |
| Security | | | | | Principal Amount* (000’s omitted) | | | Value | |
| | | | | | | | | | | | |
|
Banks (continued) | |
Fifth Third Bancorp, Series H, 5.10% to 6/30/23(5)(8) | | | | | | | 460 | | | $ | 458,850 | |
JPMorgan Chase & Co., Series S, 6.75% to 2/1/24(5)(8) | | | | | | | 215 | | | | 242,789 | |
JPMorgan Chase & Co., Series X, 6.10% to 10/1/24(5)(8) | | | | | | | 353 | | | | 379,034 | |
JPMorgan Chase & Co., Series Z, 5.30% to 5/1/20(5)(8) | | | | | | | 768 | | | | 802,598 | |
Lloyds Banking Group PLC, 6.657% to 5/21/37(3)(5)(8) | | | | | | | 335 | | | | 368,466 | |
Lloyds Banking Group PLC, 7.50% to 6/27/24(5)(8) | | | | | | | 1,033 | | | | 1,115,640 | |
M&T Bank Corp., Series F, 5.125% to 11/1/26(5)(8) | | | | | | | 280 | | | | 283,500 | |
PNC Financial Services Group, Inc. (The), Series S, 5.00% to 11/1/26(5)(8) | | | | | | | 170 | | | | 172,113 | |
Royal Bank of Scotland Group PLC, 8.00% to 8/10/25(5)(8) | | | | | | | 404 | | | | 420,160 | |
Standard Chartered PLC, 7.014% to 7/30/37(3)(5)(8) | | | | | | | 249 | | | | 278,258 | |
Standard Chartered PLC, 7.75% to 4/2/23(3)(5)(8) | | | | | | | 320 | | | | 342,000 | |
UniCredit SpA, 8.00% to
6/3/24(5)(7)(8) | | | | | | | 610 | | | | 603,061 | |
Zions Bancorporation, Series I, 5.80% to 9/15/23(5)(8) | | | | | | | 88 | | | | 86,460 | |
Zions Bancorporation, Series J, 7.20% to 9/15/23(5)(8) | | | | | | | 619 | | | | 670,067 | |
| | | | | | | | | | | | | |
| | | | | | | | | | $ | 11,256,090 | |
| | | | | | | | | | | | | |
|
Biotechnology — 0.3% | |
Grifols SA, 3.20%, 5/1/25(7) | | | EUR | | | | 1,075 | | | $ | 1,165,763 | |
| | | | | | | | | | | | | |
| | | | | | | | | | $ | 1,165,763 | |
| | | | | | | | | | | | | |
|
Building Products — 0.9% | |
Builders FirstSource, Inc., 5.625%, 9/1/24(3) | | | | | | | 115 | | | $ | 119,744 | |
LSF9 Balta Issuer S.A., 7.75%, 9/15/22(7) | | | EUR | | | | 893 | | | | 1,070,469 | |
Reliance Intermediate Holdings, L.P., 6.50%, 4/1/23(3) | | | | | | | 1,000 | | | | 1,085,000 | |
Standard Industries, Inc., 5.50%, 2/15/23(3) | | | | | | | 115 | | | | 119,887 | |
Standard Industries, Inc., 6.00%, 10/15/25(3) | | | | | | | 535 | | | | 573,787 | |
TRI Pointe Group, Inc./TRI Pointe Homes, Inc., 5.875%, 6/15/24 | | | | | | | 600 | | | | 634,500 | |
| | | | | | | | | | | | | |
| | | | | | | | | | $ | 3,603,387 | |
| | | | | | | | | | | | | |
|
Capital Markets — 0.5% | |
HRG Group, Inc., 7.875%, 7/15/19 | | | | | | | 1,000 | | | $ | 1,040,250 | |
UBS Group AG, 6.875% to
8/7/25(5)(7)(8) | | | | | | | 833 | | | | 880,339 | |
| | | | | | | | | | | | | |
| | | | | | | | | | $ | 1,920,589 | |
| | | | | | | | | | | | | |
|
Casino & Gaming — 0.1% | |
GLP Capital, L.P./GLP Financing II, Inc., 4.375%, 4/15/21 | | | | | | | 30 | | | $ | 31,500 | |
GLP Capital, L.P./GLP Financing II, Inc., 5.375%, 4/15/26 | | | | | | | 110 | | | | 116,325 | |
Sugarhouse HSP Gaming Property, L.P./Sugarhouse HSP Gaming Finance Corp.,
5.875%, 5/15/25(3)(9) | | | | | | | 165 | | | | 165,619 | |
Sugarhouse HSP Gaming Property, L.P./Sugarhouse HSP Gaming Finance Corp., 6.375%, 6/1/21(3) | | | | | | | 20 | | | | 20,396 | |
| | | | | | | | | | | | | |
| | | | | | | | | | $ | 333,840 | |
| | | | | | | | | | | | | |
| | | | | | | | | | | | |
| Security | | | | | Principal Amount* (000’s omitted) | | | Value | |
| | | | | | | | | | | | |
|
Chemicals — 0.6% | |
CF Industries, Inc., 4.95%, 6/1/43 | | | | | | | 120 | | | $ | 101,360 | |
Chemours Co. (The), 7.00%, 5/15/25 | | | | | | | 70 | | | | 77,263 | |
Platform Specialty Products Corp., 6.50%, 2/1/22(3) | | | | | | | 1,000 | | | | 1,030,000 | |
SPCM S.A., 4.875%, 9/15/25(3) | | | | | | | 65 | | | | 65,894 | |
Tronox Finance, LLC, 6.375%, 8/15/20 | | | | | | | 50 | | | | 51,063 | |
Tronox Finance, LLC,
7.50%, 3/15/22(3) | | | | | | | 15 | | | | 15,750 | |
Valvoline, Inc., 5.50%, 7/15/24(3) | | | | | | | 45 | | | | 47,700 | |
W.R. Grace & Co., 5.125%, 10/1/21(3) | | | | | | | 750 | | | | 807,187 | |
| | | | | | | | | | | | | |
| | | | | | | | | | $ | 2,196,217 | |
| | | | | | | | | | | | | |
|
Commercial Services & Supplies — 1.2% | |
Advanced Disposal Services, Inc., 5.625%, 11/15/24(3) | | | | | | | 170 | | | $ | 175,312 | |
Clean Harbors, Inc., 5.125%, 6/1/21 | | | | | | | 400 | | | | 410,164 | |
Covanta Holding Corp., 5.875%, 3/1/24 | | | | | | | 500 | | | | 503,750 | |
Covanta Holding Corp., 5.875%, 7/1/25 | | | | | | | 95 | | | | 95,000 | |
Covanta Holding Corp., 6.375%, 10/1/22 | | | | | | | 35 | | | | 36,094 | |
GFL Environmental, Inc., 9.875%, 2/1/21(3) | | | | | | | 450 | | | | 486,000 | |
Hertz Corp. (The), 5.50%, 10/15/24(3) | | | | | | | 95 | | | | 81,938 | |
Nord Anglia Education Finance, LLC, 5.75%, 7/15/22(7) | | | CHF | | | | 900 | | | | 966,709 | |
Prime Security Services Borrower, LLC/Prime Finance, Inc., 9.25%, 5/15/23(3) | | | | | | | 270 | | | | 295,650 | |
Ritchie Bros Auctioneers, Inc., 5.375%, 1/15/25(3) | | | | | | | 75 | | | | 77,625 | |
ServiceMaster Co., LLC (The), 7.45%, 8/15/27 | | | | | | | 550 | | | | 601,150 | |
Team Health Holdings, Inc., 6.375%, 2/1/25(3) | | | | | | | 240 | | | | 234,900 | |
Tervita Escrow Corp., 7.625%, 12/1/21(3) | | | | | | | 195 | | | | 201,337 | |
United Rentals North America, Inc., 5.50%, 5/15/27 | | | | | | | 35 | | | | 36,094 | |
United Rentals North America, Inc., 7.625%, 4/15/22 | | | | | | | 358 | | | | 374,557 | |
| | | | | | | | | | | | | |
| | | | | | | | | | $ | 4,576,280 | |
| | | | | | | | | | | | | |
|
Communications Equipment — 0.2% | |
CommScope Technologies, LLC, 5.00%, 3/15/27(3) | | | | | | | 150 | | | $ | 151,688 | |
Riverbed Technology, Inc., 8.875%, 3/1/23(3) | | | | | | | 630 | | | | 652,050 | |
| | | | | | | | | | | | | |
| | | | | | | | | | $ | 803,738 | |
| | | | | | | | | | | | | |
|
Consumer Finance — 0.4% | |
Ally Financial, Inc., 8.00%, 12/31/18 | | | | | | | 550 | | | $ | 596,750 | |
CPUK Finance, Ltd.,
7.00%, 2/28/42(7) | | | GBP | | | | 650 | | | | 886,862 | |
Navient Corp., 6.50%, 6/15/22 | | | | | | | 150 | | | | 155,250 | |
| | | | | | | | | | | | | |
| | | | | | | | | | $ | 1,638,862 | |
| | | | | | | | | | | | | |
|
Containers & Packaging — 0.7% | |
ARD Finance S.A.,
6.625%, 9/15/23(7)(10) | | | EUR | | | | 800 | | | $ | 907,931 | |
ARD Finance S.A.,
6.625%, 9/15/23(3)(10) | | | EUR | | | | 200 | | | | 226,983 | |
| | | | |
| | 16 | | See Notes to Financial Statements. |
Global Income Builder Portfolio
April 30, 2017
Portfolio of Investments (Unaudited) — continued
| | | | | | | | | | | | |
| Security | | | | | Principal Amount* (000’s omitted) | | | Value | |
| | | | | | | | | | | | |
|
Containers & Packaging (continued) | |
Ardagh Packaging Finance PLC/Ardagh Holdings USA, Inc., 6.00%, 2/15/25(3) | | | | | | | 200 | | | $ | 207,250 | |
BWAY Holding Co., 5.50%, 4/15/24(3) | | | | | | | 240 | | | | 243,300 | |
BWAY Holding Co., 7.25%, 4/15/25(3) | | | | | | | 240 | | | | 240,300 | |
Reynolds Group Issuer, Inc./Reynolds Group Issuer, LLC, 5.125%, 7/15/23(3) | | | | | | | 140 | | | | 146,125 | |
Reynolds Group Issuer, Inc./Reynolds Group Issuer, LLC, 5.75%, 10/15/20 | | | | | | | 500 | | | | 515,625 | |
Reynolds Group Issuer, Inc./Reynolds Group Issuer, LLC, 7.00%, 7/15/24(3) | | | | | | | 165 | | | | 177,891 | |
| | | | | | | | | | | | | |
| | | | | | | | | | $ | 2,665,405 | |
| | | | | | | | | | | | | |
|
Distributors — 0.0%(6) | |
HD Supply, Inc., 5.75%, 4/15/24(3) | | | | | | | 105 | | | $ | 111,825 | |
| | | | | | | | | | | | | |
| | | | | | | | | | $ | 111,825 | |
| | | | | | | | | | | | | |
|
Diversified Consumer Services — 0.1% | |
Laureate Education, Inc., 8.25%, 5/1/25(3) | | | | | | | 325 | | | $ | 334,750 | |
| | | | | | | | | | | | | |
| | | | | | | | | | $ | 334,750 | |
| | | | | | | | | | | | | |
|
Diversified Financial Services — 0.9% | |
Amigo Luxembourg SA, 7.625%, 1/15/24(7) | | | GBP | | | | 615 | | | $ | 838,294 | |
Cadence Financial Corp., 4.875%, 6/28/19(3) | | | | | | | 508 | | | | 500,380 | |
FBM Finance, Inc., 8.25%, 8/15/21(3) | | | | | | | 165 | | | | 178,817 | |
Icahn Enterprises, L.P./Icahn Enterprises Finance Corp., 6.25%, 2/1/22(3) | | | | | | | 115 | | | | 119,887 | |
Leucadia National Corp., 6.625%, 10/23/43 | | | | | | | 419 | | | | 426,188 | |
Mercury Bondco PLC, 7.125%, 5/30/21(7)(10) | | | EUR | | | | 530 | | | | 594,620 | |
Park Aerospace Holdings, Ltd., 5.25%, 8/15/22(3) | | | | | | | 455 | | | | 482,300 | |
Park Aerospace Holdings, Ltd., 5.50%, 2/15/24(3) | | | | | | | 265 | | | | 280,900 | |
Tempo Acquisition, LLC/Tempo Acquisition Finance Corp., 6.75%, 6/1/25(3)(9) | | | | | | | 125 | | | | 128,750 | |
| | | | | | | | | | | | | |
| | | | | | | | | | $ | 3,550,136 | |
| | | | | | | | | | | | | |
|
Diversified Telecommunication Services — 0.3% | |
CenturyLink, Inc., 5.80%, 3/15/22 | | | | | | | 500 | | | $ | 525,000 | |
CenturyLink, Inc., 7.50%, 4/1/24 | | | | | | | 100 | | | | 108,875 | |
Cincinnati Bell, Inc., 7.00%, 7/15/24(3) | | | | | | | 80 | | | | 84,880 | |
Frontier Communications Corp., 6.25%, 9/15/21 | | | | | | | 65 | | | | 60,450 | |
Frontier Communications Corp., 8.875%, 9/15/20 | | | | | | | 120 | | | | 127,124 | |
Frontier Communications Corp., 10.50%, 9/15/22 | | | | | | | 40 | | | | 40,450 | |
Level 3 Financing, Inc., 5.25%, 3/15/26 | | | | | | | 90 | | | | 93,045 | |
| | | | | | | | | | | | | |
| | | | | | | | | | $ | 1,039,824 | |
| | | | | | | | | | | | | |
| | | | | | | | | | | | |
| Security | | | | | Principal Amount* (000’s omitted) | | | Value | |
| | | | | | | | | | | | |
|
Electric Utilities — 1.0% | |
AES Corp. (The), 5.50%, 3/15/24 | | | | | | | 580 | | | $ | 598,850 | |
AES Corp. (The), 5.50%, 4/15/25 | | | | | | | 15 | | | | 15,450 | |
AES Corp. (The), 6.00%, 5/15/26 | | | | | | | 15 | | | | 15,881 | |
AES Gener SA, 8.375% to 6/18/19, 12/18/73(3)(5) | | | | | | | 515 | | | | 554,912 | |
Dynegy, Inc., 7.375%, 11/1/22 | | | | | | | 225 | | | | 216,563 | |
Emera, Inc., Series 16-A, 6.75% to 6/15/26, 6/15/76(5) | | | | | | | 940 | | | | 1,039,875 | |
NRG Yield Operating, LLC, 5.375%, 8/15/24 | | | | | | | 500 | | | | 513,750 | |
Pattern Energy Group, Inc., 5.875%, 2/1/24(3) | | | | | | | 115 | | | | 118,594 | |
Southern Co. (The), Series B, 5.50% to 3/15/22, 3/15/57(5) | | | | | | | 580 | | | | 601,650 | |
| | | | | | | | | | | | | |
| | | | | | | | | | $ | 3,675,525 | |
| | | | | | | | | | | | | |
|
Electrical Equipment — 0.2% | |
Senvion Holding GmbH, 3.875%, 10/25/22(7)(9) | | | EUR | | | | 575 | | | $ | 629,542 | |
| | | | | | | | | | | | | |
| | | | | | | | | | $ | 629,542 | |
| | | | | | | | | | | | | |
|
Electronic Equipment, Instruments & Components — 0.2% | |
Zebra Technologies Corp., 7.25%, 10/15/22 | | | | | | | 750 | | | $ | 812,813 | |
| | | | | | | | | | | | | |
| | | | | | | | | | $ | 812,813 | |
| | | | | | | | | | | | | |
|
Energy Equipment & Services — 0.2% | |
Abengoa Finance S.A.U., 7.75%, 2/1/20(3)(11) | | | | | | | 467 | | | $ | 15,469 | |
Novafives SAS, 4.50%, 6/30/21(7) | | | EUR | | | | 725 | | | | 799,417 | |
| | | | | | | | | | | | | |
| | | | | | | | | | $ | 814,886 | |
| | | | | | | | | | | | | |
|
Equity Real Estate Investment Trusts (REITs) — 0.1% | |
Equinix, Inc., 5.375%, 5/15/27 | | | | | | | 115 | | | $ | 120,438 | |
MGM Growth Properties Operating Partnership, L.P./MGP Finance Co-Issuer, Inc., 4.50%, 9/1/26 | | | | | | | 120 | | | | 120,150 | |
MGM Growth Properties Operating Partnership, L.P./MGP Finance Co-Issuer, Inc., 5.625%, 5/1/24 | | | | | | | 95 | | | | 102,956 | |
SBA Communications Corp., 4.875%, 9/1/24(3) | | | | | | | 55 | | | | 55,619 | |
| | | | | | | | | | | | | |
| | | | | | | | | | $ | 399,163 | |
| | | | | | | | | | | | | |
|
Food Products — 0.9% | |
AdvancePierre Foods Holdings, Inc., 5.50%, 12/15/24(3) | | | | | | | 115 | | | $ | 128,512 | |
Albertsons Cos., LLC/Safeway, Inc./New Albertson’s, Inc./Albertson’s, LLC, 5.75%, 3/15/25(3) | | | | | | | 165 | | | | 160,875 | |
Albertsons Cos., LLC/Safeway, Inc./New Albertson’s, Inc./Albertson’s, LLC, 6.625%, 6/15/24(3) | | | | | | | 95 | | | | 97,375 | |
Chobani, LLC/Chobani Finance Corp., Inc., 7.50%, 4/15/25(3) | | | | | | | 55 | | | | 56,925 | |
Dean Foods Co., 6.50%, 3/15/23(3) | | | | | | | 1,000 | | | | 1,057,500 | |
Dole Food Co., Inc.,
7.25%, 6/15/25(3) | | | | | | | 225 | | | | 234,281 | |
| | | | |
| | 17 | | See Notes to Financial Statements. |
Global Income Builder Portfolio
April 30, 2017
Portfolio of Investments (Unaudited) — continued
| | | | | | | | | | | | |
| Security | | | | | Principal Amount* (000’s omitted) | | | Value | |
| | | | | | | | | | | | |
|
Food Products (continued) | |
Land O’ Lakes, Inc., 8.00%(3)(8) | | | | | | | 875 | | | $ | 940,625 | |
Post Holdings, Inc., 5.00%, 8/15/26(3) | | | | | | | 85 | | | | 84,788 | |
Post Holdings, Inc., 5.50%, 3/1/25(3) | | | | | | | 230 | | | | 241,500 | |
TreeHouse Foods, Inc., 6.00%, 2/15/24(3) | | | | | | | 180 | | | | 192,600 | |
US Foods, Inc., 5.875%, 6/15/24(3) | | | | | | | 395 | | | | 414,750 | |
| | | | | | | | | | | | | |
| | | | | | | | | | $ | 3,609,731 | |
| | | | | | | | | | | | | |
|
Food Service — 0.0%(6) | |
Landry’s, Inc., 6.75%, 10/15/24(3) | | | | | | | 135 | | | $ | 141,750 | |
| | | | | | | | | | | | | |
| | | | | | | | | | $ | 141,750 | |
| | | | | | | | | | | | | |
|
Health Care Equipment & Supplies — 1.4% | |
Alere, Inc., 6.375%, 7/1/23(3) | | | | | | | 595 | | | $ | 650,781 | |
Alere, Inc., 6.50%, 6/15/20 | | | | | | | 40 | | | | 41,100 | |
Centene Corp., 4.75%, 1/15/25 | | | | | | | 300 | | | | 305,625 | |
Centene Corp., 5.625%, 2/15/21 | | | | | | | 90 | | | | 94,838 | |
Centene Corp., 6.125%, 2/15/24 | | | | | | | 340 | | | | 367,200 | |
Envision Healthcare Corp., 5.625%, 7/15/22 | | | | | | | 1,000 | | | | 1,035,400 | |
Envision Healthcare Corp., 6.25%, 12/1/24(3) | | | | | | | 220 | | | | 232,100 | |
Jaguar Holding Co. II/Pharmaceutical Product Development, LLC, 6.375%, 8/1/23(3) | | | | | | | 610 | | | | 637,450 | |
Kinetic Concepts, Inc./KCI USA, Inc., 7.875%, 2/15/21(3) | | | | | | | 320 | | | | 342,000 | |
Kinetic Concepts, Inc./KCI USA, Inc., 12.50%, 11/1/21(3) | | | | | | | 125 | | | | 140,625 | |
MPH Acquisition Holdings, LLC, 7.125%, 6/1/24(3) | | | | | | | 1,230 | | | | 1,325,325 | |
| | | | | | | | | | | | | |
| | | | | | | | | | $ | 5,172,444 | |
| | | | | | | | | | | | | |
|
Health Care Providers & Services — 0.7% | |
Acadia Healthcare Co., Inc., 6.50%, 3/1/24 | | | | | | | 45 | | | $ | 47,813 | |
CHS/Community Health Systems, Inc., 6.25%, 3/31/23 | | | | | | | 345 | | | | 352,331 | |
Eagle Holding Co. II, LLC, 7.625%, 5/15/22(3)(9)(10) | | | | | | | 165 | | | | 168,712 | |
HCA, Inc., 4.50%, 2/15/27 | | | | | | | 40 | | | | 40,480 | |
HCA, Inc., 5.875%, 2/15/26 | | | | | | | 750 | | | | 798,750 | |
MEDNAX, Inc., 5.25%, 12/1/23(3) | | | | | | | 500 | | | | 512,500 | |
Tenet Healthcare Corp., 6.75%, 6/15/23 | | | | | | | 260 | | | | 248,950 | |
Tenet Healthcare Corp., 7.50%, 1/1/22(3) | | | | | | | 85 | | | | 91,163 | |
WellCare Health Plans, Inc., 5.25%, 4/1/25 | | | | | | | 375 | | | | 390,937 | |
| | | | | | | | | | | | | |
| | | | | | | | | | $ | 2,651,636 | |
| | | | | | | | | | | | | |
|
Hotels, Restaurants & Leisure — 1.0% | |
1011778 B.C. Unlimited Liability Company/New Red Finance, Inc., 6.00%, 4/1/22(3) | | | | | | | 1,000 | | | $ | 1,045,000 | |
Carlson Travel, Inc., 6.75%, 12/15/23(3) | | | | | | | 200 | | | | 207,124 | |
Eldorado Resorts, Inc., 6.00%, 4/1/25(3) | | | | | | | 55 | | | | 57,062 | |
| | | | | | | | | | | | |
| Security | | | | | Principal Amount* (000’s omitted) | | | Value | |
| | | | | | | | | | | | |
|
Hotels, Restaurants & Leisure (continued) | |
Gateway Casinos & Entertainment, Ltd., 8.25%, 3/1/24(3) | | | | | | | 490 | | | $ | 502,250 | |
MGM Resorts International, 6.00%, 3/15/23 | | | | | | | 550 | | | | 602,250 | |
NCL Corp., Ltd., 4.75%, 12/15/21(3) | | | | | | | 150 | | | | 154,125 | |
NH Hotel Group SA,
3.75%, 10/1/23(7) | | | EUR | | | | 960 | | | | 1,095,499 | |
Penn National Gaming, Inc., 5.625%, 1/15/27(3) | | | | | | | 55 | | | | 55,550 | |
Scientific Games International, Inc., 7.00%, 1/1/22(3) | | | | | | | 115 | | | | 123,409 | |
Scientific Games International, Inc., 10.00%, 12/1/22 | | | | | | | 105 | | | | 114,135 | |
| | | | | | | | | | | | | |
| | | | | | | | | | $ | 3,956,404 | |
| | | | | | | | | | | | | |
|
Household Durables — 0.0%(6) | |
Tempur Sealy International, Inc., 5.50%, 6/15/26 | | | | | | | 45 | | | $ | 44,888 | |
| | | | | | | | | | | | | |
| | | | | | | | | | $ | 44,888 | |
| | | | | | | | | | | | | |
|
Household Products — 0.4% | |
Bormioli Rocco Holdings SA, 10.00%, 8/1/18(7) | | | EUR | | | | 850 | | | $ | 949,400 | |
Central Garden & Pet Co., 6.125%, 11/15/23 | | | | | | | 500 | | | | 536,250 | |
| | | | | | | | | | | | | |
| | | | | | | | | | $ | 1,485,650 | |
| | | | | | | | | | | | | |
|
Independent Power and Renewable Electricity Producers — 0.2% | |
Calpine Corp., 5.25%, 6/1/26(3) | | | | | | | 50 | | | $ | 50,563 | |
Drax Finco PLC, 4.25%, 5/1/22(7)(9) | | | GBP | | | | 450 | | | | 597,201 | |
NRG Energy, Inc., 7.25%, 5/15/26 | | | | | | | 235 | | | | 241,462 | |
| | | | | | | | | | | | | |
| | | | | | | | | | $ | 889,226 | |
| | | | | | | | | | | | | |
|
Industrial Conglomerates — 0.4% | |
Wittur International Holding GmbH, 8.50%, 2/15/23(7) | | | EUR | | | | 1,315 | | | $ | 1,486,681 | |
| | | | | | | | | | | | | |
| | | | | | | | | | $ | 1,486,681 | |
| | | | | | | | | | | | | |
|
Insurance — 0.3% | |
Hub International, Ltd., 7.875%, 10/1/21(3) | | | | | | | 500 | | | $ | 525,075 | |
Voya Financial, Inc., 5.65% to 5/15/23, 5/15/53(5) | | | | | | | 450 | | | | 465,750 | |
| | | | | | | | | | | | | |
| | | | | | | | | | $ | 990,825 | |
| | | | | | | | | | | | | |
|
Internet Software & Services — 0.3% | |
Match Group, Inc., 6.375%, 6/1/24 | | | | | | | 505 | | | $ | 551,713 | |
Zayo Group, LLC/Zayo Capital, Inc., 5.75%, 1/15/27(3) | | | | | | | 75 | | | | 79,781 | |
Zayo Group, LLC/Zayo Capital, Inc., 6.375%, 5/15/25 | | | | | | | 465 | | | | 504,525 | |
| | | | | | | | | | | | | |
| | | | | | | | | | $ | 1,136,019 | |
| | | | | | | | | | | | | |
|
IT Services — 0.5% | |
Alliance Data Systems Corp., 4.50%, 3/15/22(7) | | | EUR | | | | 1,465 | | | $ | 1,670,719 | |
Booz Allen Hamilton, Inc., 5.125%, 5/1/25(3) | | | | | | | 40 | | | | 40,650 | |
| | | | |
| | 18 | | See Notes to Financial Statements. |
Global Income Builder Portfolio
April 30, 2017
Portfolio of Investments (Unaudited) — continued
| | | | | | | | | | | | |
| Security | | | | | Principal Amount* (000’s omitted) | | | Value | |
| | | | | | | | | | | | |
|
IT Services (continued) | |
Gartner, Inc., 5.125%, 4/1/25(3) | | | | | | | 160 | | | $ | 166,000 | |
| | | | | | | | | | | | | |
| | | | | | | | | | $ | 1,877,369 | |
| | | | | | | | | | | | | |
|
Machinery — 0.2% | |
BlueLine Rental Finance Corp./BlueLine Rental, LLC, 9.25%, 3/15/24(3) | | | | | | | 150 | | | $ | 156,938 | |
Cloud Crane, LLC, 10.125%, 8/1/24(3) | | | | | | | 150 | | | | 160,500 | |
Navistar International Corp., 8.25%, 11/1/21 | | | | | | | 235 | | | | 239,112 | |
Welbilt, Inc., 9.50%, 2/15/24 | | | | | | | 295 | | | | 342,200 | |
| | | | | | | | | | | | | |
| | | | | | | | | | $ | 898,750 | |
| | | | | | | | | | | | | |
|
Media — 2.5% | |
Altice Luxembourg S.A., 7.25%, 5/15/22(7) | | | EUR | | | | 546 | | | $ | 629,408 | |
Altice Luxembourg S.A., 7.75%, 5/15/22(3) | | | | | | | 315 | | | | 335,475 | |
Altice US Finance I Corp., 5.50%, 5/15/26(3) | | | | | | | 200 | | | | 207,250 | |
AMC Entertainment Holdings, Inc., 6.375%, 11/15/24(7) | | | GBP | | | | 545 | | | | 754,823 | |
Cable Communications Systems NV, 5.00%, 10/15/23(7) | | | EUR | | | | 710 | | | | 826,791 | |
Cablevision Systems Corp., 5.875%, 9/15/22 | | | | | | | 55 | | | | 56,581 | |
Cablevision Systems Corp., 8.00%, 4/15/20 | | | | | | | 70 | | | | 78,357 | |
CBS Radio, Inc., 7.25%, 11/1/24(3) | | | | | | | 120 | | | | 130,800 | |
CCO Holdings, LLC/CCO Holdings Capital Corp., 5.875%, 4/1/24(3) | | | | | | | 1,130 | | | | 1,211,925 | |
Cequel Communications Holdings I, LLC/Cequel Capital Corp., 5.125%, 12/15/21(3) | | | | | | | 10 | | | | 10,275 | |
Cequel Communications Holdings I, LLC/Cequel Capital Corp., 6.375%, 9/15/20(3) | | | | | | | 294 | | | | 303,740 | |
CSC Holdings, LLC, 6.75%, 11/15/21 | | | | | | | 500 | | | | 551,250 | |
CSC Holdings, LLC, 10.875%, 10/15/25(3) | | | | | | | 500 | | | | 601,875 | |
DISH DBS Corp., 7.75%, 7/1/26 | | | | | | | 155 | | | | 181,931 | |
EW Scripps Co. (The), 5.125%, 5/15/25(3) | | | | | | | 40 | | | | 41,150 | |
McGraw-Hill Global Education Holdings, LLC/McGraw-Hill Global Education Finance, 7.875%, 5/15/24(3) | | | | | | | 140 | | | | 136,850 | |
MDC Partners, Inc., 6.50%, 5/1/24(3) | | | | | | | 265 | | | | 259,700 | |
MHGE Parent, LLC/MHGE Parent Finance, Inc., 8.50%, 8/1/19(3)(10) | | | | | | | 35 | | | | 35,438 | |
Sirius XM Radio, Inc.,
6.00%, 7/15/24(3) | | | | | | | 500 | | | | 536,250 | |
Unitymedia Hessen GmbH & Co. KG/Unitymedia NRW GmbH, 4.00%, 1/15/25(7) | | | EUR | | | | 850 | | | | 977,524 | |
Virgin Media Receivables Financing Notes I DAC, 5.50%, 9/15/24(7) | | | GBP | | | | 1,050 | | | | 1,436,462 | |
Ziggo Secured Finance B.V., 5.50%, 1/15/27(3) | | | | | | | 150 | | | | 154,500 | |
| | | | | | | | | | | | | |
| | | | | | | | | | $ | 9,458,355 | |
| | | | | | | | | | | | | |
|
Metals & Mining — 1.5% | |
Allegheny Ludlum, LLC, 6.95%, 12/15/25 | | | | | | | 380 | | | $ | 362,900 | |
| | | | | | | | | | | | |
| Security | | | | | Principal Amount* (000’s omitted) | | | Value | |
| | | | | | | | | | | | |
|
Metals & Mining (continued) | |
Allegheny Technologies, Inc., 5.95%, 1/15/21 | | | | | | | 50 | | | $ | 49,750 | |
Allegheny Technologies, Inc., 7.875%, 8/15/23 | | | | | | | 115 | | | | 119,169 | |
Anglo American Capital PLC, 4.75%, 4/10/27(3) | | | | | | | 1,025 | | | | 1,062,443 | |
BHP Billiton Finance USA, Ltd., 6.75% to 10/19/25, 10/19/75(3)(5) | | | | | | | 270 | | | | 306,450 | |
Eldorado Gold Corp., 6.125%, 12/15/20(3) | | | | | | | 45 | | | | 46,463 | |
Ferroglobe PLC/Globe Specialty Metals, Inc., 9.375%, 3/1/22(3) | | | | | | | 750 | | | | 785,625 | |
First Quantum Minerals, Ltd., 7.00%, 2/15/21(3) | | | | | | | 75 | | | | 78,000 | |
First Quantum Minerals, Ltd., 7.25%, 5/15/22(3) | | | | | | | 215 | | | | 222,525 | |
First Quantum Minerals, Ltd., 7.25%, 4/1/23(3) | | | | | | | 200 | | | | 204,125 | |
First Quantum Minerals, Ltd., 7.50%, 4/1/25(3) | | | | | | | 445 | | | | 455,012 | |
Freeport-McMoRan, Inc., 3.10%, 3/15/20 | | | | | | | 40 | | | | 39,650 | |
Freeport-McMoRan, Inc., 4.55%, 11/14/24 | | | | | | | 75 | | | | 70,838 | |
Hudbay Minerals, Inc., 7.25%, 1/15/23(3) | | | | | | | 115 | | | | 122,906 | |
Hudbay Minerals, Inc., 7.625%, 1/15/25(3) | | | | | | | 200 | | | | 215,250 | |
New Gold, Inc., 6.25%, 11/15/22(3) | | | | | | | 155 | | | | 158,875 | |
Novelis Corp., 5.875%, 9/30/26(3) | | | | | | | 180 | | | | 185,400 | |
Novelis Corp., 6.25%, 8/15/24(3) | | | | | | | 125 | | | | 132,500 | |
SunCoke Energy Partners, L.P./SunCoke Energy Partners Finance Corp., 7.375%, 2/1/20 | | | | | | | 495 | | | | 509,850 | |
Teck Resources, Ltd., 5.20%, 3/1/42 | | | | | | | 40 | | | | 38,375 | |
Teck Resources, Ltd., 5.40%, 2/1/43 | | | | | | | 85 | | | | 83,087 | |
Teck Resources, Ltd., 6.00%, 8/15/40 | | | | | | | 45 | | | | 46,519 | |
Teck Resources, Ltd.,
8.50%, 6/1/24(3) | | | | | | | 130 | | | | 150,962 | |
United States Steel Corp., 8.375%, 7/1/21(3) | | | | | | | 100 | | | | 110,375 | |
Zekelman Industries, Inc., 9.875%, 6/15/23(3) | | | | | | | 15 | | | | 16,988 | |
| | | | | | | | | | | | | |
| | | | | | | | | | $ | 5,574,037 | |
| | | | | | | | | | | | | |
|
Multi-Utilities — 0.4% | |
Dominion Resources, Inc., 5.75% to 10/1/24, 10/1/54(5) | | | | | | | 114 | | | $ | 119,843 | |
Thames Water Kemble Finance PLC, 5.875%, 7/15/22(7) | | | GBP | | | | 900 | | | | 1,293,625 | |
| | | | | | | | | | | | | |
| | | | | | | | | | $ | 1,413,468 | |
| | | | | | | | | | | | | |
|
Multiline Retail — 0.2% | |
Dollar Tree, Inc., 5.25%, 3/1/20 | | | | | | | 500 | | | $ | 515,000 | |
Dollar Tree, Inc., 5.75%, 3/1/23 | | | | | | | 330 | | | | 351,780 | |
| | | | | | | | | | | | | |
| | | | | | | | | | $ | 866,780 | |
| | | | | | | | | | | | | |
|
Oil, Gas & Consumable Fuels — 2.6% | |
AmeriGas Partners, L.P./AmeriGas Finance Corp., 5.50%, 5/20/25 | | | | | | | 175 | | | $ | 177,625 | |
AmeriGas Partners, L.P./AmeriGas Finance Corp., 5.625%, 5/20/24 | | | | | | | 40 | | | | 40,900 | |
| | | | |
| | 19 | | See Notes to Financial Statements. |
Global Income Builder Portfolio
April 30, 2017
Portfolio of Investments (Unaudited) — continued
| | | | | | | | | | | | |
| Security | | | | | Principal Amount* (000’s omitted) | | | Value | |
| | | | | | | | | | | | |
|
Oil, Gas & Consumable Fuels (continued) | |
AmeriGas Partners, L.P./AmeriGas Finance Corp., 5.75%, 5/20/27 | | | | | | | 100 | | | $ | 100,750 | |
AmeriGas Partners, L.P./AmeriGas Finance Corp., 5.875%, 8/20/26 | | | | | | | 85 | | | | 86,700 | |
Antero Resources Corp., 5.375%, 11/1/21 | | | | | | | 1,000 | | | | 1,036,250 | |
Canbriam Energy, Inc.,
9.75%, 11/15/19(3) | | | | | | | 305 | | | | 321,775 | |
Chesapeake Energy Corp., 8.00%, 12/15/22(3) | | | | | | | 65 | | | | 68,737 | |
Continental Resources, Inc., 4.50%, 4/15/23 | | | | | | | 145 | | | | 143,550 | |
CVR Refining, LLC/Coffeyville Finance, Inc., 6.50%, 11/1/22 | | | | | | | 210 | | | | 214,200 | |
Denbury Resources, Inc.,
9.00%, 5/15/21(3) | | | | | | | 260 | | | | 275,600 | |
Diamondback Energy, Inc., 4.75%, 11/1/24(3) | | | | | | | 60 | | | | 60,450 | |
Diamondback Energy, Inc., 5.375%, 5/31/25(3) | | | | | | | 155 | | | | 161,200 | |
Endeavor Energy Resources, L.P./EER Finance, Inc., 7.00%, 8/15/21(3) | | | | | | | 40 | | | | 41,800 | |
Endeavor Energy Resources, L.P./EER Finance, Inc., 8.125%, 9/15/23(3) | | | | | | | 500 | | | | 535,000 | |
EP Energy, LLC/Everest Acquisition Finance, Inc., 8.00%, 11/29/24(3) | | | | | | | 110 | | | | 115,637 | |
Extraction Oil & Gas Holdings, LLC/Extraction Finance Corp., 7.875%, 7/15/21(3) | | | | | | | 208 | | | | 218,920 | |
Great Western Petroleum, LLC/Great Western Finance Corp., 9.00%, 9/30/21(3) | | | | | | | 245 | | | | 254,800 | |
Gulfport Energy Corp., 6.00%, 10/15/24(3) | | | | | | | 340 | | | | 336,600 | |
Gulfport Energy Corp., 6.625%, 5/1/23 | | | | | | | 750 | | | | 763,125 | |
Halcon Resources Corp.,
6.75%, 2/15/25(3) | | | | | | | 230 | | | | 221,950 | |
Murphy Oil Corp., 6.875%, 8/15/24 | | | | | | | 55 | | | | 58,713 | |
Murphy Oil USA, Inc., 5.625%, 5/1/27 | | | | | | | 65 | | | | 66,787 | |
Murphy Oil USA, Inc., 6.00%, 8/15/23 | | | | | | | 500 | | | | 527,500 | |
Newfield Exploration Co., 5.375%, 1/1/26 | | | | | | | 45 | | | | 47,419 | |
Newfield Exploration Co., 5.625%, 7/1/24 | | | | | | | 65 | | | | 69,022 | |
Noble Holding International, Ltd., 7.75%, 1/15/24 | | | | | | | 160 | | | | 146,800 | |
Oasis Petroleum, Inc., 6.50%, 11/1/21 | | | | | | | 50 | | | | 50,750 | |
Oasis Petroleum, Inc., 6.875%, 3/15/22 | | | | | | | 45 | | | | 45,788 | |
Oasis Petroleum, Inc., 6.875%, 1/15/23 | | | | | | | 235 | | | | 238,525 | |
Odebrecht Oil & Gas Finance, Ltd., 7.00% to 6/17/24(3)(5)(8)(11) | | | | | | | 783 | | | | 84,172 | |
Parsley Energy, LLC/Parsley Finance Corp., 5.25%, 8/15/25(3) | | | | | | | 75 | | | | 75,937 | |
Parsley Energy, LLC/Parsley Finance Corp., 5.375%, 1/15/25(3) | | | | | | | 140 | | | | 142,100 | |
Parsley Energy, LLC/Parsley Finance Corp., 6.25%, 6/1/24(3) | | | | | | | 150 | | | | 159,375 | |
PBF Holding Co., LLC/PBF Finance Corp., 7.00%, 11/15/23 | | | | | | | 50 | | | | 51,000 | |
PDC Energy, Inc., 6.125%, 9/15/24(3) | | | | | | | 40 | | | | 41,200 | |
Peabody Energy Corp., 6.00%, 3/31/22(3) | | | | | | | 65 | | | | 66,544 | |
| | | | | | | | | | | | |
| Security | | | | | Principal Amount* (000’s omitted) | | | Value | |
| | | | | | | | | | | | |
|
Oil, Gas & Consumable Fuels (continued) | |
Peabody Energy Corp.,
6.375%, 3/31/25(3) | | | | | | | 80 | | | $ | 81,700 | |
Petrobras Global Finance BV, 6.125%, 1/17/22 | | | | | | | 342 | | | | 359,220 | |
Precision Drilling Corp., 6.50%, 12/15/21 | | | | | | | 25 | | | | 25,438 | |
Precision Drilling Corp., 6.625%, 11/15/20 | | | | | | | 18 | | | | 18,299 | |
Precision Drilling Corp.,
7.75%, 12/15/23(3) | | | | | | | 10 | | | | 10,650 | |
Resolute Energy Corp., 8.50%, 5/1/20 | | | | | | | 80 | | | | 81,800 | |
Rice Energy, Inc., 7.25%, 5/1/23 | | | | | | | 80 | | | | 86,800 | |
Seven Generations Energy, Ltd., 6.75%, 5/1/23(3) | | | | | | | 25 | | | | 26,625 | |
Seven Generations Energy, Ltd., 8.25%, 5/15/20(3) | | | | | | | 1,000 | | | | 1,050,000 | |
SM Energy Co., 5.625%, 6/1/25 | | | | | | | 85 | | | | 81,600 | |
SM Energy Co., 6.125%, 11/15/22 | | | | | | | 135 | | | | 137,700 | |
SM Energy Co., 6.75%, 9/15/26 | | | | | | | 80 | | | | 81,000 | |
Southwestern Energy Co., 5.80%, 1/23/20 | | | | | | | 145 | | | | 147,175 | |
Southwestern Energy Co., 7.50%, 2/1/18 | | | | | | | 17 | | | | 17,786 | |
Trinidad Drilling, Ltd., 6.625%, 2/15/25(3) | | | | | | | 95 | | | | 95,950 | |
Weatherford International, Ltd., 8.25%, 6/15/23 | | | | | | | 40 | | | | 43,450 | |
Weatherford International, Ltd., 9.875%, 2/15/24(3) | | | | | | | 95 | | | | 111,150 | |
Whiting Petroleum Corp., 5.00%, 3/15/19 | | | | | | | 45 | | | | 45,675 | |
Whiting Petroleum Corp., 5.75%, 3/15/21 | | | | | | | 25 | | | | 25,000 | |
WildHorse Resource Development Corp., 6.875%, 2/1/25(3) | | | | | | | 270 | | | | 259,875 | |
WPX Energy, Inc., 7.50%, 8/1/20 | | | | | | | 95 | | | | 101,175 | |
| | | | | | | | | | | | | |
| | | | | | | | | | $ | 9,935,269 | |
| | | | | | | | | | | | | |
|
Pharmaceuticals — 0.4% | |
inVentiv Group Holdings, Inc./inVentiv Health, Inc./inVentiv Health Clinical, Inc., 7.50%, 10/1/24(3) | | | | | | | 285 | | | $ | 295,687 | |
Nature’s Bounty Co. (The), 7.625%, 5/15/21(3) | | | | | | | 225 | | | | 239,625 | |
PRA Holdings, Inc., 9.50%, 10/1/23(3) | | | | | | | 80 | | | | 88,800 | |
Valeant Pharmaceuticals International, Inc., 5.875%, 5/15/23(3) | | | | | | | 130 | | | | 96,688 | |
Valeant Pharmaceuticals International, Inc.,
6.375%, 10/15/20(3) | | | | | | | 235 | | | | 202,981 | |
Valeant Pharmaceuticals International, Inc., 6.50%, 3/15/22(3) | | | | | | | 195 | | | | 200,119 | |
Valeant Pharmaceuticals International, Inc., 6.75%, 8/15/18(3) | | | | | | | 5 | | | | 4,997 | |
Valeant Pharmaceuticals International, Inc., 7.00%, 3/15/24(3) | | | | | | | 275 | | | | 281,187 | |
Vizient, Inc., 10.375%, 3/1/24(3) | | | | | | | 50 | | | | 57,375 | |
| | | | | | | | | | | | | |
| | | | | | | | | | $ | 1,467,459 | |
| | | | | | | | | | | | | |
|
Pipelines — 0.6% | |
Antero Midstream Partners L.P./Antero Midstream Finance Corp., 5.375%, 9/15/24(3) | | | | | | | 80 | | | $ | 82,200 | |
| | | | |
| | 20 | | See Notes to Financial Statements. |
Global Income Builder Portfolio
April 30, 2017
Portfolio of Investments (Unaudited) — continued
| | | | | | | | | | | | |
| Security | | | | | Principal Amount* (000’s omitted) | | | Value | |
| | | | | | | | | | | | |
|
Pipelines (continued) | |
Cheniere Corpus Christi Holdings, LLC, 5.875%, 3/31/25(3) | | | | | | | 230 | | | $ | 245,812 | |
Cheniere Corpus Christi Holdings, LLC, 7.00%, 6/30/24(3) | | | | | | | 170 | | | | 190,805 | |
Energy Transfer Equity, L.P., 5.875%, 1/15/24 | | | | | | | 20 | | | | 21,650 | |
Holly Energy Partners, L.P./Holly Energy Finance Corp., 6.00%, 8/1/24(3) | | | | | | | 60 | | | | 63,750 | |
Tesoro Logistics, L.P./Tesoro Logistics Finance Corp., 6.25%, 10/15/22 | | | | | | | 1,000 | | | | 1,077,500 | |
Tesoro Logistics, L.P./Tesoro Logistics Finance Corp., 6.375%, 5/1/24 | | | | | | | 105 | | | | 115,237 | |
Williams Cos., Inc. (The), 3.70%, 1/15/23 | | | | | | | 230 | | | | 227,700 | |
Williams Cos., Inc. (The), 4.55%, 6/24/24 | | | | | | | 125 | | | | 128,594 | |
Williams Cos., Inc. (The), 5.75%, 6/24/44 | | | | | | | 140 | | | | 145,600 | |
Williams Partners, L.P./ACMP Finance Corp., 4.875%, 3/15/24 | | | | | | | 120 | | | | 124,800 | |
| | | | | | | | | | | | | |
| | | | | | | | | | $ | 2,423,648 | |
| | | | | | | | | | | | | |
|
Real Estate Investment Trusts (REITs) — 0.1% | |
ESH Hospitality, Inc., 5.25%, 5/1/25(3) | | | | | | | 160 | | | $ | 162,400 | |
Greystar Real Estate Partners, LLC, 8.25%, 12/1/22(3) | | | | | | | 35 | | | | 37,975 | |
Mattamy Group Corp., 6.875%, 12/15/23(3) | | | | | | | 285 | | | | 297,113 | |
William Lyon Homes, Inc., 5.875%, 1/31/25(3) | | | | | | | 60 | | | | 61,650 | |
| | | | | | | | | | | | | |
| | | | | | | | | | $ | 559,138 | |
| | | | | | | | | | | | | |
|
Retail-Food and Drug — 0.3% | |
Rite Aid Corp., 6.125%, 4/1/23(3) | | | | | | | 1,000 | | | $ | 995,000 | |
| | | | | | | | | | | | | |
| | | | | | | | | | $ | 995,000 | |
| | | | | | | | | | | | | |
|
Semiconductors & Semiconductor Equipment — 0.3% | |
Micron Technology, Inc., 5.25%, 8/1/23(3) | | | | | | | 55 | | | $ | 57,200 | |
Microsemi Corp., 9.125%, 4/15/23(3) | | | | | | | 575 | | | | 664,125 | |
NXP B.V./NXP Funding, LLC, 4.125%, 6/1/21(3) | | | | | | | 200 | | | | 209,750 | |
Versum Materials, Inc., 5.50%, 9/30/24(3) | | | | | | | 145 | | | | 150,981 | |
| | | | | | | | | | | | | |
| | | | | | | | | | $ | 1,082,056 | |
| | | | | | | | | | | | | |
|
Software — 0.9% | |
Camelot Finance S.A., 7.875%, 10/15/24(3) | | | | | | | 130 | | | $ | 139,750 | |
Infor (US), Inc., 5.75%, 8/15/20(3) | | | | | | | 160 | | | | 167,300 | |
Infor (US), Inc., 5.75%, 5/15/22 | | | EUR | | | | 1,025 | | | | 1,156,727 | |
Rackspace Hosting, Inc., 8.625%, 11/15/24(3) | | | | | | | 130 | | | | 137,963 | |
Solera, LLC/Solera Finance, Inc., 10.50%, 3/1/24(3) | | | | | | | 545 | | | | 624,706 | |
SS&C Technologies Holdings, Inc., 5.875%, 7/15/23 | | | | | | | 775 | | | | 827,312 | |
Symantec Corp., 5.00%, 4/15/25(3) | | | | | | | 115 | | | | 119,169 | |
| | | | | | | | | | | | |
| Security | | | | | Principal Amount* (000’s omitted) | | | Value | |
| | | | | | | | | | | | |
|
Software (continued) | |
Veritas US, Inc./Veritas Bermuda, Ltd., 7.50%, 2/1/23(3) | | | | | | | 260 | | | $ | 274,950 | |
| | | | | | | | | | | | | |
| | | | | | | | | | $ | 3,447,877 | |
| | | | | | | | | | | | | |
|
Specialty Retail — 0.1% | |
Hot Topic, Inc., 9.25%, 6/15/21(3) | | | | | | | 270 | | | $ | 276,075 | |
| | | | | | | | | | | | | |
| | | | | | | | | | $ | 276,075 | |
| | | | | | | | | | | | | |
|
Technology Hardware, Storage & Peripherals — 0.6% | |
Dell International, LLC/EMC Corp., 5.45%, 6/15/23(3) | | | | | | | 135 | | | $ | 146,008 | |
Dell International, LLC/EMC Corp., 5.875%, 6/15/21(3) | | | | | | | 205 | | | | 217,813 | |
Dell International, LLC/EMC Corp., 6.02%, 6/15/26(3) | | | | | | | 355 | | | | 391,711 | |
Dell International, LLC/EMC Corp., 7.125%, 6/15/24(3) | | | | | | | 215 | | | | 237,762 | |
Western Digital Corp., 7.375%, 4/1/23(3) | | | | | | | 590 | | | | 647,525 | |
Western Digital Corp., 10.50%, 4/1/24 | | | | | | | 475 | | | | 561,687 | |
| | | | | | | | | | | | | |
| | | | | | | | | | $ | 2,202,506 | |
| | | | | | | | | | | | | |
|
Telecommunications — 1.5% | |
Avaya, Inc., 9.00%, 4/1/19(3)(11) | | | | | | | 400 | | | $ | 338,000 | |
Colombia Telecomunicaciones SA ESP, 8.50% to 3/30/20(3)(5)(8) | | | | | | | 204 | | | | 204,000 | |
eircom Finance DAC,
4.50%, 5/31/22(7) | | | EUR | | | | 276 | | | | 315,003 | |
Hughes Satellite Systems Corp., 5.25%, 8/1/26(3) | | | | | | | 145 | | | | 147,900 | |
Hughes Satellite Systems Corp., 6.625%, 8/1/26(3) | | | | | | | 195 | | | | 200,850 | |
Impera Holdings SA, 5.375%, 9/15/22(7)(10) | | | EUR | | | | 695 | | | | 780,300 | |
Intelsat Jackson Holdings S.A., 5.50%, 8/1/23 | | | | | | | 45 | | | | 38,644 | |
Intelsat Jackson Holdings S.A., 7.25%, 10/15/20 | | | | | | | 85 | | | | 80,002 | |
Intelsat Jackson Holdings S.A., 8.00%, 2/15/24(3) | | | | | | | 200 | | | | 216,250 | |
Sprint Capital Corp., 6.875%, 11/15/28 | | | | | | | 80 | | | | 87,000 | |
Sprint Corp., 7.875%, 9/15/23 | | | | | | | 1,800 | | | | 2,025,000 | |
T-Mobile USA, Inc., 6.625%, 4/1/23 | | | | | | | 1,025 | | | | 1,098,031 | |
| | | | | | | | | | | | | |
| | | | | | | | | | $ | 5,530,980 | |
| | | | | | | | | | | | | |
|
Textiles, Apparel & Luxury Goods — 0.1% | |
BiSoho SAS, 5.875%, 5/1/23(7) | | | EUR | | | | 405 | | | $ | 477,411 | |
| | | | | | | | | | | | | |
| | | | | | | | | | $ | 477,411 | |
| | | | | | | | | | | | | |
|
Thrifts & Mortgage Finance — 0.1% | |
Flagstar Bancorp, Inc., 6.125%, 7/15/21 | | | | | | | 235 | | | $ | 251,840 | |
| | | | | | | | | | | | | |
| | | | | | | | | | $ | 251,840 | |
| | | | | | | | | | | | | |
|
Transportation — 0.2% | |
Watco Cos., LLC/Watco Finance Corp., 6.375%, 4/1/23(3) | | | | | | | 260 | | | $ | 270,400 | |
| | | | |
| | 21 | | See Notes to Financial Statements. |
Global Income Builder Portfolio
April 30, 2017
Portfolio of Investments (Unaudited) — continued
| | | | | | | | | | | | |
| Security | | | | | Principal Amount* (000’s omitted) | | | Value | |
| | | | | | | | | | | | |
|
Transportation (continued) | |
XPO Logistics, Inc., 6.125%, 9/1/23(3) | | | | | | | 80 | | | $ | 84,300 | |
XPO Logistics, Inc., 6.50%, 6/15/22(3) | | | | | | | 500 | | | | 531,250 | |
| | | | | | | | | | | | | |
| | | | | | | | | | $ | 885,950 | |
| | | | | | | | | | | | | |
| |
Total Corporate Bonds & Notes
(identified cost $109,266,267) | | | $ | 114,084,758 | |
| | | | | | | | | | | | | |
|
| Senior Floating-Rate Loans — 0.9%(12) | |
| | | |
| | | | | | | | | | | | |
| Borrower/Tranche Description | | | | | Principal Amount (000’s omitted) | | | Value | |
|
Electronics / Electrical — 0.1% | |
Cortes NP Acquisition Corporation, Term Loan, 5.03%, Maturing 11/30/23 | | | | | | $ | 135 | | | $ | 136,532 | |
Misys Europe S.A., Term Loan, Maturing 4/27/24(13) | | | | | | | 100 | | | | 99,500 | |
Solera, LLC, Term Loan, 4.25%, Maturing 3/3/23 | | | | | | | 190 | | | | 191,062 | |
| | | | | | | | | | | | | |
| | | | | | | | | | $ | 427,094 | |
| | | | | | | | | | | | | |
|
Financial Intermediaries — 0.1% | |
Lonestar Intermediate Super Holdings, LLC, Term Loan, 10.00%, (10.00% Cash, 0.00% PIK), Maturing 8/31/21 | | | | | | $ | 300 | | | $ | 312,375 | |
| | | | | | | | | | | | | |
| | | | | | | | | | $ | 312,375 | |
| | | | | | | | | | | | | |
|
Health Care — 0.4% | |
inVentiv Health, Inc., Term Loan, 4.80%, Maturing 11/9/23 | | | | | | $ | 190 | | | $ | 190,902 | |
MPH Acquisition Holdings, LLC, Term Loan, 4.90%, Maturing 6/7/23 | | | | | | | 912 | | | | 925,026 | |
Press Ganey Holdings, Inc., Term Loan, 4.25%, Maturing 10/21/23 | | | | | | | 190 | | | | 189,940 | |
Press Ganey Holdings, Inc., Term Loan - Second Lien, 8.25%, Maturing 10/21/24 | | | | | | | 135 | | | | 138,037 | |
| | | | | | | | | | | | | |
| | | | | | | | | | $ | 1,443,905 | |
| | | | | | | | | | | | | |
|
Nonferrous Metals / Minerals — 0.1% | |
Peabody Energy Corporation, Term Loan, 5.50%, Maturing 3/31/22 | | | | | | $ | 185 | | | $ | 185,848 | |
| | | | | | | | | | | | | |
| | | | | | | | | | $ | 185,848 | |
| | | | | | | | | | | | | |
|
Oil and Gas — 0.1% | |
Chesapeake Energy Corporation, Term Loan, 8.55%, Maturing 8/23/21 | | | | | | $ | 365 | | | $ | 394,960 | |
| | | | | | | | | | | | | |
| | | | | | | | | | $ | 394,960 | |
| | | | | | | | | | | | | |
| | | | | | | | | | | | |
| Borrower/Tranche Description | | | | | Principal Amount (000’s omitted) | | | Value | |
| | | | | | | | | | | | |
|
Publishing — 0.1% | |
McGraw-Hill Global Education Holdings, LLC, Term Loan, 5.00%, Maturing 5/4/22 | | | | | | $ | 520 | | | $ | 514,877 | |
| | | | | | | | | | | | | |
| | | | | | | | | | $ | 514,877 | |
| | | | | | | | | | | | | |
| |
Total Senior Floating-Rate Loans
(identified cost $3,230,473) | | | $ | 3,279,059 | |
| | | | | | | | | | | | | |
|
| Convertible Bonds — 0.1% | |
| | | |
| | | | | | | | | | | | |
| Security | | | | | Principal Amount (000’s omitted) | | | Value | |
|
Utilities — 0.1% | |
NRG Yield, Inc., 3.25%, 6/1/20(3) | | | | | | $ | 300 | | | $ | 296,438 | |
| | | | | | | | | | | | | |
| |
Total Convertible Bonds
(identified cost $281,942) | | | $ | 296,438 | |
| | | | | | | | | | | | | |
|
| Exchange-Traded Funds — 0.2% | |
| | | |
| | | | | | | | | | | | |
| Security | | | | | Shares | | | Value | |
|
Equity Funds — 0.2% | |
iShares U.S. Preferred Stock ETF | | | | | | | 17,000 | | | $ | 663,170 | |
| | | | | | | | | | | | | |
| |
Total Exchange-Traded Funds
(identified cost $662,613) | | | $ | 663,170 | |
| | | | | | | | | | | | | |
|
| Short-Term Investments — 0.7% | |
| | | |
| | | | | | | | | | | | |
| Description | | | | | Units | | | Value | |
Eaton Vance Cash Reserves Fund, LLC, 1.07%(14) | | | | | | | 2,778,710 | | | $ | 2,779,543 | |
| | | | | | | | | | | | | |
| |
Total Short-Term Investments
(identified cost $2,779,443) | | | $ | 2,779,543 | |
| | | | | | | | | | | | | |
| |
Total Investments — 96.8%
(identified cost $348,532,229) | | | $ | 368,889,701 | |
| | | | | | | | | | | | | |
| |
Other Assets, Less Liabilities — 3.2% | | | $ | 12,186,061 | |
| | | | | | | | | | | | | |
| | | |
Net Assets — 100.0% | | | | | | | | | | $ | 381,075,762 | |
| | | | | | | | | | | | | |
The percentage shown for each investment category in the Portfolio of Investments is based on net assets.
| | * | In U.S. dollars unless otherwise indicated. |
| | (1) | Non-income producing security. |
| | | | |
| | 22 | | See Notes to Financial Statements. |
Global Income Builder Portfolio
April 30, 2017
Portfolio of Investments (Unaudited) — continued
| | (2) | Security was acquired in a private offering and may be resold on a designated offshore securities market pursuant to Regulation S under the Securities Act of 1933. |
| | (3) | Security exempt from registration pursuant to Rule 144A under the Securities Act of 1933, as amended. These securities may be sold in certain transactions in reliance on an exemption from registration (normally to qualified institutional buyers). At April 30, 2017, the aggregate value of these securities is $49,883,522 or 13.1% of the Portfolio’s net assets. |
| | (4) | Security (or a portion thereof) has been pledged to cover margin requirements on open financial futures contracts. |
| | (5) | Security converts to floating rate after the indicated fixed-rate coupon period. |
| | (6) | Amount is less than 0.05%. |
| | (7) | Security exempt from registration under Regulation S of the Securities Act of 1933, which exempts from registration securities offered and sold outside the United States. Security may not be offered or sold in the United States except pursuant to an exemption from, or in a transaction not subject to, the registration requirements of the Securities Act of 1933. At April 30, 2017, the aggregate value of these securities is $23,498,695 or 6.2% of the Portfolio’s net assets. |
| | (8) | Perpetual security with no stated maturity date but may be subject to calls by the issuer. |
| | (9) | When-issued security. |
| (10) | Represents a payment-in-kind security which may pay interest in additional principal at the issuer’s discretion. For corporate bonds, the interest rate paid in additional principal is generally higher than the indicated cash rate. |
| (11) | Defaulted security. Issuer has defaulted on the payment of interest and/or principal. |
| (12) | Senior floating-rate loans (Senior Loans) often require prepayments from excess cash flows or permit the borrowers to repay at their election. The degree to which borrowers repay, whether as a contractual requirement or at their election, cannot be predicted with accuracy. As a result, the actual remaining maturity may be substantially less than the stated maturities shown. However, Senior Loans will typically have an expected average life of approximately two to four years. The stated interest rate represents the weighted average interest rate of all contracts within the senior loan facility and includes commitment fees on unfunded loan commitments, if any. Senior Loans typically have rates of interest which are redetermined either daily, monthly, quarterly or semi-annually by reference to a base lending rate, plus a premium. These base lending rates are primarily the London Interbank Offered Rate (“LIBOR”) and secondarily, the prime rate offered by one or more major United States banks (the “Prime Rate”) and the certificate of deposit (“CD”) rate or other base lending rates used by commercial lenders. |
| (13) | This Senior Loan will settle after April 30, 2017, at which time the interest rate will be determined. |
| (14) | Affiliated investment company, available to Eaton Vance portfolios and funds, which invests in high quality, U.S. dollar denominated money market instruments. The rate shown is the annualized seven-day yield as of April 30, 2017. |
| | | | | | | | |
| Country Concentration of Portfolio | |
| | |
| | | | | | | | |
| Country | | Percentage of Total Investments | | | Value | |
United States | | | 49.5 | % | | $ | 182,681,711 | |
United Kingdom | | | 10.1 | | | | 37,212,903 | |
France | | | 7.7 | | | | 28,272,313 | |
Germany | | | 6.8 | | | | 25,183,084 | |
Italy | | | 4.3 | | | | 15,708,404 | |
Canada | | | 3.0 | | | | 11,134,336 | |
Switzerland | | | 2.3 | | | | 8,543,641 | |
Japan | | | 1.8 | | | | 6,593,546 | |
Netherlands | | | 1.6 | | | | 5,988,813 | |
Sweden | | | 1.4 | | | | 5,197,337 | |
Spain | | | 1.3 | | | | 4,883,004 | |
Ireland | | | 1.3 | | | | 4,706,475 | |
Luxembourg | | | 1.2 | | | | 4,524,712 | |
Denmark | | | 1.1 | | | | 4,156,873 | |
Finland | | | 0.8 | | | | 3,050,490 | |
Hong Kong | | | 0.8 | | | | 2,944,427 | |
Belgium | | | 0.8 | | | | 2,930,518 | |
Norway | | | 0.7 | | | | 2,717,216 | |
Australia | | | 0.6 | | | | 2,157,378 | |
Portugal | | | 0.6 | | | | 2,084,416 | |
Poland | | | 0.5 | | | | 1,775,336 | |
Brazil | | | 0.4 | | | | 1,423,513 | |
China | | | 0.3 | | | | 1,140,257 | |
New Zealand | | | 0.2 | | | | 839,641 | |
Romania | | | 0.2 | | | | 826,791 | |
Israel | | | 0.2 | | | | 790,484 | |
Chile | | | 0.2 | | | | 554,912 | |
Colombia | | | 0.1 | | | | 204,000 | |
Exchange-Traded Funds | | | 0.2 | | | | 663,170 | |
| | | | | | | | | |
Total Investments | | | 100.0 | % | | $ | 368,889,701 | |
| | | | | | | | | |
| | | | | | | | | | | | | | | | | | | | | | | | |
| Forward Foreign Currency Exchange Contracts | |
| Currency Purchased | | | Currency Sold | | | Counterparty | | Settlement Date | | | Unrealized Appreciation | | | Unrealized (Depreciation) | |
| | | | | | | |
| EUR | | | 575,000 | | | USD | | | 625,646 | | | State Street Bank and Trust Company | | | 5/5/17 | | | $ | 763 | | | $ | — | |
| GBP | | | 450,000 | | | USD | | | 580,588 | | | State Street Bank and Trust Company | | | 5/5/17 | | | | 2,285 | | | | — | |
| | | | | | | |
| | | | | | | | | | | | | | | | | | | $ | 3,048 | | | $ | — | |
| | | | |
| | 23 | | See Notes to Financial Statements. |
Global Income Builder Portfolio
April 30, 2017
Portfolio of Investments (Unaudited) — continued
| | | | | | | | | | | | | | | | | | | | | | | | |
| Futures Contracts | |
| Description | | Contracts | | | Position | | | Expiration Month/Year | | | Aggregate Cost | | | Value | | | Net Unrealized Appreciation
(Depreciation) | |
| | | | | | |
Equity Futures | | | | | | | | | | | | | | | | | | | | | | | | |
| CAC 40 Index | | | 130 | | | | Short | | | | May-17 | | | $ | (7,080,106 | ) | | $ | (7,386,652 | ) | | $ | (306,546 | ) |
| E-mini Health Care Select Sector Index | | | 48 | | | | Long | | | | Jun-17 | | | | 3,583,394 | | | | 3,630,720 | | | | 47,326 | |
| E-mini S&P 500 Index | | | 352 | | | | Long | | | | Jun-17 | | | | 41,717,562 | | | | 41,896,800 | | | | 179,238 | |
| E-mini Technology Select Sector Index | | | 57 | | | | Long | | | | Jun-17 | | | | 3,028,311 | | | | 3,107,070 | | | | 78,759 | |
| Nikkei 225 Index | | | 34 | | | | Long | | | | Jun-17 | | | | 5,776,272 | | | | 5,864,986 | | | | 88,714 | |
| STOXX Europe 600 Banks Index | | | 555 | | | | Short | | | | Jun-17 | | | | (5,268,912 | ) | | | (5,487,024 | ) | | | (218,112 | ) |
| STOXX Europe 600 Banks Index | | | 1,059 | | | | Short | | | | Jun-17 | | | | (21,189,263 | ) | | | (22,122,213 | ) | | | (932,950 | ) |
| STOXX Europe 600 Insurance Index | | | 813 | | | | Short | | | | Jun-17 | | | | (11,772,554 | ) | | | (12,134,122 | ) | | | (361,568 | ) |
| STOXX Europe 600 Utilities Index | | | 534 | | | | Short | | | | Jun-17 | | | | (8,197,992 | ) | | | (8,231,802 | ) | | | (33,810 | ) |
| | | | | | |
| | | | | | | | | | | | | | | | | | | | | | | $ | (1,458,949 | ) |
CAC 40 Index: Cotation Assistée en Continu Index comprised of the 40 largest companies listed on the Euronext Paris.
Nikkei 225 Index: Price-weighted average of 225 top-rated Japanese companies listed in the First Section of the Tokyo Stock Exchange.
STOXX Europe 600 Banks Index: Index composed of companies from the European banks sector.
STOXX Europe 600 Insurance Index: Index composed of companies from the European insurance sector.
STOXX Europe 600 Utilities Index: Index composed of companies from the European utilities sector.
Abbreviations:
| | | | |
| PC | | – | | Participation Certificate |
| PIK | | – | | Payment In Kind |
Currency Abbreviations:
| | | | |
| CHF | | – | | Swiss Franc |
| EUR | | – | | Euro |
| GBP | | – | | British Pound Sterling |
| USD | | – | | United States Dollar |
| | | | |
| | 24 | | See Notes to Financial Statements. |
Global Income Builder Portfolio
April 30, 2017
Statement of Assets and Liabilities (Unaudited)
| | | | |
| Assets | | April 30, 2017 | |
Unaffiliated investments, at value (identified cost, $345,752,786) | | $ | 366,110,158 | |
Affiliated investment, at value (identified cost, $2,779,443) | | | 2,779,543 | |
Cash | | | 320,306 | |
Restricted cash* | | | 5,984,194 | |
Foreign currency, at value (identified cost, $4,372,308) | | | 4,414,506 | |
Interest and dividends receivable | | | 2,379,906 | |
Dividends receivable from affiliated investment | | | 1,252 | |
Receivable for investments sold | | | 1,738,249 | |
Receivable for open forward foreign currency exchange contracts | | | 3,048 | |
Tax reclaims receivable | | | 1,691,938 | |
Total assets | | $ | 385,423,100 | |
| |
| Liabilities | | | | |
Payable for investments purchased | | $ | 2,130,646 | |
Payable for when-issued securities | | | 1,664,487 | |
Payable for capital withdrawals | | | 27,568 | |
Payable for variation margin on open financial futures contracts | | | 166,063 | |
Payable to affiliates: | | | | |
Investment adviser fee | | | 202,441 | |
Trustees’ fees | | | 1,888 | |
Accrued expenses | | | 154,245 | |
Total liabilities | | $ | 4,347,338 | |
Net Assets applicable to investors’ interest in Portfolio | | $ | 381,075,762 | |
| |
| Sources of Net Assets | | | | |
Investors’ capital | | $ | 362,123,151 | |
Net unrealized appreciation | | | 18,952,611 | |
Total | | $ | 381,075,762 | |
| * | Represents restricted cash on deposit at the broker as collateral for open financial futures contracts. |
| | | | |
| | 25 | | See Notes to Financial Statements. |
Global Income Builder Portfolio
April 30, 2017
Statement of Operations (Unaudited)
| | | | |
| Investment Income | | Six Months Ended April 30, 2017 | |
Dividends (net of foreign taxes, $1,180,495) | | $ | 5,166,633 | |
Interest (net of foreign taxes, $8,163) | | | 3,743,510 | |
Other income | | | 249,078 | |
Dividends from affiliated investment | | | 16,403 | |
Total investment income | | $ | 9,175,624 | |
| |
| Expenses | | | | |
Investment adviser fee | | $ | 1,219,408 | |
Trustees’ fees and expenses | | | 11,492 | |
Custodian fee | | | 114,064 | |
Legal and accounting services | | | 35,397 | |
Miscellaneous | | | 52,570 | |
Total expenses | | $ | 1,432,931 | |
| |
Net investment income | | $ | 7,742,693 | |
| |
| Realized and Unrealized Gain (Loss) | | | | |
Net realized gain (loss) — | | | | |
Investment transactions | | $ | 10,976,340 | (1) |
Investment transactions — affiliated investment | | | 1,238 | |
Financial futures contracts | | | (128,020 | ) |
Foreign currency and forward foreign currency exchange contract transactions | | | (9,672 | ) |
Net realized gain | | $ | 10,839,886 | |
Change in unrealized appreciation (depreciation) — | | | | |
Investments | | $ | 14,200,647 | |
Investments — affiliated investment | | | (755 | ) |
Financial futures contracts | | | (1,458,949 | ) |
Foreign currency and forward foreign currency exchange contracts | | | 46,387 | |
Net change in unrealized appreciation (depreciation) | | $ | 12,787,330 | |
| |
Net realized and unrealized gain | | $ | 23,627,216 | |
| |
Net increase in net assets from operations | | $ | 31,369,909 | |
| (1) | Includes $417,316 of net realized gains from redemptions in-kind. |
| | | | |
| | 26 | | See Notes to Financial Statements. |
Global Income Builder Portfolio
April 30, 2017
Statements of Changes in Net Assets
| | | | | | | | |
| Increase (Decrease) in Net Assets | | Six Months Ended April 30, 2017
(Unaudited) | | | Period Ended October 31, 2016(1) | |
From operations — | | | | | | | | |
Net investment income | | $ | 7,742,693 | | | $ | 8,694,605 | |
Net realized gain from investment transactions, financial futures contracts, and foreign currency and forward foreign currency exchange contract transactions | | | 10,839,886 | (2) | | | 9,411,663 | (3) |
Net change in unrealized appreciation (depreciation) from investments, financial futures contracts, foreign currency and forward foreign currency exchange contracts | | | 12,787,330 | | | | (2,448,246 | ) |
Net increase in net assets from operations | | $ | 31,369,909 | | | $ | 15,658,022 | |
Capital transactions — | | | | | | | | |
Contributions | | $ | 13,491,504 | | | $ | 30,069,851 | |
Withdrawals | | | (40,628,851 | ) | | | (55,132,472 | ) |
Portfolio transaction fee | | | 145,078 | | | | 198,179 | |
Assets contributed by Eaton Vance Global Income Builder Fund | | | — | | | | 385,904,542 | |
Net increase (decrease) in net assets from capital transactions | | $ | (26,992,269 | ) | | $ | 361,040,100 | |
| | |
Net increase in net assets | | $ | 4,377,640 | | | $ | 376,698,122 | |
| | |
| Net Assets | | | | | | | | |
At beginning of period | | $ | 376,698,122 | | | $ | — | |
At end of period | | $ | 381,075,762 | | | $ | 376,698,122 | |
| (1) | For the period from the start of business, March 28, 2016, to October 31, 2016. |
| (2) | Includes $417,316 of net realized gains from redemptions in-kind. |
| (3) | Includes $6,101,499 of net realized gains from redemptions in-kind. |
| | | | |
| | 27 | | See Notes to Financial Statements. |
Global Income Builder Portfolio
April 30, 2017
Financial Highlights
| | | | | | | | |
| Ratios/Supplemental Data | | Six Months Ended April 30, 2017 (Unaudited) | | | Period Ended October 31, 2016(1) | |
Ratios (as a percentage of average daily net assets): | | | | | | | | |
Expenses | | | 0.76 | %(2) | | | 0.80 | %(2) |
Net investment income | | | 4.13 | %(2) | | | 3.75 | %(2) |
Portfolio Turnover | | | 71 | %(3) | | | 66 | %(3) |
| | |
Total Return | | | 8.77 | %(3) | | | 3.65 | %(3) |
| | |
Net assets, end of period (000’s omitted) | | $ | 381,076 | | | $ | 376,698 | |
| (1) | For the period from the start of business, March 28, 2016, to October 31, 2016. |
| | | | |
| | 28 | | See Notes to Financial Statements. |
Global Income Builder Portfolio
April 30, 2017
Notes to Financial Statements (Unaudited)
1 Significant Accounting Policies
Global Income Builder Portfolio (the Portfolio) is a Massachusetts business trust registered under the Investment Company Act of 1940, as amended (the 1940 Act), as a diversified, open-end management investment company. The Portfolio commenced operations on March 28, 2016. The Portfolio’s investment objective is to achieve total return. The Declaration of Trust permits the Trustees to issue interests in the Portfolio. At April 30, 2017, Eaton Vance Global Income Builder Fund and Eaton Vance Global Income Builder NextShares held an interest of 94.6% and 5.4%, respectively, in the Portfolio.
The following is a summary of significant accounting policies of the Portfolio. The policies are in conformity with accounting principles generally accepted in the United States of America (U.S. GAAP). The Portfolio is an investment company and follows accounting and reporting guidance in the Financial Accounting Standards Board (FASB) Accounting Standards Codification Topic 946.
A Investment Valuation — The following methodologies are used to determine the market value or fair value of investments.
Equity Securities. Equity securities listed on a U.S. securities exchange generally are valued at the last sale or closing price on the day of valuation or, if no sales took place on such date, at the mean between the closing bid and asked prices therefore on the exchange where such securities are principally traded. Equity securities listed on the NASDAQ Global or Global Select Market generally are valued at the NASDAQ official closing price. Unlisted or listed securities for which closing sales prices or closing quotations are not available are valued at the mean between the latest available bid and asked prices or, in the case of preferred equity securities that are not listed or traded in the over-the-counter market, by a third party pricing service that uses various techniques that consider factors including, but not limited to, prices or yields of securities with similar characteristics, benchmark yields, broker/dealer quotes, quotes of underlying common stock, issuer spreads, as well as industry and economic events.
Debt Obligations. Debt obligations are generally valued on the basis of valuations provided by third party pricing services, as derived from such services’ pricing models. Inputs to the models may include, but are not limited to, reported trades, executable bid and asked prices, broker/dealer quotations, prices or yields of securities with similar characteristics, interest rates, anticipated prepayments, benchmark curves or information pertaining to the issuer, as well as industry and economic events. The pricing services may use a matrix approach, which considers information regarding securities with similar characteristics to determine the valuation for a security. Short-term obligations purchased with a remaining maturity of sixty days or less for which a valuation from a third party pricing service is not readily available may be valued at amortized cost, which approximates fair value.
Senior Floating-Rate Loans. Interests in senior floating-rate loans (Senior Loans) for which reliable market quotations are readily available are valued generally at the average mean of bid and ask quotations obtained from a third party pricing service.
Derivatives. Financial futures contracts are valued at the closing settlement price established by the board of trade or exchange on which they are traded, with adjustments for fair valuation for certain foreign financial futures contracts as described below. Forward foreign currency exchange contracts are generally valued at the mean of the average bid and average asked prices that are reported by currency dealers to a third party pricing service at the valuation time. Such third party pricing service valuations are supplied for specific settlement periods and the Portfolio’s forward foreign currency exchange contracts are valued at an interpolated rate between the closest preceding and subsequent settlement period reported by the third party pricing service.
Foreign Securities, Financial Futures Contracts and Currencies. Foreign securities, financial futures contracts and currencies are valued in U.S. dollars, based on foreign currency exchange rate quotations supplied by a third party pricing service. The pricing service uses a proprietary model to determine the exchange rate. Inputs to the model include reported trades and implied bid/ask spreads. The daily valuation of exchange-traded foreign securities and certain exchange-traded foreign financial futures contracts generally is determined as of the close of trading on the principal exchange on which such securities and contracts trade. Events occurring after the close of trading on foreign exchanges may result in adjustments to the valuation of foreign securities and certain foreign financial futures contracts to more accurately reflect their fair value as of the close of regular trading on the New York Stock Exchange. When valuing foreign equity securities and foreign financial futures contracts that meet certain criteria, the Portfolio’s Trustees have approved the use of a fair value service that values such securities and foreign financial futures contracts to reflect market trading that occurs after the close of the applicable foreign markets of comparable securities or other instruments that have a strong correlation to the fair-valued securities and foreign financial futures contracts.
Affiliated Fund. The Portfolio may invest in Eaton Vance Cash Reserves Fund, LLC (Cash Reserves Fund), an affiliated investment company managed by Eaton Vance Management (EVM). While Cash Reserves Fund is not a registered money market mutual fund, it conducts all of its investment activities in accordance with the requirements of Rule 2a-7 under the 1940 Act. Investments in Cash Reserves Fund are valued at the closing net asset value per unit on the valuation day. Cash Reserves Fund generally values its investment securities based on available market quotations provided by a third party pricing service.
Fair Valuation. Investments for which valuations or market quotations are not readily available or are deemed unreliable are valued at fair value using methods determined in good faith by or at the direction of the Trustees of the Portfolio in a manner that fairly reflects the security’s value, or the amount that the Portfolio might reasonably expect to receive for the security upon its current sale in the ordinary course. Each such determination is based on a consideration of relevant factors, which are likely to vary from one pricing context to another. These factors may include, but are not limited to, the type of security, the existence of any contractual restrictions on the security’s disposition, the price and extent of public trading in similar securities of the issuer or of comparable companies or entities, quotations or relevant information obtained from broker/dealers or other market participants, information obtained from the issuer, analysts, and/or the appropriate stock exchange (for exchange-traded securities), an analysis of the company’s or entity’s financial condition, and an evaluation of the forces that influence the issuer and the market(s) in which the security is purchased and sold.
Global Income Builder Portfolio
April 30, 2017
Notes to Financial Statements (Unaudited) — continued
B Investment Transactions — Investment transactions for financial statement purposes are accounted for on a trade date basis. Realized gains and losses on investments sold are determined on the basis of identified cost.
C Income — Dividend income is recorded on the ex-dividend date for dividends received in cash and/or securities. However, if the ex-dividend date has passed, certain dividends from foreign securities are recorded as the Portfolio is informed of the ex-dividend date. Withholding taxes on foreign dividends, interest and capital gains have been provided for in accordance with the Portfolio’s understanding of the applicable countries’ tax rules and rates. In consideration of recent decisions rendered by European courts, the Portfolio has filed additional tax reclaims for previously withheld taxes on dividends earned in certain European Union countries. These filings are subject to various administrative and judicial proceedings within these countries. During the six months ended April 30, 2017, the Portfolio received approximately $249,000 from Poland for previously withheld foreign taxes and interest thereon. Such amount is reflected as Other income in the Statement of Operations. No other amounts for additional tax reclaims are reflected in the financial statements due to the uncertainty as to the ultimate resolution of proceedings, the likelihood of receipt of these reclaims, and the potential timing of payment. Interest income is recorded on the basis of interest accrued, adjusted for amortization of premium or accretion of discount. Distributions from investment companies are recorded as dividend income, capital gains or return of capital based on the nature of the distribution.
D Federal Taxes — The Portfolio has elected to be treated as a partnership for federal tax purposes. No provision is made by the Portfolio for federal or state taxes on any taxable income of the Portfolio because each investor in the Portfolio is ultimately responsible for the payment of any taxes on its share of taxable income. Since at least one of the Portfolio’s investors is a regulated investment company that invests all or substantially all of its assets in the Portfolio, the Portfolio normally must satisfy the applicable source of income and diversification requirements (under the Internal Revenue Code) in order for its investors to satisfy them. The Portfolio will allocate, at least annually among its investors, each investor’s distributive share of the Portfolio’s net investment income, net realized capital gains and losses and any other items of income, gain, loss, deduction or credit.
As of April 30, 2017, the Portfolio had no uncertain tax positions that would require financial statement recognition, de-recognition, or disclosure. The Portfolio files a U.S. federal income tax return annually after its fiscal year-end, which is subject to examination by the Internal Revenue Service for a period of three years from the date of filing.
E Foreign Currency Translation — Investment valuations, other assets, and liabilities initially expressed in foreign currencies are translated each business day into U.S. dollars based upon current exchange rates. Purchases and sales of foreign investment securities and income and expenses denominated in foreign currencies are translated into U.S. dollars based upon currency exchange rates in effect on the respective dates of such transactions. Recognized gains or losses on investment transactions attributable to changes in foreign currency exchange rates are recorded for financial statement purposes as net realized gains and losses on investments. That portion of unrealized gains and losses on investments that results from fluctuations in foreign currency exchange rates is not separately disclosed.
F Use of Estimates — The preparation of the financial statements in conformity with U.S. GAAP requires management to make estimates and assumptions that affect the reported amounts of assets and liabilities at the date of the financial statements and the reported amounts of income and expense during the reporting period. Actual results could differ from those estimates.
G Indemnifications — Under the Portfolio’s organizational documents, its officers and Trustees may be indemnified against certain liabilities and expenses arising out of the performance of their duties to the Portfolio. Under Massachusetts law, if certain conditions prevail, interestholders in the Portfolio could be deemed to have personal liability for the obligations of the Portfolio. However, the Portfolio’s Declaration of Trust contains an express disclaimer of liability on the part of Portfolio interestholders and the By-laws provide that the Portfolio shall assume the defense on behalf of any Portfolio interestholder. Moreover, the By-laws also provide for indemnification out of Portfolio property of any interestholder held personally liable solely by reason of being or having been an interestholder for all loss or expense arising from such liability. Additionally, in the normal course of business, the Portfolio enters into agreements with service providers that may contain indemnification clauses. The Portfolio’s maximum exposure under these arrangements is unknown as this would involve future claims that may be made against the Portfolio that have not yet occurred.
H Financial Futures Contracts — Upon entering into a financial futures contract, the Portfolio is required to deposit with the broker, either in cash or securities, an amount equal to a certain percentage of the contract amount (initial margin). Subsequent payments, known as variation margin, are made or received by the Portfolio each business day, depending on the daily fluctuations in the value of the underlying security or index, and are recorded as unrealized gains or losses by the Portfolio. Gains (losses) are realized upon the expiration or closing of the financial futures contracts. Should market conditions change unexpectedly, the Portfolio may not achieve the anticipated benefits of the financial futures contracts and may realize a loss. Futures contracts have minimal counterparty risk as they are exchange traded and the clearinghouse for the exchange is substituted as the counterparty, guaranteeing counterparty performance.
I Forward Foreign Currency Exchange Contracts — The Portfolio may enter into forward foreign currency exchange contracts for the purchase or sale of a specific foreign currency at a fixed price on a future date. The forward foreign currency exchange contracts are adjusted by the daily exchange rate of the underlying currency and any gains or losses are recorded as unrealized until such time as the contracts have been closed. Risks may arise upon entering these contracts from the potential inability of counterparties to meet the terms of their contracts and from movements in the value of a foreign currency relative to the U.S. dollar.
Global Income Builder Portfolio
April 30, 2017
Notes to Financial Statements (Unaudited) — continued
J When-Issued Securities and Delayed Delivery Transactions — The Portfolio may purchase or sell securities on a delayed delivery or when-issued basis. Payment and delivery may take place after the customary settlement period for that security. At the time the transaction is negotiated, the price of the security that will be delivered is fixed. The Portfolio maintains cash and/or security positions for these commitments such that sufficient liquid assets will be available to make payments upon settlement. Securities purchased on a delayed delivery or when-issued basis are marked-to-market daily and begin earning interest on settlement date. Losses may arise due to changes in the market value of the underlying securities or if the counterparty does not perform under the contract.
K Capital Transactions — To seek to protect the Portfolio (and, indirectly, other investors in the Portfolio) against the costs of accommodating investor inflows and outflows, the Portfolio imposes a fee (“Portfolio transaction fee”) on inflows and outflows by Portfolio investors. The Portfolio transaction fee is sized to cover the estimated cost to the Portfolio of, in connection with issuing interests, converting the cash and/or other instruments it receives to the desired composition and, in connection with redeeming its interests, converting Portfolio holdings to cash and/or other instruments to be distributed. Such fee, which may vary over time, is limited to amounts that have been authorized by the Board of Trustees and determined by EVM to be appropriate. The maximum Portfolio transaction fee is 2% of the amount of net contributions or withdrawals. The Portfolio transaction fee is recorded as a component of capital transactions on the Statements of Changes in Net Assets.
L Interim Financial Statements — The interim financial statements relating to April 30, 2017 and for the six months then ended have not been audited by an independent registered public accounting firm, but in the opinion of the Portfolio’s management, reflect all adjustments, consisting only of normal recurring adjustments, necessary for the fair presentation of the financial statements.
2 Investment Adviser Fee and Other Transactions with Affiliates
The investment adviser fee is earned by Boston Management and Research (BMR), a subsidiary of EVM, as compensation for investment advisory services rendered to the Portfolio. The fee is computed at an annual rate of 0.65% of the Portfolio’s average daily net assets up to $500 million, and is payable monthly. On net assets of $500 million and over, the annual fee is reduced. For the six months ended April 30, 2017, the Portfolio’s investment adviser fee amounted to $1,219,408 or 0.65% (annualized) of the Portfolio’s average daily net assets. Pursuant to a sub-advisory agreement, BMR pays Eaton Vance Management (International) Limited (EVMI), an indirect, wholly-owned subsidiary of Eaton Vance Corp., a portion of its investment adviser fee for sub-advisory services provided to the Portfolio. The Portfolio invests its cash in Cash Reserves Fund. EVM does not currently receive a fee for advisory services provided to Cash Reserves Fund.
Trustees and officers of the Portfolio who are members of EVM’s or BMR’s organizations receive remuneration for their services to the Portfolio out of the investment adviser fee. Trustees of the Portfolio who are not affiliated with the investment adviser may elect to defer receipt of all or a percentage of their annual fees in accordance with the terms of the Trustees Deferred Compensation Plan. For the six months ended April 30, 2017, no significant amounts have been deferred. Certain officers and Trustees of the Portfolio are officers of the above organizations.
3 Purchases and Sales of Investments
Purchases and sales of investments, other than short-term obligations and in-kind transactions, and including maturities and principal repayments on Senior Loans, aggregated $261,837,227 and $292,611,582, respectively, for the six months ended April 30, 2017. In-kind contributions and withdrawals for the six months ended April 30, 2017 aggregated $7,792,930 and $3,520,268, respectively.
4 Federal Income Tax Basis of Investments
The cost and unrealized appreciation (depreciation) of investments of the Portfolio at April 30, 2017, as determined on a federal income tax basis, were as follows:
| | | | |
| |
Aggregate cost | | $ | 349,178,830 | |
| |
Gross unrealized appreciation | | $ | 24,944,627 | |
Gross unrealized depreciation | | | (5,233,756 | ) |
| |
Net unrealized appreciation | | $ | 19,710,871 | |
5 Financial Instruments
The Portfolio may trade in financial instruments with off-balance sheet risk in the normal course of its investing activities. These financial instruments may include forward foreign currency exchange contracts and financial futures contracts and may involve, to a varying degree, elements of risk in excess of the amounts recognized for financial statement purposes. The notional or contractual amounts of these instruments represent the investment the Portfolio has
Global Income Builder Portfolio
April 30, 2017
Notes to Financial Statements (Unaudited) — continued
in particular classes of financial instruments and do not necessarily represent the amounts potentially subject to risk. The measurement of the risks associated with these instruments is meaningful only when all related and offsetting transactions are considered. A summary of obligations under these financial instruments at April 30, 2017 is included in the Portfolio of Investments. At April 30, 2017, the Portfolio had sufficient cash and/or securities to cover commitments under these contracts.
In the normal course of pursuing its investment objective, the Portfolio is subject to the following risks:
Equity Price Risk: The Portfolio enters into equity futures contracts on securities indices to gain or limit exposure to certain markets, particularly in connection with engaging in the dividend capture trading strategy.
Foreign Exchange Risk: Because the Portfolio holds foreign currency denominated investments, the value of these investments and related receivables and payables may change due to future changes in foreign currency exchange rates. To hedge against this risk, the Portfolio enters into forward foreign currency exchange contracts.
The Portfolio enters into forward foreign currency exchange contracts that may contain provisions whereby the counterparty may terminate the contract under certain conditions, including but not limited to a decline in the Portfolio’s net assets below a certain level over a certain period of time, which would trigger a payment by the Portfolio for those derivatives in a liability position. At April 30, 2017, the Portfolio had no open derivatives with credit-related contingent features in a net liability position.
The over-the-counter (OTC) derivatives in which the Portfolio invests are subject to the risk that the counterparty to the contract fails to perform its obligations under the contract. To mitigate this risk, the Portfolio has entered into an International Swaps and Derivatives Association, Inc. Master Agreement (“ISDA Master Agreement”) or similar agreement with substantially all its derivative counterparties. An ISDA Master Agreement is a bilateral agreement between the Portfolio and a counterparty that governs certain OTC derivatives and typically contains, among other things, set-off provisions in the event of a default and/or termination event as defined under the relevant ISDA Master Agreement. Under an ISDA Master Agreement, the Portfolio may, under certain circumstances, offset with the counterparty certain derivative financial instruments’ payables and/or receivables with collateral held and/or posted and create one single net payment. The provisions of the ISDA Master Agreement typically permit a single net payment in the event of default including the bankruptcy or insolvency of the counterparty. However, bankruptcy or insolvency laws of a particular jurisdiction may impose restrictions on or prohibitions against the right of offset in bankruptcy or insolvency. Certain ISDA Master Agreements allow counterparties to OTC derivatives to terminate derivative contracts prior to maturity in the event the Portfolio’s net assets decline by a stated percentage or the Portfolio fails to meet the terms of its ISDA Master Agreements, which would cause the counterparty to accelerate payment by the Portfolio of any net liability owed to it.
The collateral requirements for derivatives traded under an ISDA Master Agreement are governed by a Credit Support Annex to the ISDA Master Agreement. Collateral requirements are determined at the close of business each day and are typically based on changes in market values for each transaction under an ISDA Master Agreement and netted into one amount for such agreement. Generally, the amount of collateral due from or to a counterparty is subject to a minimum transfer threshold amount before a transfer is required, which may vary by counterparty. Collateral pledged for the benefit of the Portfolio and/or counterparty is held in segregated accounts by the Portfolio’s custodian and cannot be sold, re-pledged, assigned or otherwise used while pledged. The portion of such collateral representing cash, if any, is reflected as restricted cash and, in the case of cash pledged by a counterparty for the benefit of the Portfolio, a corresponding liability on the Statement of Assets and Liabilities. Securities pledged by the Portfolio as collateral, if any, are identified as such in the Portfolio of Investments.
The fair value of open derivative instruments (not considered to be hedging instruments for accounting disclosure purposes) by risk exposure at April 30, 2017 was as follows:
| | | | | | | | | | |
| | | | | Fair Value | |
| Risk | | Derivative | | Asset Derivative | | | Liability Derivative | |
| | | |
Equity Price | | Financial futures contracts | | $ | 394,037 | (1) | | $ | (1,852,986 | )(1) |
Foreign Exchange | | Forward foreign currency exchange contracts | | | 3,048 | (2) | | | — | |
| | |
Total | | $ | 397,085 | | | $ | (1,852,986 | ) |
| | |
Derivatives not subject to master netting or similar agreements | | $ | 394,037 | | | $ | (1,852,986 | ) |
| | |
Total Derivatives subject to master netting or similar agreements | | $ | 3,048 | | | $ | — | |
| (1) | Amount represents cumulative unrealized appreciation or (depreciation) on futures contracts. Only the current day’s variation margin on open futures contracts is reported within the Statement of Assets and Liabilities as Receivable or Payable for variation margin on open financial futures contracts, as applicable. |
| (2) | Statement of Assets and Liabilities location: Receivable for open forward foreign currency exchange contracts; Net unrealized appreciation. |
Global Income Builder Portfolio
April 30, 2017
Notes to Financial Statements (Unaudited) — continued
The Portfolio’s derivative assets and liabilities at fair value by risk, which are reported gross in the Statement of Assets and Liabilities, are presented in the table above. The following table presents the Portfolio’s derivative assets by counterparty, net of amounts available for offset under a master netting agreement and net of the related collateral received by the Portfolio for such assets as of April 30, 2017.
| | | | | | | | | | | | | | | | | | | | |
| Counterparty | | Derivative Assets Subject to Master Netting Agreement | | | Derivatives Available for Offset | | | Non-cash Collateral Received(a) | | | Cash Collateral Received(a) | | | Net Amount of Derivative Assets(b) | |
| | | | | |
State Street Bank and Trust Company | | $ | 3,048 | | | $ | — | | | $ | — | | | $ | — | | | $ | 3,048 | |
| (a) | In some instances, the actual collateral received may be more than the amount shown due to overcollateralization. |
| (b) | Net amount represents the net amount due from the counterparty in the event of default. |
The effect of derivative instruments (not considered to be hedging instruments for accounting disclosure purposes) on the Statement of Operations by risk exposure for the six months ended April 30, 2017 was as follows:
| | | | | | | | | | |
| Risk | | Derivative | | Realized Gain (Loss) on Derivatives Recognized in Income(1) | | | Change in Unrealized Appreciation (Depreciation) on Derivatives Recognized in Income(2) | |
| | | |
Equity Price | | Financial futures contracts | | $ | (128,020 | ) | | $ | (1,458,949 | ) |
Foreign Exchange | | Forward foreign currency exchange contracts | | | 69,840 | | | | 3,048 | |
| | |
Total | | $ | (58,180 | ) | | $ | (1,455,901 | ) |
| (1) | Statement of Operations location: Net realized gain (loss) – Financial futures contracts and Foreign currency and forward foreign currency exchange contract transactions, respectively. |
| (2) | Statement of Operations location: Change in unrealized appreciation (depreciation) – Financial futures contracts and Foreign currency and forward foreign currency exchange contracts, respectively. |
The average notional cost of futures contracts and average notional amounts of other derivative contracts outstanding during the six months ended April 30, 2017, which are indicative of the volume of these derivative types, were approximately as follows:
| | | | | | | | | | |
Futures Contracts — Long | | | Futures Contracts — Short | | | Forward Foreign Currency Exchange Contracts* | |
| | |
| | $22,661,000 | | | $ | 22,495,000 | | | $ | 759,000 | |
| * | The average notional amount for forward foreign currency exchange contracts is based on the absolute value of notional amounts of currency purchased and currency sold. |
6 Line of Credit
The Portfolio participates with other portfolios and funds managed by EVM and its affiliates in a $625 million unsecured line of credit agreement with a group of banks, which is in effect through September 1, 2017. Borrowings are made by the Portfolio solely to facilitate the handling of unusual and/or unanticipated short-term cash requirements. Interest is charged to the Portfolio based on its borrowings at an amount above either the Eurodollar rate or Federal Funds rate. In addition, a fee computed at an annual rate of 0.15% on the daily unused portion of the line of credit is allocated among the participating portfolios and funds at the end of each quarter. Because the line of credit is not available exclusively to the Portfolio, it may be unable to borrow some or all of its requested amounts at any particular time. The Portfolio did not have any significant borrowings or allocated fees during the six months ended April 30, 2017.
7 Risks Associated with Foreign Investments
Investing in securities issued by companies whose principal business activities are outside the United States may involve significant risks not present in domestic investments. For example, there is generally less publicly available information about foreign companies, particularly those not subject to the
Global Income Builder Portfolio
April 30, 2017
Notes to Financial Statements (Unaudited) — continued
disclosure and reporting requirements of the U.S. securities laws. Certain foreign issuers are generally not bound by uniform accounting, auditing, and financial reporting requirements and standards of practice comparable to those applicable to domestic issuers. Investments in foreign securities also involve the risk of possible adverse changes in investment or exchange control regulations, expropriation or confiscatory taxation, limitation on the removal of funds or other assets of the Portfolio, political or financial instability or diplomatic and other developments which could affect such investments. Foreign securities markets, while growing in volume and sophistication, are generally not as developed as those in the United States, and securities of some foreign issuers (particularly those located in developing countries) may be less liquid and more volatile than securities of comparable U.S. companies. In general, there is less overall governmental supervision and regulation of foreign securities markets, broker/dealers and issuers than in the United States.
8 Fair Value Measurements
Under generally accepted accounting principles for fair value measurements, a three-tier hierarchy to prioritize the assumptions, referred to as inputs, is used in valuation techniques to measure fair value. The three-tier hierarchy of inputs is summarized in the three broad levels listed below.
| • | | Level 1 – quoted prices in active markets for identical investments |
| • | | Level 2 – other significant observable inputs (including quoted prices for similar investments, interest rates, prepayment speeds, credit risk, etc.) |
| • | | Level 3 – significant unobservable inputs (including a fund’s own assumptions in determining the fair value of investments) |
In cases where the inputs used to measure fair value fall in different levels of the fair value hierarchy, the level disclosed is determined based on the lowest level input that is significant to the fair value measurement in its entirety. The inputs or methodology used for valuing securities are not necessarily an indication of the risk associated with investing in those securities.
At April 30, 2017, the hierarchy of inputs used in valuing the Portfolio’s investments and open derivative instruments, which are carried at value, were as follows:
| | | | | | | | | | | | | | | | |
| Asset Description | | Level 1 | | | Level 2 | | | Level 3 | | | Total | |
| | | | |
Common Stocks | | | | | | | | | | | | | | | | |
Consumer Discretionary | | $ | 14,971,172 | | | $ | 19,497,650 | | | $ | — | | | $ | 34,468,822 | |
Consumer Staples | | | 5,806,381 | | | | 9,935,117 | | | | — | | | | 15,741,498 | |
Energy | | | 8,690,413 | | | | 5,835,266 | | | | — | | | | 14,525,679 | |
Financials | | | 8,661,544 | | | | 46,688,044 | | | | — | | | | 55,349,588 | |
Health Care | | | 14,024,958 | | | | 8,030,311 | | | | — | | | | 22,055,269 | |
Industrials | | | 11,097,718 | | | | 15,809,947 | | | | — | | | | 26,907,665 | |
Information Technology | | | 18,636,113 | | | | 4,991,193 | | | | — | | | | 23,627,306 | |
Materials | | | 2,327,267 | | | | 5,261,494 | | | | — | | | | 7,588,761 | |
Real Estate | | | 4,129,054 | | | | — | | | | — | | | | 4,129,054 | |
Telecommunication Services | | | — | | | | 11,891,290 | | | | — | | | | 11,891,290 | |
Utilities | | | 3,560,861 | | | | 15,137,295 | | | | — | | | | 18,698,156 | |
| | | | |
Total Common Stocks | | $ | 91,905,481 | | | $ | 143,077,607 | * | | $ | — | | | $ | 234,983,088 | |
| | | | |
Preferred Stocks | | | | | | | | | | | | | | | | |
Consumer Staples | | $ | — | | | $ | 552,523 | | | $ | — | | | $ | 552,523 | |
Energy | | | 602,063 | | | | — | | | | — | | | | 602,063 | |
Financials | | | 6,108,229 | | | | 2,385,214 | | | | — | | | | 8,493,443 | |
Industrials | | | 459,553 | | | | — | | | | — | | | | 459,553 | |
Real Estate | | | 1,483,209 | | | | — | | | | — | | | | 1,483,209 | |
Utilities | | | 1,212,854 | | | | — | | | | — | | | | 1,212,854 | |
| | | | |
Total Preferred Stocks | | $ | 9,865,908 | | | $ | 2,937,737 | | | $ | — | | | $ | 12,803,645 | |
Global Income Builder Portfolio
April 30, 2017
Notes to Financial Statements (Unaudited) — continued
| | | | | | | | | | | | | | | | |
| Asset Description | | Level 1 | | | Level 2 | | | Level 3 | | | Total | |
| | | | |
Corporate Bonds & Notes | | $ | — | | | $ | 114,084,758 | | | $ | — | | | $ | 114,084,758 | |
Senior Floating-Rate Loans | | | — | | | | 3,279,059 | | | | — | | | | 3,279,059 | |
Convertible Bonds | | | — | | | | 296,438 | | | | — | | | | 296,438 | |
Exchange-Traded Funds | | | 663,170 | | | | — | | | | — | | | | 663,170 | |
Short-Term Investments | | | — | | | | 2,779,543 | | | | — | | | | 2,779,543 | |
| | | | |
Total Investments | | $ | 102,434,559 | | | $ | 266,455,142 | | | $ | — | | | $ | 368,889,701 | |
| | | | |
Forward Foreign Currency Exchange Contracts | | $ | — | | | $ | 3,048 | | | $ | — | | | $ | 3,048 | |
Futures Contracts | | | 305,323 | | | | 88,714 | | | | — | | | | 394,037 | |
| | | | |
Total | | $ | 102,739,882 | | | $ | 266,546,904 | | | $ | — | | | $ | 369,286,786 | |
| | | | |
Liability Description | | | | | | | | | | | | | | | | |
Futures Contracts | | $ | — | | | $ | (1,852,986 | ) | | $ | — | | | $ | (1,852,986 | ) |
| | | | |
Total | | $ | — | | | $ | (1,852,986 | ) | | $ | — | | | $ | (1,852,986 | ) |
| * | Includes foreign equity securities whose values were adjusted to reflect market trading of comparable securities or other correlated instruments that occurred after the close of trading in their applicable foreign markets. |
The Portfolio held no investments or other financial instruments as of October 31, 2016 whose fair value was determined using Level 3 inputs. At April 30, 2017, the value of investments transferred between Level 1 and Level 2 during the six months then ended was not significant.
Eaton Vance
Global Income Builder NextShares
April 30, 2017
Board of Trustees’ Contract Approval
Overview of the Contract Review Process
The Investment Company Act of 1940, as amended (the “1940 Act”), provides, in substance, that each investment advisory agreement between a fund and its investment adviser will continue in effect from year to year only if its continuation is approved at least annually by the fund’s board of trustees, including by a vote of a majority of the trustees who are not “interested persons” of the fund (“Independent Trustees”), cast in person at a meeting called for the purpose of considering such approval.
At a meeting of the Boards of Trustees (each a “Board”) of the registered investment companies advised by either Eaton Vance Management or its affiliate, Boston Management and Research, (the “Eaton Vance Funds”) held on April 25, 2017, the Board, including a majority of the Independent Trustees, voted to approve continuation of existing investment advisory and sub-advisory agreements for the Eaton Vance Funds for an additional one-year period. In voting its approval, the Board relied upon the affirmative recommendation of its Contract Review Committee, which is a committee comprised exclusively of Independent Trustees. Prior to making its recommendation, the Contract Review Committee reviewed information furnished by each adviser to the Eaton Vance Funds (including information specifically requested by the Board) for a series of meetings of the Contract Review Committee held between February and April 2017. The Contract Review Committee also considered information received at prior meetings of the Board and its committees, as relevant to its annual evaluation of the investment advisory and sub-advisory agreements.
The information that the Board considered included, among other things, the following (for funds that invest through one or more underlying portfolio(s), references to “each fund” in this section may include information that was considered at the portfolio-level):
Information about Fees, Performance and Expenses
| • | | A report from an independent data provider comparing the advisory and related fees paid by each fund with fees paid by comparable funds as identified by the independent data provider (“comparable funds”); |
| • | | A report from an independent data provider comparing each fund’s total expense ratio and its components to comparable funds; |
| • | | A report from an independent data provider comparing the investment performance of each fund (including, where relevant, yield data, Sharpe ratios and information ratios) to the investment performance of comparable funds over various time periods; |
| • | | Data regarding investment performance in comparison to benchmark indices, as well as customized groups of peer funds and blended indices identified by the adviser in consultation with the Board; |
| • | | For each fund, comparative information concerning the fees charged and the services provided by each adviser in managing other accounts (including mutual funds, other collective investment funds and institutional accounts) using investment strategies and techniques similar to those used in managing such fund; |
| • | | Profitability analyses for each adviser with respect to each fund; |
Information about Portfolio Management and Trading
| • | | Descriptions of the investment management services provided to each fund, including the investment strategies and processes it employs; |
| • | | The procedures and processes used to determine the fair value of fund assets and actions taken to monitor and test the effectiveness of such procedures and processes; |
| • | | Information about each adviser’s policies and practices with respect to trading, including each adviser’s processes for monitoring best execution of portfolio transactions; |
| • | | Information about the allocation of brokerage transactions and the benefits received by each adviser as a result of brokerage allocation, including information concerning the acquisition of research through client commission arrangements and policies with respect to “soft dollars”; |
| • | | Data relating to portfolio turnover rates of each fund; |
Information about each Adviser
| • | | Reports detailing the financial results and condition of each adviser; |
| • | | Descriptions of the qualifications, education and experience of the individual investment professionals whose responsibilities include portfolio management and investment research for the funds, and information relating to their compensation and responsibilities with respect to managing other mutual funds and investment accounts; |
| • | | The Code of Ethics of each adviser and its affiliates, together with information relating to compliance with and the administration of such codes; |
| • | | Policies and procedures relating to proxy voting and the handling of corporate actions and class actions; |
| • | | Information concerning the resources devoted to compliance efforts undertaken by each adviser and its affiliates (including descriptions of various compliance programs) and their record of compliance; |
| • | | Information concerning the business continuity and disaster recovery plans of each adviser and its affiliates; |
| • | | A description of Eaton Vance Management’s procedures for overseeing third party advisers and sub-advisers, including with respect to regulatory and compliance issues, investment management and other matters; |
Eaton Vance
Global Income Builder NextShares
April 30, 2017
Board of Trustees’ Contract Approval — continued
Other Relevant Information
| • | | Information concerning the nature, cost and character of the administrative and other non-investment advisory services provided by Eaton Vance Management and its affiliates; |
| • | | Information concerning management of the relationship with the custodian, subcustodians and fund accountants by each adviser or the funds’ administrator; and |
| • | | The terms of each investment advisory agreement. |
Over the course of the twelve-month period ended April 30, 2017, with respect to one or more funds, the Board met ten times and the Contract Review Committee, the Audit Committee, the Governance Committee, the Portfolio Management Committee and the Compliance Reports and Regulatory Matters Committee, each of which is a Committee comprised solely of Independent Trustees, met seven, thirteen, six, eight and ten times, respectively. At such meetings, the Trustees participated in investment and performance reviews with the portfolio managers and other investment professionals of each investment adviser relating to each fund, and considered various investment and trading strategies used in pursuing each fund’s investment objective, such as the use of derivative instruments, as well as risk management techniques. The Board and its Committees also evaluated issues pertaining to industry and regulatory developments, compliance procedures, fund governance and other issues with respect to the funds, and received and participated in reports and presentations provided by Eaton Vance Management and other fund advisers with respect to such matters. In addition to the formal meetings of the Board and its Committees, the Independent Trustees hold regular teleconferences in between meetings to discuss, among other topics, matters relating to the continuation of investment advisory and sub-advisory agreements.
For funds that invest through one or more underlying portfolios, the Board considered similar information about the portfolio(s) when considering the approval of investment advisory agreements. In addition, in cases where the fund’s investment adviser has engaged a sub-adviser, the Board considered similar information about the sub-adviser when considering the approval of any sub-advisory agreement.
The Contract Review Committee was assisted throughout the contract review process by Goodwin Procter LLP, independent legal counsel for the Independent Trustees. The members of the Contract Review Committee relied upon the advice of such counsel and their own business judgment in determining the material factors to be considered in evaluating each investment advisory and sub-advisory agreement and the weight to be given to each such factor. The conclusions reached with respect to each investment advisory and sub-advisory agreement were based on a comprehensive evaluation of all the information provided and not any single factor. Moreover, each member of the Contract Review Committee may have placed varying emphasis on particular factors in reaching conclusions with respect to each investment advisory and sub-advisory agreement. In evaluating each investment advisory and sub-advisory agreement, including the specific fee structures and other terms of the agreements, the Contract Review Committee was informed by multiple years of analysis and discussion among the Independent Trustees and the Eaton Vance Funds’ advisers and sub-advisers.
Results of the Process
Based on its consideration of the foregoing, and such other information as it deemed relevant, including the factors and conclusions described below, the Contract Review Committee concluded that the continuation of the investment advisory and administrative agreement of Eaton Vance Global Income Builder NextShares (the “Fund”) with Eaton Vance Management (“EVM”), as well as the investment advisory agreement of Global Income Builder Portfolio (the “Portfolio”), the portfolio in which the Fund invests, with Boston Management and Research (“BMR”) and the sub-advisory agreement of the Fund, as well as the sub-advisory agreement of the Portfolio, with Eaton Vance Management (International) Limited (the “Sub-adviser”), an affiliate of EVM (EVM, with respect to the Fund, and BMR, with respect to the Portfolio, are each referred to herein as the “Adviser”), including their fee structures, is in the interests of shareholders and, therefore, the Contract Review Committee recommended to the Board approval of each agreement. The Board accepted the recommendation of the Contract Review Committee based on the material factors considered and conclusions reached by the Contract Review Committee with respect to the agreements. Accordingly, the Board, including a majority of the Independent Trustees, voted to approve continuation of the investment advisory and administrative agreement and sub-advisory agreement for the Fund and the investment advisory agreement and sub-advisory agreement for the Portfolio (collectively, the “investment advisory agreements”).
Nature, Extent and Quality of Services
In considering whether to approve the investment advisory agreements of the Fund and the Portfolio, the Board evaluated the nature, extent and quality of services provided to the Fund and the Portfolio by the applicable Adviser and the Sub-adviser.
The Board considered each Adviser’s and the Sub-adviser’s management capabilities and investment process with respect to the types of investments held by the Fund and the Portfolio, including the education, experience and number of its investment professionals and other personnel who provide portfolio management, investment research, and similar services to the Fund and the Portfolio. The Board considered the applicable Adviser’s responsibilities overseeing the Sub-adviser and coordinating activities in implementing the investment strategy of the Fund and the Portfolio. The Board considered each Adviser’s in-house equity research capabilities and experience in managing funds that seek to maximize after-tax returns. The Board also considered the abilities and experience of the Sub-adviser’s investment professionals in investing in equity securities, including investing in both U.S. and foreign common stocks. In particular, the Board considered the abilities and experience of each Adviser’s and the Sub-adviser’s investment professionals in analyzing factors such as special considerations relevant to investing in dividend-paying common and preferred stocks and foreign markets. The Board considered the
Eaton Vance
Global Income Builder NextShares
April 30, 2017
Board of Trustees’ Contract Approval — continued
international investment capabilities of the Sub-adviser, which is based in London, and the benefits to the Fund of having portfolio management services involving investments in international equities provided by investment professionals located abroad. The Board also took into account the resources dedicated to portfolio management and other services, as well as the compensation methods of each Adviser and other factors, such as the reputation and resources of the Adviser to recruit and retain highly qualified research, advisory and supervisory investment professionals. In addition, the Board considered the time and attention devoted to the Eaton Vance Funds, including the Fund and the Portfolio, by senior management, as well as the infrastructure, operational capabilities and support staff in place to assist in the portfolio management and operations of the Fund and the Portfolio, including the provision of administrative services. The Board also considered the business-related and other risks to which each Adviser or its affiliates may be subject in managing the Fund and the Portfolio.
The Board considered the special attributes of the Fund relative to a traditional mutual fund and the benefits that are expected to be realized from an investment in the Fund, rather than a traditional mutual fund. The Board also considered the resources devoted by the applicable Adviser and its affiliates in developing and maintaining an infrastructure necessary to support the on-going operations of the Fund.
The Board noted that under the terms of the investment advisory agreement of the Fund, EVM may invest assets of the Fund directly in securities, for which it would receive a fee, or in the Portfolio, for which it receives no separate fee but for which BMR receives an advisory fee from the Portfolio.
The Board considered the compliance programs of each Adviser and relevant affiliates thereof, including the Sub-adviser. Among other matters, the Board considered compliance and reporting matters relating to personal trading by investment professionals, selective disclosure of portfolio holdings, late trading, frequent trading, portfolio valuation, business continuity and the allocation of investment opportunities. The Board also considered the responses of each Adviser and its affiliates to requests in recent years from regulatory authorities such as the Securities and Exchange Commission and the Financial Industry Regulatory Authority.
The Board was aware that on April 24, 2017 a former employee of the Adviser agreed to plead guilty to fraud charges arising from the individual’s prior activities as an equity options trader for certain Eaton Vance Funds. The Board was informed that the Adviser became aware of the matter on April 18, 2017, at which time management contacted federal authorities, alerted the Board and began an internal investigation. The Adviser represented to the Board that, based on information available as of April 25, 2017, management had no reason to believe that any other employee of the Adviser or its affiliates was involved in any wrongful activities or that any fund had been materially harmed. The Adviser agreed to keep the Board fully apprised as additional information is learned, and assured the Board that any fund harmed by the former employee’s wrongful activities will be made whole, as determined in consultation with the Board. The Board concluded that the Adviser’s actions in response to these events are appropriate and consistent with the Adviser’s commitment to protect and provide quality services to the Eaton Vance Funds.
The Board considered shareholder and other administrative services provided or managed by Eaton Vance Management and its affiliates, including transfer agency and accounting services. The Board evaluated the benefits to shareholders of investing in a fund that is a part of a large fund complex offering exposure to a variety of asset classes and investment disciplines, as well as the ability, in many cases, to exchange an investment among different funds without incurring additional sales charges.
After consideration of the foregoing factors, among others, the Board concluded that the nature, extent and quality of services provided by each Adviser and the Sub-adviser, taken as a whole, are appropriate and consistent with the terms of the applicable investment advisory agreement.
Fund Performance
The Board compared the Fund’s investment performance to that of comparable funds and appropriate benchmark indices, as well as a customized peer group of similarly managed funds. In light of the Fund’s relatively brief operating history, the Board concluded that additional time is required to evaluate Fund performance.
Management Fees and Expenses
The Board considered contractual fee rates payable by the Portfolio and by the Fund for advisory and administrative services (referred to collectively as “management fees”). As part of its review, the Board considered the Fund’s management fees and total expense ratio for the one year period ended September 30, 2016, as compared to those of comparable funds, before and after giving effect to any undertaking to waive fees or reimburse expenses. The Board also considered certain Fund specific factors that had an impact on Fund expense ratios relative to comparable funds, as identified by management in response to inquiries from the Contract Review Committee.
After considering the foregoing information, and in light of the nature, extent and quality of the services provided by each Adviser and the Sub-adviser, the Board concluded that the management fees charged for advisory and related services are reasonable.
Profitability and Other “Fall-Out” Benefits
The Board considered the level of profits realized by each Adviser and relevant affiliates thereof, including the Sub-adviser, in providing investment advisory and administrative services to the Fund, to the Portfolio and to all Eaton Vance Funds as a group. The Board considered the level of profits realized without
Eaton Vance
Global Income Builder NextShares
April 30, 2017
Board of Trustees’ Contract Approval — continued
regard to marketing support or other payments by each Adviser and its affiliates to third parties in respect of distribution services. The Board also considered other direct or indirect fall-out benefits received by each Adviser and its affiliates, including the Sub-adviser, in connection with their relationships with the Fund and the Portfolio, including the benefits of research services that may be available to each Adviser or the Sub-adviser as a result of securities transactions effected for the Fund and the Portfolio and other investment advisory clients.
The Board concluded that, in light of the foregoing factors and the nature, extent and quality of the services rendered, the profits realized by each Adviser and its affiliates, including the Sub-adviser, are deemed not to be excessive.
Economies of Scale
In reviewing management fees and profitability, the Board also considered the extent to which the applicable Adviser and its affiliates, on the one hand, and the Fund and the Portfolio, on the other hand, can expect to realize benefits from economies of scale as the assets of the Fund and the Portfolio increase. The Board acknowledged the difficulty in accurately measuring the benefits resulting from economies of scale, if any, with respect to the management of any specific fund or group of funds. The Board reviewed data summarizing the increases and decreases in the assets of the Fund and of all Eaton Vance Funds as a group over various time periods, and evaluated the extent to which the total expense ratio of the Fund and the profitability of each Adviser and its affiliates may have been affected by such increases or decreases. Based upon the foregoing, the Board concluded that the Fund currently shares in any benefits from economies of scale. The Board also concluded that, assuming reasonably foreseeable increases in the assets of the Fund and the Portfolio, the structure of the advisory fees, which include breakpoints at several asset levels, will allow the Fund and the Portfolio to continue to benefit from any economies of scale in the future.
Eaton Vance
Global Income Builder NextShares
April 30, 2017
Officers and Trustees
Officers of Eaton Vance Global Income Builder NextShares
Edward J. Perkin
President
Maureen A. Gemma
Vice President, Secretary and
Chief Legal Officer
James F. Kirchner
Treasurer
Paul M. O’Neil
Chief Compliance Officer
Officers of Global Income Builder Portfolio
Edward J. Perkin
President
Maureen A. Gemma
Vice President, Secretary and
Chief Legal Officer
James F. Kirchner
Treasurer
Paul M. O’Neil
Chief Compliance Officer
Trustees of Eaton Vance Global Income Builder NextShares and Global Income Builder Portfolio
William H. Park
Chairperson
Scott E. Eston
Thomas E. Faust Jr.*
Mark R. Fetting**
Cynthia E. Frost
George J. Gorman
Valerie A. Mosley
Helen Frame Peters
Susan J. Sutherland
Harriett Tee Taggart
Ralph F. Verni
Scott E. Wennerholm**
| ** | Messrs. Fetting and Wennerholm began serving as Trustees effective September 1, 2016. |
Eaton Vance Funds
IMPORTANT NOTICES
Privacy. The Eaton Vance organization is committed to ensuring your financial privacy. Each of the financial institutions identified below has in effect the following policy (“Privacy Policy”) with respect to nonpublic personal information about its customers:
| • | | Only such information received from you, through application forms or otherwise, and information about your Eaton Vance fund transactions will be collected. This may include information such as name, address, social security number, tax status, account balances and transactions. |
| • | | None of such information about you (or former customers) will be disclosed to anyone, except as permitted by law (which includes disclosure to employees necessary to service your account). In the normal course of servicing a customer’s account, Eaton Vance may share information with unaffiliated third parties that perform various required services such as transfer agents, custodians and broker-dealers. |
| • | | Policies and procedures (including physical, electronic and procedural safeguards) are in place that are designed to protect the confidentiality of such information. |
| • | | We reserve the right to change our Privacy Policy at any time upon proper notification to you. Customers may want to review our Privacy Policy periodically for changes by accessing the link on our homepage: www.eatonvance.com. |
Our pledge of privacy applies to the following entities within the Eaton Vance organization: the Eaton Vance Family of Funds, Eaton Vance Management, Eaton Vance Investment Counsel, Eaton Vance Distributors, Inc., Eaton Vance Trust Company, Eaton Vance Management (International) Limited, Eaton Vance Management’s Real Estate Investment Group and Boston Management and Research. In addition, our Privacy Policy applies only to those Eaton Vance customers who are individuals and who have a direct relationship with us. If a customer’s account (i.e., fund shares) is held in the name of a third-party financial advisor/broker-dealer, it is likely that only such advisor’s privacy policies apply to the customer. This notice supersedes all previously issued privacy disclosures. For more information about Eaton Vance’s Privacy Policy, please call 1-800-262-1122.
Delivery of Shareholder Documents. The Securities and Exchange Commission (SEC) permits funds to deliver only one copy of shareholder documents, including prospectuses, proxy statements and shareholder reports, to fund investors with multiple accounts at the same residential or post office box address. This practice is often called “householding” and it helps eliminate duplicate mailings to shareholders. Your financial advisor may household the mailing of your documents indefinitely unless you instruct your financial advisor otherwise. If you would prefer that your Eaton Vance documents not be householded, please contact your financial advisor. Your instructions that householding not apply to delivery of your Eaton Vance documents will typically be effective within 30 days of receipt by your financial advisor.
Portfolio Holdings. Each Eaton Vance Fund and its underlying Portfolio(s) (if applicable) will file a schedule of portfolio holdings on Form N-Q with the SEC for the first and third quarters of each fiscal year. The Form N-Q will be available on the Eaton Vance website at www.eatonvance.com, by calling Eaton Vance at 1-800-262-1122 or in the EDGAR database on the SEC’s website at www.sec.gov. Form N-Q may also be reviewed and copied at the SEC’s public reference room in Washington, D.C. (call 1-800-732-0330 for information on the operation of the public reference room).
Proxy Voting. From time to time, funds are required to vote proxies related to the securities held by the funds. The Eaton Vance Funds or their underlying Portfolios (if applicable) vote proxies according to a set of policies and procedures approved by the Funds’ and Portfolios’ Boards. You may obtain a description of these policies and procedures and information on how the Funds or Portfolios voted proxies relating to portfolio securities during the most recent 12-month period ended June 30, without charge, upon request, by calling 1-800-262-1122 and by accessing the SEC’s website at www.sec.gov.
This Page Intentionally Left Blank
This Page Intentionally Left Blank
This Page Intentionally Left Blank
Investment Adviser of Global Income Builder Portfolio
Boston Management and Research
Two International Place
Boston, MA 02110
Investment Sub-Adviser of Eaton Vance Global Income Builder NextShares and Global Income Builder Portfolio
Eaton Vance Management (International) Limited
125 Old Broad Street
London, EC2N 1AR
United Kingdom
Investment Adviser and Administrator of Eaton Vance Global Income Builder NextShares
Eaton Vance Management
Two International Place
Boston, MA 02110
Distributor*
Foreside Fund Services, LLC
Three Canal Plaza, Suite 100
Portland, ME 04101
Custodian
State Street Bank and Trust Company
State Street Financial Center, One Lincoln Street
Boston, MA 02111
Transfer and Dividend Disbursing Agent
State Street Bank and Trust Company
State Street Financial Center, One Lincoln Street
Boston, MA 02111
Fund Offices
Two International Place
Boston, MA 02110
| * | FINRA BrokerCheck. Investors may check the background of their Investment Professional by contacting the Financial Industry Regulatory Authority (FINRA). FINRA BrokerCheck is a free tool to help investors check the professional background of current and former FINRA-registered securities firms and brokers. FINRA BrokerCheck is available by calling 1-800-289-9999 and at www.FINRA.org. The FINRA BrokerCheck brochure describing this program is available to investors at www.FINRA.org. |
21984 4.30.17
Item 2. Code of Ethics
Not required in this filing.
Item 3. Audit Committee Financial Expert
Not required in this filing.
Item 4. Principal Accountant Fees and Services
Rule 2-01(c)(1)(ii)(A) of Regulation S-X (the “Loan Rule”) prohibits an accounting firm, such as the Trust’s principal accountant, Deloitte & Touche LLP (“D&T”), from having certain financial relationships with their audit clients and affiliated entities. Specifically, the Loan Rule provides, in relevant part, that an accounting firm generally would not be independent if it or a “covered person” of the accounting firm (within the meaning of applicable SEC rules relating to auditor independence) receives a loan from a lender that is a “record or beneficial owner of more than ten percent of the audit client’s equity securities.” Based on information provided to the Audit Committee of the Board of Trustees (the “Audit Committee”) of the Eaton Vance family of funds by D&T, certain relationships between D&T and its affiliates (“Deloitte Entities”) and one or more lenders who are record owners of shares of one or more funds within the Eaton Vance family of funds (the “Funds”) implicate the Loan Rule, calling into question D&T’s independence with respect to the Funds. The Funds are providing this disclosure to explain the facts and circumstances as well as D&T’s conclusions concerning D&T’s objectivity and impartiality with respect to the audits of the Funds notwithstanding the existence of one or more breaches of the Loan Rule.
On June 20, 2016, the U.S. Securities and Exchange Commission (the “SEC”) issued no-action relief to another mutual fund complex (see Fidelity Management & Research Company et al., No-Action Letter (June 20, 2016) (the “No-Action Letter”)) related to an auditor independence issue arising under the Loan Rule. In the No-Action Letter, the SEC indicated that it would not recommend enforcement action against the fund group if the auditor is not in compliance with the Loan Rule provided that: (1) the auditor has complied with PCAOB Rule 3526(b)(1) and 3526(b)(2); (2) the auditor’s non-compliance under the Loan Rule is with respect to certain lending relationships; and (3) notwithstanding such non-compliance, the auditor has concluded that it is objective and impartial with respect to the issues encompassed within its engagement as auditor of the funds. The SEC has indicated that the no-action relief will expire 18 months from its issuance.
Based on information provided by D&T to the Audit Committee, the requirements of the No-Action Letter appear to be met with respect to D&T’s lending relationships described above. Among other things, D&T has advised the Audit Committee of its conclusion that the consequences of the breach of the Loan Rule have been satisfactorily addressed, that D&T’s objectivity and impartiality in the planning and conduct of the audits of the Fund’s financial statements has not been compromised and that, notwithstanding the breach, D&T is in a position to continue as the auditor for the Funds and D&T does not believe any actions need to be taken with respect to previously issued reports by D&T. D&T has advised the Audit Committee that these conclusions were based in part on its consideration of the No-Action Letter and other relevant information communicated to the Audit Committee.
Item 5. Audit Committee of Listed Registrants
Not applicable.
Item 6. Schedule of Investments
Please see schedule of investments contained in the Report to Stockholders included under Item 1 of this Form N-CSR.
Item 7. Disclosure of Proxy Voting Policies and Procedures for Closed-End Management Investment Companies
Not applicable.
Item 8. Portfolio Managers of Closed-End Management Investment Companies
Not applicable.
Item 9. Purchases of Equity Securities by Closed-End Management Investment Company and Affiliated Purchasers
Not applicable.
Item 10. Submission of Matters to a Vote of Security Holders
No material changes.
Item 11. Controls and Procedures
(a) It is the conclusion of the registrant’s principal executive officer and principal financial officer that the effectiveness of the registrant’s current disclosure controls and procedures (such disclosure controls and procedures having been evaluated within 90 days of the date of this filing) provide reasonable assurance that the information required to be disclosed by the registrant has been recorded, processed, summarized and reported within the time period specified in the Commission’s rules and forms and that the information required to be disclosed by the registrant has been accumulated and communicated to the registrant’s principal executive officer and principal financial officer in order to allow timely decisions regarding required disclosure.
(b) There have been no changes in the registrant’s internal controls over financial reporting during the second fiscal quarter of the period covered by this report that has materially affected, or is reasonably likely to materially affect, the registrant’s internal control over financial reporting.
Item 12. Exhibits
| | |
| (a)(1) | | Registrant’s Code of Ethics – Not applicable (please see Item 2). |
| |
| (a)(2)(i) | | Treasurer’s Section 302 certification. |
| |
| (a)(2)(ii) | | President’s Section 302 certification. |
| |
| (b) | | Combined Section 906 certification. |
Signatures
Pursuant to the requirements of the Securities Exchange Act of 1934 and the Investment Company Act of 1940, the registrant has duly caused this report to be signed on its behalf by the undersigned, thereunto duly authorized.
Eaton Vance NextShares Trust
| | |
| By: | | /s/ Edward J. Perkin |
| | Edward J. Perkin |
| | President |
| |
| Date: | | June 26, 2017 |
Pursuant to the requirements of the Securities Exchange Act of 1934 and the Investment Company Act of 1940, this report has been signed below by the following persons on behalf of the registrant and in the capacities and on the dates indicated.
| | |
| By: | | /s/ James F. Kirchner |
| | James F. Kirchner |
| | Treasurer |
| |
| Date: | | June 26, 2017 |
| |
| By: | | /s/ Edward J. Perkin |
| | Edward J. Perkin |
| | President |
| |
| Date: | | June 26, 2017 |