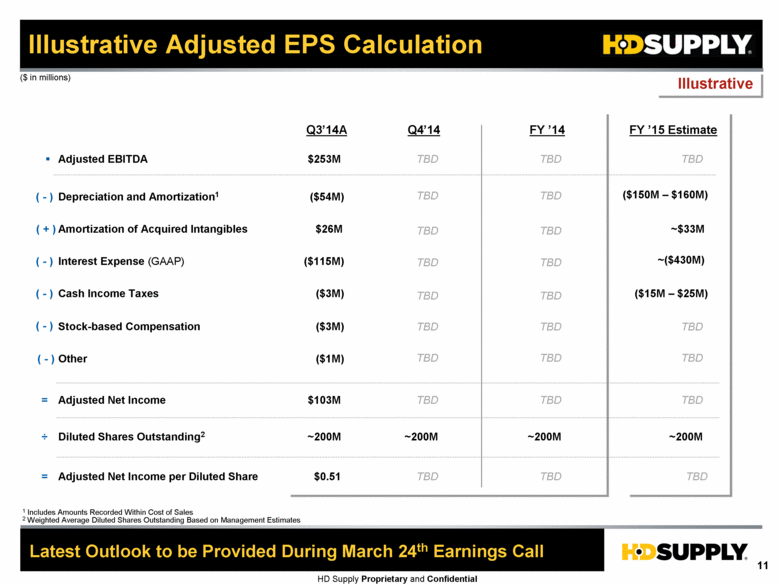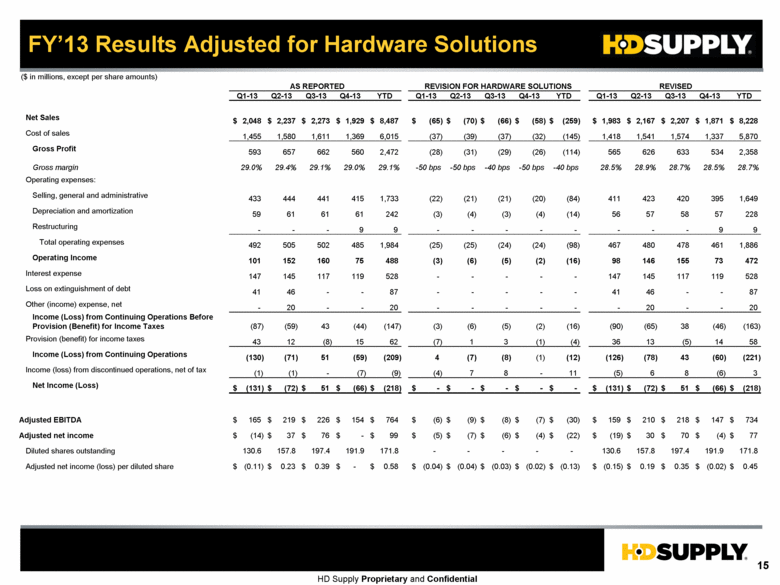
| HD Supply Proprietary and Confidential FY’13 Results Adjusted for Hardware Solutions ($ in millions, except per share amounts) AS REPORTED REVISION FOR HARDWARE SOLUTIONS REVISED Q1-13 Q2-13 Q3-13 Q4-13 YTD Q1-13 Q2-13 Q3-13 Q4-13 YTD Q1-13 Q2-13 Q3-13 Q4-13 YTD Net Sales 2,048 $ 2,237 $ 2,273 $ 1,929 $ 8,487 $ (65) $ (70) $ (66) $ (58) $ (259) $ 1,983 $ 2,167 $ 2,207 $ 1,871 $ 8,228 $ Cost of sales 1,455 1,580 1,611 1,369 6,015 (37) (39) (37) (32) (145) 1,418 1,541 1,574 1,337 5,870 Gross Profit 593 657 662 560 2,472 (28) (31) (29) (26) (114) 565 626 633 534 2,358 Gross margin 29.0% 29.4% 29.1% 29.0% 29.1% -50 bps -50 bps -40 bps -50 bps -40 bps 28.5% 28.9% 28.7% 28.5% 28.7% Operating expenses: Selling, general and administrative 433 444 441 415 1,733 (22) (21) (21) (20) (84) 411 423 420 395 1,649 Depreciation and amortization 59 61 61 61 242 (3) (4) (3) (4) (14) 56 57 58 57 228 Restructuring - - - 9 9 - - - - - - - - 9 9 Total operating expenses 492 505 502 485 1,984 (25) (25) (24) (24) (98) 467 480 478 461 1,886 Operating Income 101 152 160 75 488 (3) (6) (5) (2) (16) 98 146 155 73 472 Interest expense 147 145 117 119 528 - - - 147 145 117 119 528 Loss on extinguishment of debt 41 46 - - 87 - - - - - 41 46 - - 87 Other (income) expense, net - 20 - - 20 - - - - - - 20 - - 20 Income (Loss) from Continuing Operations Before Provision (Benefit) for Income Taxes (87) (59) 43 (44) (147) (3) (6) (5) (2) (16) (90) (65) 38 (46) (163) Provision (benefit) for income taxes 43 12 (8) 15 62 (7) 1 3 (1) (4) 36 13 (5) 14 58 Income (Loss) from Continuing Operations (130) (71) 51 (59) (209) 4 (7) (8) (12) (126) (78) 43 (60) (221) Income (loss) from discontinued operations, net of tax (1) (1) - (7) (9) (4) 7 8 - 11 (5) 6 8 (6) 3 Net Income (Loss) (131) $ (72) $ 51 $ (66) $ (218) $ - $ - $ - $ - $ - $ (131) $ (72) $ 51 $ (66) $ (218) $ Adjusted EBITDA 165 $ 219 $ 226 $ 154 $ 764 $ (6) $ (9) $ (8) $ (7) $ (30) $ 159 $ 210 $ 218 $ 147 $ 734 $ Adjusted net income (14) $ 37 $ 76 $ - $ 99 $ (5) $ (7) $ (6) $ (4) $ (22) $ (19) $ 30 $ 70 $ (4) $ 77 $ Diluted shares outstanding 130.6 157.8 197.4 191.9 171.8 - - - - - 130.6 157.8 197.4 191.9 171.8 Adjusted net income (loss) per diluted share (0.11) $ 0.23 $ 0.39 $ - $ 0.58 $ (0.04) $ (0.04) $ (0.03) $ (0.02) $ (0.13) $ (0.15) $ 0.19 $ 0.35 $ (0.02) $ 0.45 $ - - (1) |

