Murphy USA Inc. 1 Murphy USA Inc. (MUSA) 2017 Investor Day New York, NY ● May 16, 2017
Murphy USA Inc. 2 Cautionary Statement This presentation contains forward-looking statements. These statements, which express management’s current views concerning future events or results, are subject to inherent risks and uncertainties. Factors that could cause actual results to differ materially from those expressed or implied in our forward-looking statements include, but are not limited to, the volatility and level of crude oil and gasoline prices, the pace and success of our expansion plan, our relationship with Walmart, political and regulatory uncertainty, uncontrollable natural hazards, adverse market conditions or tax consequences, among other things. For further discussion of risk factors, see “Risk Factors” in the Murphy USA registration statement on our latest form 10-K. Murphy USA undertakes no duty to publicly update or revise any forward-looking statements. The Murphy USA financial information in this presentation is derived from the audited and unaudited combined financial statements of Murphy USA, Inc. for the years ended December 31, 2016 2015, 2014, 2013, and 2012. Please reference our latest 10-K, 10-Q, and 8-K filings for the latest information. This presentation also contains non-GAAP financial measures. We have provided a reconciliation of such non-GAAP financial measures to the most directly comparable measures prepared in accordance with U.S. GAAP in the Appendix to this presentation. Christian Pikul, CFA Joe Van Cavage, CFA Director, Investor Relations Investor Relations Analyst Office: 870-875-7683 Office: 870-875-7522 christian.pikul@murphyusa.com joe.vancavage@murphyusa.com
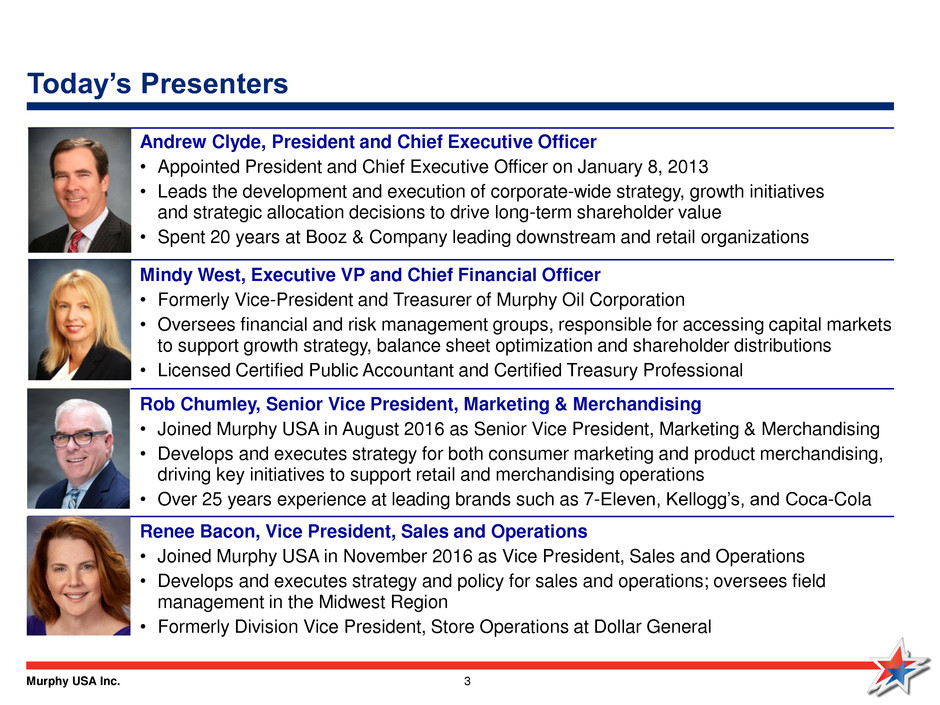
Murphy USA Inc. 3 Today’s Presenters Andrew Clyde, President and Chief Executive Officer • Appointed President and Chief Executive Officer on January 8, 2013 • Leads the development and execution of corporate-wide strategy, growth initiatives and strategic allocation decisions to drive long-term shareholder value • Spent 20 years at Booz & Company leading downstream and retail organizations Mindy West, Executive VP and Chief Financial Officer • Formerly Vice-President and Treasurer of Murphy Oil Corporation • Oversees financial and risk management groups, responsible for accessing capital markets to support growth strategy, balance sheet optimization and shareholder distributions • Licensed Certified Public Accountant and Certified Treasury Professional Rob Chumley, Senior Vice President, Marketing & Merchandising • Joined Murphy USA in August 2016 as Senior Vice President, Marketing & Merchandising • Develops and executes strategy for both consumer marketing and product merchandising, driving key initiatives to support retail and merchandising operations • Over 25 years experience at leading brands such as 7-Eleven, Kellogg’s, and Coca-Cola Renee Bacon, Vice President, Sales and Operations • Joined Murphy USA in November 2016 as Vice President, Sales and Operations • Develops and executes strategy and policy for sales and operations; oversees field management in the Midwest Region • Formerly Division Vice President, Store Operations at Dollar General
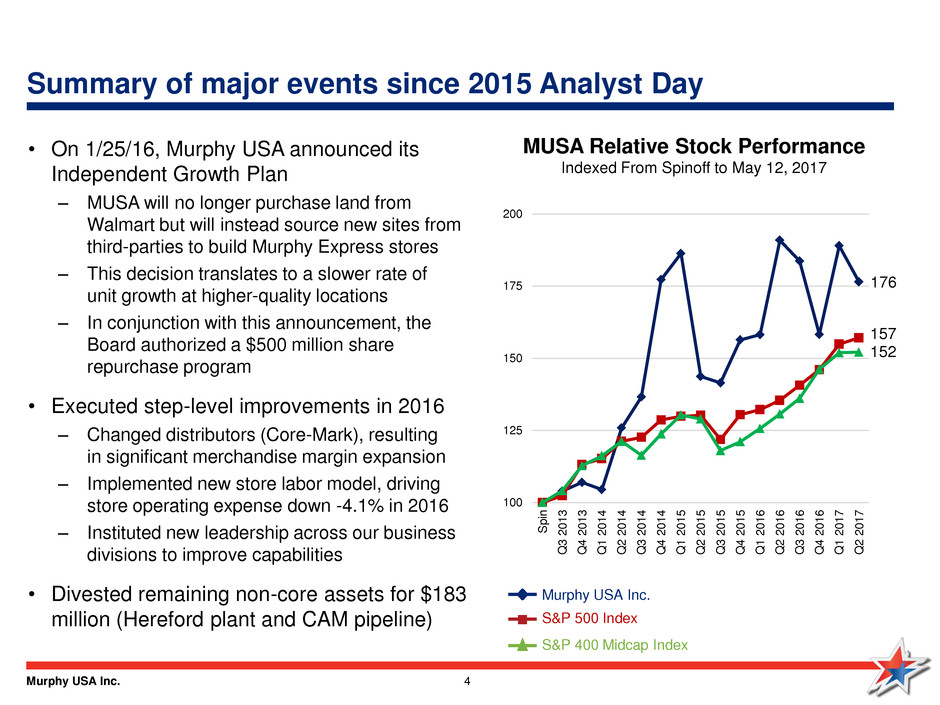
Murphy USA Inc. 4 Summary of major events since 2015 Analyst Day MUSA Relative Stock Performance Indexed From Spinoff to May 12, 2017 Murphy USA Inc. 176 157 152 • On 1/25/16, Murphy USA announced its Independent Growth Plan – MUSA will no longer purchase land from Walmart but will instead source new sites from third-parties to build Murphy Express stores – This decision translates to a slower rate of unit growth at higher-quality locations – In conjunction with this announcement, the Board authorized a $500 million share repurchase program • Executed step-level improvements in 2016 – Changed distributors (Core-Mark), resulting in significant merchandise margin expansion – Implemented new store labor model, driving store operating expense down -4.1% in 2016 – Instituted new leadership across our business divisions to improve capabilities • Divested remaining non-core assets for $183 million (Hereford plant and CAM pipeline) S&P 500 Index S&P 400 Midcap Index 100 125 150 175 200 S p in Q 3 2 0 1 3 Q 4 2 0 1 3 Q 1 2 0 1 4 Q 2 2 0 1 4 Q 3 2 0 1 4 Q 4 2 0 1 4 Q 1 2 0 1 5 Q 2 2 0 1 5 Q 3 2 0 1 5 Q 4 2 0 1 5 Q 1 2 0 1 6 Q 2 2 0 1 6 Q 3 2 0 1 6 Q 4 2 0 1 6 Q 1 2 0 1 7 Q 2 2 0 1 7
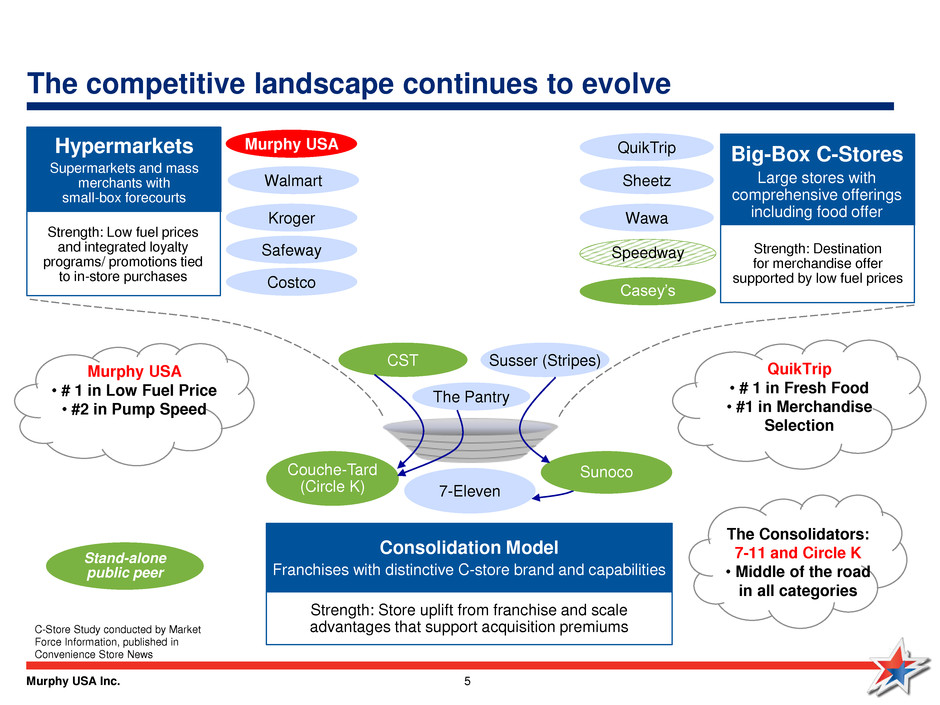
Murphy USA Inc. 5 7-Eleven The competitive landscape continues to evolve Hypermarkets Supermarkets and mass merchants with small-box forecourts Strength: Low fuel prices and integrated loyalty programs/ promotions tied to in-store purchases Big-Box C-Stores Large stores with comprehensive offerings including food offer Strength: Destination for merchandise offer supported by low fuel prices Kroger Safeway Costco Murphy USA Speedway CST Couche-Tard (Circle K) Casey’s QuikTrip Wawa Sheetz Sunoco Stand-alone public peer Consolidation Model Franchises with distinctive C-store brand and capabilities Strength: Store uplift from franchise and scale advantages that support acquisition premiums Susser (Stripes) The Pantry Murphy USA • # 1 in Low Fuel Price • #2 in Pump Speed QuikTrip • # 1 in Fresh Food • #1 in Merchandise Selection The Consolidators: 7-11 and Circle K • Middle of the road in all categories Walmart C-Store Study conducted by Market Force Information, published in Convenience Store News
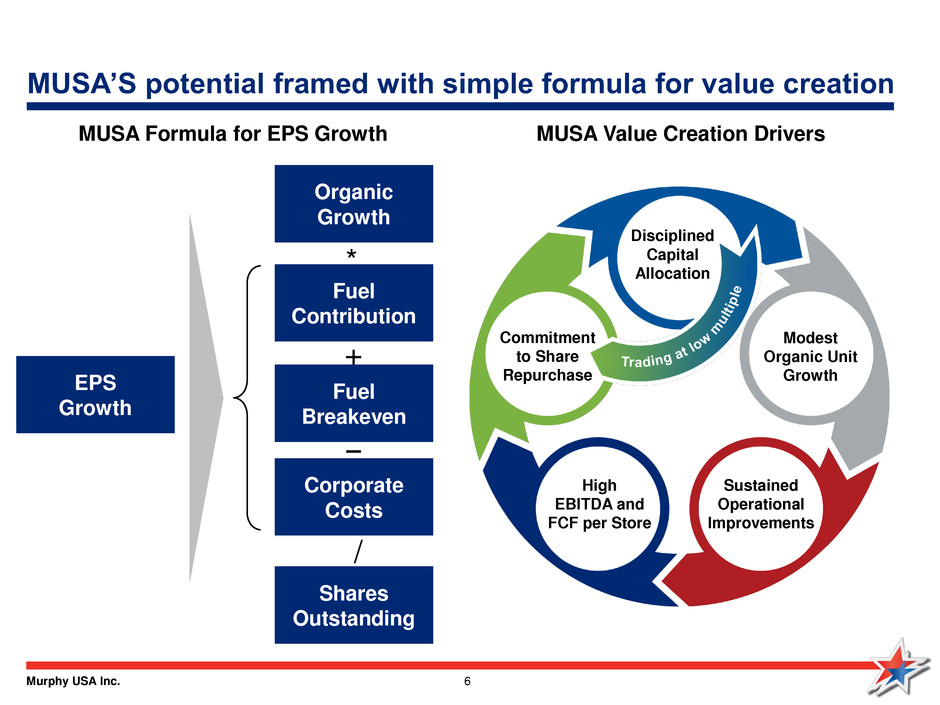
Murphy USA Inc. 6 MUSA’S potential framed with simple formula for value creation Corporate Costs * + − / MUSA Formula for EPS Growth Commitment to Share Repurchase Modest Organic Unit Growth Sustained Operational Improvements High EBITDA and FCF per Store Disciplined Capital Allocation MUSA Value Creation Drivers Shares Outstanding Fuel Breakeven Fuel Contribution Organic Growth EPS Growth
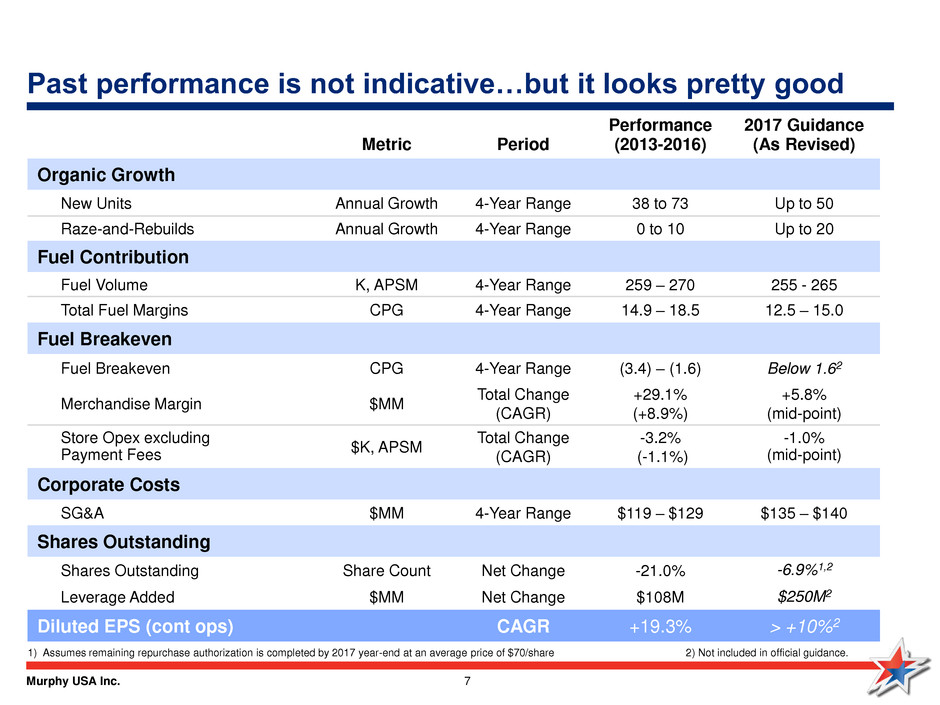
Murphy USA Inc. 7 Past performance is not indicative…but it looks pretty good Metric Period Performance (2013-2016) 2017 Guidance (As Revised) Organic Growth New Units Annual Growth 4-Year Range 38 to 73 Up to 50 Raze-and-Rebuilds Annual Growth 4-Year Range 0 to 10 Up to 20 Fuel Contribution Fuel Volume K, APSM 4-Year Range 259 – 270 255 - 265 Total Fuel Margins CPG 4-Year Range 14.9 – 18.5 12.5 – 15.0 Fuel Breakeven Fuel Breakeven CPG 4-Year Range (3.4) – (1.6) Below 1.62 Merchandise Margin $MM Total Change (CAGR) +29.1% (+8.9%) +5.8% (mid-point) Store Opex excluding Payment Fees $K, APSM Total Change (CAGR) -3.2% (-1.1%) -1.0% (mid-point) Corporate Costs SG&A $MM 4-Year Range $119 – $129 $135 – $140 Shares Outstanding Shares Outstanding Share Count Net Change -21.0% -6.9%1,2 Leverage Added $MM Net Change $108M $250M2 Diluted EPS (cont ops) CAGR +19.3% > +10%2 1) Assumes remaining repurchase authorization is completed by 2017 year-end at an average price of $70/share 2) Not included in official guidance.
Murphy USA Inc. 8 Organic Growth
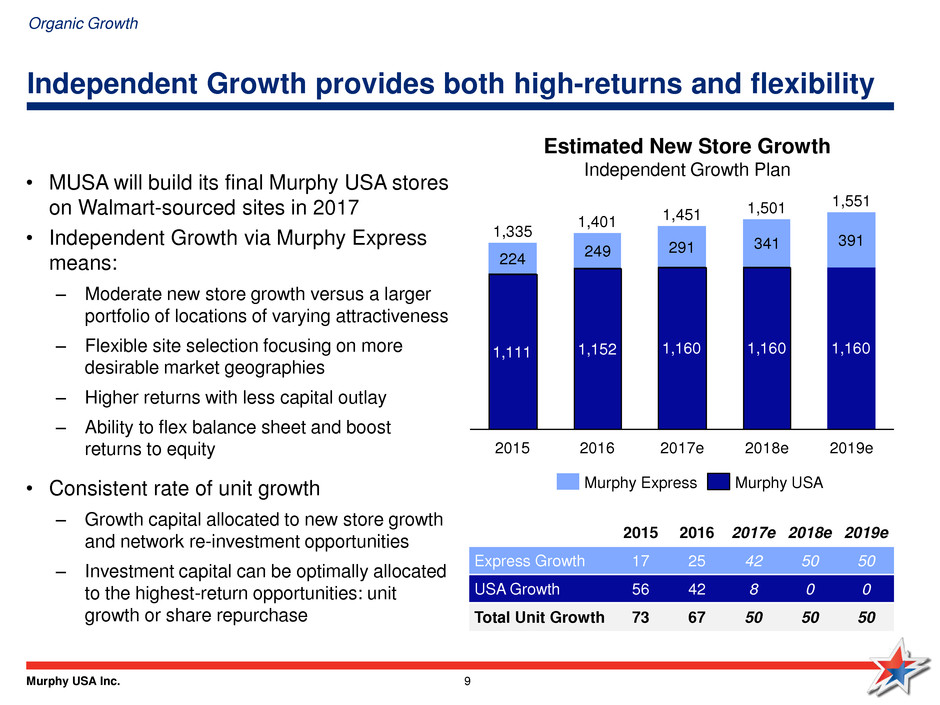
Murphy USA Inc. 9 Independent Growth provides both high-returns and flexibility 1,111 1,152 1,160 1,160 1,160 224 249 291 341 391 2019e 1,551 2018e 1,501 2017e 1,451 2016 1,401 2015 1,335 Murphy USA Murphy Express 2015 2016 2017e 2018e 2019e Express Growth 17 25 42 50 50 USA Growth 56 42 8 0 0 Total Unit Growth 73 67 50 50 50 Estimated New Store Growth Independent Growth Plan • MUSA will build its final Murphy USA stores on Walmart-sourced sites in 2017 • Independent Growth via Murphy Express means: – Moderate new store growth versus a larger portfolio of locations of varying attractiveness – Flexible site selection focusing on more desirable market geographies – Higher returns with less capital outlay – Ability to flex balance sheet and boost returns to equity • Consistent rate of unit growth – Growth capital allocated to new store growth and network re-investment opportunities – Investment capital can be optimally allocated to the highest-return opportunities: unit growth or share repurchase Organic Growth
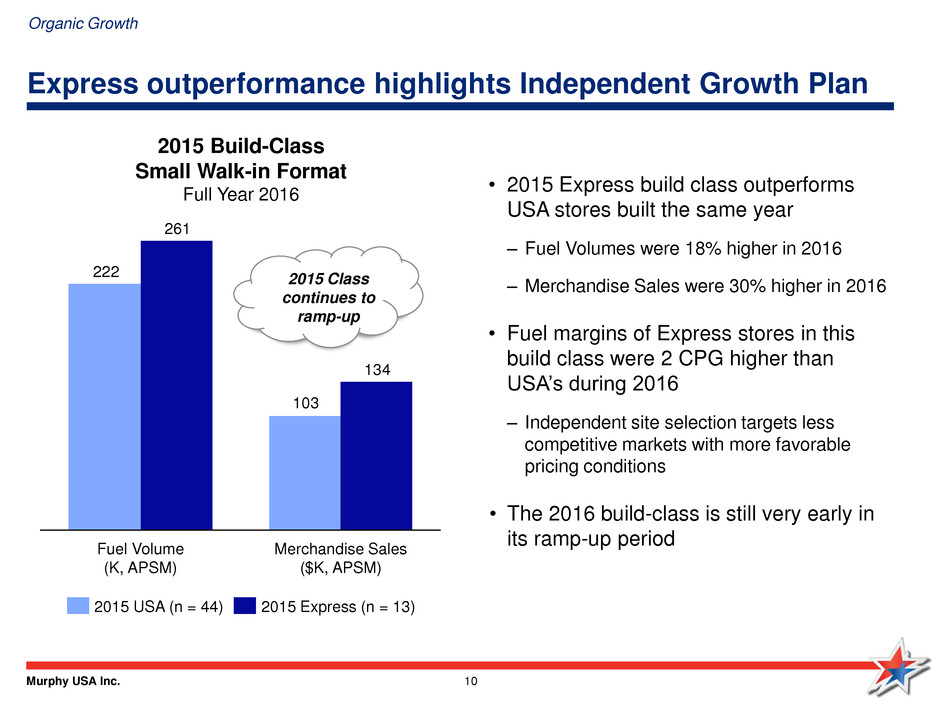
Murphy USA Inc. 10 Express outperformance highlights Independent Growth Plan 2015 Build-Class Small Walk-in Format Full Year 2016 103 222 134 261 Merchandise Sales ($K, APSM) Fuel Volume (K, APSM) 2015 USA (n = 44) 2015 Express (n = 13) • 2015 Express build class outperforms USA stores built the same year – Fuel Volumes were 18% higher in 2016 – Merchandise Sales were 30% higher in 2016 • Fuel margins of Express stores in this build class were 2 CPG higher than USA’s during 2016 – Independent site selection targets less competitive markets with more favorable pricing conditions • The 2016 build-class is still very early in its ramp-up period Organic Growth 2015 Class continues to ramp-up
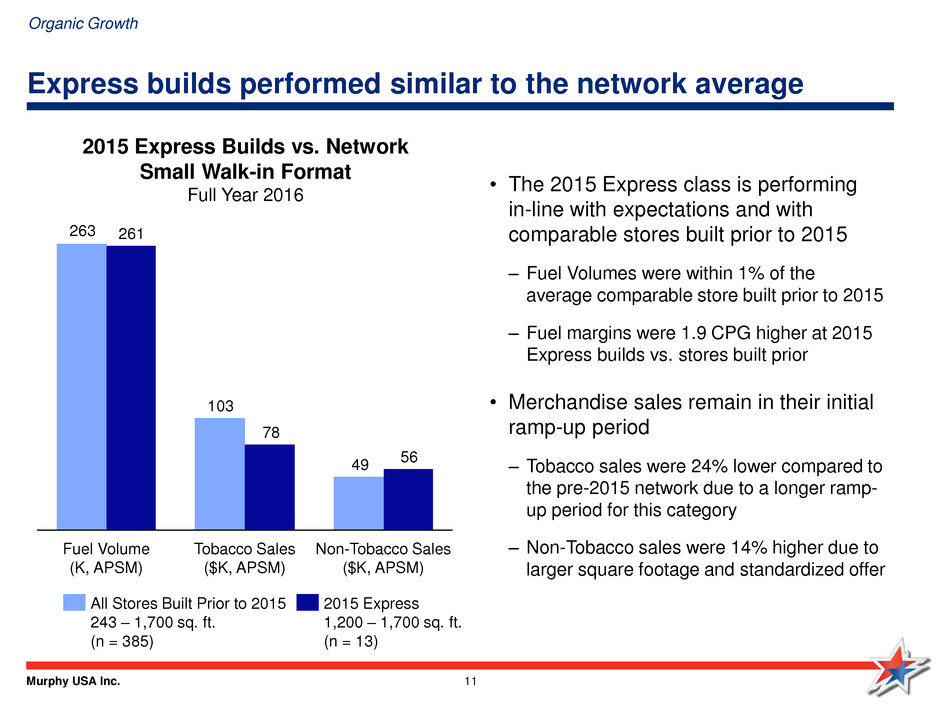
Murphy USA Inc. 11 Express builds performed similar to the network average 2015 Express Builds vs. Network Small Walk-in Format Full Year 2016 49 103 263 56 78 261 Fuel Volume (K, APSM) Tobacco Sales ($K, APSM) Non-Tobacco Sales ($K, APSM) All Stores Built Prior to 2015 243 – 1,700 sq. ft. (n = 385) 2015 Express 1,200 – 1,700 sq. ft. (n = 13) • The 2015 Express class is performing in-line with expectations and with comparable stores built prior to 2015 – Fuel Volumes were within 1% of the average comparable store built prior to 2015 – Fuel margins were 1.9 CPG higher at 2015 Express builds vs. stores built prior • Merchandise sales remain in their initial ramp-up period – Tobacco sales were 24% lower compared to the pre-2015 network due to a longer ramp- up period for this category – Non-Tobacco sales were 14% higher due to larger square footage and standardized offer Organic Growth
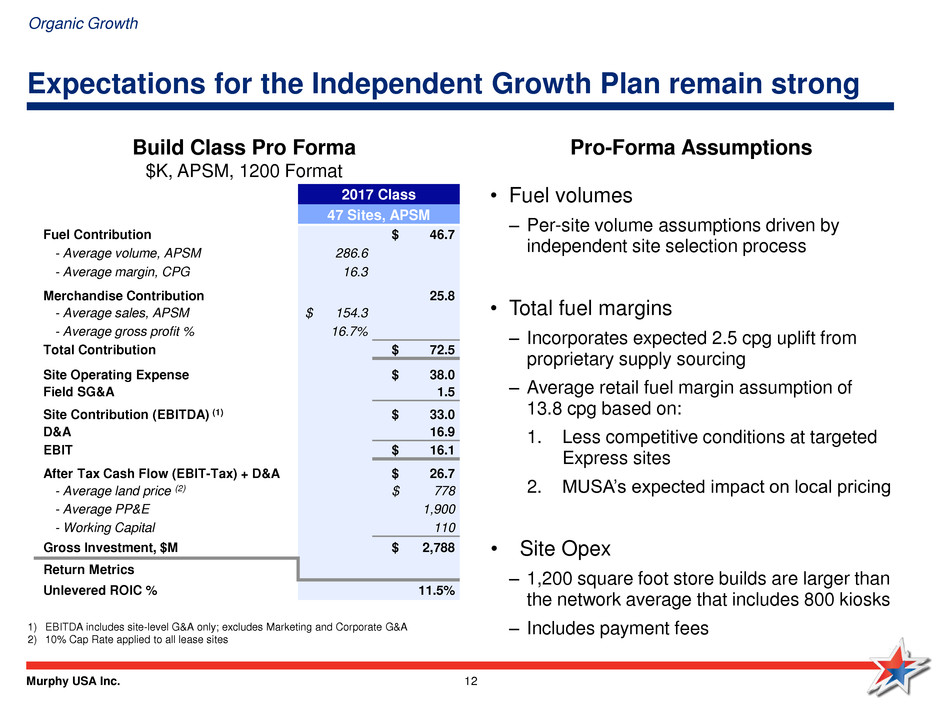
Murphy USA Inc. 12 Expectations for the Independent Growth Plan remain strong 1) EBITDA includes site-level G&A only; excludes Marketing and Corporate G&A 2) 10% Cap Rate applied to all lease sites Build Class Pro Forma $K, APSM, 1200 Format • Fuel volumes – Per-site volume assumptions driven by independent site selection process • Total fuel margins – Incorporates expected 2.5 cpg uplift from proprietary supply sourcing – Average retail fuel margin assumption of 13.8 cpg based on: 1. Less competitive conditions at targeted Express sites 2. MUSA’s expected impact on local pricing • Site Opex – 1,200 square foot store builds are larger than the network average that includes 800 kiosks – Includes payment fees Pro-Forma Assumptions 2017 Class 47 Sites, APSM Fuel Contribution $ 46.7 - Average volume, APSM 286.6 - Average margin, CPG 16.3 Merchandise Contribution 25.8 - Average sales, APSM $ 154.3 - Average gross profit % 16.7% Total Contribution $ 72.5 Site Operating Expense $ 38.0 Field SG&A 1.5 Site Contribution (EBITDA) (1) $ 33.0 D&A 16.9 EBIT $ 16.1 After Tax Cash Flow (EBIT-Tax) + D&A $ 26.7 - Average land price (2) $ 778 - Average PP&E 1,900 - Working Capital 110 Gross Investment, $M $ 2,788 Return Metrics Unlevered ROIC % 11.5% Organic Growth
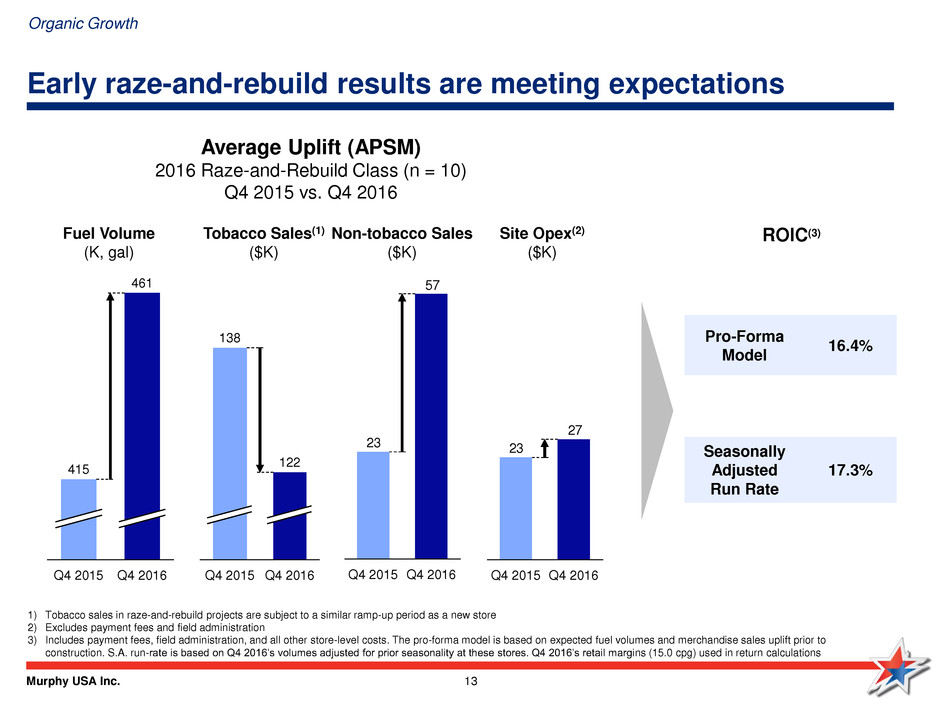
Murphy USA Inc. 13 Early raze-and-rebuild results are meeting expectations Average Uplift (APSM) 2016 Raze-and-Rebuild Class (n = 10) Q4 2015 vs. Q4 2016 461 415 Q4 2016 Q4 2015 122 138 Q4 2016 Q4 2015 57 23 Q4 2015 Q4 2016 Fuel Volume (K, gal) Tobacco Sales(1) ($K) Non-tobacco Sales ($K) 1) Tobacco sales in raze-and-rebuild projects are subject to a similar ramp-up period as a new store 2) Excludes payment fees and field administration 3) Includes payment fees, field administration, and all other store-level costs. The pro-forma model is based on expected fuel volumes and merchandise sales uplift prior to construction. S.A. run-rate is based on Q4 2016’s volumes adjusted for prior seasonality at these stores. Q4 2016’s retail margins (15.0 cpg) used in return calculations ROIC(3) 27 23 Q4 2016 Q4 2015 Site Opex(2) ($K) Seasonally Adjusted Run Rate 17.3% Organic Growth Pro-Forma Model 16.4%
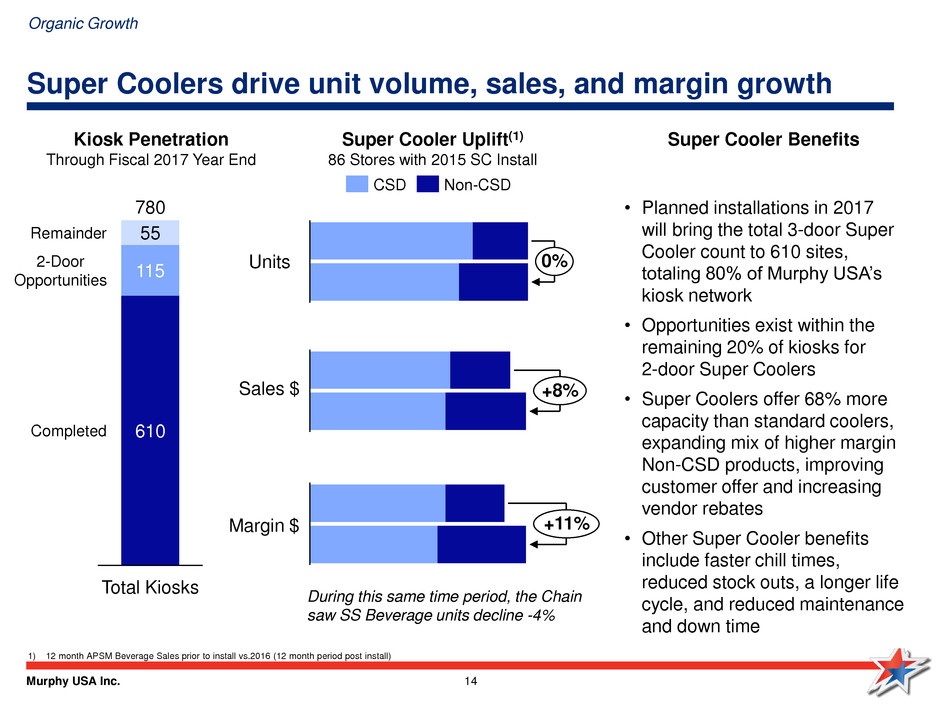
Murphy USA Inc. 14 Super Coolers drive unit volume, sales, and margin growth Organic Growth • Planned installations in 2017 will bring the total 3-door Super Cooler count to 610 sites, totaling 80% of Murphy USA’s kiosk network • Opportunities exist within the remaining 20% of kiosks for 2-door Super Coolers • Super Coolers offer 68% more capacity than standard coolers, expanding mix of higher margin Non-CSD products, improving customer offer and increasing vendor rebates • Other Super Cooler benefits include faster chill times, reduced stock outs, a longer life cycle, and reduced maintenance and down time 1) 12 month APSM Beverage Sales prior to install vs.2016 (12 month period post install) 115 55 Total Kiosks Completed 2-Door Opportunities 780 610 Remainder Kiosk Penetration Through Fiscal 2017 Year End Super Cooler Benefits Super Cooler Uplift(1) 86 Stores with 2015 SC Install Sales $ Margin $ +8% +11% During this same time period, the Chain saw SS Beverage units decline -4% Units 0% CSD Non-CSD
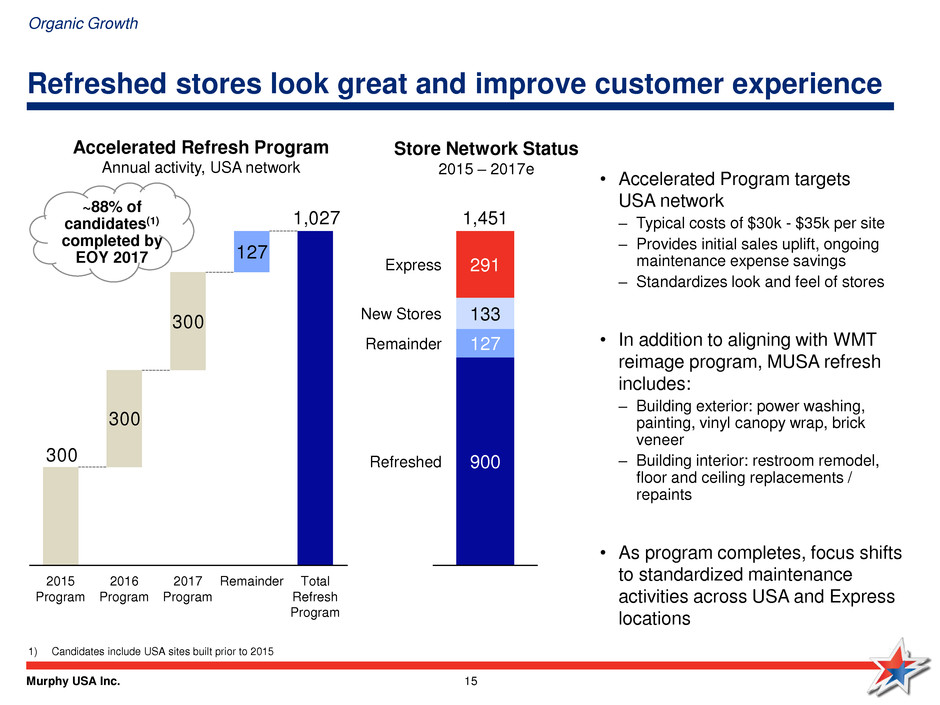
Murphy USA Inc. 15 ~88% of candidates(1) completed by EOY 2017 Refreshed stores look great and improve customer experience • Accelerated Program targets USA network – Typical costs of $30k - $35k per site – Provides initial sales uplift, ongoing maintenance expense savings – Standardizes look and feel of stores • In addition to aligning with WMT reimage program, MUSA refresh includes: – Building exterior: power washing, painting, vinyl canopy wrap, brick veneer – Building interior: restroom remodel, floor and ceiling replacements / repaints • As program completes, focus shifts to standardized maintenance activities across USA and Express locations Accelerated Refresh Program Annual activity, USA network 1) Candidates include USA sites built prior to 2015 Store Network Status 2015 – 2017e 300 300 127 1,027 300 Total Refresh Program Remainder 2017 Program 2016 Program 2015 Program 1,451 900 127 133 291 Refreshed Remainder New Stores Express Organic Growth
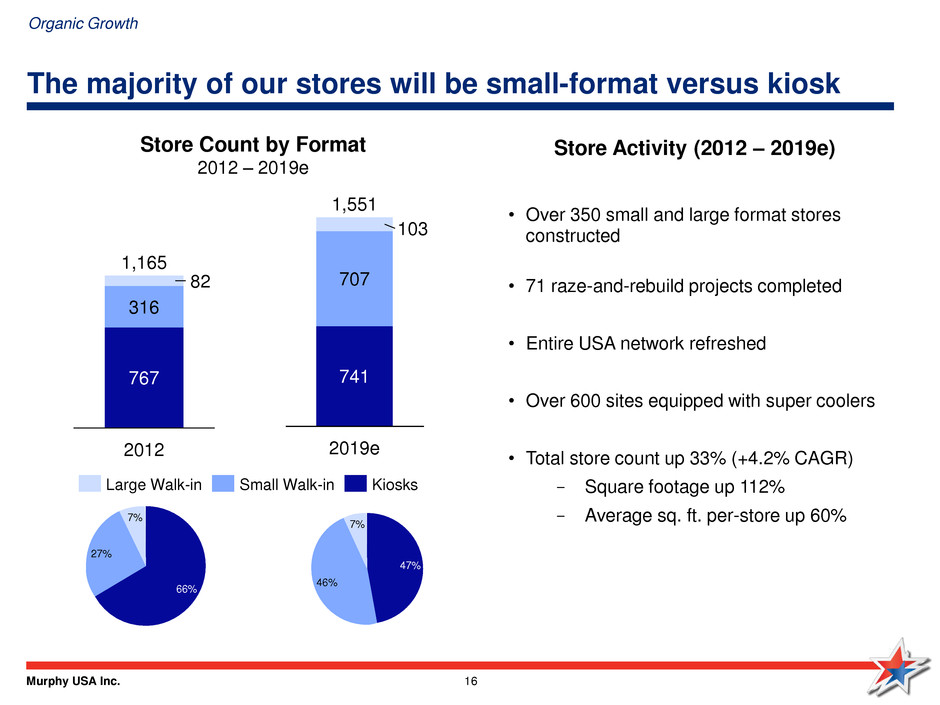
Murphy USA Inc. 16 The majority of our stores will be small-format versus kiosk 82 2012 316 767 1,165 2019e 741 707 103 1,551 Large Walk-in Small Walk-in Kiosks 7% 27% 66% 47% 7% 46% Store Count by Format 2012 – 2019e Organic Growth • Over 350 small and large format stores constructed • 71 raze-and-rebuild projects completed • Entire USA network refreshed • Over 600 sites equipped with super coolers • Total store count up 33% (+4.2% CAGR) - Square footage up 112% - Average sq. ft. per-store up 60% Store Activity (2012 – 2019e)
Murphy USA Inc. 17 Fuel Contribution
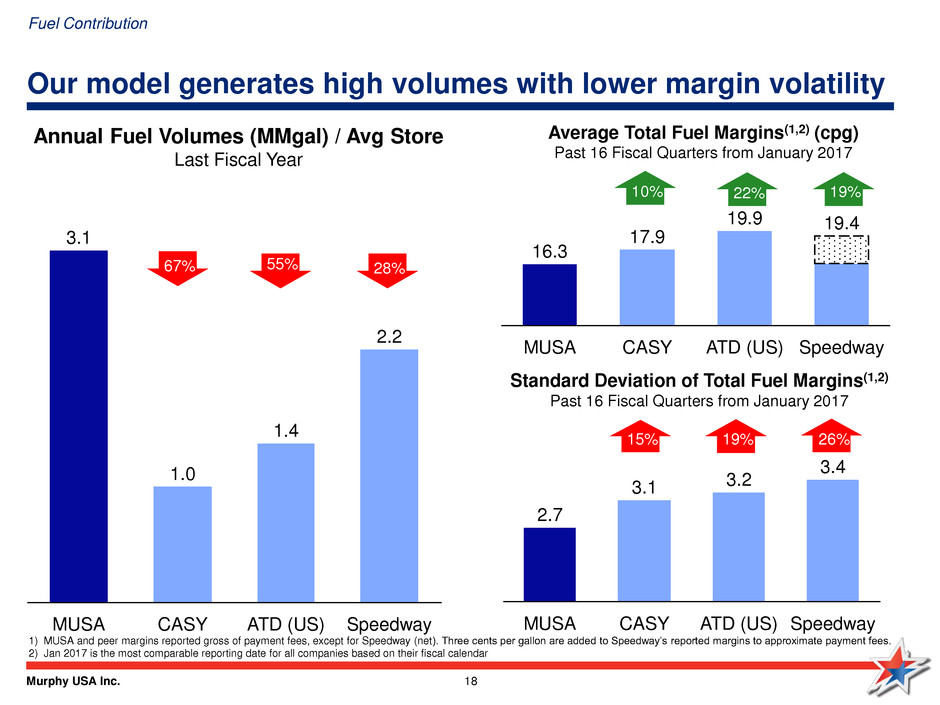
Murphy USA Inc. 18 Our model generates high volumes with lower margin volatility 2.2 MUSA CASY Speedway 1.0 ATD (US) 1.4 3.1 ATD (US) 17.9 19.4 19.9 CASY Speedway MUSA 16.3 3.4 ATD (US) Speedway CASY 2.7 3.2 MUSA 3.1 Standard Deviation of Total Fuel Margins(1,2) Past 16 Fiscal Quarters from January 2017 Average Total Fuel Margins(1,2) (cpg) Past 16 Fiscal Quarters from January 2017 1) MUSA and peer margins reported gross of payment fees, except for Speedway (net). Three cents per gallon are added to Speedway’s reported margins to approximate payment fees. 2) Jan 2017 is the most comparable reporting date for all companies based on their fiscal calendar Annual Fuel Volumes (MMgal) / Avg Store Last Fiscal Year Fuel Contribution 67% 55% 28% 10% 22% 19% 15% 19% 26%
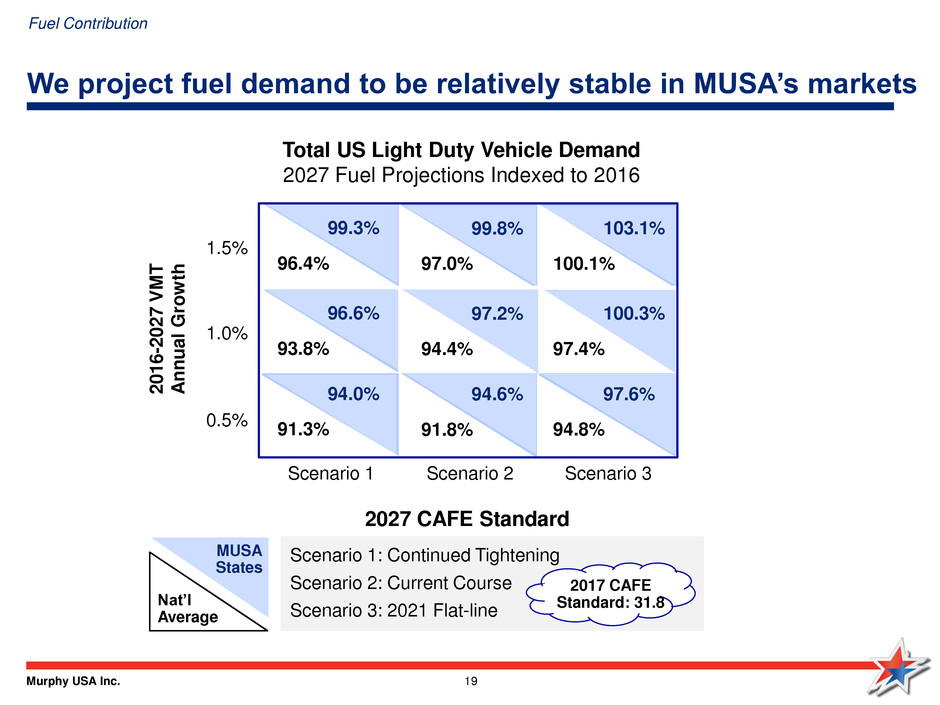
Murphy USA Inc. 19 We project fuel demand to be relatively stable in MUSA’s markets 2027 CAFE Standard 2 0 1 6 -202 7 V M T A n n u a l G ro w th Total US Light Duty Vehicle Demand 2027 Fuel Projections Indexed to 2016 Scenario 1: Continued Tightening Scenario 2: Current Course Scenario 3: 2021 Flat-line 2017 CAFE Standard: 31.8 96.4% 97.0% 100.1% 93.8% 94.4% 97.4% 91.3% 91.8% 94.8% 99.3% 99.8% 103.1% 96.6% 97.2% 100.3% 94.0% 94.6% 97.6% MUSA States Nat’l Average Fuel Contribution 1.5% 1.0% 0.5% Scenario 1 Scenario 2 Scenario 3
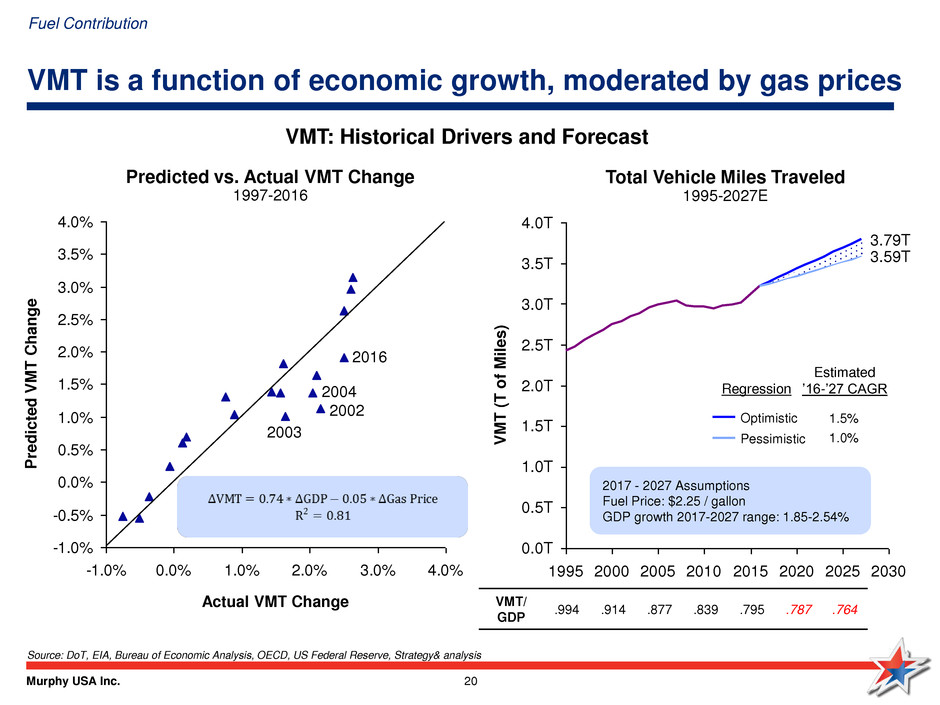
Murphy USA Inc. 20 VMT is a function of economic growth, moderated by gas prices Predicted vs. Actual VMT Change 1997-2016 Source: DoT, EIA, Bureau of Economic Analysis, OECD, US Federal Reserve, Strategy& analysis -1.0% -0.5% 0.0% 0.5% 1.0% 1.5% 2.0% 2.5% 3.0% 3.5% 4.0% -1.0% 0.0% 1.0% 2.0% 3.0% 4.0%P re di c te d V M T Chang e Actual VMT Change 2016 2004 2003 2002 VMT: Historical Drivers and Forecast 1995 2000 2005 201 2015 2020 2025 2030 2.0T 0.5T 0.0T 1.5T 3.5T 4.0T 1.0T 3.0T 2.5T 3.59T V M T ( T of M il e s ) 3.79T Total Vehicle Miles Traveled 1995-2027E Optimistic Pessimistic Regression Estimated ’16-’27 CAGR 1.5% 1.0% VMT/ GDP .994 .914 .877 .839 .795 .787 .764 2017 - 2027 Assumptions Fuel Price: $2.25 / gallon GDP growth 2017-2027 range: 1.85-2.54% Fuel Contribution
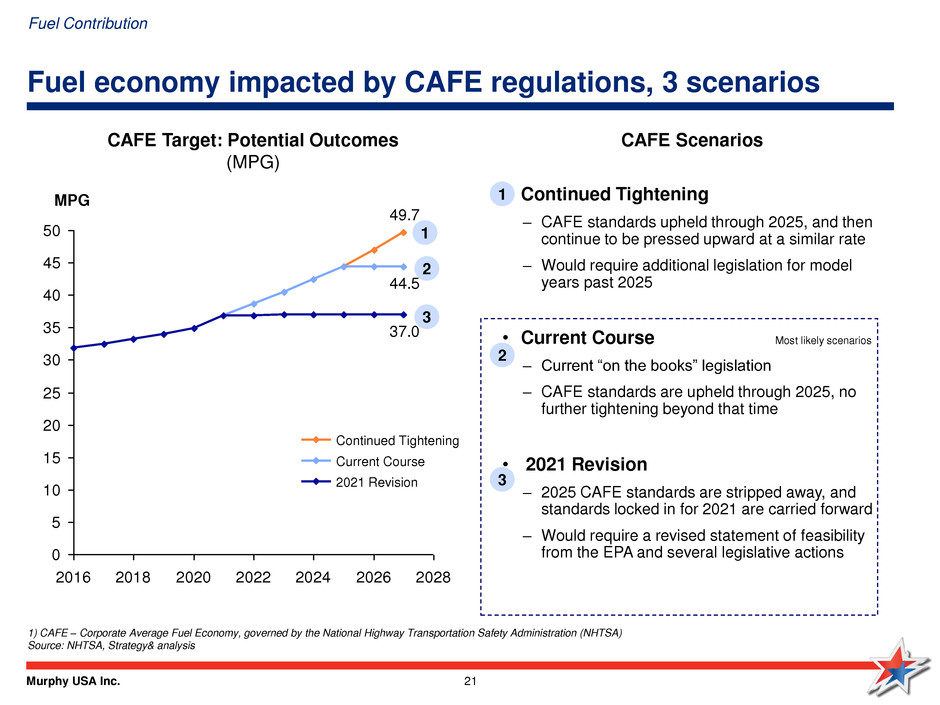
Murphy USA Inc. 21 Fuel economy impacted by CAFE regulations, 3 scenarios 49.7 44.5 37.0 0 5 10 15 20 25 30 35 40 45 50 2016 2018 2020 2022 2024 2026 2028 MPG 2021 Revision Current Course Continued Tightening CAFE Target: Potential Outcomes (MPG) • Continued Tightening – CAFE standards upheld through 2025, and then continue to be pressed upward at a similar rate – Would require additional legislation for model years past 2025 • Current Course – Current “on the books” legislation – CAFE standards are upheld through 2025, no further tightening beyond that time • 2021 Revision – 2025 CAFE standards are stripped away, and standards locked in for 2021 are carried forward – Would require a revised statement of feasibility from the EPA and several legislative actions CAFE Scenarios 1) CAFE – Corporate Average Fuel Economy, governed by the National Highway Transportation Safety Administration (NHTSA) Source: NHTSA, Strategy& analysis Most likely scenarios 1 2 3 1 2 3 Fuel Contribution
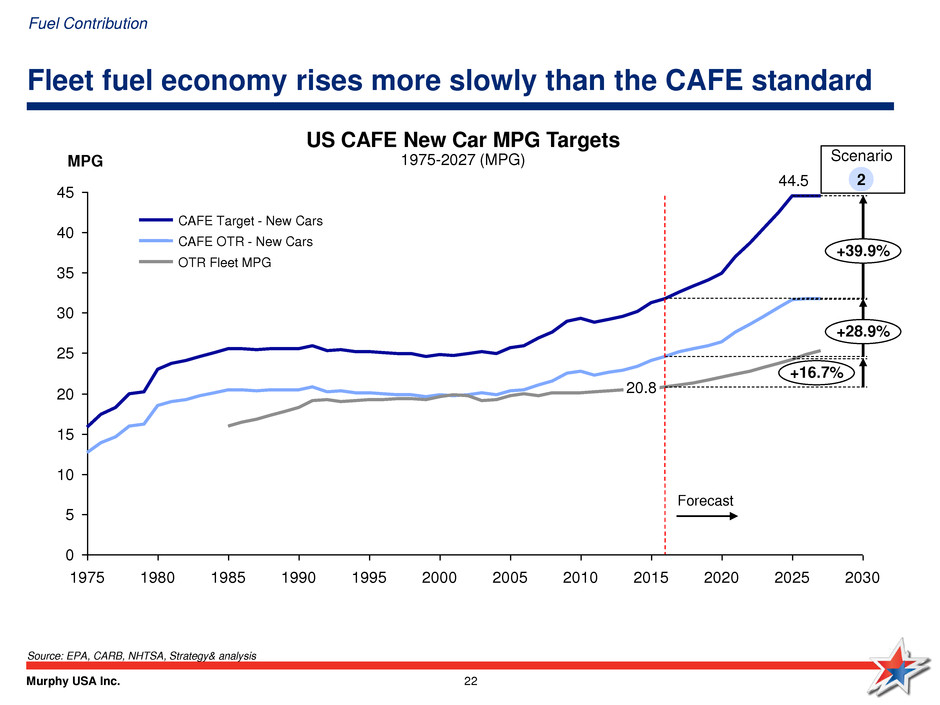
Murphy USA Inc. 22 Fleet fuel economy rises more slowly than the CAFE standard US CAFE New Car MPG Targets 1975-2027 (MPG) Source: EPA, CARB, NHTSA, Strategy& analysis 44.5 0 5 10 15 20 25 30 35 40 45 1975 1980 1985 1990 1995 2000 2005 2010 2015 2020 2025 2030 20.8 MPG +39.9% +16.7% +28.9% OTR Fleet MPG CAFE OTR - New Cars CAFE Target - New Cars Forecast 2 Scenario Fuel Contribution
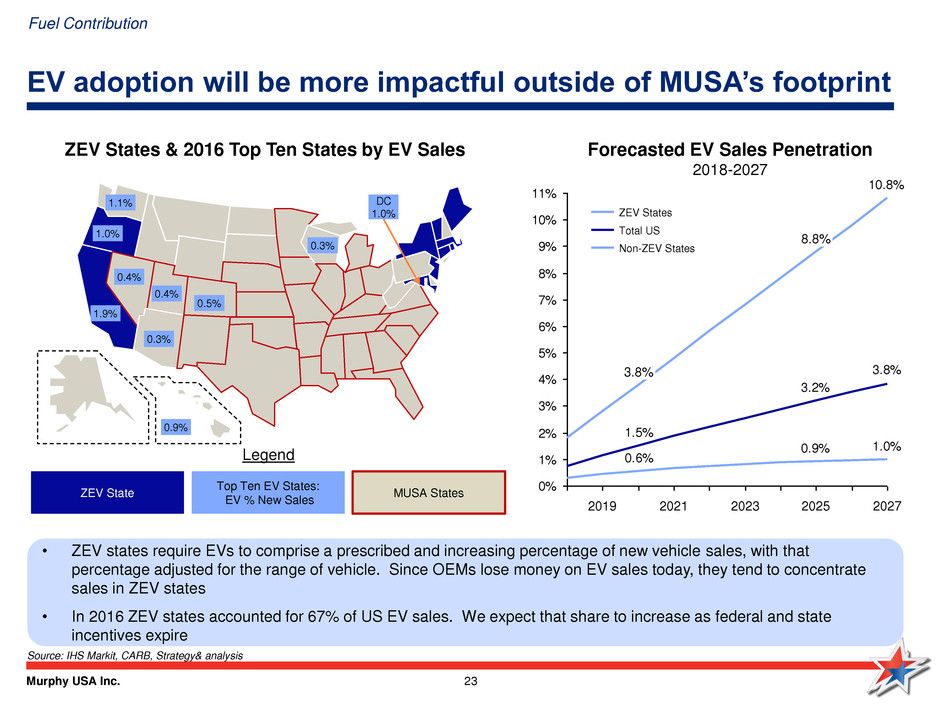
Murphy USA Inc. 23 EV adoption will be more impactful outside of MUSA’s footprint 1.9% 1.1% 1.0% 0.9% 0.5% 0.4% 0.3% 0.4% 0.3% DC 1.0% ZEV States & 2016 Top Ten States by EV Sales ZEV State Top Ten EV States: EV % New Sales Legend MUSA States 10.8% 3.8% 3.2% 1.5% 1.0%0.9% 0.6% 0% 1% 2% 3% 4% 5% 6% 7% 8% 9% 10% 11% 2023 2019 2021 2025 2027 8.8% 3.8% Non-ZEV States Total US ZEV States Forecasted EV Sales Penetration 2018-2027 Source: IHS Markit, CARB, Strategy& analysis • ZEV states require EVs to comprise a prescribed and increasing percentage of new vehicle sales, with that percentage adjusted for the range of vehicle. Since OEMs lose money on EV sales today, they tend to concentrate sales in ZEV states • In 2016 ZEV states accounted for 67% of US EV sales. We expect that share to increase as federal and state incentives expire Fuel Contribution
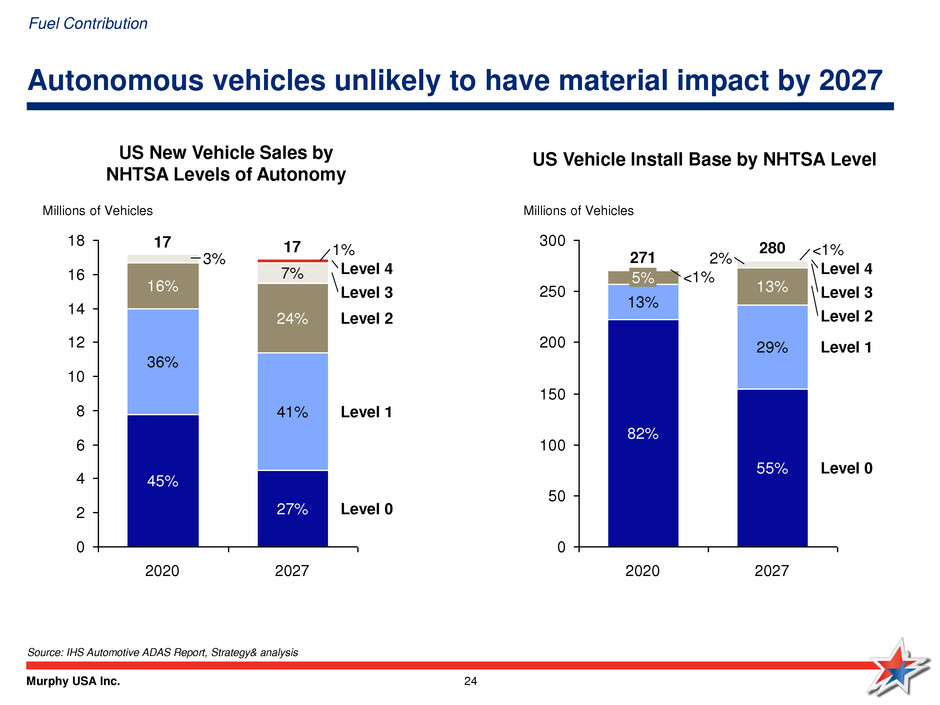
Murphy USA Inc. 24 0 2 4 6 8 10 12 14 16 18 Millions of Vehicles Level 1 Level 3 Level 0 Level 2 Level 4 24% 2027 36% 3% 41% 27% 17 7% 1% 2020 45% 16% 17 US New Vehicle Sales by NHTSA Levels of Autonomy Source: IHS Automotive ADAS Report, Strategy& analysis Autonomous vehicles unlikely to have material impact by 2027 0 50 100 150 200 250 300 2% <1% 2027 29% 2020 271 82% Level 3 Level 0 Level 4 Millions of Vehicles 13% 280 Level 1 Level 2 55% <1% 13% 5% US Vehicle Install Base by NHTSA Level Fuel Contribution

Murphy USA Inc. 25 Other disruptions to demand are unlikely to impact our forecast Summary Electric Vehicles • Substantial EV penetration will occur only when they are economically attractive relative to ICE vehicles • Under current and plausible US gas prices and vehicle incentives EVs are “out of the money” and will be until battery costs fall to $100/kwh or less • When – not if – that price point is reached, we can expect quite rapid adoption of EVs – likely starting near 2030 Autonomous Vehicles • Autonomous vehicles will be highly disruptive to the vehicle value chain as usage patterns, design attributes ownership etc. all shift radically • While experiments and some quite large scale tests will occur in the years ahead, we don’t expect any significant adoption of this technology until 2030 at the earliest – and most/all of these vehicles will be EV Ride Hailing • Ride hailing is growing rapidly but is tiny proportion of all passenger miles • For most consumers, ride hailing, while cheaper than taxis and sometimes public transport, is still much more expensive than private car ownership for most driving • Ride hailing growth could create a small segment of “semi-professional” drivers which could be of interest in our most urban markets Millennials • Millennials are a large cohort of the population just now moving into their peak driving years • Millennials have been postponing many of life’s major stage gates (e.g. leaving home, marriage, kids etc.), though the trend towards “later adulthood” has been in progress for many years • This trend, includes driving: Millennials are significantly less likely to have driver’s licenses than earlier generations at the same age • Although millennials are likely to catch-up in some areas, on many dimensions, a divergence from “normal” is to be expected Online Shopping • E-commerce continues to capture share across the retail sector, though not all categories are equally susceptible • Shopping-related trips represent less than 10% of VMT limiting the mileage at risk • From MUSA’s perspective the biggest potential issue is online shopping’s impact on Walmart store traffic Fuel Contribution
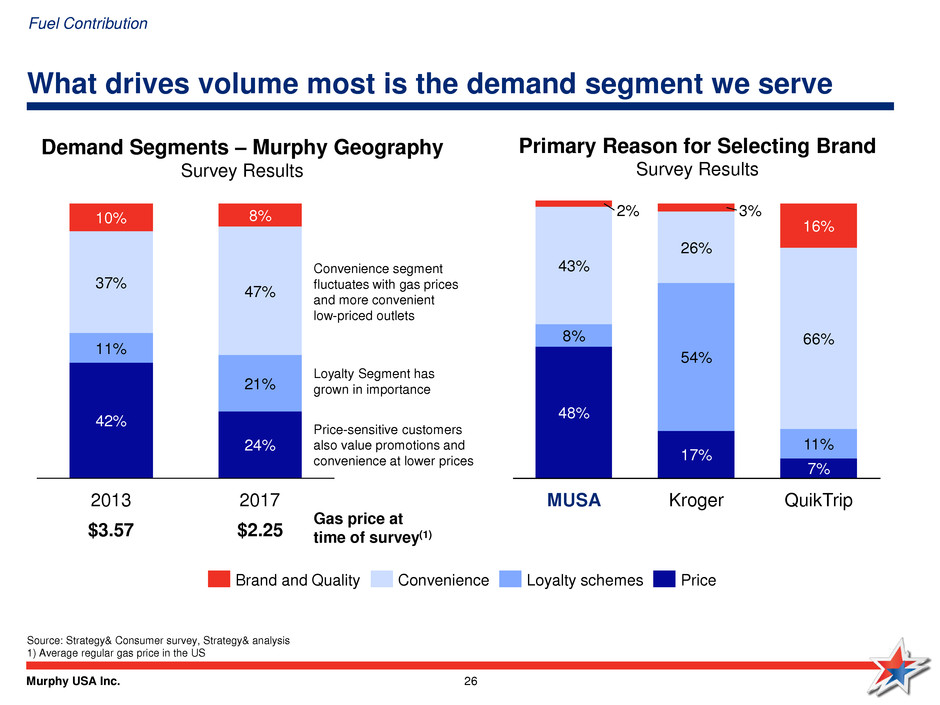
Murphy USA Inc. 26 What drives volume most is the demand segment we serve Demand Segments – Murphy Geography Survey Results Gas price at time of survey(1) 42% 24% 37% 47% 8% 21% 11% 10% 2017 2013 QuikTrip 7% 11% 66% 16% Kroger 17% 54% 26% 3% MUSA 48% 8% 43% 2% Source: Strategy& Consumer survey, Strategy& analysis 1) Average regular gas price in the US Primary Reason for Selecting Brand Survey Results Convenience segment fluctuates with gas prices and more convenient low-priced outlets Price Loyalty schemes Convenience Brand and Quality Loyalty Segment has grown in importance Price-sensitive customers also value promotions and convenience at lower prices Fuel Contribution $3.57 $2.25
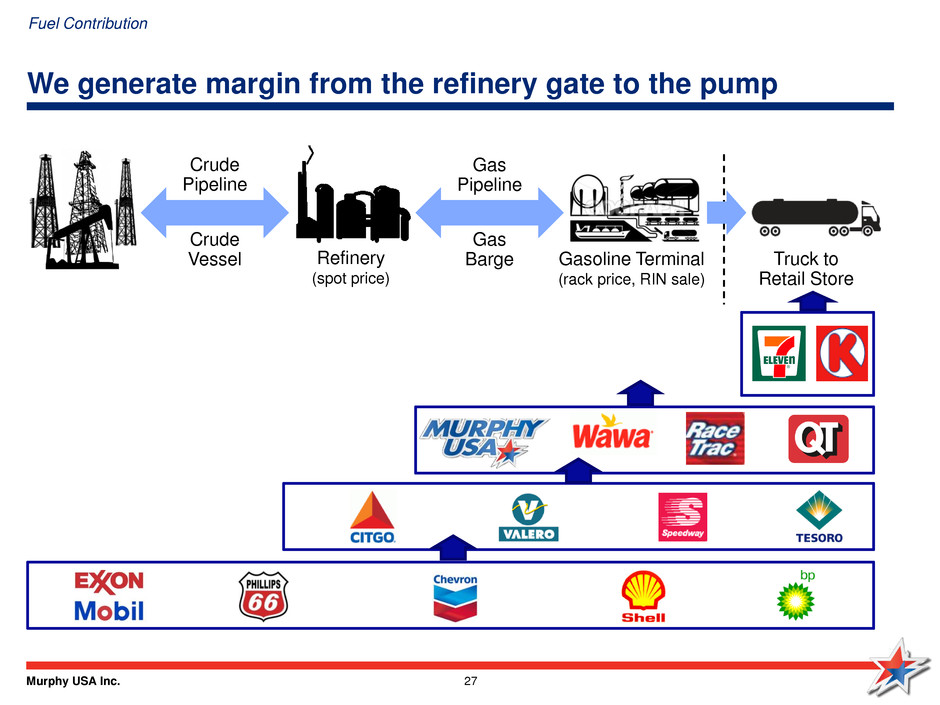
Murphy USA Inc. 27 We generate margin from the refinery gate to the pump Gas Pipeline Truck to Retail Store Refinery (spot price) Gasoline Terminal (rack price, RIN sale) Gas Barge Crude Pipeline Crude Vessel Fuel Contribution
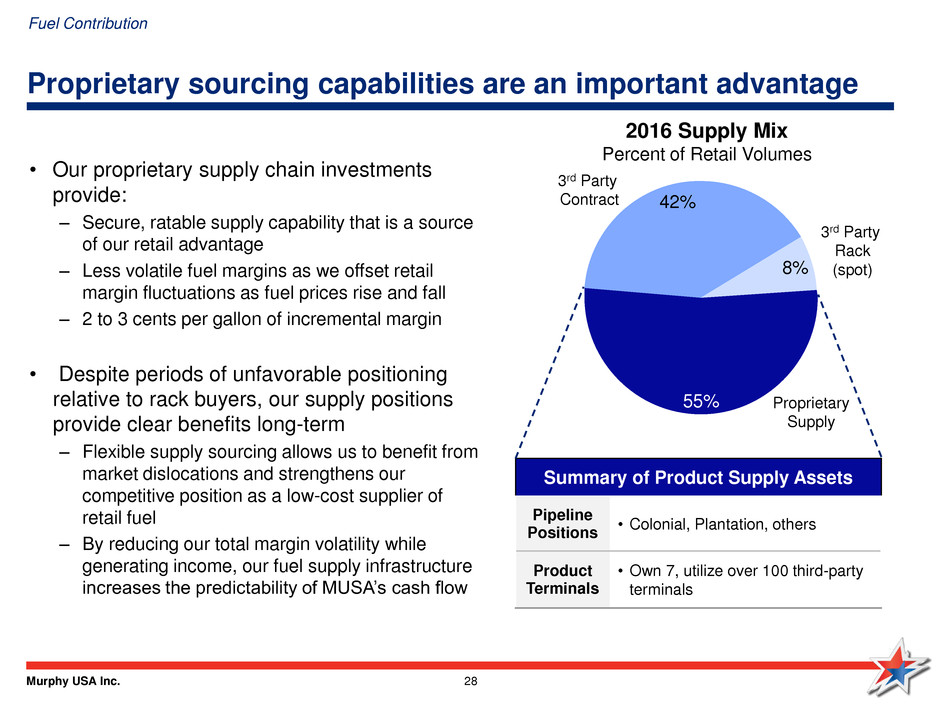
Murphy USA Inc. 28 Proprietary sourcing capabilities are an important advantage 3rd Party Rack (spot) 3rd Party Contract Proprietary Supply 8% 42% 55% • Our proprietary supply chain investments provide: – Secure, ratable supply capability that is a source of our retail advantage – Less volatile fuel margins as we offset retail margin fluctuations as fuel prices rise and fall – 2 to 3 cents per gallon of incremental margin • Despite periods of unfavorable positioning relative to rack buyers, our supply positions provide clear benefits long-term – Flexible supply sourcing allows us to benefit from market dislocations and strengthens our competitive position as a low-cost supplier of retail fuel – By reducing our total margin volatility while generating income, our fuel supply infrastructure increases the predictability of MUSA’s cash flow 2016 Supply Mix Percent of Retail Volumes Summary of Product Supply Assets Pipeline Positions • Colonial, Plantation, others Product Terminals • Own 7, utilize over 100 third-party terminals Fuel Contribution
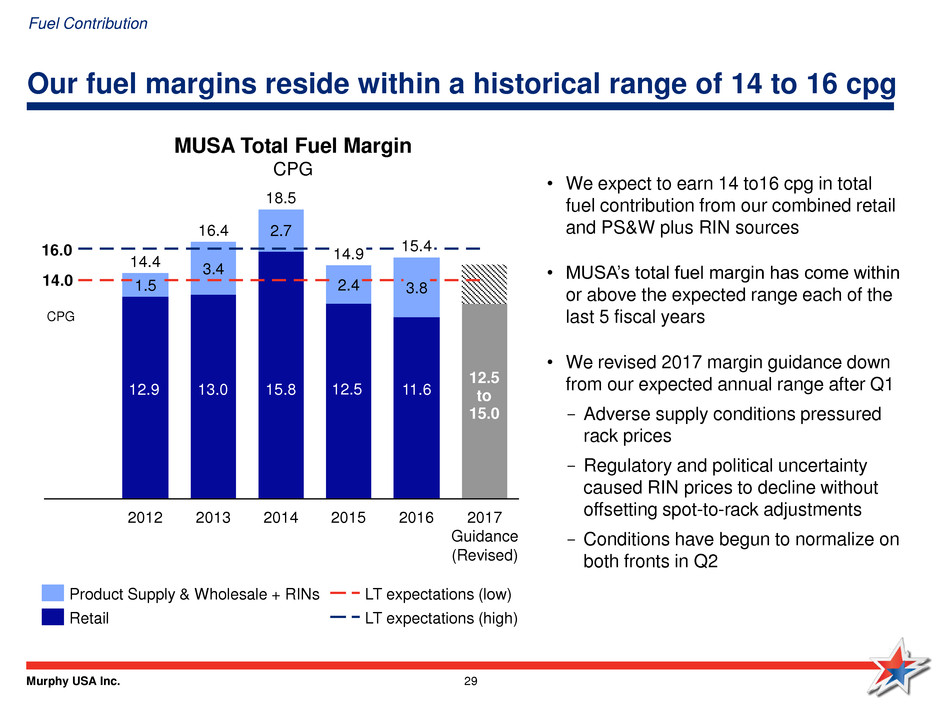
Murphy USA Inc. 29 Our fuel margins reside within a historical range of 14 to 16 cpg 2.7 3.4 16.4 2017 Guidance (Revised) 14.9 18.5 15.4 3.8 2016 2014 2.4 2015 2013 1.5 14.4 2012 Product Supply & Wholesale + RINs LT expectations (low) LT expectations (high) Retail MUSA Total Fuel Margin CPG CPG 16.0 14.0 $631 $486 $515 $496 $491 • We expect to earn 14 to16 cpg in total fuel contribution from our combined retail and PS&W plus RIN sources • MUSA’s total fuel margin has come within or above the expected range each of the last 5 fiscal years • We revised 2017 margin guidance down from our expected annual range after Q1 - Adverse supply conditions pressured rack prices - Regulatory and political uncertainty caused RIN prices to decline without offsetting spot-to-rack adjustments - Conditions have begun to normalize on both fronts in Q2 12.5 to 15.0 Fuel Contribution 12.9 13.0 15.8 12.5 11.6
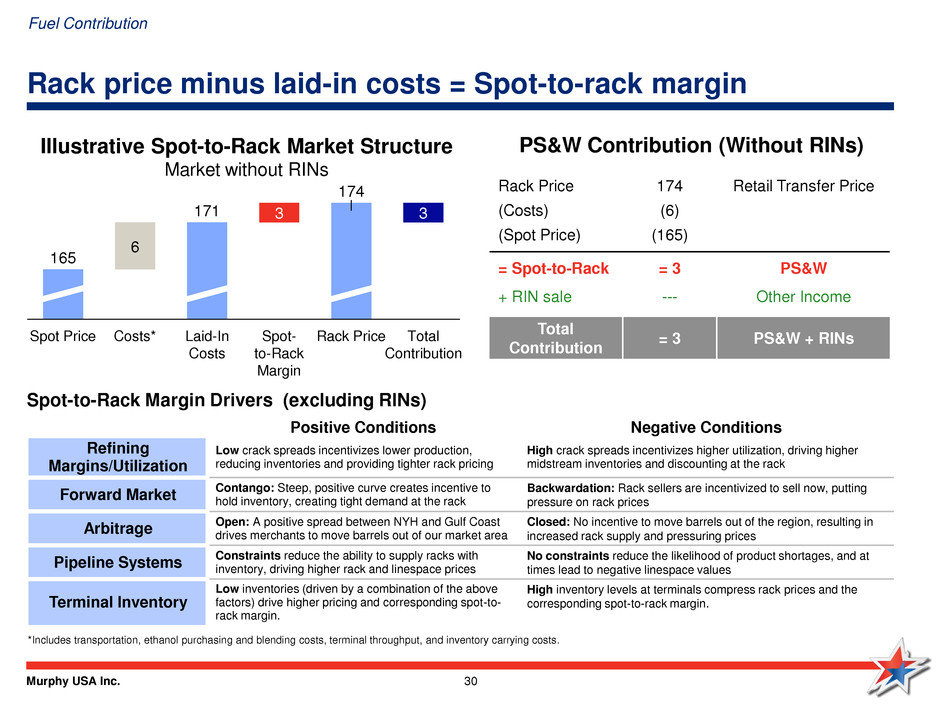
Murphy USA Inc. 30 Rack price minus laid-in costs = Spot-to-rack margin Illustrative Spot-to-Rack Market Structure Market without RINs 3 6 3 Total Contribution Rack Price 174 Spot- to-Rack Margin Laid-In Costs 171 Costs* Spot Price 165 Positive Conditions Negative Conditions Refining Margins/Utilization Low crack spreads incentivizes lower production, reducing inventories and providing tighter rack pricing High crack spreads incentivizes higher utilization, driving higher midstream inventories and discounting at the rack Forward Market Contango: Steep, positive curve creates incentive to hold inventory, creating tight demand at the rack Backwardation: Rack sellers are incentivized to sell now, putting pressure on rack prices Arbitrage Open: A positive spread between NYH and Gulf Coast drives merchants to move barrels out of our market area Closed: No incentive to move barrels out of the region, resulting in increased rack supply and pressuring prices Pipeline Systems Constraints reduce the ability to supply racks with inventory, driving higher rack and linespace prices No constraints reduce the likelihood of product shortages, and at times lead to negative linespace values Terminal Inventory Low inventories (driven by a combination of the above factors) drive higher pricing and corresponding spot-to- rack margin. High inventory levels at terminals compress rack prices and the corresponding spot-to-rack margin. Rack Price 174 Retail Transfer Price (Costs) (6) (Spot Price) (165) = Spot-to-Rack = 3 PS&W + RIN sale --- Other Income Total Contribution = 3 PS&W + RINs *Includes transportation, ethanol purchasing and blending costs, terminal throughput, and inventory carrying costs. PS&W Contribution (Without RINs) Fuel Contribution Spot-to-Rack Margin Drivers (excluding RINs)

Murphy USA Inc. 31 RINs are in spot price—offsetting negative spot-to-rack margins Illustrative Spot-to-Rack Market Structure With RINs 106 3 10 Total Contribution RIN Sale Rack Price 174 Spot- to-Rack Margin (7) Laid-In Costs 181 Costs* Spot Price 175 165 *Includes transportation, ethanol purchasing and blending costs, terminal throughput, and inventory carrying costs. PS&W Contribution (With RINs) Refiners and Importers incorporate their expected RIN costs in the spot price… …thus, RIN income is not a windfall Fuel Contribution Rack Price 174 Retail Transfer Price (Costs) (6) (Spot Price) (175) = Spot-to-Rack = (7) PS&W + RIN +10 Other Income Total Contribution = 3 PS&W + RINs

Murphy USA Inc. 32 -10 -5 0 5 10 15 20 25 100 150 200 50 0 300 250 Q2 Q4 Q3 Q1 Q4 Q3 Q2 Q1 Q4 Q3 Q2 Q1 Our integrated supply assets naturally reduce margin volatility -71 -26 29 181 118 93 2015 2014 2016 Combined RINs Spot-to-Rack Spot-to-Rack vs. RIN Contribution ($MM) 2014-2016 Margin Contribution (CPG) by Driver 2014-2016 CPG CPG Product Supply Inventory Gain/Loss Retail Margins 2014 2015 2016 RIN prices offset in spot-to-rack margin Price swings inversely affect retail margins and inventory gains US Gulf Coast Spot Price (right) Fuel Contribution

Murphy USA Inc. 33 The RFS program is working as intended for all parties Key Elements Attributes of the RFS Program Clear Goals • Current system provides a workable, stable, program that uses RINs as an incentive to increase volumes of renewable fuels in the transportation pool Well-Established Framework and Rules • System fully understood by market participants • Clear requirements that are easily monitored and enforced Effective controls • Sophisticated and stable obligated parties • Established electronic reporting system Infinite Flexibility • RFS compliance can be achieved, from blending to acquiring RINs in the market • Regulated parties can make strategic and tactical choices regarding asset ownership and supply chain participation to optimally run their businesses • Excess RINs act as a buffer for obligated parties to protect them from unforeseen changes in RIN market Essential Liquidity • Many motivated sellers who offset their losses from subsidized fuel with RINs • Smaller number of unbalanced obligated parties • Narrow Bid/Ask spreads with brokers matching buyers and sellers Impartial Equity • Participants have the choice whether to invest/participate in parts of value chain • RINs are “agnostic” as to whether a company is advantaged or disadvantaged competitor in its respective industry or part of the supply chain Fuel Contribution
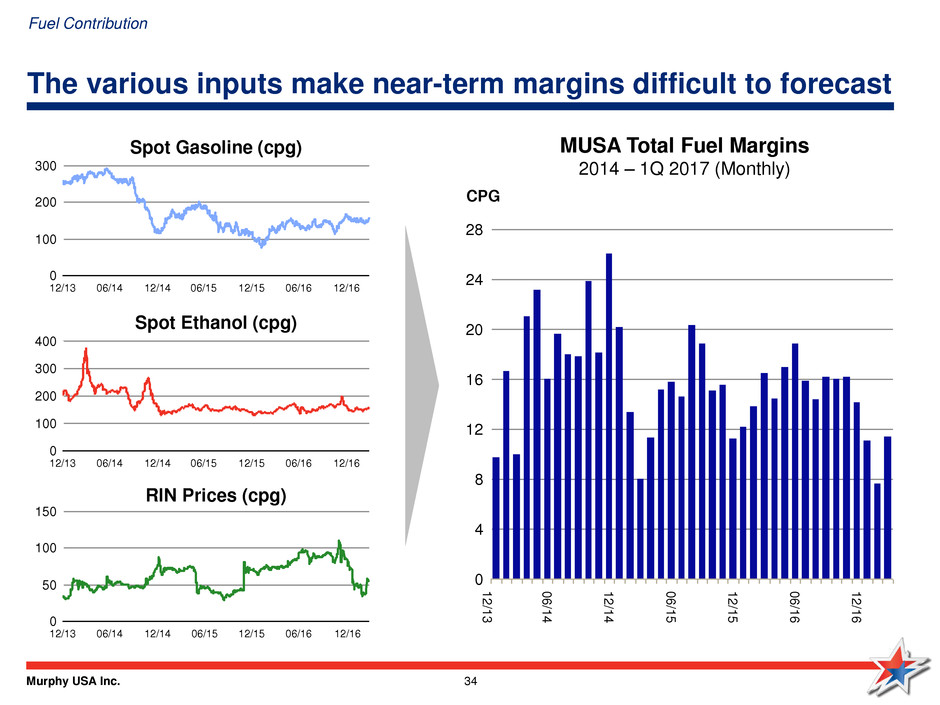
Murphy USA Inc. 34 The various inputs make near-term margins difficult to forecast 300 200 0 100 400 12/15 06/15 12/13 06/14 12/16 12/14 06/16 300 200 100 0 06/16 12/14 12/13 12/15 06/14 12/16 06/15 Spot Gasoline (cpg) MUSA Total Fuel Margins 2014 – 1Q 2017 (Monthly) 0 50 150 100 06/16 06/14 12/13 06/15 12/16 12/15 12/14 0 20 12 24 4 28 16 8 0 6 /1 4 1 2 /1 6 CPG 0 6 /1 6 1 2 /1 4 1 2 /1 5 0 6 /1 5 Spot Ethanol (cpg) RIN Prices (cpg) Fuel Contribution 1 2 /1 3
Murphy USA Inc. 35 Fuel Breakeven
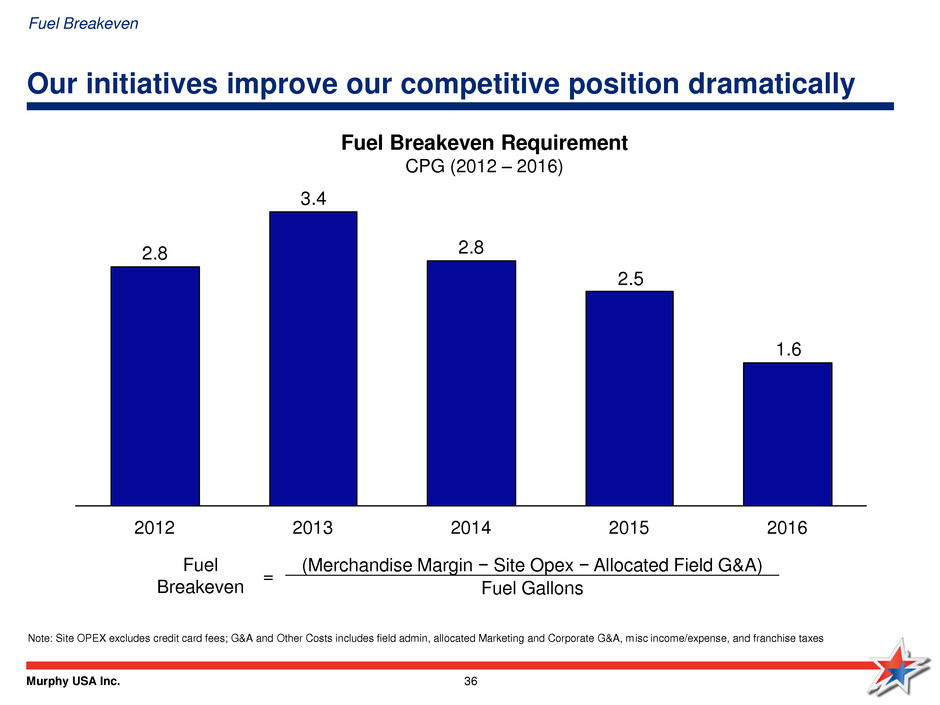
Murphy USA Inc. 36 Our initiatives improve our competitive position dramatically Note: Site OPEX excludes credit card fees; G&A and Other Costs includes field admin, allocated Marketing and Corporate G&A, misc income/expense, and franchise taxes 1.6 2.5 2.8 3.4 2.8 2013 2012 2016 2015 2014 Fuel Breakeven = (Merchandise Margin − Site Opex − Allocated Field G&A) Fuel Gallons Fuel Breakeven Requirement CPG (2012 – 2016) Fuel Breakeven
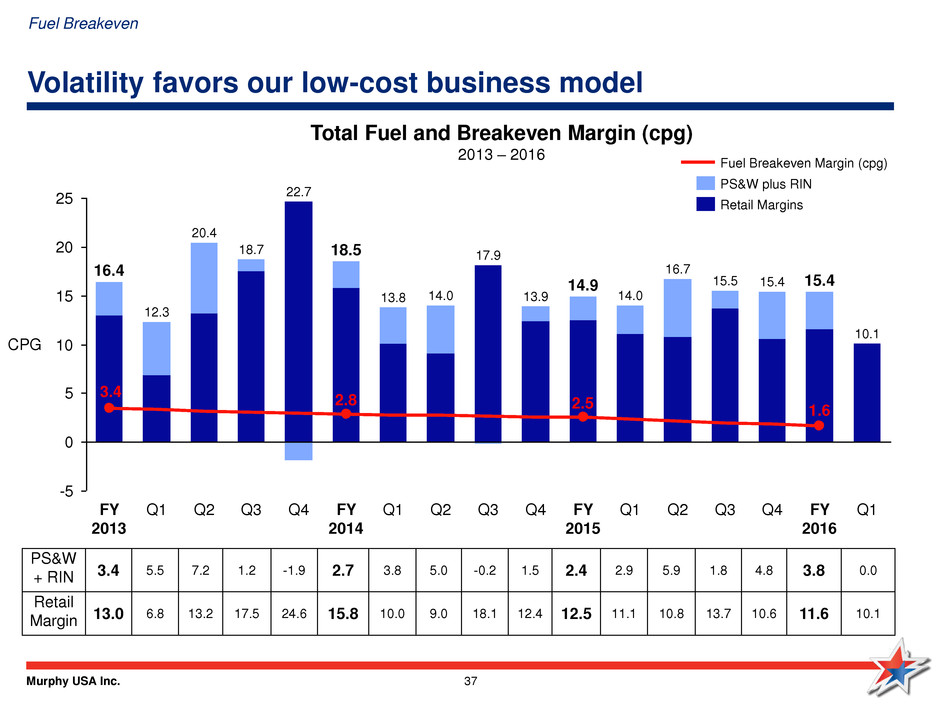
Murphy USA Inc. 37 Volatility favors our low-cost business model -5 0 5 10 15 20 25 15.4 Q4 CPG FY 2016 15.5 14.0 14.9 13.9 Q3 Q1 FY 2015 17.9 13.8 16.7 Q2 Q4 Q2 14.0 15.4 Q3 Q1 18.7 FY 2014 Q2 22.7 16.4 Q4 Q1 18.5 Q1 20.4 Q3 FY 2013 12.3 10.1 Retail Margins PS&W plus RIN Fuel Breakeven Margin (cpg) PS&W + RIN 3.4 5.5 7.2 1.2 -1.9 2.7 3.8 5.0 -0.2 1.5 2.4 2.9 5.9 1.8 4.8 3.8 0.0 Retail Margin 13.0 6.8 13.2 17.5 24.6 15.8 10.0 9.0 18.1 12.4 12.5 11.1 10.8 13.7 10.6 11.6 10.1 Total Fuel and Breakeven Margin (cpg) 2013 – 2016 3.4 2.8 2.5 1.6 Fuel Breakeven
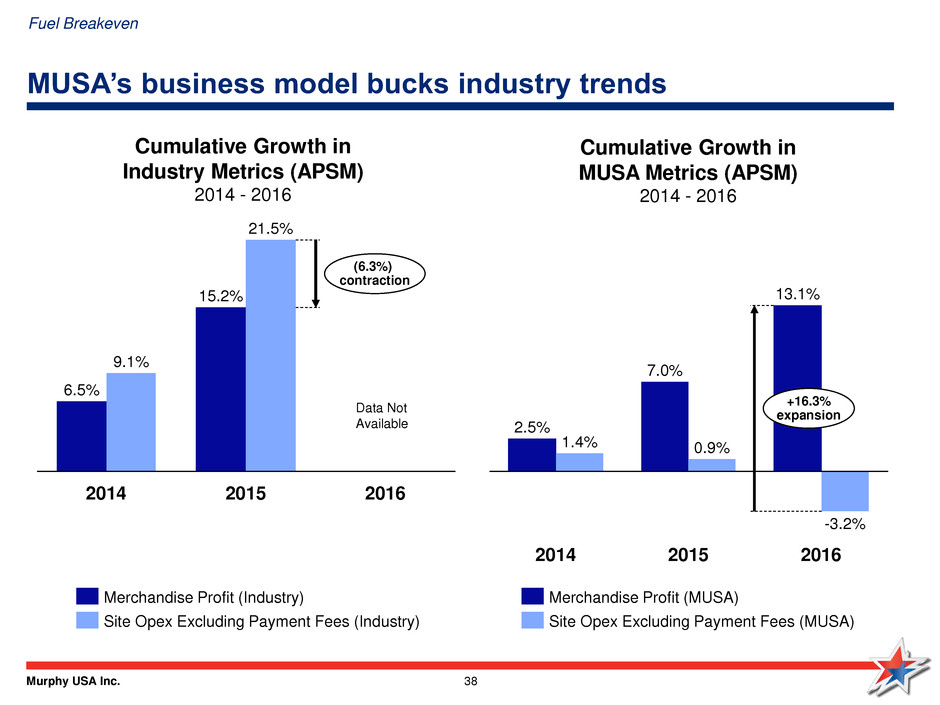
Murphy USA Inc. 38 MUSA’s business model bucks industry trends (6.3%) contraction 2016 15.2% 2015 21.5% 6.5% 9.1% 2014 Site Opex Excluding Payment Fees (Industry) Merchandise Profit (Industry) Cumulative Growth in Industry Metrics (APSM) 2014 - 2016 2014 -3.2% 1.4% 2016 2.5% 7.0% 13.1% 0.9% 2015 +16.3% expansion Merchandise Profit (MUSA) Site Opex Excluding Payment Fees (MUSA) Cumulative Growth in MUSA Metrics (APSM) 2014 - 2016 Data Not Available Fuel Breakeven
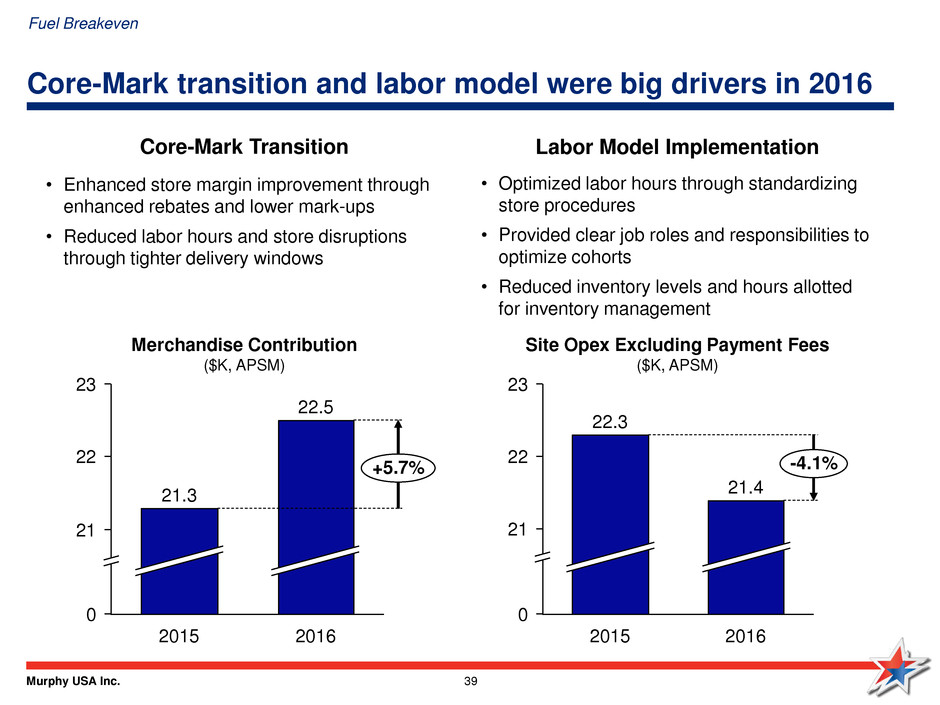
Murphy USA Inc. 39 Core-Mark transition and labor model were big drivers in 2016 23 22 21 0 22.5 +5.7% 2016 2015 21.3 Merchandise Contribution ($K, APSM) Site Opex Excluding Payment Fees ($K, APSM) 0 22 23 21 2015 -4.1% 21.4 2016 22.3 Labor Model Implementation • Optimized labor hours through standardizing store procedures • Provided clear job roles and responsibilities to optimize cohorts • Reduced inventory levels and hours allotted for inventory management Core-Mark Transition • Enhanced store margin improvement through enhanced rebates and lower mark-ups • Reduced labor hours and store disruptions through tighter delivery windows Fuel Breakeven
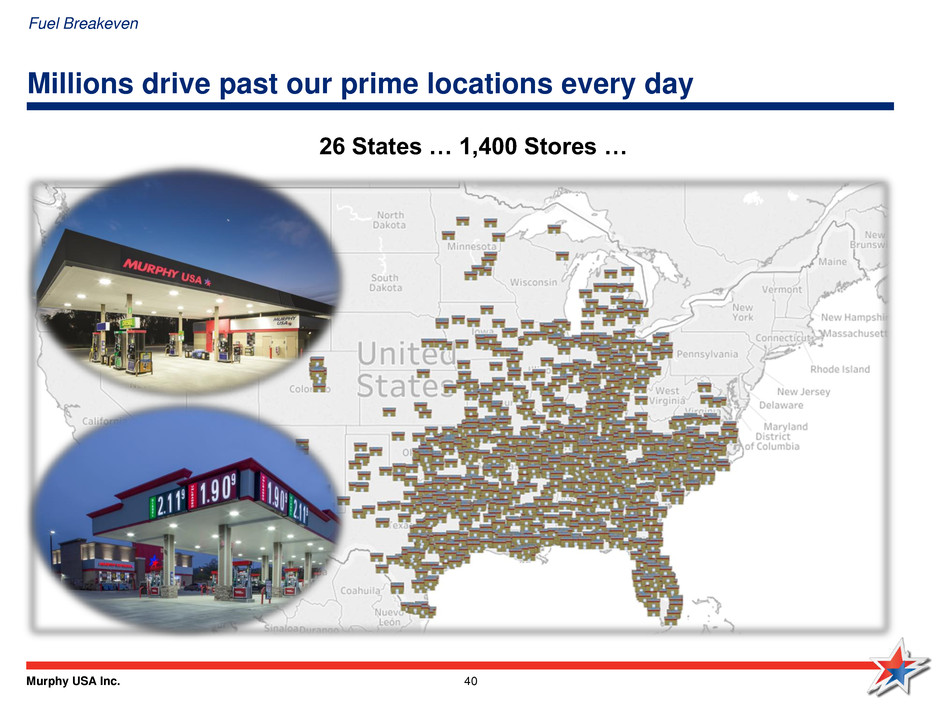
Murphy USA Inc. 40 Millions drive past our prime locations every day 26 States … 1,400 Stores … Fuel Breakeven
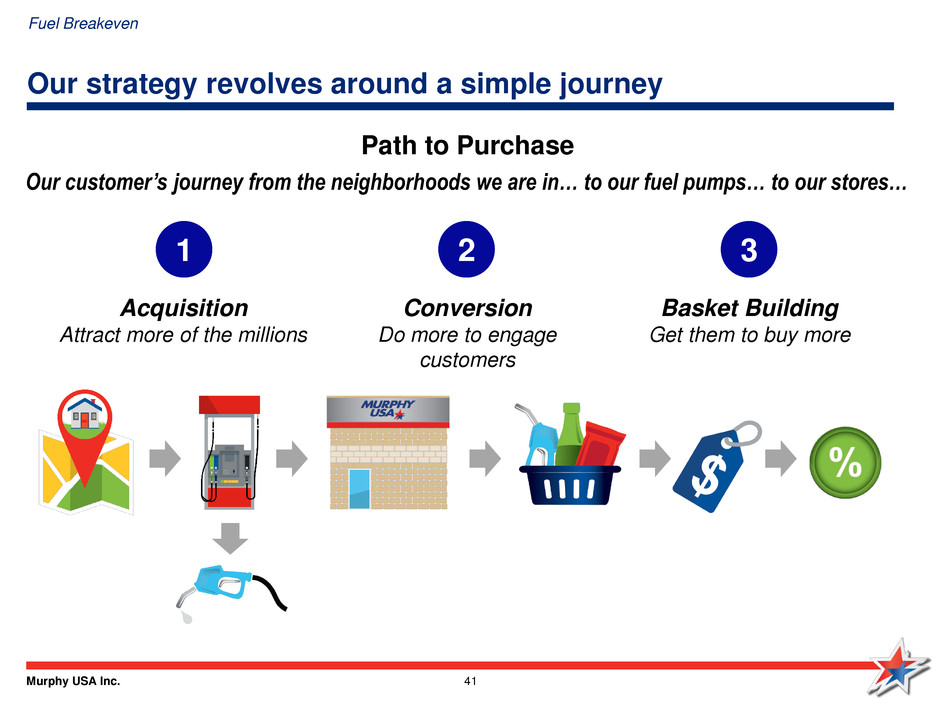
Murphy USA Inc. 41 Our strategy revolves around a simple journey Acquisition Attract more of the millions Our customer’s journey from the neighborhoods we are in… to our fuel pumps… to our stores… 1 Conversion Do more to engage customers 2 Basket Building Get them to buy more 3 Path to Purchase Fuel Breakeven
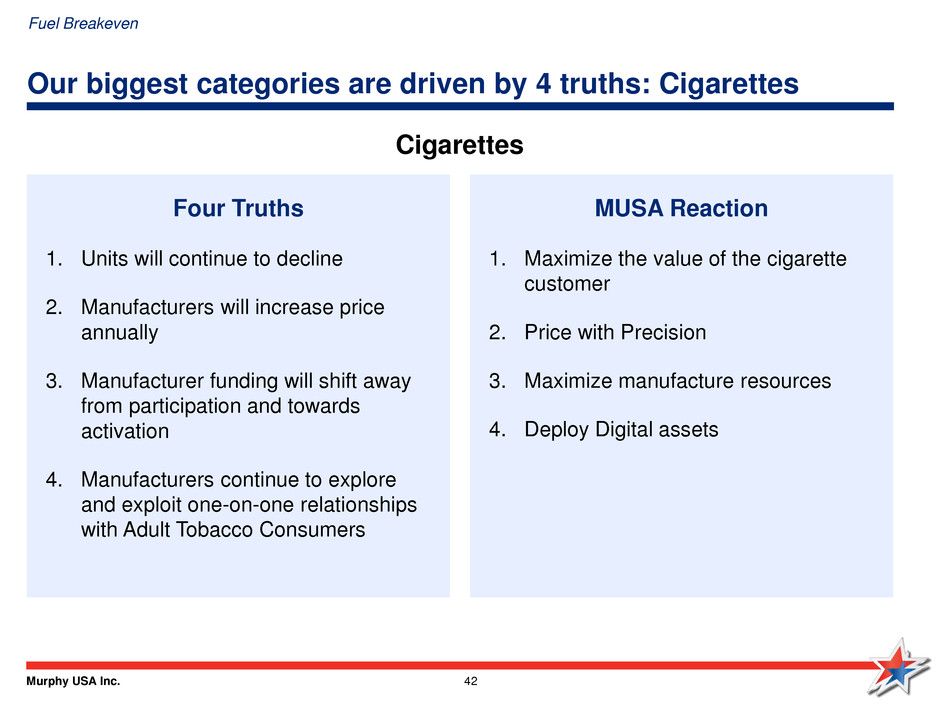
Murphy USA Inc. 42 Our biggest categories are driven by 4 truths: Cigarettes Four Truths 1. Units will continue to decline 2. Manufacturers will increase price annually 3. Manufacturer funding will shift away from participation and towards activation 4. Manufacturers continue to explore and exploit one-on-one relationships with Adult Tobacco Consumers MUSA Reaction 1. Maximize the value of the cigarette customer 2. Price with Precision 3. Maximize manufacture resources 4. Deploy Digital assets Cigarettes Fuel Breakeven
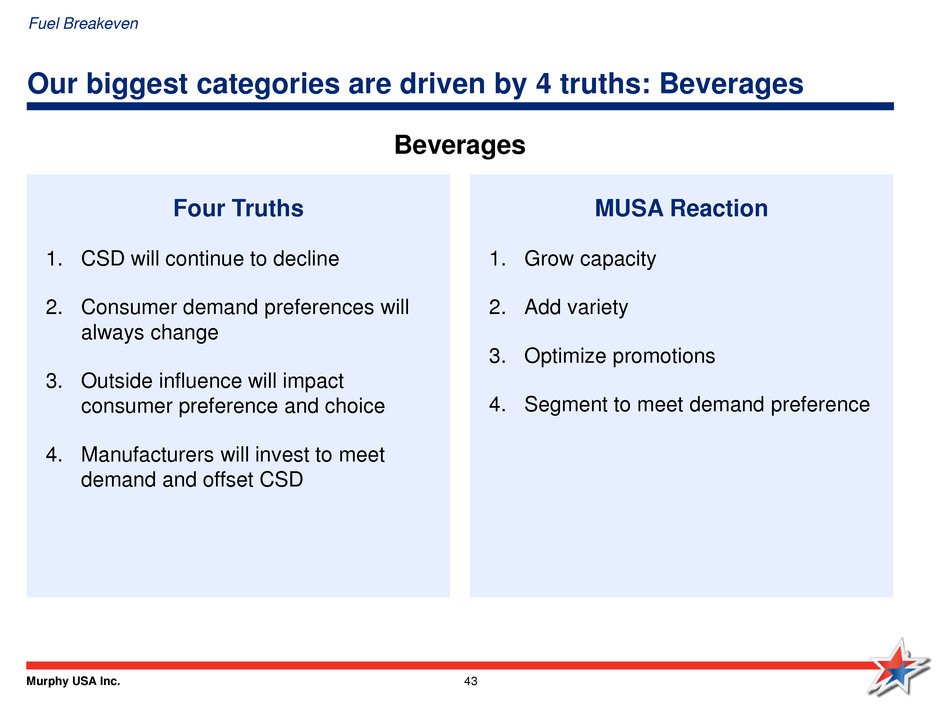
Murphy USA Inc. 43 Our biggest categories are driven by 4 truths: Beverages Four Truths 1. CSD will continue to decline 2. Consumer demand preferences will always change 3. Outside influence will impact consumer preference and choice 4. Manufacturers will invest to meet demand and offset CSD MUSA Reaction 1. Grow capacity 2. Add variety 3. Optimize promotions 4. Segment to meet demand preference Beverages Fuel Breakeven
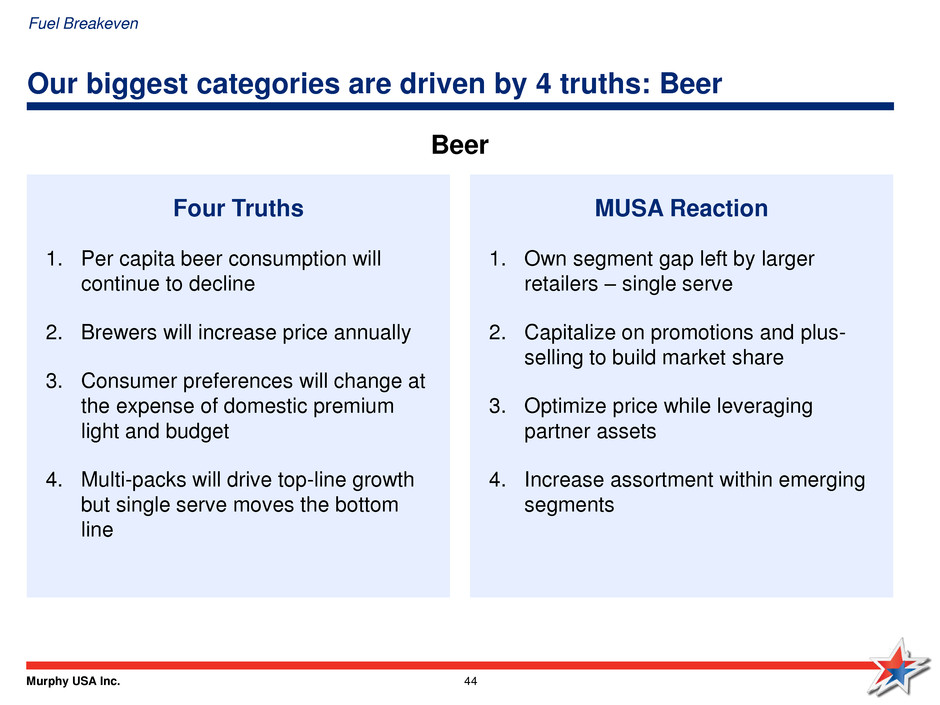
Murphy USA Inc. 44 Our biggest categories are driven by 4 truths: Beer Four Truths 1. Per capita beer consumption will continue to decline 2. Brewers will increase price annually 3. Consumer preferences will change at the expense of domestic premium light and budget 4. Multi-packs will drive top-line growth but single serve moves the bottom line MUSA Reaction 1. Own segment gap left by larger retailers – single serve 2. Capitalize on promotions and plus- selling to build market share 3. Optimize price while leveraging partner assets 4. Increase assortment within emerging segments Beer Fuel Breakeven
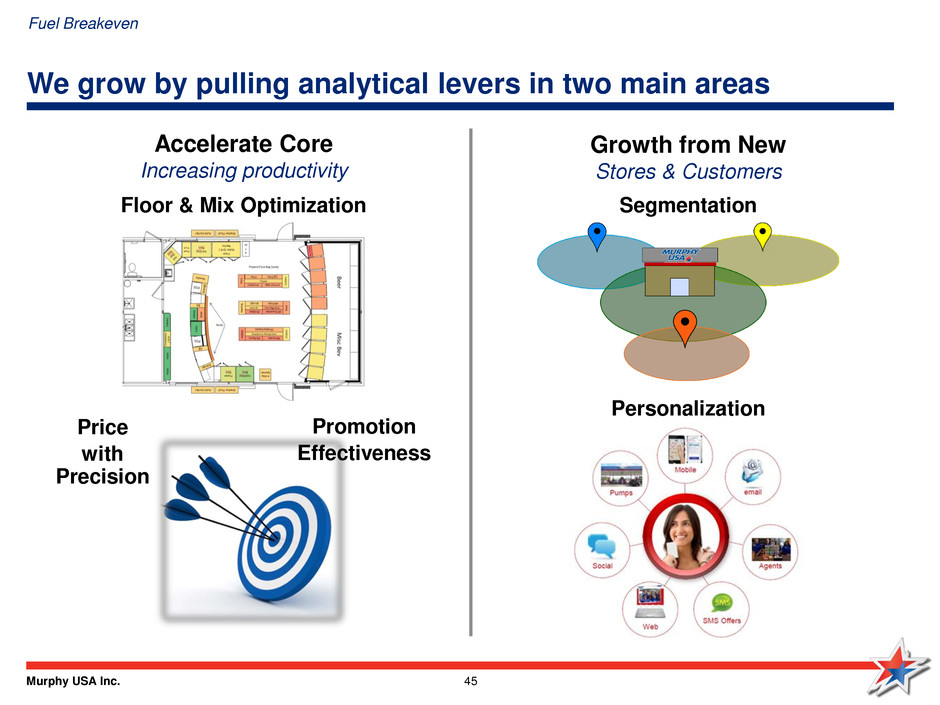
Murphy USA Inc. 45 We grow by pulling analytical levers in two main areas Accelerate Core Increasing productivity Growth from New Stores & Customers Floor & Mix Optimization Segmentation Personalization Promotion Effectiveness Price with Precision Fuel Breakeven
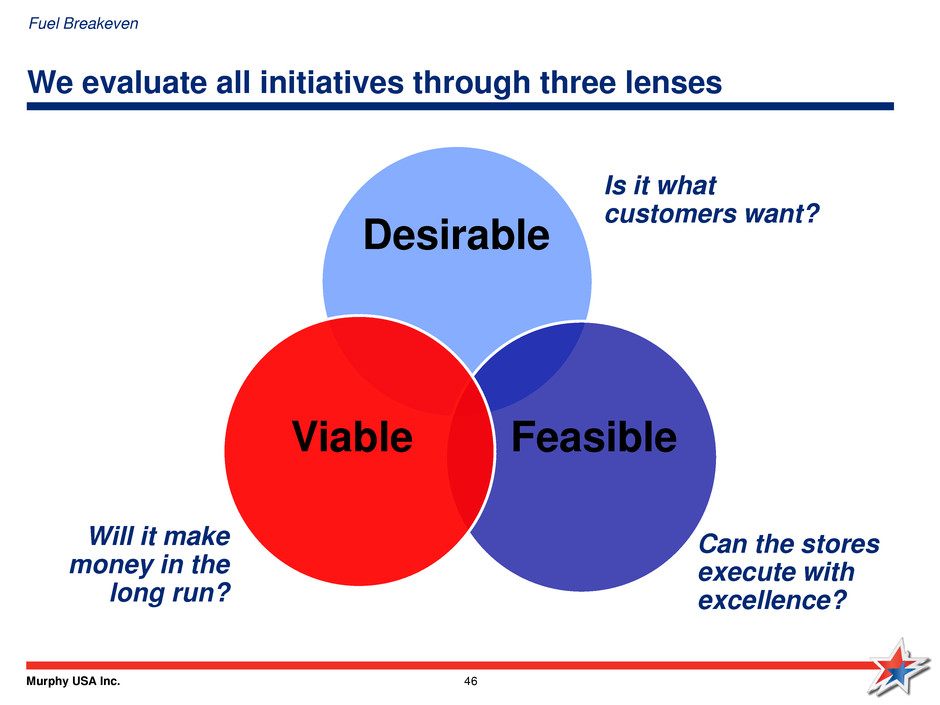
Murphy USA Inc. 46 We evaluate all initiatives through three lenses Desirable Viable Feasible Is it what customers want? Can the stores execute with excellence? Will it make money in the long run? Fuel Breakeven
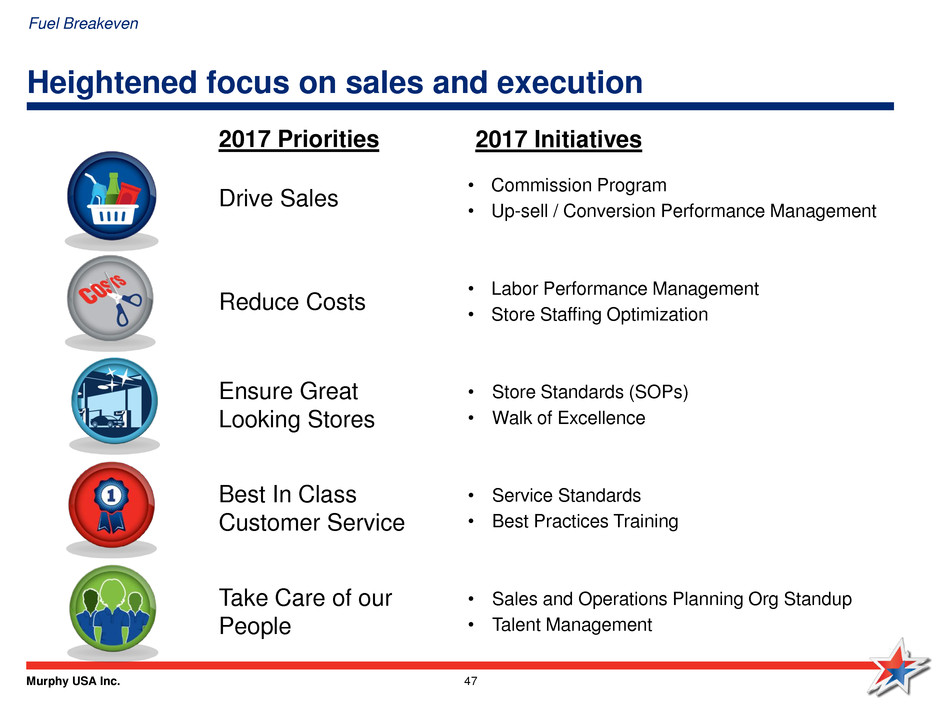
Murphy USA Inc. 47 Heightened focus on sales and execution • Commission Program • Up-sell / Conversion Performance Management • Labor Performance Management • Store Staffing Optimization • Store Standards (SOPs) • Walk of Excellence • Service Standards • Best Practices Training • Sales and Operations Planning Org Standup • Talent Management 2017 Initiatives 2017 Priorities Drive Sales Reduce Costs Ensure Great Looking Stores Best In Class Customer Service Take Care of our People Fuel Breakeven
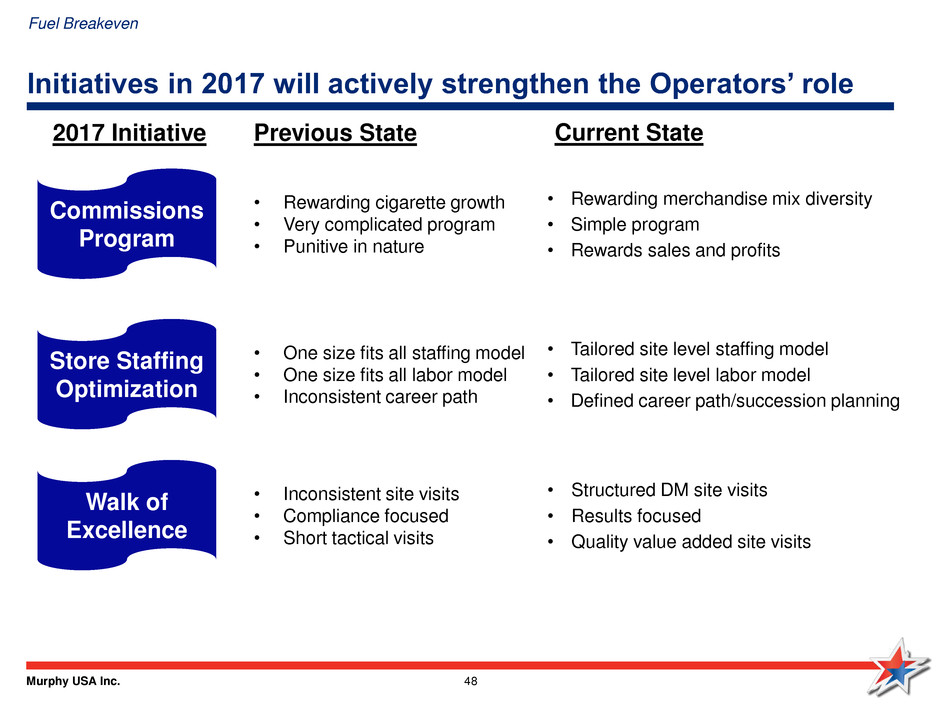
Murphy USA Inc. 48 Initiatives in 2017 will actively strengthen the Operators’ role • Rewarding merchandise mix diversity • Simple program • Rewards sales and profits • Tailored site level staffing model • Tailored site level labor model • Defined career path/succession planning • Structured DM site visits • Results focused • Quality value added site visits Current State Previous State • Rewarding cigarette growth • Very complicated program • Punitive in nature • One size fits all staffing model • One size fits all labor model • Inconsistent career path • Inconsistent site visits • Compliance focused • Short tactical visits 2017 Initiative Commissions Program Store Staffing Optimization Walk of Excellence Fuel Breakeven
Murphy USA Inc. 49 Corporate Costs
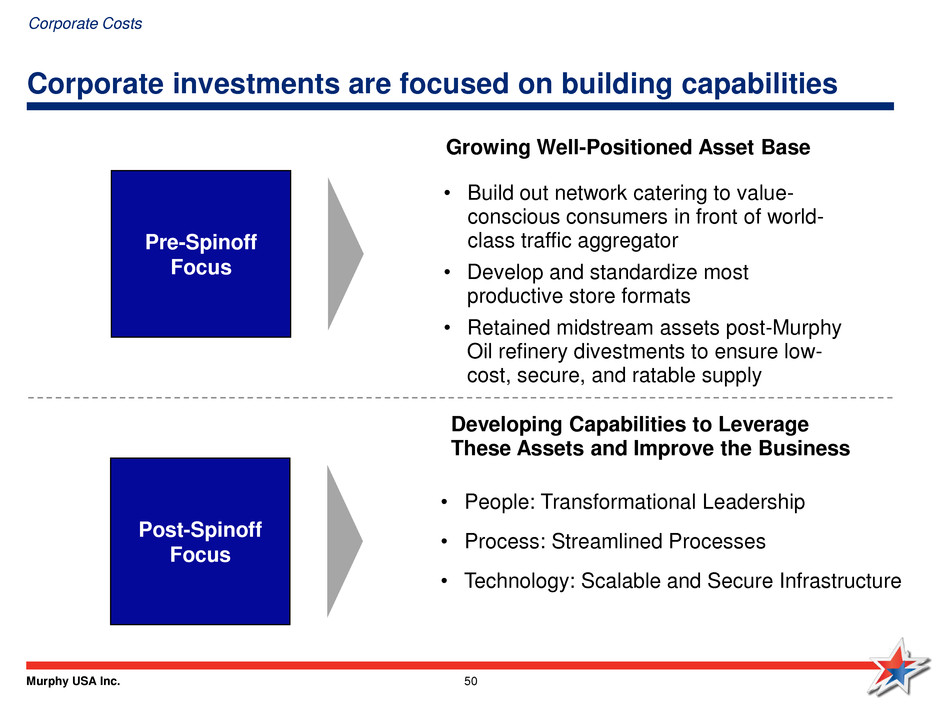
Murphy USA Inc. 50 Corporate investments are focused on building capabilities Pre-Spinoff Focus Growing Well-Positioned Asset Base Post-Spinoff Focus Developing Capabilities to Leverage These Assets and Improve the Business • People: Transformational Leadership • Process: Streamlined Processes • Technology: Scalable and Secure Infrastructure • Build out network catering to value- conscious consumers in front of world- class traffic aggregator • Develop and standardize most productive store formats • Retained midstream assets post-Murphy Oil refinery divestments to ensure low- cost, secure, and ratable supply Corporate Costs

Murphy USA Inc. 51 Our SG&A investment will enhance capabilities and scalability • People – Establish competencies to achieve corporate goals and strategies – Align incentive plans with principles and competencies – Empower leadership to drive change and support value creation process • Process – Restructured corporate functions to support strategy execution – Establish process framework vs. break/fix cycle – Proactively manage enterprise risk across the organization • Technology – Develop IT strategy and roadmap to manage business priorities and replace patchwork legacy systems – Invest in scalable and secure technology platforms – Upgrade capabilities in line with major retailing standards 138 123 129 119 2017e 2014 2016 2015 Total SG&A ($MM) 2014 – 2017e *Using end-of-year store count SG&A per Store* (K) 2014 – 2017e 94 97 88 95 Corporate Costs
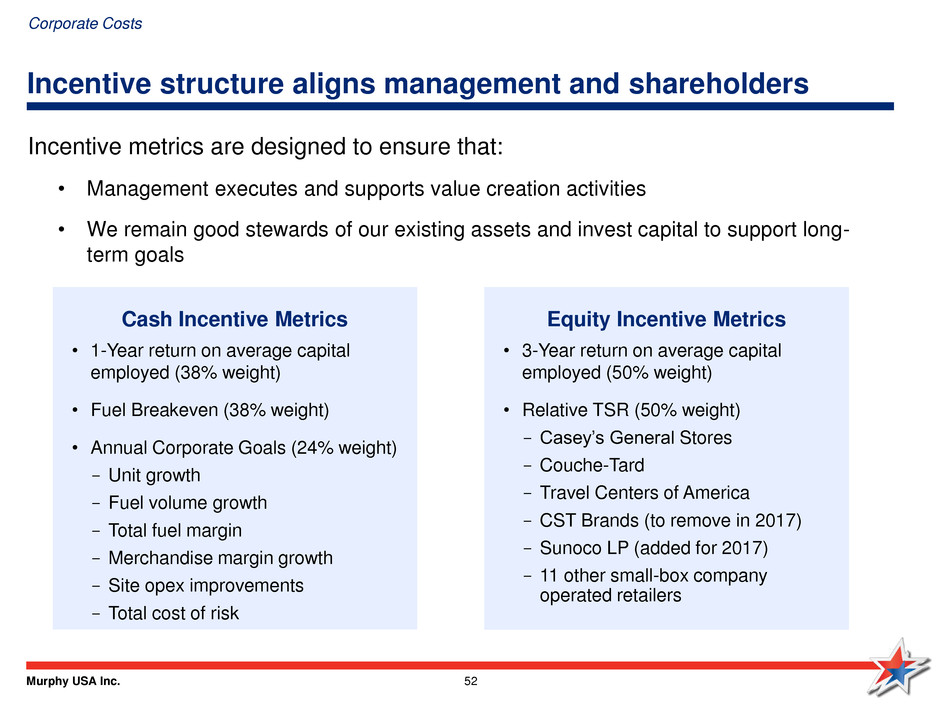
Murphy USA Inc. 52 Incentive metrics are designed to ensure that: • Management executes and supports value creation activities • We remain good stewards of our existing assets and invest capital to support long- term goals Incentive structure aligns management and shareholders Equity Incentive Metrics • 3-Year return on average capital employed (50% weight) • Relative TSR (50% weight) - Casey’s General Stores - Couche-Tard - Travel Centers of America - CST Brands (to remove in 2017) - Sunoco LP (added for 2017) - 11 other small-box company operated retailers Cash Incentive Metrics • 1-Year return on average capital employed (38% weight) • Fuel Breakeven (38% weight) • Annual Corporate Goals (24% weight) - Unit growth - Fuel volume growth - Total fuel margin - Merchandise margin growth - Site opex improvements - Total cost of risk Corporate Costs
Murphy USA Inc. 53 Shares Outstanding
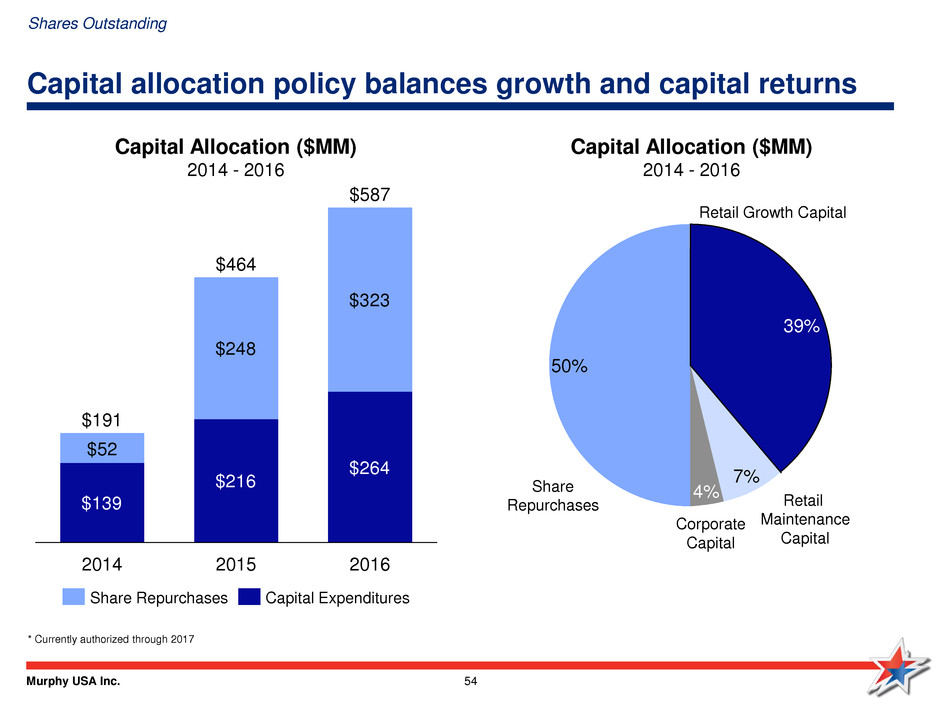
Murphy USA Inc. 54 Capital allocation policy balances growth and capital returns $139 $216 $264 $248 $323 $52 2016 $587 2015 $464 2014 $191 Capital Allocation ($MM) 2014 - 2016 * Currently authorized through 2017 Corporate Capital 4% Retail Maintenance Capital 7% Retail Growth Capital 39% Share Repurchases 50% Capital Allocation ($MM) 2014 - 2016 Capital Expenditures Share Repurchases Shares Outstanding
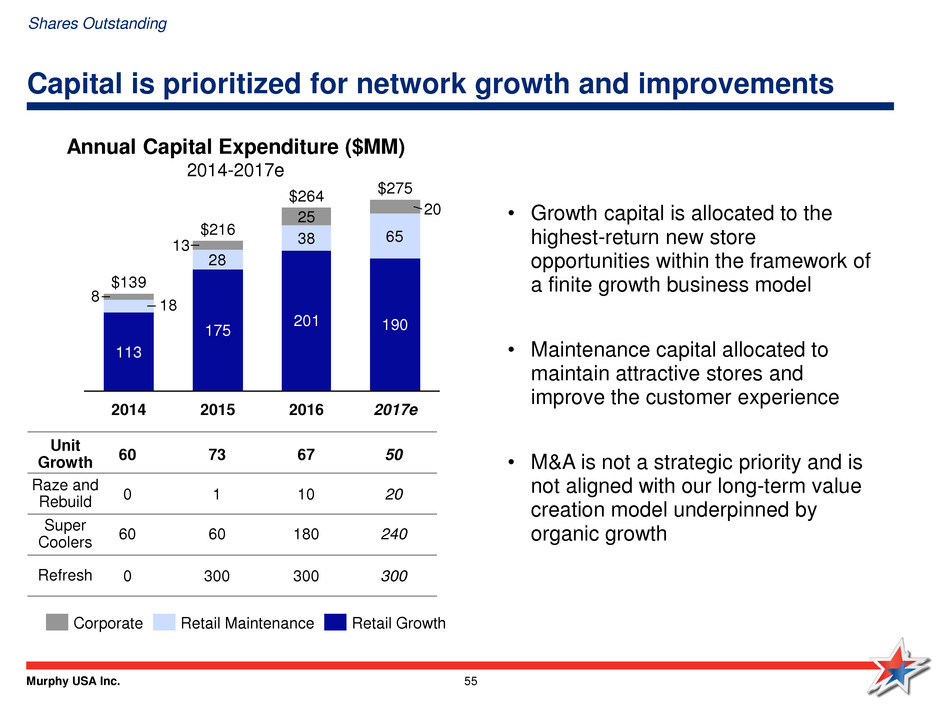
Murphy USA Inc. 55 Capital is prioritized for network growth and improvements 113 175 201 190 28 38 65 25 18 20 13 8 2017e $275 2016 $264 2015 $216 2014 $139 Retail Growth Retail Maintenance Corporate Annual Capital Expenditure ($MM) 2014-2017e • Growth capital is allocated to the highest-return new store opportunities within the framework of a finite growth business model • Maintenance capital allocated to maintain attractive stores and improve the customer experience • M&A is not a strategic priority and is not aligned with our long-term value creation model underpinned by organic growth Shares Outstanding 60 73 67 50 0 1 10 20 60 60 180 240 0 300 300 300 Unit Growth Raze and Rebuild Super Coolers Refresh

Murphy USA Inc. 56 Opportunistic share repurchases integral to EPS growth formula 34.41 41.7 2014 46.7 2016 2015 45.7 2013 2017e 36.9 -26.4%(1) -21.0% -2.2% 10.8% Shares Outstanding Fiscal Year End 0.0 0.5 1.0 1.5 2.0 2.5 $80 $75 $70 $60 $55 $50 $65 Shares Repurchased (MM shares) MUSA Share Price Q4 2015 Q2 2016 Q1 2016 Q4 2016 Q3 2016 Shares Repurchased MUSA Share Price MUSA Share Price vs. Shares Repurchased Calendar Year 2016 Commitment to Share Repurchases Over Dividend Walmart Announcement RFS Concerns Disciplined and Decisive Approach to Timing 1) Assumes remaining repurchase authorization is completed by 2017 year-end at an average price of $70/share. Shares Outstanding
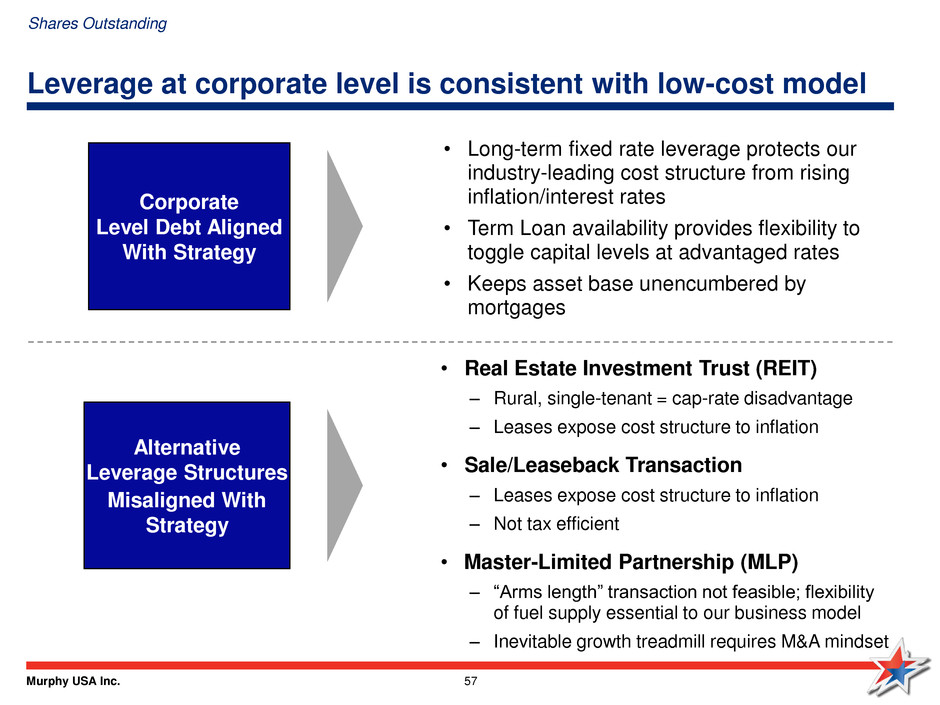
Murphy USA Inc. 57 Leverage at corporate level is consistent with low-cost model Corporate Level Debt Aligned With Strategy Alternative Leverage Structures Misaligned With Strategy • Real Estate Investment Trust (REIT) – Rural, single-tenant = cap-rate disadvantage – Leases expose cost structure to inflation • Sale/Leaseback Transaction – Leases expose cost structure to inflation – Not tax efficient • Master-Limited Partnership (MLP) – “Arms length” transaction not feasible; flexibility of fuel supply essential to our business model – Inevitable growth treadmill requires M&A mindset • Long-term fixed rate leverage protects our industry-leading cost structure from rising inflation/interest rates • Term Loan availability provides flexibility to toggle capital levels at advantaged rates • Keeps asset base unencumbered by mortgages Shares Outstanding
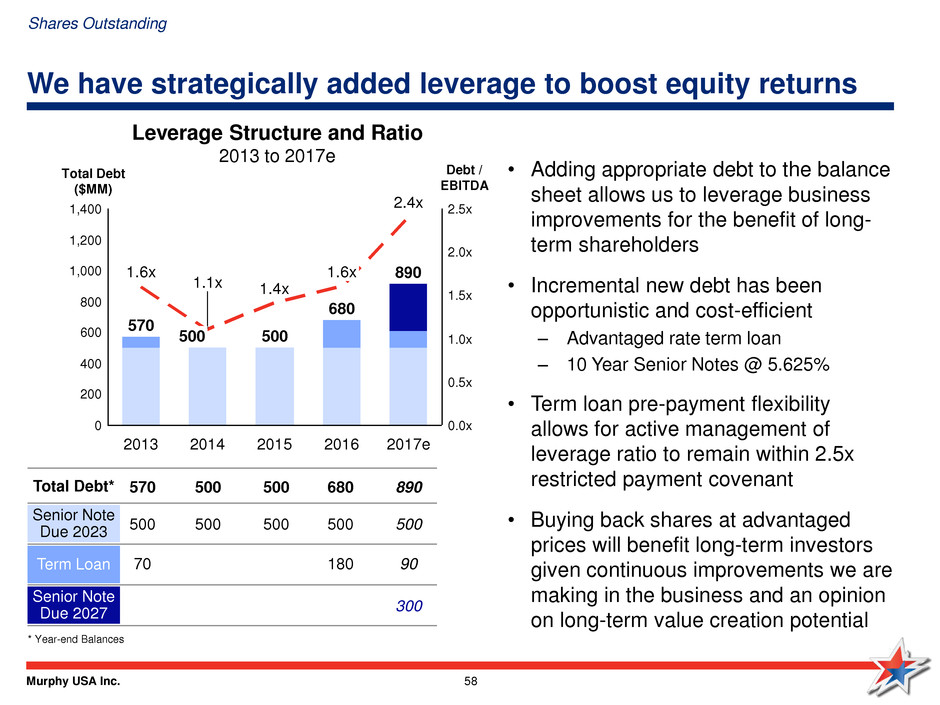
Murphy USA Inc. 58 We have strategically added leverage to boost equity returns Leverage Structure and Ratio 2013 to 2017e 1,200 2.0x 200 0 1,000 800 1,400 400 1.5x 2.5x 0.5x 1.0x 0.0x 600 2017e 890 2.4x 2016 1.6x 1.4x 680 570 2015 2014 1.1x 1.6x 500 500 2013 • Adding appropriate debt to the balance sheet allows us to leverage business improvements for the benefit of long- term shareholders • Incremental new debt has been opportunistic and cost-efficient – Advantaged rate term loan – 10 Year Senior Notes @ 5.625% • Term loan pre-payment flexibility allows for active management of leverage ratio to remain within 2.5x restricted payment covenant • Buying back shares at advantaged prices will benefit long-term investors given continuous improvements we are making in the business and an opinion on long-term value creation potential Total Debt ($MM) Debt / EBITDA * Year-end Balances Shares Outstanding 570 500 500 680 500 70 180 Total Debt* Senior Note Due 2023 Term Loan Senior Note Due 2027 890 90 300 500 500 500 500
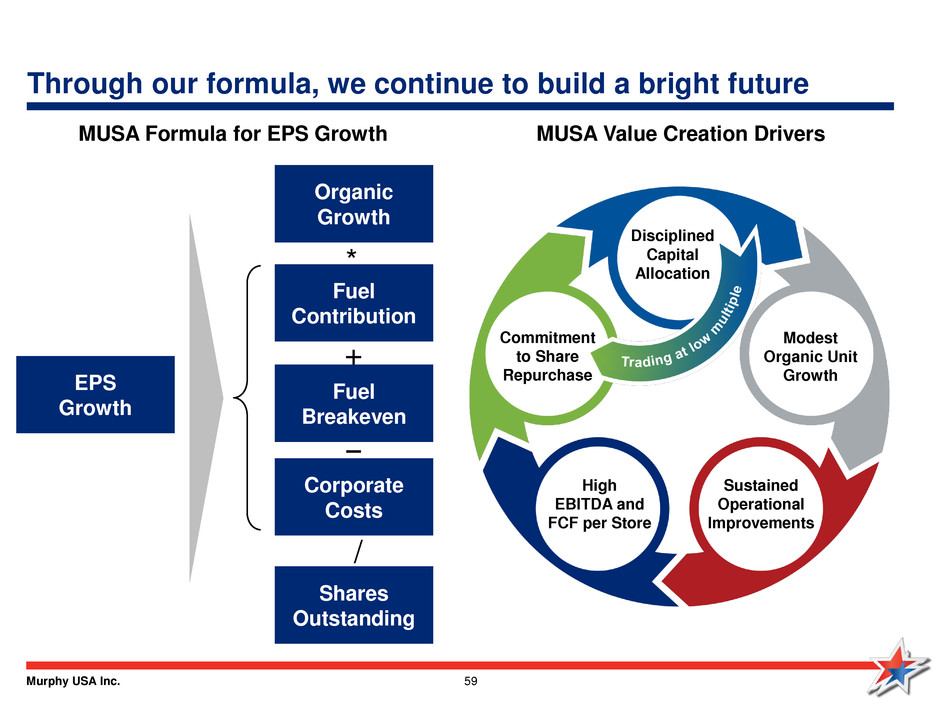
Murphy USA Inc. 59 Through our formula, we continue to build a bright future Corporate Costs * + − / MUSA Formula for EPS Growth Commitment to Share Repurchase Modest Organic Unit Growth Sustained Operational Improvements High EBITDA and FCF per Store Disciplined Capital Allocation MUSA Value Creation Drivers Shares Outstanding Fuel Breakeven Fuel Contribution Organic Growth EPS Growth


