Murphy USA Inc. 1 Raymond James Institutional Investors Conference March 2021
Murphy USA Inc. 2 Cautionary statement This presentation contains forward-looking statements. These statements, which express management’s current views concerning future events or results, are subject to inherent risks and uncertainties. Factors that could cause actual results to differ materially from those expressed or implied in our forward-looking statements include, but are not limited to, the volatility and level of crude oil and gasoline prices, the pace and success of our expansion plan, our relationship with Walmart, political and regulatory uncertainty, our ability to realize projected synergies from the acquisition of QuickChek and successfully expand our food and beverage offerings, uncontrollable natural hazards, and adverse market conditions or tax consequences, among other things. For further discussion of risk factors, see “Risk Factors” in the Murphy USA registration statement on our latest form 10-Q and 10-K. Murphy USA undertakes no duty to publicly update or revise any forward-looking statements. The Murphy USA financial information in this presentation is derived from the audited and unaudited consolidated financial statements of Murphy USA, Inc. for the years ended December 31, 2020, 2019, 2018, 2017, 2016, and 2015. Please reference our most recent 10-K, 10-Q, and 8-K filings for the latest information. If this presentation contains non-GAAP financial measures, we have provided a reconciliation of such non-GAAP financial measures to the most directly comparable measures prepared in accordance with U.S. GAAP in the Appendix to this presentation. Christian Pikul, CFA Vice President of Investor Relations and FP&A Christian.pikul@murphyusa.com
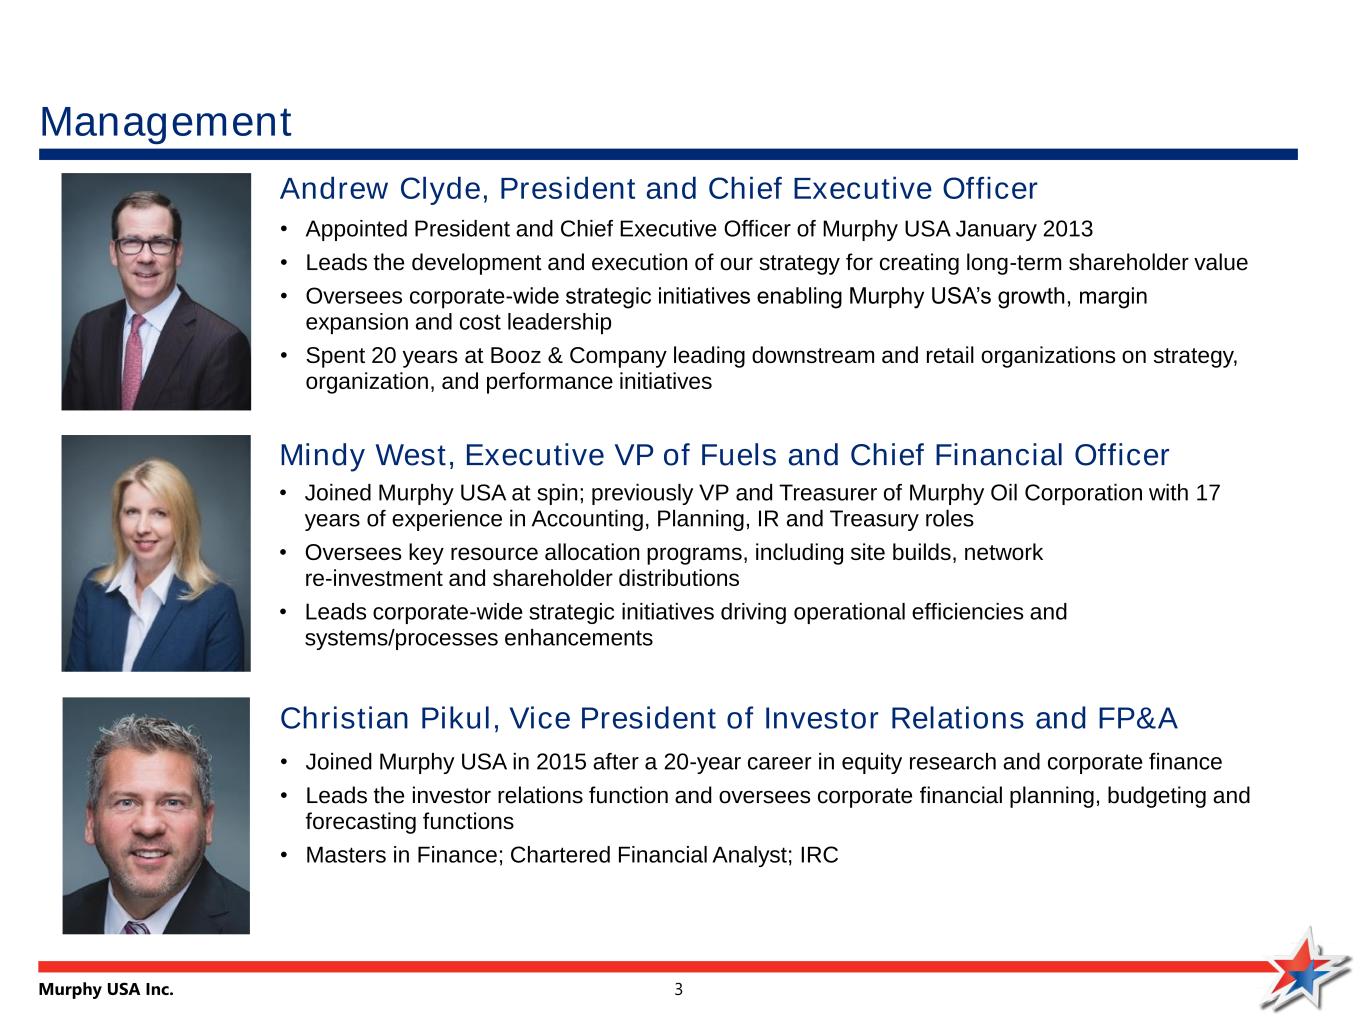
Murphy USA Inc. 3 Management Andrew Clyde, President and Chief Executive Officer • Appointed President and Chief Executive Officer of Murphy USA January 2013 • Leads the development and execution of our strategy for creating long-term shareholder value • Oversees corporate-wide strategic initiatives enabling Murphy USA’s growth, margin expansion and cost leadership • Spent 20 years at Booz & Company leading downstream and retail organizations on strategy, organization, and performance initiatives Mindy West, Executive VP of Fuels and Chief Financial Officer • Joined Murphy USA at spin; previously VP and Treasurer of Murphy Oil Corporation with 17 years of experience in Accounting, Planning, IR and Treasury roles • Oversees key resource allocation programs, including site builds, network re-investment and shareholder distributions • Leads corporate-wide strategic initiatives driving operational efficiencies and systems/processes enhancements Christian Pikul, Vice President of Investor Relations and FP&A • Joined Murphy USA in 2015 after a 20-year career in equity research and corporate finance • Leads the investor relations function and oversees corporate financial planning, budgeting and forecasting functions • Masters in Finance; Chartered Financial Analyst; IRC
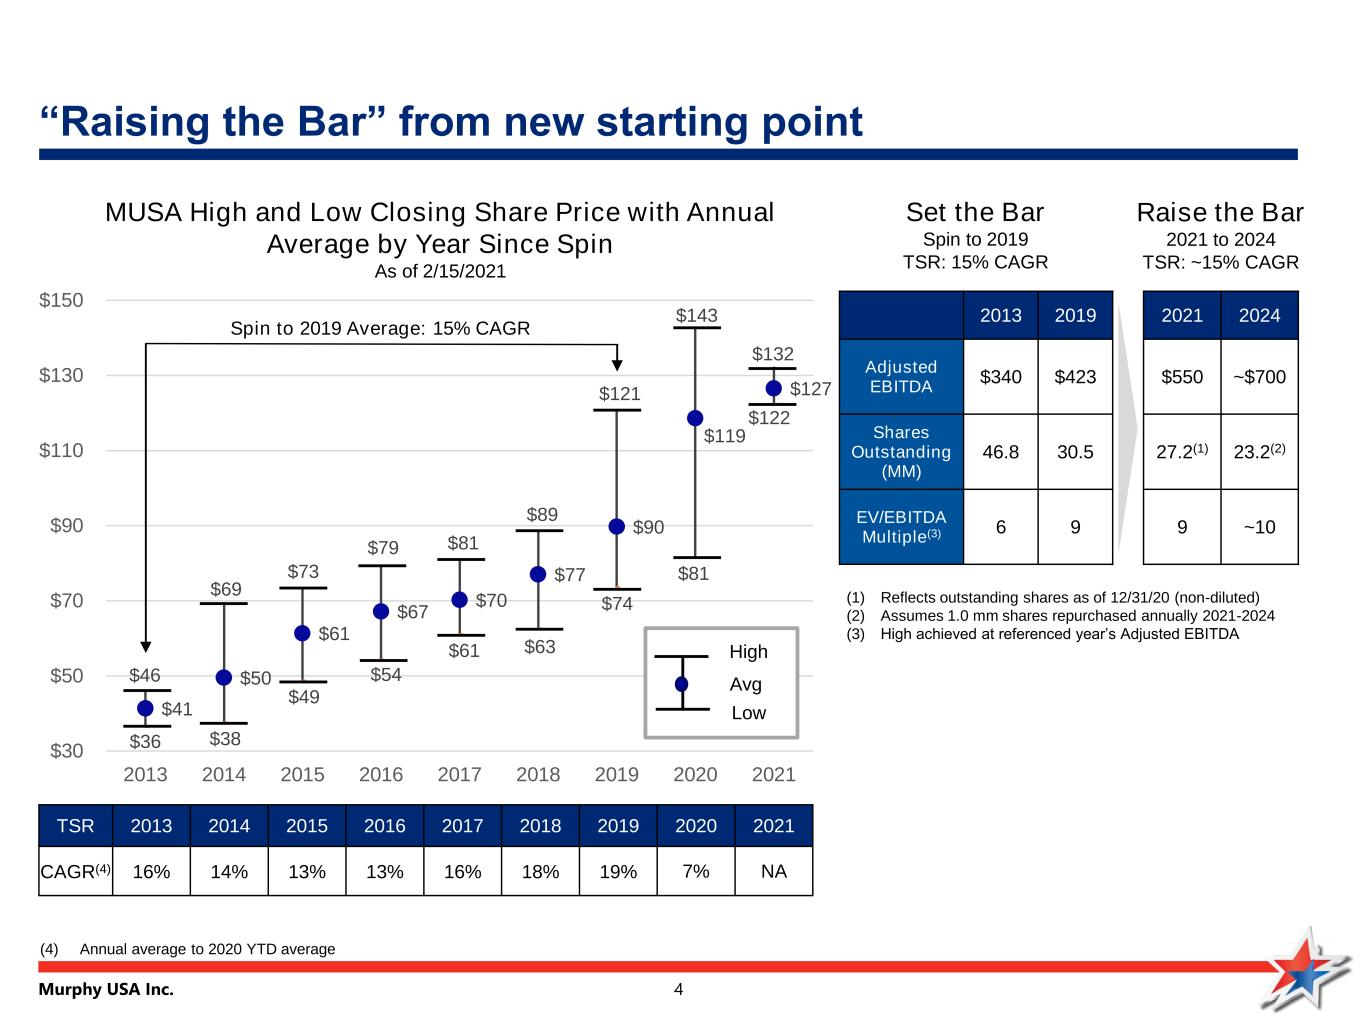
Murphy USA Inc. 4 2013 2019 Adjusted EBITDA $340 $423 Shares Outstanding (MM) 46.8 30.5 EV/EBITDA Multiple(3) 6 9 Raise the Bar 2021 to 2024 TSR: ~15% CAGR “Raising the Bar” from new starting point $46 $69 $73 $79 $81 $89 $121 $143 $132 $41 $50 $61 $67 $70 $77 $90 $119 $127 $36 $38 $49 $54 $61 $63 $74 $81 $122 $30 $50 $70 $90 $110 $130 $150 2013 2014 2015 2016 2017 2018 2019 2020 2021 MUSA High and Low Closing Share Price with Annual Average by Year Since Spin As of 2/15/2021 High Avg Low 2021 2024 $550 ~$700 27.2(1) 23.2(2) 9 ~10 Set the Bar Spin to 2019 TSR: 15% CAGR (1) Reflects outstanding shares as of 12/31/20 (non-diluted) (2) Assumes 1.0 mm shares repurchased annually 2021-2024 (3) High achieved at referenced year’s Adjusted EBITDA TSR 2013 2014 2015 2016 2017 2018 2019 2020 2021 CAGR(4) 16% 14% 13% 13% 16% 18% 19% 7% NA (4) Annual average to 2020 YTD average Spin to 2019 Average: 15% CAGR
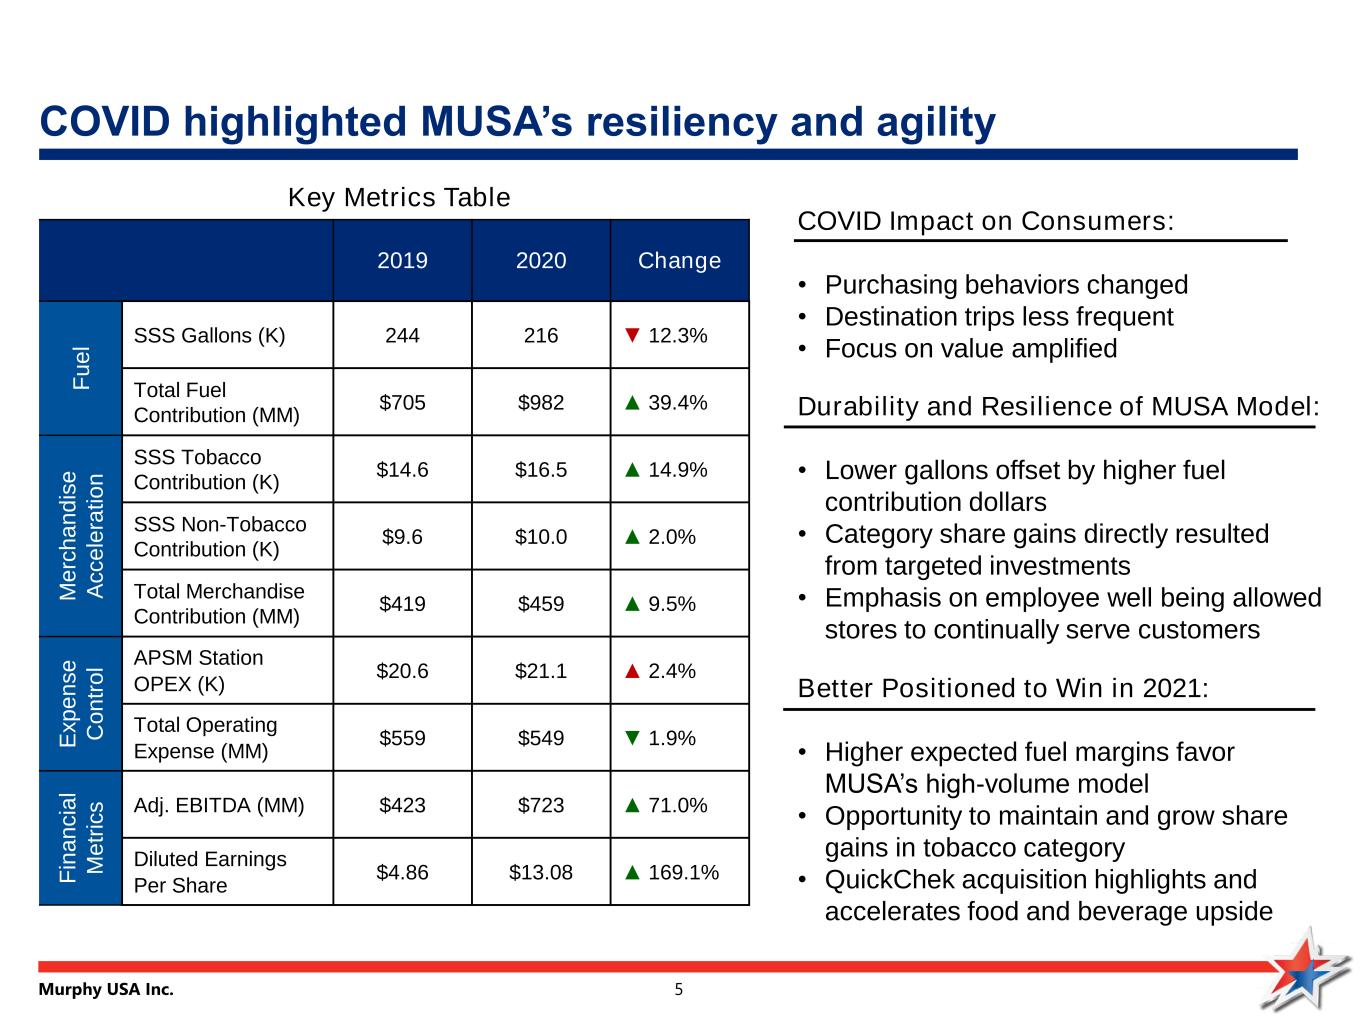
Murphy USA Inc. 5 COVID highlighted MUSA’s resiliency and agility 2019 2020 Change F u e l SSS Gallons (K) 244 216 ▼ 12.3% Total Fuel Contribution (MM) $705 $982 ▲ 39.4% M e rc h a n d is e A c c e le ra ti o n SSS Tobacco Contribution (K) $14.6 $16.5 ▲ 14.9% SSS Non-Tobacco Contribution (K) $9.6 $10.0 ▲ 2.0% Total Merchandise Contribution (MM) $419 $459 ▲ 9.5% E x p e n s e C o n tr o l APSM Station OPEX (K) $20.6 $21.1 ▲ 2.4% Total Operating Expense (MM) $559 $549 ▼ 1.9% F in a n c ia l M e tr ic s Adj. EBITDA (MM) $423 $723 ▲ 71.0% Diluted Earnings Per Share $4.86 $13.08 ▲ 169.1% Durability and Resilience of MUSA Model: • Lower gallons offset by higher fuel contribution dollars • Category share gains directly resulted from targeted investments • Emphasis on employee well being allowed stores to continually serve customers COVID Impact on Consumers: . • Purchasing behaviors changed • Destination trips less frequent • Focus on value amplified Better Positioned to Win in 2021: • Higher expected fuel margins favor MUSA’s high-volume model • Opportunity to maintain and grow share gains in tobacco category • QuickChek acquisition highlights and accelerates food and beverage upside Key Metrics Table
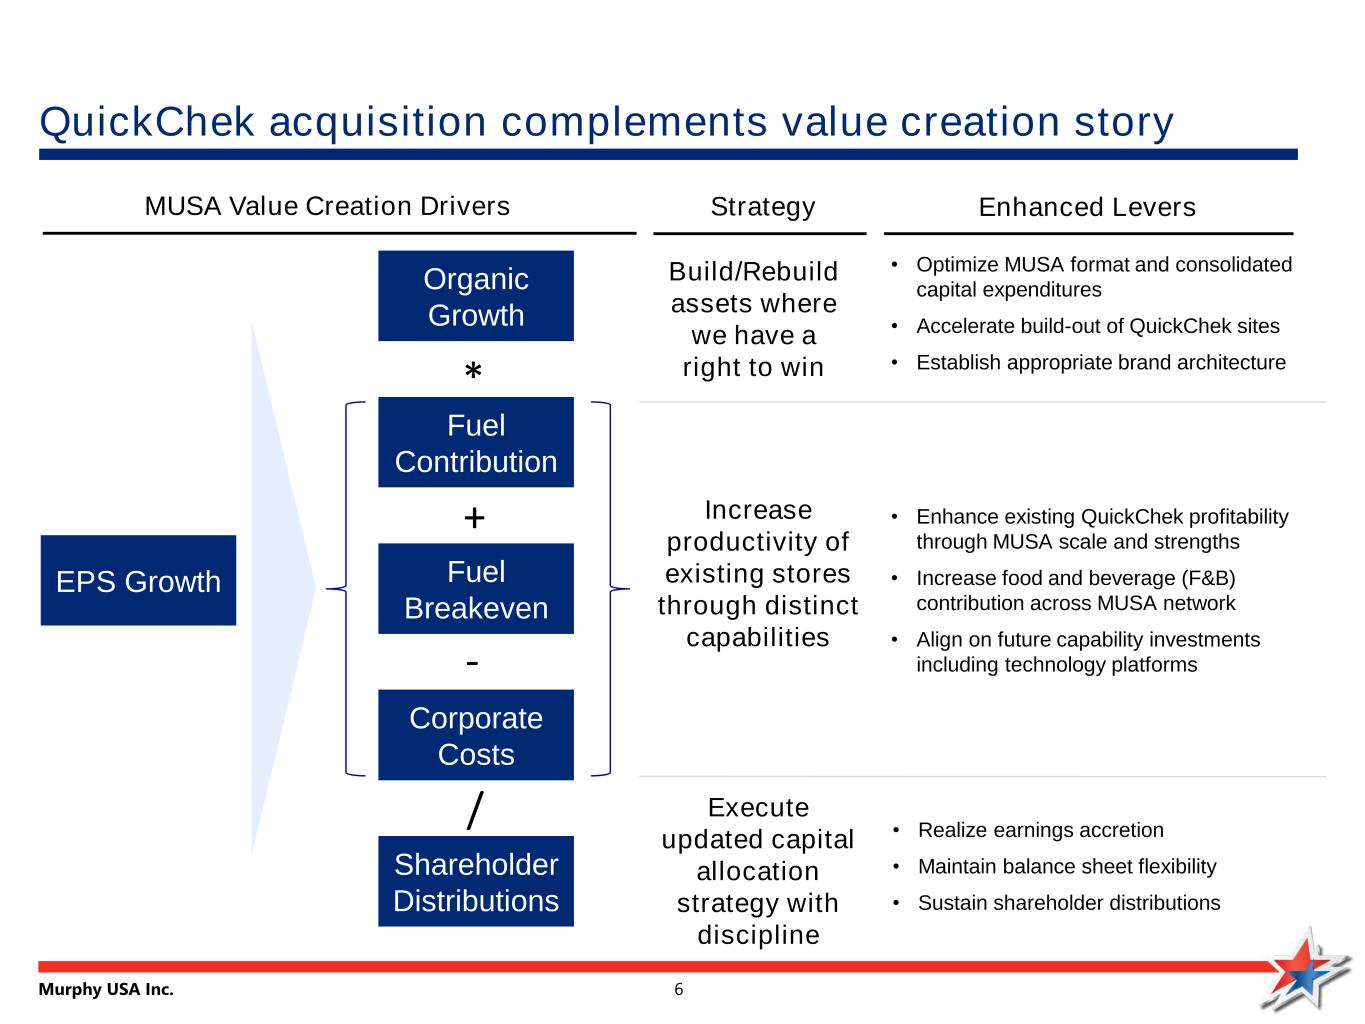
Murphy USA Inc. 6 QuickChek acquisition complements value creation story EPS Growth Organic Growth Fuel Contribution Fuel Breakeven Shareholder Distributions • Optimize MUSA format and consolidated capital expenditures • Accelerate build-out of QuickChek sites • Establish appropriate brand architecture Enhanced Levers Corporate Costs * + - MUSA Value Creation Drivers Strategy Build/Rebuild assets where we have a right to win • Enhance existing QuickChek profitability through MUSA scale and strengths • Increase food and beverage (F&B) contribution across MUSA network • Align on future capability investments including technology platforms • Realize earnings accretion • Maintain balance sheet flexibility • Sustain shareholder distributions Increase productivity of existing stores through distinct capabilities Execute updated capital allocation strategy with discipline /

Murphy USA Inc. 7 Business poised to accelerate in 2021 1. Accelerating High Quality Organic Growth – Building bigger, better stores – Leveraging higher performing 2,800 sq. ft. format on MUSA NTIs – Accelerating higher margin F&B offer with QuickChek capabilities 2. Improving Store Profitability – Growing coverage ratio / approaching “zero breakeven” fuel margin requirement – Sustaining 2020 share gains in 2021 – Improving in-store capabilities with QuickChek acquisition 3. Industry Fuel Margins Moving Higher – Breakeven economics under pressure for marginal retailers – Fuel margins represent primary lever to maintain profitability – MUSA and QuickChek low cost, high volume model disproportionately benefits

Murphy USA Inc. 8 Leveraging Higher Performing Format • New build class volumes robust in early years, despite COVID pressure • Merchandise sales strong in 2020 and expected to ramp further • Opportunities to optimize box layout and assortment while enhancing food offer Accelerating higher margin F&B offer through QuickChek capabilities • Portable capabilities create meaningful reverse synergy opportunities • Opportunity to inform NTI design • Favorably impacts coverage ratio Accelerating high-quality organic growth Building Bigger, Better Stores • Up to 55 Murphy and QuickChek NTI’s • Incremental retail space dedicated to higher margin non-tobacco products • Multi-year pipeline in place to maintain 50+ new stores per year 2021e 2015/2016 Average 82k sq. ft. from 70 MUSA branded stores 167k sq. ft. from 50 MUSA & 5 QC branded stores Annual Square Footage Additions 2020 Store Performance MUSA Branded Stores Only 220 166 292 238 Fuel Volume Merch Sales K-gal, APSM Merchandise Gross Profit Comparison FY 2019 Actuals Network Average 2,800 sq ft Format $K, APSM 52% 35% 13% Tobacco Drinks & Foodservice Other Merchandise QuickChek Murphy 59% 40% 1%
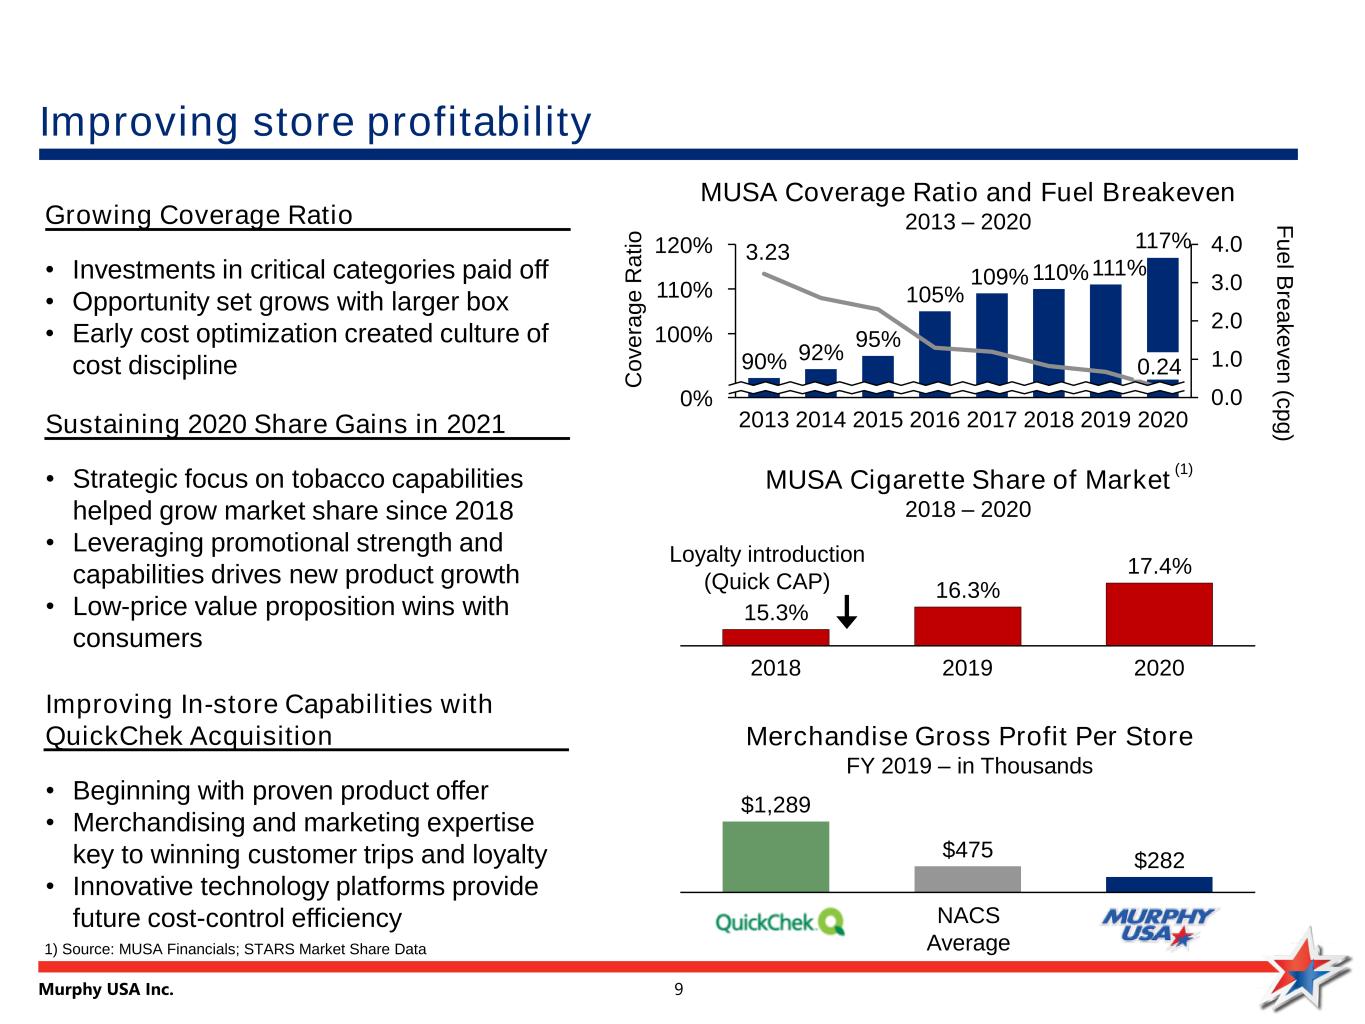
Murphy USA Inc. 9 Improving In-store Capabilities with QuickChek Acquisition • Beginning with proven product offer • Merchandising and marketing expertise key to winning customer trips and loyalty • Innovative technology platforms provide future cost-control efficiency Growing Coverage Ratio • Investments in critical categories paid off • Opportunity set grows with larger box • Early cost optimization created culture of cost discipline Improving store profitability Sustaining 2020 Share Gains in 2021 • Strategic focus on tobacco capabilities helped grow market share since 2018 • Leveraging promotional strength and capabilities drives new product growth • Low-price value proposition wins with consumers MUSA Coverage Ratio and Fuel Breakeven 2013 – 2020 3.23 0.0 1.0 2.0 3.0 4.0 0% 100% 110% 120% 2018 105% 92%90% 110% 2015 20192013 2014 2016 2017 0.24 2020 95% 109% 111% 117% C o v e ra g e R a ti o F u e l B re a k e v e n (c p g ) 15.3% 16.3% 17.4% 20202018 2019 Loyalty introduction (Quick CAP) MUSA Cigarette Share of Market 2018 – 2020 Merchandise Gross Profit Per Store FY 2019 – in Thousands $1,289 $475 $282 NACS Average1) Source: MUSA Financials; STARS Market Share Data (1)
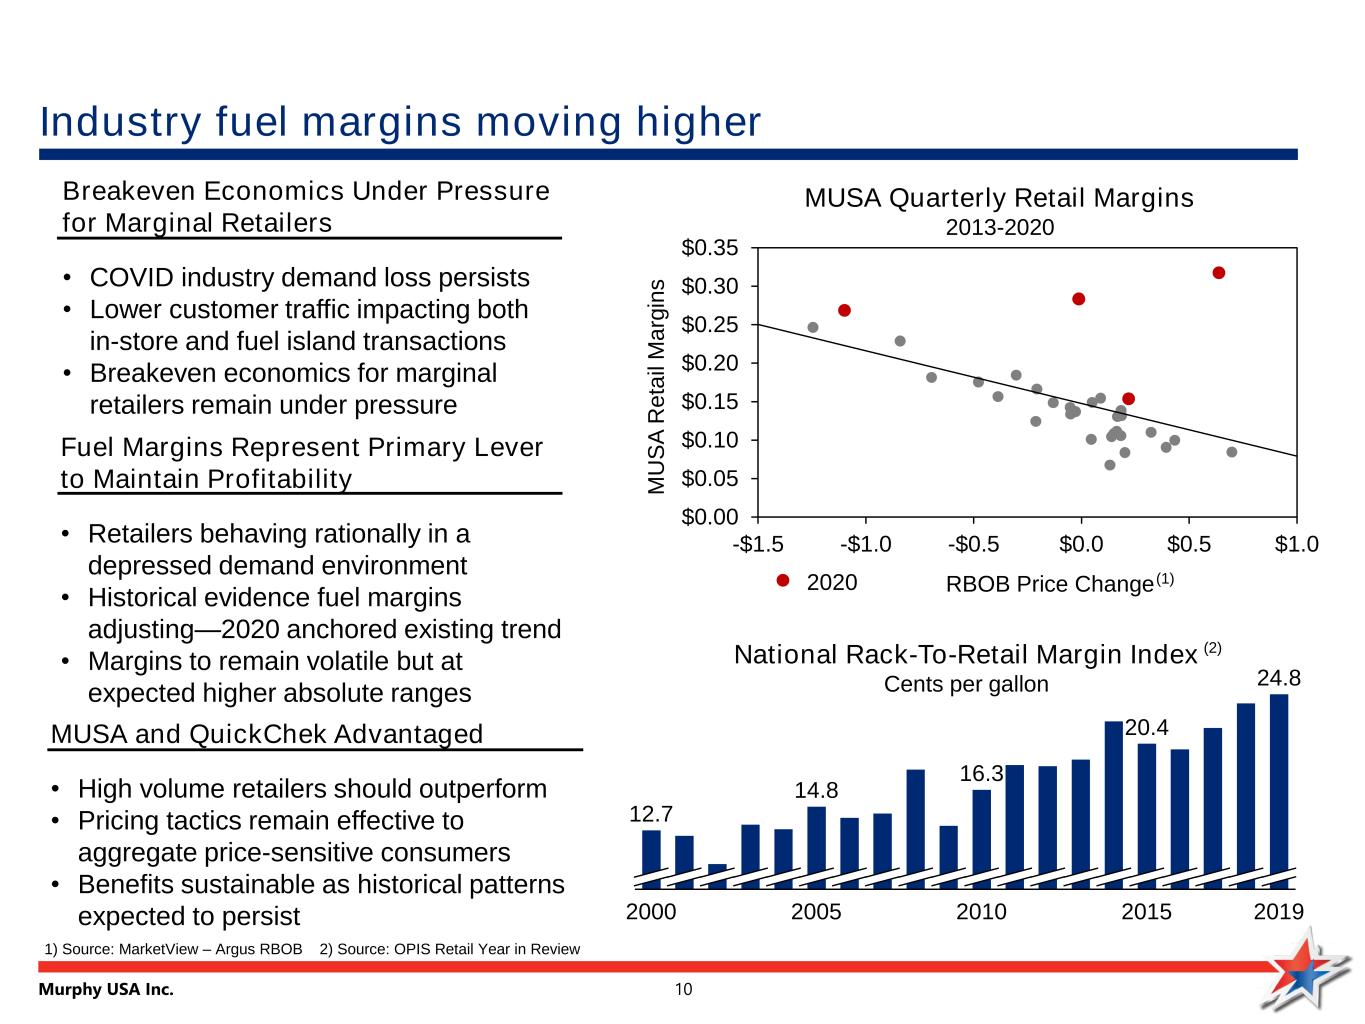
Murphy USA Inc. 10 Fuel Margins Represent Primary Lever to Maintain Profitability • Retailers behaving rationally in a depressed demand environment • Historical evidence fuel margins adjusting—2020 anchored existing trend • Margins to remain volatile but at expected higher absolute ranges Breakeven Economics Under Pressure for Marginal Retailers • COVID industry demand loss persists • Lower customer traffic impacting both in-store and fuel island transactions • Breakeven economics for marginal retailers remain under pressure Industry fuel margins moving higher MUSA and QuickChek Advantaged • High volume retailers should outperform • Pricing tactics remain effective to aggregate price-sensitive consumers • Benefits sustainable as historical patterns expected to persist National Rack-To-Retail Margin Index Cents per gallon 2000 2005 2010 2015 2019 12.7 14.8 16.3 20.4 24.8 MUSA Quarterly Retail Margins 2013-2020 (2) $0.00 $0.05 $0.10 $0.15 $0.20 $0.25 $0.30 $0.35 -$1.5 -$1.0 -$0.5 $0.0 $0.5 $1.0 2020 RBOB Price Change M U S A R e ta il M a rg in s (1) 1) Source: MarketView – Argus RBOB 2) Source: OPIS Retail Year in Review
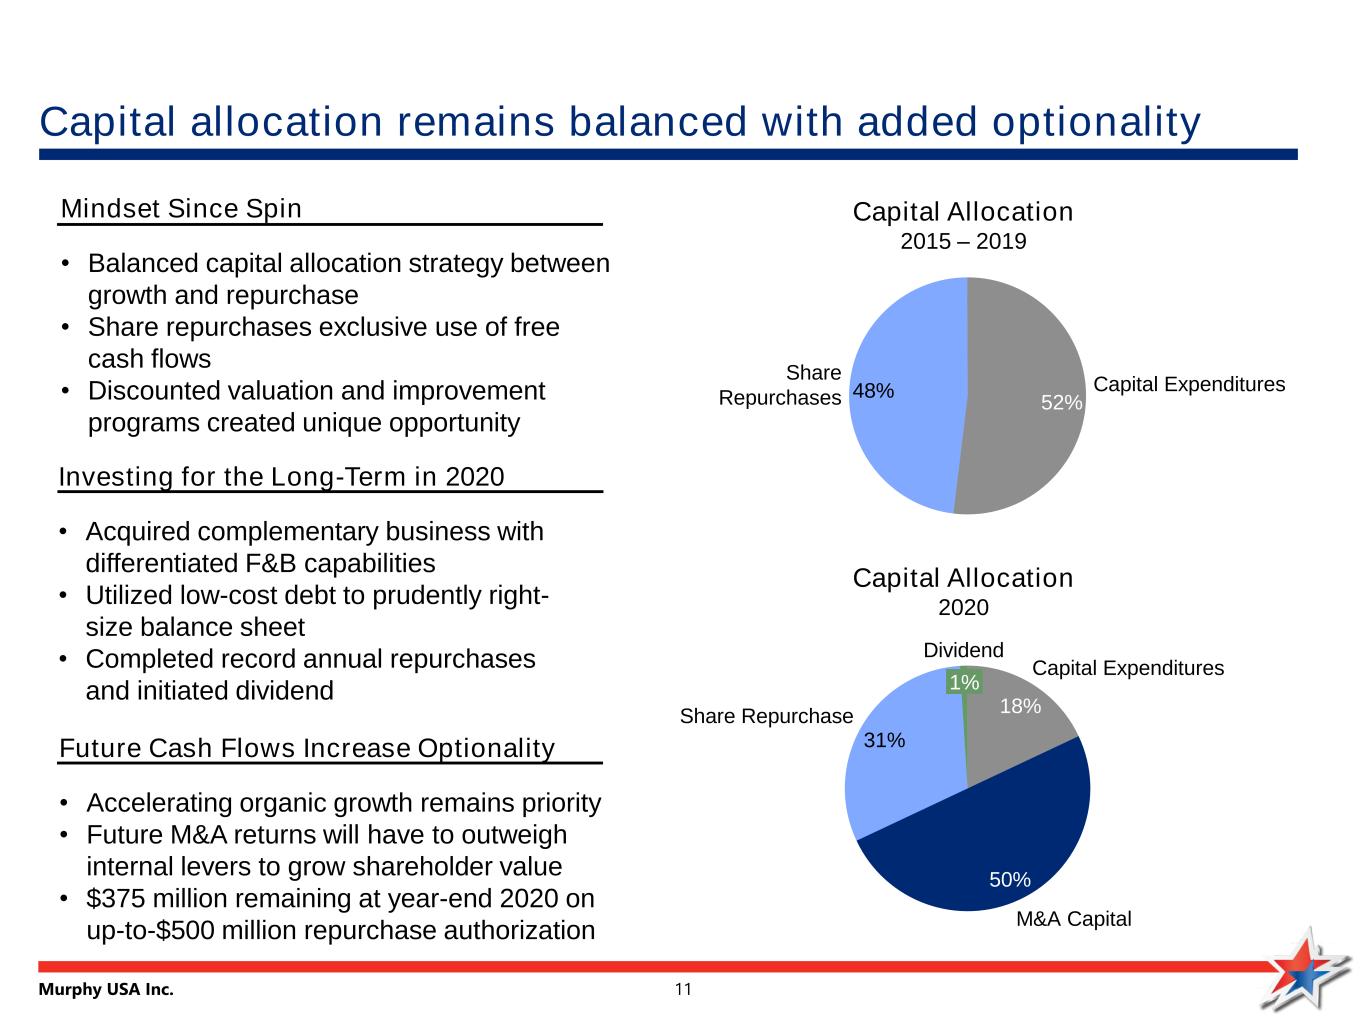
Murphy USA Inc. 11 Future Cash Flows Increase Optionality • Accelerating organic growth remains priority • Future M&A returns will have to outweigh internal levers to grow shareholder value • $375 million remaining at year-end 2020 on up-to-$500 million repurchase authorization Mindset Since Spin • Balanced capital allocation strategy between growth and repurchase • Share repurchases exclusive use of free cash flows • Discounted valuation and improvement programs created unique opportunity Capital allocation remains balanced with added optionality Investing for the Long-Term in 2020 • Acquired complementary business with differentiated F&B capabilities • Utilized low-cost debt to prudently right- size balance sheet • Completed record annual repurchases and initiated dividend 48% 52% Share Repurchases Capital Expenditures Capital Allocation 2015 – 2019 18% 50% 31% 1% Capital Expenditures M&A Capital Share Repurchase Dividend Capital Allocation 2020
Murphy USA Inc. 12 Fundamentals remain highly favorable • MUSA’s advantaged business model put to the test in 2020—and emerged stronger – Demonstrated resilience in the face of a global pandemic – Showed agility in decision making, taking market share and standing up new product lines – Made bold moves, repurchasing ~$400mm in stock and acquiring QuickChek while maintaining capital plan • Outlook remains robust in current dynamic environment – Currently advantaged due to industry structure supporting higher fuel margins – QuickChek format provides means to shift toward higher multiple category growth – Free cash flow generation ensures ongoing flexibility to adapt to short, medium, and long-term opportunities • Positioned to win in ever changing future – Pass through pricing dynamics sustain profitability and enhance it for low-cost retailers while providing insulation from headwinds over time – Strong market and customer demographics creates level of relative insulation – Well positioned to execute on new opportunities to improve longer-term terminal value
Murphy USA Inc. 13 Appendix

Murphy USA Inc. 14 2021 guidance 14 2020 Updated Guidance Range 2020 Actual Results 2021 Guidance Range Organic Growth New Stores 25-27 24 Up to 55 Raze and Rebuilds 28-30 33 Up to 25 Fuel Contribution Retail fuel volume per store (K gallons APSM) 217.5 to 222.5 220 245 to 255 Store Profitability Merchandise contribution ($ Millions) $455 to $460 $459 $680 to $700 Retail station Opex excluding credit cards (APSM % YOY change) Up 1-3% +3% N/A Retail station Opex excluding credit cards ($K, APSM) N/A N/A $27 to $28 Corporate Costs SG&A ($ Millions per year) $150 to $155 $171 $190 to $200 Effective Tax Rate 24% to 26% 24% 24% to 26% Capital Allocation Capital expenditures ($ Millions) $250 to $275 $227 $325 to $375 Note: 2020 guidance updated as of Q2 earnings on July 21, 2020
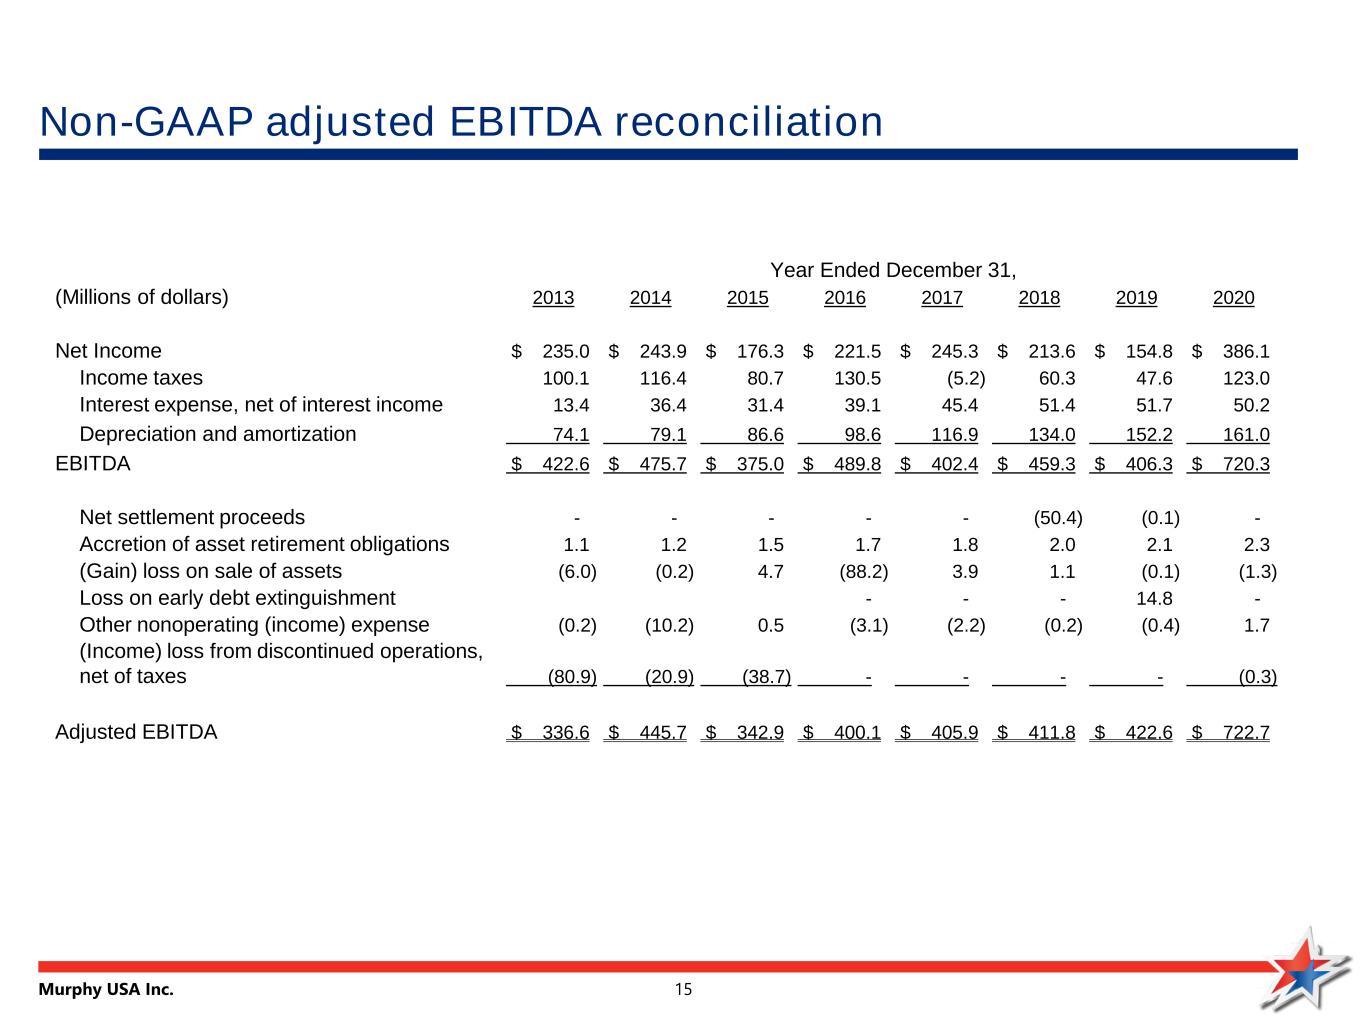
Murphy USA Inc. 15 Non-GAAP adjusted EBITDA reconciliation Year Ended December 31, (Millions of dollars) 2013 2014 2015 2016 2017 2018 2019 2020 Net Income $ 235.0 $ 243.9 $ 176.3 $ 221.5 $ 245.3 $ 213.6 $ 154.8 $ 386.1 Income taxes 100.1 116.4 80.7 130.5 (5.2) 60.3 47.6 123.0 Interest expense, net of interest income 13.4 36.4 31.4 39.1 45.4 51.4 51.7 50.2 Depreciation and amortization 74.1 79.1 86.6 98.6 116.9 134.0 152.2 161.0 EBITDA $ 422.6 $ 475.7 $ 375.0 $ 489.8 $ 402.4 $ 459.3 $ 406.3 $ 720.3 Net settlement proceeds - - - - - (50.4) (0.1) - Accretion of asset retirement obligations 1.1 1.2 1.5 1.7 1.8 2.0 2.1 2.3 (Gain) loss on sale of assets (6.0) (0.2) 4.7 (88.2) 3.9 1.1 (0.1) (1.3) Loss on early debt extinguishment - - - 14.8 - Other nonoperating (income) expense (0.2) (10.2) 0.5 (3.1) (2.2) (0.2) (0.4) 1.7 (Income) loss from discontinued operations, net of taxes (80.9) (20.9) (38.7) - - - - (0.3) Adjusted EBITDA $ 336.6 $ 445.7 $ 342.9 $ 400.1 $ 405.9 $ 411.8 $ 422.6 $ 722.7
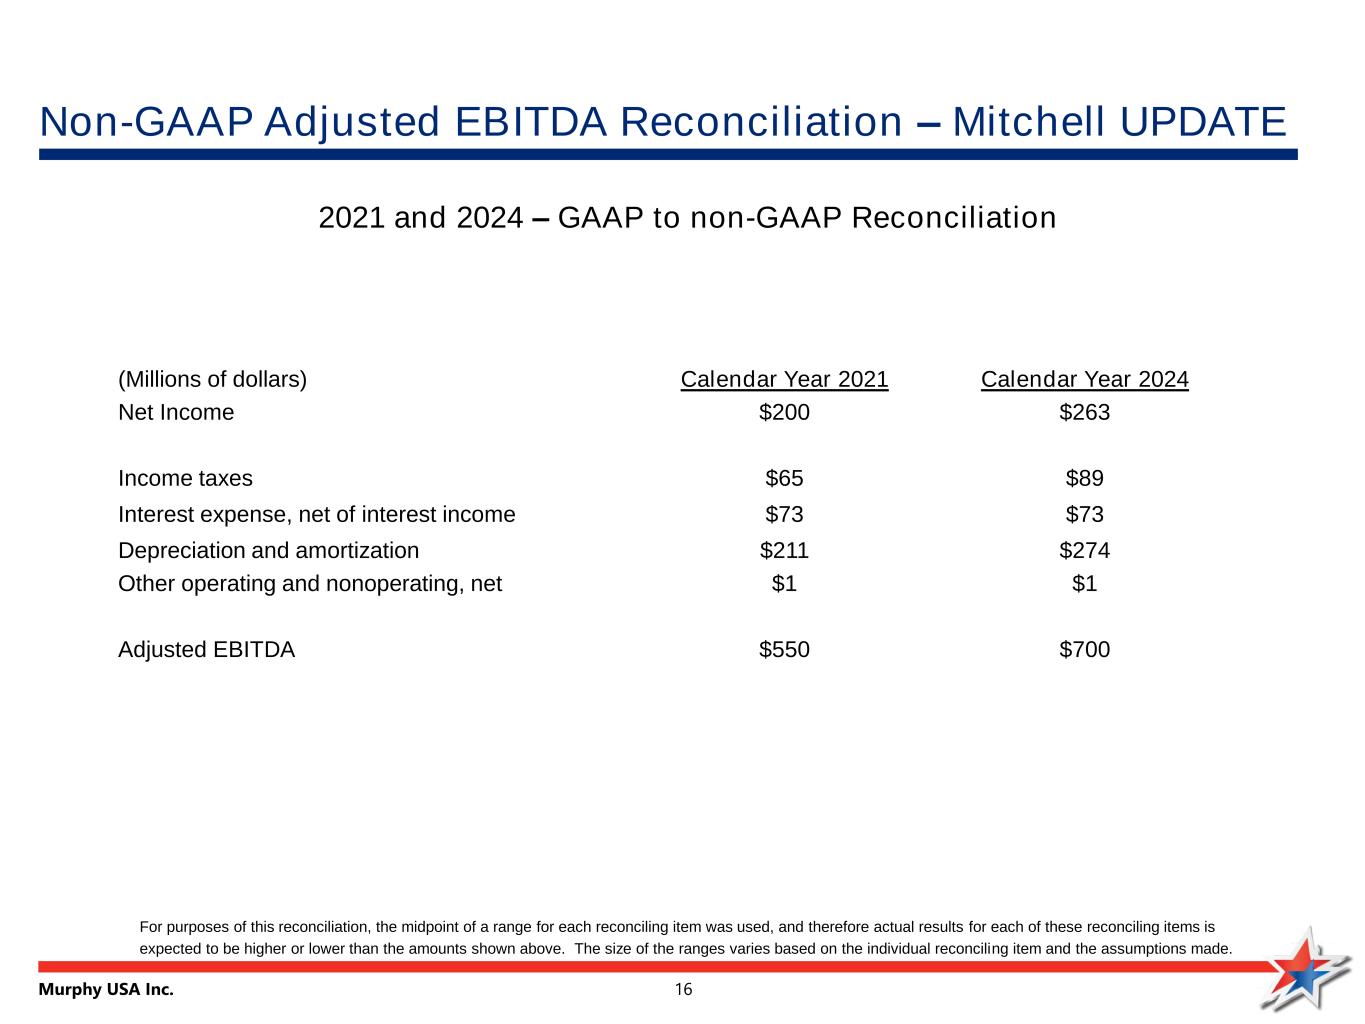
Murphy USA Inc. 16 Non-GAAP Adjusted EBITDA Reconciliation – Mitchell UPDATE For purposes of this reconciliation, the midpoint of a range for each reconciling item was used, and therefore actual results for each of these reconciling items is expected to be higher or lower than the amounts shown above. The size of the ranges varies based on the individual reconciling item and the assumptions made. 2021 and 2024 – GAAP to non-GAAP Reconciliation (Millions of dollars) Calendar Year 2021 Calendar Year 2024 Net Income $200 $263 Income taxes $65 $89 Interest expense, net of interest income $73 $73 Depreciation and amortization $211 $274 Other operating and nonoperating, net $1 $1 Adjusted EBITDA $550 $700


