Murphy USA Inc. 1 Raymond James Institutional Investor Conference March 2022
Murphy USA Inc. 2 Cautionary statement This presentation contains forward-looking statements. These statements, which express management’s current views concerning future events or results, are subject to inherent risks and uncertainties. Factors that could cause actual results to differ materially from those expressed or implied in our forward-looking statements include, but are not limited to, the volatility and level of crude oil and gasoline prices, the pace and success of our expansion plan, our relationship with Walmart, political and regulatory uncertainty, our ability to realize projected synergies from the acquisition of QuickChek and successfully expand our food and beverage offerings, uncontrollable natural hazards, and adverse market conditions or tax consequences, among other things. For further discussion of risk factors, see “Risk Factors” in the Murphy USA registration statement on our latest form 10-Q and 10-K. Murphy USA undertakes no duty to publicly update or revise any forward-looking statements. The Murphy USA financial information in this presentation is derived from the audited and unaudited consolidated financial statements of Murphy USA, Inc. for the years ended December 31, 2021, 2020, 2019, 2018, 2017, 2016, and 2015. Please reference our most recent 10-K, 10-Q, and 8-K filings for the latest information. If this presentation contains non-GAAP financial measures, we have provided a reconciliation of such non-GAAP financial measures to the most directly comparable measures prepared in accordance with U.S. GAAP in the Appendix to this presentation. Christian Pikul, CFA Vice President of Investor Relations and FP&A Christian.pikul@murphyusa.com
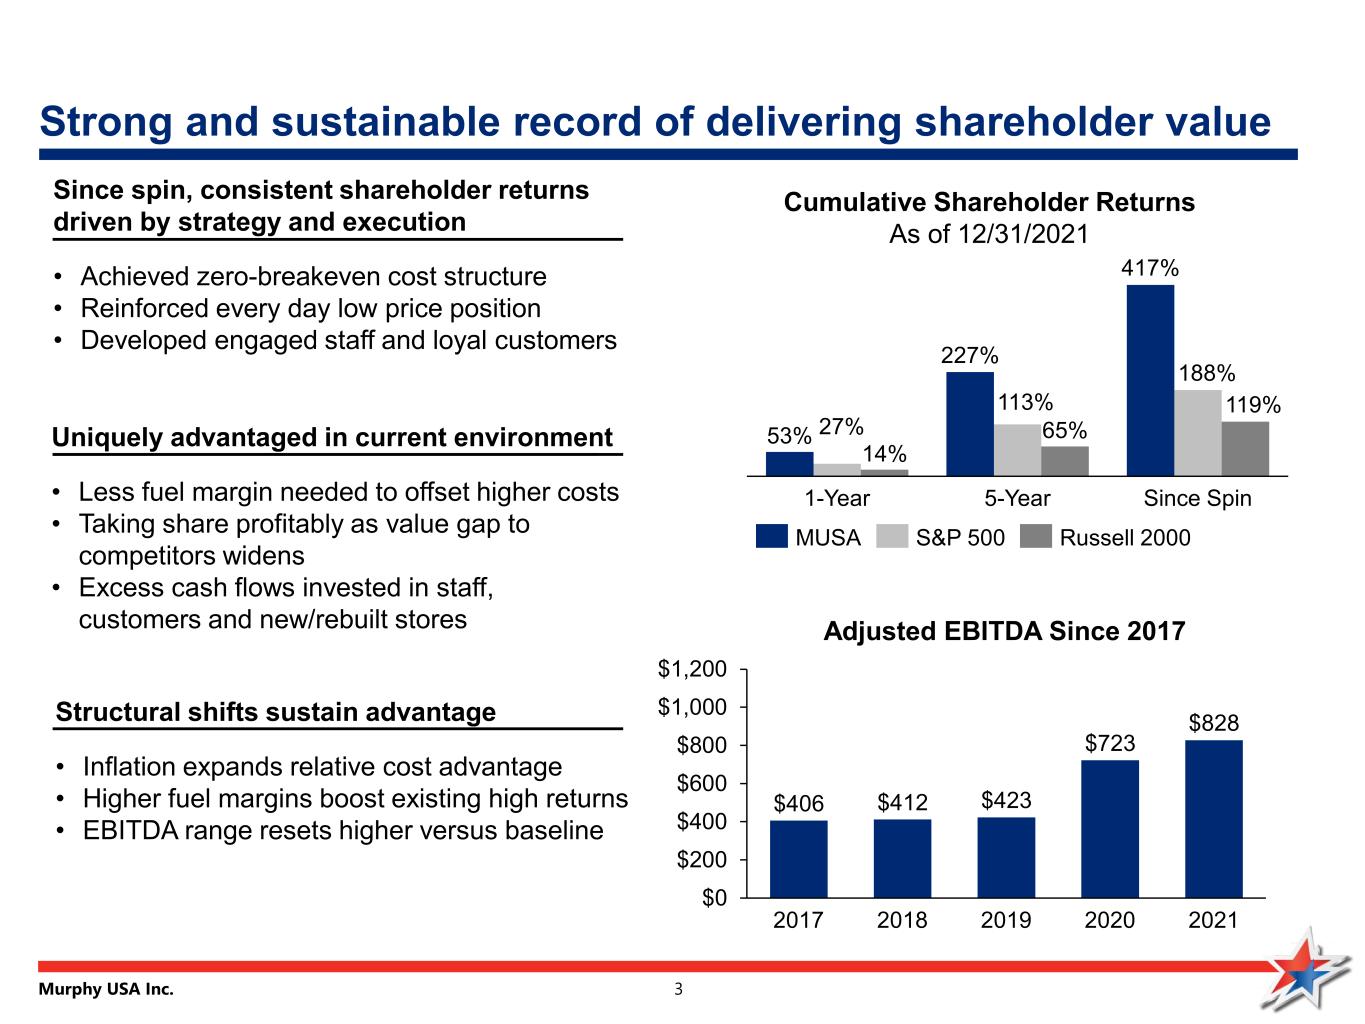
Murphy USA Inc. 3 Since spin, consistent shareholder returns driven by strategy and execution • Achieved zero-breakeven cost structure • Reinforced every day low price position • Developed engaged staff and loyal customers Strong and sustainable record of delivering shareholder value 53% 227% 417% 27% 113% 188% 14% 65% 119% 5-Year1-Year Since Spin MUSA S&P 500 Russell 2000 Cumulative Shareholder Returns As of 12/31/2021 $406 $412 $423 $723 $828 $0 $200 $400 $600 $800 $1,000 $1,200 2017 20202018 2019 2021 Adjusted EBITDA Since 2017 Uniquely advantaged in current environment • Less fuel margin needed to offset higher costs • Taking share profitably as value gap to competitors widens • Excess cash flows invested in staff, customers and new/rebuilt stores Structural shifts sustain advantage • Inflation expands relative cost advantage • Higher fuel margins boost existing high returns • EBITDA range resets higher versus baseline
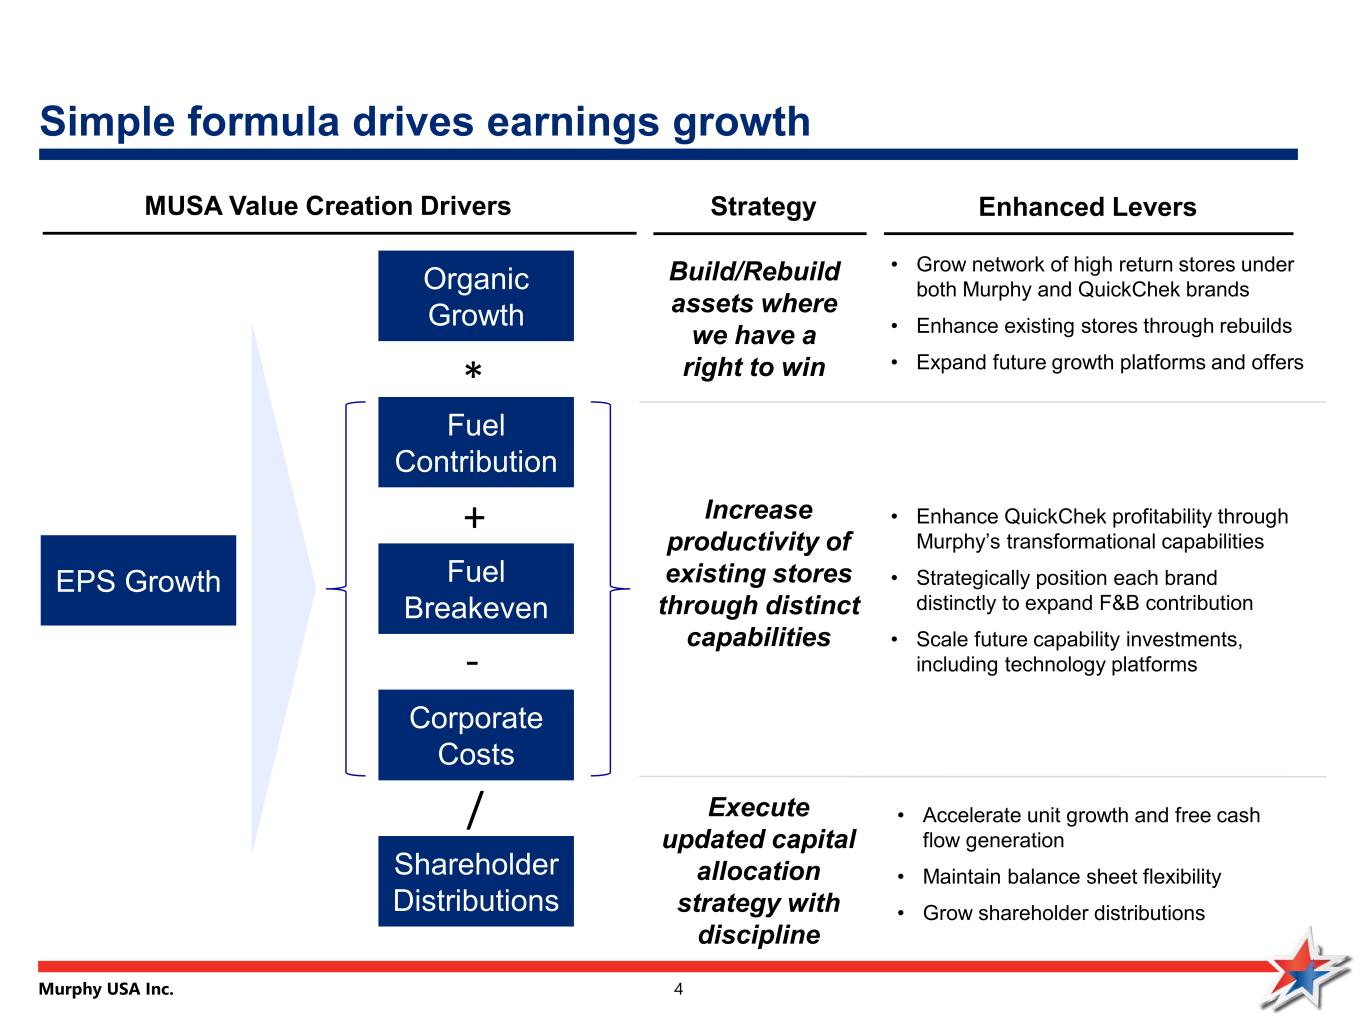
Murphy USA Inc. 4 Simple formula drives earnings growth EPS Growth Organic Growth Fuel Contribution Fuel Breakeven Shareholder Distributions • Grow network of high return stores under both Murphy and QuickChek brands • Enhance existing stores through rebuilds • Expand future growth platforms and offers Enhanced Levers Corporate Costs * + - MUSA Value Creation Drivers Strategy Build/Rebuild assets where we have a right to win • Enhance QuickChek profitability through Murphy’s transformational capabilities • Strategically position each brand distinctly to expand F&B contribution • Scale future capability investments, including technology platforms • Accelerate unit growth and free cash flow generation • Maintain balance sheet flexibility • Grow shareholder distributions Increase productivity of existing stores through distinct capabilities Execute updated capital allocation strategy with discipline /

Murphy USA Inc. 5 Structural shifts favor our advantaged model 17Baseline Total Equilibrium Residual 1 21 3 3 25 5 2022 Model 2022 Upside COVID accelerated this structural shift • Demand destruction at onset increased breakeven unit cost for weaker retailers • Low street prices created favorable environment to pass thru higher costs Future equilibrium expected to settle at higher levels • Headwinds to weaker retailers persist from inflation and lower demand • MUSA’s zero breakeven and recovered demand creates advantage Pre-Covid fuel margins elevated slowly • Fuel margins steadily increased since 2000 as industry structure evolved • MUSA all-in margins edged higher to 16-cpg baseline from 2017-2019 14 232119 2412 300 13 15 1716 260 18 320 20 22 25 160 180 200 220 240 280 CPG AP SM G al lo ns (0 00 ) 2022 Fuel Margin CPG 20172018 2019 2020 2021 2022 2022u MUSA Historical Fuel Margin and Volumes Contribution Curves in Constant 2022 Store Months 3 26 6 2021 (1) (1) Includes 4.4-cpg of PS&W + RINs contribution, which is elevated versus the long-term average of approximately 2.5 cpg EBITDA 630 810828 2016 2015 2014
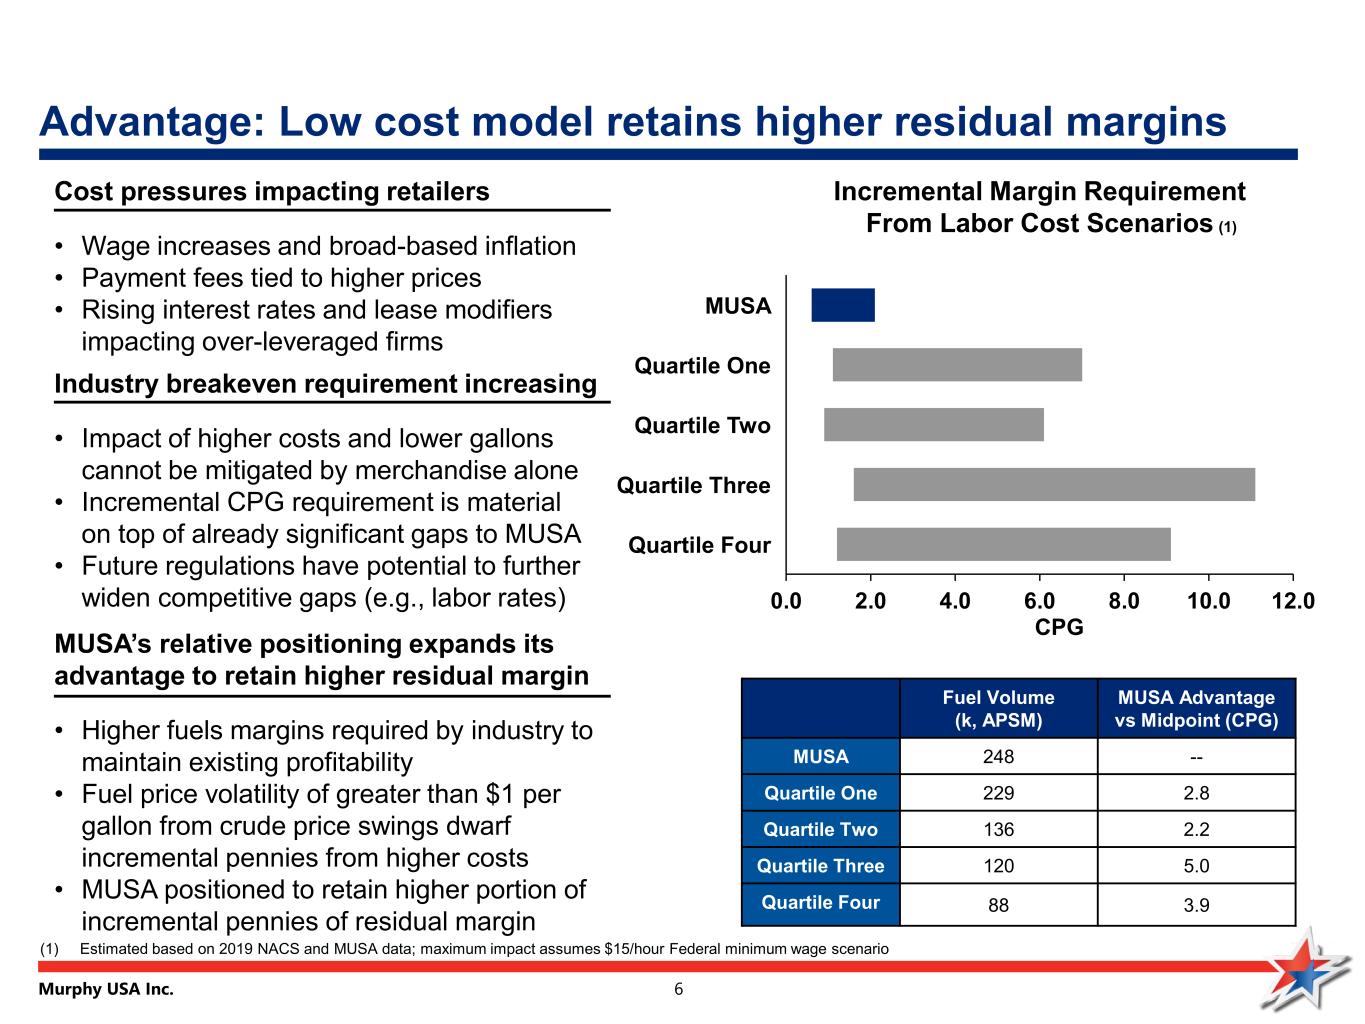
Murphy USA Inc. 6 Advantage: Low cost model retains higher residual margins Incremental Margin Requirement From Labor Cost Scenarios (1) (1) Estimated based on 2019 NACS and MUSA data; maximum impact assumes $15/hour Federal minimum wage scenario Industry breakeven requirement increasing • Impact of higher costs and lower gallons cannot be mitigated by merchandise alone • Incremental CPG requirement is material on top of already significant gaps to MUSA • Future regulations have potential to further widen competitive gaps (e.g., labor rates) MUSA’s relative positioning expands its advantage to retain higher residual margin • Higher fuels margins required by industry to maintain existing profitability • Fuel price volatility of greater than $1 per gallon from crude price swings dwarf incremental pennies from higher costs • MUSA positioned to retain higher portion of incremental pennies of residual margin Cost pressures impacting retailers • Wage increases and broad-based inflation • Payment fees tied to higher prices • Rising interest rates and lease modifiers impacting over-leveraged firms 0.0 2.0 4.0 6.0 8.0 10.0 12.0 MUSA Quartile Four Quartile One Quartile Two Quartile Three CPG Fuel Volume (k, APSM) MUSA Advantage vs Midpoint (CPG) MUSA 248 -- Quartile One 229 2.8 Quartile Two 136 2.2 Quartile Three 120 5.0 Quartile Four 88 3.9
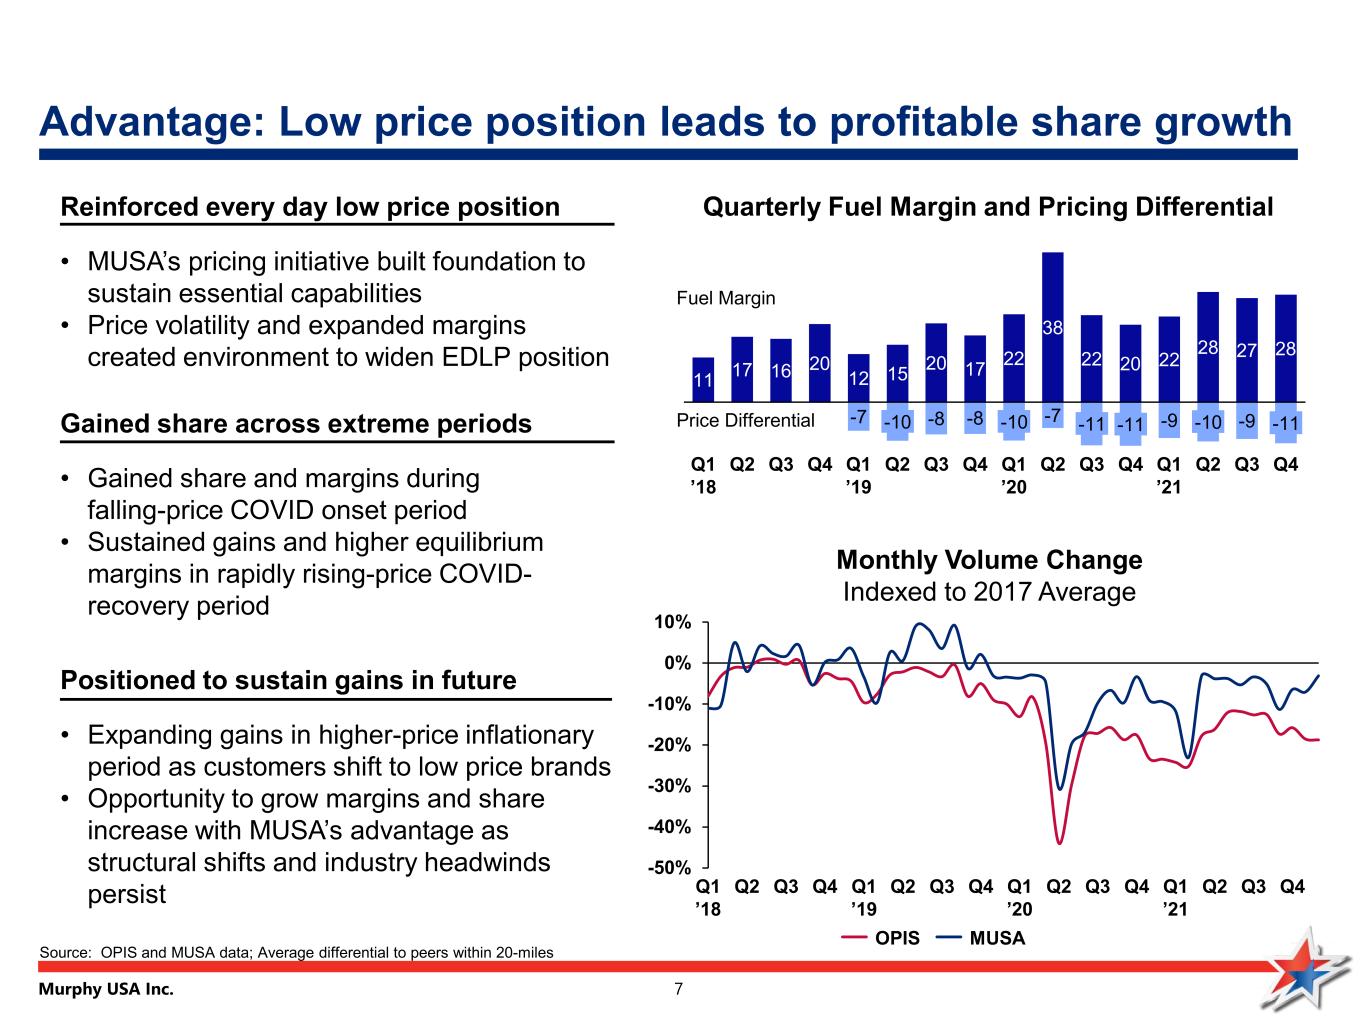
Murphy USA Inc. 7 Advantage: Low price position leads to profitable share growth 11 17 16 20 12 15 20 17 22 38 22 20 22 28 27 28 -7 -8 -8 -7 -9 -9-10 Q3 Q4Q2Q1 ’19 Q1 ’18 Q2 Q3 -10 Q4 -10 Q1 ’20 Q2 -11 Q3 -11 Q4 Q1 ’21 Q2 -11 Q3 Q4 Monthly Volume Change Indexed to 2017 Average Quarterly Fuel Margin and Pricing Differential Positioned to sustain gains in future • Expanding gains in higher-price inflationary period as customers shift to low price brands • Opportunity to grow margins and share increase with MUSA’s advantage as structural shifts and industry headwinds persist Reinforced every day low price position • MUSA’s pricing initiative built foundation to sustain essential capabilities • Price volatility and expanded margins created environment to widen EDLP position Gained share across extreme periods • Gained share and margins during falling-price COVID onset period • Sustained gains and higher equilibrium margins in rapidly rising-price COVID- recovery period -50% -40% -30% -20% -10% 0% 10% Q1 ’20 Q3 Q4 Q2Q1 ’21 Q3 Q2Q1 ’18 Q2 Q4 Q1 ’19 Q2 Q3 Q4 Q3 Q4 MUSAOPIS Source: OPIS and MUSA data; Average differential to peers within 20-miles Fuel Margin Price Differential
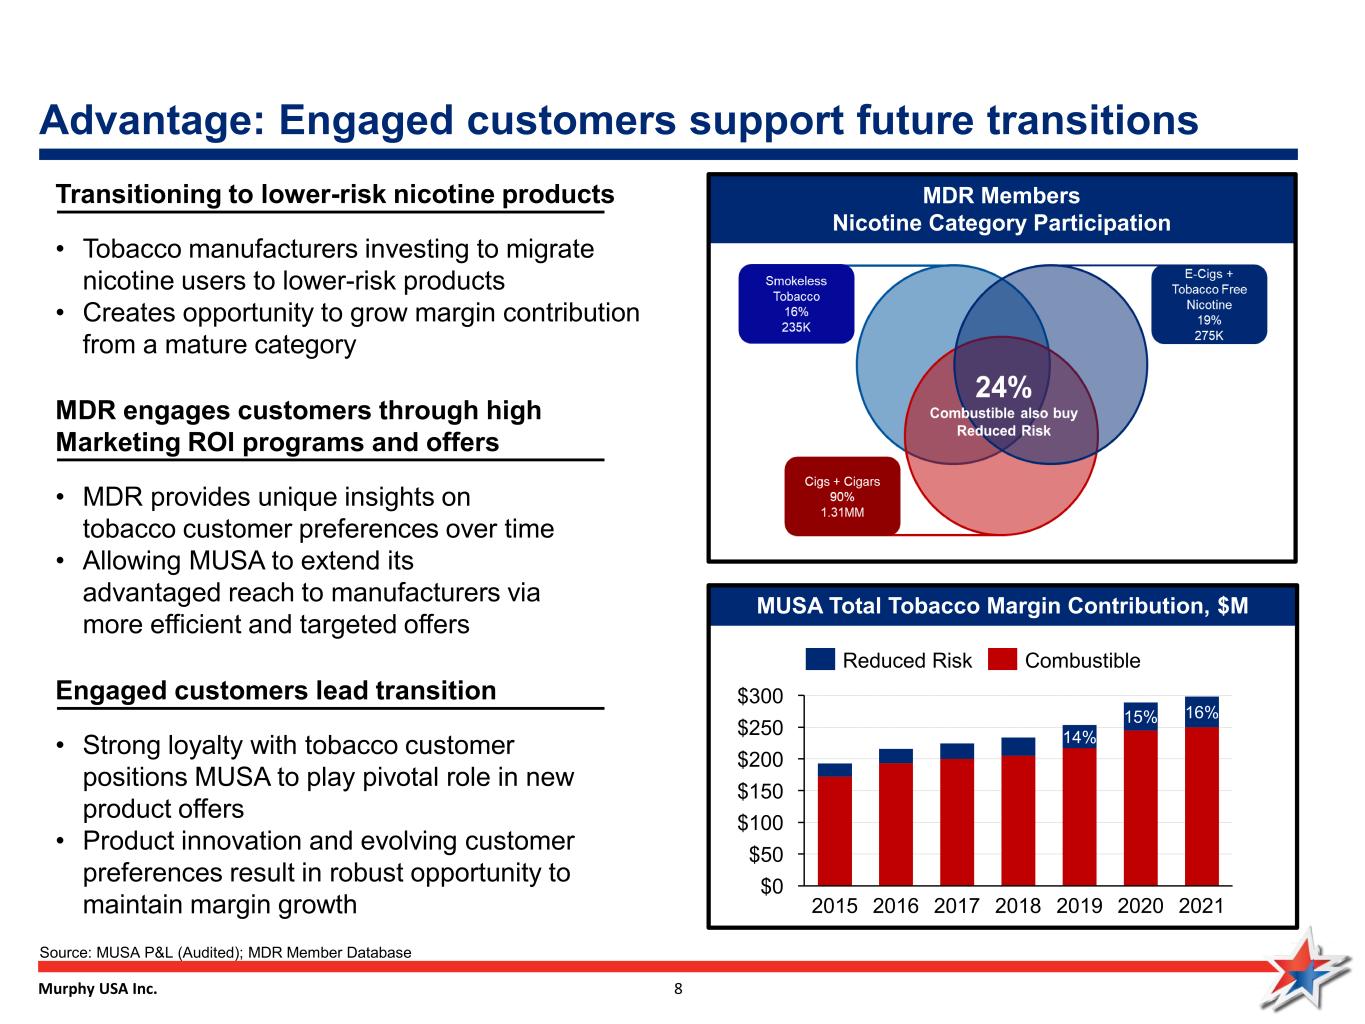
Murphy USA Inc. 8 MUSA Total Tobacco Margin Contribution, $M Advantage: Engaged customers support future transitions Source: MUSA P&L (Audited); MDR Member Database Advantaged to Convert $0 $50 $200 $100 $150 $250 $300 20172015 2016 2018 14% 2019 15% 2020 16% 2021 Reduced Risk Combustible MDR Members Nicotine Category Participation MDR engages customers through high Marketing ROI programs and offers • MDR provides unique insights on tobacco customer preferences over time • Allowing MUSA to extend its advantaged reach to manufacturers via more efficient and targeted offers Engaged customers lead transition • Strong loyalty with tobacco customer positions MUSA to play pivotal role in new product offers • Product innovation and evolving customer preferences result in robust opportunity to maintain margin growth Transitioning to lower-risk nicotine products • Tobacco manufacturers investing to migrate nicotine users to lower-risk products • Creates opportunity to grow margin contribution from a mature category
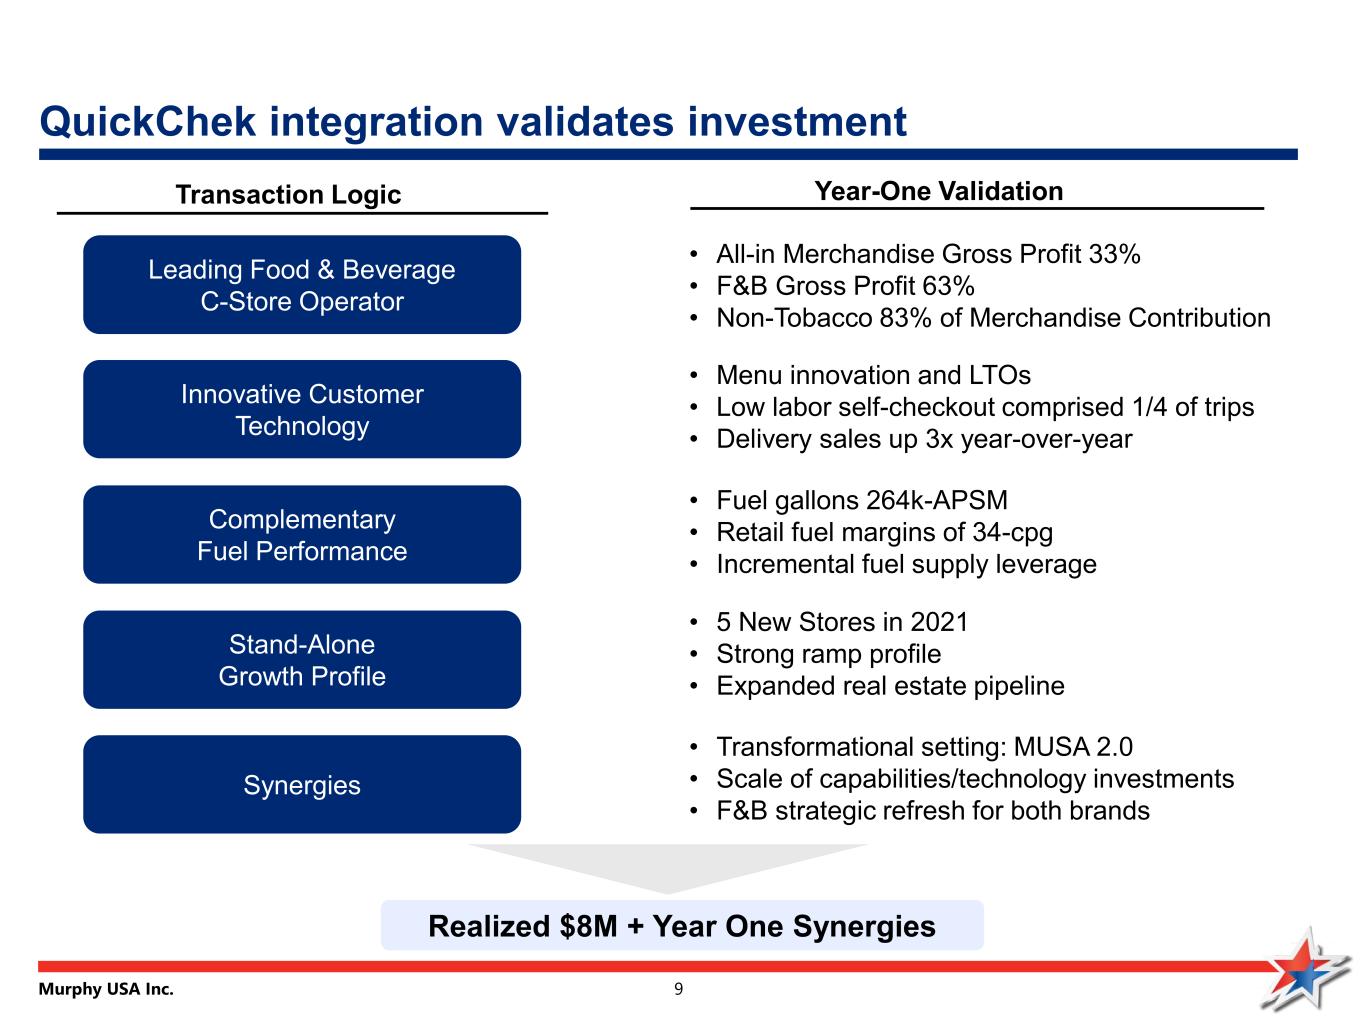
Murphy USA Inc. 9 QuickChek integration validates investment Leading Food & Beverage C-Store Operator Innovative Customer Technology Complementary Fuel Performance Stand-Alone Growth Profile Synergies Transaction Logic Realized $8M + Year One Synergies Year-One Validation • All-in Merchandise Gross Profit 33% • F&B Gross Profit 63% • Non-Tobacco 83% of Merchandise Contribution • Menu innovation and LTOs • Low labor self-checkout comprised 1/4 of trips • Delivery sales up 3x year-over-year • Fuel gallons 264k-APSM • Retail fuel margins of 34-cpg • Incremental fuel supply leverage • 5 New Stores in 2021 • Strong ramp profile • Expanded real estate pipeline • Transformational setting: MUSA 2.0 • Scale of capabilities/technology investments • F&B strategic refresh for both brands
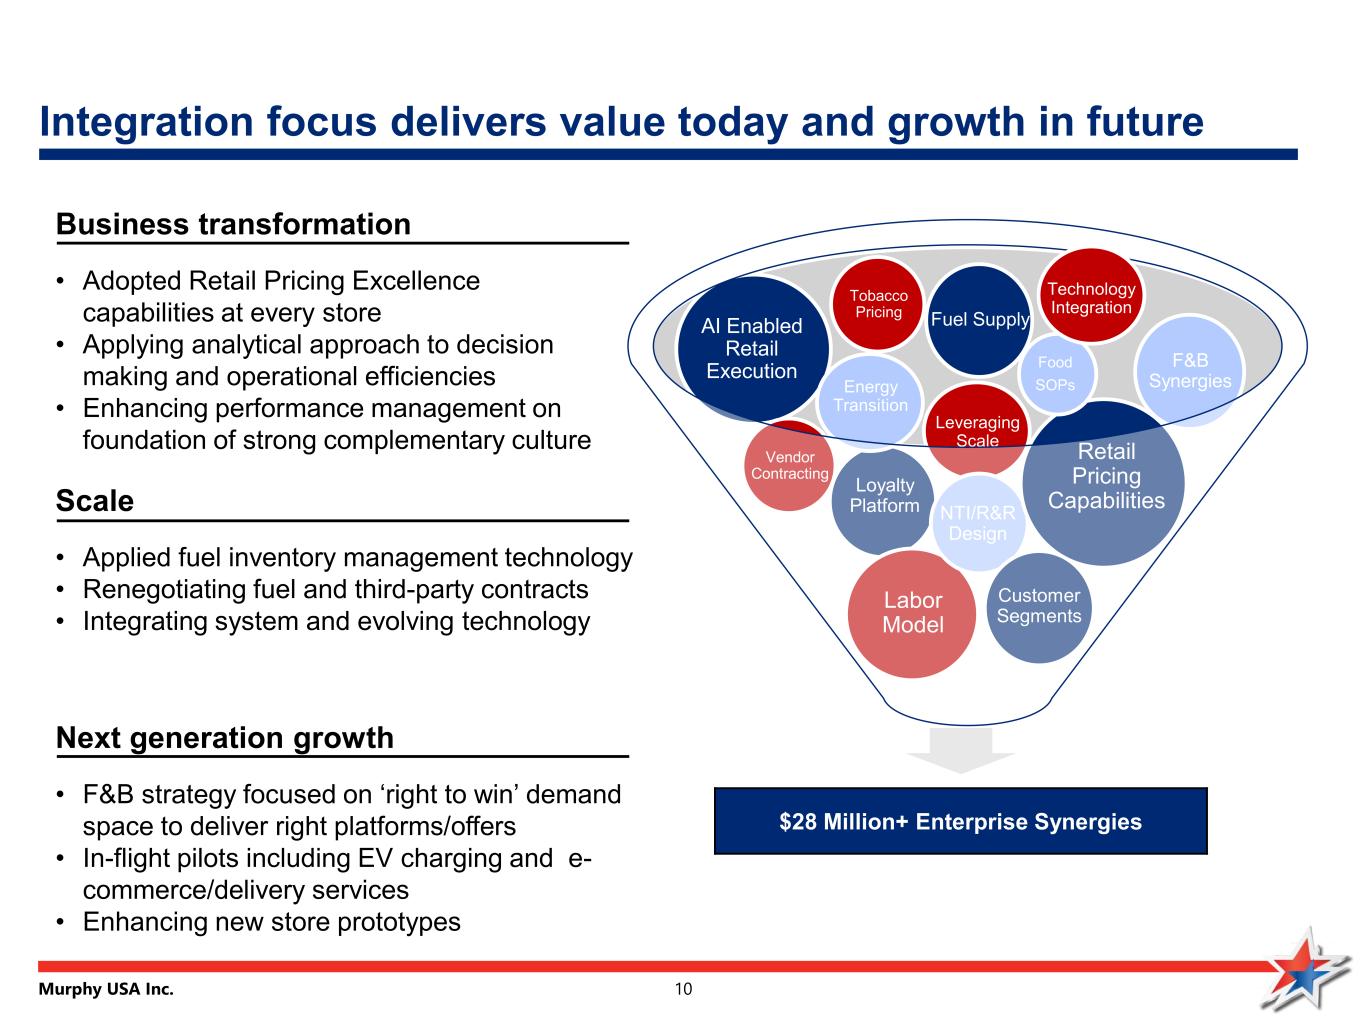
Murphy USA Inc. 10 Integration focus delivers value today and growth in future AI Enabled Retail Execution Fuel Supply Loyalty Platform Energy Transition Vendor Contracting Labor Model Leveraging Scale NTI/R&R Design Retail Pricing Capabilities $28 Million+ Enterprise Synergies F&B Synergies Customer Segments Tobacco Pricing Food SOPs Business transformation • Adopted Retail Pricing Excellence capabilities at every store • Applying analytical approach to decision making and operational efficiencies • Enhancing performance management on foundation of strong complementary culture Next generation growth • F&B strategy focused on ‘right to win’ demand space to deliver right platforms/offers • In-flight pilots including EV charging and e- commerce/delivery services • Enhancing new store prototypes Scale • Applied fuel inventory management technology • Renegotiating fuel and third-party contracts • Integrating system and evolving technology Technology Integration
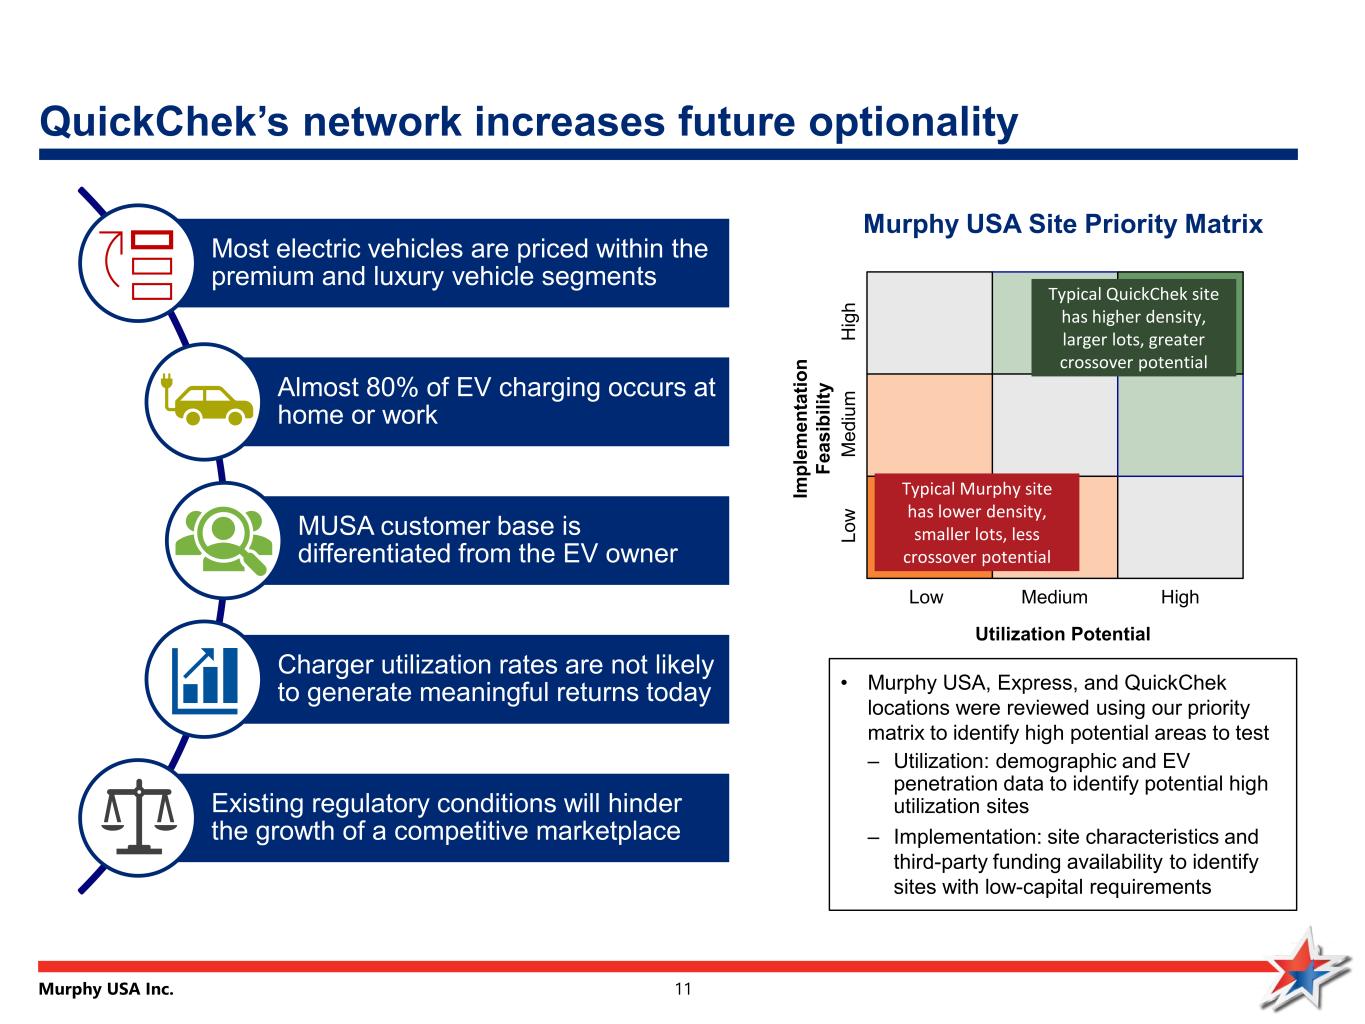
Murphy USA Inc. 11 Most electric vehicles are priced within the premium and luxury vehicle segments Almost 80% of EV charging occurs at home or work MUSA customer base is differentiated from the EV owner Charger utilization rates are not likely to generate meaningful returns today Existing regulatory conditions will hinder the growth of a competitive marketplace QuickChek’s network increases future optionality Murphy USA Site Priority Matrix H ig h M ed iu m Lo w Low Medium High Im pl em en ta tio n Fe as ib ili ty Utilization Potential • Murphy USA, Express, and QuickChek locations were reviewed using our priority matrix to identify high potential areas to test – Utilization: demographic and EV penetration data to identify potential high utilization sites – Implementation: site characteristics and third-party funding availability to identify sites with low-capital requirements Typical Murphy site has lower density, smaller lots, less crossover potential Typical QuickChek site has higher density, larger lots, greater crossover potential
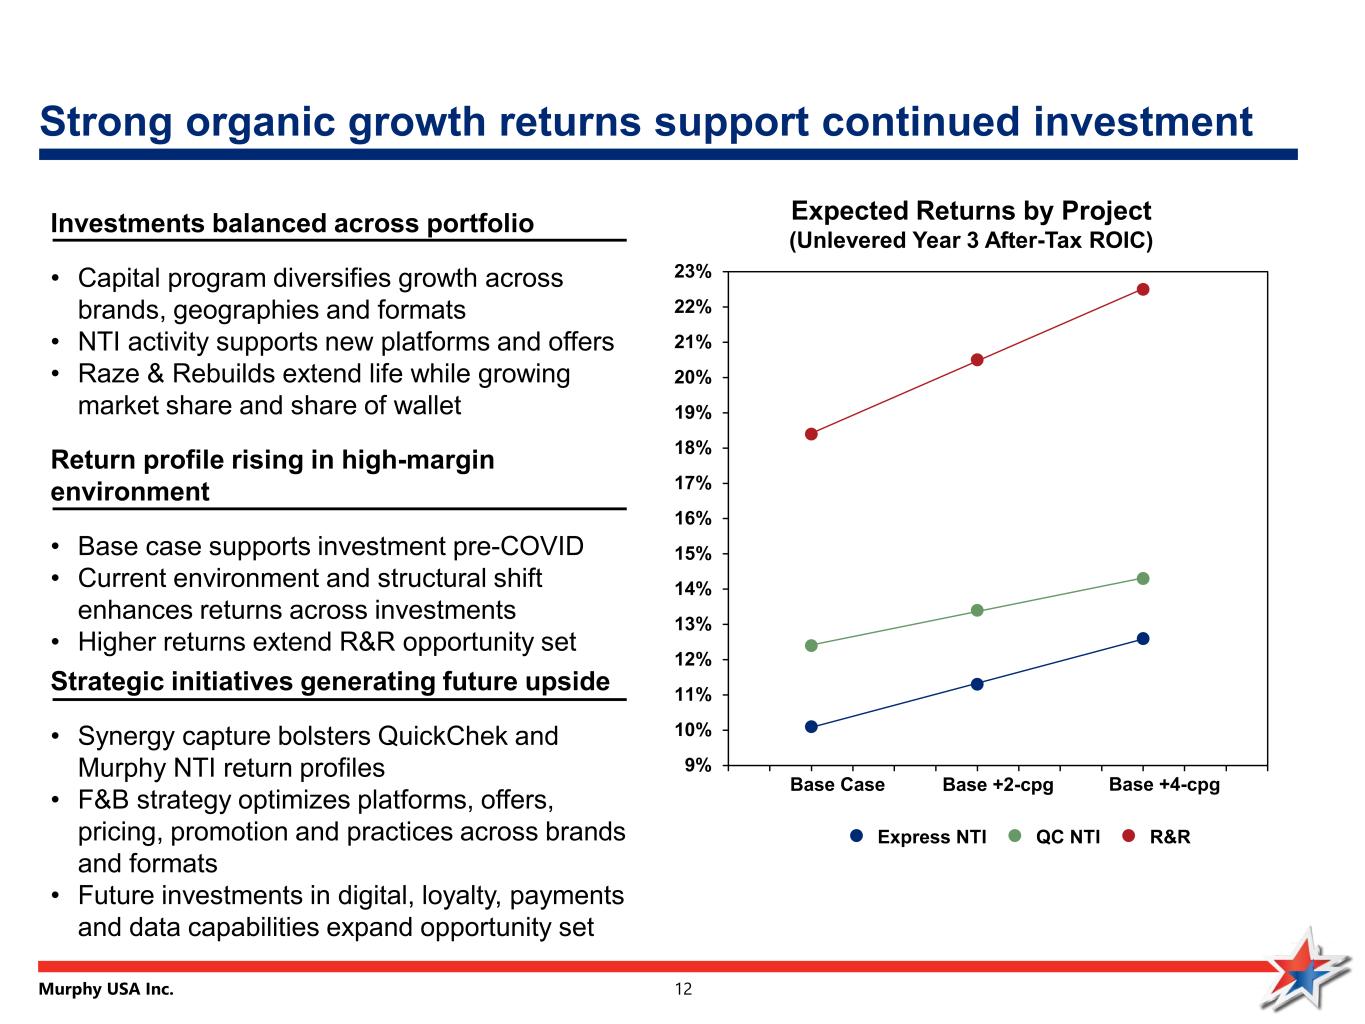
Murphy USA Inc. 12 Expected Returns by Project (Unlevered Year 3 After-Tax ROIC)Investments balanced across portfolio • Capital program diversifies growth across brands, geographies and formats • NTI activity supports new platforms and offers • Raze & Rebuilds extend life while growing market share and share of wallet Return profile rising in high-margin environment • Base case supports investment pre-COVID • Current environment and structural shift enhances returns across investments • Higher returns extend R&R opportunity set Strategic initiatives generating future upside • Synergy capture bolsters QuickChek and Murphy NTI return profiles • F&B strategy optimizes platforms, offers, pricing, promotion and practices across brands and formats • Future investments in digital, loyalty, payments and data capabilities expand opportunity set 9% 10% 11% 12% 13% 14% 15% 16% 17% 18% 19% 20% 21% 22% 23% Base Case Base +2-cpg Base +4-cpg Strong organic growth returns support continued investment Express NTI R&RQC NTI
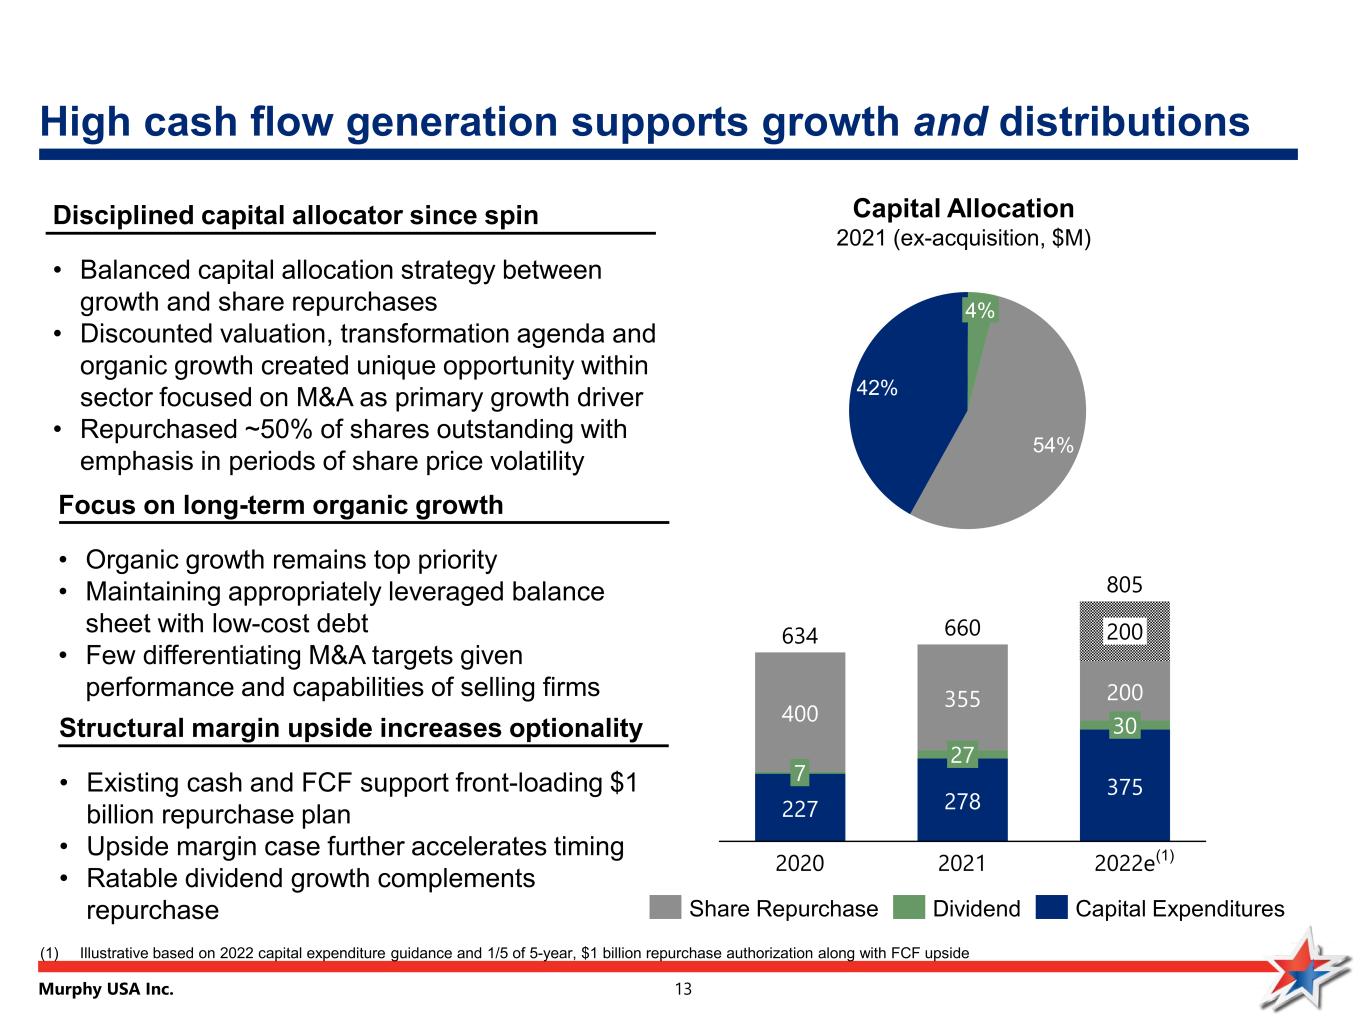
Murphy USA Inc. 13 Structural margin upside increases optionality • Existing cash and FCF support front-loading $1 billion repurchase plan • Upside margin case further accelerates timing • Ratable dividend growth complements repurchase Disciplined capital allocator since spin • Balanced capital allocation strategy between growth and share repurchases • Discounted valuation, transformation agenda and organic growth created unique opportunity within sector focused on M&A as primary growth driver • Repurchased ~50% of shares outstanding with emphasis in periods of share price volatility High cash flow generation supports growth and distributions Focus on long-term organic growth • Organic growth remains top priority • Maintaining appropriately leveraged balance sheet with low-cost debt • Few differentiating M&A targets given performance and capabilities of selling firms 42% 54% 4% Capital Allocation 2021 (ex-acquisition, $M) 227 278 375 400 355 200 30 200 7 27 2020 634 2021 2022e 660 805 Capital ExpendituresShare Repurchase Dividend (1) (1) Illustrative based on 2022 capital expenditure guidance and 1/5 of 5-year, $1 billion repurchase authorization along with FCF upside
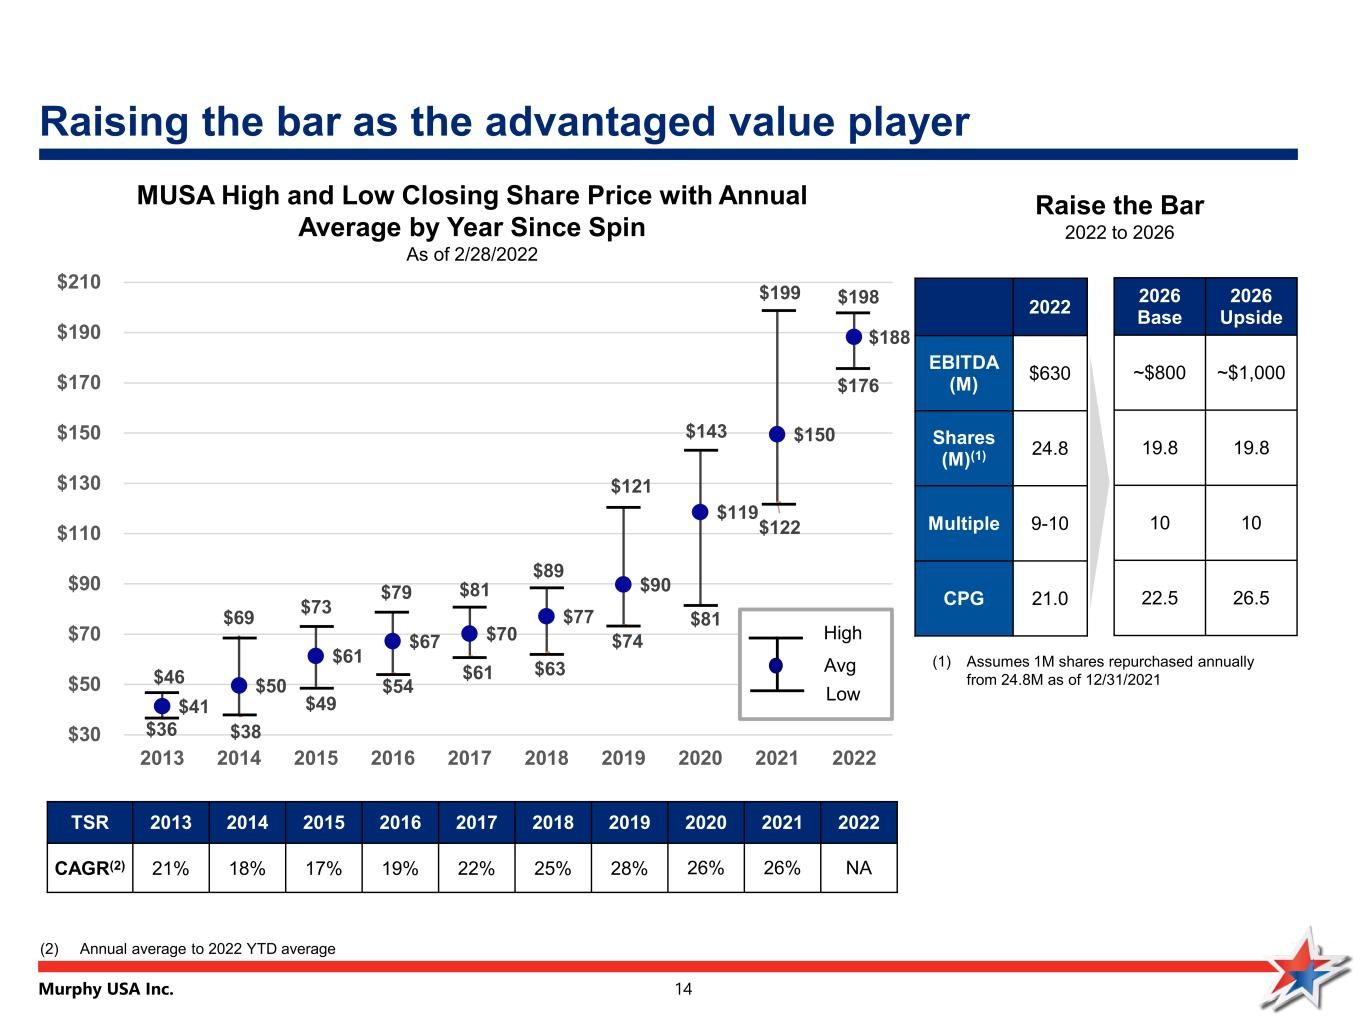
Murphy USA Inc. 14 $46 $69 $73 $79 $81 $89 $121 $143 $199 $198 $41 $50 $61 $67 $70 $77 $90 $119 $150 $188 $36 $38 $49 $54 $61 $63 $74 $81 $122 $176 $30 $50 $70 $90 $110 $130 $150 $170 $190 $210 2013 2014 2015 2016 2017 2018 2019 2020 2021 2022 Raise the Bar 2022 to 2026 MUSA High and Low Closing Share Price with Annual Average by Year Since Spin As of 2/28/2022 High Avg Low 2022 EBITDA (M) $630 Shares (M)(1) 24.8 Multiple 9-10 CPG 21.0 TSR 2013 2014 2015 2016 2017 2018 2019 2020 2021 2022 CAGR(2) 21% 18% 17% 19% 22% 25% 28% 26% 26% NA (2) Annual average to 2022 YTD average 2026 Base 2026 Upside ~$800 ~$1,000 19.8 19.8 10 10 22.5 26.5 (1) Assumes 1M shares repurchased annually from 24.8M as of 12/31/2021 Raising the bar as the advantaged value player
Murphy USA Inc. 15 Appendix
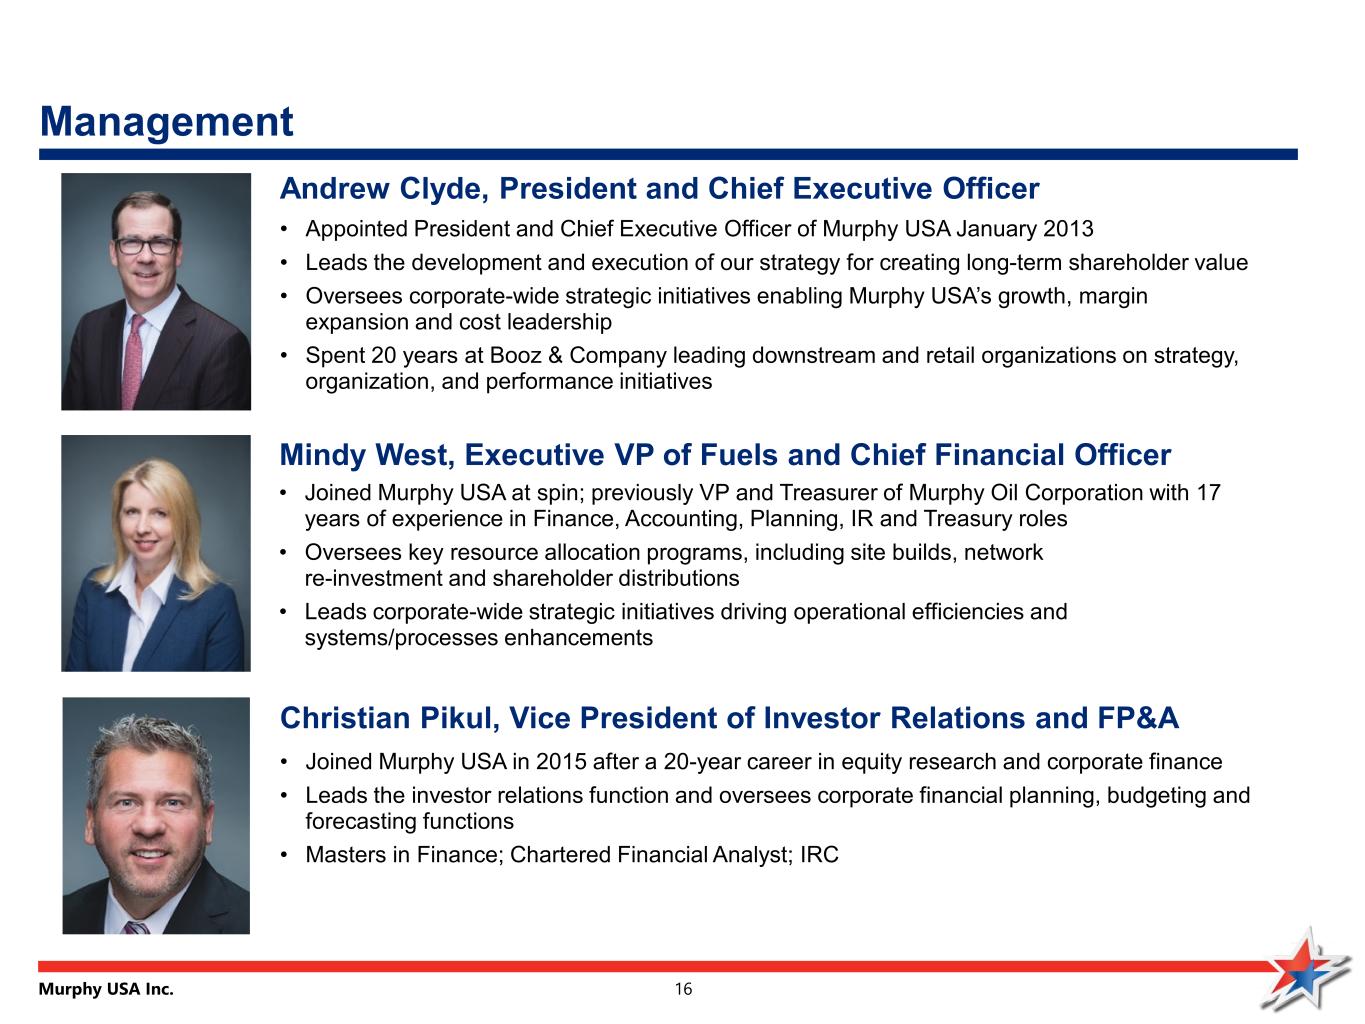
Murphy USA Inc. 16 Management Andrew Clyde, President and Chief Executive Officer • Appointed President and Chief Executive Officer of Murphy USA January 2013 • Leads the development and execution of our strategy for creating long-term shareholder value • Oversees corporate-wide strategic initiatives enabling Murphy USA’s growth, margin expansion and cost leadership • Spent 20 years at Booz & Company leading downstream and retail organizations on strategy, organization, and performance initiatives Mindy West, Executive VP of Fuels and Chief Financial Officer • Joined Murphy USA at spin; previously VP and Treasurer of Murphy Oil Corporation with 17 years of experience in Finance, Accounting, Planning, IR and Treasury roles • Oversees key resource allocation programs, including site builds, network re-investment and shareholder distributions • Leads corporate-wide strategic initiatives driving operational efficiencies and systems/processes enhancements Christian Pikul, Vice President of Investor Relations and FP&A • Joined Murphy USA in 2015 after a 20-year career in equity research and corporate finance • Leads the investor relations function and oversees corporate financial planning, budgeting and forecasting functions • Masters in Finance; Chartered Financial Analyst; IRC
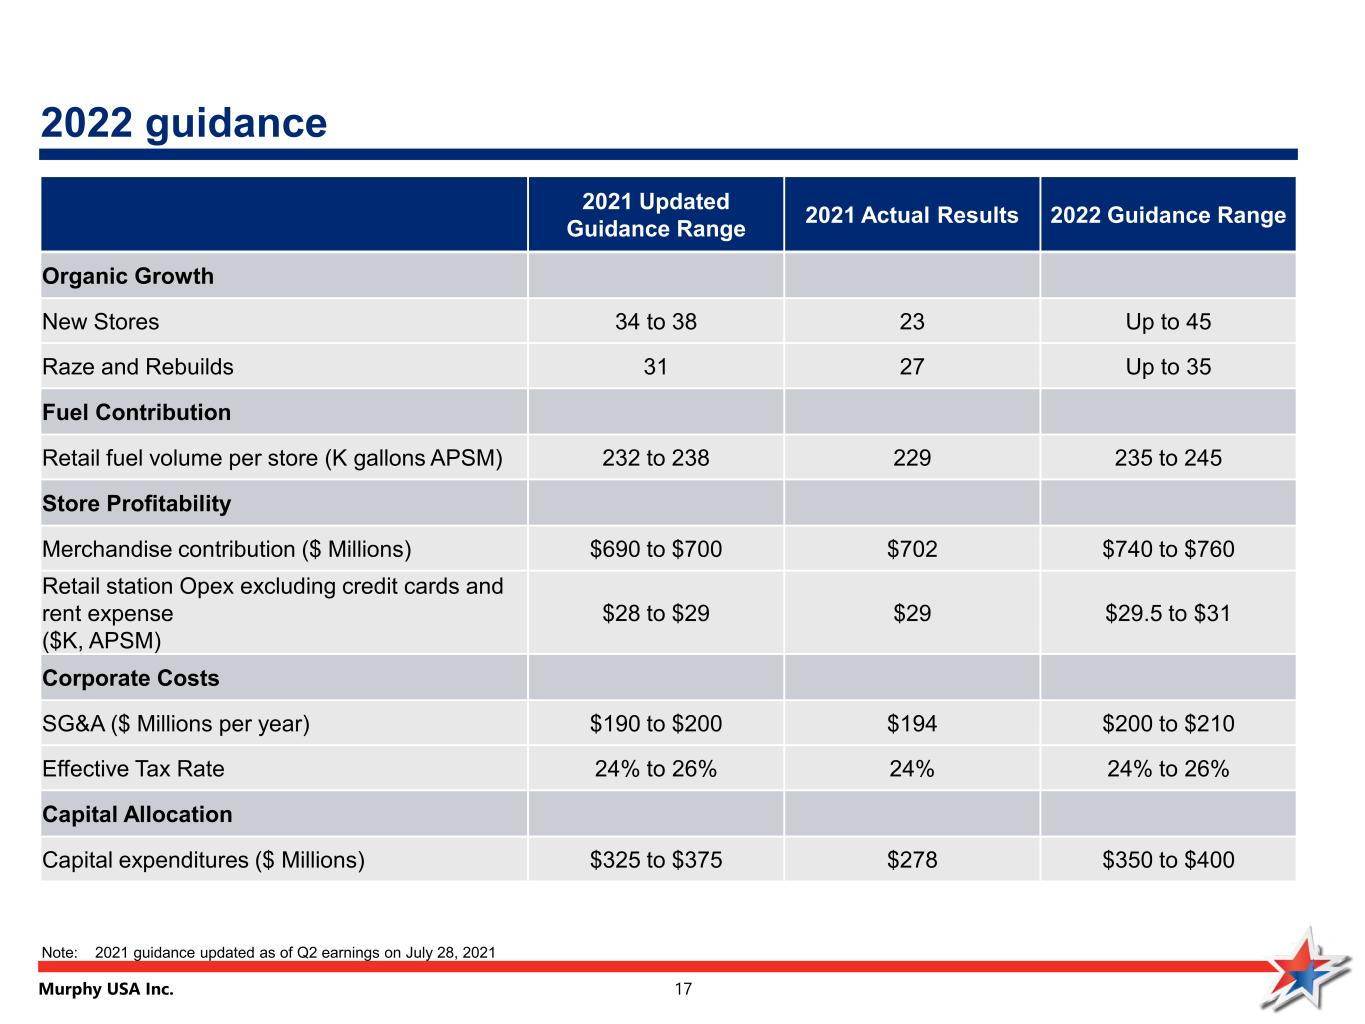
Murphy USA Inc. 17 2022 guidance 17 2021 Updated Guidance Range 2021 Actual Results 2022 Guidance Range Organic Growth New Stores 34 to 38 23 Up to 45 Raze and Rebuilds 31 27 Up to 35 Fuel Contribution Retail fuel volume per store (K gallons APSM) 232 to 238 229 235 to 245 Store Profitability Merchandise contribution ($ Millions) $690 to $700 $702 $740 to $760 Retail station Opex excluding credit cards and rent expense ($K, APSM) $28 to $29 $29 $29.5 to $31 Corporate Costs SG&A ($ Millions per year) $190 to $200 $194 $200 to $210 Effective Tax Rate 24% to 26% 24% 24% to 26% Capital Allocation Capital expenditures ($ Millions) $325 to $375 $278 $350 to $400 Note: 2021 guidance updated as of Q2 earnings on July 28, 2021
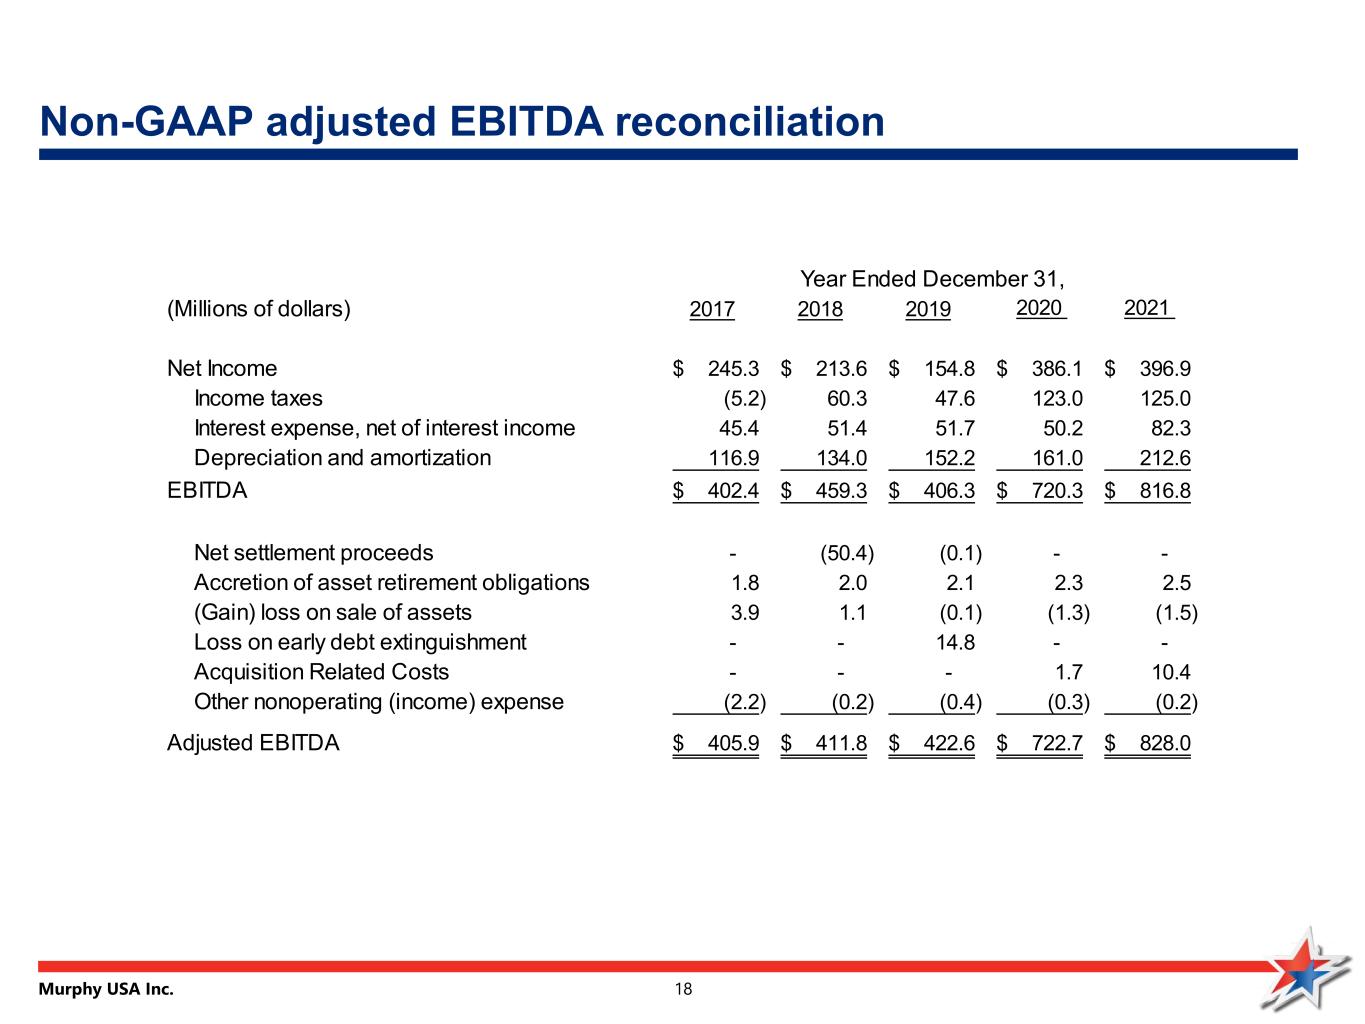
Murphy USA Inc. 18 Non-GAAP adjusted EBITDA reconciliation (Millions of dollars) 2017 2018 2019 2020 2021 Net Income 245.3$ 213.6$ 154.8$ 386.1$ 396.9$ Income taxes (5.2) 60.3 47.6 123.0 125.0 Interest expense, net of interest income 45.4 51.4 51.7 50.2 82.3 Depreciation and amortization 116.9 134.0 152.2 161.0 212.6 EBITDA 402.4$ 459.3$ 406.3$ 720.3$ 816.8$ Net settlement proceeds - (50.4) (0.1) - - Accretion of asset retirement obligations 1.8 2.0 2.1 2.3 2.5 (Gain) loss on sale of assets 3.9 1.1 (0.1) (1.3) (1.5) Loss on early debt extinguishment - - 14.8 - - Acquisition Related Costs - - - 1.7 10.4 Other nonoperating (income) expense (2.2) (0.2) (0.4) (0.3) (0.2) Adjusted EBITDA 405.9$ 411.8$ 422.6$ 722.7$ 828.0$ Year Ended December 31,
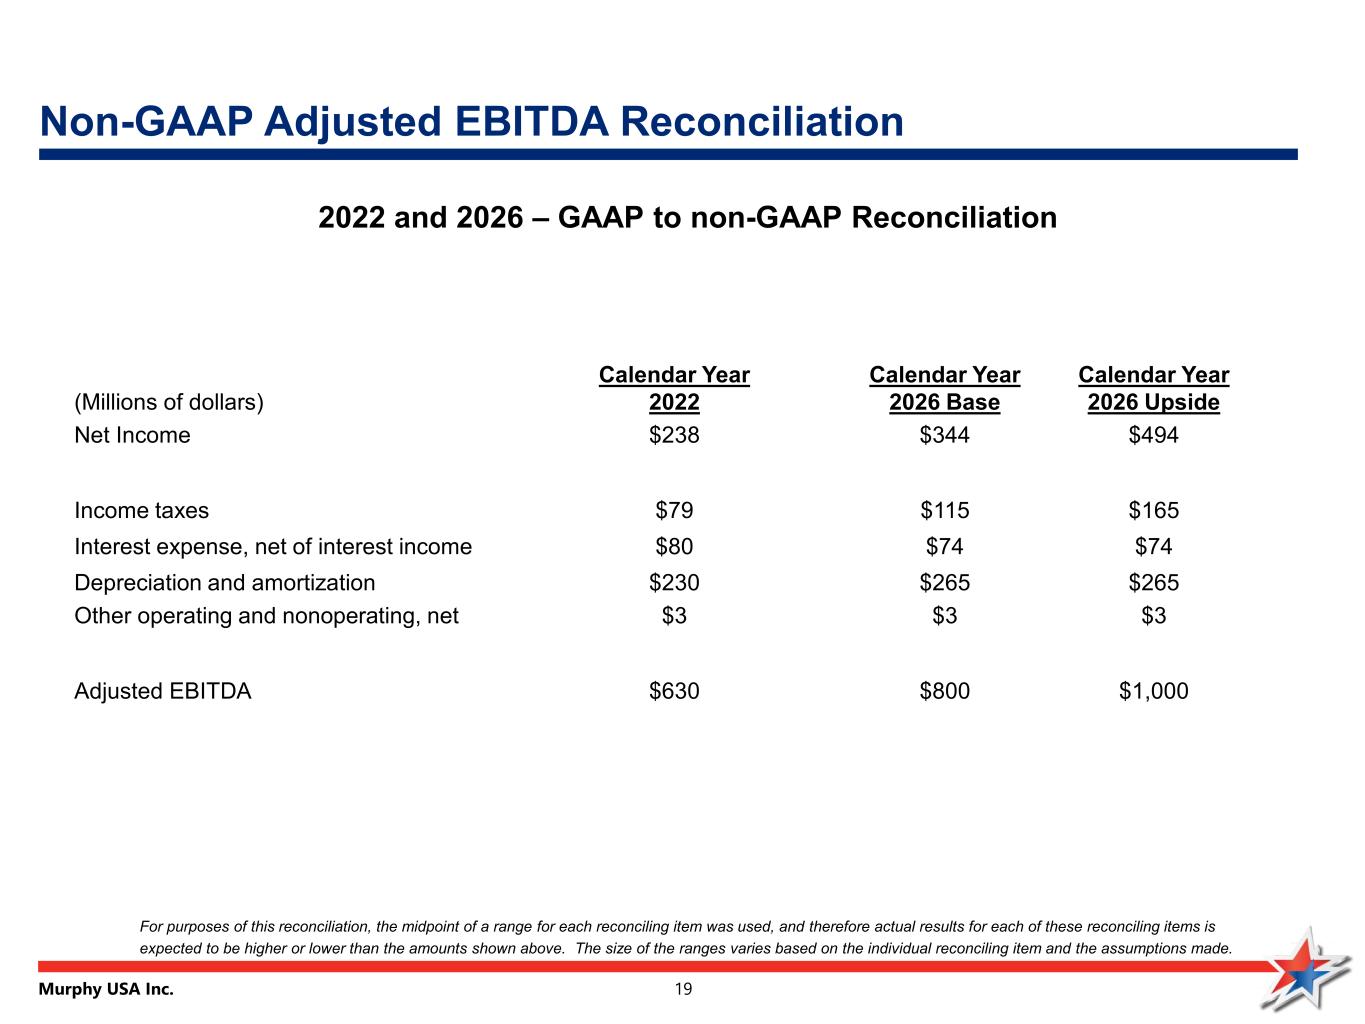
Murphy USA Inc. 19 Non-GAAP Adjusted EBITDA Reconciliation For purposes of this reconciliation, the midpoint of a range for each reconciling item was used, and therefore actual results for each of these reconciling items is expected to be higher or lower than the amounts shown above. The size of the ranges varies based on the individual reconciling item and the assumptions made. 2022 and 2026 – GAAP to non-GAAP Reconciliation (Millions of dollars) Calendar Year 2022 Calendar Year 2026 Base Calendar Year 2026 Upside Net Income $238 $344 $494 Income taxes $79 $115 $165 Interest expense, net of interest income $80 $74 $74 Depreciation and amortization $230 $265 $265 Other operating and nonoperating, net $3 $3 $3 Adjusted EBITDA $630 $800 $1,000


