UNITED STATES
SECURITIES AND EXCHANGE COMMISSION
Washington, D.C. 20549
Form N-CSR
CERTIFIED SHAREHOLDER REPORT OF REGISTERED
MANAGEMENT INVESTMENT COMPANIES
Investment Company Act File Number: 811-22821
Eaton Vance Floating-Rate Income Plus Fund
(Exact Name of Registrant as Specified in Charter)
Two International Place, Boston, Massachusetts 02110
(Address of Principal Executive Offices)
Maureen A. Gemma
Two International Place, Boston, Massachusetts 02110
(Name and Address of Agent for Services)
(617) 482-8260
(Registrant’s Telephone Number)
May 31
Date of Fiscal Year End
November 30, 2013
Date of Reporting Period
Item 1. Reports to Stockholders

Eaton Vance
Floating-Rate Income Plus Fund
(EFF)
Semiannual Report
November 30, 2013

Commodity Futures Trading Commission Registration. Effective December 31, 2012, the Commodity Futures Trading Commission (“CFTC”) adopted certain regulatory changes that subject registered investment companies and advisers to regulation by the CFTC if a fund invests more than a prescribed level of its assets in certain CFTC-regulated instruments (including futures, certain options and swap agreements) or markets itself as providing investment exposure to such instruments. The Fund has claimed an exclusion from the definition of the term “commodity pool operator” under the Commodity Exchange Act and is not subject to the CFTC regulation. Because of its management of other strategies, the Fund’s adviser is registered with the CFTC as a commodity pool operator and a commodity trading advisor.
Fund shares are not insured by the FDIC and are not deposits or other obligations of, or guaranteed by, any depository institution. Shares are subject to investment risks, including possible loss of principal invested.
Semiannual Report November 30, 2013
Eaton Vance
Floating-Rate Income Plus Fund
Table of Contents
| | | | |
Performance | | | 2 | |
| |
Fund Profile | | | 3 | |
| |
Endnotes and Additional Disclosures | | | 4 | |
| |
Financial Statements | | | 5 | |
| |
Dividend Reinvestment Plan | | | 26 | |
| |
Board of Trustees’ Contract Approval | | | 28 | |
| |
Officers and Trustees | | | 30 | |
| |
Important Notices | | | 31 | |
Eaton Vance
Floating-Rate Income Plus Fund
November 30, 2013
Performance1,2
Portfolio Managers Scott H. Page, CFA, Craig P. Russ and Kathleen C. Gaffney, CFA
| | | | | | | | | | | | | | | | | | | | |
| % Cumulative Total Returns | | Inception Date | | | Six Months | | | One Year | | | Five Years | | | Since
Inception | |
Fund at NAV | | | 06/28/2013 | | | | — | | | | — | | | | — | | | | 4.28 | % |
Fund at Market Price | | | — | | | | — | | | | — | | | | — | | | | –4.23 | |
S&P/LSTA Leveraged Loan Index | | | — | | | | 1.83 | % | | | 5.62 | % | | | 13.58 | % | | | 2.45 | % |
| | | | | |
| | | | | | | | | | | | | | | | | | | | |
| % Premium/Discount to NAV3 | | | | | | | | | | | | | | | |
| | | | | | | | | | | | | | | | | | | –8.16 | % |
| | | | | |
| | | | | | | | | | | | | | | | | | | | |
| Distributions4 | | | | | | | | | | | | | | | |
Total Distributions per share for the period | | | | | | | | | | | | | | | | | | $ | 0.399 | |
Distribution Rate at NAV | | | | | | | | | | | | | | | | | | | 6.16 | % |
Distribution Rate at Market Price | | | | | | | | | | | | | | | | | | | 6.70 | % |
| | | | | |
| | | | | | | | | | | | | | | | | | | | |
| % Total Leverage5 | | | | | | | | | | | | | | | |
Borrowings | | | | | | | | | | | | | | | | | | | 22.66 | % |
Variable Rate Term Preferred Shares (VRTP Shares) | | | | | | | | | | | | | | | | | | | 15.11 | |
See Endnotes and Additional Disclosures in this report.
Past performance is no guarantee of future results. Returns are historical and are calculated by determining the percentage change in net asset value (NAV) or market price (as applicable) with all distributions reinvested and includes management fees and other expenses. Fund performance at market price will differ from its results at NAV due to factors such as changing perceptions about the Fund, market conditions, fluctuations in supply and demand for Fund shares, or changes in Fund distributions. Investment return and principal value will fluctuate so that shares, when sold, may be worth more or less than their original cost. Performance less than one year is cumulative. Performance is for the stated time period only; due to market volatility, current Fund performance may be lower or higher than the quoted return. For performance as of the most recent month end, please refer to www.eatonvance.com.
Eaton Vance
Floating-Rate Income Plus Fund
November 30, 2013
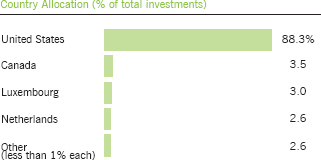
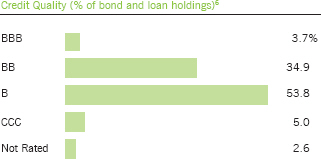
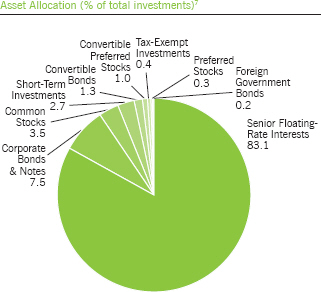
Fund Profile
See Endnotes and Additional Disclosures in this report.
Eaton Vance
Floating-Rate Income Plus Fund
November 30, 2013
Endnotes and Additional Disclosures
| 1 | S&P/LSTA Leveraged Loan Index is an unmanaged index of the institutional leveraged loan market. Unless otherwise stated, index returns do not reflect the effect of any applicable sales charges, commissions, expenses, taxes or leverage, as applicable. It is not possible to invest directly in an index. |
| 2 | Performance results reflect the effects of leverage. Performance since inception for an index, if presented, is the performance since the Fund’s or oldest share class’ inception, as applicable. |
| 3 | The shares of the Fund often trade at a discount or premium from their net asset value. The discount or premium of the Fund may vary over time and may be higher or lower than what is quoted in this report. For up-to-date premium/discount information, please refer to http://eatonvance.com/closedend. |
| 4 | The Distribution Rate is based on the Fund’s last regular distribution per share in the period (annualized) divided by the Fund’s NAV or market price at the end of the period. The Fund’s distributions may be comprised of amounts characterized for federal income tax purposes as qualified and non-qualified ordinary dividends and capital gains. The Fund will determine the federal income tax character of distributions paid to a shareholder after the end of the calendar year. This is reported on the IRS form 1099-DIV and provided to the shareholder shortly after each year-end. For information about the tax character of distributions made in prior calendar years, please refer to Performance-Tax Character of Distributions on the Fund’s webpage available at www.eatonvance.com. The Fund’s distributions are determined by the investment adviser based on its current assessment of the Fund’s long-term return potential. As portfolio and market conditions change, the rate of distributions paid by the Fund could change. |
| 5 | Leverage represents the liquidation value of the Fund’s VRTP Shares and borrowings outstanding as a percentage of Fund net assets applicable to common shares plus VRTP Shares and borrowings outstanding. Use of leverage creates an opportunity for income, but creates risks including greater price volatility. The cost of leverage rises and falls with changes in short-term interest rates. The Fund may be required to maintain prescribed asset coverage for its leverage and may be required to reduce its leverage at an inopportune time. |
| 6 | Ratings are based on Moody’s, S&P or Fitch, as applicable. Ratings, which are subject to change, apply to the creditworthiness of the issuers of the underlying securities and not to the Fund or its shares. Credit ratings measure the quality of a bond based on the issuer’s creditworthiness, with ratings ranging from AAA, being the highest, to D, being the lowest based on S&P’s measures. Ratings of BBB or higher by Standard and Poor’s or Fitch (Baa or higher by Moody’s) are considered to be investment grade quality. Credit ratings are based largely on the rating agency’s analysis at the time of rating. The rating assigned to any particular security is not necessarily a reflection of the issuer’s current financial condition and does not necessarily reflect its assessment of the volatility of a security’s market value or of the liquidity of an investment in the security. If securities are rated differently by the rating agencies, the higher rating is applied. Holdings designated as “Not Rated” are not rated by the national rating agencies stated above. |
| 7 | Asset allocation as a percentage of the Fund’s net assets amounted to 161.9%. |
| | Fund profile subject to change due to active management. |
Eaton Vance
Floating-Rate Income Plus Fund
November 30, 2013
Portfolio of Investments (Unaudited)
| | | | | | | | | | |
| Senior Floating-Rate Interests — 134.7%(1) | |
| | | |
| | | | | | | | | | |
| Borrower/Tranche Description | | | | Principal
Amount
(000’s omitted) | | | Value | |
| | | | | | | | | | |
| |
Aerospace and Defense — 3.7% | | | | | |
DAE Aviation Holdings, Inc. | | | | | | | | | | |
Term Loan, 6.25%, Maturing November 2, 2018 | | | | $ | 311 | | | $ | 313,669 | |
Term Loan, 6.25%, Maturing November 2, 2018 | | | | | 686 | | | | 691,917 | |
Sequa Corporation | | | | | | | | | | |
Term Loan, 5.25%, Maturing December 19, 2017 | | | | | 396 | | | | 391,865 | |
Silver II US Holdings, LLC | | | | | | | | | | |
Term Loan, 4.00%, Maturing December 13, 2019 | | | | | 1,492 | | | | 1,495,163 | |
Transdigm, Inc. | | | | | | | | | | |
Term Loan, 3.75%, Maturing February 28, 2020 | | | | | 2,494 | | | | 2,510,169 | |
| | | | | | | | | | | |
| | | | | | | | $ | 5,402,783 | |
| | | | | | | | | | | |
| |
Automotive — 3.5% | | | | | |
Affinia Group Intermediate Holdings Inc. | | | | | | | | | | |
Term Loan, 4.75%, Maturing April 27, 2020 | | | | $ | 798 | | | $ | 807,975 | |
Metaldyne LLC | | | | | | | | | | |
Term Loan, 5.00%, Maturing December 18, 2018 | | | | | 1,592 | | | | 1,606,415 | |
UCI International, Inc. | | | | | | | | | | |
Term Loan, 5.50%, Maturing July 26, 2017 | | | | | 1,994 | | | | 1,998,175 | |
Veyance Technologies, Inc. | | | | | | | | | | |
Term Loan, 5.25%, Maturing September 8, 2017 | | | | | 796 | | | | 796,995 | |
| | | | | | | | | | | |
| | | | | | | | $ | 5,209,560 | |
| | | | | | | | | | | |
| |
Building and Development — 1.2% | | | | | |
CPG International Inc. | | | | | | | | | | |
Term Loan, 4.75%, Maturing September 30, 2020 | | | | $ | 150 | | | $ | 150,281 | |
Quikrete Holdings, Inc. | | | | | | | | | | |
Term Loan, 4.00%, Maturing September 28, 2020 | | | | | 250 | | | | 251,496 | |
Realogy Corporation | | | | | | | | | | |
Term Loan, 4.50%, Maturing March 5, 2020 | | | | | 798 | | | | 807,471 | |
Summit Materials Companies I, LLC | | | | | | | | | | |
Term Loan, 5.00%, Maturing January 30, 2019 | | | | | 499 | | | | 501,397 | |
| | | | | | | | | | | |
| | | | | | | | $ | 1,710,645 | |
| | | | | | | | | | | |
| |
Business Equipment and Services — 11.8% | | | | | |
Advantage Sales & Marketing, Inc. | | | | | | | | | | |
Term Loan, 4.25%, Maturing December 18, 2017 | | | | $ | 1,492 | | | $ | 1,502,278 | |
AlixPartners, LLP | | | | | | | | | | |
Term Loan - Second Lien, 9.00%, Maturing July 9, 2021 | | | | | 200 | | | | 204,625 | |
Audio Visual Services Group, Inc. | | | | | | | | | | |
Term Loan, 6.75%, Maturing November 9, 2018 | | | | | 798 | | | | 803,970 | |
BakerCorp International, Inc. | | | | | | | | | | |
Term Loan, 4.25%, Maturing February 14, 2020 | | | | | 746 | | | | 744,375 | |
| | | | | | | | | | |
| Borrower/Tranche Description | | | | Principal
Amount
(000’s omitted) | | | Value | |
| | | | | | | | | | |
| |
Business Equipment and Services (continued) | | | | | |
CCC Information Services, Inc. | | | | | | | | | | |
Term Loan, 4.00%, Maturing December 20, 2019 | | | | $ | 497 | | | $ | 498,190 | |
Ceridian Corp. | | | | | | | | | | |
Term Loan, 4.42%, Maturing May 9, 2017 | | | | | 300 | | | | 302,156 | |
Crossmark Holdings, Inc. | | | | | | | | | | |
Term Loan, 4.50%, Maturing December 20, 2019 | | | | | 514 | | | | 512,769 | |
Education Management LLC | | | | | | | | | | |
Term Loan, 8.25%, Maturing March 29, 2018 | | | | | 1,496 | | | | 1,503,831 | |
EIG Investors Corp. | | | | | | | | | | |
Term Loan, Maturing November 9, 2019(2) | | | | | 100 | | | | 99,500 | |
Expert Global Solutions, Inc. | | | | | | | | | | |
Term Loan, 8.50%, Maturing April 3, 2018 | | | | | 790 | | | | 797,599 | |
Garda World Security Corporation | | | | | | | | | | |
Term Loan, 0.50%, Maturing November 6, 2020(3) | | | | | 31 | | | | 30,778 | |
Term Loan, 4.00%, Maturing November 6, 2020 | | | | | 119 | | | | 120,315 | |
Information Resources, Inc. | | | | | | | | | | |
Term Loan, 4.75%, Maturing September 30, 2020 | | | | | 325 | | | | 327,438 | |
ION Trading Technologies S.a.r.l. | | | | | | | | | | |
Term Loan, 4.50%, Maturing May 22, 2020 | | | | | 798 | | | | 802,739 | |
Term Loan - Second Lien, 8.25%, Maturing May 21, 2021 | | | | | 1,000 | | | | 1,010,208 | |
Jason Incorporated | | | | | | | | | | |
Term Loan, 5.00%, Maturing February 28, 2019 | | | | | 798 | | | | 798,952 | |
Kronos Incorporated | | | | | | | | | | |
Term Loan, 4.50%, Maturing October 30, 2019 | | | | | 1,845 | | | | 1,861,199 | |
MCS AMS Sub-Holdings LLC | | | | | | | | | | |
Term Loan, 7.00%, Maturing October 15, 2019 | | | | | 150 | | | | 145,688 | |
MEI Conlux Holdings (US), Inc. | | | | | | | | | | |
Term Loan, 5.00%, Maturing August 21, 2020 | | | | | 100 | | | | 100,313 | |
Pacific Industrial Services US Finco LLC | | | | | | | | | | |
Term Loan, 5.00%, Maturing October 2, 2018 | | | | | 325 | | | | 329,062 | |
Quintiles Transnational Corp. | | | | | | | | | | |
Term Loan, 4.00%, Maturing June 8, 2018 | | | | | 2,000 | | | | 2,004,584 | |
ServiceMaster Company | | | | | | | | | | |
Term Loan, 4.42%, Maturing January 31, 2017 | | | | | 995 | | | | 983,769 | |
SunGard Data Systems, Inc. | | | | | | | | | | |
Term Loan, 4.00%, Maturing March 9, 2020 | | | | | 1,990 | | | | 2,008,300 | |
TransUnion, LLC | | | | | | | | | | |
Term Loan, 4.25%, Maturing February 10, 2019 | | | | | 50 | | | | 50,328 | |
| | | | | | | | | | | |
| | | | | | | | $ | 17,542,966 | |
| | | | | | | | | | | |
| |
Cable and Satellite Television — 1.7% | | | | | |
UPC Financing Partnership | | | | | | | | | | |
Term Loan, 4.00%, Maturing January 29, 2021 | | | | $ | 2,500 | | | $ | 2,519,533 | |
| | | | | | | | | | | |
| | | | | | | | $ | 2,519,533 | |
| | | | | | | | | | | |
| | | | |
| | 5 | | See Notes to Financial Statements. |
Eaton Vance
Floating-Rate Income Plus Fund
November 30, 2013
Portfolio of Investments (Unaudited) — continued
| | | | | | | | | | |
| Borrower/Tranche Description | | | | Principal
Amount
(000’s omitted) | | | Value | |
| | | | | | | | | | |
| |
Chemicals and Plastics — 7.0% | | | | | |
Allnex USA, Inc. | | | | | | | | | | |
Term Loan, 4.50%, Maturing October 3, 2019 | | | | $ | 273 | | | $ | 275,244 | |
Term Loan, 4.50%, Maturing October 3, 2019 | | | | | 525 | | | | 530,487 | |
Arysta LifeScience Corporation | | | | | | | | | | |
Term Loan, 4.50%, Maturing May 29, 2020 | | | | | 798 | | | | 804,982 | |
Axalta Coating Systems US Holdings Inc. | | | | | | | | | | |
Term Loan, 4.75%, Maturing February 1, 2020 | | | | | 1,493 | | | | 1,507,798 | |
Huntsman International, LLC | | | | | | | | | | |
Term Loan, Maturing October 15, 2020(2) | | | | | 500 | | | | 501,188 | |
Ineos US Finance LLC | | | | | | | | | | |
Term Loan, 4.00%, Maturing May 4, 2018 | | | | | 1,992 | | | | 1,999,260 | |
OXEA Finance LLC | | | | | | | | | | |
Term Loan - Second Lien, 8.25%, Maturing July 15, 2020 | | | | | 1,000 | | | | 1,021,250 | |
Polarpak Inc. | | | | | | | | | | |
Term Loan, 4.50%, Maturing June 5, 2020 | | | | | 322 | | | | 324,618 | |
Tata Chemicals North America Inc. | | | | | | | | | | |
Term Loan, 3.75%, Maturing August 7, 2020 | | | | | 274 | | | | 274,484 | |
Tronox Pigments (Netherlands) B.V. | | | | | | | | | | |
Term Loan, 4.50%, Maturing March 19, 2020 | | | | | 1,995 | | | | 2,023,056 | |
Univar Inc. | | | | | | | | | | |
Term Loan, 5.00%, Maturing June 30, 2017 | | | | | 995 | | | | 981,569 | |
WNA Holdings Inc. | | | | | | | | | | |
Term Loan, 4.50%, Maturing June 5, 2020 | | | | | 175 | | | | 176,335 | |
| | | | | | | | | | | |
| | | | | | | | $ | 10,420,271 | |
| | | | | | | | | | | |
| |
Conglomerates — 2.0% | | | | | |
RGIS Services, LLC | | | | | | | | | | |
Term Loan, 5.50%, Maturing October 18, 2017 | | | | $ | 1,492 | | | $ | 1,474,701 | |
Spectrum Brands, Inc. | | | | | | | | | | |
Term Loan, 4.50%, Maturing December 17, 2019 | | | | | 1,532 | | | | 1,539,435 | |
| | | | | | | | | | | |
| | | | | | | | $ | 3,014,136 | |
| | | | | | | | | | | |
| |
Containers and Glass Products — 3.0% | | | | | |
Berry Plastics Holding Corporation | | | | | | | | | | |
Term Loan, 3.50%, Maturing February 7, 2020 | | | | $ | 1,990 | | | $ | 1,987,357 | |
Pelican Products, Inc. | | | | | | | | | | |
Term Loan, 7.00%, Maturing July 11, 2018 | | | | | 497 | | | | 499,347 | |
Reynolds Group Holdings Inc. | | | | | | | | | | |
Term Loan, 4.00%, Maturing December 31, 2018 | | | | | 1,995 | | | | 2,008,989 | |
| | | | | | | | | | | |
| | | | | | | | $ | 4,495,693 | |
| | | | | | | | | | | |
| | | | | | | | | | |
| Borrower/Tranche Description | | | | Principal
Amount
(000’s omitted) | | | Value | |
| | | | | | | | | | |
| |
Cosmetics / Toiletries — 0.7% | | | | | |
Revlon Consumer Products Corporation | | | | | | | | | | |
Term Loan, 4.00%, Maturing August 19, 2019 | | | | $ | 300 | | | $ | 301,453 | |
Sun Products Corporation (The) | | | | | | | | | | |
Term Loan, 5.50%, Maturing March 23, 2020 | | | | | 746 | | | | 702,408 | |
| | | | | | | | | | | |
| | | | | | | | $ | 1,003,861 | |
| | | | | | | | | | | |
| |
Drugs — 4.1% | | | | | |
Akorn, Inc. | | | | | | | | | | |
Term Loan, Maturing August 27,
2020(2) | | | | $ | 175 | | | $ | 175,820 | |
Aptalis Pharma, Inc. | | | | | | | | | | |
Term Loan, 6.00%, Maturing September 18, 2020 | | | | | 675 | | | | 682,594 | |
Auxilium Pharmaceuticals, Inc. | | | | | | | | | | |
Term Loan, 6.25%, Maturing April 26, 2017 | | | | | 494 | | | | 501,156 | |
Catalent Pharma Solutions Inc. | | | | | | | | | | |
Term Loan, 4.25%, Maturing September 15, 2017 | | | | | 1,496 | | | | 1,506,705 | |
Ikaria Acquisition Inc. | | | | | | | | | | |
Term Loan, 7.25%, Maturing July 3, 2018 | | | | | 148 | | | | 149,421 | |
Term Loan - Second Lien, 11.00%, Maturing July 3, 2019 | | | | | 500 | | | | 516,250 | |
Valeant Pharmaceuticals International, Inc. | | | | | | | | | | |
Term Loan, 4.50%, Maturing August 5, 2020 | | | | | 2,481 | | | | 2,513,817 | |
| | | | | | | | | | | |
| | | | | | | | $ | 6,045,763 | |
| | | | | | | | | | | |
| |
Ecological Services and Equipment — 0.7% | | | | | |
ADS Waste Holdings, Inc. | | | | | | | | | | |
Term Loan, 4.25%, Maturing October 9, 2019 | | | | $ | 1,000 | | | $ | 1,006,696 | |
| | | | | | | | | | | |
| | | | | | | | $ | 1,006,696 | |
| | | | | | | | | | | |
| |
Electronics / Electrical — 14.1% | | | | | |
Aeroflex Incorporated | | | | | | | | | | |
Term Loan, 4.50%, Maturing November 11, 2019 | | | | $ | 959 | | | $ | 967,239 | |
Attachmate Corporation | | | | | | | | | | |
Term Loan, 7.25%, Maturing November 22, 2017 | | | | | 748 | | | | 755,427 | |
Blue Coat Systems, Inc. | | | | | | | | | | |
Term Loan - Second Lien, 9.50%, Maturing June 26, 2020 | | | | | 1,000 | | | | 1,016,250 | |
Dell Inc. | | | | | | | | | | |
Term Loan, 3.75%, Maturing October 29, 2018 | | | | | 425 | | | | 424,203 | |
Term Loan, 4.50%, Maturing April 29, 2020 | | | | | 2,350 | | | | 2,331,303 | |
Digital Generation, Inc. | | | | | | | | | | |
Term Loan, 7.25%, Maturing July 26, 2018 | | | | | 783 | | | | 787,323 | |
Edwards (Cayman Islands II) Limited | | | | | | | | | | |
Term Loan, 4.50%, Maturing March 26, 2020 | | | | | 663 | | | | 665,035 | |
| | | | |
| | 6 | | See Notes to Financial Statements. |
Eaton Vance
Floating-Rate Income Plus Fund
November 30, 2013
Portfolio of Investments (Unaudited) — continued
| | | | | | | | | | |
| Borrower/Tranche Description | | | | Principal
Amount
(000’s omitted) | | | Value | |
| | | | | | | | | | |
| |
Electronics / Electrical (continued) | | | | | |
Excelitas Technologies Corp. | | | | | | | | | | |
Term Loan, 6.00%, Maturing October 30, 2020 | | | | $ | 223 | | | $ | 223,448 | |
Eze Castle Software Inc. | | | | | | | | | | |
Term Loan, 4.75%, Maturing April 6, 2020 | | | | | 798 | | | | 804,151 | |
Go Daddy Operating Company, LLC | | | | | | | | | | |
Term Loan, 4.00%, Maturing December 17, 2018 | | | | | 871 | | | | 873,661 | |
Infor (US), Inc. | | | | | | | | | | |
Term Loan, 5.25%, Maturing April 5, 2018 | | | | | 1,966 | | | | 1,981,434 | |
Magic Newco LLC | | | | | | | | | | |
Term Loan, 5.00%, Maturing December 12, 2018 | | | | | 995 | | | | 1,002,272 | |
NXP B.V. | | | | | | | | | | |
Term Loan, 4.75%, Maturing January 11, 2020 | | | | | 2,487 | | | | 2,520,895 | |
Renaissance Learning, Inc. | | | | | | | | | | |
Term Loan, 5.00%, Maturing October 16, 2020 | | | | | 200 | | | | 201,000 | |
RP Crown Parent, LLC | | | | | | | | | | |
Term Loan, 6.75%, Maturing December 21, 2018 | | | | | 995 | | | | 1,005,170 | |
Term Loan - Second Lien, 11.25%, Maturing December 20, 2019 | | | | | 1,000 | | | | 1,042,500 | |
Sirius Computer Solutions, Inc. | | | | | | | | | | |
Term Loan, 7.00%, Maturing November 30, 2018 | | | | | 484 | | | | 491,374 | |
StoneRiver Holdings, Inc. | | | | | | | | | | |
Term Loan, 4.50%, Maturing November 29, 2019 | | | | | 329 | | | | 329,437 | |
SurveyMonkey.com, LLC | | | | | | | | | | |
Term Loan, 5.50%, Maturing February 5, 2019 | | | | | 499 | | | | 504,670 | |
Vertafore, Inc. | | | | | | | | | | |
Term Loan, 4.25%, Maturing October 3, 2019 | | | | | 1,496 | | | | 1,506,838 | |
Wall Street Systems, Inc. | | | | | | | | | | |
Term Loan, 5.75%, Maturing October 25, 2019 | | | | | 494 | | | | 497,756 | |
Web.com Group, Inc. | | | | | | | | | | |
Term Loan, 4.50%, Maturing October 27, 2017 | | | | | 485 | | | | 490,631 | |
Websense, Inc. | | | | | | | | | | |
Term Loan, 4.50%, Maturing June 25, 2020 | | | | | 499 | | | | 499,997 | |
| | | | | | | | | | | |
| | | | | | | | $ | 20,922,014 | |
| | | | | | | | | | | |
| |
Financial Intermediaries — 6.3% | | | | | |
American Beacon Advisors, Inc. | | | | | | | | | | |
Term Loan, 4.75%, Maturing November 20, 2019 | | | | $ | 125 | | | $ | 124,844 | |
American Capital Holdings, Inc. | | | | | | | | | | |
Term Loan, 4.00%, Maturing August 22, 2016 | | | | | 1,144 | | | | 1,147,667 | |
Cetera Financial Group, Inc. | | | | | | | | | | |
Term Loan, 6.50%, Maturing August 2, 2019 | | | | | 175 | | | | 176,418 | |
First Data Corporation | | | | | | | | | | |
Term Loan, 4.17%, Maturing September 24, 2018 | | | | | 1,500 | | | | 1,505,742 | |
Guggenheim Partners, LLC | | | | | | | | | | |
Term Loan, 4.25%, Maturing July 17, 2020 | | | | | 2,175 | | | | 2,195,119 | |
| | | | | | | | | | |
| Borrower/Tranche Description | | | | Principal
Amount
(000’s omitted) | | | Value | |
| | | | | | | | | | |
| |
Financial Intermediaries (continued) | | | | | |
Nuveen Investments, Inc. | | | | | | | | | | |
Term Loan, 4.16%, Maturing May 15, 2017 | | | | $ | 1,500 | | | $ | 1,486,312 | |
Ocwen Financial Corporation | | | | | | | | | | |
Term Loan, 5.00%, Maturing February 15, 2018 | | | | | 796 | | | | 806,646 | |
Sesac Holdco II, LLC | | | | | | | | | | |
Term Loan, 6.00%, Maturing February 8, 2019 | | | | | 798 | | | | 805,970 | |
Walter Investment Management Corp. | | | | | | | | | | |
Term Loan, 5.75%, Maturing November 28, 2017 | | | | | 1,024 | | | | 1,033,435 | |
| | | | | | | | | | | |
| | | | | | | | $ | 9,282,153 | |
| | | | | | | | | | | |
| |
Food Products — 4.5% | | | | | |
AdvancePierre Foods, Inc. | | | | | | | | | | |
Term Loan, 5.75%, Maturing July 10, 2017 | | | | $ | 1,000 | | | $ | 997,500 | |
Blue Buffalo Company, Ltd. | | | | | | | | | | |
Term Loan, Maturing August 8,
2019(2) | | | | | 1,000 | | | | 1,009,583 | |
Del Monte Foods Company | | | | | | | | | | |
Term Loan, 4.00%, Maturing March 8, 2018 | | | | | 2,000 | | | | 2,006,242 | |
Term Loan, Maturing November 6, 2020(2) | | | | | 150 | | | | 150,812 | |
Dole Food Company Inc. | | | | | | | | | | |
Term Loan, 4.50%, Maturing November 1, 2018 | | | | | 1,600 | | | | 1,610,250 | |
Hearthside Food Solutions, LLC | | | | | | | | | | |
Term Loan, 4.51%, Maturing June 7, 2018 | | | | | 499 | | | | 497,503 | |
JBS USA Holdings Inc. | | | | | | | | | | |
Term Loan, 3.75%, Maturing September 18, 2020 | | | | | 425 | | | | 424,646 | |
| | | | | | | | | | | |
| | | | | | | | $ | 6,696,536 | |
| | | | | | | | | | | |
| |
Food Service — 1.8% | | | | | |
Landry’s, Inc. | | | | | | | | | | |
Term Loan, 4.00%, Maturing April 24, 2018 | | | | $ | 729 | | | $ | 734,310 | |
US Foods, Inc. | | | | | | | | | | |
Term Loan, 4.50%, Maturing March 29, 2019 | | | | | 1,496 | | | | 1,504,355 | |
Weight Watchers International, Inc. | | | | | | | | | | |
Term Loan, 3.75%, Maturing April 2, 2020 | | | | | 499 | | | | 433,286 | |
| | | | | | | | | | | |
| | | | | | | | $ | 2,671,951 | |
| | | | | | | | | | | |
| |
Food / Drug Retailers — 2.8% | | | | | |
Albertson’s, LLC | | | | | | | | | | |
Term Loan, 4.75%, Maturing March 21, 2019 | | | | $ | 898 | | | $ | 901,176 | |
Rite Aid Corporation | | | | | | | | | | |
Term Loan, 4.00%, Maturing February 21, 2020 | | | | | 2,488 | | | | 2,506,415 | |
Supervalu Inc. | | | | | | | | | | |
Term Loan, 5.00%, Maturing March 21, 2019 | | | | | 795 | | | | 800,710 | |
| | | | | | | | | | | |
| | | | | | | | $ | 4,208,301 | |
| | | | | | | | | | | |
| | | | |
| | 7 | | See Notes to Financial Statements. |
Eaton Vance
Floating-Rate Income Plus Fund
November 30, 2013
Portfolio of Investments (Unaudited) — continued
| | | | | | | | | | |
| Borrower/Tranche Description | | | | Principal
Amount
(000’s omitted) | | | Value | |
| | | | | | | | | | |
| |
Health Care — 10.7% | | | | | |
Amneal Pharmaceuticals LLC | | | | | | | | | | |
Term Loan, 7.00%, Maturing November 1, 2019 | | | | $ | 150 | | | $ | 151,500 | |
Apria Healthcare Group I | | | | | | | | | | |
Term Loan, 6.75%, Maturing March 20, 2020 | | | | | 499 | | | | 502,491 | |
CeramTec Acquisition Corporation | | | | | | | | | | |
Term Loan, 4.25%, Maturing August 28, 2020 | | | | | 54 | | | | 54,950 | |
CHG Buyer Corporation | | | | | | | | | | |
Term Loan, 4.25%, Maturing November 19, 2019 | | | | | 800 | | | | 805,500 | |
DJO Finance LLC | | | | | | | | | | |
Term Loan, 4.75%, Maturing September 15, 2017 | | | | | 1,492 | | | | 1,511,137 | |
Envision Healthcare Corporation | | | | | | | | | | |
Term Loan, 4.00%, Maturing May 25, 2018 | | | | | 1,496 | | | | 1,502,556 | |
Faenza Acquisition GmbH | | | | | | | | | | |
Term Loan, 4.25%, Maturing August 28, 2020 | | | | | 168 | | | | 169,742 | |
Term Loan, 4.25%, Maturing August 31, 2020 | | | | | 553 | | | | 558,058 | |
Gentiva Health Services, Inc. | | | | | | | | | | |
Term Loan, 6.50%, Maturing October 18, 2019 | | | | | 350 | | | | 345,844 | |
Hologic Inc. | | | | | | | | | | |
Term Loan, 3.75%, Maturing August 1, 2019 | | | | | 1,617 | | | | 1,627,409 | |
Iasis Healthcare LLC | | | | | | | | | | |
Term Loan, 4.50%, Maturing May 3, 2018 | | | | | 798 | | | | 804,470 | |
inVentiv Health, Inc. | | | | | | | | | | |
Term Loan, 7.50%, Maturing August 4, 2016 | | | | | 800 | | | | 794,000 | |
Kinetic Concepts, Inc. | | | | | | | | | | |
Term Loan, 4.50%, Maturing May 4, 2018 | | | | | 1,496 | | | | 1,514,242 | |
MMM Holdings, Inc. | | | | | | | | | | |
Term Loan, 9.75%, Maturing December 12, 2017 | | | | | 437 | | | | 440,120 | |
MSO of Puerto Rico, Inc. | | | | | | | | | | |
Term Loan, 9.75%, Maturing December 12, 2017 | | | | | 318 | | | | 320,285 | |
Multiplan, Inc. | | | | | | | | | | |
Term Loan, 4.00%, Maturing August 25, 2017 | | | | | 67 | | | | 68,021 | |
One Call Medical, Inc. | | | | | | | | | | |
Term Loan, Maturing November 20, 2020(2) | | | | | 275 | | | | 273,281 | |
Onex Carestream Finance LP | | | | | | | | | | |
Term Loan, 5.00%, Maturing June 7, 2019 | | | | | 790 | | | | 800,122 | |
Pharmaceutical Product Development LLC | | | | | | | | | | |
Term Loan, 4.25%, Maturing December 5, 2018 | | | | | 1,943 | | | | 1,960,512 | |
PRA Holdings, Inc. | | | | | | | | | | |
Term Loan, 5.00%, Maturing September 23, 2020 | | | | | 350 | | | | 351,566 | |
Truven Health Analytics Inc. | | | | | | | | | | |
Term Loan, 4.50%, Maturing June 6, 2019 | | | | | 498 | | | | 497,649 | |
U.S. Renal Care, Inc. | | | | | | | | | | |
Term Loan, 5.25%, Maturing July 3, 2019 | | | | | 800 | | | | 809,500 | |
| | | | | | | | | | | |
| | | | | | | | $ | 15,862,955 | |
| | | | | | | | | | | |
| | | | | | | | | | |
| Borrower/Tranche Description | | | | Principal
Amount
(000’s omitted) | | | Value | |
| | | | | | | | | | |
| |
Home Furnishings — 0.5% | | | | | |
Serta/Simmons Holdings, LLC | | | | | | | | | | |
Term Loan, 4.25%, Maturing October 1, 2019 | | | | $ | 786 | | | $ | 789,275 | |
| | | | | | | | | | | |
| | | | | | | | $ | 789,275 | |
| | | | | | | | | | | |
| |
Industrial Equipment — 5.0% | | | | | |
Apex Tool Group, LLC | | | | | | | | | | |
Term Loan, 4.50%, Maturing January 31, 2020 | | | | $ | 1,493 | | | $ | 1,502,482 | |
Gardner Denver, Inc. | | | | | | | | | | |
Term Loan, 4.25%, Maturing July 30, 2020 | | | | | 900 | | | | 896,881 | |
Husky Injection Molding Systems Ltd. | | | | | | | | | | |
Term Loan, 4.25%, Maturing June 29, 2018 | | | | | 1,400 | | | | 1,411,861 | |
Milacron LLC | | | | | | | | | | |
Term Loan, 4.25%, Maturing March 30, 2020 | | | | | 995 | | | | 997,072 | |
Paladin Brands Holding, Inc. | | | | | | | | | | |
Term Loan, 6.75%, Maturing August 16, 2019 | | | | | 500 | | | | 495,937 | |
Rexnord LLC | | | | | | | | | | |
Term Loan, 4.00%, Maturing August 21, 2020 | | | | | 2,125 | | | | 2,129,418 | |
| | | | | | | | | | | |
| | | | | | | | $ | 7,433,651 | |
| | | | | | | | | | | |
| |
Insurance — 5.0% | | | | | |
Alliant Holdings I, Inc. | | | | | | | | | | |
Term Loan, 5.00%, Maturing December 20, 2019 | | | | $ | 798 | | | $ | 802,603 | |
AmWINS Group, LLC | | | | | | | | | | |
Term Loan, 5.00%, Maturing September 6, 2019 | | | | | 1,792 | | | | 1,802,340 | |
Asurion LLC | | | | | | | | | | |
Term Loan, 4.50%, Maturing May 24, 2019 | | | | | 2,487 | | | | 2,491,192 | |
Term Loan, 3.50%, Maturing July 8, 2020 | | | | | 200 | | | | 196,650 | |
Cooper Gay Swett & Crawford Ltd. | | | | | | | | | | |
Term Loan, 5.00%, Maturing April 16, 2020 | | | | | 500 | | | | 494,896 | |
Hub International Limited | | | | | | | | | | |
Term Loan, 4.75%, Maturing October 2, 2020 | | | | | 750 | | | | 760,313 | |
USI, Inc. | | | | | | | | | | |
Term Loan, 5.00%, Maturing December 27, 2019 | | | | | 798 | | | | 802,977 | |
| | | | | | | | | | | |
| | | | | | | | $ | 7,350,971 | |
| | | | | | | | | | | |
| |
Leisure Goods / Activities / Movies — 5.0% | | | | | |
Bombardier Recreational Products, Inc. | | | | | | | | | | |
Term Loan, 4.00%, Maturing January 30, 2019 | | | | $ | 2,000 | | | $ | 2,009,108 | |
Delta 2 (LUX) S.a.r.l. | | | | | | | | | | |
Term Loan, 4.50%, Maturing April 30, 2019 | | | | | 1,493 | | | | 1,509,158 | |
Equinox Holdings, Inc. | | | | | | | | | | |
Term Loan, 4.50%, Maturing January 31, 2020 | | | | | 499 | | | | 502,176 | |
Sabre, Inc. | | | | | | | | | | |
Term Loan, 5.25%, Maturing February 19, 2019 | | | | | 798 | | | | 805,043 | |
| | | | |
| | 8 | | See Notes to Financial Statements. |
Eaton Vance
Floating-Rate Income Plus Fund
November 30, 2013
Portfolio of Investments (Unaudited) — continued
| | | | | | | | | | |
| Borrower/Tranche Description | | | | Principal
Amount
(000’s omitted) | | | Value | |
| | | | | | | | | | |
| |
Leisure Goods / Activities / Movies (continued) | | | | | |
Town Sports International Inc. | | | | | | | | | | |
Term Loan, 4.50%, Maturing November 16, 2020 | | | | $ | 325 | | | $ | 327,336 | |
US Finco LLC | | | | | | | | | | |
Term Loan - Second Lien, 8.25%, Maturing November 30, 2020 | | | | | 800 | | | | 813,000 | |
Zuffa LLC | | | | | | | | | | |
Term Loan, 4.50%, Maturing February 25, 2020 | | | | | 1,496 | | | | 1,511,193 | |
| | | | | | | | | | | |
| | | | | | | | $ | 7,477,014 | |
| | | | | | | | | | | |
| |
Lodging and Casinos — 2.0% | | | | | |
Boyd Gaming Corporation | | | | | | | | | | |
Term Loan, 4.00%, Maturing August 14, 2020 | | | | $ | 125 | | | $ | 125,664 | |
CityCenter Holdings, LLC | | | | | | | | | | |
Term Loan, 5.00%, Maturing October 16, 2020 | | | | | 225 | | | | 228,140 | |
Golden Nugget, Inc. | | | | | | | | | | |
Term Loan, 0.50%, Maturing November 21, 2019(3) | | | | | 30 | | | | 30,309 | |
Term Loan, 5.50%, Maturing November 21, 2019 | | | | | 70 | | | | 70,743 | |
Hilton Worldwide Finance, LLC | | | | | | | | | | |
Term Loan, 4.00%, Maturing October 26, 2020 | | | | | 2,023 | | | | 2,032,383 | |
Pinnacle Entertainment, Inc. | | | | | | | | | | |
Term Loan, 3.75%, Maturing August 13, 2020 | | | | | 224 | | | | 225,488 | |
Playa Resorts Holding B.V. | | | | | | | | | | |
Term Loan, 4.75%, Maturing August 6, 2019 | | | | | 100 | | | | 101,375 | |
Tropicana Entertainment Inc. | | | | | | | | | | |
Term Loan, Maturing November 26, 2020(2) | | | | | 100 | | | | 99,500 | |
| | | | | | | | | | | |
| | | | | | | | $ | 2,913,602 | |
| | | | | | | | | | | |
| |
Nonferrous Metals / Minerals — 5.8% | | | | | |
Alpha Natural Resources, LLC | | | | | | | | | | |
Term Loan, 3.50%, Maturing May 22, 2020 | | | | $ | 1,990 | | | $ | 1,960,150 | |
Arch Coal Inc. | | | | | | | | | | |
Term Loan, 5.75%, Maturing May 16, 2018 | | | | | 1,492 | | | | 1,461,105 | |
Constellium Holdco B.V. | | | | | | | | | | |
Term Loan, 6.00%, Maturing March 25, 2020 | | | | | 499 | | | | 512,463 | |
Fairmount Minerals LTD | | | | | | | | | | |
Term Loan, 4.31%, Maturing March 15, 2017 | | | | | 100 | | | | 100,732 | |
Term Loan, 5.00%, Maturing September 5, 2019 | | | | | 500 | | | | 506,250 | |
Murray Energy Corporation | | | | | | | | | | |
Term Loan, 4.75%, Maturing May 24, 2019 | | | | | 1,995 | | | | 1,997,494 | |
Noranda Aluminum Acquisition Corporation | | | | | | | | | | |
Term Loan, 5.75%, Maturing February 28, 2019 | | | | | 796 | | | | 746,212 | |
Oxbow Carbon LLC | | | | | | | | | | |
Term Loan, 4.25%, Maturing July 19, 2019 | | | | | 99 | | | | 99,120 | |
Term Loan - Second Lien, 8.00%, Maturing January 17, 2020 | | | | | 175 | | | | 178,281 | |
| | | | | | | | | | |
| Borrower/Tranche Description | | | | Principal
Amount
(000’s omitted) | | | Value | |
| | | | | | | | | | |
| |
Nonferrous Metals / Minerals (continued) | | | | | |
Walter Energy, Inc. | | | | | | | | | | |
Term Loan, 6.75%, Maturing April 2, 2018 | | | | $ | 1,000 | | | $ | 982,681 | |
| | | | | | | | | | | |
| | | | | | | | $ | 8,544,488 | |
| | | | | | | | | | | |
| |
Oil and Gas — 5.1% | | | | | |
Ameriforge Group, Inc. | | | | | | | | | | |
Term Loan - Second Lien, 8.75%, Maturing December 18, 2020 | | | | $ | 800 | | | $ | 822,000 | |
Bronco Midstream Funding LLC | | | | | | | | | | |
Term Loan, 5.00%, Maturing August 17, 2020 | | | | | 1,000 | | | | 1,015,000 | |
Fieldwood Energy LLC | | | | | | | | | | |
Term Loan, 3.88%, Maturing September 28, 2018 | | | | | 200 | | | | 201,888 | |
Term Loan - Second Lien, 8.38%, Maturing September 30, 2020 | | | | | 150 | | | | 153,295 | |
Samson Investment Company | | | | | | | | | | |
Term Loan - Second Lien, 6.00%, Maturing September 13, 2019 | | | | | 1,500 | | | | 1,513,125 | |
Sheridan Production Partners I, LLC | | | | | | | | | | |
Term Loan, 5.00%, Maturing September 14, 2019 | | | | | 1,236 | | | | 1,241,815 | |
Term Loan, 5.00%, Maturing September 25, 2019 | | | | | 100 | | | | 100,509 | |
Term Loan, 5.00%, Maturing September 25, 2019 | | | | | 164 | | | | 164,551 | |
Tallgrass Operations, LLC | | | | | | | | | | |
Term Loan, 5.25%, Maturing November 13, 2018 | | | | | 1,593 | | | | 1,603,183 | |
Tervita Corporation | | | | | | | | | | |
Term Loan, 6.25%, Maturing May 15, 2018 | | | | | 796 | | | | 797,732 | |
| | | | | | | | | | | |
| | | | | | | | $ | 7,613,098 | |
| | | | | | | | | | | |
| |
Publishing — 4.3% | | | | | |
American Greetings Corporation | | | | | | | | | | |
Term Loan, 4.00%, Maturing August 9, 2019 | | | | $ | 250 | | | $ | 250,625 | |
Getty Images, Inc. | | | | | | | | | | |
Term Loan, 4.75%, Maturing October 18, 2019 | | | | | 1,990 | | | | 1,848,004 | |
Laureate Education, Inc. | | | | | | | | | | |
Term Loan, 5.00%, Maturing June 15, 2018 | | | | | 995 | | | | 1,003,222 | |
Merrill Communications, LLC | | | | | | | | | | |
Term Loan, 7.25%, Maturing March 8, 2018 | | | | | 487 | | | | 494,450 | |
Multi Packaging Solutions, Inc. | | | | | | | | | | |
Term Loan, 4.25%, Maturing August 21, 2020 | | | | | 75 | | | | 75,312 | |
Rentpath, Inc. | | | | | | | | | | |
Term Loan, 6.25%, Maturing May 29, 2020 | | | | | 499 | | | | 492,042 | |
Springer Science+Business Media Deutschland GmbH | | | | | | | | | | |
Term Loan, 5.00%, Maturing August 14, 2020 | | | | | 250 | | | | 250,703 | |
Tribune Company | | | | | | | | | | |
Term Loan, 4.00%, Maturing December 31, 2019 | | | | | 1,990 | | | | 1,989,967 | |
| | | | | | | | | | | |
| | | | | | | | $ | 6,404,325 | |
| | | | | | | | | | | |
| | | | |
| | 9 | | See Notes to Financial Statements. |
Eaton Vance
Floating-Rate Income Plus Fund
November 30, 2013
Portfolio of Investments (Unaudited) — continued
| | | | | | | | | | |
| Borrower/Tranche Description | | | | Principal
Amount
(000’s omitted) | | | Value | |
| | | | | | | | | | |
| |
Radio and Television — 4.6% | | | | | |
Clear Channel Communications, Inc. | | | | | | | | | | |
Term Loan, 6.91%, Maturing January 30, 2019 | | | | $ | 1,000 | | | $ | 948,438 | |
Cumulus Media Holdings Inc. | | | | | | | | | | |
Term Loan, 4.50%, Maturing September 17, 2018 | | | | | 1,922 | | | | 1,936,526 | |
Entercom Radio, LLC | | | | | | | | | | |
Term Loan, 5.00%, Maturing November 23, 2018 | | | | | 379 | | | | 380,831 | |
Entravision Communications Corporation | | | | | | | | | | |
Term Loan, 3.50%, Maturing May 29, 2020 | | | | | 1,000 | | | | 989,063 | |
TWCC Holding Corp. | | | | | | | | | | |
Term Loan - Second Lien, 7.00%, Maturing June 26, 2020 | | | | | 1,000 | | | | 1,026,875 | |
Univision Communications Inc. | | | | | | | | | | |
Term Loan, 4.50%, Maturing March 2, 2020 | | | | | 1,496 | | | | 1,504,190 | |
| | | | | | | | | | | |
| | | | | | | | $ | 6,785,923 | |
| | | | | | | | | | | |
| |
Retailers (Except Food and Drug) — 7.1% | | | | | |
Bass Pro Group, LLC | | | | | | | | | | |
Term Loan, Maturing November 20, 2019(2) | | | | $ | 625 | | | $ | 628,516 | |
CDW LLC | | | | | | | | | | |
Term Loan, 3.25%, Maturing April 29, 2020 | | | | | 1,646 | | | | 1,642,395 | |
David’s Bridal, Inc. | | | | | | | | | | |
Term Loan, 5.00%, Maturing October 11, 2019 | | | | | 499 | | | | 500,510 | |
Harbor Freight Tools USA, Inc. | | | | | | | | | | |
Term Loan, 4.75%, Maturing July 26, 2019 | | | | | 249 | | | | 252,522 | |
Hudson’s Bay Company | | | | | | | | | | |
Term Loan, 4.75%, Maturing November 4, 2020 | | | | | 1,025 | | | | 1,040,119 | |
Jo-Ann Stores, Inc. | | | | | | | | | | |
Term Loan, 4.00%, Maturing March 16, 2018 | | | | | 1,990 | | | | 2,001,791 | |
Michaels Stores, Inc. | | | | | | | | | | |
Term Loan, 3.75%, Maturing January 28, 2020 | | | | | 1,493 | | | | 1,499,609 | |
Neiman Marcus Group, Inc. (The) | | | | | | | | | | |
Term Loan, 5.00%, Maturing October 26, 2020 | | | | | 1,100 | | | | 1,108,171 | |
Party City Holdings Inc. | | | | | | | | | | |
Term Loan, 4.25%, Maturing July 29, 2019 | | | | | 1,492 | | | | 1,500,293 | |
Spin Holdco Inc. | | | | | | | | | | |
Term Loan, Maturing November 14, 2019(2) | | | | | 150 | | | | 150,125 | |
Toys ‘R’ Us Property Company I, LLC | | | | | | | | | | |
Term Loan, 6.00%, Maturing August 21, 2019 | | | | | 150 | | | | 146,362 | |
| | | | | | | | | | | |
| | | | | | | | $ | 10,470,413 | |
| | | | | | | | | | | |
| |
Steel — 3.5% | | | | | |
FMG Resources (August 2006) Pty Ltd. | | | | | | | | | | |
Term Loan, 4.25%, Maturing June 28, 2019 | | | | $ | 2,090 | | | $ | 2,113,462 | |
JFB Firth Rixson Inc. | | | | | | | | | | |
Term Loan, 4.25%, Maturing June 30, 2017 | | | | | 796 | | | | 803,452 | |
| | | | | | | | | | |
| Borrower/Tranche Description | | | | Principal
Amount
(000’s omitted) | | | Value | |
| | | | | | | | | | |
| |
Steel (continued) | | | | | |
JMC Steel Group, Inc. | | | | | | | | | | |
Term Loan, 4.75%, Maturing April 3, 2017 | | | | $ | 997 | | | $ | 1,001,486 | |
Neenah Foundry Company | | | | | | | | | | |
Term Loan, 6.78%, Maturing April 26, 2017 | | | | | 494 | | | | 494,288 | |
Waupaca Foundry, Inc. | | | | | | | | | | |
Term Loan, 4.50%, Maturing June 29, 2017 | | | | | 790 | | | | 792,059 | |
| | | | | | | | | | | |
| | | | | | | | $ | 5,204,747 | |
| | | | | | | | | | | |
| |
Telecommunications — 4.9% | | | | | |
Cricket Communications, Inc. | | | | | | | | | | |
Term Loan, 4.75%, Maturing March 9, 2020 | | | | $ | 1,496 | | | $ | 1,504,200 | |
Crown Castle International Corporation | | | | | | | | | | |
Term Loan, 3.25%, Maturing January 31, 2019 | | | | | 274 | | | | 274,451 | |
Intelsat Jackson Holdings S.A. | | | | | | | | | | |
Term Loan, Maturing June 30,
2019(2) | | | | | 1,950 | | | | 1,950,000 | |
Syniverse Holdings, Inc. | | | | | | | | | | |
Term Loan, 4.00%, Maturing April 23, 2019 | | | | | 1,454 | | | | 1,459,433 | |
Windstream Corporation | | | | | | | | | | |
Term Loan, 4.00%, Maturing August 8, 2019 | | | | | 1,995 | | | | 2,003,055 | |
| | | | | | | | | | | |
| | | | | | | | $ | 7,191,139 | |
| | | | | | | | | | | |
| |
Utilities — 2.3% | | | | | |
Calpine Corporation | | | | | | | | | | |
Term Loan, 4.00%, Maturing April 2, 2018 | | | | $ | 1,990 | | | $ | 2,006,455 | |
Dynegy Holdings Inc. | | | | | | | | | | |
Term Loan, 4.00%, Maturing April 23, 2020 | | | | | 798 | | | | 800,992 | |
EFS Cogen Holdings I Inc. | | | | | | | | | | |
Term Loan, Maturing December 1, 2020(2) | | | | | 150 | | | | 150,750 | |
PowerTeam Services, LLC | | | | | | | | | | |
Term Loan, 4.23%, Maturing May 6, 2020(3) | | | | | 56 | | | | 55,000 | |
Term Loan, 4.25%, Maturing May 6, 2020 | | | | | 443 | | | | 439,565 | |
| | | | | | | | | | | |
| | | | | | | | $ | 3,452,762 | |
| | | | | | | | | | | |
| | | |
Total Senior Floating-Rate Interests
(identified cost $198,515,660) | | | | | | | | $ | 199,647,225 | |
| | | | | | | | | | | |
| |
| Corporate Bonds & Notes — 12.1% | | | | | |
| | | |
| | | | | | | | | | |
| Security | | | | Principal
Amount
(000’s omitted) | | | Value | |
| |
Automotive — 0.3% | | | | | |
Navistar International Corp. | | | | | | | | | | |
8.25%, 11/1/21 | | | | $ | 400 | | | $ | 413,000 | |
| | | | | | | | | | | |
| | | | | | | | $ | 413,000 | |
| | | | | | | | | | | |
| | | | |
| | 10 | | See Notes to Financial Statements. |
Eaton Vance
Floating-Rate Income Plus Fund
November 30, 2013
Portfolio of Investments (Unaudited) — continued
| | | | | | | | | | |
| Security | | | | Principal
Amount
(000’s omitted) | | | Value | |
| | | | | | | | | | |
| |
Chemicals and Plastics — 0.2% | | | | | |
Tronox Finance, LLC | | | | | | | | | | |
6.375%, 8/15/20 | | | | $ | 300 | | | $ | 301,875 | |
| | | | | | | | | | | |
| | | | | | | | $ | 301,875 | |
| | | | | | | | | | | |
| |
Commercial Services �� 0.7% | | | | | |
ADT Corp. (The) | | | | | | | | | | |
3.50%, 7/15/22 | | | | $ | 600 | | | $ | 526,213 | |
Cielo SA/Cielo USA, Inc. | | | | | | | | | | |
3.75%, 11/16/22(4) | | | | | 575 | | | | 516,063 | |
| | | | | | | | | | | |
| | | | | | | | $ | 1,042,276 | |
| | | | | | | | | | | |
| |
Containers and Glass Products — 0.4% | | | | | |
Reynolds Group Holdings, Inc. | | | | | | | | | | |
9.875%, 8/15/19 | | | | $ | 500 | | | $ | 557,500 | |
| | | | | | | | | | | |
| | | | | | | | $ | 557,500 | |
| | | | | | | | | | | |
| |
Diversified Financial Services — 0.5% | | | | | |
SLM Corp. | | | | | | | | | | |
5.625%, 8/1/33 | | | | $ | 950 | | | $ | 788,500 | |
| | | | | | | | | | | |
| | | | | | | | $ | 788,500 | |
| | | | | | | | | | | |
| |
Electronics / Electrical — 1.6% | | | | | |
Advanced Micro Devices, Inc. | | | | | | | | | | |
7.50%, 8/15/22 | | | | $ | 500 | | | $ | 483,750 | |
Dell, Inc. | | | | | | | | | | |
5.40%, 9/10/40 | | | | | 1,575 | | | | 1,067,062 | |
Hewlett-Packard Co. | | | | | | | | | | |
6.00%, 9/15/41 | | | | | 835 | | | | 828,543 | |
| | | | | | | | | | | |
| | | | | | | | $ | 2,379,355 | |
| | | | | | | | | | | |
| |
Financial Intermediaries — 0.1% | | | | | |
First Data Corp. | | | | | | | | | | |
10.625%, 6/15/21(4) | | | | $ | 200 | | | $ | 217,000 | |
| | | | | | | | | | | |
| | | | | | | | $ | 217,000 | |
| | | | | | | | | | | |
| |
Food / Drug Retailers — 0.3% | | | | | |
Delhaize Group SA | | | | | | | | | | |
5.70%, 10/1/40 | | | | $ | 380 | | | $ | 365,489 | |
| | | | | | | | | | | |
| | | | | | | | $ | 365,489 | |
| | | | | | | | | | | |
| | | | | | | | | | |
| Security | | | | Principal
Amount
(000’s omitted) | | | Value | |
| | | | | | | | | | |
| |
Health Care — 0.1% | | | | | |
Tenet Healthcare Corp. | | | | | | | | | | |
8.125%, 4/1/22 | | | | $ | 165 | | | $ | 179,438 | |
| | | | | | | | | | | |
| | | | | | | | $ | 179,438 | |
| | | | | | | | | | | |
| |
Insurance — 0.1% | | | | | |
Onex USI Acquisition Corp. | | | | | | | | | | |
7.75%, 1/15/21(4) | | | | $ | 200 | | | $ | 205,500 | |
| | | | | | | | | | | |
| | | | | | | | $ | 205,500 | |
| | | | | | | | | | | |
| |
Metals / Mining — 0.5% | | | | | |
Newmont Mining Corp. | | | | | | | | | | |
4.875%, 3/15/42 | | | | $ | 1,030 | | | $ | 768,230 | |
| | | | | | | | | | | |
| | | | | | | | $ | 768,230 | |
| | | | | | | | | | | |
| |
Oil and Gas — 0.6% | | | | | |
MEG Energy Corp. | | | | | | | | | | |
6.375%, 1/30/23(4) | | | | $ | 400 | | | $ | 406,000 | |
PBF Holding Co., LLC/PBF Finance Corp. | | | | | | | | | | |
8.25%, 2/15/20 | | | | | 400 | | | | 422,000 | |
| | | | | | | | | | | |
| | | | | | | | $ | 828,000 | |
| | | | | | | | | | | |
| |
Retailers (Except Food and Drug) — 2.1% | | | | | |
Best Buy Co., Inc. | | | | | | | | | | |
5.00%, 8/1/18 | | | | $ | 836 | | | $ | 873,620 | |
JC Penney Corp., Inc. | | | | | | | | | | |
6.375%, 10/15/36 | | | | | 2,900 | | | | 2,233,000 | |
| | | | | | | | | | | |
| | | | | | | | $ | 3,106,620 | |
| | | | | | | | | | | |
| |
Steel — 0.6% | | | | | |
Cliffs Natural Resources, Inc. | | | | | | | | | | |
6.25%, 10/1/40 | | | | $ | 950 | | | $ | 832,495 | |
| | | | | | | | | | | |
| | | | | | | | $ | 832,495 | |
| | | | | | | | | | | |
| |
Telecommunications — 3.4% | | | | | |
Alcoa, Inc. | | | | | | | | | | |
5.95%, 2/1/37 | | | | $ | 885 | | | $ | 833,388 | |
Avaya, Inc. | | | | | | | | | | |
10.50%, 3/1/21(4) | | | | | 650 | | | | 591,500 | |
Sprint Capital Corp. | | | | | | | | | | |
6.875%, 11/15/28 | | | | | 500 | | | | 477,500 | |
Sprint Corp. | | | | | | | | | | |
7.875%, 9/15/23(4) | | | | | 1,000 | | | | 1,097,500 | |
| | | | |
| | 11 | | See Notes to Financial Statements. |
Eaton Vance
Floating-Rate Income Plus Fund
November 30, 2013
Portfolio of Investments (Unaudited) — continued
| | | | | | | | | | |
| Security | | | | Principal
Amount
(000’s omitted) | | | Value | |
| | | | | | | | | | |
| |
Telecommunications (continued) | | | | | |
Telecom Italia Capital SA | | | | | | | | | | |
6.00%, 9/30/34 | | | | $ | 2,490 | | | $ | 2,099,722 | |
| | | | | | | | | | | |
| | | | | | | | $ | 5,099,610 | |
| | | | | | | | | | | |
| |
Utilities — 0.6% | | | | | |
Enel Finance International NV | | | | | | | | | | |
6.00%, 10/7/39(4) | | | | $ | 860 | | | $ | 830,752 | |
| | | | | | | | | | | |
| | | | | | | | $ | 830,752 | |
| | | | | | | | | | | |
| | | |
Total Corporate Bonds & Notes
(identified cost $17,659,190) | | | | | | | | $ | 17,915,640 | |
| | | | | | | | | | | |
| |
| Foreign Government Bonds — 0.3% | | | | | |
| | | |
| | | | | | | | | | |
| Security | | | | Principal
Amount
(000’s omitted) | | | Value | |
| |
Mexico — 0.3% | | | | | |
Mexican Bonos | | | | | | | | | | |
5.00%, 6/15/17 | | MXN | | | 6,460 | | | $ | 500,211 | |
| | | | | | | | | | | |
| | | |
Total Foreign Government Bonds
(identified cost $498,879) | | | | | | | | $ | 500,211 | |
| | | | | | | | | | | |
| | | |
| Convertible Bonds — 2.0% | | | | | | | | | | |
| Security | | | | Principal
Amount
(000’s omitted) | | | Value | |
| |
Automotive & Parts — 0.1% | | | | | |
Meritor, Inc. | | | | | | | | | | |
7.875%, 3/1/26(4) | | | | $ | 175 | | | $ | 220,172 | |
| | | | | | | | | | | |
| | | | | | | | $ | 220,172 | |
| | | | | | | | | | | |
| |
Home Builders — 0.6% | | | | | |
KB Home | | | | | | | | | | |
1.375%, 2/1/19 | | | | $ | 400 | | | $ | 397,250 | |
Ryland Group, Inc. (The) | | | | | | | | | | |
0.25%, 6/1/19 | | | | | 465 | | | | 423,440 | |
| | | | | | | | | | | |
| | | | | | | | $ | 820,690 | |
| | | | | | | | | | | |
| |
Semiconductors — 1.1% | | | | | |
Novellus Systems, Inc. | | | | | | | | | | |
2.625%, 5/15/41 | | | | $ | 1,000 | | | $ | 1,604,375 | |
| | | | | | | | | | | |
| | | | | | | | $ | 1,604,375 | |
| | | | | | | | | | | |
| | | | | | | | | | |
| Security | | | | Principal
Amount
(000’s omitted) | | | Value | |
| | | | | | | | | | |
| |
Telecommunications — 0.2% | | | | | |
Ciena Corp. | | | | | | | | | | |
3.75%, 10/15/18(4) | | | | $ | 250 | | | $ | 344,844 | |
| | | | | | | | | | | |
| | | | | | | | $ | 344,844 | |
| | | | | | | | | | | |
| | | |
Total Convertible Bonds
(identified cost $2,785,709) | | | | | | | | $ | 2,990,081 | |
| | | | | | | | | | | |
| | | |
| Common Stocks — 5.7% | | | | | | | | | | |
| | | |
| | | | | | | | | | |
| Security | | | | Shares | | | Value | |
| |
Chemicals and Plastics — 0.7% | | | | | |
E.I. du Pont de Nemours & Co. | | | | | 5,596 | | | $ | 343,482 | |
LyondellBasell Industries NV, Class A | | | | | 4,405 | | | | 339,978 | |
Solvay SA | | | | | 2,347 | | | | 357,189 | |
| | | | | | | | | | | |
| | | | | | | | $ | 1,040,649 | |
| | | | | | | | | | | |
| |
Diversified Financial Services — 0.7% | | | | | |
Medley Capital Corp. | | | | | 74,500 | | | $ | 1,067,585 | |
| | | | | | | | | | | |
| | | | | | | | $ | 1,067,585 | |
| | | | | | | | | | | |
| |
Electronics / Electrical — 0.9% | | | | | |
Applied Materials, Inc. | | | | | 39,300 | | | $ | 679,890 | |
Intel Corp. | | | | | 25,150 | | | | 599,576 | |
| | | | | | | | | | | |
| | | | | | | | $ | 1,279,466 | |
| | | | | | | | | | | |
| |
Investment Companies — 2.8% | | | | | |
Ares Capital Corp. | | | | | 59,000 | | | $ | 1,084,420 | |
PennantPark Investment Corp. | | | | | 71,000 | | | | 864,070 | |
Solar Capital, Ltd. | | | | | 43,000 | | | | 995,450 | |
THL Credit, Inc. | | | | | 67,000 | | | | 1,136,990 | |
| | | | | | | | | | | |
| | | | | | | | $ | 4,080,930 | |
| | | | | | | | | | | |
| |
Oil and Gas — 0.4% | | | | | |
Marathon Oil Corp. | | | | | 8,397 | | | $ | 302,628 | |
Occidental Petroleum Corp. | | | | | 3,312 | | | | 314,508 | |
| | | | | | | | | | | |
| | | | | | | | $ | 617,136 | |
| | | | | | | | | | | |
| |
Telecommunications — 0.2% | | | | | |
Corning, Inc. | | | | | 20,679 | | | $ | 353,197 | |
| | | | | | | | | | | |
| | | | | | | | $ | 353,197 | |
| | | | | | | | | | | |
| | | |
Total Common Stocks
(identified cost $7,796,106) | | | | | | | | $ | 8,438,963 | |
| | | | | | | | | | | |
| | | | |
| | 12 | | See Notes to Financial Statements. |
Eaton Vance
Floating-Rate Income Plus Fund
November 30, 2013
Portfolio of Investments (Unaudited) — continued
| | | | | | | | | | |
| Convertible Preferred Stocks — 1.6% | | | | | |
| | | |
| | | | | | | | | | |
| Security | | | | Shares | | | Value | |
| | | | | | | | | | |
| |
Automotive & Parts — 0.0%(5) | | | | | |
Goodyear Tire & Rubber Co. (The), 5.875% | | | | | 600 | | | $ | 37,752 | |
| | | | | | | | | | | |
| | | | | | | | $ | 37,752 | |
| | | | | | | | | | | |
| |
Health Care – Products — 0.2% | | | | | |
Alere, Inc., 3.00% | | | | | 900 | | | $ | 244,800 | |
| | | | | | | | | | | |
| | | | | | | | $ | 244,800 | |
| | | | | | | | | | | |
| |
Oil & Gas — 0.3% | | | | | |
Chesapeake Energy Corp., 5.75%(4) | | | | | 400 | | | $ | 461,750 | |
| | | | | | | | | | | |
| | | | | | | | $ | 461,750 | |
| | | | | | | | | | | |
| |
Real Estate Investment Trusts (REITs) — 0.8% | | | | | |
iStar Financial, Inc., 4.50% | | | | | 20,000 | | | $ | 1,167,600 | |
| | | | | | | | | | | |
| | | | | | | | $ | 1,167,600 | |
| | | | | | | | | | | |
| |
Telecommunications — 0.3% | | | | | |
Lucent Technologies Capital Trust I, 7.75% | | | | | 400 | | | $ | 404,000 | |
| | | | | | | | | | | |
| | | | | | | | $ | 404,000 | |
| | | | | | | | | | | |
| | | |
Total Convertible Preferred Stocks
(identified cost $2,076,164) | | | | | | | | $ | 2,315,902 | |
| | | | | | | | | | | |
| | | |
| Preferred Stocks — 0.5% | | | | | | | | | | |
| | | |
| | | | | | | | | | |
| Security | | | | Shares | | | Value | |
| |
Banks — 0.5% | | | | | |
First Tennessee Bank, 3.75%(4)(6) | | | | | 26 | | | $ | 184,636 | |
Lloyds Banking Group PLC, 6.657% to 5/21/37(4)(7) | | | | | 575 | | | | 556,045 | |
| | | | | | | | | | | |
| | | |
Total Preferred Stocks
(identified cost $711,809) | | | | | | | | $ | 740,681 | |
| | | | | | | | | | | |
| |
| Tax-Exempt Investments — 0.7% | | | | | |
| | | |
| | | | | | | | | | |
| Security | | | | Principal
Amount
(000’s omitted) | | | Value | |
| |
Water and Sewer — 0.7% | | | | | |
Detroit, MI, Water Supply System, 5.25%, 7/1/41 | | | | $ | 1,102 | | | $ | 1,009,134 | |
| | | | | | | | | | | |
| | | |
Total Tax-Exempt Investments
(identified cost $976,692) | | | | | | | | $ | 1,009,134 | |
| | | | | | | | | | | |
| | | | | | | | | | |
| Short-Term Investments — 4.4% | | | | | |
| | | |
| | | | | | | | | | |
| Description | | | | Interest
(000’s omitted) | | | Value | |
| | | | | | | | | | |
Eaton Vance Cash Reserves Fund, LLC, 0.12%(8) | | | | $ | 6,574 | | | $ | 6,574,089 | |
| | | | | | | | | | | |
| | | |
Total Short-Term Investments
(identified cost $6,574,089) | | | | | | | | $ | 6,574,089 | |
| | | | | | | | | | | |
| | | |
Total Investments — 162.0%
(identified cost $237,594,298) | | | | | | | | $ | 240,131,926 | |
| | | | | | | | | | | |
| |
Less Unfunded Loan Commitments — (0.1)% | | | $ | (91,944 | ) |
| | | | | | | | | | | |
| | | |
Net Investments — 161.9%
(identified cost $237,502,354) | | | | | | | | $ | 240,039,982 | |
| | | | | | | | | | | |
| | | |
Notes Payable — (36.4)% | | | | | | | | $ | (54,000,000 | ) |
| | | | | | | | | | | |
| |
Variable Rate Term Preferred Shares, at Liquidation Value — (24.3)% | | | $ | (36,000,000 | ) |
| | | | | | | | | | | |
| | | |
Other Assets, Less Liabilities — (1.2)% | | | | | | | | $ | (1,759,555 | ) |
| | | | | | | | | | | |
| | | |
Net Assets Applicable to Common Shares — 100.0% | | | | | | | | $ | 148,280,427 | |
| | | | | | | | | | | |
The percentage shown for each investment category in the Portfolio of Investments is based on net assets applicable to common shares.
| (1) | Senior floating-rate interests (Senior Loans) often require prepayments from excess cash flows or permit the borrowers to repay at their election. The degree to which borrowers repay, whether as a contractual requirement or at their election, cannot be predicted with accuracy. As a result, the actual remaining maturity may be substantially less than the stated maturities shown. However, Senior Loans will have an expected average life of approximately two to four years. The stated interest rate represents the weighted average interest rate of all contracts within the senior loan facility and includes commitment fees on unfunded loan commitments, if any. Senior Loans typically have rates of interest which are redetermined either daily, monthly, quarterly or semi-annually by reference to a base lending rate, plus a premium. These base lending rates are primarily the London Interbank Offered Rate (“LIBOR”) and secondarily, the prime rate offered by one or more major United States banks (the “Prime Rate”) and the certificate of deposit (“CD”) rate or other base lending rates used by commercial lenders. |
| (2) | This Senior Loan will settle after November 30, 2013, at which time the interest rate will be determined. |
| (3) | Unfunded or partially unfunded loan commitments. See Note 1G for description. |
| (4) | Security exempt from registration pursuant to Rule 144A under the Securities Act of 1933. These securities May be sold in certain transactions (normally to qualified institutional buyers) and remain exempt from registration. At November 30, 2013, the aggregate value of these securities is $5,631,762 or 3.8% of the Fund’s net assets applicable to common shares. |
| (5) | Amount is less than 0.05%. |
| | | | |
| | 13 | | See Notes to Financial Statements. |
Eaton Vance
Floating-Rate Income Plus Fund
November 30, 2013
Portfolio of Investments (Unaudited) — continued
| (6) | Variable rate security. The stated interest rate represents the rate in effect at November 30, 2013. |
| (7) | Security converts to floating rate after the indicated fixed-rate coupon period. |
| (8) | Affiliated investment company, available to Eaton Vance portfolios and funds, which invests in high quality, U.S. dollar denominated money market instruments. The rate shown is the annualized seven-day yield as of November 30, 2013. |
| | | | |
| | 14 | | See Notes to Financial Statements. |
Eaton Vance
Floating-Rate Income Plus Fund
November 30, 2013
Statement of Assets and Liabilities (Unaudited)
| | | | |
| Assets | | November 30, 2013 | |
Unaffiliated investments, at value (identified cost, $230,928,265) | | $ | 233,465,893 | |
Affiliated investment, at value (identified cost, $6,574,089) | | | 6,574,089 | |
Cash | | | 1,214,105 | |
Interest and dividends receivable | | | 1,451,595 | |
Interest receivable from affiliated investment | | | 381 | |
Receivable for investments sold | | | 2,815,625 | |
Deferred offering costs | | | 273,741 | |
Prepaid upfront fees on variable rate term preferred shares | | | 156,329 | |
Prepaid expenses | | | 776 | |
Total assets | | $ | 245,952,534 | |
|
| Liabilities | |
Notes payable | | $ | 54,000,000 | |
Variable rate term preferred shares, at liquidation value | | | 36,000,000 | |
Payable for investments purchased | | | 7,386,719 | |
Payable to affiliates: | | | | |
Investment adviser fee | | | 146,777 | |
Trustees’ fees | | | 506 | |
Interest payable | | | 41,791 | |
Accrued expenses | | | 96,314 | |
Total liabilities | | $ | 97,672,107 | |
Net assets applicable to common shares | | $ | 148,280,427 | |
|
| Sources of Net Assets | |
Common shares, $0.01 par value, unlimited number of shares authorized, 7,606,422 shares issued and outstanding | | $ | 76,064 | |
Additional paid-in capital | | | 144,907,194 | |
Accumulated net realized gain | | | 562,491 | |
Accumulated undistributed net investment income | | | 197,196 | |
Net unrealized appreciation | | | 2,537,482 | |
Net assets applicable to common shares | | $ | 148,280,427 | |
|
| Net Asset Value Per Common Share | |
($148,280,427 ÷ 7,606,422 common shares issued and outstanding) | | $ | 19.49 | |
| | | | |
| | 15 | | See Notes to Financial Statements. |
Eaton Vance
Floating-Rate Income Plus Fund
November 30, 2013
Statement of Operations (Unaudited)
| | | | |
| Investment Income | | Period Ended
November 30, 2013(1) | |
Interest and other income | | $ | 4,327,814 | |
Dividends | | | 255,499 | |
Interest income allocated from affiliated investment | | | 10,194 | |
Expenses allocated from affiliated investment | | | (1,508 | ) |
Total investment income | | $ | 4,591,999 | |
|
| Expenses | |
Investment adviser fee | | $ | 684,025 | |
Trustees’ fees and expenses | | | 2,040 | |
Custodian fee | | | 57,084 | |
Transfer and dividend disbursing agent fees | | | 12,359 | |
Legal and accounting services | | | 77,873 | |
Amortization of deferred offering costs | | | 40,098 | |
Printing and postage | | | 7,988 | |
Interest expense and fees | | | 432,342 | |
Miscellaneous | | | 46,375 | |
Total expenses | | $ | 1,360,184 | |
Deduct — | | | | |
Reduction of custodian fee | | $ | 18 | |
Total expense reductions | | $ | 18 | |
| |
Net expenses | | $ | 1,360,166 | |
| |
Net investment income | | $ | 3,231,833 | |
| |
| Realized and Unrealized Gain (Loss) | | | | |
Net realized gain (loss) — | | | | |
Investment transactions | | $ | 562,584 | |
Investment transactions allocated from affiliated investment | | | 48 | |
Foreign currency transactions | | | (141 | ) |
Net realized gain | | $ | 562,491 | |
Change in unrealized appreciation (depreciation) — | | | | |
Investments | | $ | 2,537,628 | |
Foreign currency | | | (146 | ) |
Net change in unrealized appreciation (depreciation) | | $ | 2,537,482 | |
| |
Net realized and unrealized gain | | $ | 3,099,973 | |
| |
Net increase in net assets from operations | | $ | 6,331,806 | |
| (1) | For the period from the start of business, June 28, 2013, to November 30, 2013. |
| | | | |
| | 16 | | See Notes to Financial Statements. |
Eaton Vance
Floating-Rate Income Plus Fund
November 30, 2013
Statement of Changes in Net Assets
| | | | |
| Increase (Decrease) in Net Assets | | Period Ended November 30, 2013 (Unaudited)(1) | |
From operations — | | | | |
Net investment income | | $ | 3,231,833 | |
Net realized gain from investment and foreign currency transactions | | | 562,491 | |
Net change in unrealized appreciation (depreciation) from investments and foreign currency | | | 2,537,482 | |
Net increase in net assets from operations | | $ | 6,331,806 | |
Distributions to common shareholders — | | | | |
From net investment income | | $ | (3,034,637 | ) |
Total distributions to common shareholders | | $ | (3,034,637 | ) |
Capital share transactions — | | | | |
Proceeds from sale of common shares(2) | | $ | 145,127,358 | |
Reinvestment of distributions to common shareholders | | | 59,990 | |
Offering costs on common shares | | | (304,090 | ) |
Net increase in net assets from capital share transactions | | $ | 144,883,258 | |
| |
Net increase in net assets | | $ | 148,180,427 | |
|
| Net Assets Applicable to Common Shares | |
At beginning of period | | $ | 100,000 | |
At end of period | | $ | 148,280,427 | |
|
Accumulated undistributed net investment income included in net assets applicable to common shares | |
At end of period | | $ | 197,196 | |
| (1) | For the period from the start of business, June 28, 2013, to November 30, 2013. |
| (2) | Proceeds from sale of common shares are net of sales load paid of $6,838,462 and include shares sold from the exercise of the underwriters’ over-allotment option of $16,202,358 (see Note 6). |
| | | | |
| | 17 | | See Notes to Financial Statements. |
Eaton Vance
Floating-Rate Income Plus Fund
November 30, 2013
Statement of Cash Flows (Unaudited)
| | | | |
| Cash Flows From Operating Activities | | Period Ended November 30, 2013(1) | |
Net increase in net assets from operations | | $ | 6,331,806 | |
Adjustments to reconcile net increase in net assets from operations to net cash used in operating activities: | | | | |
Investments purchased | | | (255,537,794 | ) |
Investments sold and principal repayments | | | 29,700,516 | |
Increase in short-term investments, net | | | (6,574,089 | ) |
Net amortization/accretion of premium (discount) | | | (49,253 | ) |
Amortization of offering costs and prepaid upfront fees on variable rate term preferred shares | | | 63,769 | |
Increase in interest and dividends receivable | | | (1,451,595 | ) |
Increase in interest receivable from affiliated investment | | | (381 | ) |
Increase in prepaid expenses | | | (776 | ) |
Increase in payable to affiliate for investment adviser fee | | | 146,777 | |
Increase in payable to affiliate for Trustees’ fees | | | 506 | |
Increase in interest payable | | | 41,791 | |
Increase in accrued expenses | | | 96,314 | |
Increase in unfunded loan commitments | | | 91,944 | |
Net change in unrealized (appreciation) depreciation from investments | | | (2,537,628 | ) |
Net realized gain from investments | | | (562,584 | ) |
Net cash used in operating activities | | $ | (230,240,677 | ) |
| |
| Cash Flows From Financing Activities | | | | |
Proceeds from common shares sold(2) | | $ | 145,127,358 | |
Offering costs on common shares | | | (304,090 | ) |
Distributions paid to common shareholders, net of reinvestments | | | (2,974,647 | ) |
Proceeds from notes payable | | | 54,000,000 | |
Proceeds from variable rate term preferred shares issued | | | 36,000,000 | |
Payment of deferred offering costs on variable rate term preferred shares | | | (313,839 | ) |
Payment of prepaid upfront fees on variable rate term preferred shares | | | (180,000 | ) |
Net cash provided by financing activities | | $ | 231,354,782 | |
| |
Net increase in cash | | $ | 1,114,105 | |
| |
Cash at beginning of period | | $ | 100,000 | |
| |
Cash at end of period | | $ | 1,214,105 | |
| |
| Supplemental disclosure of cash flow information: | | | | |
Noncash financing activities not included herein consist of: | | | | |
Reinvestment of dividends and distributions | | $ | 59,990 | |
Cash paid for interest and fees on borrowings and variable rate term preferred shares | | | 495,443 | |
| (1) | For the period from the start of business, June 28, 2013, to November 30, 2013. |
| (2) | Proceeds from sale of common shares are net of sales load paid of $6,838,462. |
| | | | |
| | 18 | | See Notes to Financial Statements. |
Eaton Vance
Floating-Rate Income Plus Fund
November 30, 2013
Financial Highlights
Selected data for a common share outstanding during the periods stated
| | | | |
| | | Period Ended November 30, 2013 (Unaudited) (1) | |
Net asset value — Beginning of period (Common shares) | | $ | 19.100 | (2) |
| |
| Income (Loss) From Operations | | | | |
Net investment income(3) | | $ | 0.438 | |
Net realized and unrealized gain | | | 0.422 | |
| |
Total income from operations | | $ | 0.860 | |
| |
| Less Distributions to Common Shareholders | | | | |
From net investment income | | $ | (0.399 | ) |
| |
Total distributions to common shareholders | | $ | (0.399 | ) |
| |
Common shares offering costs charged to paid-in capital(3) | | $ | (0.041 | ) |
| |
Discount related to exercise of underwriters’ over-allotment option | | $ | (0.030 | ) |
| |
Net asset value — End of period (Common shares) | | $ | 19.490 | |
| |
Market value — End of period (Common shares) | | $ | 17.900 | |
| |
Total Investment Return on Net Asset Value(4) | | | 4.28 | %(5)(6) |
| |
Total Investment Return on Market Value(4) | | | (4.23 | )%(5)(6) |
| | | | |
| | 19 | | See Notes to Financial Statements. |
Eaton Vance
Floating-Rate Income Plus Fund
November 30, 2013
Financial Highlights — continued
Selected data for a common share outstanding during the periods stated
| | | | |
| Ratios/Supplemental Data | | Period Ended November 30, 2013 (Unaudited) (1) | |
Net assets applicable to common shares, end of period (000’s omitted) | | $ | 148,280 | |
Ratios (as a percentage of average daily net assets applicable to common shares): | | | | |
Expenses excluding interest and fees(7) | | | 1.53 | %(8) |
Interest and fee expense(9) | | | 0.71 | %(8) |
Total expenses(7) | | | 2.24 | %(8) |
Net investment income | | | 5.31 | %(8) |
Portfolio Turnover | | | 15 | %(6) |
The ratios reported above are based on net assets applicable solely to common shares. The ratios based on net assets, including amounts related to preferred shares and borrowings, are as follows: | |
Ratios (as a percentage of average daily net assets applicable to common shares plus preferred shares and borrowings): | |
Expenses excluding interest and fees(7) | | | 1.02 | %(8) |
Interest and fee expense(9) | | | 0.47 | %(8) |
Total expenses(7) | | | 1.49 | %(8) |
Net investment income | | | 3.53 | %(8) |
Senior Securities: | | | | |
Total notes payable outstanding (in 000’s) | | $ | 54,000 | |
Asset coverage per $1,000 of notes payable(10) | | $ | 4,413 | |
Total preferred shares outstanding(11) | | | 360 | |
Asset coverage per preferred share(11)(12) | | $ | 264,756 | |
Involuntary liquidation preference per preferred share(11) | | $ | 100,000 | |
Approximate market value per preferred share(11) | | $ | 100,000 | |
| (1) | For the period from the start of business, June 28, 2013, to November 30, 2013. |
| (2) | Net asset value at beginning of period reflects the deduction of the sales load of $0.90 per share paid by the shareholders from the $20.00 offering price. |
| (3) | Computed using average common shares outstanding. |
| (4) | Returns are historical and are calculated by determining the percentage change in net asset value or market value with all distributions reinvested. Distributions are assumed to be reinvested at prices obtained under the Fund’s dividend reinvestment plan. |
| (5) | Total investment return on net asset value is calculated assuming a purchase at the offering price of $20.00 less the sales load of $0.90 per share paid by the shareholder on the first day and a sale at the net asset value on the last day of the period reported with all distributions reinvested. Total investment return on market value is calculated assuming a purchase at the offering price of $20.00 less the sales load of $0.90 per share paid by the shareholder on the first day and a sale at the current market price on the last day of the period reported with all distributions reinvested. |
| (7) | Excludes the effect of custody fee credits, if any, of less than 0.005%. |
| (9) | Interest and fee expense relates to variable rate term preferred shares and borrowings (see Note 2 and Note 8). |
| (10) | Calculated by subtracting the Fund’s total liabilities (not including the notes payable and preferred shares) from the Fund’s total assets, and dividing the result by the notes payable balance in thousands. |
| (11) | Preferred shares represent variable rate term preferred shares. |
| (12) | Calculated by subtracting the Fund’s total liabilities (not including the notes payable and preferred shares) from the Fund’s total assets, dividing the result by the sum of the value of the notes payable and liquidation value of the preferred shares, and multiplying the result by the liquidation value of one preferred share. Such amount equates to 265%. |
| | | | |
| | 20 | | See Notes to Financial Statements. |
Eaton Vance
Floating-Rate Income Plus Fund
November 30, 2013
Notes to Financial Statements (Unaudited)
1 Significant Accounting Policies
Eaton Vance Floating-Rate Income Plus Fund (the Fund) is a Massachusetts business trust registered under the Investment Company Act of 1940, as amended (the 1940 Act), as a diversified, closed-end management investment company. The trust was organized on April 5, 2013 and remained inactive until June 28, 2013, except for matters related to its organization, including the sale of 5,000 initial shares to Eaton Vance Management (EVM) for $100,000. The Fund’s investment objective is total return, with an emphasis on income.
The following is a summary of significant accounting policies of the Fund. The policies are in conformity with accounting principles generally accepted in the United States of America.
A Investment Valuation — The following methodologies are used to determine the market value or fair value of investments.
Senior Floating-Rate Loans. Interests in senior floating-rate loans (Senior Loans) for which reliable market quotations are readily available are valued generally at the average mean of bid and ask quotations obtained from a third party pricing service. Other Senior Loans are valued at fair value by the investment adviser under procedures approved by the Trustees. In fair valuing a Senior Loan, the investment adviser utilizes one or more of the valuation techniques described in (i) through (iii) below to assess the likelihood that the borrower will make a full repayment of the loan underlying such Senior Loan relative to yields on other Senior Loans issued by companies of comparable credit quality. If the investment adviser believes that there is a reasonable likelihood of full repayment, the investment adviser will determine fair value using a matrix pricing approach that considers the yield on the Senior Loan. If the investment adviser believes there is not a reasonable likelihood of full repayment, the investment adviser will determine fair value using analyses that include, but are not limited to: (i) a comparison of the value of the borrower’s outstanding equity and debt to that of comparable public companies; (ii) a discounted cash flow analysis; or (iii) when the investment adviser believes it is likely that a borrower will be liquidated or sold, an analysis of the terms of such liquidation or sale. In certain cases, the investment adviser will use a combination of analytical methods to determine fair value, such as when only a portion of a borrower’s assets are likely to be sold. In conducting its assessment and analyses for purposes of determining fair value of a Senior Loan, the investment adviser will use its discretion and judgment in considering and appraising relevant factors. Fair value determinations are made by the portfolio managers of the Fund based on information available to such managers. The portfolio managers of other funds managed by the investment adviser that invest in Senior Loans may not possess the same information about a Senior Loan borrower as the portfolio managers of the Fund. At times, the fair value of a Senior Loan determined by the portfolio managers of other funds managed by the investment adviser that invest in Senior Loans may vary from the fair value of the same Senior Loan determined by the portfolio managers of the Fund. The fair value of each Senior Loan is periodically reviewed and approved by the investment adviser’s Valuation Committee and by the Trustees based upon procedures approved by the Trustees. Junior Loans (i.e., subordinated loans and second lien loans) are valued in the same manner as Senior Loans.
Debt Obligations. Debt obligations (including short-term obligations with a remaining maturity of more than sixty days) are generally valued on the basis of valuations provided by third party pricing services, as derived from such services’ pricing models. Inputs to the models may include, but are not limited to, reported trades, executable bid and asked prices, broker/dealer quotations, prices or yields of securities with similar characteristics, benchmark curves or information pertaining to the issuer, as well as industry and economic events. The pricing services may use a matrix approach, which considers information regarding securities with similar characteristics to determine the valuation for a security. Short-term obligations purchased with a remaining maturity of sixty days or less are generally valued at amortized cost, which approximates market value.
Equity Securities. Equity securities (including common shares of closed-end investment companies) listed on a U.S. securities exchange generally are valued at the last sale or closing price on the day of valuation or, if no sales took place on such date, at the mean between the closing bid and asked prices therefore on the exchange where such securities are principally traded. Equity securities listed on the NASDAQ Global or Global Select Market generally are valued at the NASDAQ official closing price. Unlisted or listed securities for which closing sales prices or closing quotations are not available are valued at the mean between the latest available bid and asked prices or, in the case of preferred equity securities that are not listed or traded in the over-the-counter market, by a third party pricing service that will use various techniques that consider factors including, but not limited to, prices or yields of securities with similar characteristics, benchmark yields, broker/dealer quotes, quotes of underlying common stock, issuer spreads, as well as industry and economic events. The value of preferred equity securities that are valued by a pricing service on a bond basis will be adjusted by an income factor, to be determined by the investment adviser, to reflect the next anticipated regular dividend.
Foreign Securities and Currencies. Foreign securities and currencies are valued in U.S. dollars, based on foreign currency exchange rate quotations supplied by a third party pricing service. The pricing service uses a proprietary model to determine the exchange rate. Inputs to the model include reported trades and implied bid/ask spreads.
Affiliated Fund. The Fund may invest in Eaton Vance Cash Reserves Fund, LLC (Cash Reserves Fund), an affiliated investment company managed by EVM. The value of the Fund’s investment in Cash Reserves Fund reflects the Fund’s proportionate interest in its net assets. Cash Reserves Fund generally values its investment securities utilizing the amortized cost valuation technique in accordance with Rule 2a-7 under the 1940 Act. This technique involves initially valuing a portfolio security at its cost and thereafter assuming a constant amortization to maturity of any discount or premium. If amortized cost is determined not to approximate fair value, Cash Reserves Fund may value its investment securities in the same manner as debt obligations described above.
Fair Valuation. Investments for which valuations or market quotations are not readily available or are deemed unreliable are valued at fair value using methods determined in good faith by or at the direction of the Trustees of the Fund in a manner that fairly reflects the security’s value, or the amount that the Fund might reasonably expect to receive for the security upon its current sale in the ordinary course. Each such determination is based on a consideration of relevant factors, which are likely to vary from one pricing context to another. These factors may include, but are not limited to, the type of
Eaton Vance
Floating-Rate Income Plus Fund
November 30, 2013
Notes to Financial Statements (Unaudited) — continued
security, the existence of any contractual restrictions on the security’s disposition, the price and extent of public trading in similar securities of the issuer or of comparable companies or entities, quotations or relevant information obtained from broker/dealers or other market participants, information obtained from the issuer, analysts, and/or the appropriate stock exchange (for exchange-traded securities), an analysis of the company’s or entity’s financial condition, and an evaluation of the forces that influence the issuer and the market(s) in which the security is purchased and sold.
B Investment Transactions — Investment transactions for financial statement purposes are accounted for on a trade date basis. Realized gains and losses on investments sold are determined on the basis of identified cost.
C Income — Interest income is recorded on the basis of interest accrued, adjusted for amortization of premium or accretion of discount. Fees associated with loan amendments are recognized immediately. Dividend income is recorded on the ex-dividend date for dividends received in cash and/or securities. However, if the ex-dividend date has passed, certain dividends from foreign securities are recorded as the Fund is informed of the ex-dividend date.
D Federal Taxes — The Fund’s policy is to comply with the provisions of the Internal Revenue Code applicable to regulated investment companies and to distribute to shareholders each year substantially all of its net investment income, and all or substantially all of its net realized capital gains. Accordingly, no provision for federal income or excise tax is necessary.
As of November 30, 2013, the Fund had no uncertain tax positions that would require financial statement recognition, de-recognition, or disclosure. The Fund files a U.S. federal income tax return annually after its fiscal year-end, which is subject to examination by the Internal Revenue Service for a period of three years from the date of filing.
E Expense Reduction — State Street Bank and Trust Company (SSBT) serves as custodian of the Fund. Pursuant to the custodian agreement, SSBT receives a fee reduced by credits, which are determined based on the average daily cash balance the Fund maintains with SSBT. All credit balances, if any, used to reduce the Fund’s custodian fees are reported as a reduction of expenses in the Statement of Operations.
F Foreign Currency Translation — Investment valuations, other assets, and liabilities initially expressed in foreign currencies are translated each business day into U.S. dollars based upon current exchange rates. Purchases and sales of foreign investment securities and income and expenses denominated in foreign currencies are translated into U.S. dollars based upon currency exchange rates in effect on the respective dates of such transactions. Recognized gains or losses on investment transactions attributable to changes in foreign currency exchange rates are recorded for financial statement purposes as net realized gains and losses on investments. That portion of unrealized gains and losses on investments that results from fluctuations in foreign currency exchange rates is not separately disclosed.
G Unfunded Loan Commitments — The Fund may enter into certain credit agreements all or a portion of which may be unfunded. The Fund is obligated to fund these commitments at the borrower’s discretion. These commitments are disclosed in the accompanying Portfolio of Investments. At November 30, 2013, the Fund had sufficient cash and/or securities to cover these commitments.
H Organization and Offering Costs — Organization costs paid in connection with the organization of the Fund were borne directly by Eaton Vance Management (EVM), the Fund’s investment adviser. EVM agreed to pay all common share offering costs (other than sales loads) that exceed $0.04 per common share. Costs incurred by the Fund in connection with the offering of its common shares are recorded as a reduction of additional paid-in capital.
I Legal Fees — Legal fees and other related expenses incurred as part of negotiations of the terms and requirement of capital infusions, or that are expected to result in the restructuring of, or a plan of reorganization for, an investment are recorded as realized losses. Ongoing expenditures to protect or enhance an investment are treated as operating expenses.
J Use of Estimates — The preparation of the financial statements in conformity with accounting principles generally accepted in the United States of America requires management to make estimates and assumptions that affect the reported amounts of assets and liabilities at the date of the financial statements and the reported amounts of income and expense during the reporting period. Actual results could differ from those estimates.
K Indemnifications — Under the Fund’s organizational documents, its officers and Trustees may be indemnified against certain liabilities and expenses arising out of the performance of their duties to the Fund. Under Massachusetts law, if certain conditions prevail, shareholders of a Massachusetts business trust (such as the Fund) could be deemed to have personal liability for the obligations of the Fund. However, the Fund’s Declaration of Trust contains an express disclaimer of liability on the part of Fund shareholders and the By-laws provide that the Fund shall assume the defense on behalf of any Fund shareholders. Moreover, the By-laws also provide for indemnification out of Fund property of any shareholder held personally liable solely by reason of being or having been a shareholder for all loss or expense arising from such liability. Additionally, in the normal course of business, the Fund enters into agreements with service providers that may contain indemnification clauses. The Fund’s maximum exposure under these arrangements is unknown as this would involve future claims that may be made against the Fund that have not yet occurred.
L Statement of Cash Flows — The cash amount shown in the Statement of Cash Flows of the Fund is the amount included in the Fund’s Statement of Assets and Liabilities and represents the unrestricted cash on hand at its custodian and does not include any short-term investments.
Eaton Vance
Floating-Rate Income Plus Fund
November 30, 2013
Notes to Financial Statements (Unaudited) — continued
M Interim Financial Statements — The interim financial statements relating to November 30, 2013 and for the period then ended have not been audited by an independent registered public accounting firm, but in the opinion of the Fund’s management, reflect all adjustments, consisting only of normal recurring adjustments, necessary for the fair presentation of the financial statements.
2 Variable Rate Term Preferred Shares
On July 10, 2013, the Fund issued 360 shares of Series C-1 Variable Rate Term Preferred Shares (VRTP Shares) in a private offering to a commercial paper conduit sponsored by a large financial institution (the Conduit), all of which are outstanding at November 30, 2013.
The VRTP Shares are a form of preferred shares that represent stock of the Fund. The VRTP Shares have a par value of $0.01 per share, a liquidation preference of $100,000 per share, and a mandatory redemption date of July 8, 2016, unless extended. Dividends on the VRTP Shares are determined each day based on a spread of 1.2% to the Conduit’s current cost of funding. Such spread to the cost of funding is determined based on the current credit rating of the VRTP Shares.
The VRTP Shares are redeemable at the option of the Fund at a redemption price equal to $100,000 per share, plus accumulated and unpaid dividends, on any business day and solely for the purpose of reducing the leverage of the Fund. The VRTP Shares are also subject to mandatory redemption at a redemption price equal to $100,000 per share, plus accumulated and unpaid dividends, if the Fund is in default for an extended period on its asset maintenance or leverage ratio requirements with respect to the VRTP Shares. The holders of the VRTP Shares, voting as a class, are entitled to elect two Trustees of the Fund. If the dividends on the VRTP Shares remain unpaid in an amount equal to two full years’ dividends, the holders of the VRTP Shares as a class have the right to elect a majority of the Board of Trustees.
For financial reporting purposes, the liquidation value of the VRTP Shares is presented as a liability on the Statement of Assets and Liabilities and unpaid dividends are included in interest payable. Dividends accrued on VRTP Shares are treated as interest payments for financial reporting purposes and are included in interest expense and fees on the Statement of Operations. Costs incurred by the Fund in connection with its offering of VRTP Shares were capitalized as deferred offering costs and are being amortized over a period of three years to the mandatory redemption date of the VRTP Shares. In connection with the issuance of VRTP Shares, the Fund paid an initial upfront fee to the Conduit of $180,000 which is being amortized to interest expense and fees over a period of three years. The unamortized amount as of November 30, 2013 is presented as prepaid upfront fees on VRTP Shares on the Statement of Assets and Liabilities. If measured at fair value, the VRTP Shares would have been considered as Level 2 in the fair value hierarchy (see Note 11) at November 30, 2013.
The average liquidation preference of the VRTP Shares during the portion of the period ended November 30, 2013 in which the VRTP Shares were outstanding was $36 million.
3 Distributions to Shareholders
The Fund intends to make monthly distributions of net investment income to common shareholders, after payment of any dividends on any outstanding VRTP Shares. In addition, at least annually, the Fund intends to distribute all or substantially all of its net realized capital gains. Distributions to common shareholders are recorded on the ex-dividend date. Dividends to VRTP shareholders are accrued daily and payable monthly. The dividend rate on the VRTP Shares at November 30, 2013 was 0.17%. The amount of dividends accrued and the average annual dividend rate of the VRTP Shares during the portion of the period ended November 30, 2013 in which the VRTP Shares were outstanding were $203,079 and 0.21%, respectively.
The Fund distinguishes between distributions on a tax basis and a financial reporting basis. Accounting principles generally accepted in the United States of America require that only distributions in excess of tax basis earnings and profits be reported in the financial statements as a return of capital. Permanent differences between book and tax accounting relating to distributions are reclassified to paid-in capital. For tax purposes, distributions from short-term capital gains are considered to be from ordinary income.
4 Investment Adviser Fee and Other Transactions with Affiliates
The investment adviser fee is earned by EVM as compensation for investment advisory services rendered to the Fund. The fee is computed at an annual rate of 0.75% of the Fund’s average daily total managed assets and is payable monthly. Total managed assets as referred to herein represent total assets of the Fund (including assets attributable to borrowings, any outstanding preferred shares, or other forms of leverage) less accrued liabilities (other than liabilities representing borrowings or such other forms of leverage). For the period ended November 30, 2013, the investment adviser fee amounted to $684,025. The Fund invests its cash in Cash Reserves Fund. EVM does not currently receive a fee for advisory services provided to Cash Reserves Fund. EVM also serves as administrator of the Fund, but receives no compensation.
Trustees and officers of the Fund who are members of EVM’s organization receive remuneration for their services to the Fund out of the investment adviser fee. Trustees of the Fund who are not affiliated with EVM may elect to defer receipt of all or a percentage of their annual fees in accordance with the terms of the Trustees Deferred Compensation Plan. For the period ended November 30, 2013, no significant amounts have been deferred. Certain officers and Trustees of the Fund are officers of EVM.
Eaton Vance
Floating-Rate Income Plus Fund
November 30, 2013
Notes to Financial Statements (Unaudited) — continued
5 Purchases and Sales of Investments
Purchases and sales of investments, other than short-term obligations and including maturities, paydowns and principal repayments on Senior Loans, aggregated $262,924,513 and $32,516,141, respectively, for the period ended November 30, 2013.
6 Common Shares of Beneficial Interest
In connection with the initial public offering of the Fund’s common shares, the underwriters were granted an option to purchase additional common shares at a price of $19.10 (after deduction of the sales load). Additional shares were issued by the Fund on August 9, 2013 pursuant to the exercise of the over-allotment option. The Fund’s net asset value per share on such date was $19.32, resulting in a discount of $186,624. The Fund may issue common shares pursuant to its dividend reinvestment plan. Transactions in common shares were as follows:
| | | | |
| | | Period Ended
November 30, 2013
(Unaudited)(1) | |
| |
Sales (initial public offering) | | | 6,750,000 | |
Exercise of over-allotment option by underwriters | | | 848,291 | |
Issued to shareholders electing to receive payments of distributions in Fund shares | | | 3,131 | |
| |
Net increase | | | 7,601,422 | |
| (1) | For the period from the start of business, June 28, 2013, to November 30, 2013. |
On November 11, 2013, the Board of Trustees of the Fund authorized the repurchase by the Fund of up to 10% of its then currently outstanding common shares in open-market transactions at a discount to net asset value. The repurchase program does not obligate the Fund to purchase a specific amount of shares. There were no repurchases of common shares by the Fund for the period ended November 30, 2013.
7 Federal Income Tax Basis of Investments
The cost and unrealized appreciation (depreciation) of investments of the Fund at November 30, 2013, as determined on a federal income tax basis, were as follows:
| | | | |
| |
Aggregate cost | | $ | 237,502,354 | |
| |
Gross unrealized appreciation | | $ | 3,238,243 | |
Gross unrealized depreciation | | | (700,615 | ) |
| |
Net unrealized appreciation | | $ | 2,537,628 | |
8 Revolving Credit and Security Agreement
On July 10, 2013, the Fund entered into a Revolving Credit and Security Agreement, as amended (the Agreement) with conduit lenders and a bank to borrow up to $54 million. Borrowings under the Agreement are secured by the assets of the Fund. Interest is charged at a rate above the conduits’ commercial paper issuance rate and is payable monthly. Under the terms of the Agreement, in effect through July 9, 2014, the Fund also pays a program fee of 0.80% per annum on its outstanding borrowings to administer the facility and a liquidity fee of 0.15% (0.25% if the outstanding loan amount is less than or equal to 50% of the total facility size) per annum on the borrowing limit under the Agreement. Program and liquidity fees for the period ended November 30, 2013 totaled $170,994 and are included in interest expense and fees on the Statement of Operations. The Fund is required to maintain certain net asset levels during the term of the Agreement. At November 30, 2013, the Fund had borrowings outstanding under the Agreement of $54,000,000 at an interest rate of 0.17%. Based on the short-term nature of the borrowings under the Agreement and the variable interest rate, the carrying amount of the borrowings at November 30, 2013 approximated its fair value. If measured at fair value, borrowings under the Agreement would have been considered as Level 2 in the fair value hierarchy (see Note 11) at November 30, 2013. For the period from July 10, 2013 through November 30, 2013, the average borrowings under the Agreement and the average annual interest rate (excluding fees) were $41,951,389 and 0.21%, respectively.
Eaton Vance
Floating-Rate Income Plus Fund
November 30, 2013
Notes to Financial Statements (Unaudited) — continued
9 Risks Associated with Foreign Investments
Investing in securities issued by companies whose principal business activities are outside the United States may involve significant risks not present in domestic investments. For example, there is generally less publicly available information about foreign companies, particularly those not subject to the disclosure and reporting requirements of the U.S. securities laws. Certain foreign issuers are generally not bound by uniform accounting, auditing, and financial reporting requirements and standards of practice comparable to those applicable to domestic issuers. Investments in foreign securities also involve the risk of possible adverse changes in investment or exchange control regulations, expropriation or confiscatory taxation, limitation on the removal of funds or other assets of the Fund, political or financial instability or diplomatic and other developments which could affect such investments. Foreign securities markets, while growing in volume and sophistication, are generally not as developed as those in the United States, and securities of some foreign issuers (particularly those located in developing countries) may be less liquid and more volatile than securities of comparable U.S. companies. In general, there is less overall governmental supervision and regulation of foreign securities markets, broker/dealers and issuers than in the United States.
10 Credit Risk
The Fund invests primarily in below investment grade floating-rate loans, which are considered speculative because of the credit risk of their issuers. Changes in economic conditions or other circumstances are more likely to reduce the capacity of issuers of these securities to make principal and interest payments. Such companies are more likely to default on their payments of interest and principal owed than issuers of investment grade bonds. An economic downturn generally leads to a higher non-payment rate, and a loan or other debt obligation may lose significant value before a default occurs. Lower rated investments also may be subject to greater price volatility than higher rated investments. Moreover, the specific collateral used to secure a loan may decline in value or become illiquid, which would adversely affect the loan’s value.
11 Fair Value Measurements
Under generally accepted accounting principles for fair value measurements, a three-tier hierarchy to prioritize the assumptions, referred to as inputs, is used in valuation techniques to measure fair value. The three-tier hierarchy of inputs is summarized in the three broad levels listed below.
| Ÿ | | Level 1 – quoted prices in active markets for identical investments |
| Ÿ | | Level 2 – other significant observable inputs (including quoted prices for similar investments, interest rates, prepayment speeds, credit risk, etc.) |
| Ÿ | | Level 3 – significant unobservable inputs (including a fund’s own assumptions in determining the fair value of investments) |
In cases where the inputs used to measure fair value fall in different levels of the fair value hierarchy, the level disclosed is determined based on the lowest level input that is significant to the fair value measurement in its entirety. The inputs or methodology used for valuing securities are not necessarily an indication of the risk associated with investing in those securities.
At November 30, 2013, the hierarchy of inputs used in valuing the Fund’s investments, which are carried at value, were as follows:
| | | | | | | | | | | | | | | | |
| Asset Description | | Level 1 | | | Level 2 | | | Level 3 | | | Total | |
| | | | |
Senior Floating-Rate Interests (Less Unfunded Loan Commitments) | | $ | — | | | $ | 199,555,281 | | | $ | — | | | $ | 199,555,281 | |
Corporate Bonds & Notes | | | — | | | | 17,915,640 | | | | — | | | | 17,915,640 | |
Foreign Government Bonds | | | — | | | | 500,211 | | | | — | | | | 500,211 | |
Convertible Bonds | | | — | | | | 2,990,081 | | | | — | | | | 2,990,081 | |
Common Stocks | | | 8,081,774 | | | | 357,189 | * | | | — | | | | 8,438,963 | |
Convertible Preferred Stocks | | | 441,752 | | | | 1,874,150 | | | | — | | | | 2,315,902 | |
Preferred Stocks | | | — | | | | 740,681 | | | | — | | | | 740,681 | |
Tax-Exempt Investments | | | — | | | | 1,009,134 | | | | — | | | | 1,009,134 | |
Short-Term Investments | | | — | | | | 6,574,089 | | | | — | | | | 6,574,089 | |
| | | | |
Total Investments | | $ | 8,523,526 | | | $ | 231,516,456 | | | $ | — | | | $ | 240,039,982 | |
| * | Includes foreign equity securities whose values were adjusted to reflect market trading of comparable securities or other correlated instruments that occurred after the close of trading in their applicable foreign markets. |
Eaton Vance
Floating-Rate Income Plus Fund
November 30, 2013
Dividend Reinvestment Plan
The Fund offers a dividend reinvestment plan (Plan) pursuant to which shareholders automatically have distributions reinvested in common shares (Shares) of the Fund unless they elect otherwise through their investment dealer. On the distribution payment date, if the NAV per Share is equal to or less than the market price per Share plus estimated brokerage commissions, then new Shares will be issued. The number of Shares shall be determined by the greater of the NAV per Share or 95% of the market price. Otherwise, Shares generally will be purchased on the open market by American Stock Transfer & Trust Company, the Plan agent (Agent). Distributions subject to income tax (if any) are taxable whether or not Shares are reinvested.
If your Shares are in the name of a brokerage firm, bank, or other nominee, you can ask the firm or nominee to participate in the Plan on your behalf. If the nominee does not offer the Plan, you will need to request that the Fund’s transfer agent re-register your Shares in your name or you will not be able to participate.
The Agent’s service fee for handling distributions will be paid by the Fund. Plan participants will be charged their pro rata share of brokerage commissions on all open-market purchases.
Plan participants may withdraw from the Plan at any time by writing to the Agent at the address noted on the following page. If you withdraw, you will receive Shares in your name for all Shares credited to your account under the Plan. If a participant elects by written notice to the Agent to sell part or all of his or her Shares and remit the proceeds, the Agent is authorized to deduct a $5.00 fee plus brokerage commissions from the proceeds.
If you wish to participate in the Plan and your Shares are held in your own name, you may complete the form on the following page and deliver it to the Agent. Any inquiries regarding the Plan can be directed to the Agent at 1-866-439-6787.
Eaton Vance
Floating-Rate Income Plus Fund
November 30, 2013
Application for Participation in Dividend Reinvestment Plan
This form is for shareholders who hold their common shares in their own names. If your common shares are held in the name of a brokerage firm, bank, or other nominee, you should contact your nominee to see if it will participate in the Plan on your behalf. If you wish to participate in the Plan, but your brokerage firm, bank, or nominee is unable to participate on your behalf, you should request that your common shares be re-registered in your own name which will enable your participation in the Plan.
The following authorization and appointment is given with the understanding that I may terminate it at any time by terminating my participation in the Plan as provided in the terms and conditions of the Plan.
Please print exact name on account:
Shareholder signature Date
Shareholder signature Date
Please sign exactly as your common shares are registered. All persons whose names appear on the share certificate must sign.
YOU SHOULD NOT RETURN THIS FORM IF YOU WISH TO RECEIVE YOUR DISTRIBUTIONS IN CASH. THIS IS NOT A PROXY.
This authorization form, when signed, should be mailed to the following address:
Eaton Vance Floating-Rate Income Plus Fund
c/o American Stock Transfer & Trust Company
P.O. Box 922
Wall Street Station
New York, NY 10269-0560
Number of Employees
The Fund is organized as a Massachusetts business trust and is registered under the Investment Company Act of 1940, as amended, as a diversified, closed-end management investment company and has no employees.
Number of Shareholders
As of November 30, 2013, Fund records indicate that there are 3 registered shareholders and no shareholders owning the Fund shares in street name, such as through brokers, banks, and financial intermediaries.
If you are a street name shareholder and wish to receive Fund reports directly, which contain important information about the Fund, please write or call:
Eaton Vance Distributors, Inc.
Two International Place
Boston, MA 02110
1-800-262-1122
New York Stock Exchange MKT Symbol
The New York Stock Exchange MKT symbol is EFF.
Eaton Vance
Floating-Rate Income Plus Fund
November 30, 2013
Board of Trustees’ Contract Approval
Overview of the Contract Review Process
The Investment Company Act of 1940, as amended (the “1940 Act”), provides, in substance, that for a fund to enter into an investment advisory agreement with an investment adviser, the fund’s board of trustees, including a majority of the trustees who are not “interested persons” of the fund (“Independent Trustees”), must approve the agreement and its terms at an in-person meeting called for the purpose of considering such approval.
At a meeting of the Boards of Trustees (each a “Board”) of the Eaton Vance group of mutual funds (the “Eaton Vance Funds”) held on June 10, 2013, the Board, including a majority of the Independent Trustees, voted to approve the investment advisory and administrative agreement of Eaton Vance Floating-Rate Income Plus Fund (the “Fund”), with Eaton Vance Management (the “Adviser”). The Board reviewed information furnished with respect to the Fund at its meetings of April 22, 2013 and June 10, 2013, as well as information previously furnished throughout the year at meetings of the Board and its committees, including with respect to the approval of other investment advisory agreements for other Eaton Vance Funds. Such information included, among other things, the following:
Information about Fees and Expenses
| Ÿ | | The advisory and related fees to be paid by the Fund and the anticipated expense ratio of the Fund; |
| Ÿ | | Comparative information concerning the fees charged and the services provided by the Adviser in managing other accounts (including mutual funds, other collective investment funds and institutional accounts) using investment strategies and techniques similar to those to be used in managing the Fund, if applicable, and concerning fees charged by other advisers for managing funds similar to the Fund; |
Information about Portfolio Management and Trading
| Ÿ | | Descriptions of the investment management services to be provided to the Fund, including the investment strategies and processes to be employed; |
| Ÿ | | Information concerning the allocation of brokerage and the benefits expected to be received by the Adviser as a result of brokerage allocation for the Fund, including information concerning the acquisition of research through client commission arrangements and the Fund’s policies with respect to “soft dollar” arrangements; |
| Ÿ | | Information about the Adviser’s processes for monitoring best execution of portfolio transactions, and other policies and practices of the Adviser with respect to trading; |
| Ÿ | | The procedures and processes to be used to determine the fair value of the Fund’s assets and actions to be taken to monitor and test the effectiveness of such procedures and processes; |
Information about the Adviser
| Ÿ | | Reports detailing the financial results and condition of the Adviser; |
| Ÿ | | Descriptions of the qualifications, education and experience of the individual investment professionals whose responsibilities include portfolio management and investment research for the Fund, and information relating to their compensation and responsibilities with respect to managing other mutual funds and investment accounts; |
| Ÿ | | Copies of the Codes of Ethics of the Adviser and its affiliates, together with information relating to compliance with and the administration of such codes; |
| Ÿ | | Copies of or descriptions of the Adviser’s policies and procedures relating to proxy voting and the handling of corporate actions and class actions; |
| Ÿ | | Information concerning the resources devoted to compliance efforts undertaken by the Adviser and its affiliates on behalf of the Eaton Vance Funds (including descriptions of various compliance programs) and their record of compliance with investment policies and restrictions, including policies with respect to market-timing, late trading and selective portfolio disclosure, and with policies on personal securities transactions; |
| Ÿ | | Descriptions of the business continuity and disaster recovery plans of the Adviser and its affiliates; |
Other Relevant Information
| Ÿ | | Information concerning the nature, cost and character of the administrative and other non-investment management services to be provided by Eaton Vance Management and its affiliates; |
| Ÿ | | Information concerning management of the relationship with the custodian, subcustodians and fund accountants by the Adviser (which is the administrator); and |
| Ÿ | | The terms of the investment advisory and administrative agreement of the Fund. |
Results of the Process
Based on its consideration of the foregoing, and such other information as it deemed relevant, including the factors and conclusions described below, the Board concluded that the terms of the Fund’s investment advisory and administrative agreement with the Adviser, including its fee structure, is in the interests of shareholders and, therefore, the Board, including a majority of the Independent Trustees, voted to approve the terms of the investment advisory and administrative agreement for the Fund.
Eaton Vance
Floating-Rate Income Plus Fund
November 30, 2013
Board of Trustees’ Contract Approval — continued
Nature, Extent and Quality of Services
In considering whether to approve the investment advisory and administrative agreement of the Fund, the Board evaluated the nature, extent and quality of services to be provided to the Fund by the Adviser.
The Board considered the Adviser’s management capabilities and investment process with respect to the types of investments to be held by the Fund, including the education, experience and number of its investment professionals and other personnel who will provide portfolio management, investment research, and similar services to the Fund. In particular, the Board considered the abilities and experience of such investment personnel in analyzing special considerations relevant to investing in senior floating rate loans and other income-producing investments. The Board noted the experience of the Adviser’s large group of bank loan investment professionals and other personnel who provide services to the Fund, including portfolio managers and analysts. The Board also took into account the resources dedicated to portfolio management and other services, including the compensation methods of the Adviser to recruit and retain investment personnel, and the time and attention expected to be devoted to Fund matters by senior management.
The Board reviewed the compliance programs of the Adviser and relevant affiliates thereof. Among other matters, the Board considered compliance and reporting matters relating to personal trading by investment personnel, selective disclosure of portfolio holdings, late trading, frequent trading, portfolio valuation, business continuity and the allocation of investment opportunities. The Board also evaluated the responses of the Adviser and its affiliates to requests in recent years from regulatory authorities such as the Securities and Exchange Commission and the Financial Industry Regulatory Authority.
The Board considered shareholder and other administrative services provided or managed by the Adviser and its affiliates, including transfer agency and accounting services. The Board evaluated the benefits to shareholders of investing in a fund that is a part of a large family of funds.
After consideration of the foregoing factors, among others, the Board concluded that the nature, extent and quality of services to be provided by the Adviser, taken as a whole, are appropriate and consistent with the terms of the investment advisory and administrative agreement.
Fund Performance
Because the Fund had not yet commenced operations when the contract was approved, it had no performance record.
Management Fees and Expenses
The Board reviewed contractual fee rates to be payable by the Fund for advisory and administrative services (referred to as “management fees”). As part of its review, the Board considered the Fund’s management fees as compared to a group of similarly managed funds selected by an independent data provider and the Fund’s estimated expense ratio for a one-year period.
After reviewing the foregoing information, and in light of the nature, extent and quality of the services to be provided by the Adviser, the Board concluded that the management fees proposed to be charged for advisory and related services are reasonable.
Profitability
The Board reviewed the level of profits projected to be realized by the Adviser and relevant affiliates thereof in providing investment advisory and administrative services to the Fund. The Board considered the level of profits expected to be realized without regard to revenue sharing or other payments expected to be made by the Adviser and its affiliates to third parties in respect of distribution services. The Board also considered other direct or indirect benefits expected to be received by the Adviser and its affiliates in connection with their relationships with the Fund, including the benefits of research services that may be available to the Adviser as a result of securities transactions effected for the Fund and other investment advisory clients.
The Board concluded that, in light of the foregoing factors and the nature, extent and quality of the services to be rendered, the profits expected to be realized by the Adviser and its affiliates are reasonable.
Economies of Scale
In reviewing management fees and profitability, the Board also considered the extent to which the Adviser and its affiliates, on the one hand, and the Fund, on the other hand, can expect to realize benefits from economies of scale as the assets of the Fund increase. The Board acknowledged the difficulty in accurately measuring the benefits resulting from the economies of scale with respect to the management of any specific fund or group of funds. Based upon the foregoing, the Board concluded that the Fund can be expected to share in the benefits from economies of scale in the future. The Board also considered the fact that the Fund is not continuously offered and that the Fund’s assets are not expected to increase materially in the foreseeable future. The Board concluded that, in light of the level of the Adviser’s expected profits with respect to the Fund, the implementation of breakpoints in the advisory fee schedule is not appropriate at this time.
Eaton Vance
Floating-Rate Income Plus Fund
November 30, 2013
Officers and Trustees
Officers of Eaton Vance Floating-Rate Income Plus Fund
Scott H. Page
President
Maureen A. Gemma
Vice President, Secretary and
Chief Legal Officer
James F. Kirchner
Treasurer
Paul M. O’Neil
Chief Compliance Officer
Trustees of Eaton Vance Floating-Rate Income Plus Fund
Ralph F. Verni
Chairman
Scott E. Eston
Thomas E. Faust Jr.*
Allen R. Freedman
Valerie A. Mosley
William H. Park
Ronald A. Pearlman
Helen Frame Peters
Lynn A. Stout
Harriett Tee Taggart
Eaton Vance Funds
IMPORTANT NOTICES
Privacy. The Eaton Vance organization is committed to ensuring your financial privacy. Each of the financial institutions identified below has in effect the following policy (“Privacy Policy”) with respect to nonpublic personal information about its customers:
| Ÿ | | Only such information received from you, through application forms or otherwise, and information about your Eaton Vance fund transactions will be collected. This may include information such as name, address, social security number, tax status, account balances and transactions. |
| Ÿ | | None of such information about you (or former customers) will be disclosed to anyone, except as permitted by law (which includes disclosure to employees necessary to service your account). In the normal course of servicing a customer’s account, Eaton Vance may share information with unaffiliated third parties that perform various required services such as transfer agents, custodians and broker-dealers. |
| Ÿ | | Policies and procedures (including physical, electronic and procedural safeguards) are in place that are designed to protect the confidentiality of such information. |
| Ÿ | | We reserve the right to change our Privacy Policy at any time upon proper notification to you. Customers may want to review our Privacy Policy periodically for changes by accessing the link on our homepage: www.eatonvance.com. |
Our pledge of privacy applies to the following entities within the Eaton Vance organization: the Eaton Vance Family of Funds, Eaton Vance Management, Eaton Vance Investment Counsel, Eaton Vance Distributors, Inc., Eaton Vance Trust Company, Eaton Vance Management’s Real Estate Investment Group and Boston Management and Research. In addition, our Privacy Policy applies only to those Eaton Vance customers who are individuals and who have a direct relationship with us. If a customer’s account (i.e., fund shares) is held in the name of a third-party financial advisor/broker-dealer, it is likely that only such advisor’s privacy policies apply to the customer. This notice supersedes all previously issued privacy disclosures. For more information about Eaton Vance’s Privacy Policy, please call 1-800-262-1122.
Delivery of Shareholder Documents. The Securities and Exchange Commission (SEC) permits funds to deliver only one copy of shareholder documents, including prospectuses, proxy statements and shareholder reports, to fund investors with multiple accounts at the same residential or post office box address. This practice is often called “householding” and it helps eliminate duplicate mailings to shareholders. Eaton Vance, or your financial advisor, may household the mailing of your documents indefinitely unless you instruct Eaton Vance, or your financial advisor, otherwise. If you would prefer that your Eaton Vance documents not be householded, please contact Eaton Vance at 1-800-262-1122, or contact your financial advisor. Your instructions that householding not apply to delivery of your Eaton Vance documents will be effective within 30 days of receipt by Eaton Vance or your financial advisor.
Portfolio Holdings. Each Eaton Vance Fund and its underlying Portfolio(s) (if applicable) will file a schedule of portfolio holdings on Form N-Q with the SEC for the first and third quarters of each fiscal year. The Form N-Q will be available on the Eaton Vance website at www.eatonvance.com, by calling Eaton Vance at 1-800-262-1122 or in the EDGAR database on the SEC’s website at www.sec.gov. Form N-Q may also be reviewed and copied at the SEC’s public reference room in Washington, D.C. (call 1-800-732-0330 for information on the operation of the public reference room).
Proxy Voting. From time to time, funds are required to vote proxies related to the securities held by the funds. The Eaton Vance Funds or their underlying Portfolios (if applicable) vote proxies according to a set of policies and procedures approved by the Funds’ and Portfolios’ Boards. You may obtain a description of these policies and procedures and information on how the Funds or Portfolios voted proxies relating to portfolio securities during the most recent 12-month period ended June 30, without charge, upon request, by calling 1-800-262-1122 and by accessing the SEC’s website at www.sec.gov.
Share Repurchase Program. On November 11, 2013, the Fund’s Board of Trustees approved a share repurchase program authorizing the Fund to repurchase up to 10% of its currently outstanding common shares in open-market transactions at a discount to net asset value. The repurchase program does not obligate the Fund to purchase a specific amount of shares. The Fund’s repurchase activity, including the number of shares purchased, average price and average discount to net asset value, will be disclosed in the Fund’s annual and semi-annual reports to shareholders.
Additional Notice to Shareholders. If applicable, a Fund may redeem or purchase its outstanding preferred shares in order to maintain compliance with regulatory requirements, borrowing or rating agency requirements or for other purposes as it deems appropriate or necessary.
Closed-End Fund Information. Eaton Vance closed-end funds make fund performance data and certain information about portfolio characteristics available on the Eaton Vance website shortly after the end of each month. The funds’ net asset value per share is readily accessible on the Eaton Vance website. Portfolio holdings for the most recent month-end are also posted to the website approximately 30 days following the end of the month. This information is available at www.eatonvance.com on the fund information pages under “Individual Investors — Closed-End Funds”.
This Page Intentionally Left Blank
Investment Adviser and Administrator
Eaton Vance Management
Two International Place
Boston, MA 02110
Custodian
State Street Bank and Trust Company
200 Clarendon Street
Boston, MA 02116
Transfer Agent
American Stock Transfer & Trust Company
6201 15th Avenue
Brooklyn, NY 11219
Fund Offices
Two International Place
Boston, MA 02110
Item 2. Code of Ethics
Not required in this filing.
Item 3. Audit Committee Financial Expert
Not required in this filing.
Item 4. Principal Accountant Fees and Services
Not required in this filing.
Item 5. Audit Committee of Listed Registrants
Not required in this filing.
Item 6. Schedule of Investments
Please see schedule of investments contained in the Report to Stockholders included under Item 1 of this Form N-CSR.
Item 7. Disclosure of Proxy Voting Policies and Procedures for Closed-End Management Investment Companies
Not required in this filing.
Item 8. Portfolio Managers of Closed-End Management Investment Companies
Not required in this filing.
Item 9. Purchases of Equity Securities by Closed-End Management Investment Company and Affiliated Purchasers
No such purchases this period.
Item 10. Submission of Matters to a Vote of Security Holders
No material changes.
Item 11. Controls and Procedures
(a) It is the conclusion of the registrant’s principal executive officer and principal financial officer that the effectiveness of the registrant’s current disclosure controls and procedures (such disclosure controls and procedures having been evaluated within 90 days of the date of this filing) provide reasonable assurance that the information required to be disclosed by the registrant has been recorded, processed, summarized and reported within the time period specified in the Commission’s rules and forms and that the information required to be disclosed by the registrant has been accumulated and communicated to the registrant’s principal executive officer and principal financial officer in order to allow timely decisions regarding required disclosure.
(b) There have been no changes in the registrant’s internal controls over financial reporting during the second fiscal quarter of the period covered by this report that has materially affected, or is reasonably likely to materially affect, the registrant’s internal control over financial reporting.
Item 12. Exhibits
| | |
| (a)(1) | | Registrant’s Code of Ethics – Not applicable (please see Item 2). |
| (a)(2)(i) | | Treasurer’s Section 302 certification. |
| (a)(2)(ii) | | President’s Section 302 certification. |
| (b) | | Combined Section 906 certification. |
Signatures
Pursuant to the requirements of the Securities Exchange Act of 1934 and the Investment Company Act of 1940, the registrant has duly caused this report to be signed on its behalf by the undersigned, thereunto duly authorized.
Eaton Vance Floating-Rate Income Plus Fund
| | |
| By: | | /s/ Scott H. Page |
| | Scott H. Page |
| | President |
|
| Date: January 8, 2014 |
Pursuant to the requirements of the Securities Exchange Act of 1934 and the Investment Company Act of 1940, this report has been signed below by the following persons on behalf of the registrant and in the capacities and on the dates indicated.
| | |
| By: | | /s/ James F. Kirchner |
| | James F. Kirchner |
| | Treasurer |
|
| Date: January 8, 2014 |
| |
| By: | | /s/ Scott H. Page |
| | Scott H. Page |
| | President |
|
| Date: January 8, 2014 |