
Investor Presentation – June 2016

Certain statements and assumptions in this presentation contain or are based upon “forward-looking” information and are being made pursuant to the safe harbor provisions of the Private Securities Litigation Reform Act of 1995. These forward-looking statements are subject to risks and uncertainties. When we use the words “will likely result,” “may,” “anticipate,” “estimate,” “should,” “expect,” “believe,” “intend,” or similar expressions, we intend to identify forward-looking statements. Such forward-looking statements include, but are not limited to, our business and investment strategy, our understanding of our competition, current market trends and opportunities, and projected capital expenditures. Such statements are subject to numerous assumptions and uncertainties, many of which are outside of our control. These forward-looking statements are subject to known and unknown risks and uncertainties, which could cause actual results to differ materially from those anticipated, including, without limitation: general volatility of the capital markets, the general economy or the hospitality industry, whether the result of market events or otherwise; our ability to deploy capital and raise additional capital at reasonable costs to repay debts, invest in our properties and fund future acquisitions; unanticipated increases in financing and other costs, including a rise in interest rates; the degree and nature of our competition; actual and potential conflicts of interest with Ashford Hospitality Trust, Inc., Ashford Hospitality Advisors, LLC (“Ashford LLC”), Ashford Inc., Remington Lodging & Hospitality, LLC, our executive officers and our non-independent directors; our ability to implement and execute on planned initiatives announced in connection with the conclusion of our independent directors’ strategic review process; changes in personnel of Ashford LLC or the lack of availability of qualified personnel; changes in governmental regulations, accounting rules, tax rates and similar matters; legislative and regulatory changes, including changes to the Internal Revenue Code and related rules, regulations and interpretations governing the taxation of real estate investment trusts (“REITs”); and limitations imposed on our business and our ability to satisfy complex rules in order for us to qualify as a REIT for U.S. federal income tax purposes. These and other risk factors are more fully discussed in the section entitled “Risk Factors” in our Annual Report on Form 10-K, and from time to time, in our other filings with the Securities and Exchange Commission (“SEC”). The forward-looking statements included in this presentation are only made as of the date of this presentation. Investors should not place undue reliance on these forward-looking statements. We are not obligated to publicly update or revise any forward-looking statements, whether as a result of new information, future events or circumstances, changes in expectations or otherwise. EBITDA is defined as net income before interest, taxes, depreciation and amortization. EBITDA yield is defined as trailing twelve month EBITDA divided by the purchase price. A capitalization rate is determined by dividing the property's net operating income by the purchase price. Net operating income is the property's funds from operations minus a capital expense reserve of either 4% or 5% of gross revenues. Hotel EBITDA flow-through is the change in Hotel EBITDA divided by the change in total revenues. EBITDA, FFO, AFFO, CAD and other terms are non-GAAP measures, reconciliations of which have been provided in prior earnings releases and filings with the SEC. This overview is for informational purposes only and is not an offer to sell, or a solicitation of an offer to buy or sell, any securities of Ashford Prime or any of its respective affiliates, and may not be relied upon in connection with the purchase or sale of any such security. Additional Information and Where to Find It Ashford Hospitality Prime, Inc. (“Ashford Prime”), its directors, executive officers and other employees may be deemed to be participants in the solicitation of proxies from Ashford Prime’s stockholders in connection with its 2016 Annual Meeting of Stockholders (the “2016 Annual Meeting”). Stockholders may obtain information regarding the names, affiliations and interests of such individuals in Ashford Prime’s definitive proxy statement, filed with the SEC on April 25, 2016. Additional information regarding the identity of potential participants, and their direct or indirect interests, by security holdings or otherwise, is set forth in the definitive proxy statement and, to the extent applicable, will be updated in other materials to be filed with the SEC in connection with Ashford Prime’s 2016 Annual Meeting. Ashford Prime has filed a definitive proxy statement in connection with the 2016 Annual Meeting. ASHFORD PRIME STOCKHOLDERS ARE STRONGLY URGED TO READ THE DEFINITIVE PROXY STATEMENT, THE ACCOMPANYING GOLD PROXY CARD AND OTHER RELEVANT DOCUMENTS FILED BY ASHFORD PRIME WITH THE SEC IN THEIR ENTIRETY BECAUSE THEY WILL CONTAIN IMPORTANT INFORMATION. The definitive proxy statement and an accompanying GOLD proxy card are, along with other relevant documents, available at no charge on the SEC’s website at www.sec.gov. Copies of these documents will also be available free of charge from Ashford Prime by directing a request to Ashford Hospitality Prime, Inc., Attn: Investor Relations, 14185 Dallas Parkway, Suite 1100, Dallas, Texas 75254 or by calling (972) 490-9600. 2 Certain Disclosures
Background on Ashford Prime 3 Ashford Hospitality Prime, Inc. ("Ashford Prime" or the "Company")(NYSE: AHP) was created in November 2013 through a spin-off of 8 high quality hotels from Ashford Hospitality Trust, Inc. ("Ashford Trust")(NYSE: AHT) The spin-off was a way to unlock value for stockholders Our strategy: invest in high RevPAR, high quality luxury hotels in gateway and resort markets AHP was designed to have an external manager, Ashford Inc. (NYSE MKT: AINC) Lower cost than if internally advised An incentive structure for AINC that is aligned with AHP market performance Management team has a long, successful track record Superior long-term total shareholder returns vs. peers Extensive experience in managing lodging investments over multiple cycles Ashford Prime is majority controlled by a set of experienced, independent directors The Company has among the highest insider equity ownership among its peers Recently, the Board completed a wide ranging and thorough review of strategic alternatives The Board has taken several steps to maximize value for shareholders and continues to evaluate a number of initiatives – including a new CEO and additional independent Board members
Recent Updates 4 In May 2016 the US District Court for the Northern District of Texas rejected Sessa's motion for preliminary injunction ending the proxy contest Proxy advisory firm Glass Lewis recommends Ashford Prime stockholders vote "FOR" all Ashford Prime Directors Excellent progress on strategic alternatives to enhance shareholder value
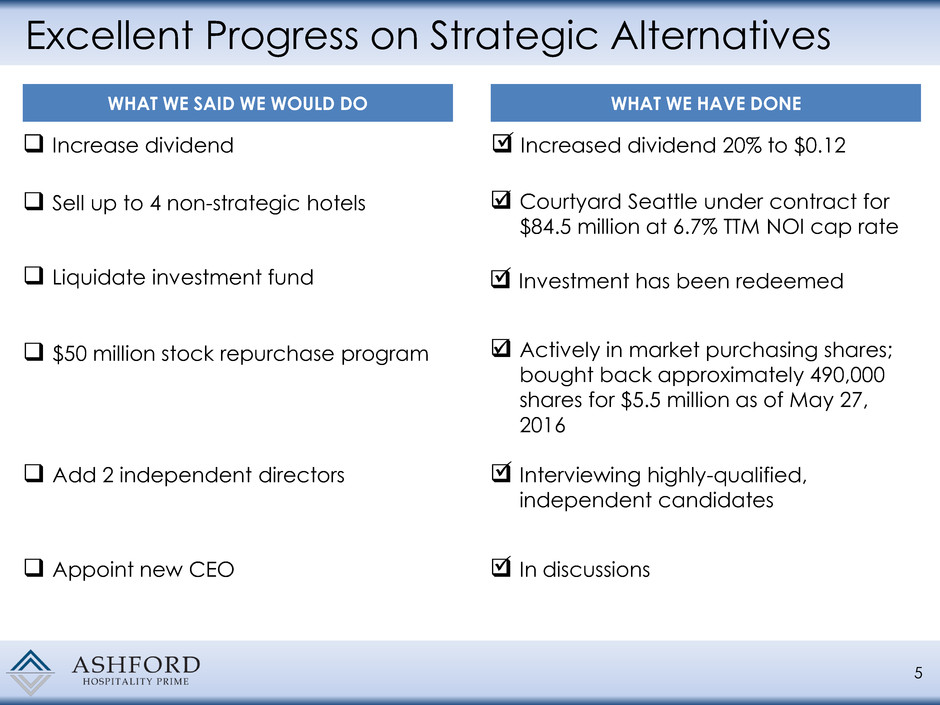
In discussions Interviewing highly-qualified, independent candidates Actively in market purchasing shares; bought back approximately 490,000 shares for $5.5 million as of May 27, 2016 Investment has been redeemed Increased dividend 20% to $0.12 Courtyard Seattle under contract for $84.5 million at 6.7% TTM NOI cap rate Excellent Progress on Strategic Alternatives 5 Increase dividend WHAT WE SAID WE WOULD DO Sell up to 4 non-strategic hotels Liquidate investment fund $50 million stock repurchase program Add 2 independent directors Appoint new CEO WHAT WE HAVE DONE
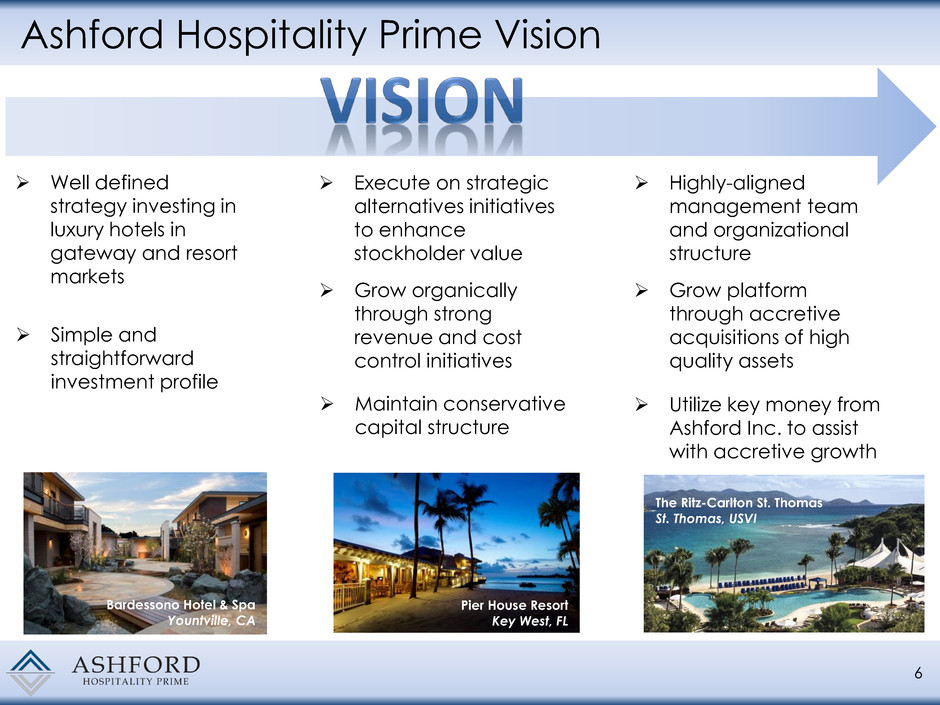
Ashford Hospitality Prime Vision Well defined strategy investing in luxury hotels in gateway and resort markets 6 Bardessono Hotel & Spa Yountville, CA Pier House Resort Key West, FL The Ritz-Carlton St. Thomas St. Thomas, USVI Grow platform through accretive acquisitions of high quality assets Highly-aligned management team and organizational structure Simple and straightforward investment profile Grow organically through strong revenue and cost control initiatives Maintain conservative capital structure Execute on strategic alternatives initiatives to enhance stockholder value Utilize key money from Ashford Inc. to assist with accretive growth

7 STRONG OPERATIONAL PERFORMANCE 7.3% RevPAR growth in 2015 was the highest amongst our peers Portfolio RevPAR of $199 in 2015 is second amongst our peers 1.4% 3.3% 4.7% 5.7% 5.9% 7.3% 1.0% 2.0% 3.0% 4.0% 5.0% 6.0% 7.0% 8.0% LHO PEB DRH CHSP SHO AHP $162 $171 $186 $194 $199 $205 $150.00 $160.00 $170.00 $180.00 $190.00 $200.00 $210.00 SHO DRH CHSP LHO AHP PEB AHP Leadership Has Delivered Results in Operational Excellence
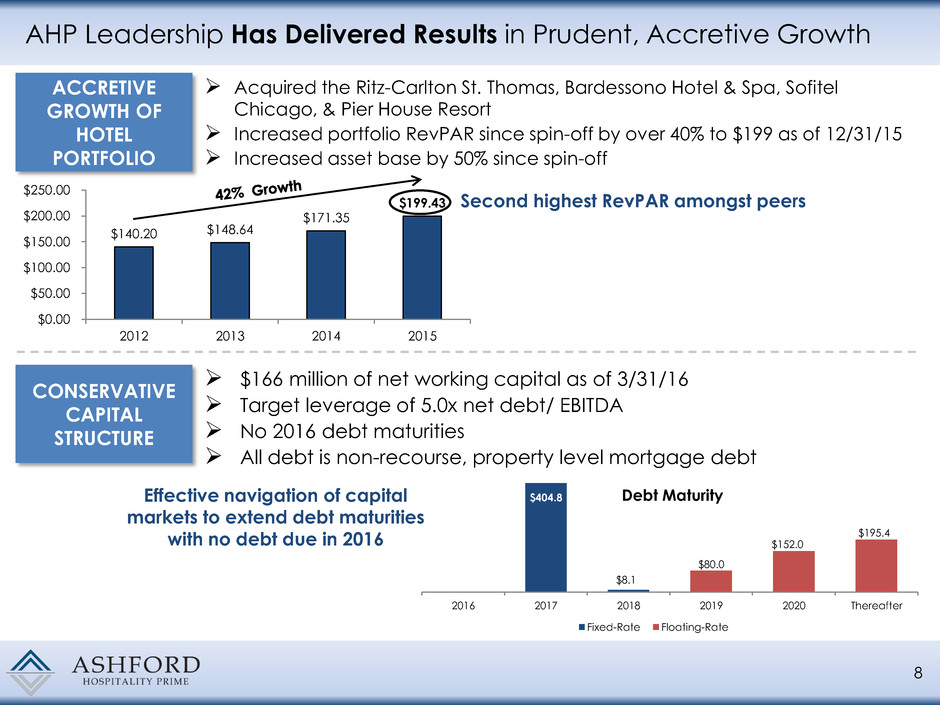
$140.20 $148.64 $171.35 $199.43 $0.00 $50.00 $100.00 $150.00 $200.00 $250.00 2012 2013 2014 2015 8 AHP Leadership Has Delivered Results in Prudent, Accretive Growth ACCRETIVE GROWTH OF HOTEL PORTFOLIO CONSERVATIVE CAPITAL STRUCTURE Acquired the Ritz-Carlton St. Thomas, Bardessono Hotel & Spa, Sofitel Chicago, & Pier House Resort Increased portfolio RevPAR since spin-off by over 40% to $199 as of 12/31/15 Increased asset base by 50% since spin-off $166 million of net working capital as of 3/31/16 Target leverage of 5.0x net debt/ EBITDA No 2016 debt maturities All debt is non-recourse, property level mortgage debt Second highest RevPAR amongst peers $404.8 $8.1 $80.0 $152.0 $195.4 2016 2017 2018 2019 2020 Thereafter Debt Maturity Fixed-Rate Floating-Rate Effective navigation of capital markets to extend debt maturities with no debt due in 2016
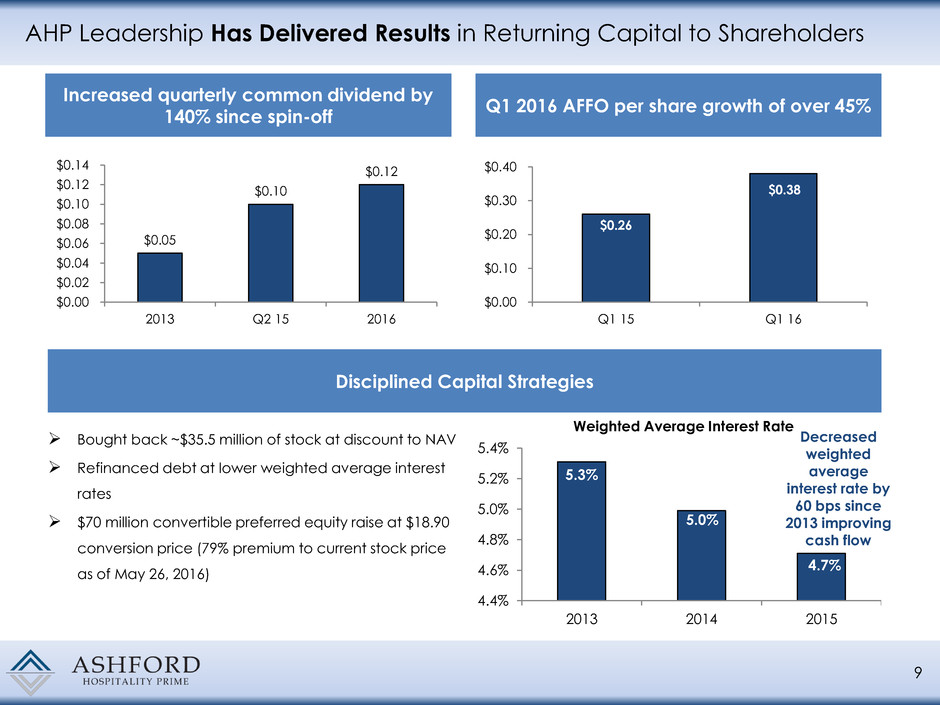
9 $0.05 $0.10 $0.12 $0.00 $0.02 $0.04 $0.06 $0.08 $0.10 $0.12 $0.14 2013 Q2 15 2016 $0.26 $0.38 $0.00 $0.10 $0.20 $0.30 $0.40 Q1 15 Q1 16 AHP Leadership Has Delivered Results in Returning Capital to Shareholders Increased quarterly common dividend by 140% since spin-off Q1 2016 AFFO per share growth of over 45% Disciplined Capital Strategies 5.3% 5.0% 4.7% 4.4% 4.6% 4.8% 5.0% 5.2% 5.4% 2013 2014 2015 Weighted Average Interest Rate Decreased weighted average interest rate by 60 bps since 2013 improving cash flow Bought back ~$35.5 million of stock at discount to NAV Refinanced debt at lower weighted average interest rates $70 million convertible preferred equity raise at $18.90 conversion price (79% premium to current stock price as of May 26, 2016)

15%* 5.7% 3.4% 3.3% 3.3% 2.3% 2.2% 1.9% 1.8% 1.3% 1.2% 0.8% 0.5% 0.0% 2.0% 4.0% 6.0% 8.0% 10.0% 12.0% 14.0% 16.0% AHP HT RLJ CLDT FCH Peer Avg CHSP INN HST PEB DRH SHO LHO 10 HIGHLY ALIGNED MANAGEMENT TEAM Insider ownership of 15%, 6x more than hotel REIT industry average Insider ownership among the highest of its peers Management has significant personal wealth invested in the Company Incentive fee based on AHP total return outperformance vs. its peers Insider Equity Ownership Highly-aligned management team with among highest insider equity ownership of publicly-traded Hotel REITs Public Lodging REITs include: CHSP, CLDT, DRH, FCH, HST, HT, INN, LHO, PEB, RLJ, SHO Source: Company filings. * Insider equity ownership for Ashford Prime includes direct & indirect interests & interests of related parties AHP’s Management Team Is Aligned Like No Other
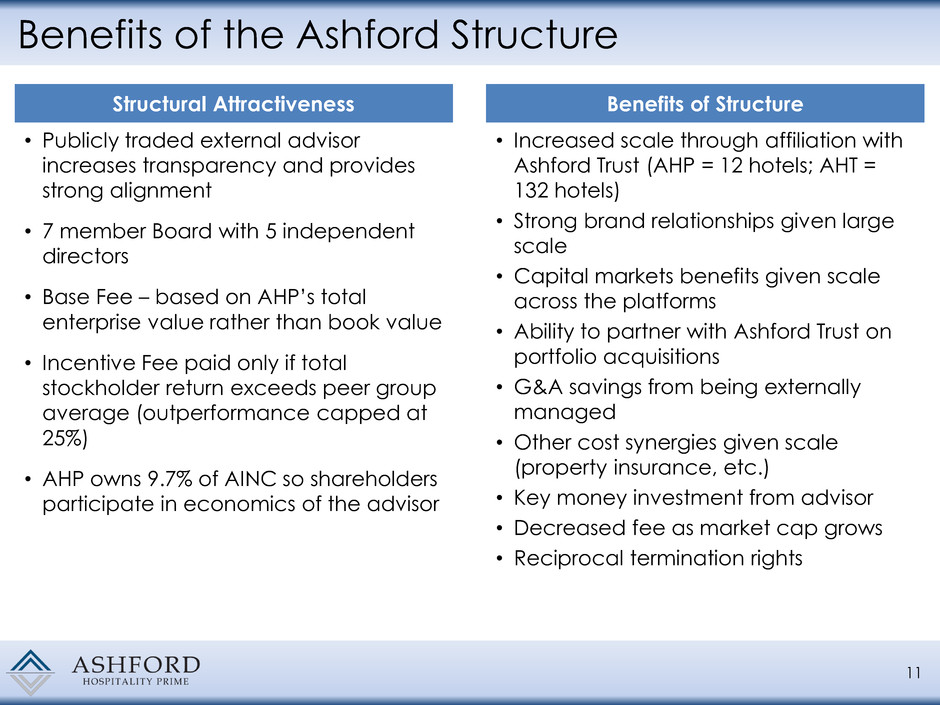
Benefits of the Ashford Structure 11 Structural Attractiveness • Publicly traded external advisor increases transparency and provides strong alignment • 7 member Board with 5 independent directors • Base Fee – based on AHP’s total enterprise value rather than book value • Incentive Fee paid only if total stockholder return exceeds peer group average (outperformance capped at 25%) • AHP owns 9.7% of AINC so shareholders participate in economics of the advisor Benefits of Structure • Increased scale through affiliation with Ashford Trust (AHP = 12 hotels; AHT = 132 hotels) • Strong brand relationships given large scale • Capital markets benefits given scale across the platforms • Ability to partner with Ashford Trust on portfolio acquisitions • G&A savings from being externally managed • Other cost synergies given scale (property insurance, etc.) • Key money investment from advisor • Decreased fee as market cap grows • Reciprocal termination rights

Ashford Prime’s Management Team is Experienced and Qualified 12 Aggregate 139 Years of Relevant Industry Experience 27 years of hospitality experience 13 years with Ashford (14 years with Ashford predecessor) Cornell School of Hotel Administration BS Cornell S.C. Johnson MBA Montgomery J. Bennett Chief Executive Officer & Chairman of the Board 20 years of hospitality experience 13 years with Ashford 10 years with Goldman Sachs Stanford BA, MBA Douglas A. Kessler President 24 years of hospitality experience 13 years with Ashford (11 years with Ashford predecessor) University of North Texas BS, University of Houston JD David A. Brooks Chief Operating Officer, General Counsel 16 years of hospitality experience 13 years with Ashford 3 years with ClubCorp CFA charterholder Southern Methodist University BBA Deric S. Eubanks, CFA Chief Financial Officer 10 years of hospitality experience 5 years with Ashford (5 years with Ashford predecessor) 5 years with Stephens Investment Bank Oklahoma State University BS Jeremy J. Welter EVP of Asset Management 31 years of hospitality experience 13 years with Ashford (18 years with Ashford predecessor) Pepperdine University BS, University of Houston MS, CPA Mark L. Nunneley Chief Accounting Officer 11 years of hospitality experience 11 years with Ashford 3 years of M&A experience at Dresser Inc. & Merrill Lynch Princeton University AB J. Robison Hays Chief Strategy Officer

65% -22% -38% -18% 119% 29% 24% 36% 82% 24% 12% 99% 169% 41% -21% 23% -50% 0% 50% 100% 150% 200% Inception 10-Yr 9-Yr 8-Yr 7-Yr 6-Yr 5-Yr 4-Yr Peer Avg AHT Management's Long Term Track Record of Creating Value at Ashford Trust 13 (1) Since IPO on August 26, 2003 Peer average includes: CHSP, CLDT, DRH, FCH, HST, HT, INN, LHO, RLJ, SHO Returns as of 5/26/16 Source: SNL Total Stockholder Return Significant long-term outperformance proves management's ability to create value for shareholders over time (1)

8.7% 17.4% -12.8% 1.8% -15.0% -10.0% -5.0% 0.0% 5.0% 10.0% 15.0% 20.0% From Start of Strategic Review (8/27/15) to Present (5/25/16) From Start of Strategic Review (8/27/15) to Day Before Sessa Slate Announcement (1/14/16) From Day Before Sessa Slate Announcement (1/14/16) to Strategic Review Conclusion (4/7/16) From Strategic Review Conclusion (4/7/16) to Present (5/25/16) AHP Outperformance vs. Named Peers 14 Named peers include: CHSP, DRH, LHO, SHO, PEB Source: Bloomberg Note: Total return analysis assumes reinvested dividends Stock Total Return Relative Performance Compared to Named Peers SESSA'S DISRUPTIVE PROXY FIGHT

High Quality Portfolio 15 Ashford Prime Hotels Courtyard Seattle Downtown Seattle, WA Marriott Seattle Seattle, WA Hilton Torrey Pines La Jolla, CA Bardessono Hotel & Spa Yountville, CA Pier House Resort Key West, FL Renaissance Tampa Tampa, FL Chicago Sofitel WaterTower Chicago, IL Courtyard Philadelphia Philadelphia, PA Capital Hilton Washington D.C. Courtyard San Francisco San Francisco, CAz Renaissance Tampa Tampa, FL Courtyard Philadelphia Philadelphia, PA apital Hilton ashington . . Marriott Plano Legacy Plano, TX The Ritz-Carlton St. Thomas St. Thomas, USVI Announced Planned Sale

Number of TTM TTM TTM TTM Hotel % of Location Rooms ADR (1) Occ. (1) RevPAR(1) EBITDA(1) Total Courtyard Philadelphia Downtown Philadelphia, PA 499 $175 82% $144 $12,236 9.8% Marriott Plano Legacy Dallas, TX 404 $196 71% $138 $11,130 8.9% Courtyard San Francisco Downtown San Francisco, CA 405 $277 90% $251 $14,127 11.3% Courtyard Seattle Downtown Seattle, WA 250 $196 80% $157 $6,666 5.3% Marriott Seattle Waterfront Seattle, WA 358 $257 82% $210 $14,436 11.6% Renaissance Tampa Tampa, FL 293 $181 78% $142 $6,228 5.0% Capital Hilton Washington D.C. 550 $224 86% $193 $15,809 12.7% Hilton Torrey Pines La Jolla, CA 394 $193 84% $162 $12,346 9.9% Chicago Sofitel Water Tower Chicago, IL 415 $221 80% $176 $8,248 6.6% Pier House Key West, FL 142 $399 90% $359 $9,894 7.9% Bardessono Napa Valley, CA 62 $716 79% $568 $4,236 3.4% Ritz-Carlton St. Thomas St. Thomas, USVI 180 $546 79% $430 $9,328 7.5% Total Portfolio 3,952 $245 82% $200 $124,684 100.0% Portfolio Overview 16 (1) As of March 31, 2016 (2) Wells Fargo Securities Research; Lodging: TripAdvisor Rankings (September 4, 2015) Note: Hotel EBITDA in thousands High quality portfolio with total ADR and RevPAR of $245 and $200, respectively for the TTM period Excluding the Courtyard Seattle Downtown, portfolio ADR and RevPAR is $248 and $203, respectively Geographically diversified portfolio located in strong markets Highest TripAdvisor ranking among publicly-traded Hotel REITs(2)

Asset Management Initiatives 17 Pier House: Complexed GM and sales team resulting in significant labor savings Renaissance Tampa: Recently completed significant guestrooms and lobby renovation; listed for sale with broker Bardessono: Evaluating construction of presidential villa consisting of 3 large-luxurious suites The Ritz-Carlton St. Thomas: Implemented profit improvement plan estimated to save ~$800k annually Capital Hilton: Potentially releasing retail space to higher quality tenant and increased rent Hilton Torrey Pines: Negotiating extension of ground lease, adding potential 52 years in term Marriott Seattle: Adding 3 keys by moving concierge lounge to lobby level Marriott Plano: Actively marketing ~15,000 sq. ft. of highly visible retail space; listed for sale with broker Courtyard San Francisco: Custom guestrooms renovation and consolidating F&B outlets Sofitel Chicago: Renovation of lobby bar and fitness center; 2017 rooms renovation Courtyard Philadelphia: Meeting and pre-function space renovation starting Dec. 2016; listed for sale with broker Courtyard Seattle: Announced planned sale at 6.7% TTM NOI cap rate($338,000 per key)
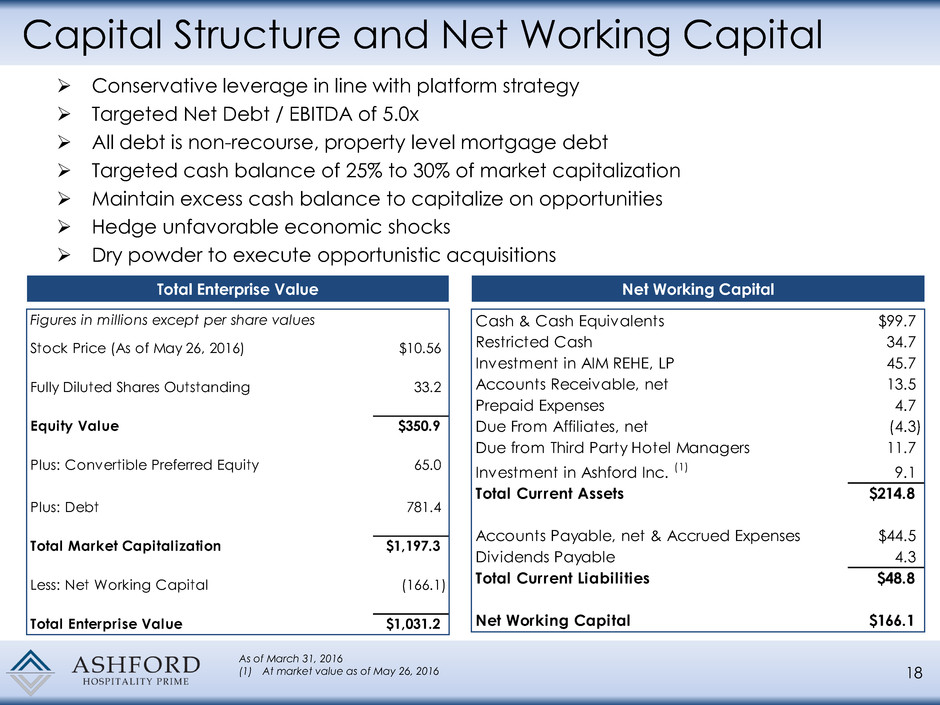
Capital Structure and Net Working Capital Conservative leverage in line with platform strategy Targeted Net Debt / EBITDA of 5.0x All debt is non-recourse, property level mortgage debt Targeted cash balance of 25% to 30% of market capitalization Maintain excess cash balance to capitalize on opportunities Hedge unfavorable economic shocks Dry powder to execute opportunistic acquisitions 18 As of March 31, 2016 (1) At market value as of May 26, 2016 Total Enterprise Value Net Working Capital Figures in millions except per share values Stock Price (As of May 26, 2016) $10.56 Fully Diluted Shares Outstanding 33.2 Equity Value $350.9 Plus: Convertible Preferred Equity 65.0 Plus: Debt 781.4 Total Market Capitalization $1,197.3 Less: Net Working Capital (166.1) Total Enterprise Value $1,031.2 Cash & Cash Equivalents $99.7 Restricted Cash 34.7 Investment i AIM REHE, LP 45.7 Accounts Receivable, net 13.5 Prepaid Expenses 4.7 Due From Affiliates, net (4.3) Due from Third Party Hotel Managers 11.7 Investment in Ashford Inc. (1) 9.1 Total Current Assets $214.8 Accounts Payable, net & Accrued Expenses $44.5 Dividends Payable 4.3 Total Current Liabilities $48.8 Net Working Capital $166.1
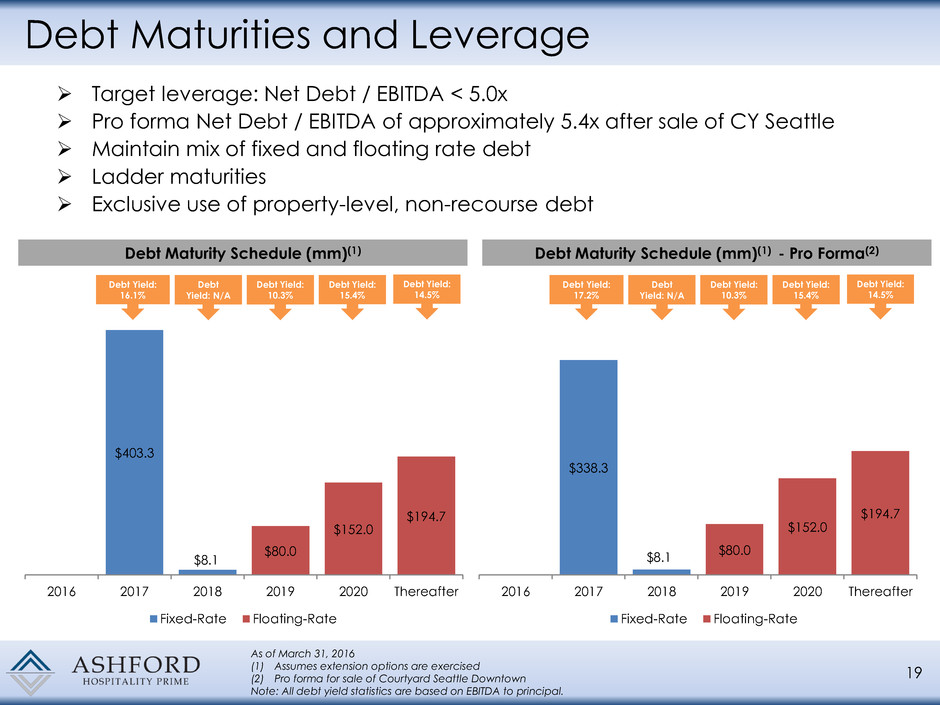
$338.3 $8.1 $80.0 $152.0 $194.7 $0.0 $50.0 $100.0 $150.0 $200.0 $250.0 $300.0 $350.0 $400.0 $450.0 2016 2017 2018 2019 2020 Thereafter Fixed-Rate Floating-Rate Debt Maturities and Leverage Target leverage: Net Debt / EBITDA < 5.0x Pro forma Net Debt / EBITDA of approximately 5.4x after sale of CY Seattle Maintain mix of fixed and floating rate debt Ladder maturities Exclusive use of property-level, non-recourse debt 19 As of March 31, 2016 (1) Assumes extension options are exercised (2) Pro forma for sale of Courtyard Seattle Downtown Note: All debt yield statistics are based on EBITDA to principal. Debt Maturity Schedule (mm)(1) Debt Yield: 16.1% Debt Yield: N/A Debt Yield: 10.3% Debt Yield: 15.4% Debt Yield: 14.5% $403.3 $8.1 $80.0 $152.0 $194.7 $0.0 $50.0 $100.0 $150.0 $200.0 $250.0 $300.0 $350.0 $400.0 $450.0 2016 2017 2018 2019 2020 Thereafter Fixed-Rate Floating-Rate Debt Maturity Schedule (mm)(1) - Pro Forma(2) Debt Yield: 17.2% Debt Yield: N/A Debt Yield: 10.3% Debt Yield: 15.4% Debt Yield: 14.5%
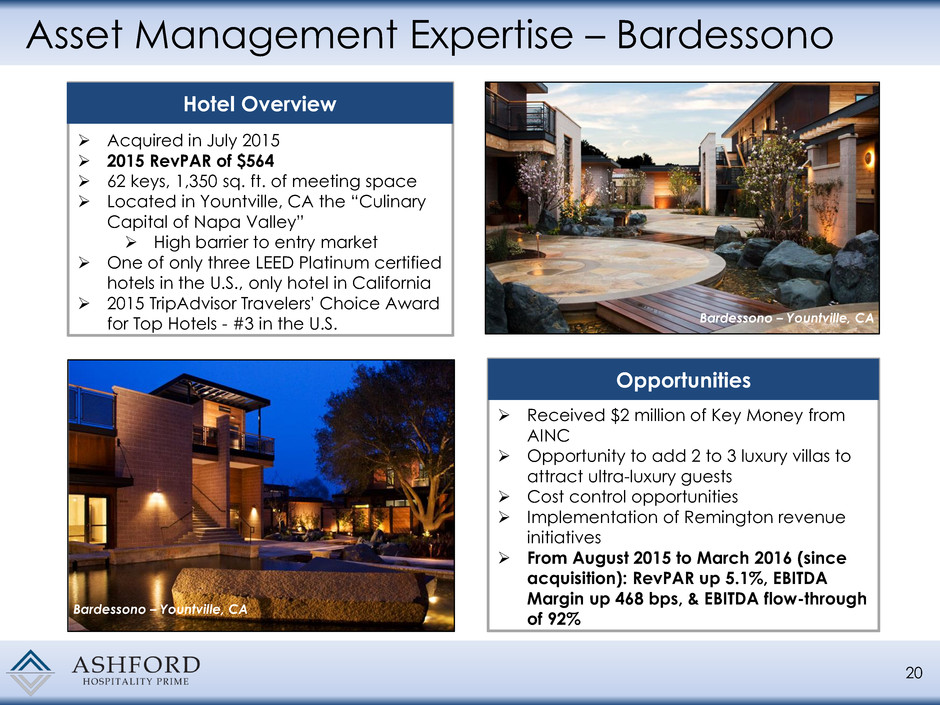
Asset Management Expertise – Bardessono 20 Acquired in July 2015 2015 RevPAR of $564 62 keys, 1,350 sq. ft. of meeting space Located in Yountville, CA the “Culinary Capital of Napa Valley” High barrier to entry market One of only three LEED Platinum certified hotels in the U.S., only hotel in California 2015 TripAdvisor Travelers' Choice Award for Top Hotels - #3 in the U.S. Hotel Overview Received $2 million of Key Money from AINC Opportunity to add 2 to 3 luxury villas to attract ultra-luxury guests Cost control opportunities Implementation of Remington revenue initiatives From August 2015 to March 2016 (since acquisition): RevPAR up 5.1%, EBITDA Margin up 468 bps, & EBITDA flow-through of 92% Opportunities Bardessono – Yountville, CA Bardessono – Yountville, CA
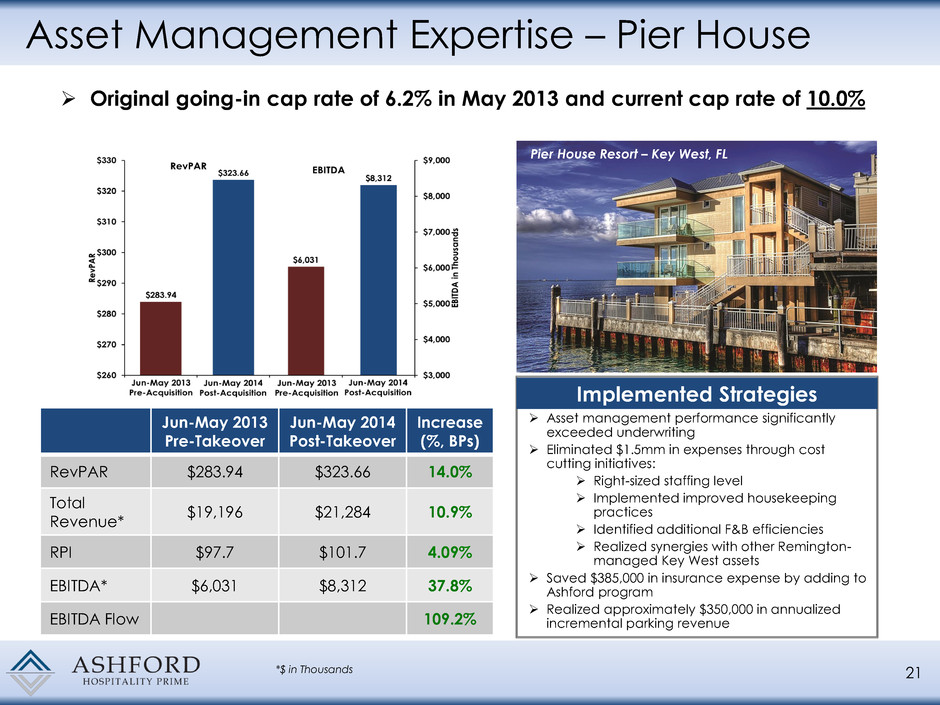
Asset Management Expertise – Pier House 21 Asset management performance significantly exceeded underwriting Eliminated $1.5mm in expenses through cost cutting initiatives: Right-sized staffing level Implemented improved housekeeping practices Identified additional F&B efficiencies Realized synergies with other Remington- managed Key West assets Saved $385,000 in insurance expense by adding to Ashford program Realized approximately $350,000 in annualized incremental parking revenue Implemented Strategies Pier House Resort – Key West, FL Jun-May 2013 Pre-Takeover Jun-May 2014 Post-Takeover Increase (%, BPs) RevPAR $283.94 $323.66 14.0% Total Revenue* $19,196 $21,284 10.9% RPI $97.7 $101.7 4.09% EBITDA* $6,031 $8,312 37.8% EBITDA Flow 109.2% *$ in Thousands Original going-in cap rate of 6.2% in May 2013 and current cap rate of 10.0%

Asset Management Expertise – Ritz St. Thomas 22 The Ritz-Carlton St. Thomas Acquired in December 2015 180 keys, 10,000 sq. ft. of meeting space Acquisition completed at favorable metrics of 7.2x TTM EBITDA and 10% TTM NOI cap rate Located in St. Thomas in the U.S. Virgin Islands with high barriers to entry 30 oceanfront acres along Great Bay Recognized in the 2015 U.S. News & World Report's Best Hotel Rankings Hotel Overview Significant upside after recently completed extensive $22 million renovation of guest rooms and public space Since closing of the acquisition, our asset management team has identified several opportunities to improve performance EBITDA Margin up 208 bps, & EBITDA flow- through of 129.1% in the 1st quarter 2016 (1st full quarter of ownership) with no change in property manager Opportunities Great Bay View The Ritz-Carlton St. Thomas
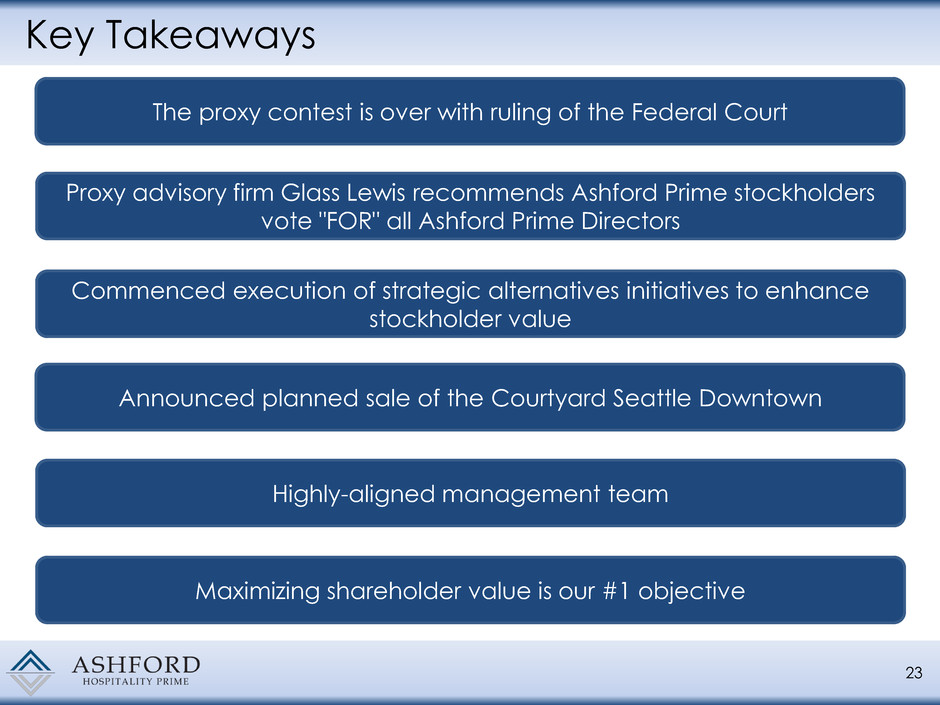
Key Takeaways 23 Announced planned sale of the Courtyard Seattle Downtown Commenced execution of strategic alternatives initiatives to enhance stockholder value The proxy contest is over with ruling of the Federal Court Highly-aligned management team Maximizing shareholder value is our #1 objective Proxy advisory firm Glass Lewis recommends Ashford Prime stockholders vote "FOR" all Ashford Prime Directors

Investor Presentation – June 2016


