
Company Presentation – June 2017

Certain statements and assumptions in this presentation contain or are based upon “forward-looking” information and are being made pursuant to the safe harbor provisions of the Private Securities Litigation Reform Act of 1995. These forward-looking statements are subject to risks and uncertainties. When we use the words “will likely result,” “may,” “anticipate,” “estimate,” “should,” “expect,” “be lieve,” “intend,” or similar expressions, we intend to identify forward-looking statements. Such forward-looking statements include, but are not limited to, our business and investment strategy, our understanding of our competition, current market trends and opportunities, and projected capital expenditures. Such statements are subject to numerous assumptions and uncertainties, many of which are outside of our control. These forward-looking statements are subject to known and unknown risks and uncertainties, which could cause actual results to differ materially from those anticipated, including, without limitation: general volatility of the capital markets, the general economy or the hospitality industry, whether the result of market events or otherwise; our ability to deploy capital and raise additional capital at reasonable costs to repay debts, invest in our properties and fund future acquisitions; unanticipated increases in financing and other costs, including a rise in interest rates; the degree and nature of our competition; actual and potential conflicts of interest with Ashford Hospitality Trust, Inc., Ashford Hospitality Advisors, LLC (“Ashford LLC”), Ashford Inc., Remington Lodging & Hospitality, LLC, our executive officers and our non-independent directors; our ability to implement and execute on planned initiatives announced in connection with the conclusion of our independent directors’ strategic review process; changes in personnel of Ashford LLC or the lack of availability of qualified personnel; changes in governmental regulations, accounting rules, tax rates and similar matters; legislative and regulatory changes, including changes to the Internal Revenue Code and related rules, regulations and interpretations governing the taxation of real estate investment trusts (“REITs”); and limitat ions imposed on our business and our ability to satisfy complex rules in order for us to qualify as a REIT for U.S. federal income tax purposes. These and other risk factors are more fully discussed in the section entitled “Risk Factors” in our Annual Report on Form 10-K, and from time to time, in our other filings with the Securities and Exchange Commission (“SEC”). The forward-looking statements included in this presentation are only made as of the date of this presentation. Investors should not place undue reliance on these forward-looking statements. We are not obligated to publicly update or revise any forward-looking statements, whether as a result of new information, future events or circumstances, changes in expectations or otherwise. EBITDA is defined as net income before interest, taxes, depreciation and amortization. EBITDA yield is defined as trailing twelve month EBITDA divided by the purchase price. A capitalization rate is determined by dividing the property's net operating income by the purchase price. Net operating income is the property's funds from operations minus a capital expense reserve of either 4% or 5% of gross revenues. Hotel EBITDA flow-through is the change in Hotel EBITDA divided by the change in total revenues. EBITDA, FFO, AFFO, CAD and other terms are non-GAAP measures, reconciliations of which have been provided in prior earnings releases and filings with the SEC. This overview is for informational purposes only and is not an offer to sell, or a solicitation of an offer to buy or sell, any securities of Ashford Prime or any of its respective affiliates, and may not be relied upon in connection with the purchase or sale of any such security. 2 Certain Disclosures

Strategic Overview 3 Bardessono Hotel & Spa Yountville, CA Pier House Resort Key West, FL The Ritz-Carlton St. Thomas St. Thomas, USVI Focused strategy of investing in luxury hotels and resorts Grow organically through strong revenue and cost control initiatives Grow externally through accretive acquisitions of high quality assets Targets conservative leverage of Net Debt / Gross Assets of 45% with non-recourse property debt Highly-aligned management team and advisory structure
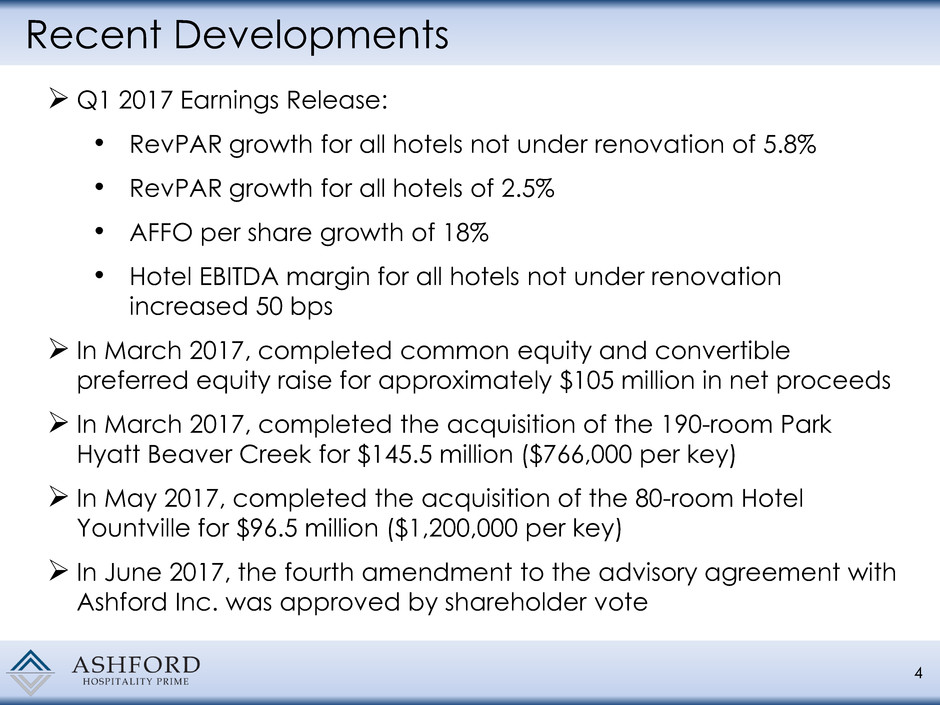
Recent Developments 4 Q1 2017 Earnings Release: • RevPAR growth for all hotels not under renovation of 5.8% • RevPAR growth for all hotels of 2.5% • AFFO per share growth of 18% • Hotel EBITDA margin for all hotels not under renovation increased 50 bps In March 2017, completed common equity and convertible preferred equity raise for approximately $105 million in net proceeds In March 2017, completed the acquisition of the 190-room Park Hyatt Beaver Creek for $145.5 million ($766,000 per key) In May 2017, completed the acquisition of the 80-room Hotel Yountville for $96.5 million ($1,200,000 per key) In June 2017, the fourth amendment to the advisory agreement with Ashford Inc. was approved by shareholder vote
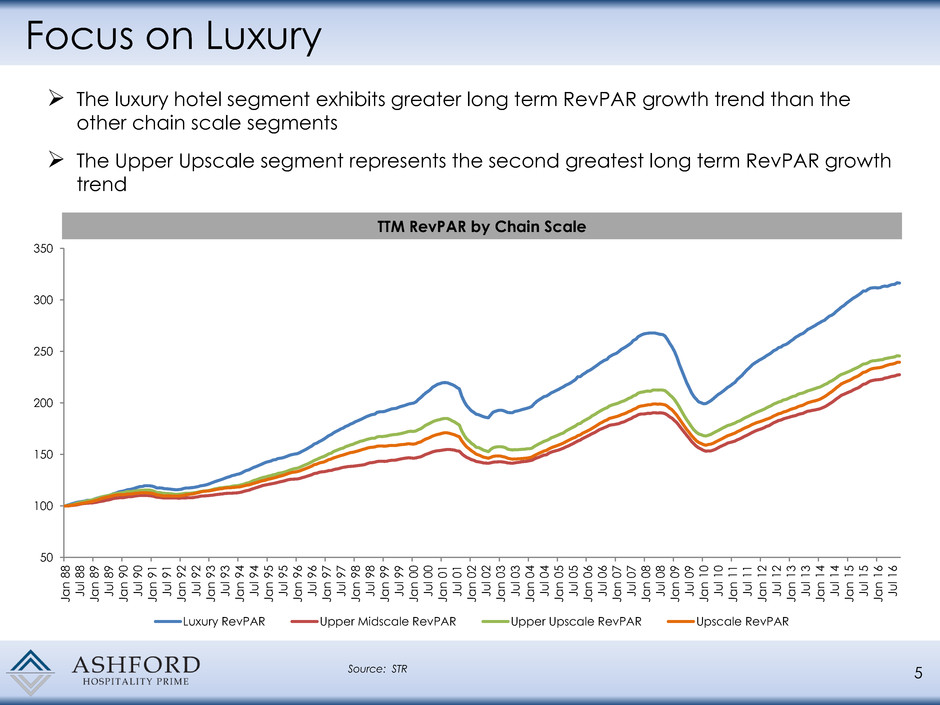
Focus on Luxury 5 The luxury hotel segment exhibits greater long term RevPAR growth trend than the other chain scale segments The Upper Upscale segment represents the second greatest long term RevPAR growth trend Source: STR 50 100 150 200 250 300 350 Ja n 8 8 Ju l 8 8 Ja n 8 9 Ju l 8 9 Ja n 9 0 Ju l 9 0 Ja n 9 1 Ju l 9 1 Ja n 9 2 Ju l 9 2 Ja n 9 3 Ju l 9 3 Ja n 9 4 Ju l 9 4 Ja n 9 5 Ju l 9 5 Ja n 9 6 Ju l 9 6 Ja n 9 7 Ju l 9 7 Ja n 9 8 Ju l 9 8 Ja n 9 9 Ju l 9 9 Ja n 0 0 Ju l 0 0 Ja n 0 1 Ju l 0 1 Ja n 0 2 Ju l 0 2 Ja n 0 3 Ju l 0 3 Ja n 0 4 Ju l 0 4 Ja n 0 5 Ju l 0 5 Ja n 0 6 Ju l 0 6 Ja n 0 7 Ju l 0 7 Ja n 0 8 Ju l 0 8 Ja n 0 9 Ju l 0 9 Ja n 1 0 Ju l 1 0 Ja n 1 1 Ju l 1 1 Ja n 1 2 Ju l 1 2 Ja n 1 3 Ju l 1 3 Ja n 1 4 Ju l 1 4 Ja n 1 5 Ju l 1 5 Ja n 1 6 Ju l 1 6 Luxury RevPAR Upper Midscale RevPAR Upper Upscale RevPAR Upscale RevPAR TTM RevPAR by Chain Scale

$140.20 $148.64 $171.35 $186.76 $207.30 $216.86 $0.00 $50.00 $100.00 $150.00 $200.00 $250.00 2012 2013 2014 2015 2016 TTM 6 Successfully Increasing Portfolio RevPAR... ACCRETIVE GROWTH OF HOTEL PORTFOLIO The luxury hotel segment exhibits greater long term RevPAR growth rates than the other chain scale segments Acquired the Ritz-Carlton St. Thomas, Bardessono Hotel & Spa, Sofitel Chicago Magnificent Mile, Pier House Resort, Park Hyatt Beaver Creek & Hotel Yountville since spin-off Increased portfolio RevPAR since spin-off by 55% to $217 as of TTM March 2017* *Pro forma for the acquisition of Hotel Yountville *

5.3% 5.0% 4.7% 4.8% 3.9% 2.5% 3.0% 3.5% 4.0% 4.5% 5.0% 5.5% 2013 2014 2015 2016 2017 7 Increased quarterly common dividend per share by 220% since spin-off Disciplined Capital Strategies Weighted Average Interest Rate Jun 2015: Raised $72mm in convertible preferred offering at $18.90 conversion price Jan 2017: Refinanced $365mm of debt extending debt maturity and lowering interest cost Mar 2017: Raised $105mm of common and convertible preferred equity to finance $250mm of accretive acquisitions ...While Delivering Strong Financial Results $0.05 $0.10 $0.12 $0.16 $0.00 $0.05 $0.10 $0.15 $0.20 2013 Q2 15 2016 2017 Attractive AFFO per Share Growth 15% 70% 18% 0.0% 10.0% 20.0% 30.0% 40.0% 50.0% 60.0% 70.0% 80.0% FY2016 Q4 16 Q1 17
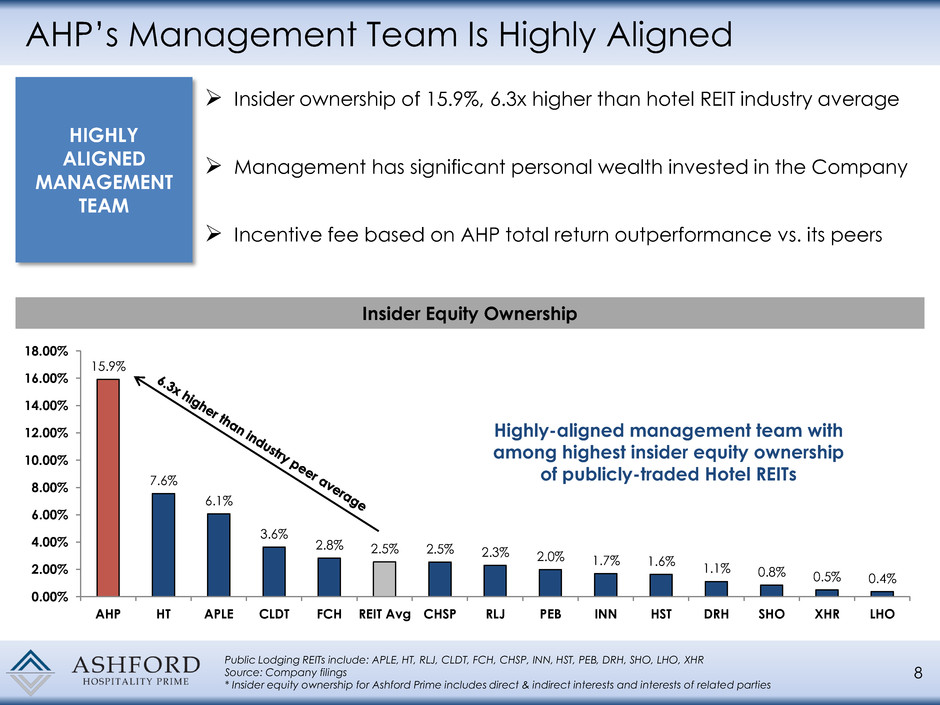
15.9% 7.6% 6.1% 3.6% 2.8% 2.5% 2.5% 2.3% 2.0% 1.7% 1.6% 1.1% 0.8% 0.5% 0.4% 0.00% 2.00% 4.00% 6.00% 8.00% 10.00% 12.00% 14.00% 16.00% 18.00% AHP HT APLE CLDT FCH REIT Avg CHSP RLJ PEB INN HST DRH SHO XHR LHO 8 HIGHLY ALIGNED MANAGEMENT TEAM Insider ownership of 15.9%, 6.3x higher than hotel REIT industry average Management has significant personal wealth invested in the Company Incentive fee based on AHP total return outperformance vs. its peers Insider Equity Ownership Highly-aligned management team with among highest insider equity ownership of publicly-traded Hotel REITs Public Lodging REITs include: APLE, HT, RLJ, CLDT, FCH, CHSP, INN, HST, PEB, DRH, SHO, LHO, XHR Source: Company filings * Insider equity ownership for Ashford Prime includes direct & indirect interests and interests of related parties AHP’s Management Team Is Highly Aligned

High-Quality Hotels in Leading Urban & Resort Markets 9 Current Hotels Marriott Seattle Seattle, WA Hilton Torrey Pines La Jolla, CA Bardessono Hotel & Spa Yountville, CA Pier House Resort Key West, FL Renaissance Tampa Tampa, FL Sofitel Chicago Magnificent Mile Chicago, IL Capital Hilton Washington D.C. Courtyard San Francisco San Francisco, CA Renaissance Tampa Tampa, FL Courtyard Philadelphia Philadelphia, PA Capital Hilton Washington D.C. Marriott Plano Legacy Plano, TX The Ritz-Carlton St. Thomas St. Thomas, USVI Hotel Yountville Yountville, CA Park Hyatt Beaver Creek Beaver Creek, CO
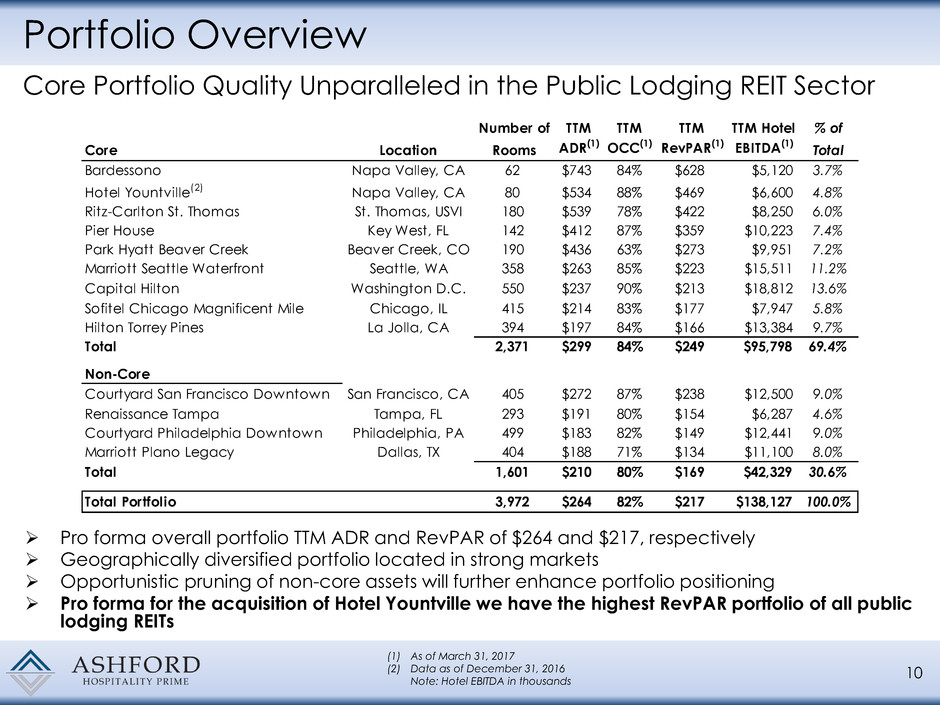
Portfolio Overview 10 Pro forma overall portfolio TTM ADR and RevPAR of $264 and $217, respectively Geographically diversified portfolio located in strong markets Opportunistic pruning of non-core assets will further enhance portfolio positioning Pro forma for the acquisition of Hotel Yountville we have the highest RevPAR portfolio of all public lodging REITs Core Portfolio Quality Unparalleled in the Public Lodging REIT Sector (1) As of March 31, 2017 (2) Data as of December 31, 2016 Note: Hotel EBITDA in thousands Number of TTM TTM TTM TTM Hotel % of Core Location Rooms ADR (1) OCC(1) RevPAR(1) EBITDA(1) Total Bardessono Napa Valley, CA 62 $743 84% $628 $5,120 3.7% Hotel Yountville(2) Napa Valley, CA 80 $534 88% $469 $6,600 4.8% Ritz-Carlton St. Thomas St. Thomas, USVI 180 $539 78% $422 $8,250 6.0% Pier House Key West, FL 142 $412 87% $359 $10,223 7.4% Park Hyatt Beaver Creek Beaver Creek, CO 190 $436 63% $273 $9,951 7.2% Marriott Seattle Waterfront Seattle, WA 358 $263 85% $223 $15,511 11.2% Capital Hilton Washington D.C. 550 $237 90% $213 $18,812 13.6% Sofitel Chicago Magnificent Mile Chicago, IL 415 $214 83% $177 $7,947 5.8% Hilton Torrey Pines La Jolla, CA 394 $197 84% $166 $13,384 9.7% Total 2,371 $299 84% $249 $95,798 69.4% Non-Core Courtyard San Francisco Downtown San Francisco, CA 405 $272 87% $238 $12,500 9.0% Renaissance Tampa Tampa, FL 293 $191 80% $154 $6,287 4.6% Courtyard Philadelphia Downtown Philadelphia, PA 499 $183 82% $149 $12,441 9.0% Marriott Plano Legacy Dallas, TX 404 $188 71% $134 $11,100 8.0% Total 1,601 $210 80% $169 $42,329 30.6% Total Portfolio 3,972 $264 82% $217 $138,127 100.0%
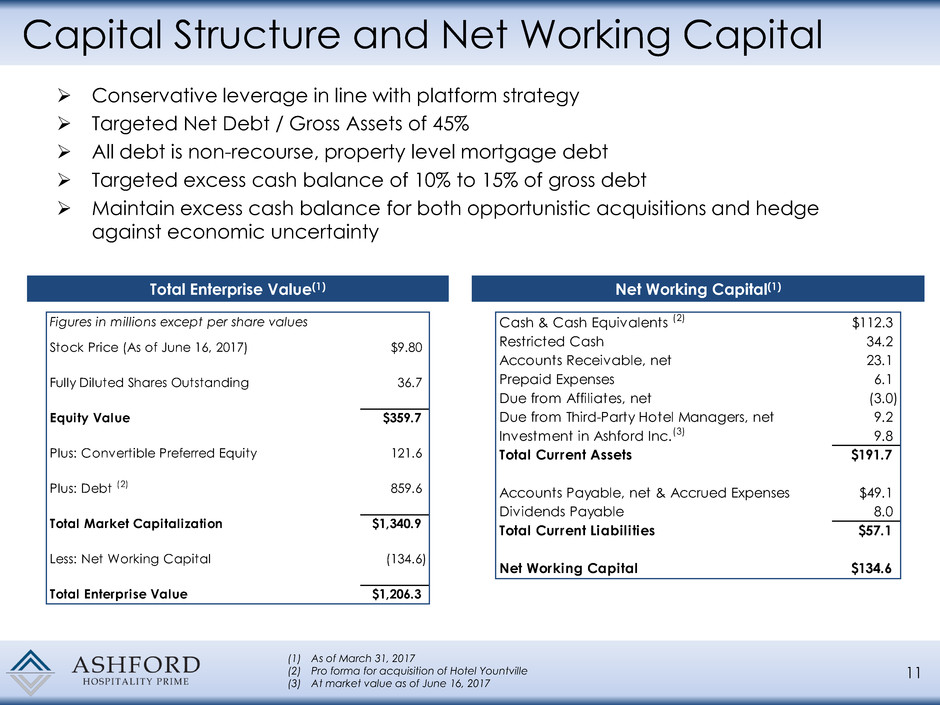
Capital Structure and Net Working Capital Conservative leverage in line with platform strategy Targeted Net Debt / Gross Assets of 45% All debt is non-recourse, property level mortgage debt Targeted excess cash balance of 10% to 15% of gross debt Maintain excess cash balance for both opportunistic acquisitions and hedge against economic uncertainty 11 (1) As of March 31, 2017 (2) Pro forma for acquisition of Hotel Yountville (3) At market value as of June 16, 2017 Total Enterprise Value(1) Net Working Capital(1) Figures in millions except per share values Stock Price (As of June 16, 2017) $9.80 Fully Diluted Shares Outstanding 36.7 Equity Value $359.7 Plus: Convertible Preferred Equity 121.6 Plus: Debt (2) 859.6 Total Market Capitalization $1,340.9 Less: Net Working Capital (134.6) Total Enterprise Value $1,206.3 Cash & Cash Equivalents (2) $112.3 Restricted Cash 34.2 Accounts Receivable, net 23.1 Prepaid Expenses 6.1 Due from Affiliates, net (3.0) Due from Third-Party Hotel Managers, net 9.2 Investment in Ashford Inc.(3) 9.8 Total Current Assets $191.7 Accounts Payable, net & Accrued Expenses $49.1 Dividends Payable 8.0 Total Current Liabilities $57.1 Net Working Capital $134.6

Debt Maturities and Leverage Next hard debt maturity in 2019 Laddered debt maturities Exclusive use of property-level, non-recourse debt Net Debt / Gross Assets of 41.8%(1) FCCR of 1.90x(1) 12 (1) As of March 31, 2017 (2) Assumes extension options are exercised (3) All floating-rate debt has interest rate caps in place (4) Pro forma for acquisition of Hotel Yountville Debt Maturity Schedule (mm) (1) (2) (3) $8.1 $80.0 $152.0 $192.1 $483.5 $0.0 $100.0 $200.0 $300.0 $400.0 $500.0 $600.0 2017 2018 2019 2020 2021 Thereafter Fixed-Rate Floating-Rate (4)
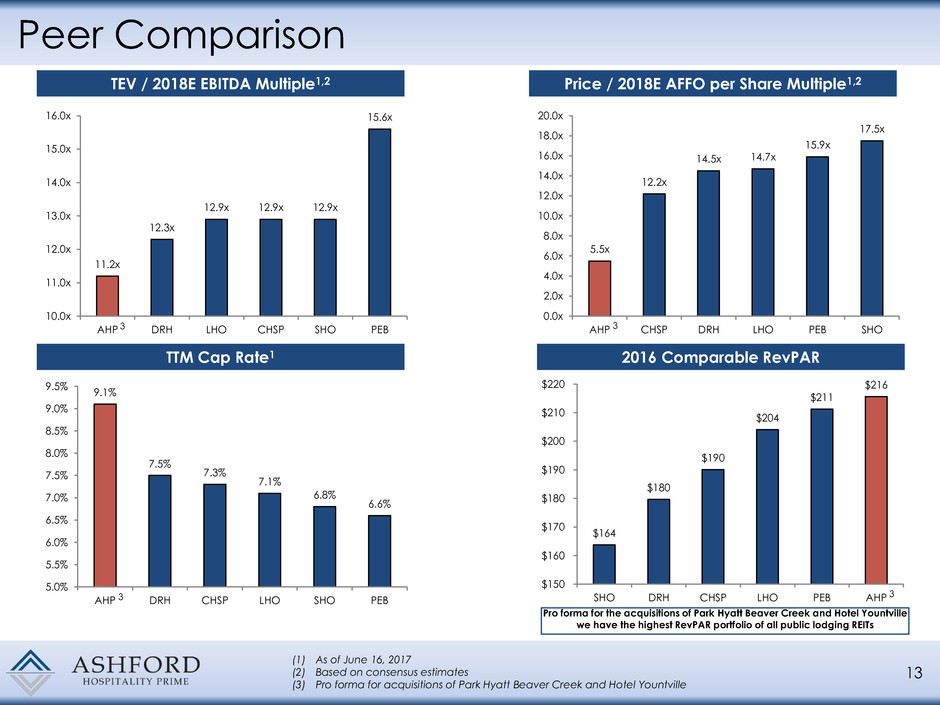
9.1% 7.5% 7.3% 7.1% 6.8% 6.6% 5.0% 5.5% 6.0% 6.5% 7.0% 7.5% 8.0% 8.5% 9.0% 9.5% AHP DRH CHSP LHO SHO PEB 5.5x 12.2x 14.5x 14.7x 15.9x 17.5x 0.0x 2.0x 4.0x 6.0x 8.0x 10.0x 12.0x 14.0x 16.0x 18.0x 20.0x AHP CHSP DRH LHO PEB SHO 11.2x 12.3x 12.9x 12.9x 12.9x 15.6x 10.0x 11.0x 12.0x 13.0x 14.0x 15.0x 16.0x AHP DRH LHO CHSP SHO PEB Peer Comparison 13 $164 $180 $190 $204 $211 $216 $150 $160 $170 $180 $190 $200 $210 $220 SHO DRH CHSP LHO PEB AHP 2016 Comparable RevPAR Pro forma for the acquisitions of Park Hyatt Beaver Creek and Hotel Yountville we have the highest RevPAR portfolio of all public lodging REITs (1) As of June 16, 2017 (2) Based on consensus estimates (3) Pro forma for acquisitions of Park Hyatt Beaver Creek and Hotel Yountville 3 TEV / 2018E EBITDA Multiple1,2 Price / 2018E AFFO per Share Multiple1,2 TTM Cap Rate1 3 3 3

Compelling Growth Opportunity – Park Hyatt Beaver Creek 14 Acquired for $145.5 million ($766,000 / key) 190 keys, 20,000 sq. ft. of meeting space Purchase price represents a 5.7% TTM NOI cap rate*; 14.6x TTM EBITDA* Purchase price represents a 6.4% FWD NOI cap rate; 14.0x FWD EBITDA Located in Beaver Creek, CO overlooking Beaver Creek Mountain Ski-in / ski-out access AAA Four Diamond Resort TTM RevPAR of $273* Hotel Overview 18,000sf of retail lease space provides stable income Opportunity to improve flow-through with Ashford asset management Opportunity to improve operations during shoulder seasons Potential to improve luxury product offering through renovation of public space and guestroom bathrooms Lower insurance costs Only ~3% of roomnights are booked through Expedia Opportunities Park Hyatt Beaver Creek Lobby *As of March 31, 2017

Compelling Growth Opportunity – Hotel Yountville 15 Acquired for $96.5 million ($1.2 mn / key) 80 keys, 4,392 sq. ft. of meeting space Purchase price represents a 6.2% TTM NOI cap rate; 14.6x TTM EBITDA* Located in Yountville, CA in Napa Valley Over 450 wineries nearby as well as boutique shopping, golf courses, and award winning restaurants TTM RevPAR of $469* Hotel Overview Significant ADR upside relative to competitors (34% discount to peers**) Second highest RevPAR asset in Ashford Prime portfolio Implementation of Remington revenue and cost savings initiatives Significant synergies with Bardessono Hotel & Spa including shared services for general manager, front office manager, sales, HR, etc. Opportunities Hotel Yountville *As of December 31, 2016 **Based on competitive peer set

Key Takeaways 16 High quality portfolio with focused strategy of investing in luxury hotels and resorts Announced recent corporate governance enhancements, appointment of new independent director, and appointment of new CEO Q1 RevPAR growth for all hotels not under renovation of 5.8% & Q1 AFFO per share growth of 18% Highly aligned management team Announced strategy refinements and amended advisory agreement with Ashford Inc. Completed acquisitions of the luxury resorts Park Hyatt Beaver Creek & Hotel Yountville

Company Presentation – June 2017


