Exhibit 99.2


TABLE OF CONTENTS | | |
| | |
COMPANY OVERVIEW | | |
| | |
COMPANY INFORMATION | | 5 |
| | |
FIRST QUARTER HIGHLIGHTS | | 7 |
| | |
FINANCIAL HIGHLIGHTS | | 8 |
| | |
FINANCIAL INFORMATION | | |
| | |
FUNDS FROM OPERATIONS (FFO), NORMALIZED FUNDS FROM OPERATIONS (NORMALIZED FFO), AND NORMALIZED FUNDS AVAILABLE FOR DISTRIBUTION (NORMALIZED FAD) | | 9 |
| | |
NET OPERATING INCOME AND ADJUSTED EBITDA | | 10 |
| | |
MARKET CAPITALIZATION AND DEBT SUMMARY | | 11 |
| | |
FINANCIAL STATISTICS | | 12 |
| | |
SAME-STORE PORTFOLIO PERFORMANCE AND TENANT OCCUPANCY | | 13 |
| | |
INVESTMENT ACTIVITY AND LEASE EXPIRATION SCHEDULE | | 14 |
| | |
GEOGRAPHICAL DISTRIBUTION | | 15 |
| | |
PORTFOLIO DIVERSIFICATION | | 16 |
| | |
TOP 10 HEALTH SYSTEM RELATIONSHIPS | | 17 |
| | |
CONSOLIDATED BALANCE SHEETS | | 18 |
| | |
CONSOLIDATED STATEMENTS OF OPERATIONS | | 19 |
| | |
REPORTING DEFINITIONS | | 20 |
Forward looking statements:
Certain statements made in this supplemental information package constitute forward-looking statements within the meaning of the Private Securities Litigation Reform Act of 1995 (set forth in Section 27A of the Securities Act of 1933, as amended, and Section 21E of the Securities Exchange Act of 1934, as amended (the “Exchange Act”)). In particular, statements pertaining to our capital resources, portfolio performance and results of operations contain forward-looking statements. Likewise, our pro forma financial statements and our statements regarding anticipated market conditions are forward-looking statements. You can identify forward-looking statements by the use of forward-looking terminology such as “believes,” “expects,” “may,” “will,” “should,” “seeks,” “approximately,” “intends,” “plans,” “pro forma,” “estimates” or “anticipates” or the negative of these words and phrases or similar words or phrases which are predictions of or indicate future events or trends and which do not relate solely to historical matters. You can also identify forward-looking statements by discussions of strategy, plans or intentions.
2
Forward-looking statements involve numerous risks and uncertainties and you should not rely on them as predictions of future events. Forward-looking statements depend on assumptions, data or methods which may be incorrect or imprecise and we may not be able to realize them. We do not guarantee that the transactions and events described will happen as described (or that they will happen at all). The following factors, among others, could cause actual results and future events to differ materially from those set forth or contemplated in the forward-looking statements:
· general economic conditions;
· adverse economic or real estate developments, either nationally or in the markets in which our properties are located;
· our failure to generate sufficient cash flows to service our outstanding indebtedness;
· fluctuations in interest rates and increased operating costs;
· the availability, terms and deployment of debt and equity capital, including our unsecured revolving credit facility;
· our ability to make distributions on our common shares;
· general volatility of the market price of our common shares;
· our limited operating history;
· our increased vulnerability economically due to the concentration of our investments in healthcare properties;
· our geographic concentrations in Texas and the greater Atlanta, Georgia metropolitan area causes us to be particularly exposed to downturns in these economies or other changes in real estate market conditions;
· changes in our business or strategy;
· our dependence upon key personnel whose continued service is not guaranteed;
· our ability to identify, hire and retain highly qualified personnel in the future;
· the degree and nature of our competition;
· changes in governmental regulations, tax rates and similar matters;
· defaults on or non-renewal of leases by tenants;
· decreased rental rates or increased vacancy rates;
· difficulties in identifying healthcare properties to acquire and complete acquisitions;
· competition for investment opportunities;
· our failure to successfully develop, integrate and operate acquired properties and operations;
· the impact of our investment in joint ventures;
· the financial condition and liquidity of, or disputes with, joint venture and development partners;
· our ability to operate as a public company;
3
· changes in accounting principles generally accepted in the United States (or GAAP);
· lack of or insufficient amounts of insurance;
· other factors affecting the real estate industry generally;
· our failure to qualify and maintain our qualification as a real estate investment trust (or REIT) for U.S. federal income tax purposes;
· limitations imposed on our business and our ability to satisfy complex rules in order for us to qualify as a REIT for U.S. federal income tax purposes; and
· changes in governmental regulations or interpretations thereof, such as real estate and zoning laws and increases in real property tax rates and taxation of REITs; and,
· various other factors may materially adversely affect us, including the per share trading price of our common shares, such as:
· higher market interest rates;
· the number of our common shares available for future issuance or sale;
· our issuance of equity securities or the perception that such issuance might occur;
· future offerings of debt; and
· if securities analysts do not publish research or reports about our industry or if they downgrade our common shares or the healthcare-related real estate sector.
While forward-looking statements reflect our good faith beliefs, they are not guarantees of future performance. You should not place undue reliance on any forward-looking statements, which speak only as of the date of this report. We disclaim any obligation to publicly update or revise any forward-looking statement to reflect changes in underlying assumptions or factors, of new information, data or methods, future events or other changes after the date of this prospectus, except as required by applicable law. For a further discussion of these and other factors that could impact our future results, performance or transactions, see Part I, Item 1A (Risk Factors) of our Annual Report on Form 10-K for the fiscal year December 31, 2014.
ADDITIONAL INFORMATION
The information in this supplemental information package should be read in conjunction with the Company’s Annual Report on Form 10-K, Quarterly Reports on Form 10-Q, Current Reports on Form 8-K, earnings press release dated May 7, 2015 and other information filed with, or furnished to, the SEC. You can access the Company’s reports and amendments to those reports filed or furnished to the Securities and Exchange Commission (the “SEC”) pursuant to Section 13(a) or 15(d) of the Exchange Act in the “Investor Relations” section on the Company’s website (www.docreit.com) under the tab “SEC Filings” as soon as reasonably practicable after they are filed with, or furnished to, the SEC. The information on or connected to the Company’s website is not, and shall not be deemed to be, a part of, or incorporated into this supplemental information package. You also can review these SEC filings and other information by accessing the SEC’s website at http://www.sec.gov.
4
ABOUT PHYSICIANS REALTY TRUST
Physicians Realty Trust (NYSE:DOC) (the “Trust,” the “Company,” “DOC,” “we,” “our” and “us”) is a self-managed healthcare real estate company organized in 2013 to acquire, selectively develop, own and manage healthcare properties that are leased to physicians, hospitals and healthcare delivery systems.
We invest in real estate that is integral to providing high quality healthcare services. Our properties typically are on a campus with a hospital or other healthcare facilities or strategically located and affiliated with a hospital or other healthcare facilities.
Our management team has significant public healthcare REIT experience and long established relationships with physicians, hospitals and healthcare delivery system decision makers that we believe will provide quality investment opportunities to generate attractive risk-adjusted returns to our shareholders.
We are a Maryland real estate investment trust and elected to be taxed as a REIT for U.S. federal income tax purposes beginning with our short taxable year ending December 31, 2013. We conduct our business through an UPREIT structure in which our properties are owned by Physicians Realty L.P., a Delaware limited partnership (the “operating partnership”), directly or through limited partnerships, limited liability companies or other subsidiaries. We are the sole general partner of the operating partnership and, as of March 31, 2015, own approximately 95.1% of the partnership interests in the operating partnership.
We had no business operations prior to completion of our initial public offering (the “IPO”) on July 24, 2013. Our predecessor, which is not a legal entity, is comprised of the four healthcare real estate funds managed by B.C. Ziegler & Company (“Ziegler”), which are referred to as the Predecessor Ziegler Funds, that owned directly or indirectly interests in entities that owned the initial properties we acquired through the operating partnership on July 24, 2013 in connection with completion of the IPO and related formation transactions.
COMPANY SNAPSHOT
| | As of | |
| | March 31, 2015 | |
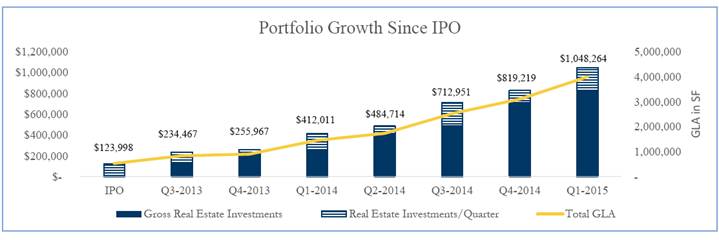
Gross real estate investments (thousands) | | $ | 1,047,575 | |
Total buildings | | 109 | |
% Leased | | 94.6 | % |
Total portfolio gross leasable area | | 3,993,783 | |
| | | |
% of GLA on-campus / affiliated | | 72.2 | % |
Average remaining lease term for all buildings (years) | | 8.7 | |
| | | |
Cash and cash equivalents (thousands) | | $ | 35,774 | |
Total debt to firm value | | 10.7 | % |
Weighted average interest rate per annum on consolidated debt | | 3.51 | % |
Equity market cap (thousands) | | $ | 1,238,232 | |
Quarterly dividend | | $ | 0.225 | |
Quarter end stock price | | $ | 17.61 | |
Dividend yield | | 5.11 | % |
Common shares outstanding | | 70,314,134 | |
Operating Partnership Units outstanding | | 3,640,900 | |
Total firm value (thousands) (1) | | $ | 1,473,021 | |
(1) Represents the value of outstanding shares and units based on the closing stock price on March 31, 2015 plus the amount of outstanding debt and redeemable equity at March 31, 2015
5
ABOUT PHYSICIANS REALTY TRUST (CONTINUED)
BOARD OF TRUSTEES
Tommy G. Thompson | William A. Ebinger, M.D. | Richard A. Weiss |
Chairman | | |
| | |
Albert C. Black | Mark A. Baumgartner | Stanton D. Anderson |
Compensation, Nominating and | Finance and Investment | Audit Committee Chair |
Governance Committee Chair | Committee Chair | |
| | |
| John T. Thomas | |
| Chief Executive Officer | |
| President | |
MANAGEMENT TEAM
John T. Thomas | John W. Sweet | Jeffrey N. Theiler |
Chief Executive Officer | Executive Vice President | Executive Vice President |
President | Chief Investment Officer | Chief Financial Officer |
| | |
Bradley D. Page | John W. Lucey | Mark D. Theine |
Senior Vice President | Senior Vice President | Senior Vice President |
General Counsel | Principal Accounting and | Asset & Investment |
| Reporting Officer | Management |
LOCATION AND CONTACT INFORMATION
External Auditor | Corporate and REIT Tax Counsel | Transfer Agent |
Ernst & Young | Baker & McKenzie LLP | Computershare |
155 N. Upper Wacker Drive | Richard Lipton, Partner | College Station, TX 77845 |
Chicago, IL 60606 | 300 E. Randolph Street, Suite 5000 | 1-800-446-2617 |
(312) 879-2000 | Chicago, IL 60601 | www.computershare.com |
| (312) 861-8000 | |
| | |
Corporate Headquarters | | |
735 N. Water Street, Suite 1000 | | |
Milwaukee, WI 53202 | | |
(414) 978-6494 | | |
6
FIRST QUARTER HIGHLIGHTS
OPERATING
· First quarter 2015 total revenue of $24.5 million, up 205% over the prior year period
· First quarter 2015 rental revenue of $20.3 million, an increase of 199% over the prior year period
· Generated quarterly normalized funds from operations (Normalized FFO) of $0.20 per share on a fully diluted basis
· Closed on 9 acquisitions totaling 913,327 square feet for total first quarter 2015 investments of $234.1 million
· Declared quarterly dividend of $0.225 per share for the first quarter
· 94.6% of portfolio square footage leased as of March 31, 2015
· Net increase to gross leasable square footage of 29% to 3,993,783 square feet, as of March 31, 2015 from 3,100,701 as of December 31, 2014
FIRST QUARTER ACQUISITIONS | | SUBSEQUENT ACQUISITIONS |
| | |
· Minnesota Portfolio, Minneapolis, MN | | · Premier Surgery Center of Louisville, Louisville, KY |
· Columbus Regional Health Portfolio, Columbus, GA | | · Baton Rouge MOB, Baton Rouge, LA |
· Methodist Sports Medicine, Greenwood, IN | | · Health Park MOB, Grand Blanc, MI |
· Indianapolis South MOB, Greenwood, IN | | · Plaza HCA MOB, Jacksonville, FL |
· Bridgeport Medical Center, Lakewood, WA | | |
· Baylor Cancer Center, Dallas, TX | | |
· Renaissance Office Building, Milwaukee, WI | | |
· University of Rochester Strong Memorial Portfolio, Rochester, NY |
· Avalon Park Florida Hospital MOB, Avalon Park, FL | | |
COMPANY ANNOUNCEMENTS
· January 14, 2015: Announced the closing of $81.7 million in five unrelated transactions, including a total of seven buildings in Illinois, New York, Louisiana, Tennessee and Florida, as well as the execution of a non-binding letter of intent with The Davis Group and an equity investor working with The Davis Group to acquire a 96% or greater interest in the Minnesota Portfolio
· January 14, 2015: Announced commencement of public offering of 15,000,000 common shares and plans to grant the underwriters a 30-day option to purchase up to an additional 2,250,000 common shares
· January 14, 2015: Announced pricing of public offering of 16,500,000 common shares at a price per share of $16.40
· January 15, 2015: Announced exercise of underwriters’ option to purchase additional common shares
· January 21, 2015: Announced the completion of upsized public offering of 18,975,000 common shares, including 2,475,000 common shares issued pursuant to the exercise of the underwriters’ overallotment option, at a price per share of $16.40, for net proceeds of $297.7 million
· January 28, 2015: Announced the tax reporting information for dividends paid to shareholders during the year ended December 31, 2014
· February 5, 2015: Announced the closing of $121.9 million of investments in medical office facilities since January 1, 2015
· April 6, 2015: Announced the closing of $234 million of investments in medical office facilities since January 1, 2015.
7
FINANCIAL HIGHLIGHTS
(Unaudited and in thousands, except sq. ft. and per share data)
INCOME
| | Three Months Ended | |
| | March 31, 2015 | | December 31, 2014 | |
Revenues | | $ | 24,484 | | $ | 19,694 | |
NOI | | 18,788 | | 15,910 | |
Annualized Adjusted EBITDA | | 64,496 | | 55,816 | |
Normalized FFO | | 13,660 | | 11,316 | |
Normalized FAD | | 12,468 | | 10,543 | |
Net income (loss) available to common shareholders per common share | | $ | (0.01 | ) | $ | 0.04 | |
Normalized FAD per common share and unit | | $ | 0.18 | | $ | 0.20 | |
CAPITALIZATION
| | As of | |
| | March 31, 2015 | | December 31, 2014 | |
ASSETS | | | | | |
Gross Real Estate Investments (including gross lease intangibles) | | $ | 1,047,575 | | $ | 819,219 | |
Total Assets | | 1,066,207 | | 811,573 | |
DEBT AND EQUITY | | | | | |
Total Debt | | $ | 156,952 | | $ | 216,105 | |
Total Shareholders’ Equity | | 862,279 | | 569,209 | |
Total Equity Capitalization | | 1,238,232 | | 845,945 | |
Implied Equity Market Capitalization (1) | | 1,302,348 | | 898,904 | |
Total Debt / Implied Equity Market Capitalization | | 12 | % | 24 | % |
(1) Outstanding shares and units at quarter end multiplied by share price at quarter end
8
RECONCILIATION OF NON-GAAP MEASURES
FUNDS FROM OPERATIONS (FFO),
NORMALIZED FUNDS FROM OPERATIONS (NORMALIZED FFO)
AND NORMALIZED FUNDS AVAILABLE FOR DISTRIBUTION (NORMALIZED FAD)
(Unaudited and in thousands, except share and per share data)
| | Three Months Ended | | Three Months Ended | |
| | March 31, 2015 | | March 31, 2014 | |
Net loss | | $ | (448 | ) | $ | (3,558 | ) |
Preferred distribution | | (66 | ) | — | |
Depreciation and amortization expense | | 8,240 | | 2,416 | |
Loss on the sale of property | | 15 | | — | |
FFO | | $ | 7,741 | | $ | (1,142 | ) |
FFO per share and unit | | $ | 0.11 | | $ | (0.05 | ) |
Net change in fair value of derivative | | (13 | ) | (41 | ) |
Acquisition related expenses | | 5,932 | | 4,287 | |
Normalized FFO | | $ | 13,660 | | $ | 3,104 | |
Normalized FFO per share and unit | | $ | 0.20 | | $ | 0.12 | |
| | | | | |
Normalized FFO | | 13,660 | | 3,104 | |
Non-cash share compensation expense | | 703 | | 273 | |
Straight-line rent adjustments | | (2,012 | ) | (652 | ) |
Amortization of acquired above/below market leases | | 222 | | 46 | |
Amortization of lease inducements | | 119 | | 34 | |
Amortization of deferred financing costs | | 293 | | 148 | |
TI/LC and recurring capital expenditures | | (1,028 | ) | — | |
Seller master lease and rent abatement payments | | 511 | | — | |
Normalized FAD | | $ | 12,468 | | $ | 2,953 | |
Normalized FAD per share and unit | | $ | 0.18 | | $ | 0.12 | |
| | | | | |
Weighted average number of shares and units outstanding | | 69,490,587 | | 25,274,626 | |
9
NET OPERATING INCOME AND ADJUSTED EBITDA
(Unaudited and in thousands, except share and per share data)
NET OPERATING INCOME
| | Three Months Ended | | Three Months Ended | |
| | March 31, 2015 | | March 31, 2014 | |
Net loss | | $ | (448 | ) | $ | (3,558 | ) |
General and administrative | | 3,352 | | 2,014 | |
Acquisition related expenses | | 5,932 | | 4,287 | |
Depreciation and amortization | | 8,240 | | 2,416 | |
Interest expense | | 1,710 | | 1,281 | |
Net change in fair value of derivative | | (13 | ) | — | |
Loss (gain) on sale of property | | 15 | | (41 | ) |
NOI | | $ | 18,788 | | $ | 6,399 | |
| | | | | |
NOI | | $ | 18,788 | | $ | 6,399 | |
Straight-line rent adjustments | | (2,012 | ) | (652 | ) |
Amortization of acquired above/below market leases | | 232 | | 46 | |
Amortization of lease inducement | | 119 | | 34 | |
Seller master lease and rent abatement payments | | 511 | | ��� | |
Cash NOI | | $ | 17,638 | | $ | 5,827 | |
ADJUSTED EBITDA
| | Three Months Ended | | Three Months Ended | |
| | March 31, 2015 | | March 31, 2014 | |
Net loss | | $ | (448 | ) | $ | (3,558 | ) |
Depreciation and amortization | | 8,240 | | 2,416 | |
Interest expense | | 1,710 | | 1,281 | |
Net change in fair value of derivative | | (13 | ) | (41 | ) |
EBITDA | | $ | 9,489 | | $ | 98 | |
Acquisition related expenses | | 5,932 | | 4,287 | |
Non-cash share compensation | | 703 | | 273 | |
Adjusted EBITDA | | $ | 16,124 | | $ | 4,658 | |
| | | | | |
Adjusted EBITDA Annualized | | $ | 64,496 | | $ | 18,632 | |
10
MARKET CAPITALIZATION AND DEBT SUMMARY
(Unaudited and in thousands, except share data)
MARKET CAPITALIZATION | | | | 
| |
| | | |
| | As of | |
| | March 31, 2015 | |
Revolving credit facility debt | | $ | 73,000 | |
Mortgage debt | | 83,952 | |
Total Debt | | $ | 156,952 | |
| | | |
Redeemable equity | | $ | 13,721 | |
| | | |
Share price | | $ | 17.61 | |
Total common shares outstanding | | 70,314 | |
Total OP units outstanding | | 3,641 | |
Implied equity market capitalization | | $ | 1,302,348 | |
| | | |
Total Firm Value (Debt + Pref. + Equity) | | $ | 1,473,021 | |
Total Debt/Total Assets | | 14.7 | % |
Total Debt/Total Firm Value | | 10.7 | % |
DEBT SUMMARY
| | Balance as of | | | | | |
| | 3/31/2015 | | Interest Rate: | | Maturity Date | |
Revolving Credit Facility Debt | | $ | 73,000 | | 1.7 | % | 9/18/2018 | |
Mortgage Debt | | | | | | | |
Canton MOB | | 6,180 | | 5.9 | % | 6/6/2017 | |
Firehouse Square | | 2,749 | | 6.6 | % | 9/6/2017 | |
Hackley Medical Center | | 5,368 | | 5.9 | % | 1/6/2017 | |
MeadowView Professional Center | | 10,362 | | 5.8 | % | 6/6/2017 | |
Mid Coast Hospital MOB | | 7,817 | | 4.8 | % | 5/16/2016 | |
Remington Medical Commons | | 4,365 | | 2.9 | % | 9/28/2017 | |
Valley West Hospital MOB | | 4,850 | | 4.8 | % | 12/1/2020 | |
Oklahoma City, OK MOB | | 7,603 | | 4.7 | % | 1/10/2021 | |
Crescent City Surgical Center | | 18,750 | | 5.0 | % | 1/23/2019 | |
San Antonio Hospital | | 9,619 | | 5.0 | % | 6/26/2022 | |
Savage MOB (2) | | 5,858 | | 5.0 | % | 2/1/2022 | |
Total / Weighted Average | | $ | 156,521 | | 3.5 | % | 3.89 | (1) |
(1) Weighted average maturity of mortgage debt only
(2) Excludes market value adjustment of $0.4 million

11
FINANCIAL STATISTICS
(Unaudited and in thousands, except share and per share data)
| | Quarter Ended | |
| | March 31, 2015 | |
| | | |
Annualized dividend rate(1) | | $ | 0.90 | |
Price per share(2) | | $ | 17.61 | |
Annualized dividend yield | | 5.11 | % |
| | | |
Total debt | | $ | 156,952 | |
Net debt (less cash) | | 121,178 | |
Adjusted EBITDA (annualized)* | | 64,496 | |
Net Debt / Adjusted EBITDA Ratio | | 1.88 | x |
| | | |
Adjusted EBITDA (annualized)* | | $ | 64,496 | |
Cash interest expense (annualized)* | | 5,668 | |
Interest Coverage Ratio | | 11.38 | x |
| | | |
Total interest | | $ | 1,710 | |
Secured debt principal amortization | | 466 | |
Total fixed charges | | $ | 2,176 | |
Adjusted EBITDA | | 16,124 | |
Adjusted EBITDA fixed charge coverage ratio | | 7.41 | x |
| | | |
Equity market cap | | $ | 1,302,348 | |
Redeemable equity | | 13,721 | |
Total debt | | 156,952 | |
Total Firm Value | | $ | 1,473,021 | |
| | | |
Total debt | | $ | 156,952 | |
Total assets | | 1,066,207 | |
Total Debt / Total Assets | | 14.7 | % |
Total Debt / Total Firm Value | | 10.7 | % |
| | | |
Weighted Average common shares | | 65,649,478 | |
Weighted average unvested restricted common shares | | 349,637 | |
Weighted average units | | 3,497,234 | |
Weighted Average Common Shares and Units - Diluted | | 69,496,349 | |
(1) Annualized rate based on $0.225 quarterly dividend for the quarter ending March 31, 2015. Actual dividend amounts will be determined by the Trust’s board of trustees based on a variety of factors.
(2) Closing share price of $17.61 as of March 31, 2015.
* Amounts are annualized and actual amounts may differ significantly from the annualized amounts shown.
12
SAME-STORE PORTFOLIO PERFORMANCE AND TENANT OCCUPANCY
(Unaudited and in thousands, except square footage data)
SAME-STORE PORTFOLIO ANALYSIS
| | Portfolio | | Same-Store | | 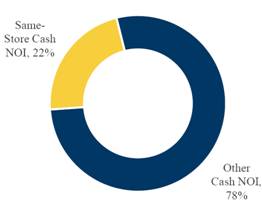
|
| | 3 Months | | 3 Months | |
| | Ended 03/31/15 | | Ended 03/31/15 | |
Number of properties | | 109 | | 25 | |
Gross leasable area | | 3,993,783 | | 871,160 | |
Cash NOI | | $ | 17,638 | | $ | 5,032 | |
% Leased | | 94.6 | % | 84.6 | % |
| | | | | |
| | | | | |
| | | | | |
| | | | | |
| | | | | | | | |
SAME-STORE PORTFOLIO PERFORMANCE
| | Year-over-year Comparison | | Sequential Comparison | |
| | 1Q15 | | 1Q14 | | Change | | 1Q15 | | 4Q14 | | Change | |
Number of properties | | 25 | | 25 | | — | | 25 | | 25 | | — | |
Gross leasable area | | 871,160 | | 871,160 | | — | | 871,160 | | 871,160 | | — | |
% Leased | | 84.6 | % | 84.5 | % | 10 | bps | 84.6 | % | 84.6 | % | 0 | bps |
Rental revenues | | 6,220 | | 6,227 | | -0.1 | % | 6,220 | | 6,207 | | +0.2 | % |
Operating expenses | | (1,188 | ) | (1,311 | ) | -9.4 | % | (1,188 | ) | (1,145 | ) | +3.8 | % |
Same-property Cash NOI | | 5,032 | | 4,916 | | +2.4 | % | 5,032 | | 5,062 | | -0.6 | % |
TENANT OCCUPANCY
| | Quarter Ending | | Percentage of Total | |
| | 03/31/15 | | GLA at 03/31/15 | |
Total GLA | | | | | |
Total square feet beginning of quarter | | 3,100,785 | (1) | 77.6 | % |
Acquired GLA | | 913,327 | | 22.9 | % |
Disposed GLA | | (20,329 | ) | -0.5 | % |
Total square feet end of quarter | | 3,993,783 | | 100.0 | % |
| | | | | |
Occupied GLA | | | | | |
Occupied GLA beginning of quarter | | 2,933,371 | | 73.4 | % |
| | | | | |
Leases expiring in quarter | | (20,773 | ) | -0.5 | % |
Leases renewed in quarter | | 13,013 | | 0.3 | % |
Retention Rate | | 63 | % | | |
New leases commencing in quarter | | 500 | | 0.0 | % |
Net absorption/(vacancy Loss) | | (7,260 | ) | -0.2 | % |
| | | | | |
Net occupied GLA acquired / (disposed) | | 850,982 | | 21.3 | % |
Occupied GLA end of quarter | | 3,777,093 | | 94.6 | % |
(1) Resizing adjustment increased square footage by 84 SF from 3,100,701 SF reported in 4Q14 supplemental.
13
INVESTMENT ACTIVITY AND LEASE EXPIRATION SCHEDULE
INVESTMENT ACTIVITY
| | | | Acquisition | | Cash | | % | | Purchase | | | |
Property | | Location | | Date | | Cap Rate | | Leased | | Price | | GLA | |
610 19th Street | | Columbus, GA | | 1/23/2015 | (1) | 8.1 | % | 100 | % | 6,540 | | 37,995 | |
Methodist Sports | | Greenwood, IN | | 1/28/2015 | | 7.6 | % | 100 | % | 10,000 | | 38,000 | |
Indianapolis South MOB | | Greenwood, IN | | 2/13/2015 | | 9.0 | % | 81 | % | 17,183 | | 118,934 | |
Minneapolis Portfolio | | Minneapolis, MN | | 2/17/2015 | (2) | 6.4 | % | 98 | % | 116,305 | | 362,355 | |
Bridgeport Medical Center | | Lakewood, WA | | 2/27/2015 | | 6.9 | % | 100 | % | 13,750 | | 31,074 | |
Baylor Cancer Center | | Dallas, TX | | 2/27/2015 | | 6.4 | % | 100 | % | 8,200 | | 21,470 | |
Renaissance Office Bldg. | | Milwaukee, WI | | 3/27/2015 | | 7.5 | % | 72 | % | 6,500 | | 108,843 | |
Rochester MOBs | | Rochester, NY | | 3/31/2015 | | 7.1 | % | 100 | % | 41,000 | | 149,939 | |
Avalon Park MOB | | Orlando, FL | | 3/31/2015 | | 7.1 | % | 93 | % | 14,600 | | 44,717 | |
Premier Surgery Center | | Louisville, KY | | 4/10/2015 | | 6.2 | % | 100 | % | 8,000 | | 18,887 | |
Baton Rouge MOB | | Baton Rouge, LA | | 4/15/2015 | | 7.0 | % | 100 | % | 10,486 | | 25,269 | |
Health Park MOB | | Grand Blanc, MI | | 4/30/2015 | | 6.9 | % | 100 | % | 18,913 | | 59,347 | |
Plaza HCA MOB | | Jacksonville, FL | | 4/30/2015 | | 7.7 | % | 100 | % | 19,000 | | 44,354 | |
Total / Weighted Average | | | | | | 7.0 | % | 94 | % | $ | 290,477 | | 1,061,184 | |
| | | | | | | | | | | | | | |
(1) $28.0 million of the Columbus Regional Health Portfolio closed 11/20/14 and $6.5 million closed on 1/23/15
(2) $48.2 million of the Minneapolis portfolio closed on 1/22/15, $18.4 million closed on 1/29/15, $38.8 million closed on 2/5/15, and $10.9 million closed on 2/17/15
LEASE EXPIRATION SCHEDULE
(As of March 31, 2015)
Expiration | | Expiring | | Expiring Lease | | % of Total | | Expiring Lease | | % of Total | | Average Rent | |
Year | | Leases | | GLA | | GLA | | ABR | | ABR | | Per SF | |
2015 | | 31 | | 81,879 | | 2.1 | % | $ | 1,561 | | 1.9 | % | $ | 19.06 | |
2016 | | 41 | | 181,915 | | 4.6 | % | 3,897 | | 4.7 | % | 21.42 | |
2017 | | 50 | | 215,056 | | 5.4 | % | 4,590 | | 5.6 | % | 21.34 | |
2018 | | 49 | | 292,489 | | 7.3 | % | 5,574 | | 6.7 | % | 19.06 | |
2019 | | 32 | | 270,351 | | 6.8 | % | 5,819 | | 7.0 | % | 21.52 | |
2020 | | 21 | | 76,128 | | 1.9 | % | 1,548 | | 1.9 | % | 20.33 | |
2021 | | 17 | | 95,916 | | 2.4 | % | 2,195 | | 2.7 | % | 22.88 | |
2022 | | 16 | | 138,791 | | 3.5 | % | 3,351 | | 4.1 | % | 24.14 | |
2023 | | 30 | | 304,121 | | 7.6 | % | 6,786 | | 8.2 | % | 22.31 | |
2024 | | 52 | | 557,661 | | 14.0 | % | 10,651 | | 12.9 | % | 19.10 | |
Thereafter: | | 64 | | 1,538,643 | | 38.5 | % | 36,401 | | 44.0 | % | 23.66 | |
| | | | — | | | | | | | | | |
MTM | | 10 | | 24,143 | | 0.6 | % | 291 | | 0.4 | % | 12.05 | |
Vacant | | | | 216,690 | | 5.4 | % | | | | | | |
Total/W.A. | | 413 | | 3,993,783 | | 100.0 | % | $ | 82,664 | | 100.0 | % | $ | 22.08 | |
14
PORTFOLIO GEOGRAPHIC DISTRIBUTION
(As of March 31, 2015)
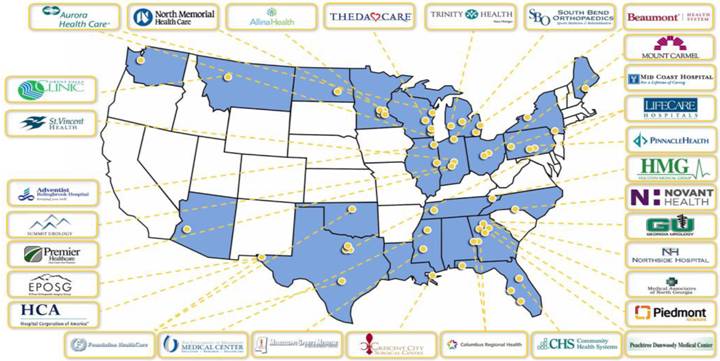
TOP TEN STATES
| State | | GLA | |
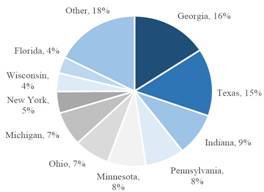
| Georgia | | 631,402 | |
Texas | | 579,844 | |
Indiana | | 368,746 | |
Pennsylvania | | 324,006 | |
Minnesota | | 317,133 | |
Ohio | | 293,048 | |
Michigan | | 292,710 | |
New York | | 185,365 | |
Wisconsin | | 159,842 | |
Florida | | 139,923 | |
Other | | 701,764 | |
Total | | 3,993,783 | |
| | | |
15
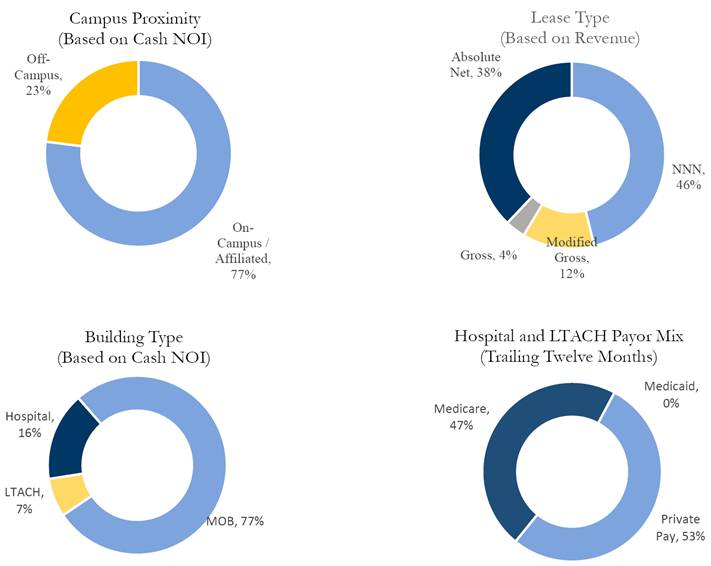
PORTFOLIO DIVERSIFICATION
(As of March 31, 2015)
| | | | | | | | | | Coverage | |
| | # of Buildings | | GLA | | % of Total | | % Leased | | Ratio | |
Single-tenant MOBs | | 45 | | 1,255,481 | | 31.4 | % | 99.4 | % | N/A | |
Multi-tenant MOBs | | 57 | | 2,158,025 | | 54.0 | % | 90.3 | % | N/A | |
Hospitals | | 4 | | 269,925 | | 6.8 | % | 100.0 | % | 3.5 | x |
LTACHs | | 3 | | 310,352 | | 7.8 | % | 100.0 | % | 3.0 | x |
Total | | 109 | | 3,993,783 | | 100.0 | % | 94.6 | % | | |
THREE MONTH PERIOD ENDING 3/31/15
16
TOP 10 HEALTH SYSTEM RELATIONSHIPS
(As of March 31, 2015, $ in thousands)
| | Weighted Avg. | | | | | | | | % of Total | |
| | Remaining | | Leased | | % of Total | | Annualized | | Annualized | |
Tenant | | Lease Term | | GLA | | GLA | | Base Rent | | Base Rent | |
LifeCare | | 13.0 | | 310,352 | | 7.8 | % | 4,802 | | 5.8 | % |
East El Paso Physicians Medical Center | | 13.7 | | 77,000 | | 1.9 | % | 3,381 | | 4.1 | % |
Wayne State University Physician Group | | 14.7 | | 176,000 | | 4.4 | % | 3,168 | | 3.8 | % |
Crescent City Surgical Centre | | 13.8 | | 60,000 | | 1.5 | % | 3,090 | | 3.7 | % |
Foundation Hospital of San Antonio, LLC | | 14.2 | | 68,786 | | 1.7 | % | 2,971 | | 3.6 | % |
Northside Hospital | | 7.9 | | 88,003 | | 2.2 | % | 2,290 | | 2.8 | % |
Mid Ohio Oncology | | 9.4 | | 98,325 | | 2.5 | % | 2,232 | | 2.7 | % |
Pinnacle Health | | 9.5 | | 105,199 | | 2.6 | % | 2,029 | | 2.5 | % |
Columbus Regional Health System | | 11.0 | | 125,189 | | 3.1 | % | 1,906 | | 2.3 | % |
University of Rochester Cancer Center | | 14.2 | | 92,152 | | 2.3 | % | 1,836 | | 2.2 | % |
Total/W.A. | | 12.1 | | 1,201,006 | | 30.1 | % | 27,705 | | 33.5 | % |

| 
| |
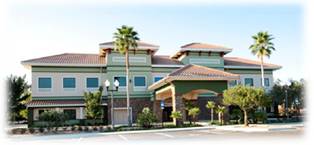
University of Rochester Strong Memorial Portfolio
Rochester, NY | The Oaks Medical Building
Lady Lake, FL | |
| | |
| 
| |
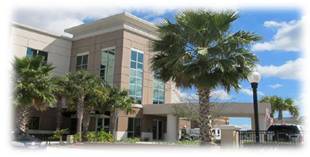
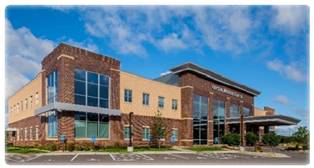
Avalon Park Florida Hospital MOB Avalon
Park, FL | Crystal Medical Center
Crystal, MN | |
17
CONSOLIDATED BALANCE SHEETS
(In thousands, except share data)
| | March 31, | | December 31, | |
| | 2015 | | 2014 | |
ASSETS | | (unaudited) | | (audited) | |
Investment properties: | | | | | |
Land and improvements | | $ | 99,950 | | $ | 79,334 | |
Building and improvements | | 817,673 | | 644,086 | |
Tenant improvements | | 6,417 | | 5,614 | |
Acquired lease intangibles | | 109,173 | | 72,985 | |
| | 1,033,213 | | 802,019 | |
Accumulated depreciation | | (53,451 | ) | (45,569 | ) |
Net real estate property | | 979,762 | | 756,450 | |
Real estate loans receivable | | 16,094 | | 15,876 | |
Investment in unconsolidated entity | | 1,324 | | 1,324 | |
Net real estate investments | | 997,180 | | 773,650 | |
Cash and cash equivalents | | 35,774 | | 15,923 | |
Tenant receivables, net | | 2,127 | | 1,324 | |
Deferred costs, net | | 4,601 | | 4,870 | |
Other assets | | 26,525 | | 15,806 | |
Total assets | | $ | 1,066,207 | | $ | 811,573 | |
LIABILITIES AND EQUITY | | | | | |
Liabilities: | | | | | |
Credit facility | | $ | 73,000 | | $ | 78,105 | |
Mortgage debt | | 83,952 | | 138,000 | |
Accounts payable | | 448 | | 700 | |
Dividends payable | | 16,722 | | 16,548 | |
Accrued expenses and other liabilities | | 13,029 | | 6,140 | |
Acquired lease intangibles, net | | 3,056 | | 2,871 | |
Total liabilities | | 190,207 | | 242,364 | |
Redeemable Noncontrolling Interest - Operating Partnership and partially owned properties | | 13,721 | | — | |
Equity: | | | | | |
Common shares, $0.01 par value, 500,000,000 shares authorized, 69,943,001 and 50,640,863 shares issued and outstanding as of March 31, 2015 and December 31, 2014, respectively | | 703 | | 510 | |
Additional paid-in capital | | 886,092 | | 586,017 | |
Accumulated deficit | | (68,161 | ) | (51,797 | ) |
Total shareholders’ equity | | 818,634 | | 534,730 | |
Noncontrolling interests: | | | | | |
Operating Partnership | | 42,430 | | 33,727 | |
Partially owned properties | | 1,215 | | 752 | |
Total noncontrolling interest | | 43,645 | | 34,479 | |
Total equity | | 862,279 | | 569,209 | |
Total liabilities and equity | | $ | 1,066,207 | | $ | 811,573 | |
18
CONSOLIDATED STATEMENT OF OPERATIONS
(in thousands, except share and per share data)
| | Three Months Ended | |
| | March 31, | |
| | 2015 | | 2014 | |
Revenues: | | | | | |
Rental revenues | | $ | 20,341 | | $ | 6,808 | |
Expense recoveries | | 3,536 | | 1,070 | |
Interest income on real estate loans and other | | 607 | | 154 | |
Total revenues | | 24,484 | | 8,032 | |
Expenses: | | | | | |
Interest expense | | 1,710 | | 1,281 | |
General and administrative | | 3,352 | | 2,014 | |
Operating expenses | | 5,709 | | 1,609 | |
Depreciation and amortization | | 8,240 | | 2,416 | |
Acquisition expenses | | 5,932 | | 4,287 | |
Total expenses | | 24,943 | | 11,607 | |
Loss before equity in income of unconsolidated entity, loss on sale of investment property, and noncontrolling interests: | | (459 | ) | (3,575 | ) |
Equity in income of unconsolidated entity | | 26 | | 17 | |
Loss on sale of investment property | | (15 | ) | — | |
Net loss | | (448 | ) | (3,558 | ) |
Net (income) loss attributable to noncontrolling interests: | | | | | |
Operating Partnerhip | | 24 | | 531 | |
Partially owned properties | | (32 | ) | (66 | ) |
Net loss attributable to controlling interest | | (456 | ) | (3,093 | ) |
Preferred distributions | | (66 | ) | — | |
Net loss attributable to common shareholders | | $ | (522 | ) | $ | (3,093 | ) |
Net loss per share: | | | | | |
Basic and diluted | | $ | (0.01 | ) | $ | (0.15 | ) |
Weighted average common shares | | | | | |
Basic and diluted | | 65,649,478 | | 21,298,597 | |
| | | | | |
Dividends and distributions declared per common share and unit | | $ | 0.225 | | $ | 0.225 | |
19
GLOSSARY
Adjusted Earnings Before Interest Taxes, Depreciation and Amortization (Adjusted EBITDA): We define Adjusted EBITDA for DOC as net (loss) income computed in accordance with GAAP plus depreciation, amortization, interest expense and net change in the fair value of derivative financial instruments, net (loss) included from discontinued operations, stock based compensation, acquisition-related expenses, and other non-reoccurring items. We consider Adjusted EBITDA an important measure because it provides additional information to allow management, investors, and our current and potential creditors to evaluate and compare our core operating results and our ability to service debt.
Annualized Base Rent: Annualized base rent is calculated by multiplying contractual base rent for September 2014 by 12 (but excluding the impact of concessions and straight-line rent).
Earnings Before Interest Taxes, Depreciation, Amortization and Rent (EBITDAR): We define EBITDAR for DOC as net (loss) income computed in accordance with GAAP plus depreciation, amortization, interest expense and net change in the fair value of derivative financial instruments, net (loss) included from discontinued operations, stock based compensation, acquisition-related expenses and lease expense. We consider EBITDAR an important measure because it provides additional information to allow management, investors, and our current and potential creditors to evaluate and compare our tenants ability to fund their rent obligations.
Funds From Operations (FFO): Funds from operations, or FFO, is a widely recognized measure of REIT performance. Although FFO is not computed in accordance with generally accepted accounting principles, or GAAP, we believe that information regarding FFO is helpful to shareholders and potential investors because it facilitates an understanding of the operating performance of our initial properties without giving effect to real estate depreciation and amortization, which assumes that the value of real estate assets diminishes ratably over time. Because real estate values have historically increased or decreased with market conditions, we believe that FFO provides a more meaningful and accurate indication of our performance. We calculate FFO in accordance with standards established by the National Association of Real Estate Investment Trusts, (“NAREIT”). NAREIT defines FFO as net income (computed in accordance with GAAP) before noncontrolling interests of holders of OP units, excluding preferred distributions, gains (or losses) on sales of depreciable operating property, impairment write-downs on depreciable assets and extraordinary items (computed in accordance with GAAP), plus real estate related depreciation and amortization (excluding amortization of deferred financing costs). Our FFO computation may not be comparable to FFO reported by other REITs that do not compute FFO in accordance with NAREIT definition or that interpret the NAREIT definition differently than we do. The GAAP measure that we believe to be most directly comparable to FFO, net income (loss), includes depreciation and amortization expenses, gains or losses on property sales, impairments and noncontrolling interests. In computing FFO, we eliminate these items because, in our view, they are not indicative of the results from the operations of our properties. To facilitate a clear understanding of our historical operating result, FFO should be examined in conjunction with net income (determined in accordance with GAAP) as presented in our financial statements. FFO does not represent cash generated from operating activities in accordance with GAAP, should not be considered to be an alternative to net income (loss) (determined in accordance with GAAP) as a measure of our liquidity and is not indicative of funds available for our cash needs, including our ability to make cash distributions to shareholders.
Gross Leasable Area (GLA): Gross leasable area (in square feet).
Gross Real Estate Investments: Based on acquisition price (and includes lease intangibles).
Health System-Affiliated: Properties are considered affiliated with a health system if one or more of the following conditions are met: 1) the land parcel is contained within the physical boundaries of a hospital campus; 2) the land parcel is located adjacent to the campus; 3) the building is physically connected to the hospital regardless of the land ownership structure; 4) a ground lease is maintained with a health system entity; 5) a master lease is maintained with a health system entity; 6) significant square footage is leased to a health system entity; 7) the property includes an ambulatory surgery center with a hospital partnership interest; or (8) a significant square footage is leased to a physician group that is either employed, directly or indirectly by a health system, or has a significant clinical and financial affiliation with the health system.
Hospitals: Hospitals refer to specialty surgical hospitals. These hospitals provide a wide range of inpatient and outpatient services, including but not limited to, surgery and clinical laboratories.
LTACHs: Long-term acute care hospitals (LTACH) provide inpatient services for patients with complex medical conditions who require more sensitive care, monitoring or emergency support than that available in most skilled nursing facilities.
Medical Office Building: Medical office buildings are office and clinic facilities, often located near hospitals or on hospital campuses, specifically constructed and designed for use by physicians and other health care personnel to provide services to their patients. They may also include ambulatory surgery centers that are used for general or specialty surgical procedures not requiring an overnight stay in a hospital. Medical office buildings may contain sole and group physician practices and may provide laboratory and other patient services.
Net Operating Income (NOI): NOI is a non-GAAP financial measure that is defined as net income or loss, computed in accordance with GAAP, generated from DOC’s total portfolio of properties before general and administrative expenses, acquisition-related expenses, depreciation and amortization expense, REIT expenses, interest expense and net change in the fair value of derivative financial instruments, and gains or loss on the sale of discontinued properties. DOC believes that NOI provides an accurate measure of operating performance of its operating assets because NOI excludes certain items that are not associated with management of the properties. Additionally, DOC’s use of the term NOI may not be comparable to that of other real estate companies as they may have different methodologies for computing this amount.
20
GLOSSARY (continued)
Cash Net Operating Income (NOI): Cash NOI is a non-GAAP financial measure which excludes from NOI straight-line rent adjustments, amortization of acquired below and above market leases and other non-cash and normalizing items. Other non-cash and normalizing items include items such as the amortization of lease inducements, and payment received from a seller master lease. DOC believes that Cash NOI provides an accurate measure of the operating performance of its operating assets because it excludes certain items that are not associated with management of the properties. Additionally, DOC believes that Cash NOI is a widely accepted measure of comparative operating performance in the real estate community. However, DOC’s use of the term Cash NOI may not be comparable to that of other real estate companies as such other companies may have different methodologies for computing this amount.
Normalized Funds Available for Distribution (Normalized FAD): DOC defines Normalized FAD, a non-GAAP measure, which excludes from Normalized FFO, non-cash compensation expense, straight-line rent adjustments, amortization of acquired above market leases, amortization of deferred financing costs and amortization of lease inducements and recurring capital expenditures, including leasing costs and tenant and capital improvements. FAD includes payments received from a seller master lease. DOC believes Normalized FAD provides a meaningful supplemental measure of its ability to fund its ongoing distributions. Normalized FAD should not be considered as an alternative to net income or loss attributable to controlling interest (computed in accordance with GAAP) as an indicator of DOC’s financial performance or to cash flow from operating activities (computed in accordance with GAAP) as an indicator of DOC’s liquidity. Normalized FAD should be reviewed in connection with other GAAP measurements.
Normalized Funds From Operations (Normalized FFO): Changes in the accounting and reporting rules under GAAP have prompted a significant increase in the amount of non-operating items included in FFO, as defined. Therefore, DOC uses Normalized FFO, which excludes from FFO acquisition-related expenses, net change in fair value of derivative financial instruments, non-controlling income from operating partnership units included in diluted shares, acceleration of deferred financing costs, and other normalizing items. However, DOC’s use of the term Normalized FFO may not be comparable to that of other real estate companies as they may have different methodologies for computing this amount. Normalized FFO should not be considered as an alternative to net income or loss attributable to controlling interest (computed in accordance with GAAP) as an indicator of DOC’s financial performance or to cash flow operating activities (computed in accordance with GAAP) as an indicator of DOC’s liquidity, nor its indicative of funds available to fund DOC’s cash needs, including its ability to make distributions. Normalized FFO should be reviewed in connection with other GAAP measurements.
Occupancy: Occupancy represents the percentage of total gross leasable area that is leased, including month-to-month leases and leases that are signed but not yet commenced, as of the date reported.
Off-Campus: A building portfolio that is not located on or adjacent to key hospital based-campuses and is not affiliated with recognized healthcare systems.
On-Campus / Affiliated: On-campus refers to a property that is located on or within a quarter mile to a healthcare system. Affiliated refers to a property that is not on the campus of a healthcare system, but anchored by a healthcare system.
Same-Store Portfolio: The same-store portfolio consists of properties held by the Company for the entire preceding year and not currently slated for disposition.
21


