
May 2016 Annual Shareholders Meeting IMS Portfolio – Avondale Medical Building Peachtree Dunwoody Medical Center
1 This document may contain “forward-looking” statements as defined in the Private Securities Litigation Reform Act of 1995. These forward-looking statements concern and are based upon, among other things, the possible expansion of the company’s portfolio; the sale of properties; the performance of its operators/tenants and properties; its ability to enter into agreements with new viable tenants for vacant space or for properties that the company takes back from financially troubled tenants, if any; its occupancy rates; its ability to acquire, develop and/or manage properties; the ability to successfully manage the risks associated with international expansion and operations; its ability to make distributions to shareholders; its policies and plans regarding investments, financings and other matters; its tax status as a real estate investment trust; its critical accounting policies; its ability to appropriately balance the use of debt and equity; its ability to access capital markets or other sources of funds; its ability to meet its earnings guidance; and its ability to finance and complete, and the effect of, future acquisitions. When the company uses words such as “may,” “will,” “intend,” “should,” “believe,” “expect,” “anticipate,” “project,” “estimate” or similar expressions, it is making forward-looking statements. Forward-looking statements are not guarantees of future performance and involve risks and uncertainties. The company’s expected results may not be achieved, and actual results may differ materially from expectations. This may be a result of various factors, including, but not limited to: material differences between actual results and the assumptions, projections and estimates of occupancy rates, rental rates, operating expenses and required capital expenditures; the status of the economy; the status of capital markets, including the availability and cost of capital; issues facing the health care industry, including compliance with, and changes to, regulations and payment policies, responding to government investigations and punitive settlements and operators’/tenants’ difficulty in cost-effectively obtaining and maintaining adequate liability and other insurance; changes in financing terms; competition within the health care, seniors housing and life science industries; negative developments in the operating results or financial condition of operators/tenants, including, but not limited to, their ability to pay rent and repay loans; the company’s ability to transition or sell facilities with profitable results; the failure to make new investments as and when anticipated; acts of God affecting the company’s properties; the company’s ability to re-lease space at similar rates as vacancies occur; the failure of closings to occur as and when anticipated, including the receipt of third-party approvals and health care licenses without unexpected delays or conditions; the company’s ability to timely reinvest sale proceeds at similar rates to assets sold; operator/tenant or joint venture partner bankruptcies or insolvencies; the cooperation of joint venture partners; government regulations affecting Medicare and Medicaid reimbursement rates and operational requirements; regulatory approval and market acceptance of the products and technologies of life science tenants; liability or contract claims by or against operators/tenants; unanticipated difficulties and/or expenditures relating to future acquisitions and the integration of multi-property acquisitions; environmental laws affecting the company’s properties; changes in rules or practices governing the company’s financial reporting; the movement of U.S. and foreign currency exchange rates; and legal and operational matters, including real estate investment trust qualification and key management personnel recruitment and retention. Finally, the company assumes no obligation to update or revise any forward-looking statements or to update the reasons why actual results could differ from those projected in any forward-looking statements.
2 Company Overview DOC is an internally managed healthcare REIT with a focus on acquiring and managing medical office buildings (“MOB”s) and other healthcare facilities The Company’s corporate strategy focuses on leveraging its physician and hospital relationships nationwide to invest in off-market assets that maximize risk-adjusted returns to shareholders Management team has maintained a conservative balance sheet while investing over $2.4 billion in real estate assets since DOC’s IPO in 2013 As of 3/31/16, DOC owned 167 properties across 27 states, spanning 6.5mm sq. ft. of net leasable area, 96% leased DOC expects to close the recently announced $719mm Catholic Health Initiatives (“CHI”) acquisition of 51 properties in 2Q16 DOC raised over $750 million of equity through two follow-on offerings in 2016 Significant Recent Events April 2016 – DOC announced the CHI transaction, $202mm of 1Q16 acquisitions, completed a $442mm follow-on equity offering and increased 2016 acquisition guidance to $1.0 - $1.25B January 2016 – DOC announced the closing of a $150mm private placement debt offering (11.8 year average term, 4.5% interest rate) and completed a $321mm follow-on equity offering July 2015 - DOC upsized its unsecured revolving credit facility to $750 million August 2015 - DOC received an investment grade rating of Baa3 from Moody’s

3 Board of Directors Expertise in healthcare operations, healthcare policy, hospital and physician administration Tommy Thompson Former Secretary of U.S. Health and Human Services; Former Governor, state of Wisconsin Founding chairman Deloitte Center for Health Solutions, previously senior adviser to Deloitte and Touche USA LLP Current board member of: CareView Communications, Inc., Centene Corporation, C.R. Bard Inc., United Therapeutics Corporation, among others Stanton Anderson Senior Counsel to the President and CEO of the U.S. Chamber of Commerce where he served as Executive VicePresident and Chief Legal Officer Former Director and Audit Committee Chairman for CB Richard Ellis Former partner with McDermott Will & Emery Mark Baumgartner Senior Managing Director – Chief Credit Officer, B.C. Ziegler and Company Albert Black Current President and CEO of On-Target Supplies & Logistics, Ltd. Former Past Chairman of Baylor Health Care System Dallas Former Chairman, Dallas Regional Chamber of Commerce Richard Weiss, Esq. Former Board Chair for Washington Hospital Center and current Finance Board Chair for Aurora Healthcare Former Trustee for Medical College of Wisconsin and board Chairman of a private psychiatric hospital Former Partner with Foley & Lardner William Ebinger, M.D. Practicing Physician / Executive with Aurora Healthcare, the largest healthcare delivery system in Wisconsin Current President of Aurora Medical Center in Grafton, Wisconsin Member of American Board of Internal Medicine = Independent Director
4 Management Overview Expertise in healthcare operations, healthcare policy, hospital and physician administration John Thomas President and Chief Executive Officer, Trustee Former Executive Vice President – Medical Facilities Group for Health Care REIT, Inc. (NYSE:HCN); $5.8 billion portfolio Former President, Chief Development Officer, and Business Counsel of Cirrus Health Former Senior Vice President and General Counsel for Baylor Healthcare System from October 2000 to July 2005, a multi-billion dollar healthcare system Jeff Theiler EVP – Chief Financial Officer Former lead Health Care and Lab Space Equity Research Analyst at Green Street Advisors Former real estate investment banker at Lehman Brothers and Bank of America John Sweet EVP – Chief Investment Officer Co-founder Windrose Medical Properties; Vice President – Business Development for Windrose Former Managing Director of Ziegler Healthcare Real Estate Funds Deeni Taylor EVP – Investments Former EVP of Duke Realty from 2006 to 2015 Former EVP and Chief Strategy Officer for St. Vincent Health John Lucey SVP – Accounting and Reporting Officer Former Director of Financial Reporting with Assisted Living Concepts, Inc. (NYSE: ALC) Former manager of Financial Reporting and Division Controller for many enterprises including Case New Holland, Monster Worldwide, Inc., Alterra Healthcare Corporation (now Brookdale Living Communities, NYSE: BKD) Mark Theine SVP – Asset and Investment Management Former co-manager of Ziegler Healthcare Real Estate portfolio from 2005 to 2013 Bradley Page SVP – General Counsel Former attomey at Davis & Kuelthau s.c.; represented businesses in all areas of commercial real estate, commercial lending, corporate and construction transactions Member of American Bar Association, State Bar of Wisconsin and Milwaukee Bar Association Holds L.L.M. in Administrative and Civil law, U.S. Army, The Judge Advocate General's School, a J.D. from University of Wisconsin Law School and a B.B.A. from University of Michigan
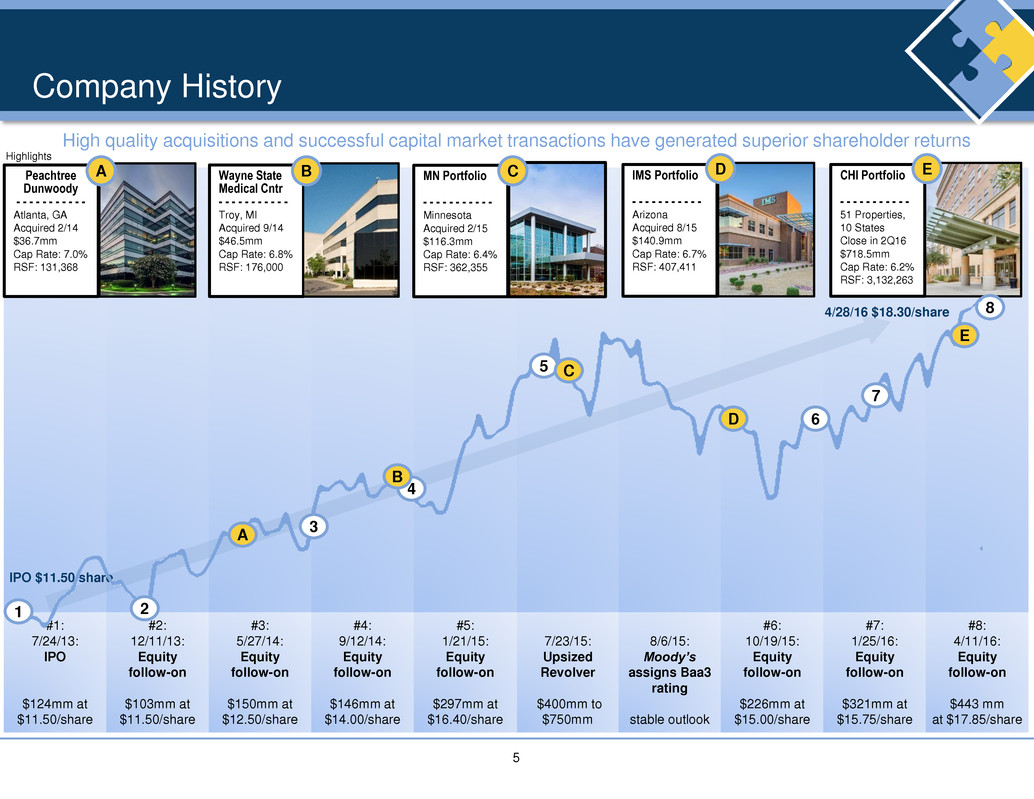
5 #1: 7/24/13: IPO $124mm at $11.50/share #2: 12/11/13: Equity follow-on $103mm at $11.50/share #3: 5/27/14: Equity follow-on $150mm at $12.50/share #4: 9/12/14: Equity follow-on $146mm at $14.00/share #5: 1/21/15: Equity follow-on $297mm at $16.40/share 7/23/15: Upsized Revolver $400mm to $750mm 8/6/15: Moody’s assigns Baa3 rating stable outlook #6: 10/19/15: Equity follow-on $226mm at $15.00/share #7: 1/25/16: Equity follow-on $321mm at $15.75/share #8: 4/11/16: Equity follow-on $443 mm at $17.85/share Company History High quality acquisitions and successful capital market transactions have generated superior shareholder returns Peachtree Dunwoody - - - - - - - - - - - Atlanta, GA Acquired 2/14 $36.7mm Cap Rate: 7.0% RSF: 131,368 MN Portfolio - - - - - - - - - - - Minnesota Acquired 2/15 $116.3mm Cap Rate: 6.4% RSF: 362,355 CA CHI Portfolio - - - - - - - - - - - 51 Properties, 10 States Close in 2Q16 $718.5mm Cap Rate: 6.2% RSF: 3,132,263 IMS Portfolio - - - - - - - - - - - Arizona Acquired 8/15 $140.9mm Cap Rate: 6.7% RSF: 407,411 D EWayne State Medical Cntr - - - - - - - - - - - Troy, MI Acquired 9/14 $46.5mm Cap Rate: 6.8% RSF: 176,000 B IPO $11.50/share 4/28/16 $18.30/share Highlights 8 6 1 2 3 7 5 4 E C A D B
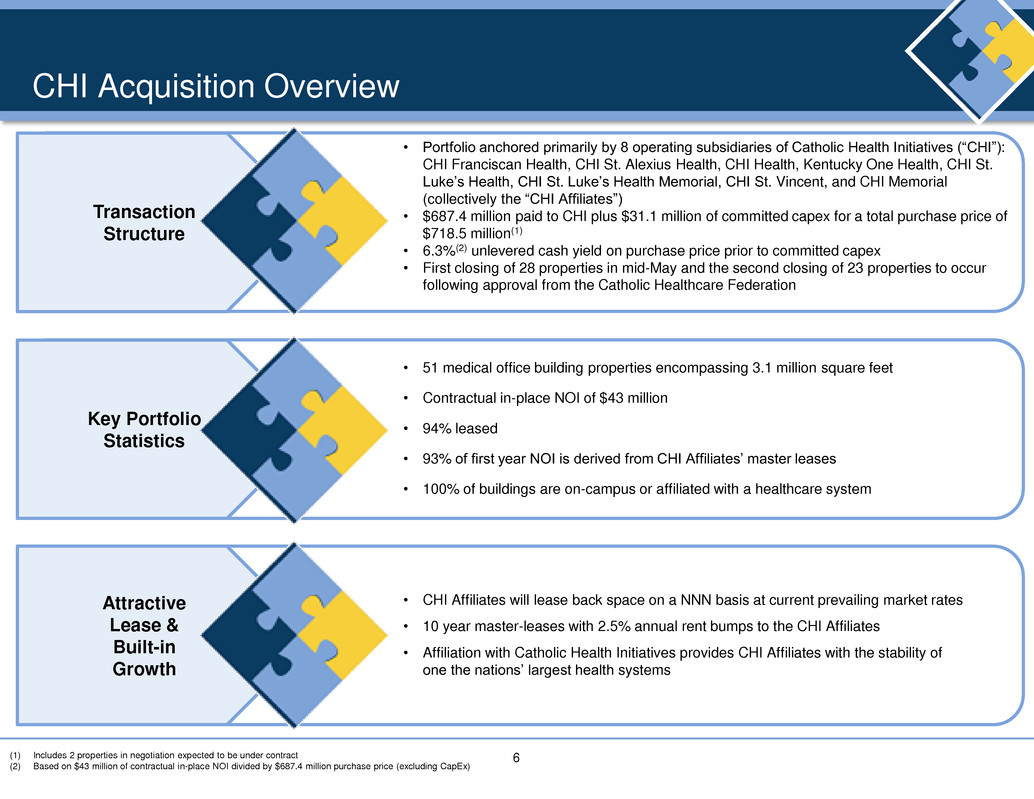
6 CHI Acquisition Overview (1) Includes 2 properties in negotiation expected to be under contract (2) Based on $43 million of contractual in-place NOI divided by $687.4 million purchase price (excluding CapEx) Transaction Structure • Portfolio anchored primarily by 8 operating subsidiaries of Catholic Health Initiatives (“CHI”): CHI Franciscan Health, CHI St. Alexius Health, CHI Health, Kentucky One Health, CHI St. Luke’s Health, CHI St. Luke’s Health Memorial, CHI St. Vincent, and CHI Memorial (collectively the “CHI Affiliates”) • $687.4 million paid to CHI plus $31.1 million of committed capex for a total purchase price of $718.5 million(1) • 6.3%(2) unlevered cash yield on purchase price prior to committed capex • First closing of 28 properties in mid-May and the second closing of 23 properties to occur following approval from the Catholic Healthcare Federation Key Portfolio Statistics • 51 medical office building properties encompassing 3.1 million square feet • Contractual in-place NOI of $43 million • 94% leased • 93% of first year NOI is derived from CHI Affiliates’ master leases • 100% of buildings are on-campus or affiliated with a healthcare system Attractive Lease & Built-in Growth • CHI Affiliates will lease back space on a NNN basis at current prevailing market rates • 10 year master-leases with 2.5% annual rent bumps to the CHI Affiliates • Affiliation with Catholic Health Initiatives provides CHI Affiliates with the stability of one the nations’ largest health systems
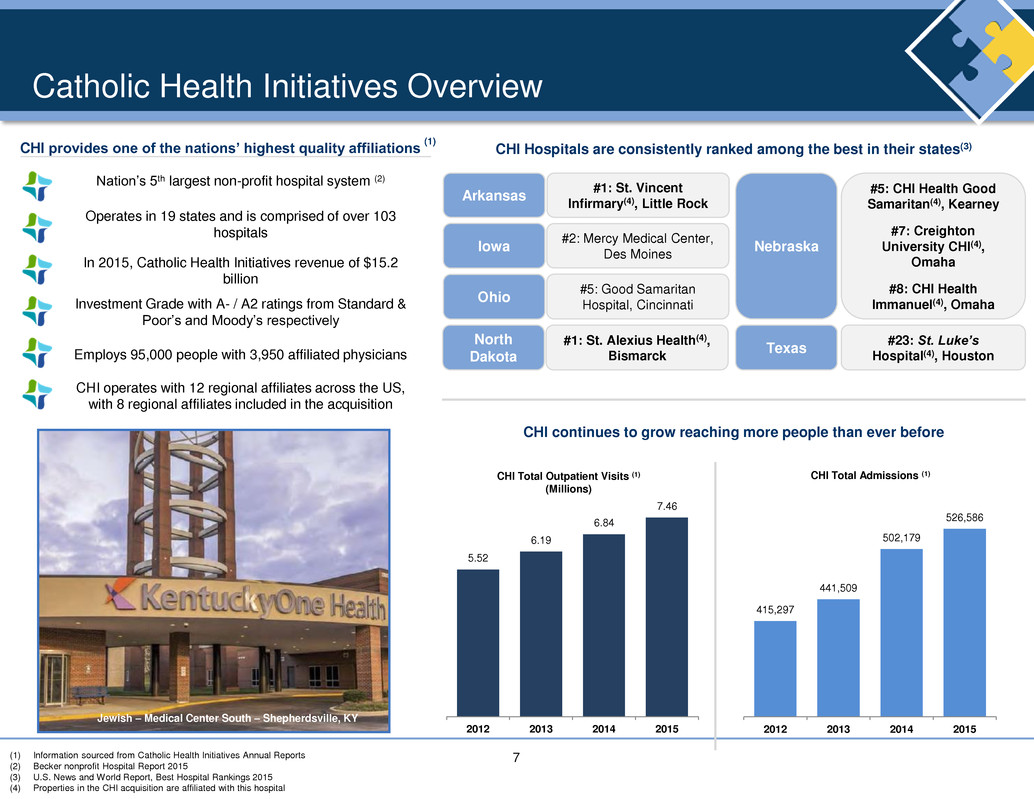
7 415,297 441,509 502,179 526,586 2012 2013 2014 2015 5.52 6.19 6.84 7.46 2012 2013 2014 2015 Catholic Health Initiatives Overview CHI Hospitals are consistently ranked among the best in their states(3) Arkansas Iowa Ohio Nebraska #1: St. Vincent Infirmary(4), Little Rock #2: Mercy Medical Center, Des Moines #5: Good Samaritan Hospital, Cincinnati Texas #23: St. Luke’s Hospital(4), Houston #5: CHI Health Good Samaritan(4), Kearney #7: Creighton University CHI(4), Omaha #8: CHI Health Immanuel(4), Omaha (1) Information sourced from Catholic Health Initiatives Annual Reports (2) Becker nonprofit Hospital Report 2015 (3) U.S. News and World Report, Best Hospital Rankings 2015 (4) Properties in the CHI acquisition are affiliated with this hospital Nation’s 5th largest non-profit hospital system (2) Operates in 19 states and is comprised of over 103 hospitals In 2015, Catholic Health Initiatives revenue of $15.2 billion Investment Grade with A- / A2 ratings from Standard & Poor’s and Moody’s respectively Employs 95,000 people with 3,950 affiliated physicians CHI operates with 12 regional affiliates across the US, with 8 regional affiliates included in the acquisition CHI continues to grow reaching more people than ever before CHI Total Admissions (1)CHI Total Outpatient Visits (1) (Millions) North Dakota #1: St. Alexius Health(4), Bismarck Jewish – Medical Center South – Shepherdsville, KY CHI provides one of the nations’ highest quality affiliations (1)
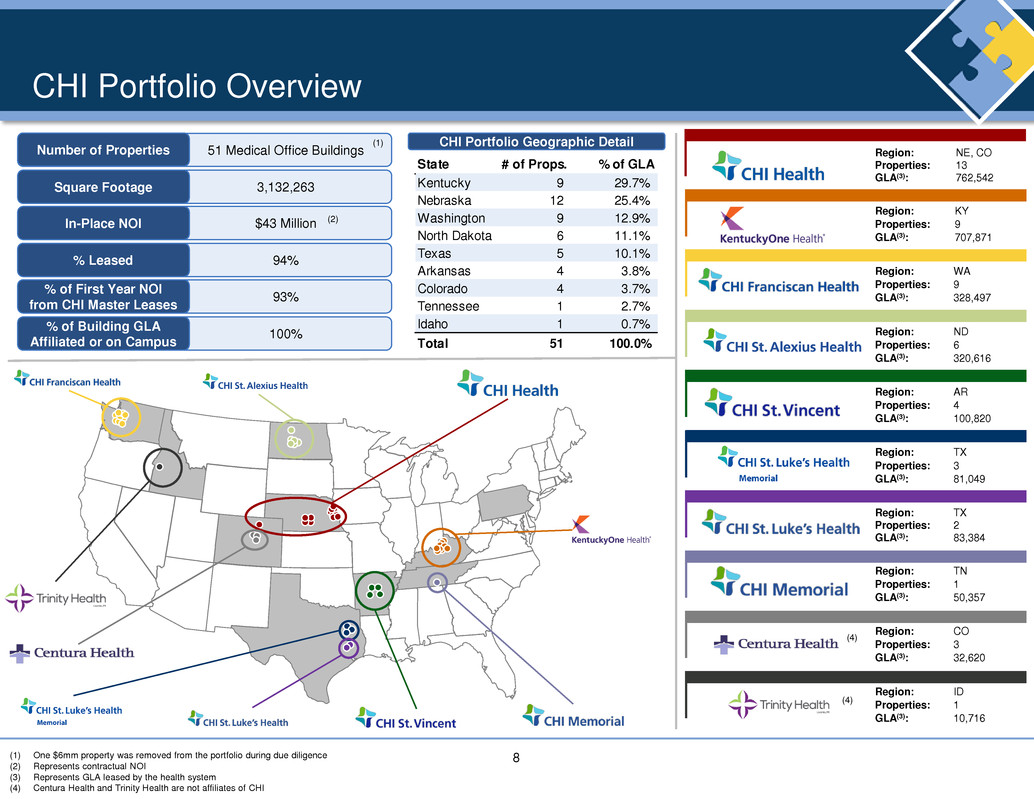
8 State # of Props. % of GLA Kentucky 9 29.7% Nebraska 12 25.4% Washington 9 12.9% North Dakota 6 11.1% Texas 5 10.1% Arkansas 4 3.8% Colorado 4 3.7% Tennessee 1 2.7% Idaho 1 0.7% Total 51 100.0% CHI Portfolio Overview CHI Portfolio Geographic Detail Region: NE, CO Properties: 13 GLA(3): 762,542 Region: KY Properties: 9 GLA(3): 707,871 Region: WA Properties: 9 GLA(3): 328,497 Region: ND Properties: 6 GLA(3): 320,616 Region: AR Properties: 4 GLA(3): 100,820 Region: TX Properties: 3 GLA(3): 81,049 Region: TX Properties: 2 GLA(3): 83,384 Region: TN Properties: 1 GLA(3): 50,357 Region: CO Properties: 3 GLA(3): 32,620 Region: ID Properties: 1 GLA(3): 10,716 (1) One $6mm property was removed from the portfolio during due diligence (2) Represents contractual NOI (3) Represents GLA leased by the health system (4) Centura Health and Trinity Health are not affiliates of CHI Number of Properties Square Footage In-Place NOI % Leased % of First Year NOI from CHI Master Leases % of Building GLA Affiliated or on Campus 51 Medical Office Buildings 3,132,263 $43 Million 94% 93% 100% (4) (4) (2) (1)
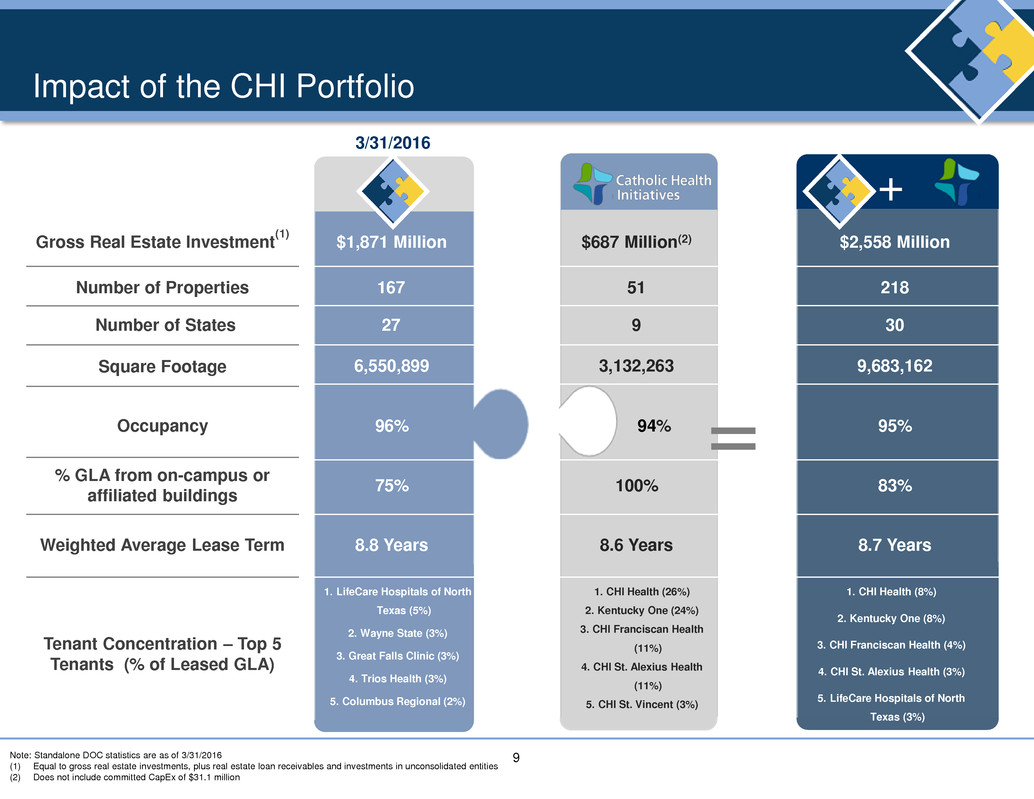
9 Impact of the CHI Portfolio Gross Real Estate Investment (1) Number of Properties Square Footage Occupancy % GLA from on-campus or affiliated buildings Weighted Average Lease Term Tenant Concentration – Top 5 Tenants (% of Leased GLA) Note: Standalone DOC statistics are as of 3/31/2016 (1) Equal to gross real estate investments, plus real estate loan receivables and investments in unconsolidated entities (2) Does not include committed CapEx of $31.1 million + $1,871 Million 167 6,550,899 96% 75% 8.8 Years $687 Million(2) 51 3,132,263 94% 100% 8.6 Years $2,558 Million 218 9,683,162 95% 83% 8.7 Years 1. LifeCare Hospitals of North Texas (5%) 2. Wayne State (3%) 3. Great Falls Clinic (3%) 4. Trios Health (3%) 5. Columbus Regional (2%) 1. CHI Health (26%) 2. Kentucky One (24%) 3. CHI Franciscan Health (11%) 4. CHI St. Alexius Health (11%) 5. CHI St. Vincent (3%) 1. CHI Health (8%) 2. Kentucky One (8%) 3. CHI Franciscan Health (4%) 4. CHI St. Alexius Health (3%) 5. LifeCare Hospitals of North Texas (3%) = Number of States 27 9 30 3/31/2016
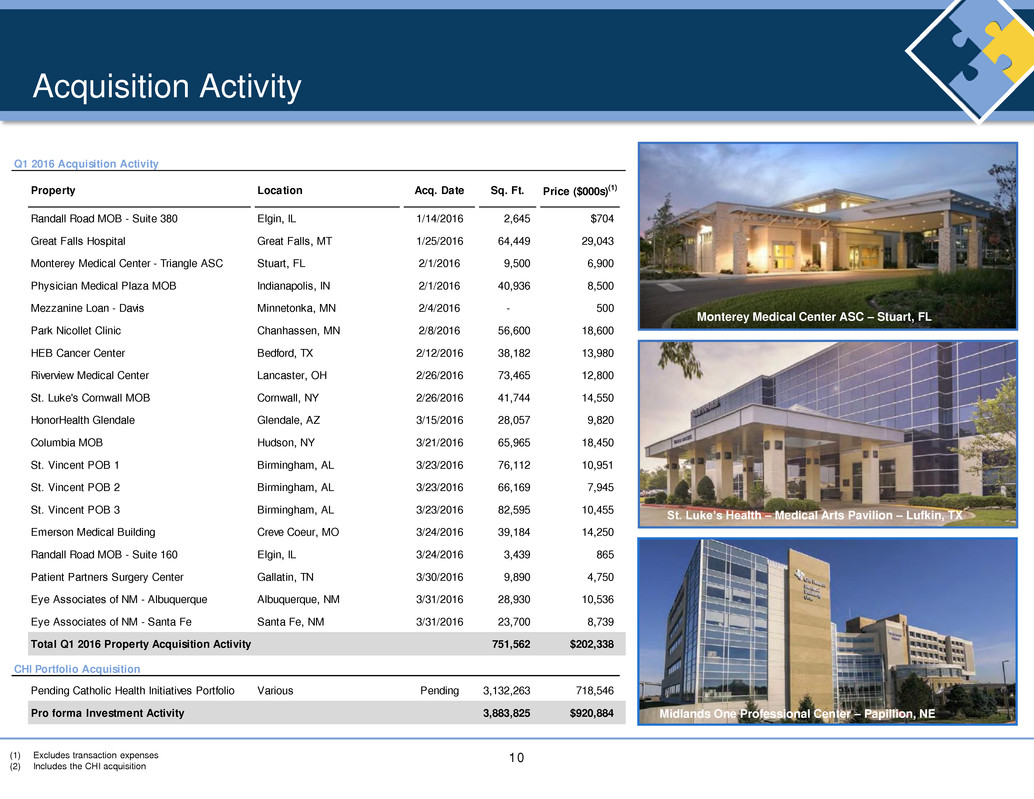
10 Acquisition Activity Monterey Medical Center ASC – Stuart, FL St. Luke’s Health – Medical Arts Pavilion – Lufkin, TX Midlands One Professional Center – Papillion, NE (1) Excludes transaction expenses (2) Includes the CHI acquisition Q1 2016 Acquisition Activity Property Location Acq. Date Sq. Ft. Price ($000s)(1) Randall Road MOB - Suite 380 Elgin, IL 1/14/2016 2,645 $704 Great Falls Hospital Great Falls, MT 1/25/2016 64,449 29,043 Monterey Medical Center - Triangle ASC Stuart, FL 2/1/2016 9,500 6,900 Physician Medical Plaza MOB Indianapolis, IN 2/1/2016 40,936 8,500 Mezzanine Loan - Davis Minnetonka, MN 2/4/2016 - 500 Park Nicollet Clinic Chanhassen, MN 2/8/2016 56,600 18,600 HEB Cancer Center Bedford, TX 2/12/2016 38,182 13,980 Riverview Medical Center Lancaster, OH 2/26/2016 73,465 12,800 St. Luke's Cornwall MOB Cornwall, NY 2/26/2016 41,744 14,550 HonorHealth Glendale Glendale, AZ 3/15/2016 28,057 9,820 Columbia MOB Hudson, NY 3/21/2016 65,965 18,450 St. Vincent POB 1 Birmingham, AL 3/23/2016 76,112 10,951 St. Vincent POB 2 Birmingham, AL 3/23/2016 66,169 7,945 St. Vincent POB 3 Birmingham, AL 3/23/2016 82,595 10,455 Emerson Medical Building Creve Coeur, MO 3/24/2016 39,184 14,250 Randall Road MOB - Suite 160 Elgin, IL 3/24/2016 3,439 865 Patient Partners Surgery Center Gallatin, TN 3/30/2016 9,890 4,750 Eye Associates of NM - Albuquerque Albuquerque, NM 3/31/2016 28,930 10,536 Eye Associates of NM - Santa Fe Santa Fe, NM 3/31/2016 23,700 8,739 Total Q1 2016 Property Acquisition Activity 751,562 $202,338 CHI Portfolio Acquisition Pending Catholic Health Initiatives Portfolio Various Pending 3,132,263 718,546 Pro forma Investment Activity 3,883,825 $920,884
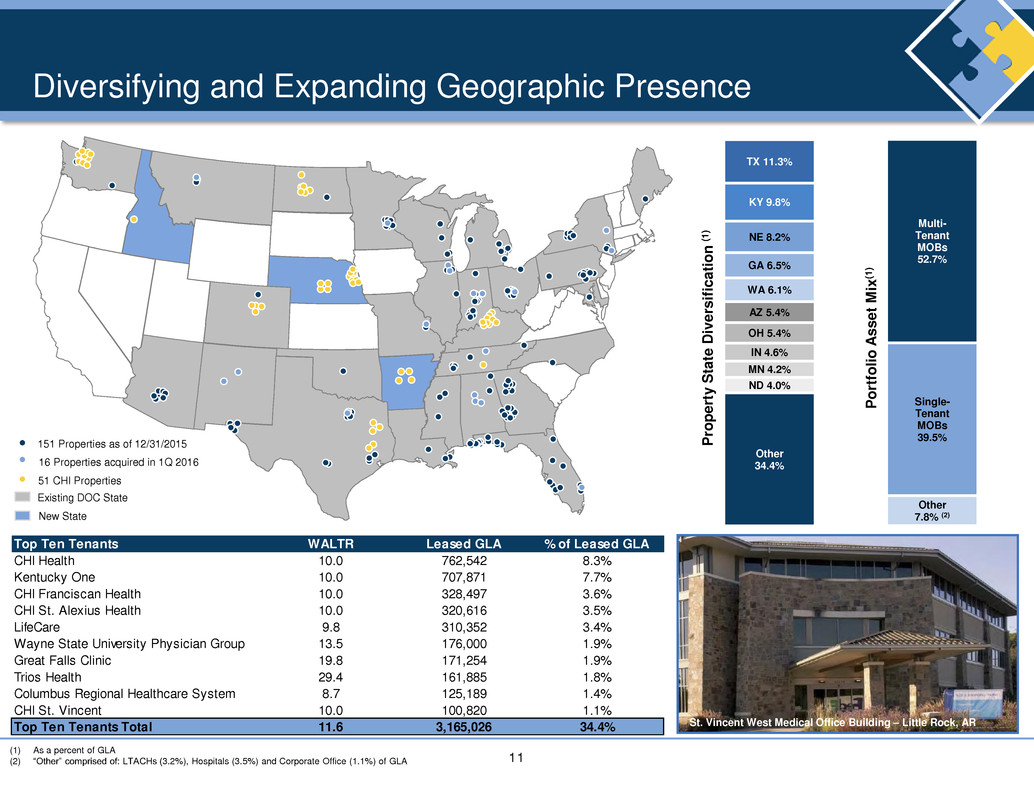
11 Top Ten Tenants WALTR Leased GLA % of Leased GLA CHI Health 10.0 762,542 8.3% Kentucky One 10.0 707,871 7.7% CHI Franciscan Health 10.0 328,497 3.6% CHI St. Alexius Health 10.0 320,616 3.5% LifeCare 9.8 310,352 3.4% Wayne State University Physician Group 13.5 176,000 1.9% Great Falls Clinic 19.8 171,254 1.9% Trios Health 29.4 161,885 1.8% Columbus Regional Healthcare System 8.7 125,189 1.4% CHI St. Vincent 10.0 100,820 1.1% Top Ten Tenants Total 11.6 3,165,026 34.4% Other 7.8% (2) Single- Tenant MOBs 39.5% Multi- Tenant MOBs 52.7% Other 34.4% ND 4.0% MN 4.2% IN 4.6% OH 5.4% AZ 5.4% WA 6.1% GA 6.5% NE 8.2% KY 9.8% TX 11.3% Diversifying and Expanding Geographic Presence P ro p ert y S tate D iv er s if ic a ti o n (1 ) P or tf ol io A s s et M ix (1 ) St. Vincent West Medical Office Building – Little Rock, AR (1) As a percent of GLA (2) “Other” comprised of: LTACHs (3.2%), Hospitals (3.5%) and Corporate Office (1.1%) of GLA Existing DOC State New State 151 Properties as of 12/31/2015 16 Properties acquired in 1Q 2016 51 CHI Properties
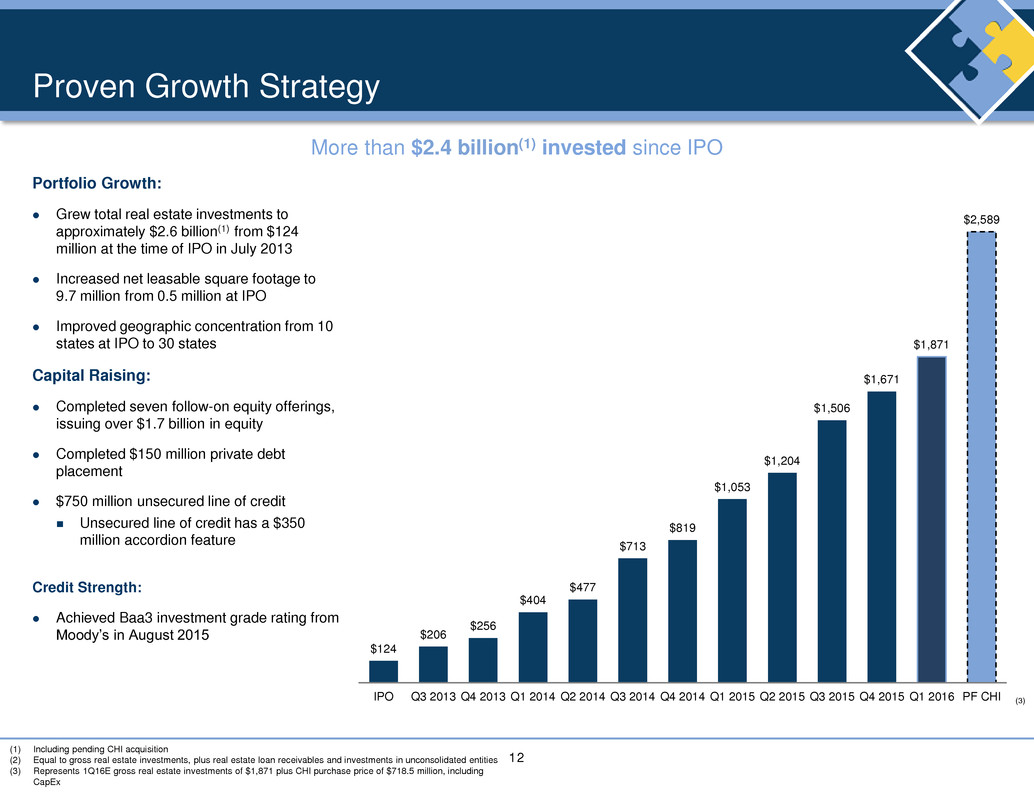
12 Proven Growth Strategy More than $2.4 billion(1) invested since IPO Portfolio Growth: Grew total real estate investments to approximately $2.6 billion(1) from $124 million at the time of IPO in July 2013 Increased net leasable square footage to 9.7 million from 0.5 million at IPO Improved geographic concentration from 10 states at IPO to 30 states Capital Raising: Completed seven follow-on equity offerings, issuing over $1.7 billion in equity Completed $150 million private debt placement $750 million unsecured line of credit Unsecured line of credit has a $350 million accordion feature Credit Strength: Achieved Baa3 investment grade rating from Moody’s in August 2015 (1) Including pending CHI acquisition (2) Equal to gross real estate investments, plus real estate loan receivables and investments in unconsolidated entities (3) Represents 1Q16E gross real estate investments of $1,871 plus CHI purchase price of $718.5 million, including CapEx Gross Real Estate Investments ($mm)(2) (3) $124 $206 $256 $404 $477 $713 $819 $1,053 $1,204 $1,506 $1,671 $1,871 $2,589 IPO Q3 2013 Q4 2013 Q1 2014 Q2 2014 Q3 2014 Q4 2014 Q1 2015 Q2 2015 Q3 2015 Q4 2015 Q1 2016 PF CHI
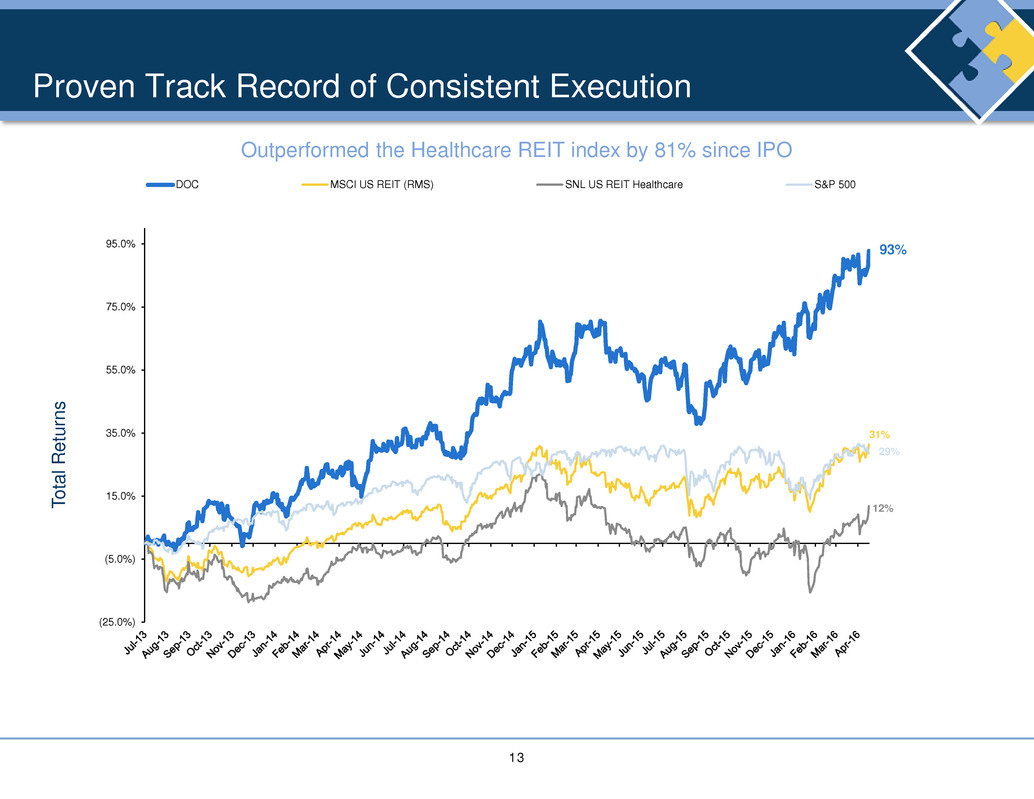
13 Proven Track Record of Consistent Execution Outperformed the Healthcare REIT index by 81% since IPO T o tal R e turn s 93% 31% 12% 29% (25.0%) (5.0%) 15.0% 35.0% 55.0% 75.0% 95.0% DOC MSCI US REIT (RMS) SNL US REIT Healthcare S&P 500
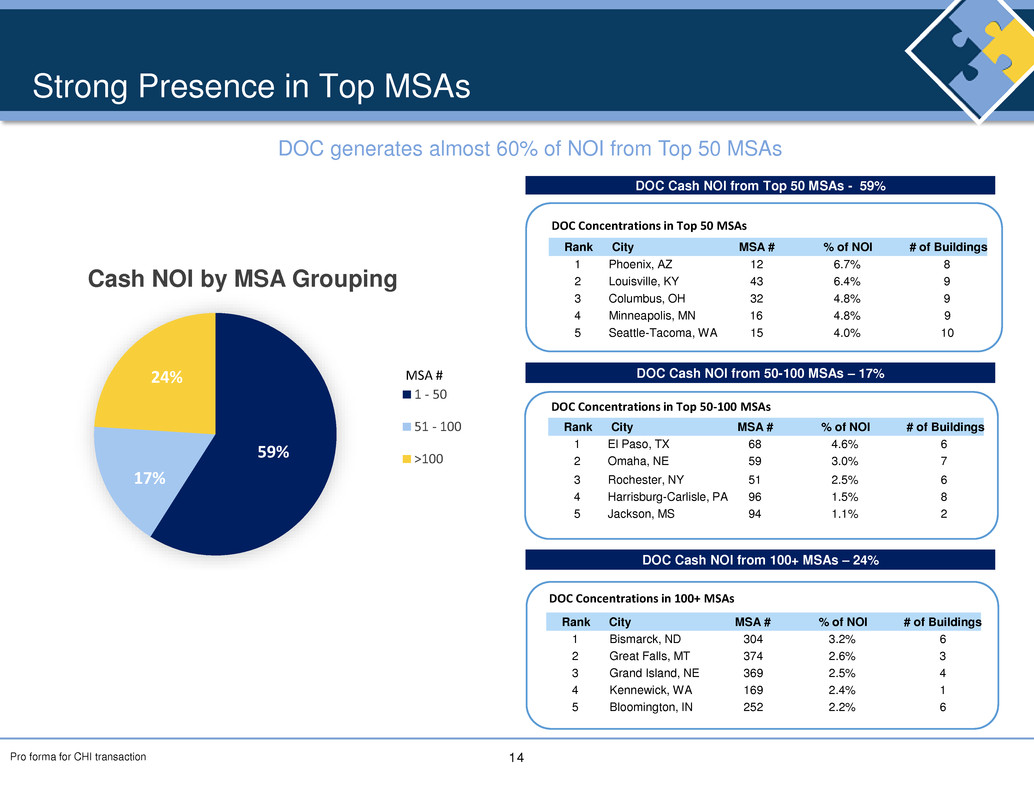
14 Strong Presence in Top MSAs DOC Cash NOI from Top 50 MSAs - 59% 59% 17% 24% Cash NOI by MSA Grouping 1 - 50 51 - 100 >100 MSA # DOC Cash NOI from 50-100 MSAs – 17% DOC Cash NOI from 100+ MSAs – 24% DOC generates almost 60% of NOI from Top 50 MSAs Pro forma for CHI transaction DOC Concentrations in Top 50 MSAs Rank City MSA # % of NOI # of Buildings 1 Phoenix, AZ 12 6.7% 8 2 Louisville, KY 43 6.4% 9 3 Columbus, OH 32 4.8% 9 4 Minneapolis, MN 16 4.8% 9 5 Seattle-Tacoma, WA 15 4.0% 10 DOC Concentrations in Top 50-100 MSAs Rank City MSA # % of NOI # of Buildings 1 El Paso, TX 68 4.6% 6 2 Omaha, NE 59 3.0% 7 3 Rochester, NY 51 2.5% 6 4 Harrisburg-Carlisle, PA 96 1.5% 8 5 Jackson, MS 94 1.1% 2 DOC Concentrations in 100+ MSAs Rank City MSA # % of NOI # of Buildings 1 Bismarck, ND 304 3.2% 6 2 Great Falls, MT 374 2.6% 3 3 Grand Island, NE 369 2.5% 4 4 Kennewick, WA 169 2.4% 1 5 Bloomington, IN 252 2.2% 6
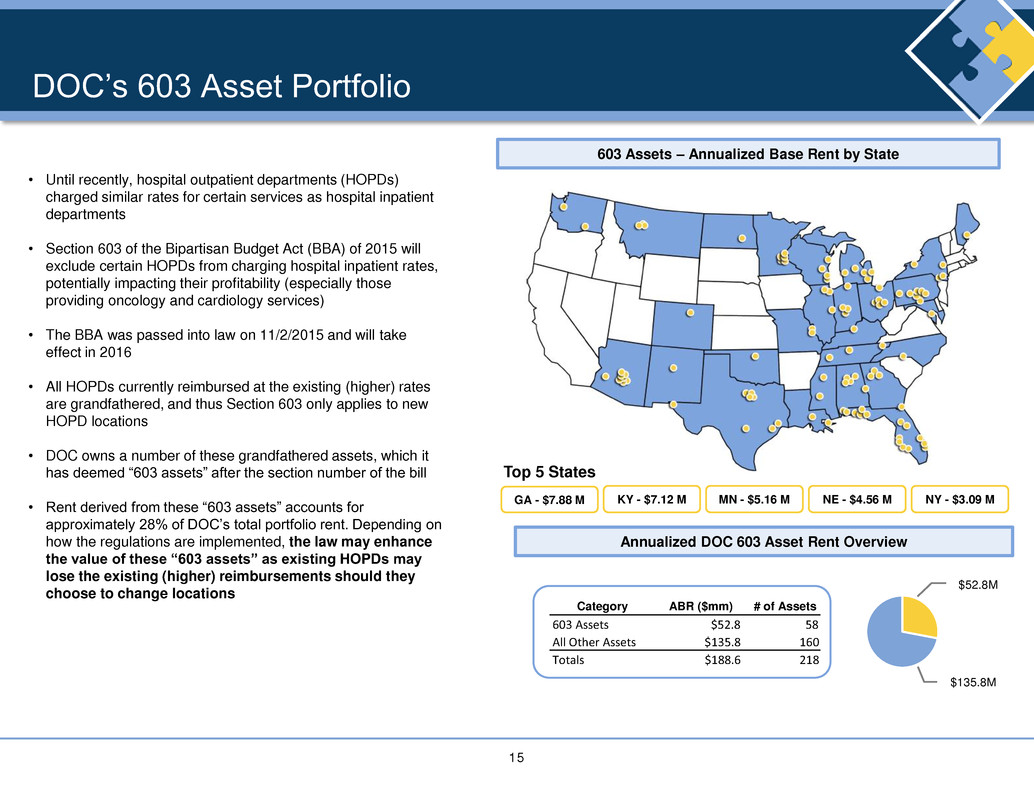
15 DOC’s 603 Asset Portfolio • Until recently, hospital outpatient departments (HOPDs) charged similar rates for certain services as hospital inpatient departments • Section 603 of the Bipartisan Budget Act (BBA) of 2015 will exclude certain HOPDs from charging hospital inpatient rates, potentially impacting their profitability (especially those providing oncology and cardiology services) • The BBA was passed into law on 11/2/2015 and will take effect in 2016 • All HOPDs currently reimbursed at the existing (higher) rates are grandfathered, and thus Section 603 only applies to new HOPD locations • DOC owns a number of these grandfathered assets, which it has deemed “603 assets” after the section number of the bill • Rent derived from these “603 assets” accounts for approximately 28% of DOC’s total portfolio rent. Depending on how the regulations are implemented, the law may enhance the value of these “603 assets” as existing HOPDs may lose the existing (higher) reimbursements should they choose to change locations Annualized DOC 603 Asset Rent Overview $52.8M $135.8M Category ABR ($mm) # of Assets 603 Assets $52.8 58 All Other Assets $135.8 160 Totals $188.6 218 NY - $3.09 MGA - $7.88 M 603 Assets – Annualized Base Rent by State KY - $7.12 M NE - $4.56 MMN - $5.16 M Top 5 States
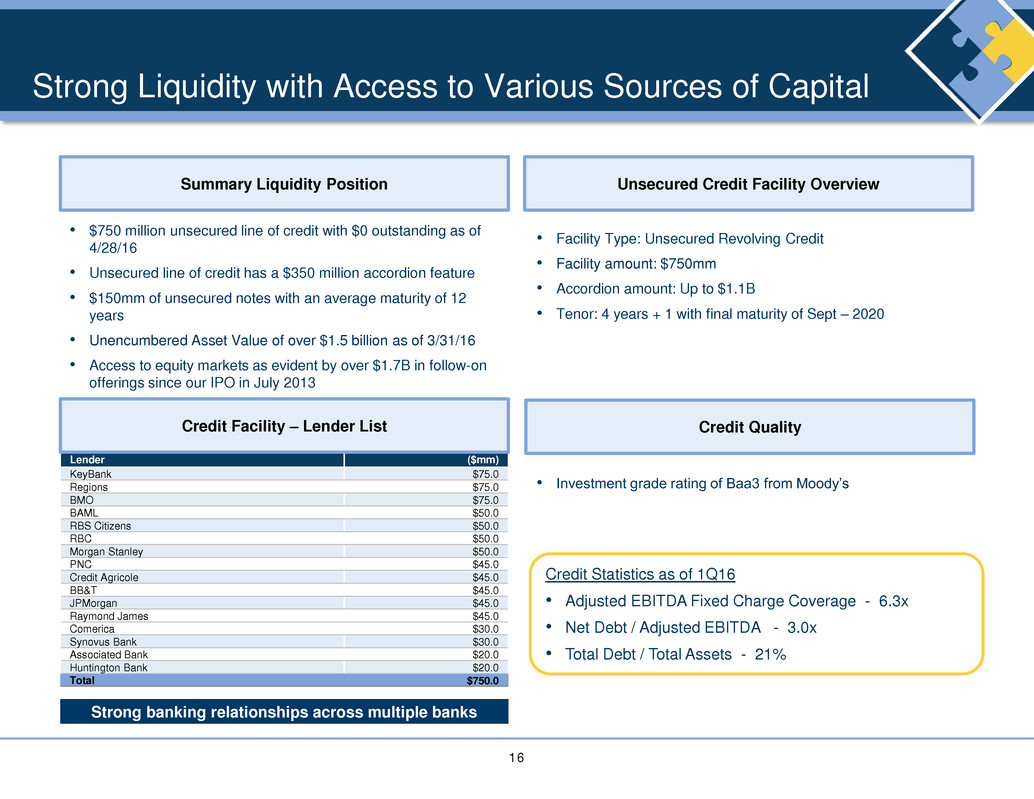
16 Strong Liquidity with Access to Various Sources of Capital • $750 million unsecured line of credit with $0 outstanding as of 4/28/16 • Unsecured line of credit has a $350 million accordion feature • $150mm of unsecured notes with an average maturity of 12 years • Unencumbered Asset Value of over $1.5 billion as of 3/31/16 • Access to equity markets as evident by over $1.7B in follow-on offerings since our IPO in July 2013 Summary Liquidity Position Unsecured Credit Facility Overview • Facility Type: Unsecured Revolving Credit • Facility amount: $750mm • Accordion amount: Up to $1.1B • Tenor: 4 years + 1 with final maturity of Sept – 2020 Lender ($mm) KeyBank $75.0 Regions $75.0 BMO $75.0 BAML $50.0 RBS Citizens $50.0 RBC $50.0 Morgan Stanley $50.0 PNC $45.0 Credit Agricole $45.0 BB&T $45.0 JPMorgan $45.0 Raymond James $45.0 Comerica $30.0 Synovus Bank $30.0 Associated Bank $20.0 Huntington Bank $20.0 Total $750.0 Strong banking relationships across multiple banks Credit Facility – Lender List • Investment grade rating of Baa3 from Moody’s Credit Quality Credit Statistics as of 1Q16 • Adjusted EBITDA Fixed Charge Coverage - 6.3x • Net Debt / Adjusted EBITDA - 3.0x • Total Debt / Total Assets - 21%
17 Appendix
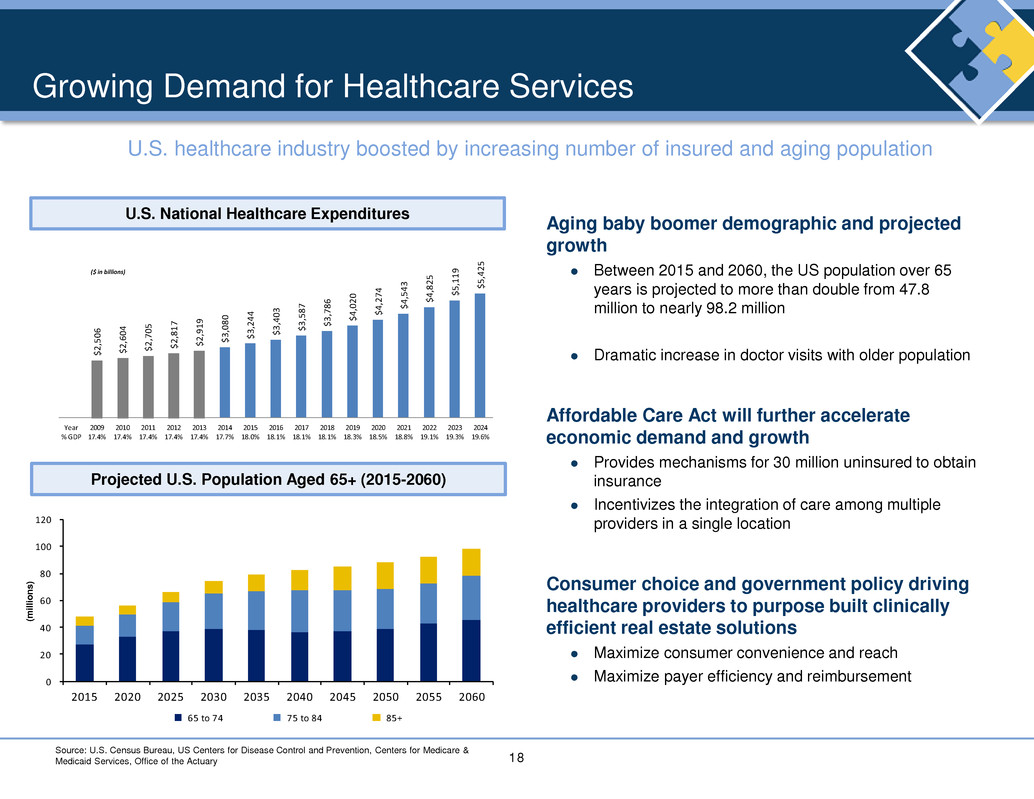
18 $2, 506 $2, 604 $2, 705 $2, 817 $2, 919 $3, 080 $3, 244 $3, 403 $3, 587 $3, 786 $4, 020 $4, 274 $4, 543 $4, 825 $5, 119 $5, 425 Year % GDP 2009 17.4% 2010 17.4% 2011 17.4% 2012 17.4% 2013 17.4% 2014 17.7% 2015 18.0% 2016 18.1% 2017 18.1% 2018 18.1% 2019 18.3% 2020 18.5% 2021 18.8% 2022 19.1% 2023 19.3% 2024 19.6% ($ in billions) 0 20 40 60 80 100 120 2015 2020 2025 2030 2035 2040 2045 2050 2055 2060 65 to 74 75 to 84 85+ U.S. healthcare industry boosted by increasing number of insured and aging population Growing Demand for Healthcare Services Aging baby boomer demographic and projected growth Between 2015 and 2060, the US population over 65 years is projected to more than double from 47.8 million to nearly 98.2 million Dramatic increase in doctor visits with older population Affordable Care Act will further accelerate economic demand and growth Provides mechanisms for 30 million uninsured to obtain insurance Incentivizes the integration of care among multiple providers in a single location Consumer choice and government policy driving healthcare providers to purpose built clinically efficient real estate solutions Maximize consumer convenience and reach Maximize payer efficiency and reimbursement Projected U.S. Population Aged 65+ (2015-2060) U.S. National Healthcare Expenditures Source: U.S. Census Bureau, US Centers for Disease Control and Prevention, Centers for Medicare & Medicaid Services, Office of the Actuary (m il li o n s )
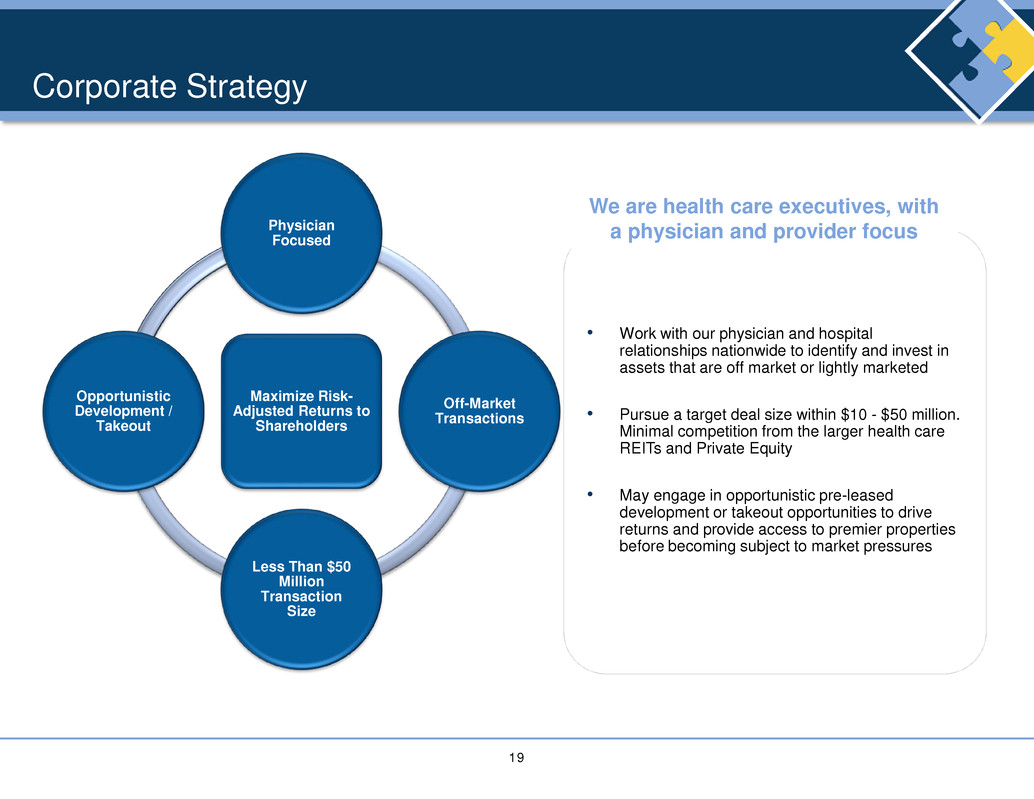
19 Corporate Strategy Maximize Risk- Adjusted Returns to Shareholders Physician Focused Off-Market Transactions Less Than $50 Million Transaction Size Opportunistic Development / Takeout • Work with our physician and hospital relationships nationwide to identify and invest in assets that are off market or lightly marketed • Pursue a target deal size within $10 - $50 million. Minimal competition from the larger health care REITs and Private Equity • May engage in opportunistic pre-leased development or takeout opportunities to drive returns and provide access to premier properties before becoming subject to market pressures We are health care executives, with a physician and provider focus
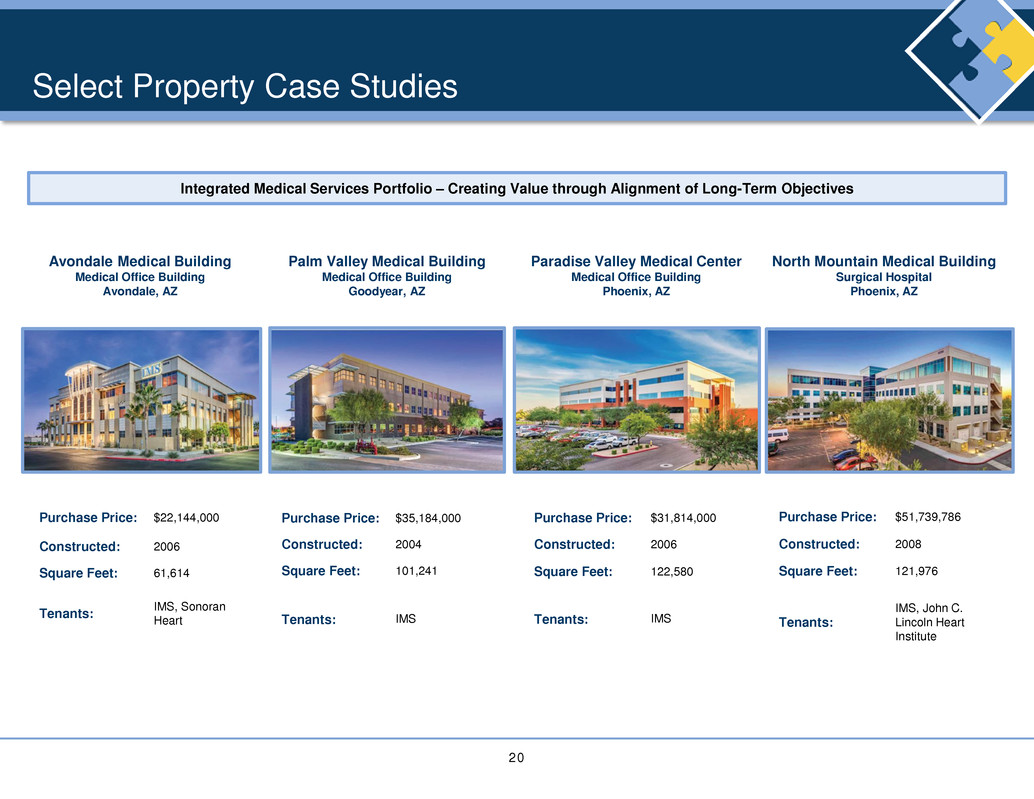
20 Select Property Case Studies Purchase Price: $22,144,000 Constructed: 2006 Square Feet: 61,614 Tenants: IMS, Sonoran Heart Avondale Medical Building Medical Office Building Avondale, AZ Integrated Medical Services Portfolio – Creating Value through Alignment of Long-Term Objectives Palm Valley Medical Building Medical Office Building Goodyear, AZ Paradise Valley Medical Center Medical Office Building Phoenix, AZ North Mountain Medical Building Surgical Hospital Phoenix, AZ Purchase Price: $35,184,000 Constructed: 2004 Square Feet: 101,241 Tenants: IMS Purchase Price: $31,814,000 Constructed: 2006 Square Feet: 122,580 Tenants: IMS Purchase Price: $51,739,786 Constructed: 2008 Square Feet: 121,976 Tenants: IMS, John C. Lincoln Heart Institute
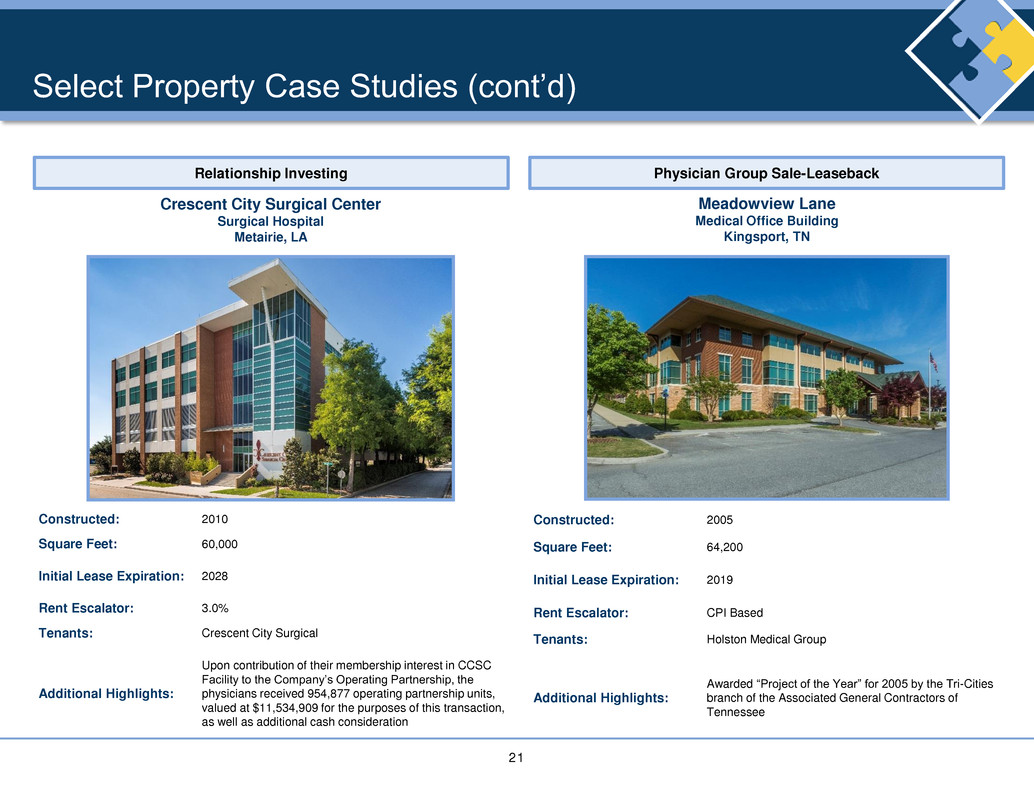
21 Select Property Case Studies (cont’d) Meadowview Lane Medical Office Building Kingsport, TN Constructed: 2010 Square Feet: 60,000 Initial Lease Expiration: 2028 Rent Escalator: 3.0% Tenants: Crescent City Surgical Additional Highlights: Upon contribution of their membership interest in CCSC Facility to the Company’s Operating Partnership, the physicians received 954,877 operating partnership units, valued at $11,534,909 for the purposes of this transaction, as well as additional cash consideration Constructed: 2005 Square Feet: 64,200 Initial Lease Expiration: 2019 Rent Escalator: CPI Based Tenants: Holston Medical Group Additional Highlights: Awarded “Project of the Year” for 2005 by the Tri-Cities branch of the Associated General Contractors of Tennessee Crescent City Surgical Center Surgical Hospital Metairie, LA Relationship Investing Physician Group Sale-Leaseback
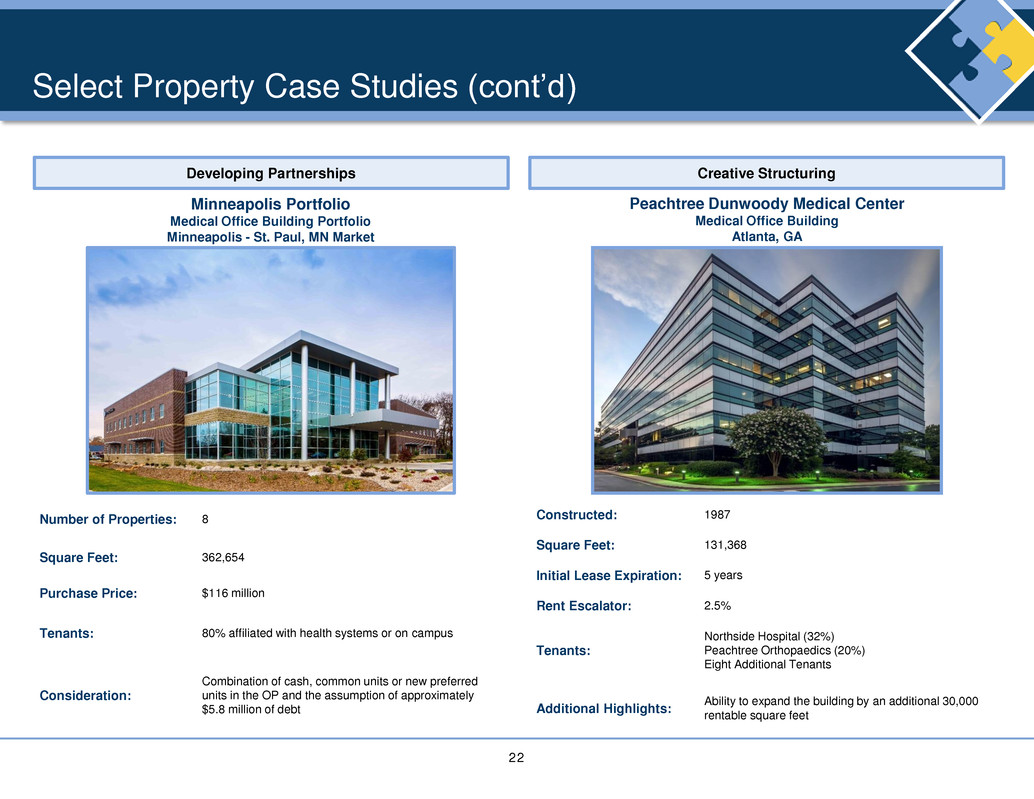
22 Select Property Case Studies (cont’d) Peachtree Dunwoody Medical Center Medical Office Building Atlanta, GA Minneapolis Portfolio Medical Office Building Portfolio Minneapolis - St. Paul, MN Market Developing Partnerships Number of Properties: 8 Square Feet: 362,654 Purchase Price: $116 million Tenants: 80% affiliated with health systems or on campus Consideration: Combination of cash, common units or new preferred units in the OP and the assumption of approximately $5.8 million of debt Constructed: 1987 Square Feet: 131,368 Initial Lease Expiration: 5 years Rent Escalator: 2.5% Tenants: Northside Hospital (32%) Peachtree Orthopaedics (20%) Eight Additional Tenants Additional Highlights: Ability to expand the building by an additional 30,000 rentable square feet Creative Structuring